Xiaozhou Wang Graduate Fellow Quantitative Social Science Initiative Penn State University ([email protected]) An Introduction to Quantile Regression: Modeling Group Disparity by Comparing Entire Distributions 1

Xiaozhou Wang Graduate Fellow Quantitative Social Science Initiative Penn State University ([email protected]) 1.
Dec 31, 2015
Welcome message from author
This document is posted to help you gain knowledge. Please leave a comment to let me know what you think about it! Share it to your friends and learn new things together.
Transcript

1
Xiaozhou Wang
Graduate Fellow
Quantitative Social Science Initiative
Penn State University
An Introduction to Quantile Regression:
Modeling Group Disparity by Comparing Entire
Distributions

2
MotivationGroup disparity
GenderRaceClassImmigration…
How to model group disparityDescriptive statisticsRegression model

3
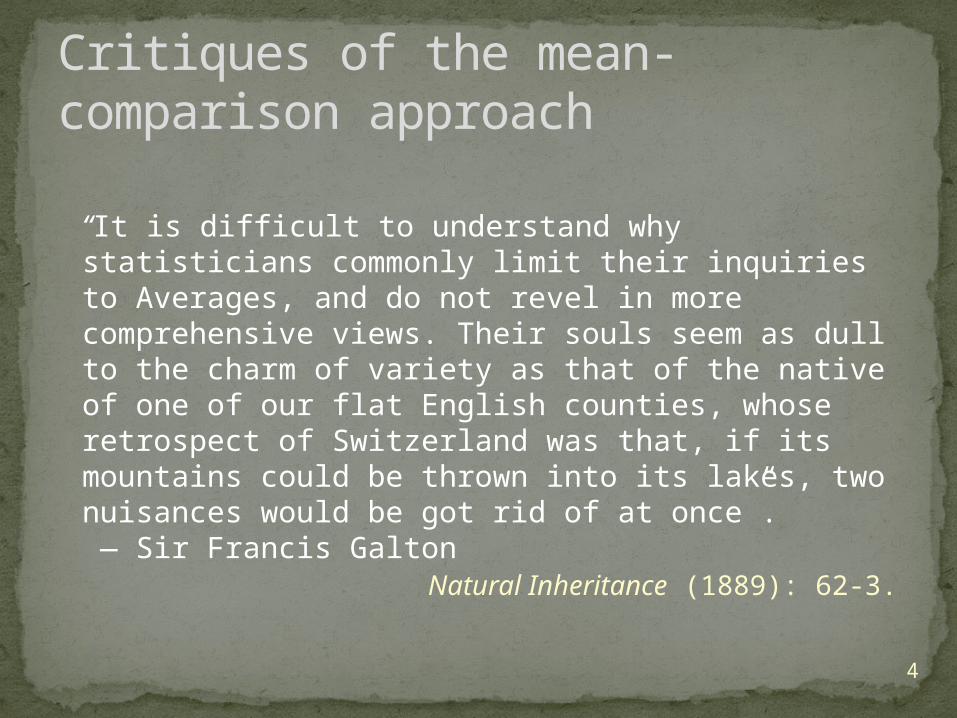
Standard approach to describe data: comparing the means
4
“It is difficult to understand why statisticians commonly limit their inquiries to Averages, and do not revel in more comprehensive views. Their souls seem as dull to the charm of variety as that of the native of one of our flat English counties, whose retrospect of Switzerland was that, if its mountains could be thrown into its lakes, two nuisances would be got rid of at once”.
— Sir Francis Galton Natural Inheritance
(1889): 62-3.
Critiques of the mean-comparison approach

5
Normal distribution
Are distributions identical when they have equal means and variances?
Gamma distribution
-4 -2 0 2 4 6
0.0
0.5
1.0
1.5
x
dn
orm
(x, m
ea
n =
mu
, sd
= s
igm
a)
fx1
22exp
x 2
22
: mean
: standard deviation
Normal distribution: mean=1 and variance=2
0 2 4 6 8 10
0.0
0.5
1.0
1.5
x
dg
am
ma
(x, s
ha
pe
= a
, sca
le =
s)
fx1
saaxa 1
expx
s
a 0: shape parameter
s 0: scale parameter
Gamma distribution: shape=0.5 and scale=2

6
The basic idea (Silverman 1986)
K(x) is the kernel function, which satisfies:
Very often, K will be a symmetric probability density function.
h is the smoothing parameter (bandwidth).
Kernel density estimation
Or,
where

7
Let’s compare the distributions.
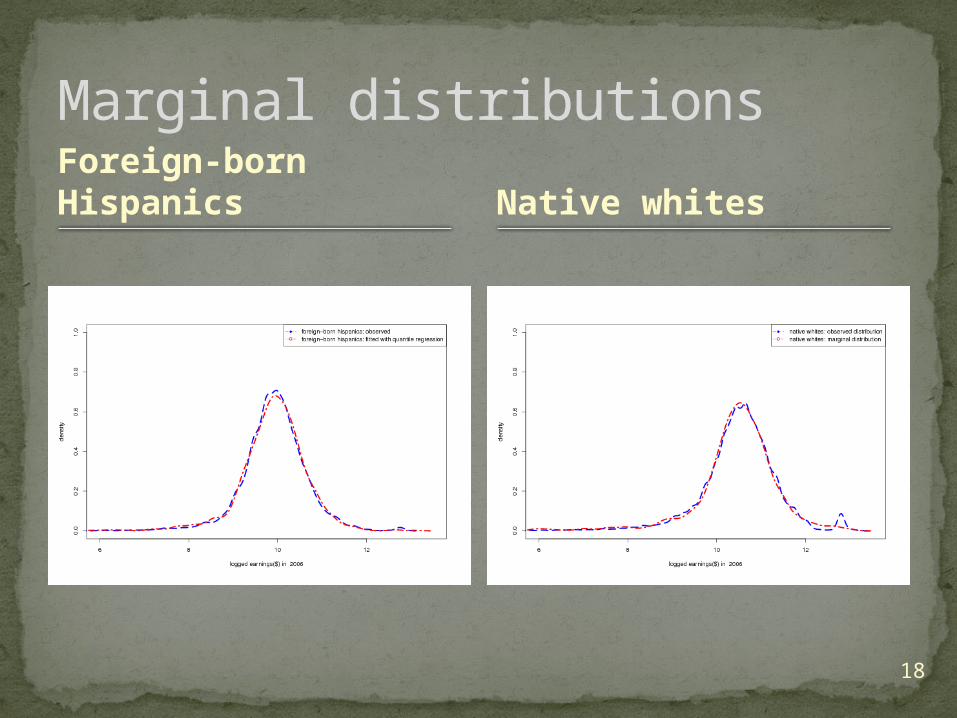
Both of the two earnings distributions changed from 1996 to 2006.
For native whites, there is a growing share of population who make about 80,000 or more.
Hispanic immigrants also made some progress – less people are found at the lower end of their earnings distribution.

8
The OLS model
The conditional mean of the outcome variable is expressed as a product of characteristics and the "prices" of these characteristics.
The estimated model provides “a grand summary for the averages of the distributions corresponding to the set of Xs” (Mosteller and Tukey 1977).
Regression model
9
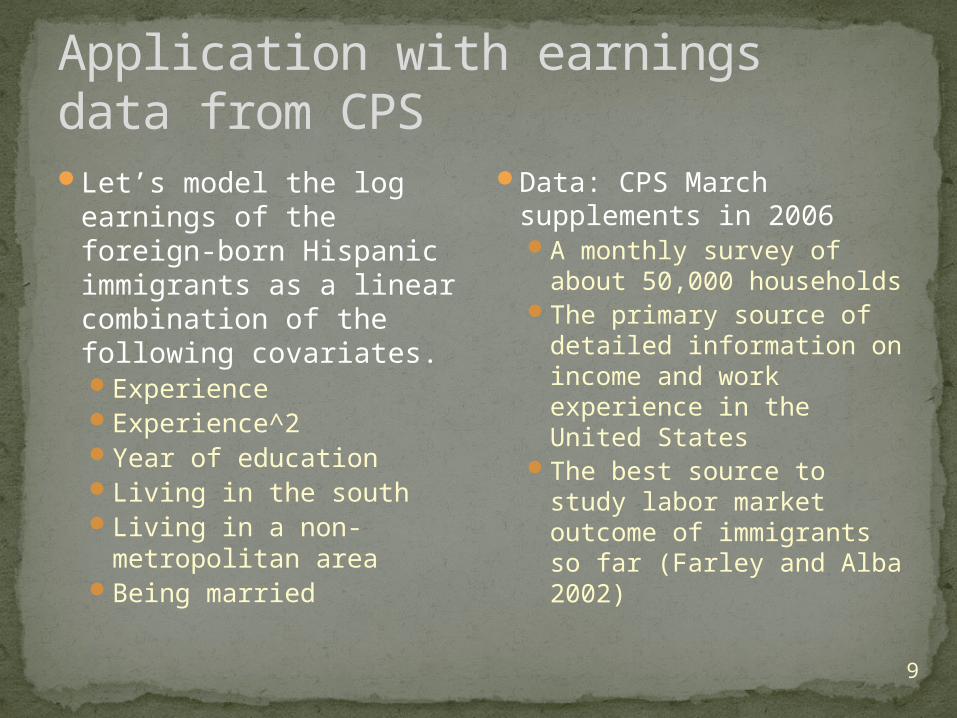
Application with earnings data from CPSLet’s model the log
earnings of the foreign-born Hispanic immigrants as a linear combination of the following covariates.ExperienceExperience^2Year of educationLiving in the southLiving in a non-
metropolitan areaBeing married
Data: CPS March supplements in 2006A monthly survey of
about 50,000 householdsThe primary source of
detailed information on income and work experience in the United States
The best source to study labor market outcome of immigrants so far (Farley and Alba 2002)

10
DataSample of analysis
Non-institutional population
Men of Hispanic origin
Aged at 25-64 by the time of survey interview
Worked for at least one week during the last calendar year
Coefficients:Estimate Std. Error t value Pr(>|t|)
(Intercept) 8.84 0.09 101.87 0.00 ***exper 0.02 0.01 3.84 0.00 ***exper2 0.00 0.00 -2.73 0.01 **yredu 0.06 0.00 16.20 0.00 ***south -0.02 0.03 -0.52 0.60nonmetro 0.09 0.06 1.57 0.12married 0.15 0.03 4.88 0.00 ***
Var. Mean sd. Median log earnings 9.89 1.00 9.97experience 23.03 10.49 22.00experience^2 640.40 555.00 484.00year of education 10.06 4.04 12.00south 0.34 0.34 0.00nonmetro 0.07 0.07 0.00married 0.65 0.65 1.00
Coefficients:Estimate Std. Error Pr(>|t|)
(Intercept) 8.84 0.09 0.00 ***experience 0.02 0.01 0.00 ***experience^2 -3.00E-04 0.00 0.01 **year of education 0.06 0.00 0.00 ***south -0.02 0.03 0.60nonmetro 0.09 0.06 0.12married 0.15 0.03 0.00 ***
11
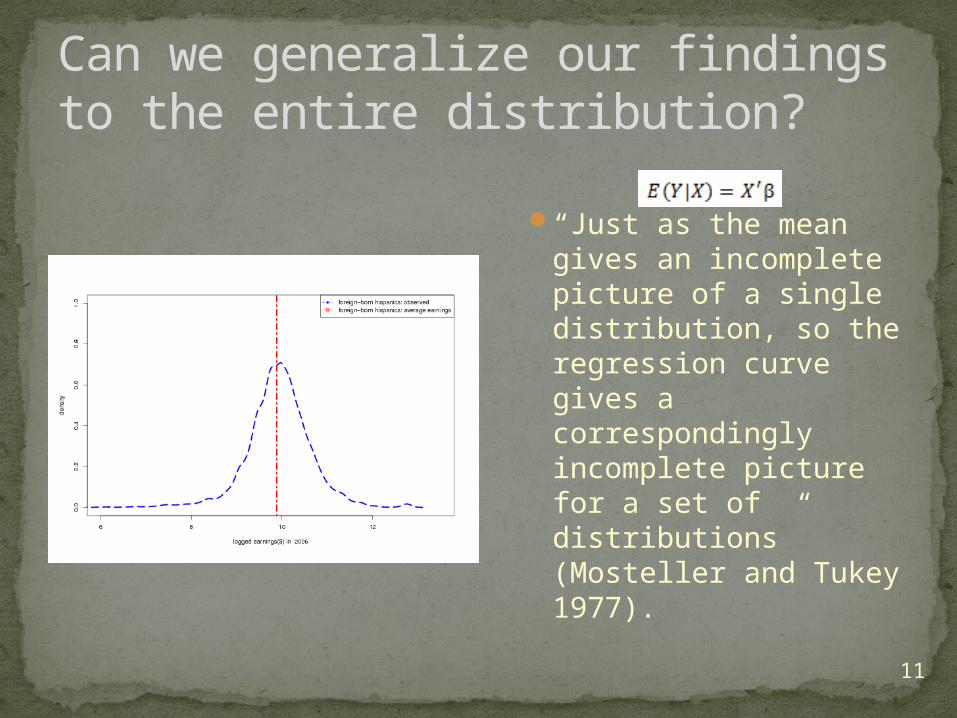
Can we generalize our findings to the entire distribution?
“Just as the mean gives an incomplete picture of a single distribution, so the regression curve gives a correspondingly incomplete picture for a set of distributions” (Mosteller and Tukey 1977).
12
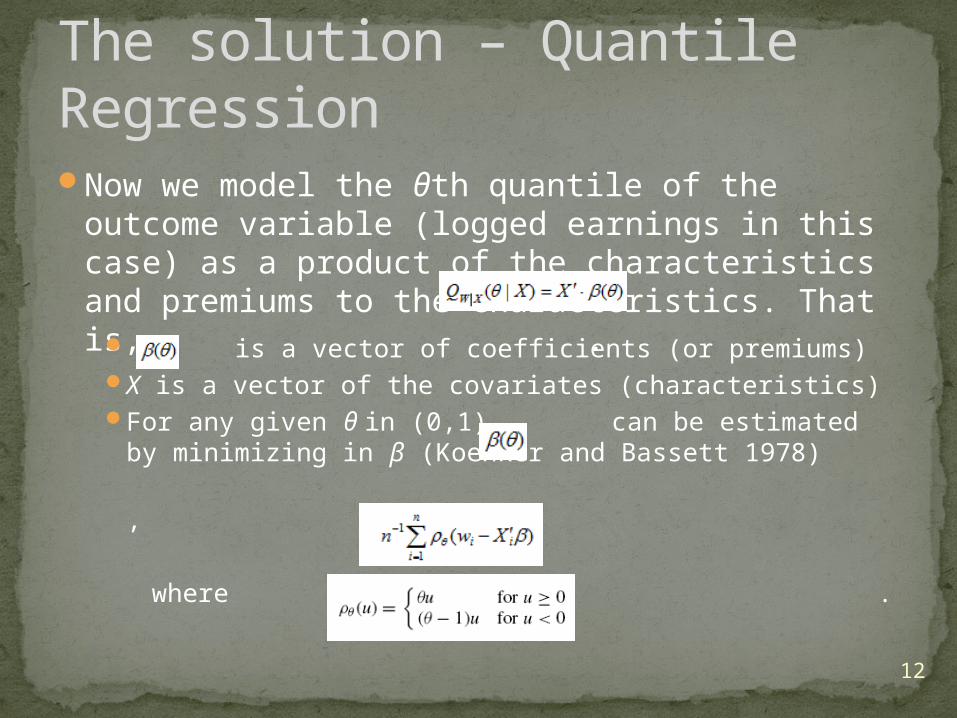
The solution – Quantile RegressionNow we model the θth quantile of the
outcome variable (logged earnings in this case) as a product of the characteristics and premiums to the characteristics. That is, . is a vector of coefficients (or premiums)X is a vector of the covariates (characteristics)For any given θ in (0,1), can be estimated
by minimizing in β (Koenker and Bassett 1978) ,
where .

13
Foreign-born Hispanics
Quantile regression (QR): application
Native whites

14
PDFTo what extent is the
observed group disparity due to: A. difference in
covariates?B. difference in
coefficients ?
The observed group disparity

15
Use QR to estimate the conditional distribution given the covariates
In Bassett and Koenker (1982; 1986), it is established that under regularity conditions, the estimated conditional quantile function is a strongly consistent estimator of the population quantile function.
Probability Integral Transformation Theorem: if U is a uniform random variable on [0,1], then F-1(U) has distribution F.

16
• We estimate the quantile of earnings distribution given the observed characteristics of the respondents, where are drawn from a uniform (0, 1) distribution.
• By the Probability Integral Transformation Theorem,
constitute a random sample from F(Y|X), the (estimated) conditional distribution of earnings given X (Albrecht et al 2009: 384).
Use QR to estimate the conditional distribution given the covariates
17
According to Machado & Mata (2005), to ‘integrate X out’ and get a sample from the marginal earnings distribution, we can generate a random sample of size m with replacement from the rows of X, denoted by
. Now form a random sample of size m from the marginal earnings distribution for the respondents.
From F(Y|X) to F(Y)
18
Foreign-born Hispanics
Marginal distributions
Native whites
19
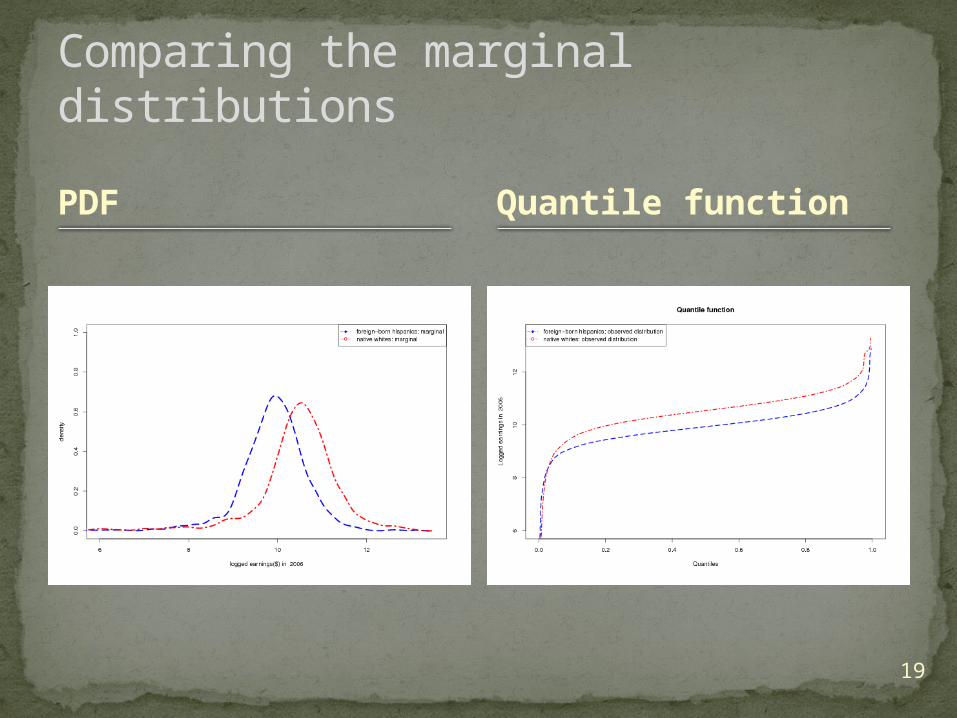
Comparing the marginal distributions
Quantile function

20
To what extent the observed group disparity is due to: A. difference in covariates?B. difference in coefficients?
Counterfactual analysisA. when group A have same coefficients as
group BB. when group A have same covariates as
group B
The questions yet to answer
21
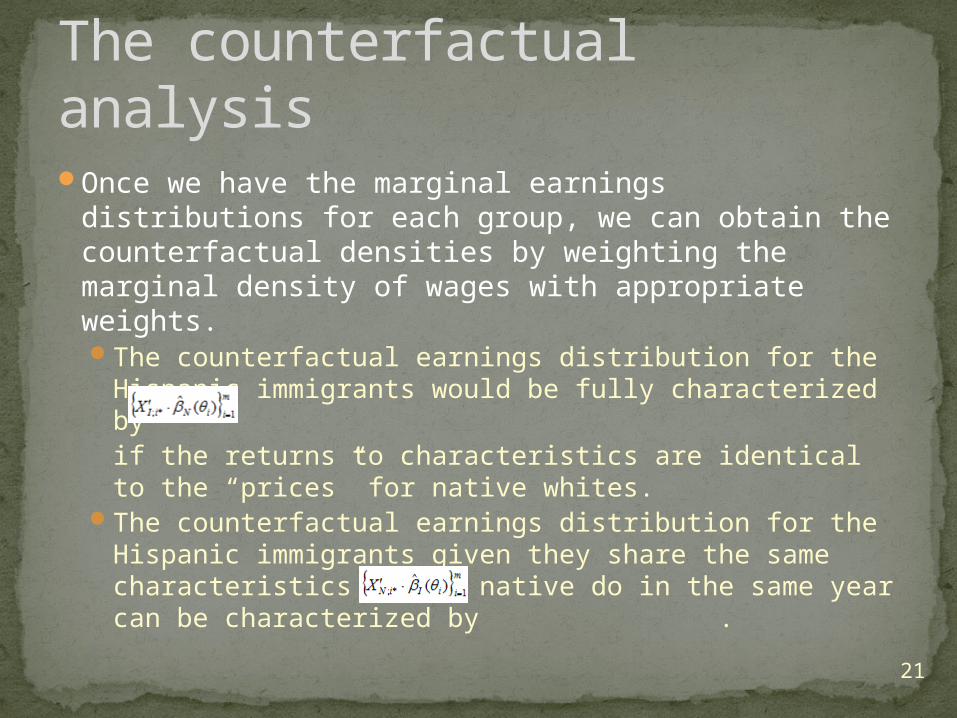
Once we have the marginal earnings distributions for each group, we can obtain the counterfactual densities by weighting the marginal density of wages with appropriate weights. The counterfactual earnings distribution for the
Hispanic immigrants would be fully characterized by
if the returns to characteristics are identical to the “prices” for native whites.
The counterfactual earnings distribution for the Hispanic immigrants given they share the same characteristics as the native do in the same year can be characterized by .
The counterfactual analysis
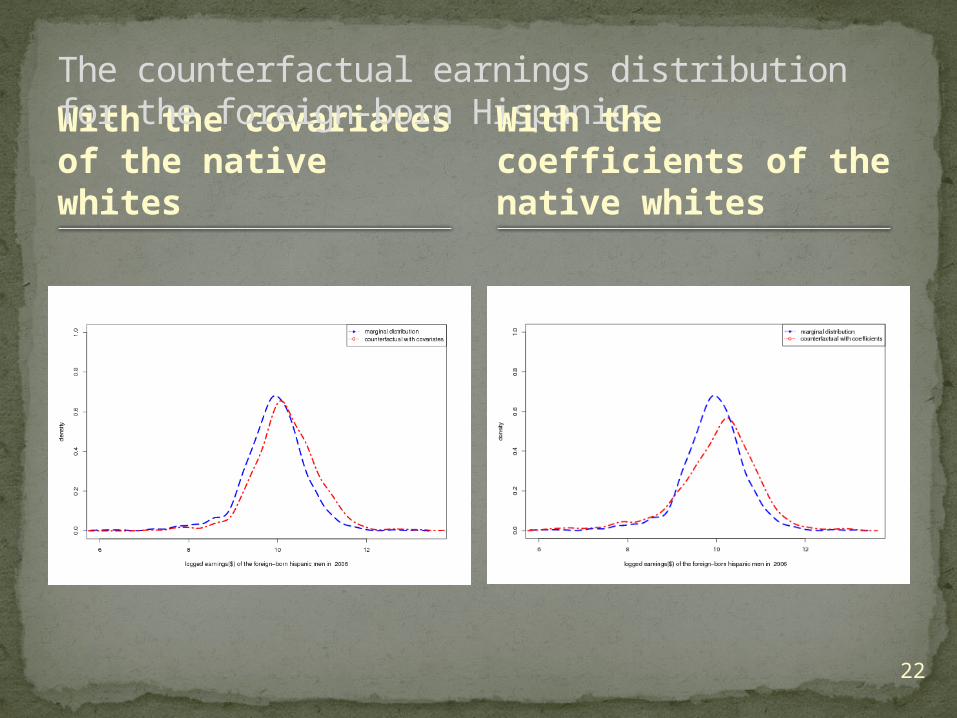
22
With the covariates of the native whites
The counterfactual earnings distribution for the foreign-born HispanicsWith the
coefficients of the native whites
23
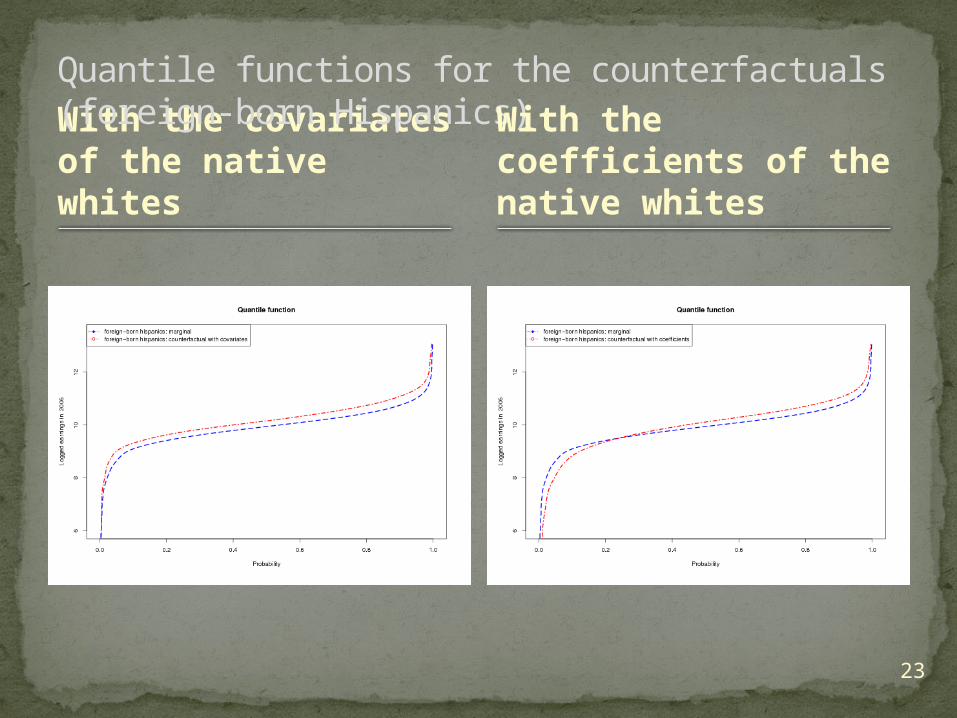
With the covariates of the native whites
Quantile functions for the counterfactuals (foreign-born Hispanics)With the
coefficients of the native whites
24
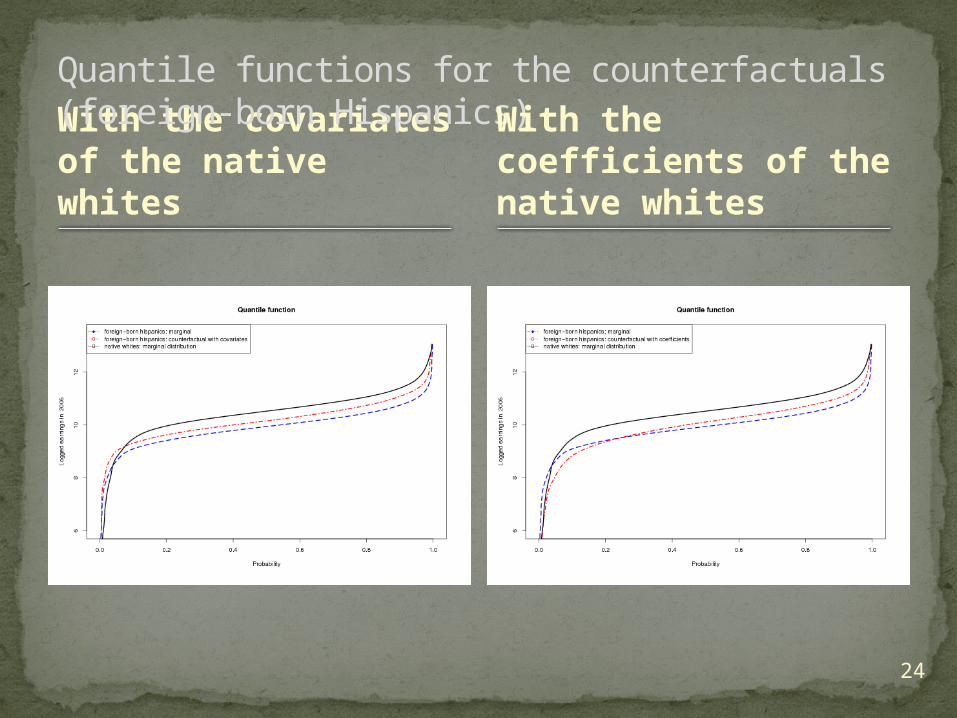
With the covariates of the native whites
Quantile functions for the counterfactuals (foreign-born Hispanics)With the
coefficients of the native whites

25
Pessimistic view Segmented assimilation
model (López and Stanton-Salazar 2001; Portes and Rumbaut 2001; Zhou 1997)
Racial disadvantaged model (Glazer and Moynihan 1963)
Declining quality of immigrants (Borjas 1995, 1999; Borjas and Friedberg 2007)
Classical assimilation theory (Robert Park (1926); Irving Child (1943); Oscar Handlin (1951); Milton Gordon (1964))
Institutional perspective (Alba and Nee; Alba and Farley)
Earnings assimilation of Hispanic immigrants in the U.S.
Optimistic view
Perspectives about economic assimilation of the Hispanic immigrants
Pessimistic view Segmented assimilation model (López and
Stanton-Salazar 2001; Portes and Rumbaut 2001; Zhou 1997)Declining employment in manufacturingRacial discrimination against ethnic minoritiesDeteriorated urban infrastructure – in
particular ,the public education system may not provide advanced training for immigrant students to move upward
Transnationalism – it is easier to maintain strong tie to immigrants’ own community
Less-educated second generation may look down upon the job their parents take and then join the “underclass” – that is, a “downward assimilation” trajectory

Perspectives about economic assimilation of the Hispanic immigrants
Pessimistic view Racial disadvantaged model (Glazer and
Moynihan 1963)The host society is highly stratified according to
race and ethnicity and thus the earning differentials associated with nativity is just a reflection of the ethnic inequality in earnings
Discrimination may undermine immigrants’ motivation to move upward (Bean & Stevens: 99)
Declining quality of immigrants (Borjas 1995, 1999; Borjas and Friedberg 2007)The education gap between immigrants and
native whites has been widen by the 1990sDeclining quality of immigrant cohorts

Perspectives about economic assimilation of the Hispanic immigrants
Optimistic viewClassical assimilation theory (Robert Park
(1926); Irving Child (1943); Oscar Handlin (1951); Milton Gordon (1964))Immigrants experience steady improvement in
socioeconomic outcomes over time, within and across generations
Institutional perspective (Alba and Nee; Alba and Farley)Legal, social and economic changes may now
guarantee the second generation protections and opportunities
Labor markets have been extremely tight throughout the 1990s, which “should have benefited the bottom of the labor queue”(Alba and Farley: 677)
29
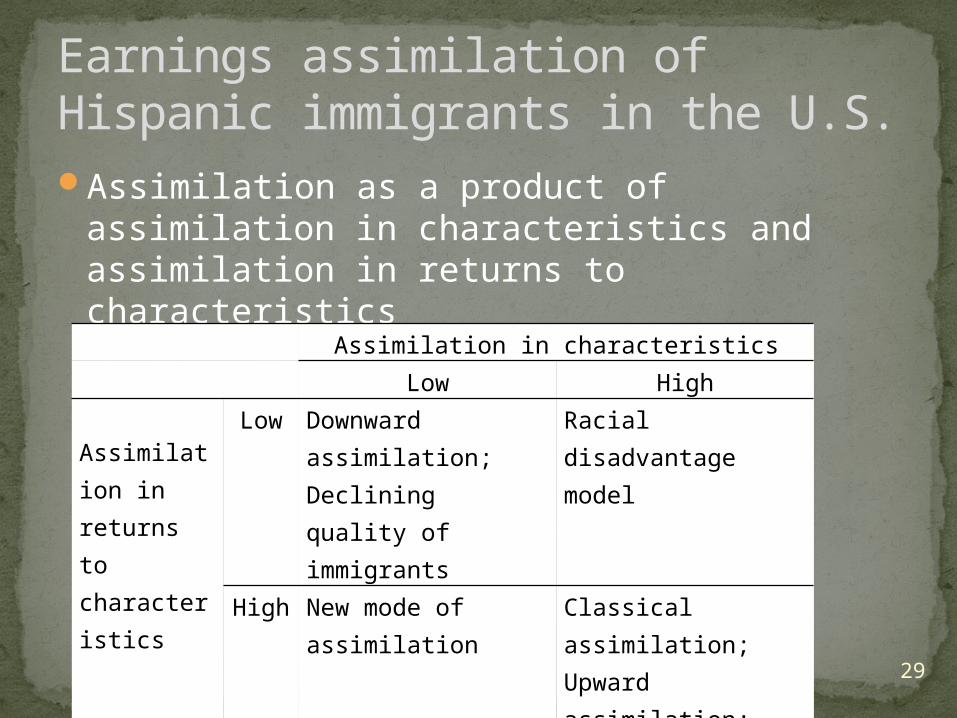
Assimilation as a product of assimilation in characteristics and assimilation in returns to characteristics
Earnings assimilation of Hispanic immigrants in the U.S.
Assimilation in characteristics Low High
Assimilation in returns to characteristics
Low Downward assimilation;Declining quality of immigrants
Racial disadvantage model
High New mode of assimilation
Classical assimilation; Upward assimilation;Institutional perspective

30
With the covariates of the native whites
Quantile functions for the counterfactuals (foreign-born Hispanics)With the
coefficients of the native whites

31
With the covariates of the native whites
Quantile functions for the counterfactuals (2nd gen. Hispanics)With the
coefficients of the native whites
32
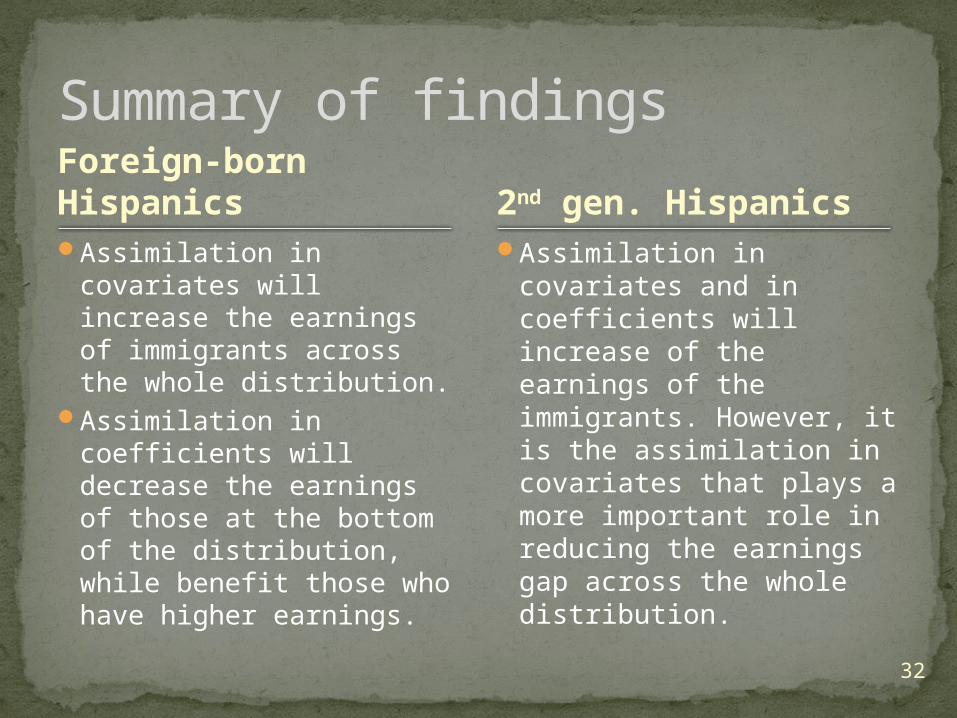
Foreign-born HispanicsAssimilation in covariates
will increase the earnings of immigrants across the whole distribution.
Assimilation in coefficients will decrease the earnings of those at the bottom of the distribution, while benefit those who have higher earnings.
Assimilation in covariates and in coefficients will increase of the earnings of the immigrants. However, it is the assimilation in covariates that plays a more important role in reducing the earnings gap across the whole distribution.
Summary of findings
2nd gen. Hispanics

33
Foreign-born HispanicsRacial disadvantage
model and the declining quality of immigrants argument do not hold for the immigrants at the lower end of the earnings distribution.
Downward assimilation does not hold for the immigrants since their difference with the native whites is mainly due to difference in covariates.
Conclusion
2nd gen. Hispanics

34
Albrecht, J., A. Van Vuuren, et al. (2009). "Counterfactual distributions with sample selection adjustments: Econometric theory and an application to the Netherlands." Labour Economics 16(4): 383-396.
Bassett, G. W. and R. W. Koenker (1986). "Strong consistency of regression quantiles and related empirical processes." Econometric Theory 2(2): 191-201.
Bassett Jr, G. and R. Koenker (1982). "An empirical quantile function for linear models with iid errors." Journal of the American Statistical Association 77(378): 407-415.
Machado, J. and J. Mata (2005). "Counterfactual decomposition of changes in wage distributions using quantile regression." Journal of Applied Econometrics 20(4): 445-466.
Mosteller, F. and J. W. Tukey (1977). "Data analysis and regression. A second course in statistics."
Silverman, B (1986). "Density estimation for statistics and data analysis. " Monographs on Statistics and Applied Probability. Chapman and Hall, New York.
Some References on Quantile Regression

35
R: Package ‘quantreg’ by Roger Koenker
Software

36
Thank you!
Related Documents