Xerox Investor Handout as of Q1 2018 Xerox to Combine with Fuji Xerox Announcement Fourth Quarter 2017 Earnings http://www.xerox.com/investor

Welcome message from author
This document is posted to help you gain knowledge. Please leave a comment to let me know what you think about it! Share it to your friends and learn new things together.
Transcript
Xerox Investor Handout as of Q1 2018
Xerox to Combine with Fuji Xerox AnnouncementFourth Quarter 2017 Earnings
http://www.xerox.com/investor

2
Additional Information and Where to Find It
This presentation may be deemed to be solicitation material in respect of the transactions with FUJIFILM Holdings Corporation (“Fujifilm”) described herein (the “Transactions”) and/or the matters to be considered at the Company’s 2018 Annual Meeting of Shareholders. In connection with the Transactions and the 2018 Annual Meeting, Xerox plans to file with the Securities and Exchange Commission (“SEC”) and furnish to Xerox’s shareholders one or more proxy statements and other relevant documents. BEFORE MAKING ANY VOTING DECISION, XEROX’S SHAREHOLDERS ARE URGED TO READ THE PROXY STATEMENT(S) IN THEIR ENTIRETY WHEN THEY BECOME AVAILABLE AND ANY OTHER DOCUMENTS TO BE FILED WITH THE SEC IN CONNECTION WITH THE TRANSACTIONS AND/OR THE COMPANY’S 2018 ANNUAL MEETING OR INCORPORATED BY REFERENCE IN THE PROXY STATEMENTS BECAUSE THEY WILL CONTAIN IMPORTANT INFORMATION ABOUT THE TRANSACTIONS AND/OR THE COMPANY’S 2018 ANNUAL MEETING AND THE PARTIES RELATED THERETO. Xerox’s shareholders will be able to obtain a free copy of documents filed with the SEC at the SEC’s website at http://www.sec.gov. In addition, Xerox’s shareholders may obtain a free copy of Xerox’s filings with the SEC from Xerox’s website at http://www.xerox.com under the heading “Investor Relations” and then under the heading “SEC Filings.”
Participants in the Solicitation
The directors, executive officers and certain other members of management and employees of Xerox may be deemed “participants” in the solicitation of proxies from shareholders of Xerox in favor of the Transactions or in connection with the matters to be considered at the Company’s 2018 Annual Meeting. Information regarding the persons who may, under the rules of the SEC, be considered participants in the solicitation of the shareholders of Xerox in connection with the Transactions or the Company’s 2018 Annual Meeting will be set forth in the applicable proxy statement and other relevant documents to be filed with the SEC. You can find information about Xerox’s executive officers and directors in Xerox’s Annual Report on Form 10-K for the fiscal year ended December 31, 2016, Xerox’s and such persons’ other filings with the SEC and in Xerox’s definitive proxy statement filed with the SEC on Schedule 14A.
Forward-Looking Statements
This presentation, and other written or oral statements made from time to time by management contain “forward-looking statements” as defined in the Private Securities Litigation Reform Act of 1995. The words “anticipate”, “believe”, “estimate”, “expect”, “intend”, “will”, “should” and similar expressions, as they relate to us, are intended to identify forward-looking statements. These statements reflect management’s current beliefs, assumptions and expectations and are subject to a number of factors that may cause actual results to differ materially. Such factors include but are not limited to: our ability to address our business challenges in order to reverse revenue declines, reduce costs and increase productivity so that we can invest in and grow our business; changes in economic and political conditions, trade protection measures, licensing requirements and tax laws in the United States and in the foreign countries in which we do business; changes in foreign currency exchange rates; our ability to successfully develop new products, technologies and service offerings and to protect our intellectual property rights; the risk that multi-year contracts with governmental entities could be terminated prior to the end of the contract term and that civil or criminal penalties and administrative sanctions could be imposed on us if we fail to comply with the terms of such contracts and applicable law; the risk that partners, subcontractors and software vendors will not perform in a timely, quality manner; actions of competitors and our ability to promptly and effectively react to changing technologies and customer expectations; our ability to obtain adequate pricing for our products and services and to maintain and improve cost efficiency of operations, including savings from restructuring actions; the risk that individually identifiable information of customers, clients and employees could be inadvertently disclosed or disclosed as a result of a breach of our security systems; reliance on third parties, including subcontractors, for manufacturing of products and provision of services; our ability to manage changes in the printing environment and expand equipment placements; interest rates, cost of borrowing and access to credit markets;
Safe Harbor

3
Safe Harbor (cont’d)Forward-Looking Statements (cont’d)
funding requirements associated with our employee pension and retiree health benefit plans; the risk that our operations and products may not comply with applicable worldwide regulatory requirements, particularly environmental regulations and directives and anti-corruption laws; the outcome of litigation and regulatory proceedings to which we may be a party; the risk that we do not realize all of the expected strategic and financial benefits from the separation and spin-off of our Business Process Outsourcing business; the effects on our business resulting from actions of activist shareholders; and other factors that are set forth in the “Risk Factors” sect ion, the “Legal Proceedings” section, the “Management’s Discussion and Analysis of Financial Condition and Results of Operations” section and other sections of our Quarterly Reports on Form 10-Q for the quarters ended March 31, 2017, June 30, 2017 and September 30, 2017 and our 2016 Annual Report on Form 10-K, as well as our Current Reports on Form 8-K filed with the SEC. Furthermore, the actual results of the Transactions could vary materially as a result of a number of factors, including, but not limited to: (i) the risk that the transactions may not be completed in a timely manner or at all, which may adversely affect Xerox’s business and the price of Xerox’s common stock, (ii) the failure to satisfy the conditions to the consummation of the transactions, including the receipt of certain approvals from Xerox’s shareholders and certain governmental and regulatory approvals, (iii) the parties may be unable to achieve expected synergies and operating efficiencies in the transactions within the expected time frames or at all, (iv) the transactions may not result in the accretion to Xerox’s earnings or other benefits, (v) the occurrence of any event, change or other circumstance that could give rise to the termination of the transaction agreements, (vi) the effect of the announcement or pendency of the transactions on Xerox’s and/or Fujifilm business relationships, operating results, and business generally, risks related to the proposed transactions disrupting Xerox’s current plans and operations and potential difficulties in Xerox’s employee retention as a result of the transactions, (vii) risks related to diverting management's attention from Xerox’s ongoing business operations, (viii) the outcome of any legal proceedings that may be instituted against Xerox, its officers or directors related to the transaction agreements or the transactions and (ix) the possibility that competing offers or acquisition proposals for Xerox will be made. Xerox assumes no obligation to update any forward-looking statements as a result of new information or future events or developments, except as required by law.
Fuji Xerox Co., Ltd. (“Fuji Xerox”) is a joint venture between Xerox Corporation and Fujifilm in which Xerox holds a noncontrolling 25% equity interest and Fujifilm holds the remaining equity interest. In April 2017, Fujifilm formed an independent investigation committee (“IIC”) to primarily conduct a review of the appropriateness of the accounting practices at Fuji Xerox’s New Zealand subsidiary and at other subsidiaries. The IIC completed its review during the second quarter 2017 and identified aggregate adjustments to Fuji Xerox’s financial statements of approximately JPY 40 billion (approximately $360 million) primarily related to misstatements at Fuji Xerox’s New Zealand and Australian subsidiaries. We determined that our share of the total adjustments identified as part of the investigation was approximately $90 million and impacted our fiscal years 2009 through 2017. We concluded that we should revise our previously issued annual and interim consolidated financial statements for 2014, 2015 and 2016 and the first quarter of 2017 the next time they are filed. Our review of this matter has been completed. However, Fujifilm and Fuji Xerox continue to review Fujifilm’s oversight and governance of Fuji Xerox as well as Fuji Xerox’s oversight and governance over its businesses in light of the findings of the IIC. At this time, we can provide no assurances relative to the outcome of any potential governmental investigations or any consequences thereof that may happen as a result of this matter.

What We Are Announcing Today
Strong Q4 Xerox results with significant
improvement across all key metrics,
providing positive momentum entering 2018
Xerox and Fuji Xerox to combine, creating
a global leader in innovative print
technologies and intelligent work solutions
4

Xerox Q4 and FY17 Results

• Adjusted1 EPS and net income expand year-over-year
• Equipment turns to growth with increasing demand for new products; strategic growth areas up 5% in CC1
• Achieved operating margin gains while supporting future revenue initiatives
• Continued strong adjusted1 operating cash flow, at higher end of guidance range
Strong Fourth-Quarter ResultsImprovement across all key metrics; positions us well entering 2018
• Revenue of $2.7B, up 0.5% or down 2.0% CC1
• Equipment up 4.3% or 1.5% CC1
• Post sale down 0.7% or 3.1% CC1
(8.0)%
(6.0)%
(4.0)%
(2.0)%
0.0%
4Q16 1Q17 2Q17 3Q17 4Q17
Revenue (CC1)
(5.0)%
(2.0)%
• Adj.1 operating margin: 14.4%, up 20 bps YOY
0.0%
4.0%
8.0%
12.0%
16.0%
4Q16 1Q17 2Q17 3Q17 4Q17
Adjusted1 Operating Margin
14.2% 14.4%
• GAAP Loss : ($0.78), down $1.48 due
to $400M tax charge2
• Adj.1 EPS: $1.04, up 4 cents
-
0.20
0.40
0.60
0.80
1.00
1.20
4Q16 1Q17 2Q17 3Q17 4Q17
Adjusted1 EPS$
$1.00 $1.04
Note: All numerical comparisons shown above are on a year-over-year basis.
1. Constant Currency (CC), Adjusted Operating Margin, Adjusted EPS and Net Income, Adjusted Operating Cash Flow: see Non-GAAP Financial Measures.
2. Q4 2017 GAAP Loss per share from continuing operations includes estimated non-cash charge of $400M associated with the enactment of the U.S. Tax Act in December 2017. 6

Delivering on Our 2017 Commitments
New Xerox
Xerox + Fuji Xerox
Combination• Year 2 Strategic
Transformation
savings of $680M
exceeded full-year
target
• Enabled investment
in the business and
offset FY transaction
currency headwinds
of ~$75M
Overachieved on
Cost Transformation
Drove Revenue Toward
Growth Markets
• Reduced debt by
$800M
• Contributed $836M
to pension,
significantly reducing
underfunded gap
• Eliminated A/R sales
programs, driving
future savings and
simplifying
operations
Optimized Capital
Structure
Xerox
Fuji Xerox
• Successful launch of
29 new workplace
devices
• 65 new dealer
partners signed
• Strategic growth
areas providing 40%
of revenue and up
1% CC1 FY (up 5%
CC1 in Q4)
• Presented
comprehensive
strategy at
December 2016
Investor Day
• New Xerox launched
January 1, 2017 with
positive market
reception
Well Positioned
Entering 2018
2017 Progress Provides Strong Foundation
• Building on
2017 progress,
we will continue
to execute on
our strategy with
focus on
delivering on
our 2018
commitments
• Revenue: down 4.7% in-line with down mid-single digits at CC1
• Adj1 Operating Margin: 12.8%, up 30 bps within 12.5-13.5% range
• Adj1 EPS: $3.48 above $3.28-$3.44 range
• Adj1 Operating Cash Flow: $972M at high end of $800M-$1B range
Achieved
FY 2017
Guidance
Note: All numerical comparisons shown above are on a year-over-year basis.
1. Constant Currency (CC), Adjusted Operating Margin, Adjusted EPS, and Adjusted Operating Cash Flow from Continuing Operations: see Non-GAAP Financial Measures.
7

Overachieving on Strategic Transformation
1. MPS = Managed Print Services.
Sources of Productivity and Cost Savings Cumulative Gross Productivity & Cost Savings
13%
20%
20%
17%
30%
$1,700M+
$1,500M$1,100M$500MOriginal Target
Supply Chain &
Procurement
Delivery
Cost of
Production
Sales &
Contracting
G&A
• Integrated supply chain
• Procurement
• MPS(1) delivery
• Technical service
• Remote connectivity
• Manufacturing
• RD&E and design efficiency
• Sales productivity
• Pricing tools
• Real estate
• IT
• Finance
• Management structure
• Facilities
Delivery
Cost of
Production
Sales &
Contracting
G&A
Supply Chain &
Procurement
~$550M
~$1,225M
2016 2017 Cumulative through
2018
(Actuals)
8

Xerox to Combine with Fuji Xerox

10
Xerox and Fuji Xerox – Better TogetherCombining to lead the evolution of the industry and unleash competitive strengths
Notes: Assumes exchange rate of JPY114: US$1.
1. Reflects 2017 actual revenue for Xerox and calendar year 2017 estimated revenue for Fuji Xerox (includes inter-company revenues of ~$0.1B for Xerox and ~$1.6B for Fuji Xerox).
2. Recurring revenue is equal to Post sale revenue.
$10.3 Billion 2017 Revenue1 $9.6 Billion 2017 Revenue1
• Iconic, global technology brand
• Innovation DNA: Invented xerography and pioneered MPS
• Among the best operating margins in the industry
• >75% recurring revenue2
Xerox Regions
Fuji Xerox Regions • Strong market presence in faster-growing geographies
• World-class R&D, manufacturing and sales platform
• Leading in Office Products / Office Printer market
• ~40% of revenue from growing market segments of
Graphic Communications and Solutions & Services
#1 worldwide equipment revenue leader
for 8 consecutive years
#1 share in Asia
#1 share in Japan for 8 consecutive years

11
Strategic Value UnlockedFujifilm and Xerox have 56 years of history as one of the most successful Japan/U.S. cross-border collaborations
• Enables access to high growth territories
• Streamlined product portfolio strategy, including
launch timing and R&D coordination
• More efficient R&D and corporate functions
• Shared access to critical IP and technology
• Enhanced customer value proposition on a
broader global scale
• Fully integrated supply chain
• Common long-term vision and strategic growth
development
Opportunities for OptimizationFuji Xerox JV Today
• Xerox unable to access growth markets
• Separate product portfolios and go-to-market
strategies, limiting effectiveness in global deals
• Product launch delays due to handoff processes
• R&D investment overlap
• Suboptimal supply chain and sourcing
relationship
• Distinct visions for long-term growth and
strategic investments in future IP

Financial Value Unlocked
12
1. Funded through new Combined Company debt of $2.5B.
2. Based on midpoint of 7 – 8x EBITDA range and 8.5% discount rate.
$1.25BAnnual cost synergies in 2022
7-8x EBITDAIllustrative industry valuation multiple
Post Close Consideration Illustrative Value of Transaction Cost Synergies
~$12 / share²Implied present value based on 49.9%
allocation to Xerox shareholders
All of Fuji Xerox JV
All of
$1.25B
Transaction
Cost Synergies
$450M
Fuji Xerox JV
Cost Savings
$2.5BCash Dividend¹
49.9%Of Combined Company including:
shareholders receive:

13
Compelling Strategic Rationale
1Creates a global leader
in innovative print
technologies and
intelligent work solutions
with $18 billion in revenue
2Delivers $1.7 billion in total
annual cost savings, with
$1.2 billion to be achieved by
20203
Accelerates path to
revenue growth through
enhanced global reach,
scale and customer value
proposition
4Unleashes world-class
innovation capabilities to
capture significant long-term
growth opportunities5
Enhances financial profile
and flexibility to support
strategic growth investments
and attractive capital returns

Substantial Value for Xerox Shareholders
Transaction
Consideration
$2.5BCash Dividend
(~$9.80/share1)
49.9%of Combined
Company
Cost Savings
Optimized
Operating
Structure
$1.7B+Total Annual Cost
Savings by 2022
$1.2BAnnual Cost Savings
by 2020
Growth
Opportunities
Leadership in Key
Growth
Markets
Above-Market
Revenue
Growth
World-Class
Innovation
Improved
Competitive
Strength
1. Based on current shares outstanding assuming no conversion of preferred shares.
Attractive
Capital
Returns
Capital
Deployment
Investment
GradeCredit Rating
Strategic
Growth
Investments
Greater
Financial
Flexibility
14

15
Fujifilm – Ideal Long-Term PartnerJapan-based leader in document, imaging and information solutions with strong culture of innovation and transformation
Selectively concentrating resources to growth segments
through M&A, capital and R&D investments
Document Solutions
Document-related business activities including the
provision of digital multifunction devices for offices and
related services
Information Solutions
Range of activities focusing mainly on B2B businesses,
including healthcare and highly functional materials
Imaging Solutions
Provides photo-related products and services ranging
from photo-taking to printing
Revenue Breakdown – FY ended March 2017 Growth Strategies
1. Figures in USD billions. Exchange rate of JPY114: US$1.
Photo Imaging
Other Photo
Related
Graphic
Systems
Healthcare
Flat Panel Display
MaterialsRecording Media
and Others
Document
Solutions
46%
10%
5%
11%
17%
9%2%
46%
Imaging
Solutions
~15%
Information
Solutions
~39%
~$20B1

16
Combined Company Facts and Figures
180+Countries
Broad
Global Scale
Strong
Financial Profile
World-Class
Innovation
$18B+In Annual Revenue
2020Return To Revenue
Growth
2022High-teens
Operating Margin
$1.7B+Total Annual Cost
Savings
~$1B Combined R&D
6,600+Engineers
6Innovation Labs
$1.5BFCF2 By 2020
~18,880Combined
Patents1
#1Equipment
Revenue Share
~$120BTotal Addressable
Opportunity
Note: Assumes exchange rate of JPY114: US$1.
1. Combined patents based on Xerox patents as of December 31, 2017 and Fuji Xerox patents as of November 30, 2017.
2. Free cash flow defined as cash flow from operations minus CAPEX, including internal use software.

17
Transaction Summary
• Xerox shareholders to receive $2.5 billion special cash dividend (~$9.80/share1) at closing, for which committed funding
has been obtained
• Xerox shareholders to own 49.9% of Combined Company; Fujifilm to own 50.1%
• Combined Company will be listed on the NYSE post-transaction under the ticker “XRX”
Transaction
Consideration
Capital Structure and
Returns
• Expect to maintain investment grade credit ratings at closing
• Maintain $1.00/share annual dividend
• Maintain Xerox’s current capital return policy of at least 50% of combined free cash flow2 to shareholders
• Opportunity for greater capital deployment including share repurchases and increased dividends over time
Approvals and Timing• Transaction expected to close in the second half of 2018, subject to customary conditions, regulatory and shareholder
approval
Value Creation
• Immediate, significant cash payment, representing more than 30% of Xerox’s unaffected share price of $30.35 as of
January 10, 2018 market close
• At least $1.7 billion total annual cost savings opportunity – $1.2 billion to be achieved by 2020
• Significant revenue synergy opportunities from innovation and footprint in faster-growing markets
Governance
• Jeff Jacobson, current CEO of Xerox, to be named CEO of Combined Company
• Shigetaka Komori, current Chairman and CEO of Fujifilm, will serve as Chairman of the Board
• Board will include seven Directors appointed by Fujifilm and five Independent Directors from current Xerox Board
• Dual headquarters in Norwalk, CT and in Minato, Tokyo
Note: Assumes exchange rate of JPY114: US$1.
1. Based on current shares outstanding assuming no conversion of preferred shares as of January 31, 2018. Final determination of the portion of dividend versus return of capital, for purposes for individual tax treatment,
will be made at closing.
2. Free cash flow defined as cash flow from operations minus CAPEX, including internal use software.

The New Fuji Xerox

19
Compelling Strategic Rationale
1Creates a global leader
in innovative print
technologies and
intelligent work solutions
with $18 billion in revenue
2Delivers $1.7 billion in total
annual cost savings, with
$1.2 billion to be achieved by
20203
Accelerates path to
revenue growth through
enhanced global reach,
scale and customer value
proposition
4Unleashes world-class
innovation capabilities to
capture significant long-term
growth opportunities5
Enhances financial profile
and flexibility to support
strategic growth investments
and attractive capital returns

$18.8 $18.2
$15.9 $15.7
$10.1
$8.1
$6.8 $6.0
$3.4
HP Canon Ricoh Konica Minolta Epson Brother
20
A Global Leader in Innovative Print Technologies and Intelligent Work Solutions
Realization of Clear Industry Leadership
Printing Revenue ($B)1
NEW
FUJI XEROX
2
Notes: Reflects latest fiscal year available for each company; assumes exchange rate of JPY114: US$1.
1. Segments used: HP: Printing; Canon: Office Business Unit; Ricoh: Imaging & Solutions; KM: Office Business.
2. Reflects 2017 actual revenue for Xerox and calendar year 2017 estimated revenue for Fuji Xerox. Eliminates intercompany revenue.
3. MPS=Managed Print Services; CPS=Centralized Print Solutions.
2
2
#1Total Equipment Revenue
Color
A3 MFPs
Production Cut Sheet
Large Enterprise MPS3 & CPS3
1

21
Significant Cost Savings Opportunities
COGS SG&A R&D Fuji Xerox JV Total
~$650M
~$400M
~$200M
~$450M $1.7B
Total expected cost
savings by 2022
Note: Assumes exchange rate of JPY114: US$1.
• Cost savings incremental to Xerox’s ongoing Strategic Transformation program
• Leveraging Xerox’s strong track record of productivity enhancements
• $450 million Fuji Xerox JV cost reduction program commencing immediately
• Combining best manufacturing practices to drive COGS efficiency
• One-time integration and restructuring costs of approximately $1.4 billion mainly in the first three years
2At least $1.7 billion in total annual cost savings by 2022 – $1.2 billion to be achieved by 2020
~$1.25B Transaction
cost synergies

22
$1.7B in Total Annual Cost Savings
R&D
• Eliminate redundancies and optimize footprint of
research centers
• Integrate device controllers
• Combine print drivers, apps, solutions, MPS2 tools
for best of class
SG&A
• Consolidation of central support functions i.e.
Finance, HR
• Optimize selling related costs
• Purchasing scale
100%
~70%
~45%
• Manufacturing and R&D costs reduction
• Product portfolio optimization
• SG&A productivity initiatives
Fuji Xerox JV
Savings
COGS
• Plant footprint optimization
• Optimization of 3rd party outsourcers
• Improved design efficiency and scale
• Integrate supply chain and procurement~85%
1. Does not include Xerox expected ongoing Strategic Transformation cost savings.
2. MPS=Managed Print Solutions.
Sources of $1.7B Total Annual Cost Reductions1 Expected Cost Reduction Progression
Post Close Timing
Combining companies unlocks substantial incremental cost savings opportunities
Year 1 Year 2 Year 3 Year 4
2

North America
Europe
Developing Markets
$19B
$28B
$36B
36%
27%
13%
5%
12%7%
North America Japan Europe China Asia Pacific DMO
Enhanced Global Leadership
Source: IDC and company estimates.
Notes: Figures in USD billions. Exchange rate of JPY114: US$1. Market size in 2017 USD; Market share based on 2016 equipment revenues; Asia Pacific market share includes China. DMO is Developing Markets.
1. Represents Total Addressable Opportunity.
2. Represents CAGRs from 2016-2020.
3. Reflects Xerox revenue breakdown for full-year 2017 and preliminary Fuji Xerox JV revenue breakdown for calendar year 2017. China segment includes Hong Kong.
21%
31%
14%20%
28%
10%
North America Japan Europe China Asia Pacific DMO
Market
Opportunity1
Market Share By RegionRevenue3 by Region (as % of $18.2B Total)
Combined
Company
Combined Company
~$120B
Global Opportunity1
Flat to Slightly
Down2
$83B1 │ Low-Single Digit Decline2
Xerox Regions
Japan
China
Rest of Asia
Fuji Xerox JV Regions
$36B1 │ Low-Single Digit Growth2
$11B
$8B
$17B
3
23
24
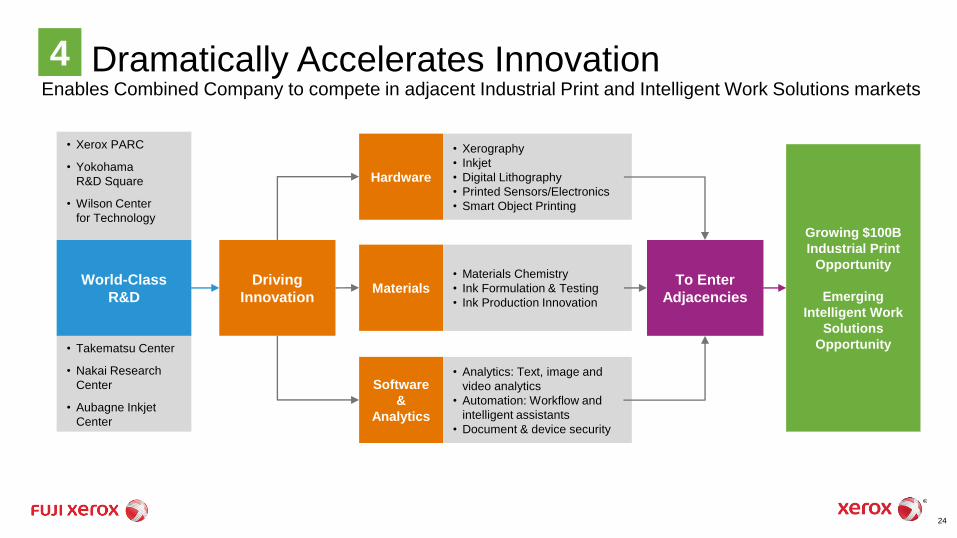
Dramatically Accelerates InnovationEnables Combined Company to compete in adjacent Industrial Print and Intelligent Work Solutions markets
• Xerox PARC
• Yokohama
R&D Square
• Wilson Center
for Technology
• Takematsu Center
• Nakai Research
Center
• Aubagne Inkjet
Center
World-Class
R&D
Driving
Innovation
Hardware
• Xerography
• Inkjet
• Digital Lithography
• Printed Sensors/Electronics
• Smart Object Printing
Materials• Materials Chemistry
• Ink Formulation & Testing
• Ink Production Innovation
Software
&
Analytics
• Analytics: Text, image and
video analytics
• Automation: Workflow and
intelligent assistants
• Document & device security
To Enter
Adjacencies
Growing $100B
Industrial Print
Opportunity
Emerging
Intelligent Work
Solutions
Opportunity
4

25
Enhanced Financial Profile
Combined Company
(Targets)
• Achieves revenue growth in 2020
• Adjusted operating profit margin in
the high teens in 2022
• $1.5 billion free cash flow1 in 2020
• Accretive to EPS in 2020
Revenue
Adj. Operating
Profit Margin1
Adj. EBITDA
less Capex1,3
Adj. EBITDA1,2
Note: Assumes exchange rate of JPY114: US$1. All figures are based on calendar year.
1. Adjusted Operating Profit/Margin is calculated by adjusting our reported pre-tax income and margin amounts for Amortization of intangible assets, Restructuring and related costs, Non-service retirement-related costs
and Other expenses, net. Free cash flow defined as cash flow from operations minus CAPEX, including internal use software.
2. In addition to the costs and expenses noted as adjustments for our Adjusted Operating Profit/Margin measure, Adjusted EBITDA also excludes Depreciation.
3. Including change in equipment on operating lease.
Combined Company
(2017 Proforma)
$1.8B
$18.2B
10%
$2.6B
5

26
Capital Structure and Balance Sheet
Selected Balance Sheet Items at December 31, 20171
Note: Assumes exchange rate of JPY114: US$1.
1. Reflects 2017 actuals for Xerox and calendar year 2017 estimated revenue for Fuji Xerox.
2. Other post employment benefits reflects retiree health benefits.
3. Finance Assets Include:
• Xerox: $3.7B of Finance receivables and $0.5B of Equipment on operating lease.
• Fuji Xerox: $1.6B of Finance receivables exclude Equipment on operating lease.
4. $350M pension contribution required as a result of change in control.
USD Billions
• Xerox plans to repay $265 million bond maturing in
May 2018 with cash on hand
• Transaction impact:
• All Xerox and Fuji Xerox debt to be retained on
the Combined Company’s balance sheet
• $150 million of fees and expenses (preliminary
estimate)
• $2.85 billion of new debt:
• $2.5 billion bridge financing commitment has
been obtained to support the $2.5 billion special
cash dividend to Xerox shareholders
• $350 million to fund mandatory pension
contribution4
Cash & Cash Equivalents $1.3 $0.7
Total Debt $5.5 $0.5
Pension and OPEB2 (pre-tax) $2.1 $0.1
Finance Assets3 $4.2 $1.6

27
Capital Allocation PolicyMaintain the principles of Xerox’s disciplined return on investment approach
• Expected to maintain investment grade credit ratings
• Maintain a substantial liquidity position with cash on hand and committed credit facilities
• Stronger balance sheet supports credit rating profile and provides more financial flexibility
• Strengthened cash flows support incremental investments in growth and value creation opportunities
• Selectively pursue M&A in strategic growth areas to improve portfolio mix and drive profit expansion
• Maintain $1.00 annual dividend per share
• Maintain commitment to return at least 50% of free cash flow to shareholders
• Opportunity for greater capital deployment, including share repurchases and increased dividends
over time
Leverage
Targeted
Investments
Capital
Return
28
Summary Strong Q4 and FY17 performance reflects successful execution of
our strategic priorities, providing positive momentum as we enter the
new chapter of Xerox’s transformation
Combining forces with Fuji Xerox to create a global leader in
innovative print technologies and intelligent work solutions
Transaction unlocks substantial shareholder value and creates
significantly stronger and more competitive combined company
Combined Company will have enhanced prospects for revenue
growth and margin expansion
Committed to continued progress on our operational and financial
performance in 2018, while driving toward the successful completion of
our proposed combination with Fuji Xerox

Fourth Quarter 2017 Earnings
Jeff Jacobson, CEOBill Osbourn, CFO
January 31, 2018http://www.xerox.com/investor

Revenue
$2.7B, up 0.5% or down 2.0% CC1
Equipment up 4.3% or 1.5% CC1
Post Sale down 0.7% or 3.1% CC1
Profitability
Adj1 operating margin: 14.4%, up 20 bps
GAAP Loss2,3: $(0.78), down $1.48 due
to U.S. Tax Act related charge of $400M
Adj1 EPS: $1.04, up 4 cents
Cash
Operating cash flow2: $(28)M reflects
A/R sales programs elimination
Adj1,4 operating cash flow: $322M
Ending Cash: $1.3B
Fourth-Quarter Overview
Strong fourth quarter; positions us well entering 2018
• Adjusted1 EPS and net income expand year-over-year
• Equipment turns to growth with increasing demand for new products; strategic growth areas up 5% CC1
• Achieved operating margin gains while supporting future revenue initiatives
• Continued strong adjusted1 operating cash flow, at higher end of guidance range
(1) Constant Currency (CC) and other adjusted measures: see Non-GAAP Financial Measures. (2) GAAP Loss per share and Operating
Cash Flow are from Continuing Operations. (3) Includes estimated non-cash charge associated with the enactment of the U.S. Tax Act in
December 2017. (4) Adjusted for previously announced $350M impact of certain accounts receivable (A/R) sales programs elimination.
Note: all numerical comparisons shown above are on a year-over-year basis.30

31
Delivering on Our 2017 Commitments
New Xerox
Xerox + Fuji Xerox
Combination• Year 2 Strategic
Transformation
savings of $680M
exceeded full-year
target
• Enabled investment
in the business and
offset FY transaction
currency headwinds
of ~$75M
Overachieved on
Cost Transformation
Drove Revenue Toward
Growth Markets
• Reduced debt by
$800M
• Contributed $836M
to pension,
significantly reducing
underfunded gap
• Eliminated A/R sales
programs, driving
future savings and
simplifying
operations
Optimized Capital
Structure
Xerox
Fuji Xerox
• Successful launch of
29 new workplace
devices
• 65 new dealer
partners signed
• Strategic growth
areas providing 40%
of revenue and up
1% CC1 FY (up 5%
CC1 in Q4)
• New leadership team
presented
comprehensive
strategy at
December 2016
Investor Day
• New Xerox launched
January 1, 2017 with
positive market
reception
Well Positioned
Entering 2018
2017 Progress Provides Strong Foundation
• Building on
2017 progress,
we will continue
to execute on
our strategy with
focus on
delivering on
our 2018
commitments
• Revenue: down 4.7% in-line with down mid-single digits at CC1
• Adj1 Operating Margin: 12.8%, up 30 bps within 12.5-13.5% range
• Adj1 EPS: $3.48 above $3.28-$3.44 range
• Adj1 Operating Cash Flow: $972M at high end of $800M-$1B range
Achieved
FY 2017
Guidance
(1) Adjusted Measures: see Non-GAAP Financial Measures. Note: all numerical comparisons shown above are on a year-over-year basis.

Financial Performance(in millions, except per share data)
P&L Measures Q4 2017 B/(W) YOY
Revenue $ 2,747 $ 13
Operating Income – Adjusted1 395 7
Equity Income 25 (2)
Other Expenses, net – Adjusted1 29 28
Net Income2 (196) (381)
Net Income – Adjusted1 274 10
GAAP Loss2 (0.78) (1.48)
EPS – Adjusted1 1.04 0.04
(1) Adjusted Measures: see Non-GAAP Financial Measures. (2) Net Income and GAAP Loss per share from continuing operations include
estimated non-cash charge of $400M associated with the enactment of U.S. Tax Act in December 2017.
P&L Ratios (Adjusted1) Q4 2017 B/(W) YOY
Gross Margin 40.4% 0.1 pts
RD&E % 3.9% 0.1 pts
SAG % 23.2% (0.1) pts
Operating Income Margin 14.4% 0.2 pts
Tax Rate 26.2% (5.1) pts
32
0.0%
4.0%
8.0%
12.0%
16.0%
4Q16 1Q17 2Q17 3Q17 4Q17(8.0)%
(6.0)%
(4.0)%
(2.0)%
0.0%
4Q16 1Q17 2Q17 3Q17 4Q17
-
0.20
0.40
0.60
0.80
1.00
1.20
4Q16 1Q17 2Q17 3Q17 4Q17
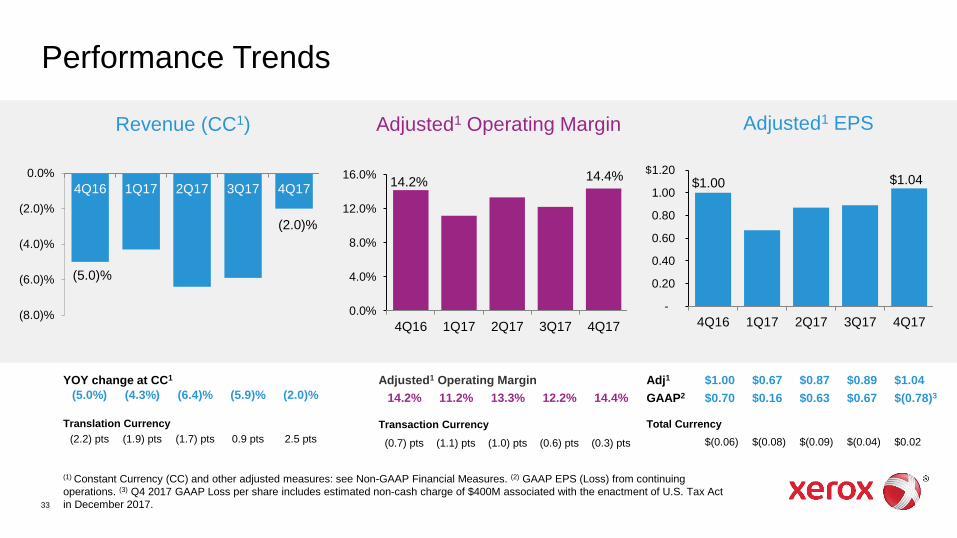
Performance Trends
(1) Constant Currency (CC) and other adjusted measures: see Non-GAAP Financial Measures. (2) GAAP EPS (Loss) from continuing
operations. (3) Q4 2017 GAAP Loss per share includes estimated non-cash charge of $400M associated with the enactment of U.S. Tax Act
in December 2017.
Revenue (CC1) Adjusted1 Operating Margin Adjusted1 EPS
$
YOY change at CC1
(5.0%) (4.3%) (6.4)% (5.9)% (2.0)%
Translation Currency
(2.2) pts (1.9) pts (1.7) pts 0.9 pts 2.5 pts
Adjusted1 Operating Margin
14.2% 11.2% 13.3% 12.2% 14.4%
Transaction Currency
(0.7) pts (1.1) pts (1.0) pts (0.6) pts (0.3) pts
Adj1 $1.00 $0.67 $0.87 $0.89 $1.04
GAAP2 $0.70 $0.16 $0.63 $0.67 $(0.78)3
Total Currency
$(0.06) $(0.08) $(0.09) $(0.04) $0.02
33
14.2%
(5.0)%
$1.00
(2.0)%
14.4% $1.04

YOY Change
Q4 2017 AC CC3
Total Revenue $ 2,747 0.5% (2.0)%
North America 1,601 (1.6)% (2.1)%
International 1,001 4.8% (1.2)%
Other1 145 (4.6)% (4.6)%
Equipment Revenue $ 682 4.3% 1.5%
Entry 100 5.3% 4.1%
Mid-range 410 2.2% (0.2)%
High-end 161 7.3% 3.9%
Other 11 N/M N/M
Managed Document Services2 $ 913 3.4% 0.8%
Revenue Performance(in millions)
58%
36%
6%
Total Revenue by Geographic Sales Channel
North America
International
Other
15%
60%
23%
2%Equipment Sales Revenue
Entry
Mid-range
High-end
Other
Managed Document Services2: 33% of Total Revenue
34
(1) Other total revenue includes OEM business, sales to Fuji Xerox and licensing. (2) Managed Document Services (MDS) includes Managed
Print Services (MPS) (including Global Imaging Systems MPS), Centralized Print Services (CPS) and Workflow Automation and excludes
Communication and Marketing Solutions (CMS). (3) Constant Currency (CC): see Non-GAAP Financial Measures.
1

Key Performance Metrics
Strategic Growth Areas Installs Strategic Transformation
Q4 2017
(% change YOY) Color B&W
Entry A4 MFPs2 32% 34%
Mid-Range2 14% 1%
High-End2 (5)% (10)%
% Change CC1
Q4 2017 YOY TTM
Enterprise MDS $1.0B 20% 1%
A4 MFPs
MPS & Workflow Automation
Production Color
1% 40%
2017 FY Results
YOY revenue
change at CC1
Gross Savings3Actuals/
Estimated
Initial
Target4
2016 FY $550M $500M
2017 FY $680M $600M
2018 FY guidance $475M $400M
Cumulative thru 2018 $1.7B $1.5B+
FY ‘17 Restructuring $220M $225M
(1) Constant Currency (CC): see Non-GAAP Financial Measures. (2) Entry installations exclude OEM sales; Mid-range and High-end color
installations exclude Fuji Xerox digital front-end sales. (3) Gross savings are the year-over-year savings, assuming similar operating levels. (4) Initial Strategic Transformation gross savings target provided at our December 2016 Investor Day.
Signings
30%
17%20%
20%
13%Delivery
Cost of Production
Sales & Contracting
G&A
Supply Chain &Procurement
Sources of Productivity
2 pts
% of Revenue
in Strategic
Growth Areas
Mix shift YOY
35
Note: signings do not include GIS or Xerox
Partner Print Services results
Offering Focus Areas

Cash Flow
Operating cash flow from continuing operations at high-end of guidance range
Working Capital1 a use driven by elimination of A/R sales programs
CAPEX2 of $35M in Q4, $105M FY
Financing cash flow reflects $475M senior note payment in Q4
(in millions) Q4 2017 FY 2017
Pre-tax Income from Continuing Ops $ 226 $ 570
Non-cash add-backs3 174 767
Restructuring payments (55) (224)
Pension Contributions (119) (836)
Working Capital, net1 (219) (427)
Change in Finance Assets4 (37) 231
Other5 2 41
Cash from Operations - Continuing Ops $ (28) $ 122
Adj. Cash from Operations – Continuing Ops6 $ 322 $ 972
Cash from Investing - Continuing Ops $ 85 $ (31)
Cash from Financing $ (555) $ (985)
Ending Cash and Cash Equivalents $1,293 $1,293
Memo:
Free Cash Flow6 $ (63) $ 17
Adj. Free Cash Flow6 $ 287 $ 867
(1) Working Capital, net includes accounts receivable, collections of deferred proceeds from sales of receivables, accounts payable and accrued compensation and inventory.(2) CAPEX including Internal Use Software. (3) Non-Cash Add-backs include depreciation & amortization excluding equipment on operating lease, provisions, stock-based
compensation, defined benefit pension expense, restructuring charges and gain on sales of businesses and assets. (4) Includes equipment on operating leases and its related
depreciation, finance receivables and collections on beneficial interest from sales of finance receivables. (5) Includes other current and long-term assets and liabilities, derivative
assets and liabilities, other operating, net, distributions from net income of unconsolidated affiliates and taxes. (6) Adj. Cash from Operations and Free Cash Flow: see Non-
GAAP Financial Measures.
36
FY 2017 Actuals Guidance
GAAP $122M $(50) - $150M
Adjusted* $972M $800M - $1B
*Adjusted to exclude incremental, voluntary pension
contribution to the U.S. plan of $500M and $350M impact
of accounts receivable (A/R) sales programs elimination
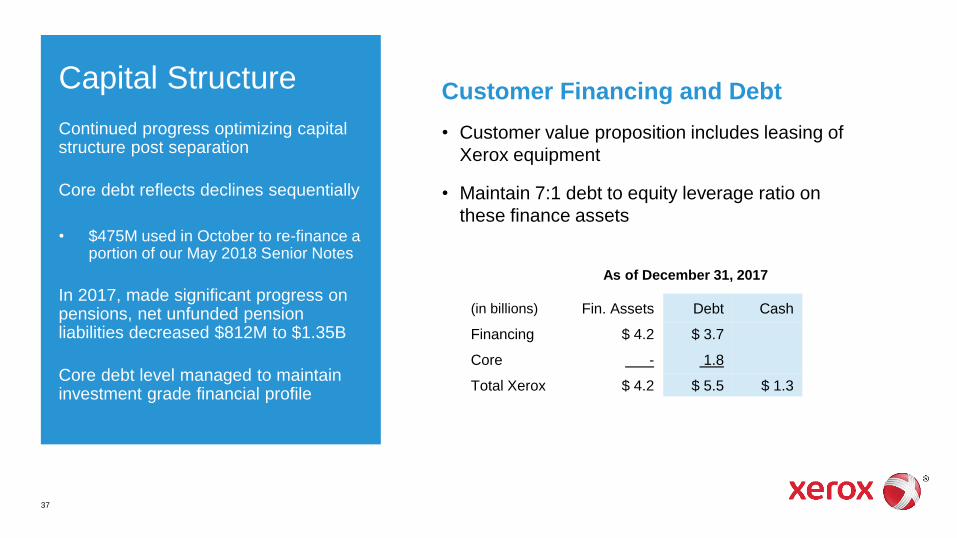
Capital Structure
Continued progress optimizing capital structure post separation
Core debt reflects declines sequentially
• $475M used in October to re-finance a portion of our May 2018 Senior Notes
In 2017, made significant progress on pensions, net unfunded pension liabilities decreased $812M to $1.35B
Core debt level managed to maintain investment grade financial profile
As of December 31, 2017
(in billions) Fin. Assets Debt Cash
Financing $ 4.2 $ 3.7
Core - 1.8
Total Xerox $ 4.2 $ 5.5 $ 1.3
Customer Financing and Debt
• Customer value proposition includes leasing of
Xerox equipment
• Maintain 7:1 debt to equity leverage ratio on
these finance assets
37

38
2018 Full-Year Guidance
Cash Flow from
Continuing Ops 2017 Actuals 2018
Operating Cash Flow$122M
$972M Adjusted$900M - $1.1B
Free Cash Flow1 $17M
$867M Adjusted$750M - $950M
(1) Constant Currency (CC) and other adjusted measures: see Non-GAAP Financial Measures. (2) EPS from Continuing Operations. (3) 2018
Adjusted EPS to GAAP EPS differences include non-service retirement related costs, restructuring and related costs, amortization of intangibles,
as well as other discretely identified adjustments. (4) Year-over-year CAPEX increase driven by incremental transformative IT. (5) Remaining
6.35% Senior Notes due May 2018.
P&L 2017 Actuals 2018
Revenue CC1 (4.7)% (2)% - (4)%
Adj. Operating Margin1 12.8% 13% - 14%
Adj. Tax Rate1 25.0% 24% - 27%
GAAP EPS2 $0.70 $2.30 - $2.50
Adj. EPS1,3 $3.48 $3.50 - $3.70
Capital Allocation 2017 Actuals 2018
Common Dividends $274M$1.00 per share;
~$260M
CAPEX4 $105M ~$150M
M&A $87M $150M - $200M
Debt Reduction5 $800M ~$265M
39
2017: Delivered on
Commitments
2018: Building on
Momentum
• Strong fourth-quarter and full-year
performance reflects successful execution of
strategy and Strategic Transformation
• Building on foundation for continued progress
in 2018
‒ Drive revenue improvement by accelerating
MPS, workflow and SMB
‒ Strategic Transformation continues to enable
margin expansion and investment
‒ Strengthened capital structure supports strong
cash flow

40
Appendix

Revenue Trend
(in millions) Q1 Q2 Q3 Q4 FY Q1 Q2 Q3 Q4 FY
Total Revenue $2,615 $2,793 $2,629 $2,734 $10,771 $2,454 $2,567 $2,497 $2,747 $10,265
% Change (6.8)% (4.6)% (5.6)% (7.2)% (6.1)% (6.2)% (8.1)% (5.0)% 0.5% (4.7)%
CC1 % Change (4.7)% (3.4)% (4.1)% (5.0)% (4.3)% (4.3)% (6.4)% (5.9)% (2.0)% (4.7)%
Post Sale2 $2,073 $2,143 $2,056 $2,080 $8,352 $1,952 $2,021 $1,976 $2,065 $8,014
% Change (5.7)% (4.2)% (3.9)% (5.5)% (4.8)% (5.8)% (5.7)% (3.9)% (0.7)% (4.0)%
CC1 % Change (3.3)% (2.9)% (2.2)% (3.2)% (2.9)% (3.9)% (3.9)% (4.8)% (3.1)% (3.9)%
Post Sale % Revenue
79% 77% 78% 76% 78% 80% 79% 79% 75% 78%
Equipment2 $542 $650 $573 $654 $2,419 $502 $546 $521 $682 $2,251
% Change (11.0)% (5.7)% (11.4)% (12.1)% (10.0)% (7.4)% (16.0)% (9.1)% 4.3% (6.9)%
CC1 % Change (9.7)% (4.9)% (10.4)% (10.1)% (8.7)% (5.7)% (14.6)% (10.0)% 1.5% (7.2)%
Memo:
OEM and CMS impact on Total Revenue
(0.3) pts (0.2) pts (0.6) pts (0.7) pts (0.4) pts (0.9) pts (0.6) pts (0.3) pts (0.7) pts (0.6) pts
(1) Constant currency: see Non-GAAP Financial Measures. (2) Equipment sales revenue in 2016 has been revised to reclassify certain GIS IT-
related equipment sales to Other sales, which are included in Post Sale revenue.
2016
41
2017

42
Non-GAAP Financial Measures

43
Non-GAAP Financial MeasuresWe have reported our financial results in accordance with generally accepted accounting principles (GAAP). In addition, we have discussed our
financial results using the non-GAAP measures described below. We believe these non-GAAP measures allow investors to better understand the
trends in our business and to better understand and compare our results. Accordingly, we believe it is necessary to adjust several reported amounts,
determined in accordance with GAAP, to exclude the effects of certain items as well as their related income tax effects.
A reconciliation of these non-GAAP financial measures to the most directly comparable financial measures calculated and presented in accordance
with GAAP are set forth below as well as on our website at www.xerox.com/investor.
These non-GAAP financial measures should be viewed in addition to, and not as a substitute for, the company’s reported results prepared in
accordance with GAAP.
Adjusted Earnings Measures
• Net income and Earnings per share (EPS)
• Effective tax rate
• Gross margin, RD&E and SAG (only adjusted for non-service retirement-related costs and transaction/proxy related costs)
The above measures were adjusted for the following items:
• Amortization of intangible assets: The amortization of intangible assets is driven by our acquisition activity which can vary in size, nature and timing
as compared to other companies within our industry and from period to period. The use of intangible assets contributed to our revenues earned
during the periods presented and will contribute to our future period revenues as well. Amortization of intangible assets will recur in future periods.

44
Non-GAAP Financial Measures
• Restructuring and related costs: Restructuring and related costs include restructuring and asset impairment charges as well as costs associated
with our Strategic Transformation program beyond those normally included in restructuring and asset impairment charges. Restructuring consists of
costs primarily related to severance and benefits paid to employees pursuant to formal restructuring and workforce reduction plans. Asset
impairment includes costs incurred for those assets sold, abandoned or made obsolete as a result of our restructuring actions, exiting from a
business or other strategic business changes. Additional costs for our Strategic Transformation program are primarily related to the implementation
of strategic actions and initiatives and include third-party professional service costs as well as one-time incremental costs. All of these costs can
vary significantly in terms of amount and frequency based on the nature of the actions as well as the changing needs of the business. Accordingly,
due to that significant variability, we will exclude these charges since we do not believe they provide meaningful insight into our current or past
operating performance nor do we believe they are reflective of our expected future operating expenses as such charges are expected to yield future
benefits and savings with respect to our operational performance.
• Non-service retirement-related costs: Our defined benefit pension and retiree health costs include several elements impacted by changes in plan
assets and obligations that are primarily driven by changes in the debt and equity markets as well as those that are predominantly legacy in nature
and related to employees who are no longer providing current service to the company (e.g. retirees and ex-employees). These elements include (i)
interest cost, (ii) expected return on plan assets, (iii) amortized actuarial gains/losses and (iv) the impacts of any plan settlements/curtailments.
Accordingly, we consider these elements of our periodic retirement plan costs to be outside the operational performance of the business or legacy
costs and not necessarily indicative of current or future cash flow requirements. Adjusted earnings will continue to include the elements of our
retirement costs related to current employee service (service cost and amortization of prior service cost) as well as the cost of our defined
contribution plans.

45
Non-GAAP Financial Measures
• Other discrete, unusual or infrequent items: In addition, we also excluded the following items given their discrete, unusual or infrequent nature and
their impact on our results for the period:
• Losses on early extinguishment of debt in the first and fourth quarter of 2017
• A benefit from the remeasurement of a tax matter in the first quarter of 2017 that related to a previously adjusted item
• Costs incurred in the fourth quarter of 2017 related to the recently announced transaction with Fujifilm as well as to our expected proxy
contest. These costs are primarily for third-party investment banking, legal, accounting, consulting and other similar services.
• An estimated non-cash charge in the fourth quarter 2017 reflecting the impact associated with the enactment of the Tax Cuts and Jobs Act
(the "Tax Act") in December 2017. See our Fourth Quarter 2017 Earnings Release on Form 8-K filed with the Securities and Exchange
Commission.
We believe the exclusion of these items allows investors to better understand and analyze the results for the period as compared to prior periods and
expected future trends in our business.
Adjusted Operating Income/Margin
We also calculate and utilize adjusted operating income and margin measures by adjusting our reported pre-tax income and margin amounts. In
addition to the costs and expenses noted as adjustments for our Adjusted Earnings measures, adjusted operating income and margin also exclude
Other expenses, net. Other expenses, net is primarily comprised of non-financing interest expense and also includes certain other non-operating
costs and expenses. We exclude these amounts in order to evaluate our current and past operating performance and to better understand the
expected future trends in our business. Adjusted Operating income and margin also include Equity in net income of unconsolidated affiliates. Equity
in net income of unconsolidated affiliates primarily reflects our 25% share of Fuji Xerox net income. We include this amount in our measure of
operating income and margin as Fuji Xerox is our primary intermediary to the Asia/Pacific market for distribution of Xerox branded products and
services.

46
Non-GAAP Financial MeasuresConstant Currency
To better understand trends in our business, we believe that it is helpful to adjust revenue to exclude the impact of changes in the translation of foreign
currencies into U.S. dollars. We refer to this adjusted revenue as “constant currency.” This impact is calculated by translating current period activity in
local currency using the comparable prior year period's currency translation rate. This impact is calculated for all countries where the functional currency
is the local country currency. The constant currency impact for signings growth is calculated on the basis of plan currency rates. Management believes
the constant currency measure provides investors an additional perspective on revenue trends. Currency impact can be determined as the difference
between actual growth rates and constant currency growth rates.
EBITDA
Adjusted EBITDA represents Income before Income Taxes adjusted for depreciation and amortization, restructuring and related costs, non-service
retirement related costs, transaction/proxy contest costs and other expenses, net, which includes interest expense. Adjusted EBITDA is not intended to
represent cash flows from operations, income before taxes or net income as defined by U.S. GAAP and is not necessarily comparable to similar
measures disclosed by other companies as not all companies calculate Adjusted EBITDA in the same manner. We believe Adjusted EBITDA is useful to
investors and other users of the financial statements in evaluating operating performance because it provides an additional tool to compare business
performance across companies and across periods.
Free Cash Flow
To better understand trends in our business, we believe that it is helpful to subtract amounts for capital expenditures (inclusive of internal use software)
from cash flows from continuing operations. Management believes this measure gives investors an additional perspective on cash flow from operating
activities in excess of amounts required for reinvestment. It provides a measure of our ability to fund acquisitions, dividends and share repurchase.

47
Non-GAAP Financial MeasuresSummary:
Management believes that all of these non-GAAP financial measures provide an additional means of analyzing the current period’s results against the
corresponding prior period’s results. However, these non-GAAP financial measures should be viewed in addition to, and not as a substitute for, the
company’s reported results prepared in accordance with GAAP. Our non-GAAP financial measures are not meant to be considered in isolation or as a
substitute for comparable GAAP measures and should be read only in conjunction with our consolidated financial statements prepared in accordance
with GAAP. Our management regularly uses our supplemental non-GAAP financial measures internally to understand, manage and evaluate our
business and make operating decisions. These non-GAAP measures are among the primary factors management uses in planning for and forecasting
future periods. Compensation of our executives is based in part on the performance of our business based on these non-GAAP measures.
A reconciliation of these non-GAAP financial measures and the most directly comparable measures calculated and
presented in accordance with GAAP are set forth on the following tables:

48
Net Income and EPS reconciliation
(in millions, except per share amounts)
Net (Loss)
Income
Diluted
EPS
Net
Income
Diluted
EPS
Net
Income
Diluted
EPS
Net
Income
Diluted
EPS
As Reported (1)
$ (196) $ (0.78) $ 185 $ 0.70 $ 192 $ 0.70 $ 622 $ 2.33
Restructuring and related costs 24 92 220 264
Amortization of intangible assets 12 14 53 58
Non-service retirement-related costs 62 19 198 131
Loss on extinguishment of debt 7 - 20 -
Transaction and proxy related fees 9 - 9 -
Income tax on adjustments (2)
(45) (46) (171) (151)
US Tax Act 400 - 400 -
Remeasurement of unrecognized tax positions - - (16) -
Restructuring and other charges - Fuji Xerox (3)
1 - 10 3
Adjusted 274$ $ 1.04 264$ $ 1.00 915$ $ 3.48 927$ $ 3.53
Dividends on preferred stock used in adjusted EPS calculation (4)
$ - $ - $ - $ 24
Weighted average shares for adjusted EPS (4)
264 264 263 256
Fully diluted shares at end of period (5)
264
(1) Net (Loss) Income and EPS from continuing operations attributable to Xerox.
(3) Other charges in 2017 represent audit and other fees associated with the independent investigation of Fuji Xerox's accounting practices.(4) For those periods that exclude the preferred stock dividend the average shares for the calculations of diluted EPS include 7 million shares associated with our Series A or Series B
convertible preferred stock.
(5) Represents common shares outstanding at December 31, 2017 as well as shares associated with our Series B convertible preferred stock plus dilutive potential common shares as
used for the calculation of diluted earnings per share for the fourth quarter 2017.
Three Months Ended
December 31, 2017
Three Months Ended
December 31, 2016
Year Ended
December 31, 2017
Year Ended
December 31, 2016
(2) Refer to Effective Tax Rate reconciliation.

49
Effective Tax Rate reconciliation
(in millions)
Pre-Tax
Income
Income Tax
Expense
Effective
Tax Rate
Pre-Tax
Income
Income Tax
Expense
Effective
Tax Rate
Pre-Tax
Income
Income Tax
Expense
Effective
Tax Rate
Pre-Tax
Income
Income Tax
Expense
Effective
Tax Rate
Reported (1)
$ 226 $ 444 196.5% $ 179 $ 18 10.1% $ 570 $ 481 84.4% $ 568 $ 62 10.9%
Non-GAAP Adjustments (2)
114 45 125 46 500 171 453 151
US Tax Act - (400) - - - (400) - -
Remeasurement of unrecognized
tax positions - - - - - 16 - -
Adjusted (3)
$ 340 $ 89 26.2% $ 304 $ 64 21.1% $ 1,070 $ 268 25.0% $ 1,021 $ 213 20.9%
__________
(1) Pre-Tax Income and Income Tax Expense from continuing operations.
(2) Refer to Net Income and EPS reconciliations for details.
Three Months Ended
December 31, 2017
Three Months Ended
December 31, 2016
Year Ended
December 31, 2017
Year Ended
December 31, 2016
(3) The tax impact on the Adjusted Pre‐Tax Income from continuing operations is calculated under the same accounting principles applied to the As Reported Pre-Tax Income under ASC 740, which employs an
annual effective tax rate method to the results.

50
Key Financial Ratios – Q4
(1) Revenue and costs from continuing operations.
(2) 2017 includes adjustments for non-service retirement-related costs and transaction/proxy-related costs. 2016 includes
adjustments for non-service retirement-related costs.
(in millions)
Total Revenues $ 2,747 $ - $ 2,747 $ 2,734 $ - $ 2,734
Total Gross Profit 1,088 23 1,111 1,094 7 1,101
Post Sale Revenue 2,065 - 2,065 2,080 - 2,080
Post Sale Gross Profit 901 23 924 889 7 896
RD&E 114 (8) 106 113 (4) 109
SAG 676 (40) 636 639 (8) 631
Total Gross Margin 39.6 % 40.4 % 40.0 % 40.3 %
Post Sale Gross Margin 43.6 % 44.7 % 42.7 % 43.1 %
RD&E as a % of Revenue 4.1 % 3.9 % 4.1 % 4.0 %
SAG as a % of Revenue 24.6 % 23.2 % 23.4 % 23.1 %
December 31, 2017 December 31, 2016
Three Months Ended Three Months Ended
As Reported (1)
Adjustments (2) Adjusted As Reported
(1)Adjustments
(2) Adjusted

51
Key Financial Ratios – FY
(1) Revenue and costs from continuing operations.
(2) 2017 includes adjustments for non-service retirement-related costs and transaction/proxy-related costs. 2016 includes
adjustments for non-service retirement-related costs.
(in millions)
Total Revenues $ 10,265 $ - $ 10,265 $ 10,771 $ - $ 10,771
Total Gross Profit 4,061 75 4,136 4,261 49 4,310
Post Sale Revenue 8,014 - 8,014 8,352 - 8,352
Post Sale Gross Profit 3,414 75 3,489 3,513 49 3,562
RD&E 446 (25) 421 476 (25) 451
SAG 2,631 (107) 2,524 2,695 (57) 2,638
Total Gross Margin 39.6 % 40.3 % 39.6 % 40.0 %
Post Sale Gross Margin 42.6 % 43.5 % 42.1 % 42.6 %
RD&E as a % of Revenue 4.3 % 4.1 % 4.4 % 4.2 %
SAG as a % of Revenue 25.6 % 24.6 % 25.0 % 24.5 %
Year Ended
December 31, 2017 December 31, 2016
Year Ended
AdjustedAs Reported (1)
Adjustments (2) Adjusted As Reported
(1)Adjustments
(2)

52
Operating Income/Margin reconciliation – Q4
(1) Pre-Tax Income and revenue from continuing operations.
(2) Other charges in 2017 represent audit and other fees associated with the independent investigation of Fuji Xerox’s
accounting practices.
(in millions) Profit Revenue Margin Profit Revenue Margin
Reported (1)
226$ 2,747$ 8.2% 179$ 2,734$ 6.5%
Adjustments:
Restructuring and related costs 24 92
Amortization of intangible assets 12 14
Non-service retirement-related costs 62 19
Transaction and proxy related fees 9 -
Equity in net income of unconsolidated affiliates 25 27
Restructuring and other charges - Fuji Xerox (2)
1 -
Other expenses, net 36 57
Adjusted 395$ 2,747$ 14.4% 388$ 2,734$ 14.2%
Three Months Ended December 31, 2017 Three Months Ended December 31, 2016

53
Operating Income/Margin reconciliation – FY
(1) Pre-Tax Income and revenue from continuing operations.
(2) Other charges in 2017 represent audit and other fees associated with the independent investigation of Fuji Xerox’s
accounting practices.
(in millions) Profit Revenue Margin Profit Revenue Margin
Reported (1)
570$ 10,265$ 5.6% 568$ 10,771$ 5.3%
Adjustments:
Restructuring and related costs 220 264
Amortization of intangible assets 53 58
Non-service retirement-related costs 198 131
Transaction and proxy related fees 9 -
Equity in net income of unconsolidated affiliates 115 127
Restructuring and other charges - Fuji Xerox (2)
10 3
Other expenses, net 141 200
Adjusted 1,316$ 10,265$ 12.8% 1,351$ 10,771$ 12.5%
Year Ended December 31, 2017 Year Ended December 31, 2016

54
Other expenses, net
(in millions) December 31, 2017 December 31, 2016
Other expenses, net - Reported 36$ 57$
Adjustment:
Loss on early extinguishment of debt (7) -
Other expenses, net - Adjusted 29$ 57$
Three Months Ended

55
Operating Cash Flow / Free Cash Flow reconciliation
(1) Operating Cash Flow and Free Cash Flow from continuing operations.
(in millions) Q4 2017 Actual FY 2017 Actual FY 2018 Guidance
Operating Cash Flow (1)
(28)$ 122$ $ 900 - 1,100
Less: CAPEX (inclusive of Internal Use Software) (35) (105) (150)
Free Cash Flow (1)
(63)$ 17$ $ 750 - 950
(in millions) Q4 2017 Actual FY 2017 Actual FY 2017 Guidance
Operating Cash Flow (1)
(28)$ 122$ $ (50) - 150
Elimination of certain accounts receivables sales programs 350 350 350
Incremental, voluntary contributions to U.S. defined benefit pension plans - 500 500
Adjusted Operating Cash Flow (1)
322 972 $ 800 - 1,000
Less: CAPEX (inclusive of Internal Use Software) (35) (105)
Adjusted Free Cash Flow (1)
287$ 867$

56
EPS Guidance
Note: Adjusted EPS guidance excludes non-service retirement related costs, restructuring and related costs, amortization
of intangibles, as well as other discretely identified adjustments.
FY 2018
GAAP EPS from Continuing Operations $2.30 - $2.50
Non-GAAP Adjustments 1.20
Adjusted EPS from Continuing Operations $3.50 - $3.70

© 2018 Xerox Corporation. All rights reserved. Xerox® and Xerox and Design® are trademarks of Xerox Corporation in the United States and/or other countries.
Related Documents