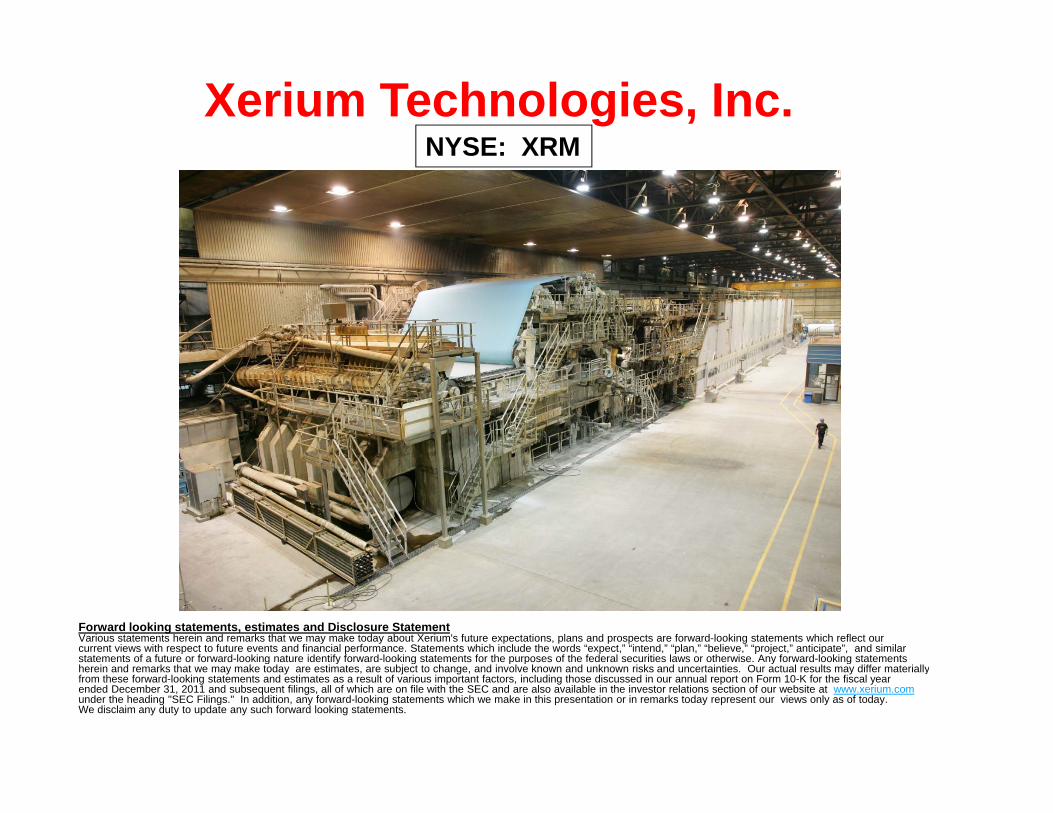
Xerium Technologies, Inc. NYSE: XRM NYSE: XRM Forward looking statements, estimates and Disclosure Statement Various statements herein and remarks that we may make today about Xerium's future expectations, plans and prospects are forward-looking statements which reflect our current views with respect to future events and financial performance. Statements which include the words “expect,” “intend,” “plan,” “believe,” “project,” anticipate”, and similar statements of a future or forward-looking nature identify forward-looking statements for the purposes of the federal securities laws or otherwise. Any forward-looking statements herein and remarks that we may make today are estimates, are subject to change, and involve known and unknown risks and uncertainties. Our actual results may differ materially from these forward-looking statements and estimates as a result of various important factors, including those discussed in our annual report on Form 10-K for the fiscal year ended December 31, 2011 and subsequent filings, all of which are on file with the SEC and are also available in the investor relations section of our website at www.xerium.com under the heading "SEC Filings." In addition, any forward-looking statements which we make in this presentation or in remarks today represent our views only as of today. We disclaim any duty to update any such forward looking statements.

Welcome message from author
This document is posted to help you gain knowledge. Please leave a comment to let me know what you think about it! Share it to your friends and learn new things together.
Transcript
Xerium Technologies, Inc.NYSE: XRMNYSE: XRM
Forward looking statements, estimates and Disclosure StatementVarious statements herein and remarks that we may make today about Xerium's future expectations, plans and prospects are forward-looking statements which reflect our current views with respect to future events and financial performance. Statements which include the words “expect,” “intend,” “plan,” “believe,” “project,” anticipate”, and similar statements of a future or forward-looking nature identify forward-looking statements for the purposes of the federal securities laws or otherwise. Any forward-looking statementsg y g p p y gherein and remarks that we may make today are estimates, are subject to change, and involve known and unknown risks and uncertainties. Our actual results may differ materiallyfrom these forward-looking statements and estimates as a result of various important factors, including those discussed in our annual report on Form 10-K for the fiscal yearended December 31, 2011 and subsequent filings, all of which are on file with the SEC and are also available in the investor relations section of our website at www.xerium.comunder the heading "SEC Filings." In addition, any forward-looking statements which we make in this presentation or in remarks today represent our views only as of today.We disclaim any duty to update any such forward looking statements.
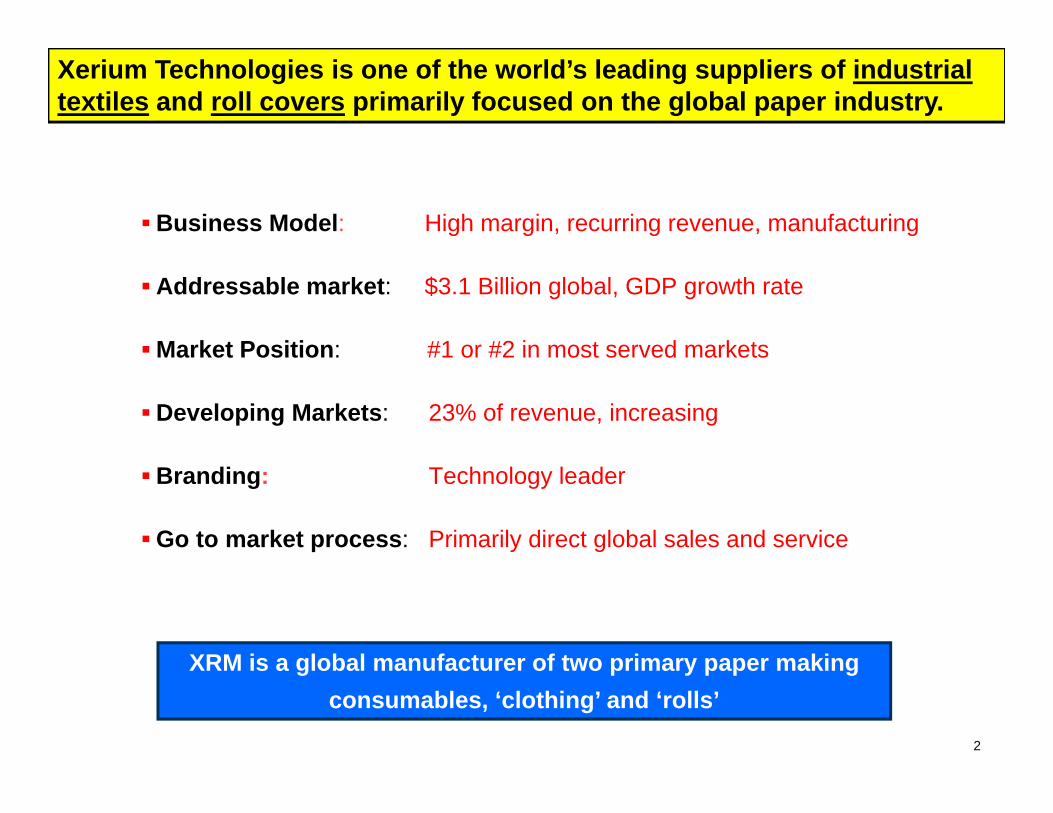
Xerium Technologies is one of the world’s leading suppliers of industrial textiles and roll covers primarily focused on the global paper industry.
Business Model: High margin, recurring revenue, manufacturing
Addressable market: $3.1 Billion global, GDP growth rate
Market Position: #1 or #2 in most served marketsMarket Position: #1 or #2 in most served markets
Developing Markets: 23% of revenue, increasing
Branding: Technology leader
Go to market process: Primarily direct global sales and service
XRM is a global manufacturer of two primary paper making
2
XRM is a global manufacturer of two primary paper makingconsumables, ‘clothing’ and ‘rolls’
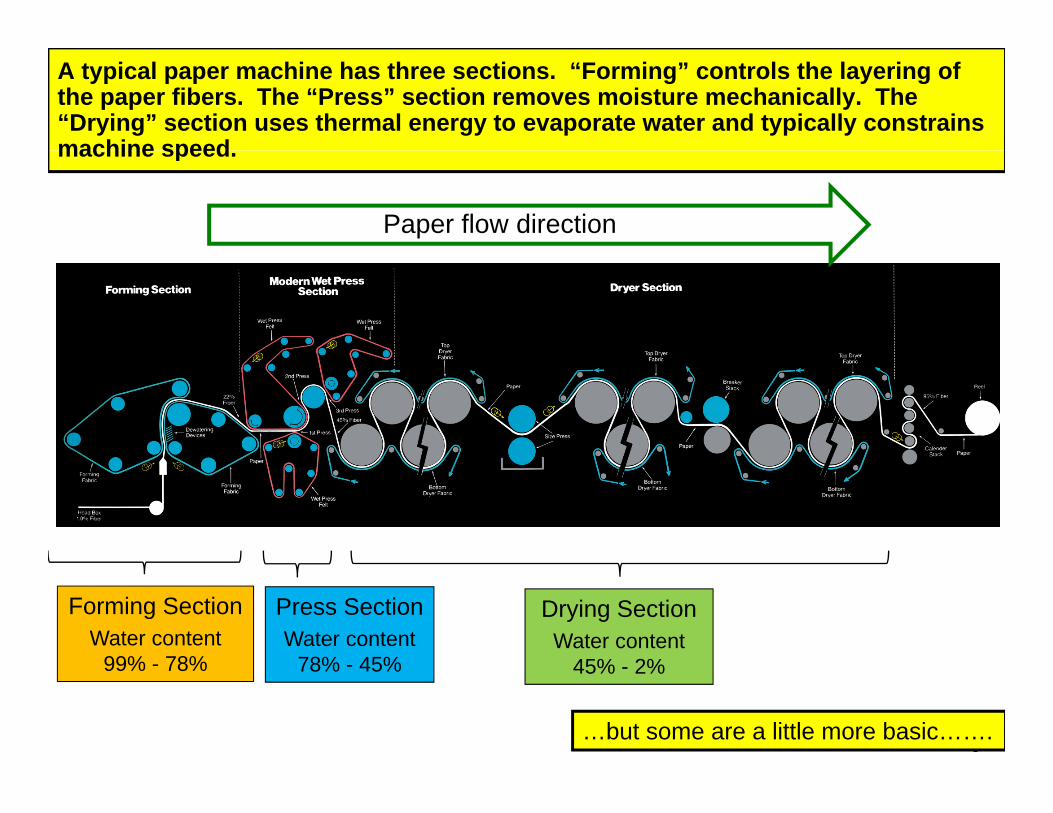
A typical paper machine has three sections. “Forming” controls the layering of the paper fibers. The “Press” section removes moisture mechanically. The “Drying” section uses thermal energy to evaporate water and typically constrains machine speedmachine speed.
Paper flow direction
Press SectionWater content
78% 45%
Forming SectionWater content
99% 78%
Drying SectionWater content
45% 2%
3
78% - 45%99% - 78% 45% - 2%
…but some are a little more basic…….
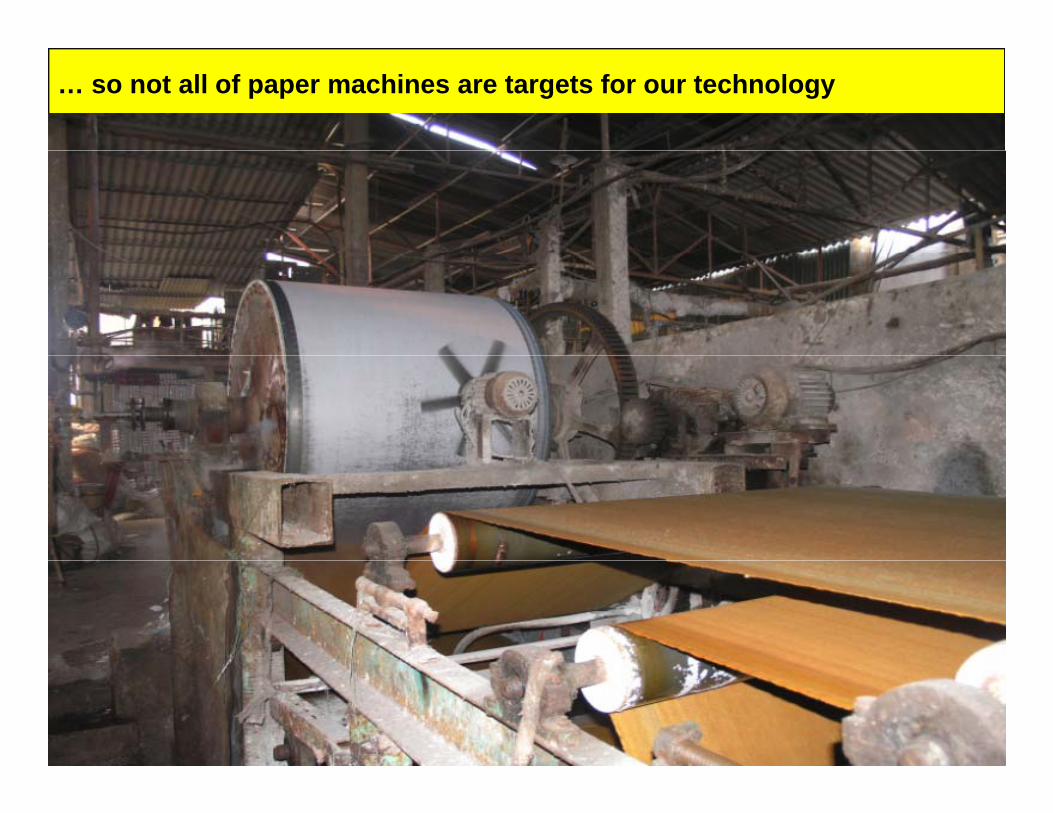
… so not all of paper machines are targets for our technology
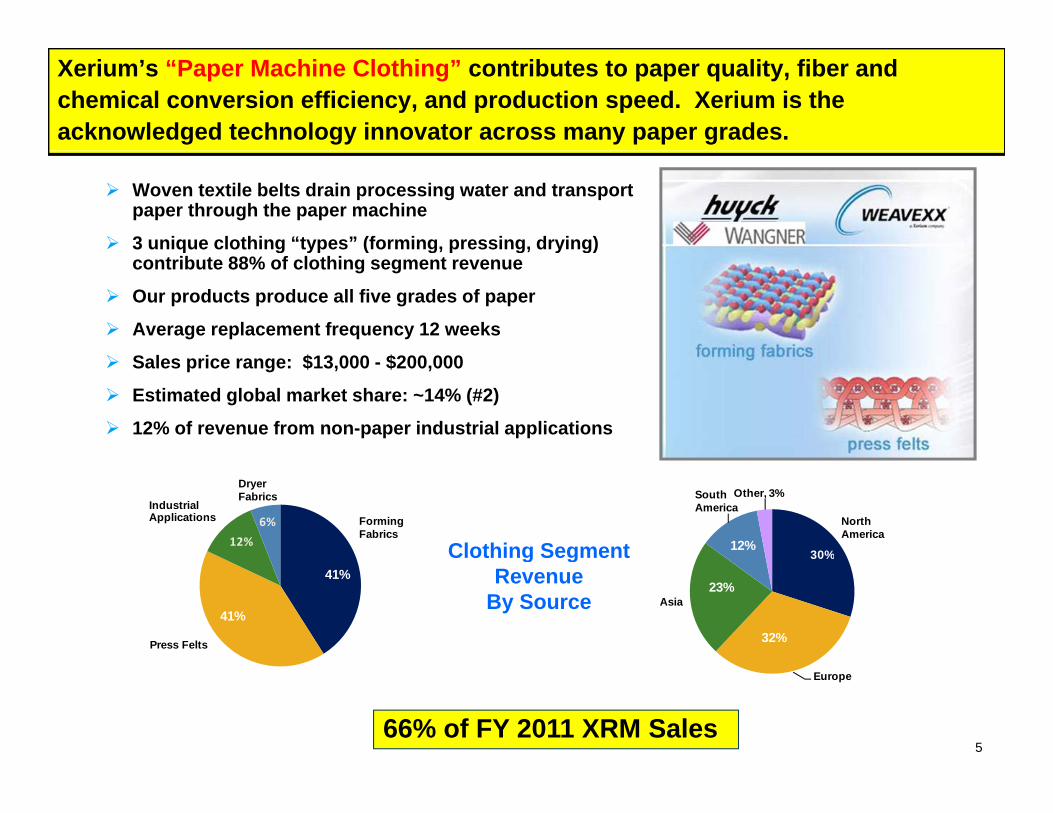
Xerium’s “Paper Machine Clothing” contributes to paper quality, fiber and chemical conversion efficiency, and production speed. Xerium is the acknowledged technology innovator across many paper grades.
Woven textile belts drain processing water and transport paper through the paper machine
3 unique clothing “types” (forming, pressing, drying) g y ( g g y g)contribute 88% of clothing segment revenue
Our products produce all five grades of paper
Average replacement frequency 12 weeks
S l i $13 000 $200 000 Sales price range: $13,000 - $200,000
Estimated global market share: ~14% (#2)
12% of revenue from non-paper industrial applications
Forming Fabrics
Industrial Applications
Dryer Fabrics
12%
6% North America
South America
Other, 3%
13%30%
12%Clothing Segment
Press Felts
41%
41%
Asia
32%
23%
g gRevenue
By Source
Europe
66% of FY 2011 XRM Sales 5
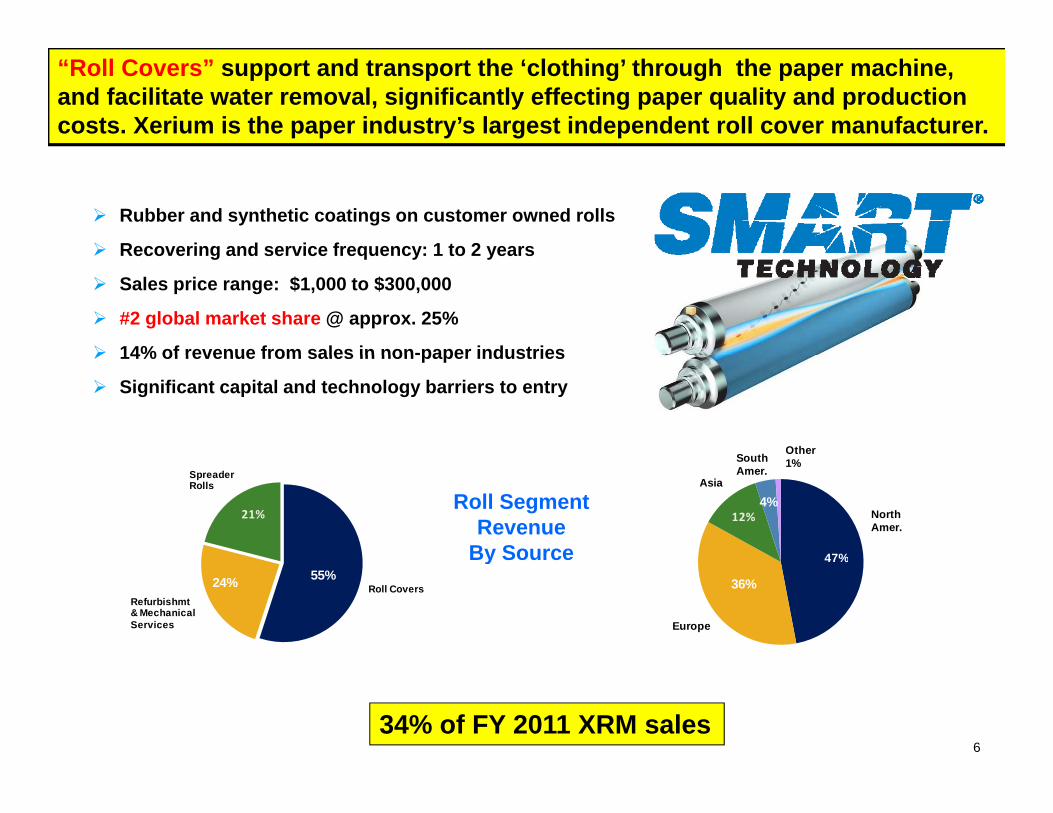
“Roll Covers” support and transport the ‘clothing’ through the paper machine, and facilitate water removal, significantly effecting paper quality and production costs. Xerium is the paper industry’s largest independent roll cover manufacturer.
Rubber and synthetic coatings on customer owned rolls
Recovering and service frequency: 1 to 2 years Recovering and service frequency: 1 to 2 years
Sales price range: $1,000 to $300,000
#2 global market share @ approx. 25%
14% of revenue from sales in non-paper industries 14% of revenue from sales in non paper industries
Significant capital and technology barriers to entry
SouthOther
Spreader Rolls
21% North Amer.
Asia
South Amer.
1%
8%
47%
4%12%
Roll SegmentRevenue
By SourceRoll Covers
Refurbishmt & Mechanical Services
24% 55%
Europe
36%
47%y
34% of FY 2011 XRM sales6
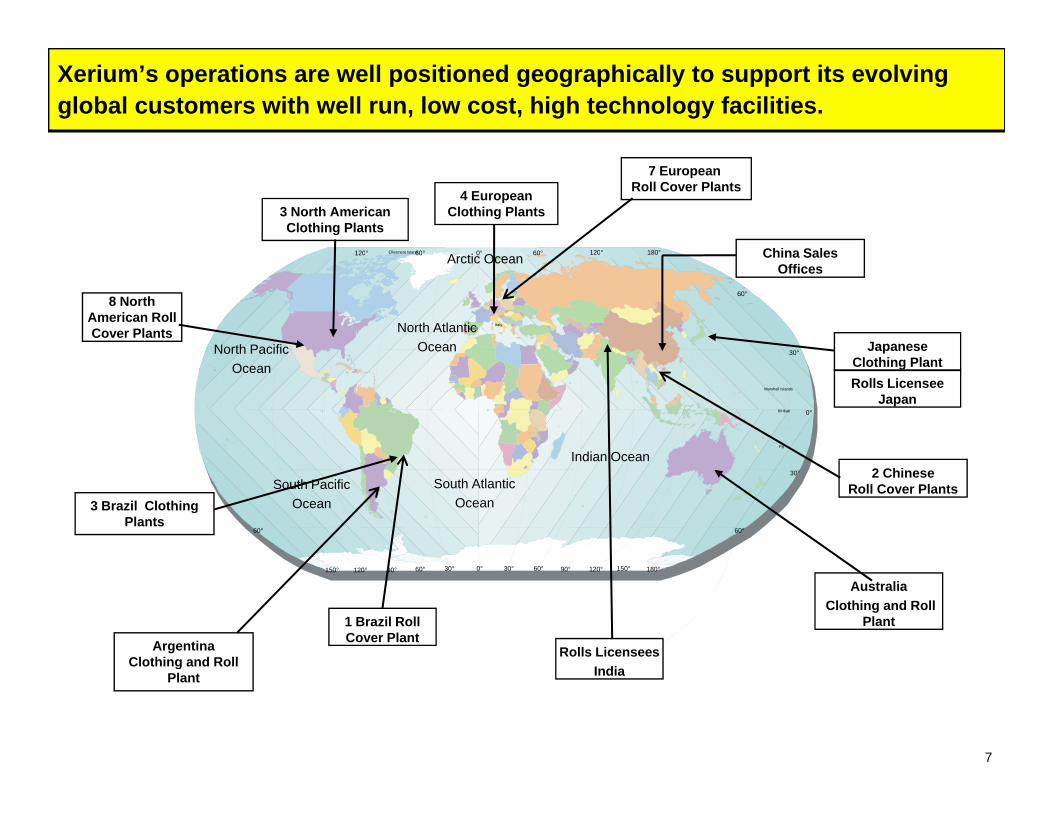
Xerium’s operations are well positioned geographically to support its evolving global customers with well run, low cost, high technology facilities.
7 European Roll Cover Plants4 European
Clothing Plants3 North American Clothing Plants
China SalesEllesmere Island120° 60° 0° 60° 120° 180°
Japanese
8 North American Roll Cover Plants
China Sales Offices
North Pacific North Atlantic
Ocean
Arctic Ocean
Italy Spain
Ellesmere Island 120 60 0 60 120 180
60°
30°
Clothing PlantOcean
Indian OceanFiji
Kiribati
Marshall Islands
0°
Rolls Licensee Japan
2 Chinese Roll Cover Plants
3 Brazil Clothing Plants
South Atlantic Ocean
South Pacific Ocean
Indian Ocean 30°
60°60°
Rolls Licensees
180°150°120°90°30°0°30°60°90°120°150° 60°
AustraliaClothing and Roll
Plant1 Brazil Roll Cover PlantArgentina
Clothing and Roll India
7
Clothing and Roll Plant
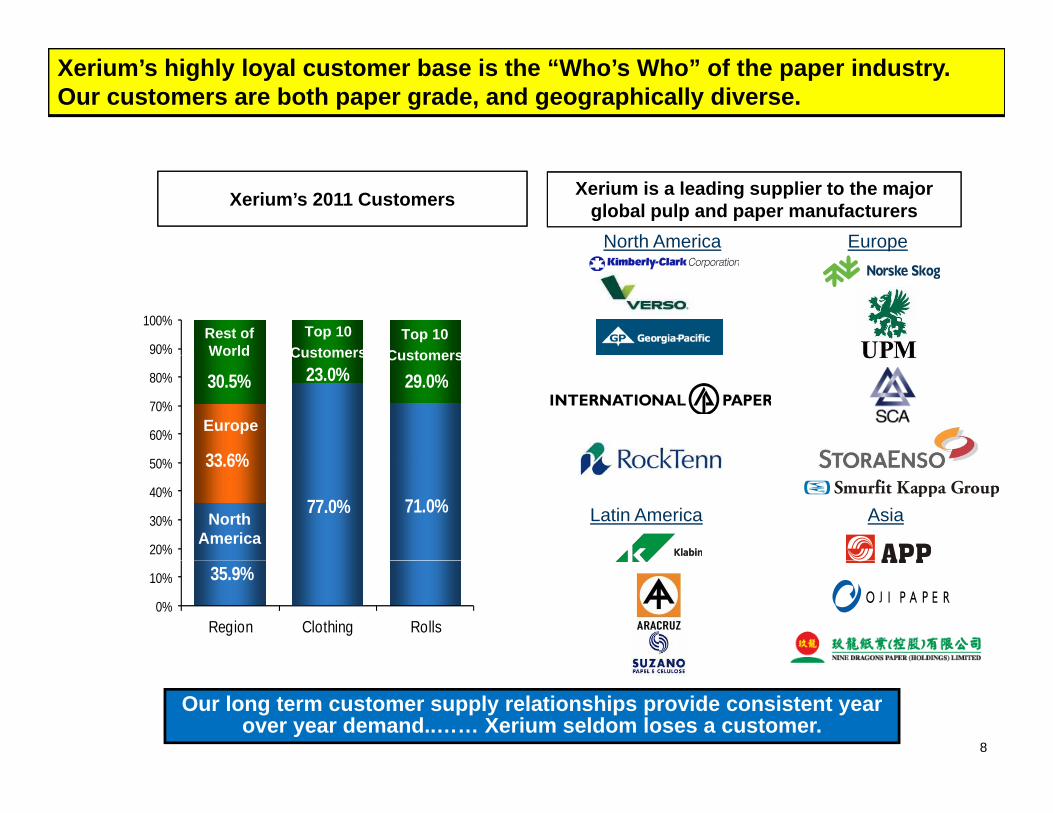
Xerium’s highly loyal customer base is the “Who’s Who” of the paper industry. Our customers are both paper grade, and geographically diverse.
Xerium is a leading supplier to the major global pulp and paper manufacturersXerium’s 2011 Customers
North America Europe
90%
100%Top 10
CustomersTop 10
CustomersRest of World
33 6%
23.0% 29.0%30.5%
60%
70%
80%
Customers Customers
Europe
World
77.0% 71.0%
33.6%
20%
30%
40%
50%
North America
AsiaLatin America
35.9%0%
10%
Region Clothing Rolls
8
Our long term customer supply relationships provide consistent year over year demand..…… Xerium seldom loses a customer.
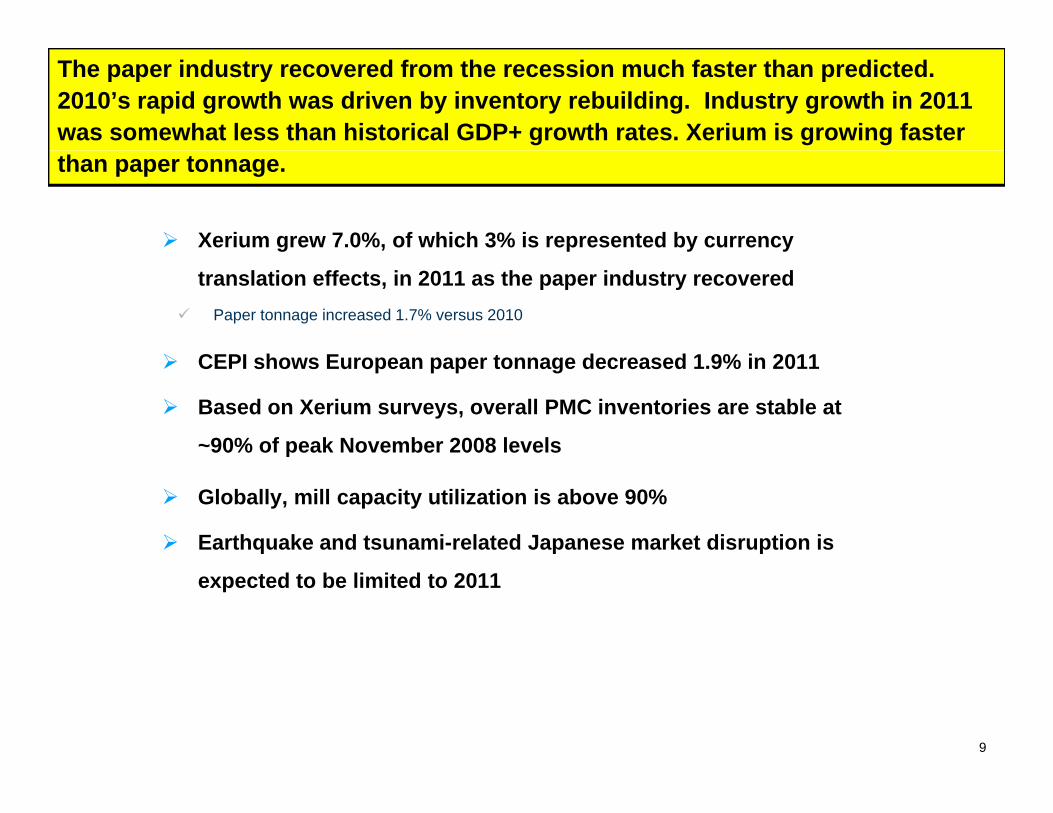
The paper industry recovered from the recession much faster than predicted. 2010’s rapid growth was driven by inventory rebuilding. Industry growth in 2011 was somewhat less than historical GDP+ growth rates. Xerium is growing faster than paper tonnage.
Xerium grew 7.0%, of which 3% is represented by currency
translation effects, in 2011 as the paper industry recovered Paper tonnage increased 1.7% versus 2010
CEPI h E t d d 1 9% i 2011 CEPI shows European paper tonnage decreased 1.9% in 2011
Based on Xerium surveys, overall PMC inventories are stable at
~90% of peak November 2008 levels
Globally, mill capacity utilization is above 90%
Earthquake and tsunami-related Japanese market disruption is
expected to be limited to 2011
9
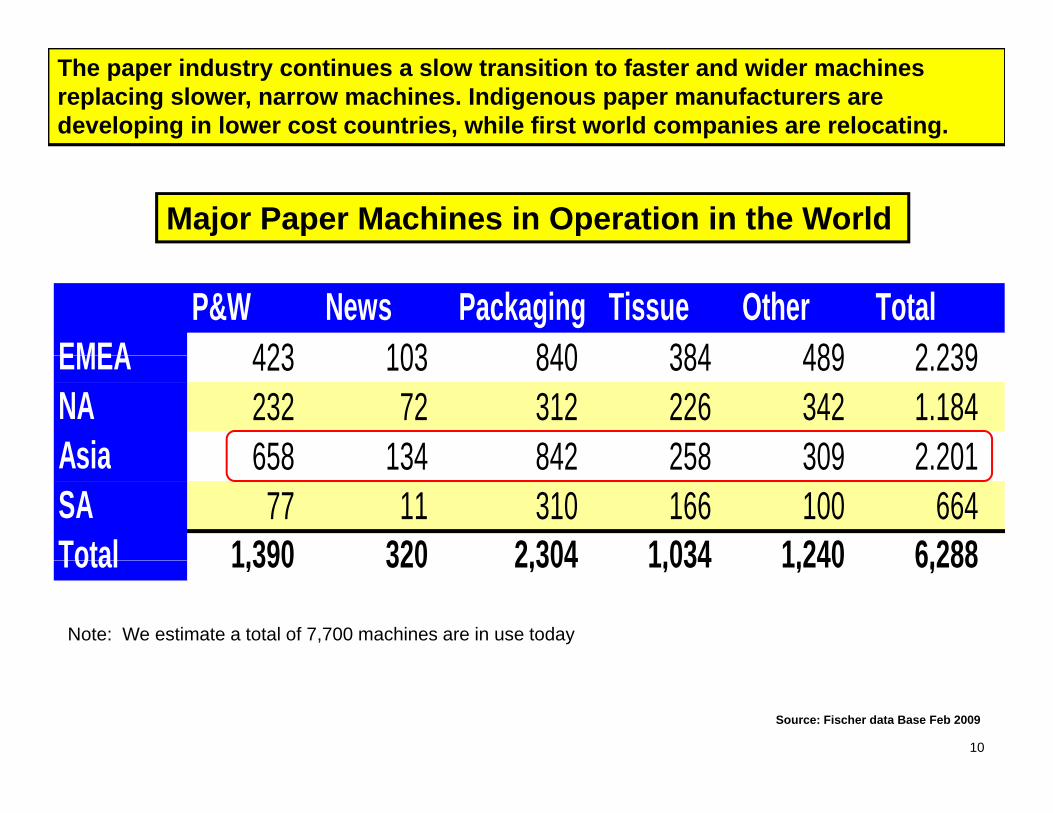
The paper industry continues a slow transition to faster and wider machines replacing slower, narrow machines. Indigenous paper manufacturers are developing in lower cost countries, while first world companies are relocating.
Major Paper Machines in Operation in the World
P&W News Packaging Tissue Other TotalEMEA 423 103 840 384 489 2 239EMEA 423 103 840 384 489 2.239 NA 232 72 312 226 342 1.184 Asia 658 134 842 258 309 2 201Asia 658 134 842 258 309 2.201 SA 77 11 310 166 100 664 Total 1 390 320 2 304 1 034 1 240 6 288Total 1.390 320 2.304 1.034 1.240 6.288
Note: We estimate a total of 7,700 machines are in use today
, ,, , ,
Source: Fischer data Base Feb 2009
10
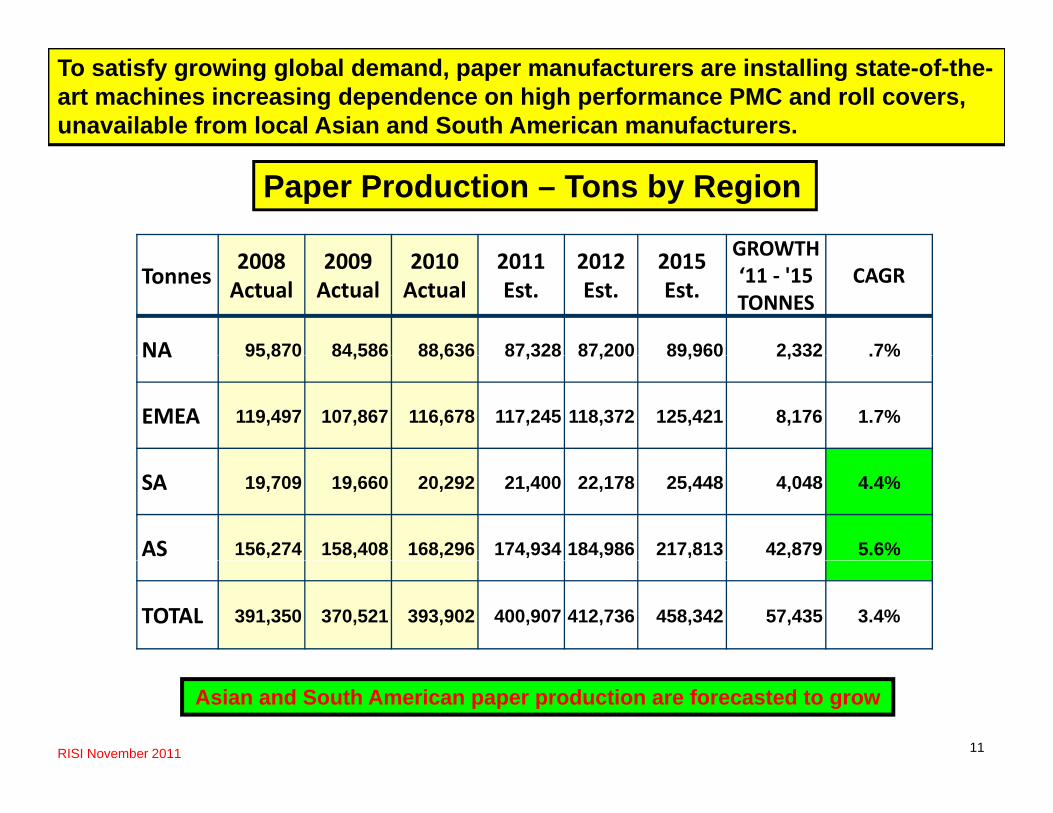
To satisfy growing global demand, paper manufacturers are installing state-of-the-art machines increasing dependence on high performance PMC and roll covers, unavailable from local Asian and South American manufacturers.
Paper Production – Tons by Region
GROWTHTonnes
2008 Actual
2009 Actual
2010 Actual
2011 Est.
2012Est.
2015Est.
GROWTH ‘11 ‐ '15 TONNES
CAGR
NA 95,870 84,586 88,636 87,328 87,200 89,960 2,332 .7%NA 95,870 84,586 88,636 87,328 87,200 89,960 2,332 .7%
EMEA 119,497 107,867 116,678 117,245 118,372 125,421 8,176 1.7%
SA 19,709 19,660 20,292 21,400 22,178 25,448 4,048 4.4%
AS 156,274 158,408 168,296 174,934 184,986 217,813 42,879 5.6%
TOTAL 391,350 370,521 393,902 400,907 412,736 458,342 57,435 3.4%
11RISI November 2011
Asian and South American paper production are forecasted to grow
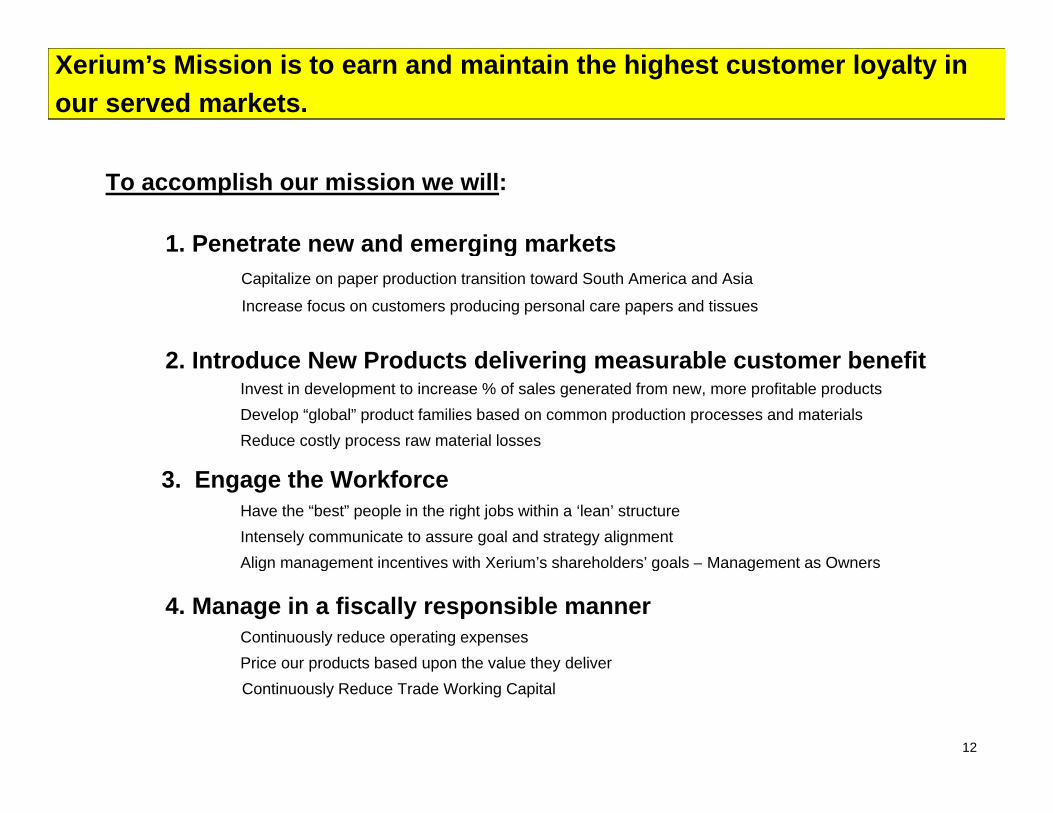
Xerium’s Mission is to earn and maintain the highest customer loyalty inour served markets.
To accomplish our mission we will:
1. Penetrate new and emerging marketsg gCapitalize on paper production transition toward South America and Asia
Increase focus on customers producing personal care papers and tissues
2 I t d N P d t d li i bl t b fit2. Introduce New Products delivering measurable customer benefit Invest in development to increase % of sales generated from new, more profitable productsDevelop “global” product families based on common production processes and materialsReduce costly process raw material losses
3. Engage the WorkforceHave the “best” people in the right jobs within a ‘lean’ structureIntensely communicate to assure goal and strategy alignmentAlign management incentives with Xerium’s shareholders’ goals Management as OwnersAlign management incentives with Xerium s shareholders goals – Management as Owners
4. Manage in a fiscally responsible mannerContinuously reduce operating expensesPrice our products based upon the value they deliverPrice our products based upon the value they deliverContinuously Reduce Trade Working Capital
12
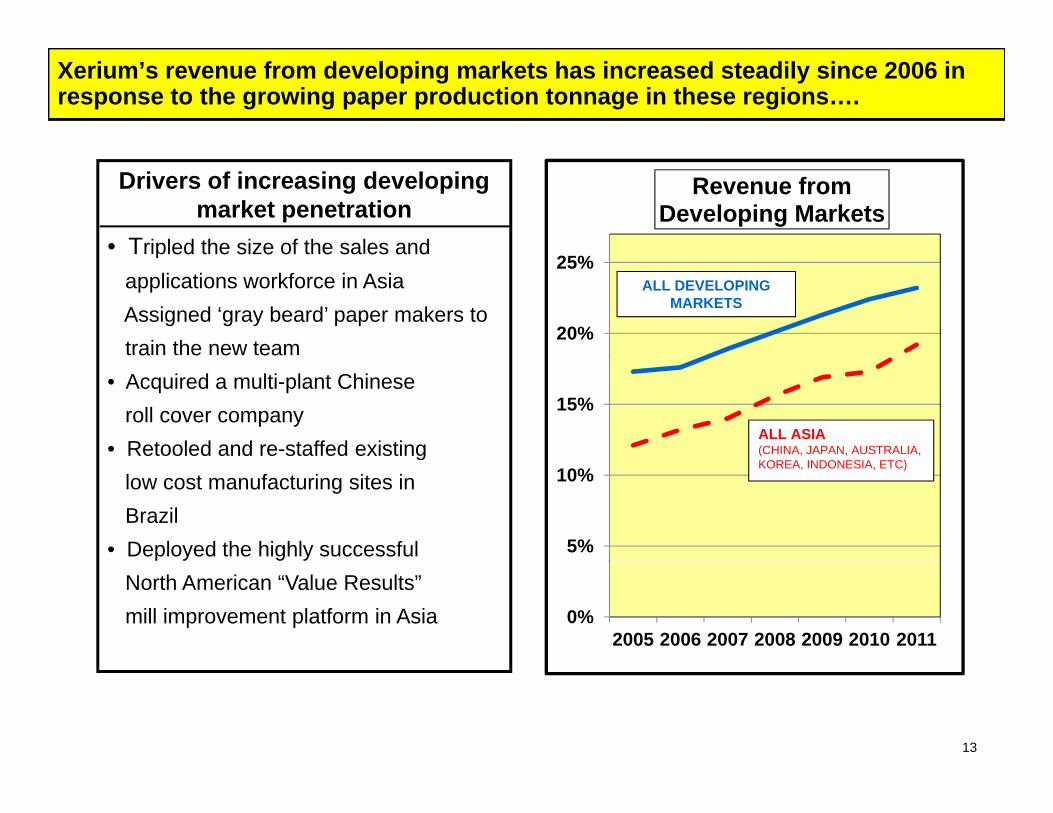
Xerium’s revenue from developing markets has increased steadily since 2006 in response to the growing paper production tonnage in these regions….
Drivers of increasing developing market penetration
• Tripled the size of the sales and
Revenue fromDeveloping Markets
Tripled the size of the sales and applications workforce in AsiaAssigned ‘gray beard’ paper makers to train the new team
20%
25%ALL DEVELOPING
MARKETS
a e e ea• Acquired a multi-plant Chinese
roll cover company• Retooled and re-staffed existing
15%ALL ASIA(CHINA, JAPAN, AUSTRALIA, g
low cost manufacturing sites in Brazil
• Deployed the highly successful 5%
10% KOREA, INDONESIA, ETC)
p y g yNorth American “Value Results” mill improvement platform in Asia 0%
2005 2006 2007 2008 2009 2010 2011
13
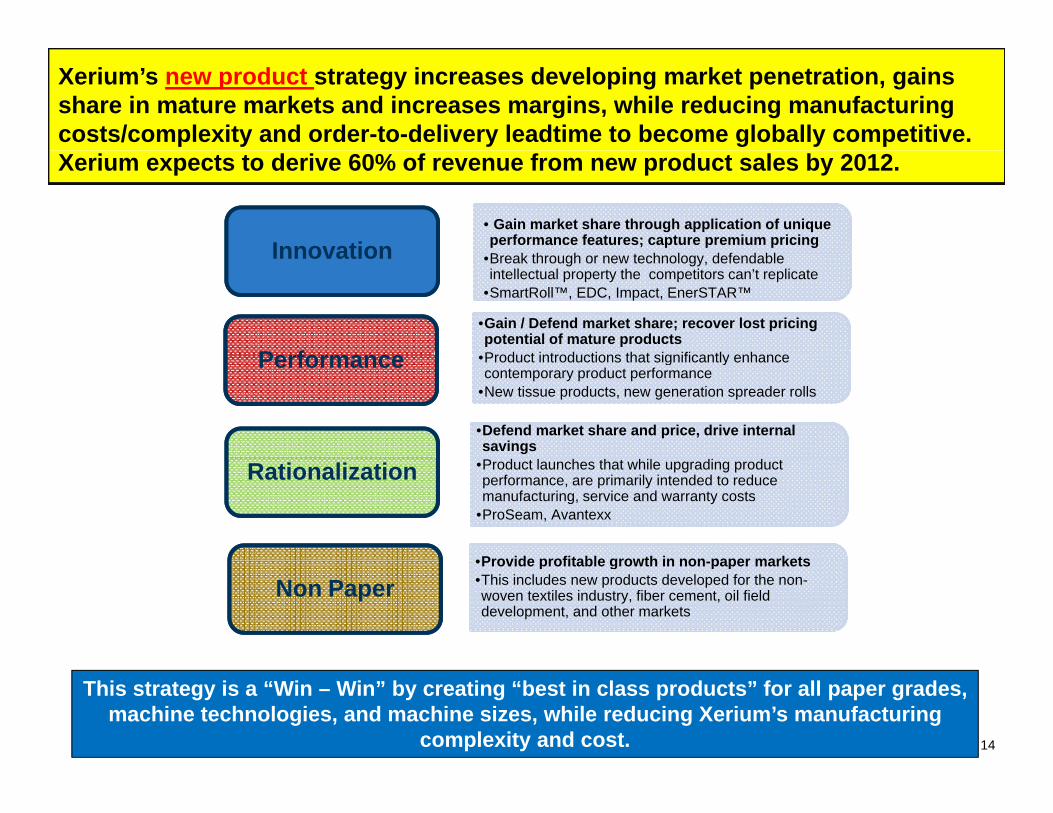
Xerium’s new product strategy increases developing market penetration, gainsshare in mature markets and increases margins, while reducing manufacturingcosts/complexity and order-to-delivery leadtime to become globally competitive.Xerium expects to derive 60% of revenue from new product sales by 2012.
• Gain market share through application of unique performance features; capture premium pricing B k h h h l d f d blInnovation •Break through or new technology, defendable intellectual property the competitors can’t replicate
•SmartRoll™, EDC, Impact, EnerSTAR™
Innovation
•Gain / Defend market share; recover lost pricing potential of mature products
•Product introductions that significantly enhancePerformance •Product introductions that significantly enhance contemporary product performance
•New tissue products, new generation spreader rolls
Performance
•Defend market share and price, drive internal savings
•Product launches that while upgrading product performance, are primarily intended to reduce manufacturing, service and warranty costs
•ProSeam, Avantexx
Rationalization
•Provide profitable growth in non paper markets•Provide profitable growth in non-paper markets•This includes new products developed for the non-woven textiles industry, fiber cement, oil field development, and other markets
Non Paper
14
This strategy is a “Win – Win” by creating “best in class products” for all paper grades, machine technologies, and machine sizes, while reducing Xerium’s manufacturing
complexity and cost.
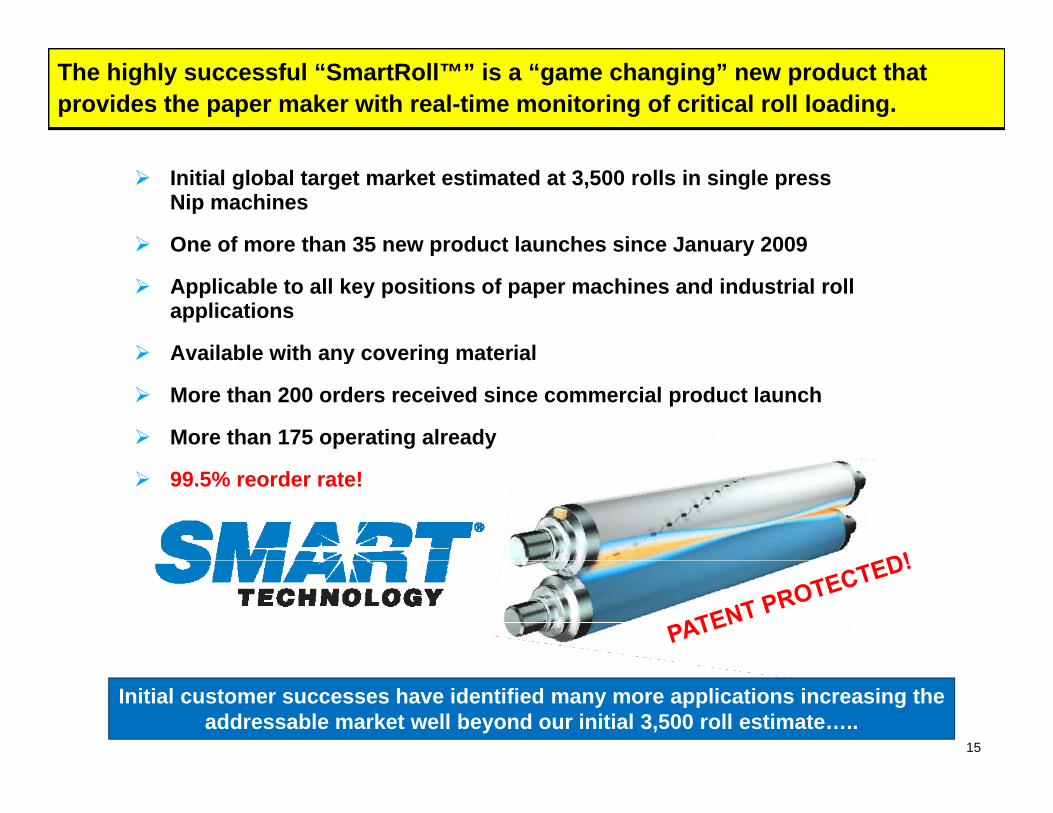
The highly successful “SmartRoll™” is a “game changing” new product that provides the paper maker with real-time monitoring of critical roll loading.
Initial global target market estimated at 3,500 rolls in single press Nip machines
One of more than 35 new product launches since January 2009p y
Applicable to all key positions of paper machines and industrial roll applications
Available with any covering material Available with any covering material
More than 200 orders received since commercial product launch
More than 175 operating already
99.5% reorder rate!
15
Initial customer successes have identified many more applications increasing the addressable market well beyond our initial 3,500 roll estimate…..
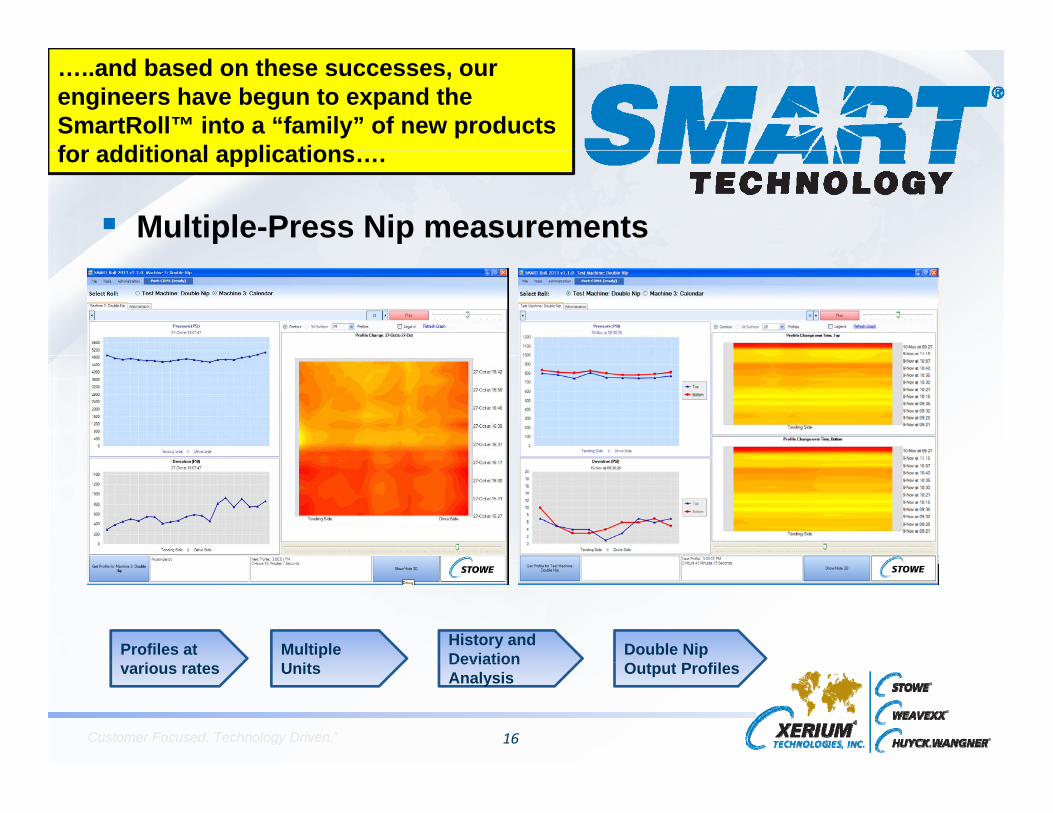
…..and based on these successes, our engineers have begun to expand the SmartRoll™ into a “family” of new products for additional applications
Multiple-Press Nip measurements
for additional applications….
Profiles at i t
Multiple U it
History and Deviation Double Nip
O t t P fil
16Customer Focused. Technology Driven.Customer Focused. Technology Driven.®®
various rates Units Deviation Analysis Output Profiles
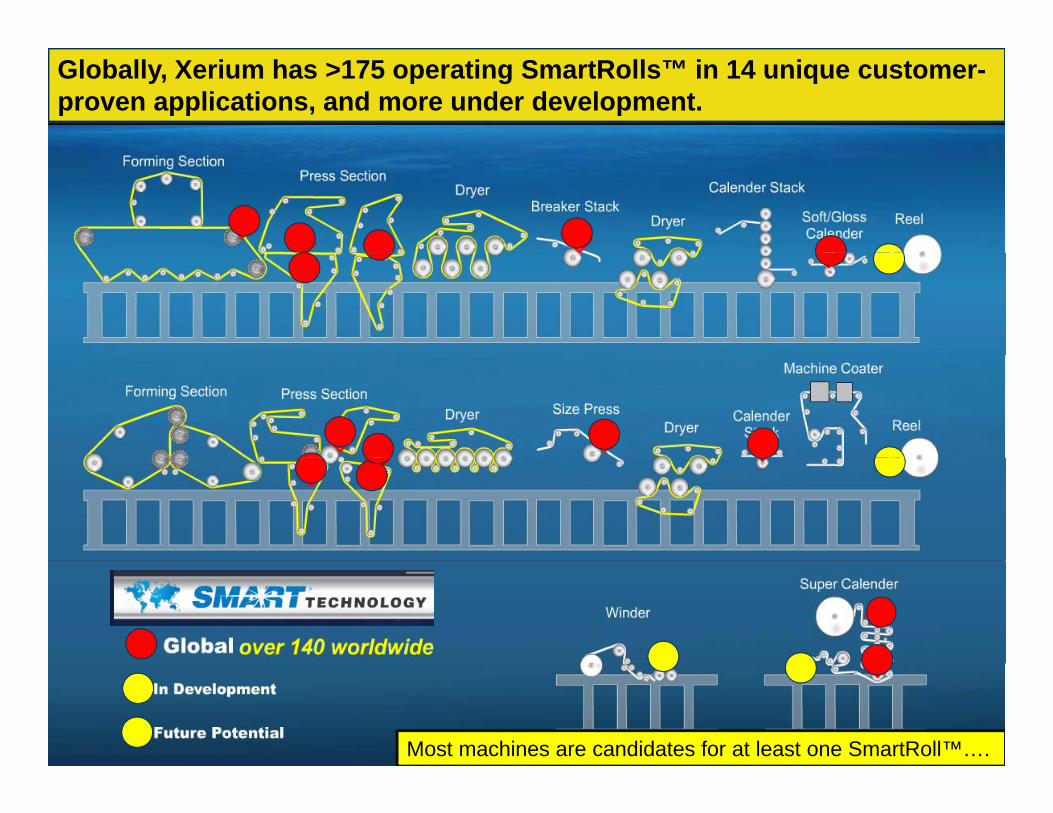
Globally, Xerium has >175 operating SmartRolls™ in 14 unique customer-proven applications, and more under development.
Most machines are candidates for at least one SmartRoll™….
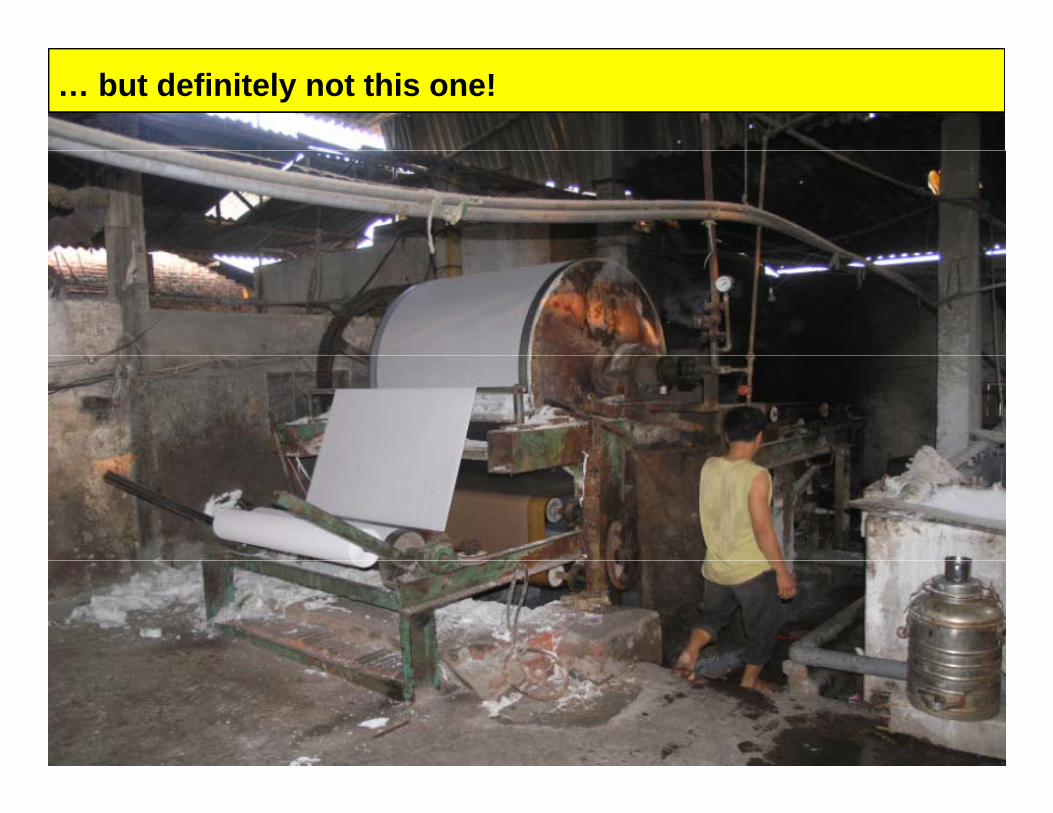
… but definitely not this one!
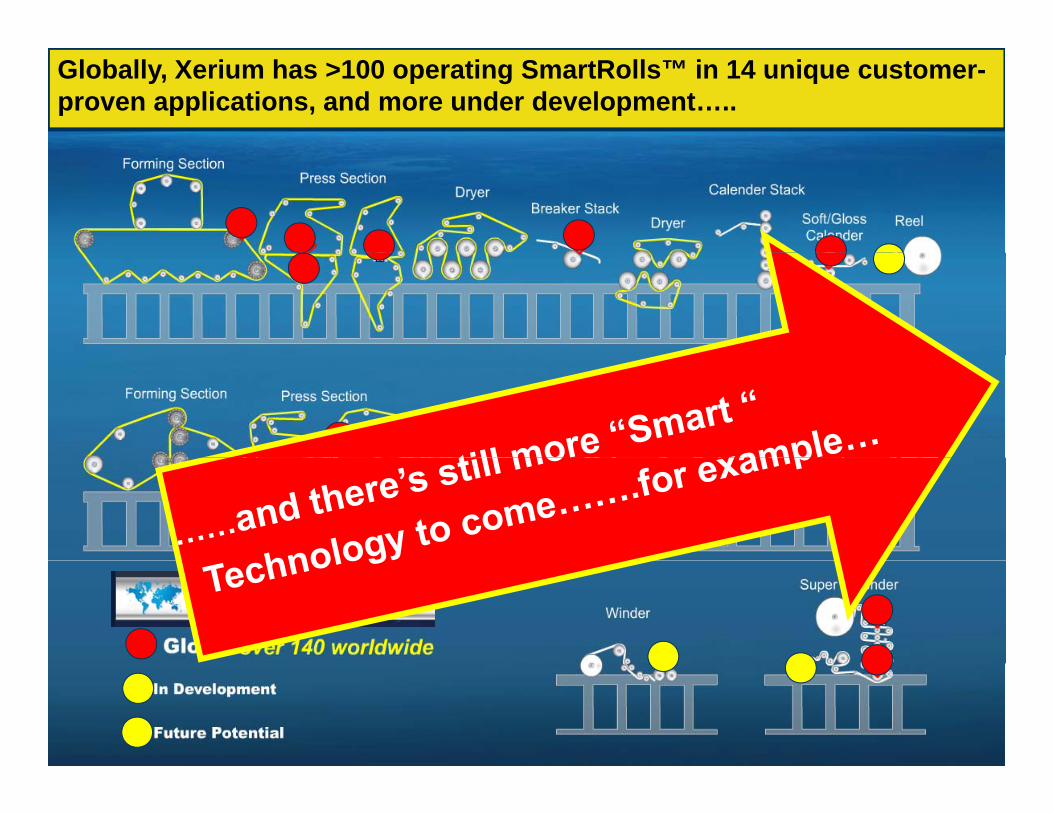
Globally, Xerium has >100 operating SmartRolls™ in 14 unique customer-proven applications, and more under development…..
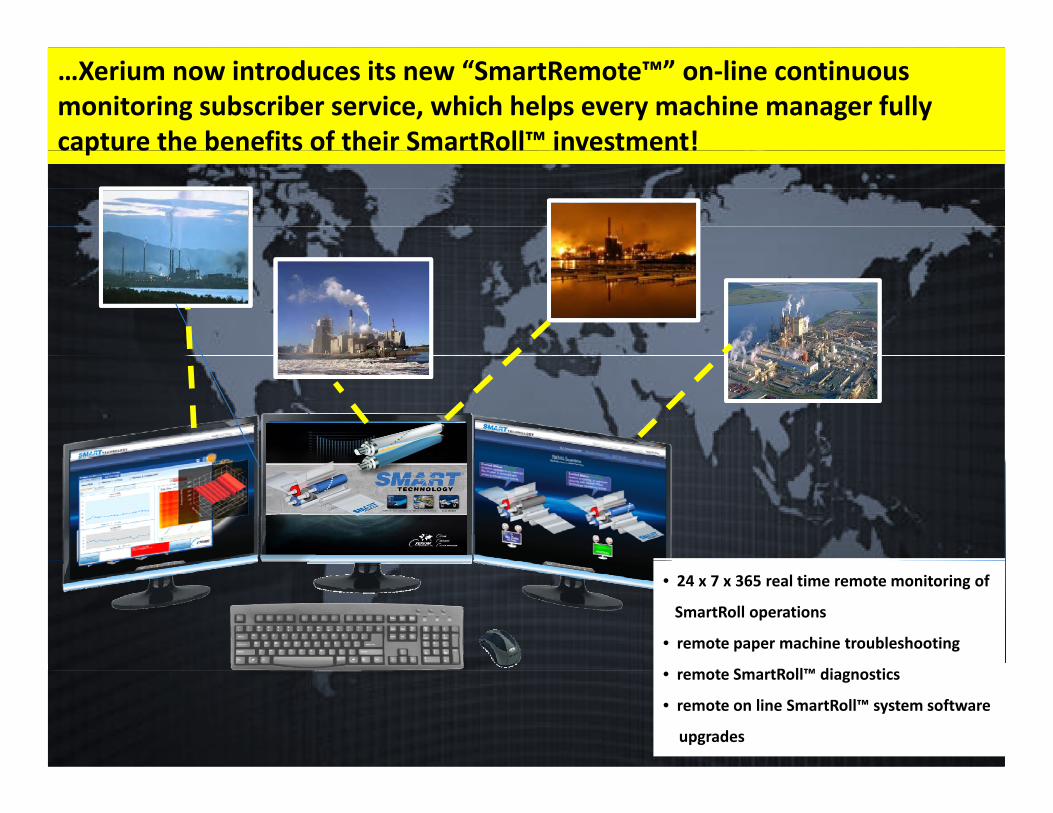
Xerium’s new SmartRemote™ Service Center …Xerium now introduces its new “SmartRemote™” on‐line continuous monitoring subscriber service, which helps every machine manager fully capture the benefits of their SmartRoll™ investment!capture the benefits of their SmartRoll investment!
Value Through TechnologyTM
• 24 x 7 x 365 real time remote monitoring of
SmartRoll operations
• remote paper machine troubleshooting
• remote SmartRoll™ diagnostics
• remote on line SmartRoll™ system software
upgrades
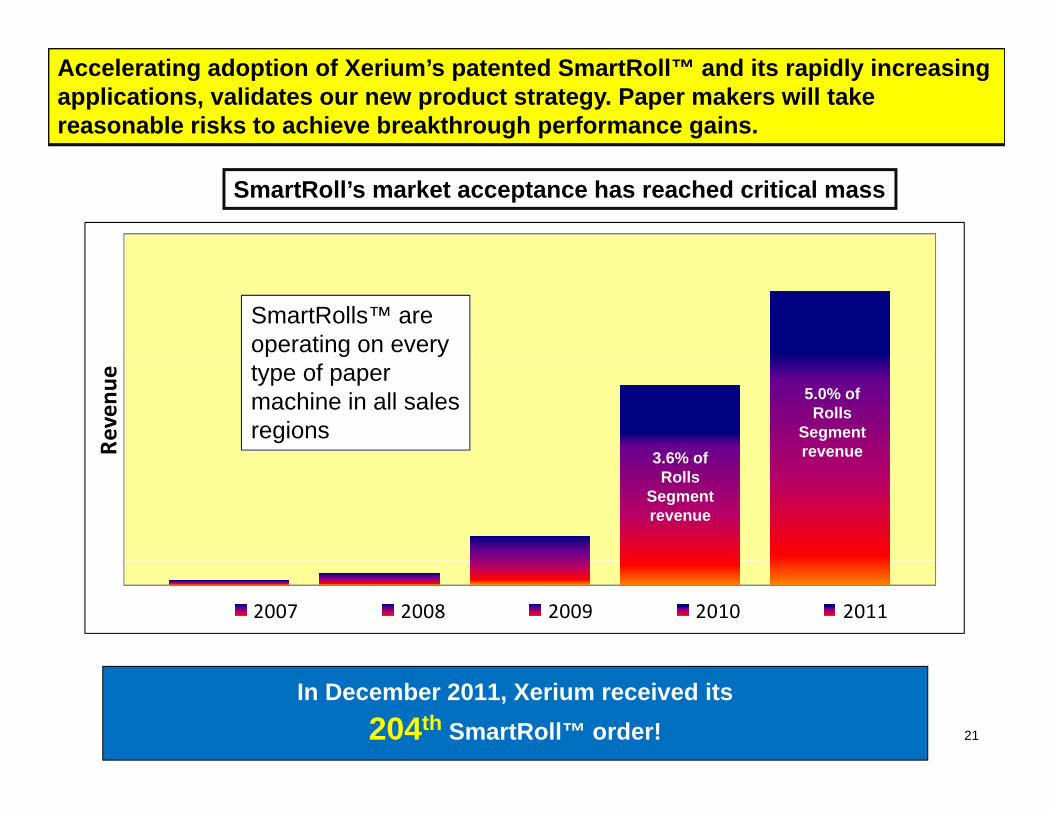
Accelerating adoption of Xerium’s patented SmartRoll™ and its rapidly increasing applications, validates our new product strategy. Paper makers will take reasonable risks to achieve breakthrough performance gains.
SmartRoll’s market acceptance has reached critical mass
SmartRolls™ are operating on every
Reven
ue 5.0% of Rolls
Segment revenue3 6% of
p g ytype of paper machine in all sales regions
Development Commercial availability
3.6% of Rolls
Segment revenue
2007 2008 2009 2010 2011
In December 2011, Xerium received its 204th SmartRoll™ order! 21
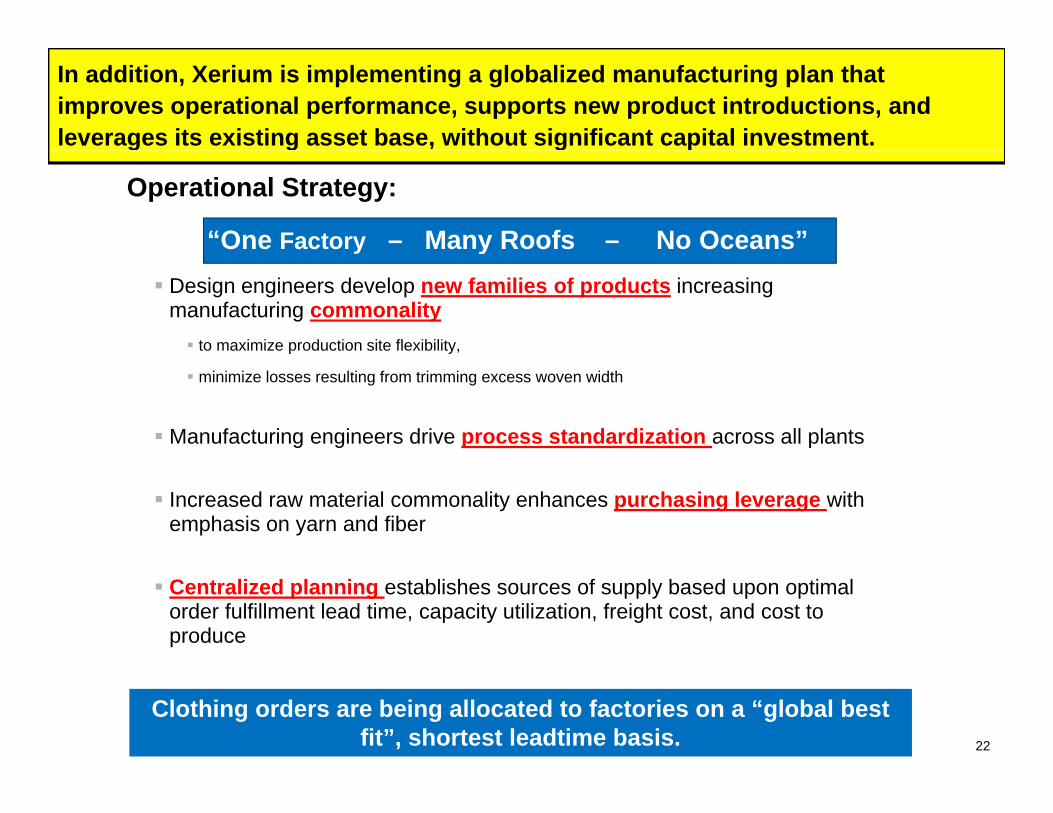
In addition, Xerium is implementing a globalized manufacturing plan that improves operational performance, supports new product introductions, and leverages its existing asset base, without significant capital investment.g g g
Operational Strategy:
“One Factory – Many Roofs – No Oceans”y y Design engineers develop new families of products increasing
manufacturing commonality to maximize production site flexibility,
minimize losses resulting from trimming excess woven width
Manufacturing engineers drive process standardization across all plants
Increased raw material commonality enhances purchasing leverage with emphasis on yarn and fiber
Centralized planning establishes sources of supply based upon optimal order fulfillment lead time, capacity utilization, freight cost, and cost to produce
22
Clothing orders are being allocated to factories on a “global best fit”, shortest leadtime basis.
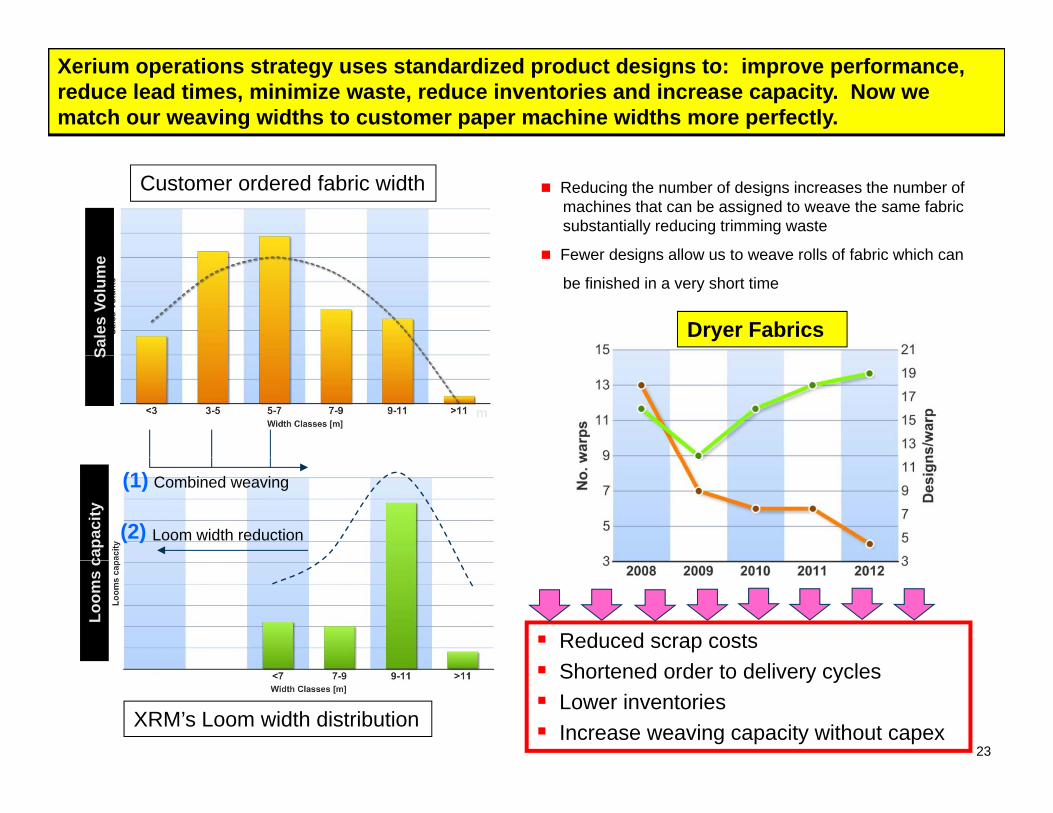
Xerium operations strategy uses standardized product designs to: improve performance, reduce lead times, minimize waste, reduce inventories and increase capacity. Now we match our weaving widths to customer paper machine widths more perfectly.
Reducing the number of designs increases the number of machines that can be assigned to weave the same fabric substantially reducing trimming waste
Fewer designs allow us to weave rolls of fabric which can
Customer ordered fabric width
Sale
s Vo
lum
e Fewer designs allow us to weave rolls of fabric which can
be finished in a very short time
Dryer Fabrics
S
m
Combined weaving
capa
city
Loom width reduction
(1)
(2)
Loom
s c
Reduced scrap costsS
23
XRM’s Loom width distribution
Shortened order to delivery cycles Lower inventories Increase weaving capacity without capex
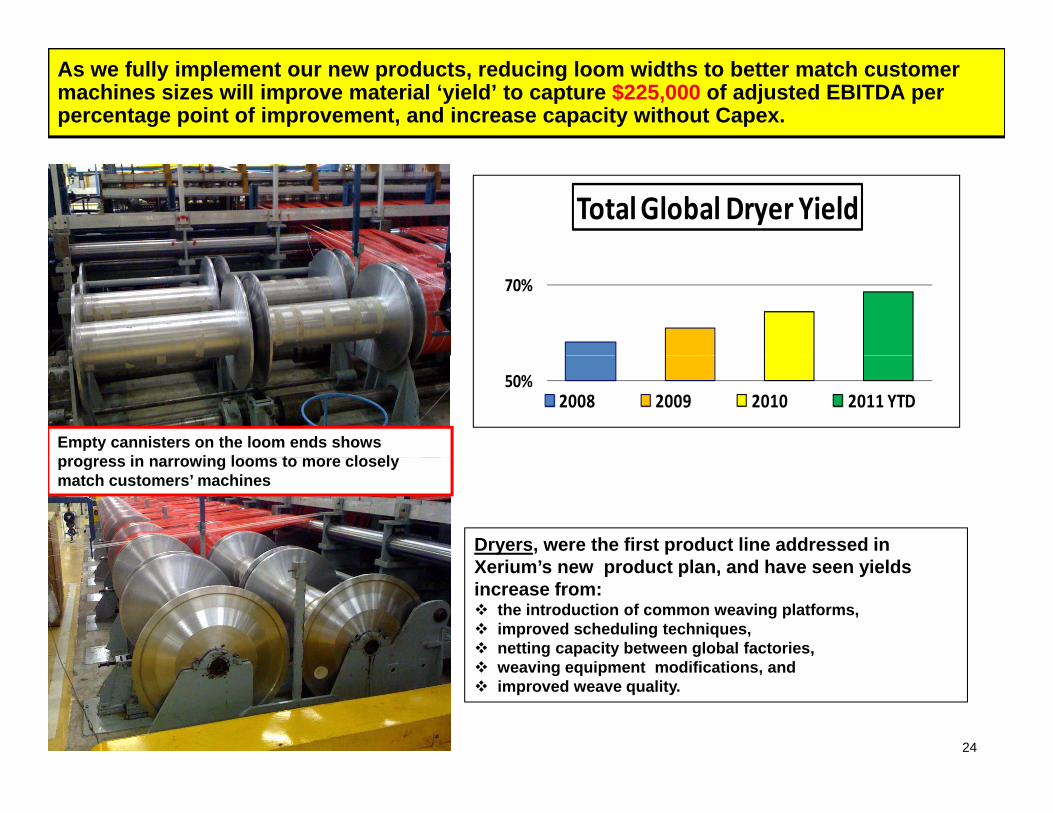
As we fully implement our new products, reducing loom widths to better match customer machines sizes will improve material ‘yield’ to capture $225,000 of adjusted EBITDA per percentage point of improvement, and increase capacity without Capex.
Total Global Dryer Yield
70%
Empty cannisters on the loom ends shows i i l t l l
50%2008 2009 2010 2011 YTD
progress in narrowing looms to more closely match customers’ machines
Dryers, were the first product line addressed inX i ’ d t l d h i ldXerium’s new product plan, and have seen yields increase from: the introduction of common weaving platforms, improved scheduling techniques, netting capacity between global factories, i i t difi ti d
24
weaving equipment modifications, and improved weave quality.
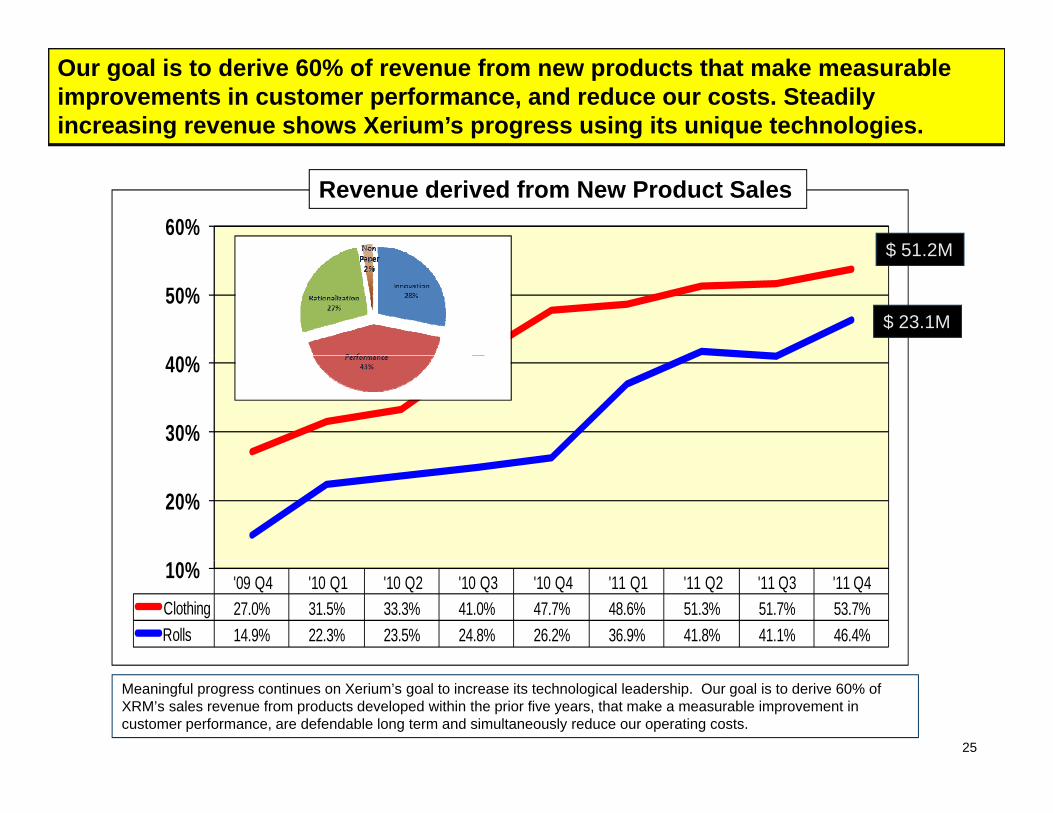
Our goal is to derive 60% of revenue from new products that make measurable improvements in customer performance, and reduce our costs. Steadily increasing revenue shows Xerium’s progress using its unique technologies.
60%$ 51 2M
Revenue derived from New Product Sales
%
50%
$ 51.2M
$ 23.1M
30%
40%
20%
'09 Q4 '10 Q1 '10 Q2 '10 Q3 '10 Q4 '11 Q1 '11 Q2 '11 Q3 '11 Q4Clothing 27.0% 31.5% 33.3% 41.0% 47.7% 48.6% 51.3% 51.7% 53.7%Rolls 14.9% 22.3% 23.5% 24.8% 26.2% 36.9% 41.8% 41.1% 46.4%
10%
Meaningful progress continues on Xerium’s goal to increase its technological leadership. Our goal is to derive 60% of XRM’s sales revenue from products developed within the prior five years, that make a measurable improvement in customer performance, are defendable long term and simultaneously reduce our operating costs.
25
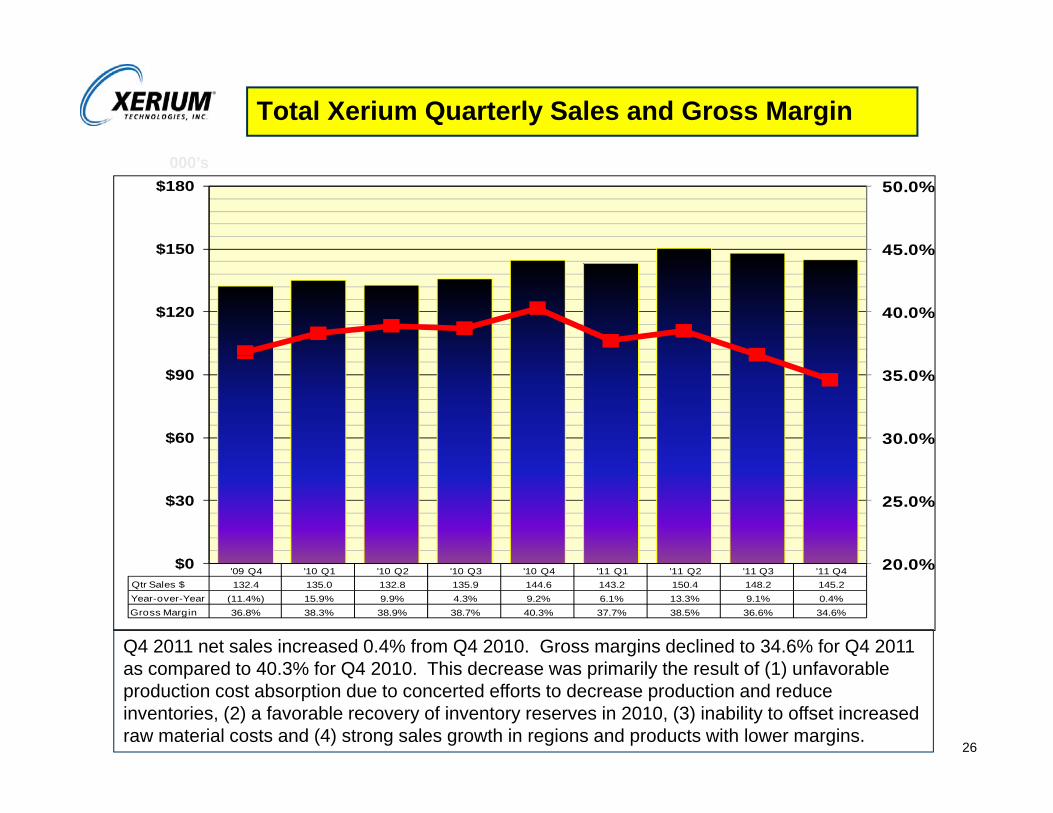
Total Xerium Quarterly Sales and Gross Margin
45.0%
50.0%
$150
$180000’s
40.0%
45.0%
$120
$150
30.0%
35.0%
$60
$90
20 0%
25.0%
$0
$30
'09 Q4 '10 Q1 '10 Q2 '10 Q3 '10 Q4 '11 Q1 '11 Q2 '11 Q3 '11 Q4Qtr Sales $ 132.4 135.0 132.8 135.9 144.6 143.2 150.4 148.2 145.2Year-over-Year (11.4%) 15.9% 9.9% 4.3% 9.2% 6.1% 13.3% 9.1% 0.4%Gross Margin 36.8% 38.3% 38.9% 38.7% 40.3% 37.7% 38.5% 36.6% 34.6%
20.0%$0
Q4 2011 net sales increased 0.4% from Q4 2010. Gross margins declined to 34.6% for Q4 2011 d t 40 3% f Q4 2010 Thi d i il th lt f (1) f blas compared to 40.3% for Q4 2010. This decrease was primarily the result of (1) unfavorable
production cost absorption due to concerted efforts to decrease production and reduce inventories, (2) a favorable recovery of inventory reserves in 2010, (3) inability to offset increased raw material costs and (4) strong sales growth in regions and products with lower margins.
26
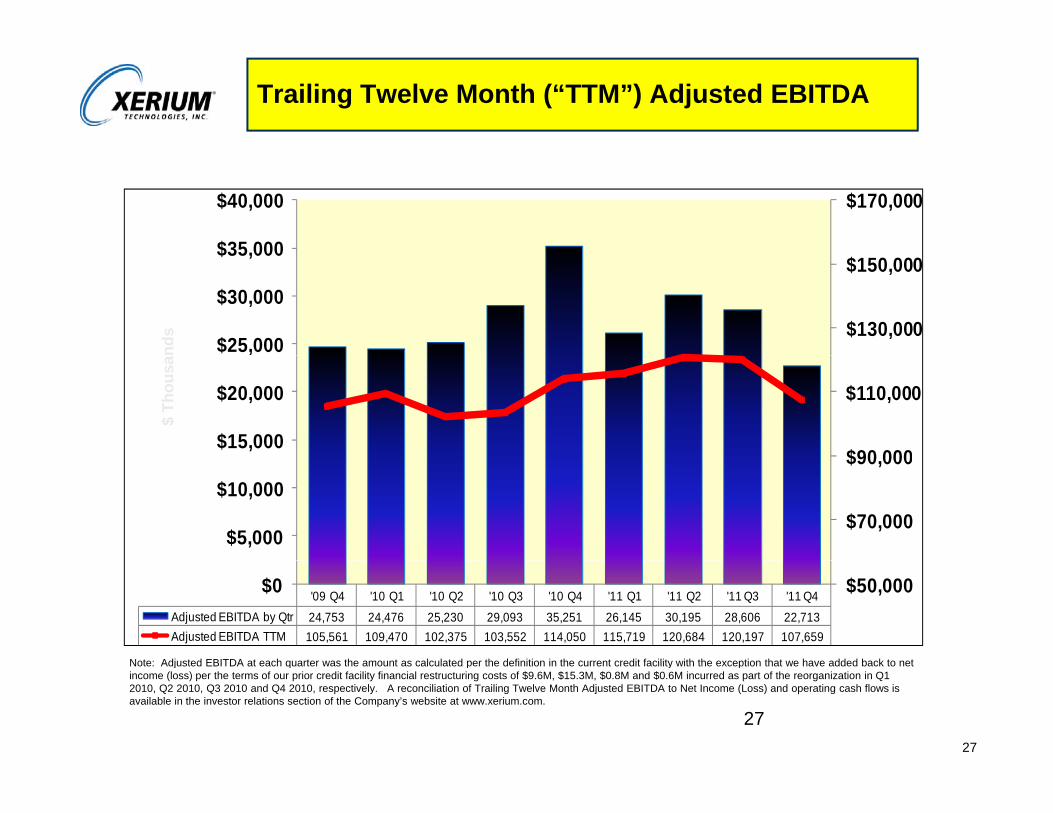
Trailing Twelve Month (“TTM”) Adjusted EBITDA
$170,000
$35,000
$40,000
$130,000
$150,000
$25,000
$30,000
$35,000
nds
$90 000
$110,000
$15,000
$20,000
$ Th
ousa
$70,000
$90,000
$5,000
$10,000
'09 Q4 '10 Q1 '10 Q2 '10 Q3 '10 Q4 '11 Q1 '11 Q2 '11 Q3 '11 Q4Adjusted EBITDA by Qtr 24,753 24,476 25,230 29,093 35,251 26,145 30,195 28,606 22,713 Adjusted EBITDA TTM 105,561 109,470 102,375 103,552 114,050 115,719 120,684 120,197 107,659
$50,000$0
Note: Adjusted EBITDA at each quarter was the amount as calculated per the definition in the current credit facility with the exception that we have added back to netNote: Adjusted EBITDA at each quarter was the amount as calculated per the definition in the current credit facility with the exception that we have added back to net income (loss) per the terms of our prior credit facility financial restructuring costs of $9.6M, $15.3M, $0.8M and $0.6M incurred as part of the reorganization in Q1 2010, Q2 2010, Q3 2010 and Q4 2010, respectively. A reconciliation of Trailing Twelve Month Adjusted EBITDA to Net Income (Loss) and operating cash flows is available in the investor relations section of the Company’s website at www.xerium.com.
2727
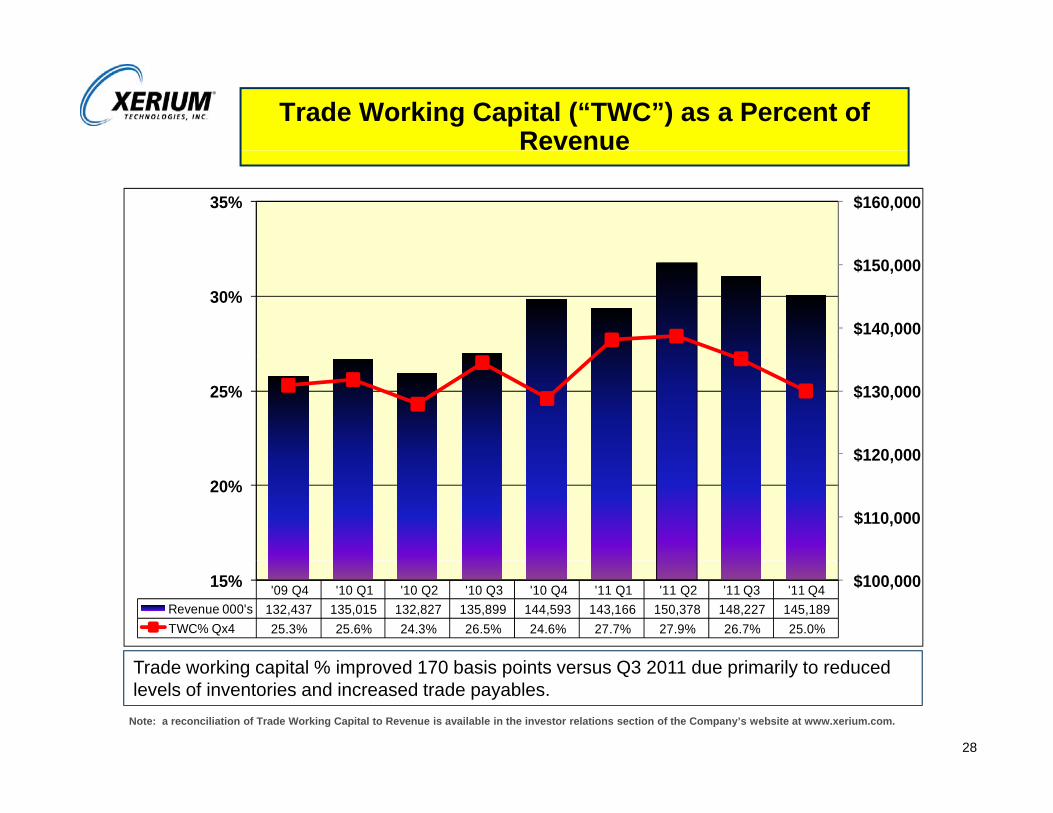
Trade Working Capital (“TWC”) as a Percent of Revenue
$160,00035%
$140,000
$150,000
30%
$120 000
$130,00025%
$110,000
$120,000
20%
'09 Q4 '10 Q1 '10 Q2 '10 Q3 '10 Q4 '11 Q1 '11 Q2 '11 Q3 '11 Q4Revenue 000's 132,437 135,015 132,827 135,899 144,593 143,166 150,378 148,227 145,189 TWC% Qx4 25.3% 25.6% 24.3% 26.5% 24.6% 27.7% 27.9% 26.7% 25.0%
$100,00015%
T d ki it l % i d 170 b i i t Q3 2011 d i il t d dTrade working capital % improved 170 basis points versus Q3 2011 due primarily to reduced levels of inventories and increased trade payables.
Note: a reconciliation of Trade Working Capital to Revenue is available in the investor relations section of the Company’s website at www.xerium.com.
28
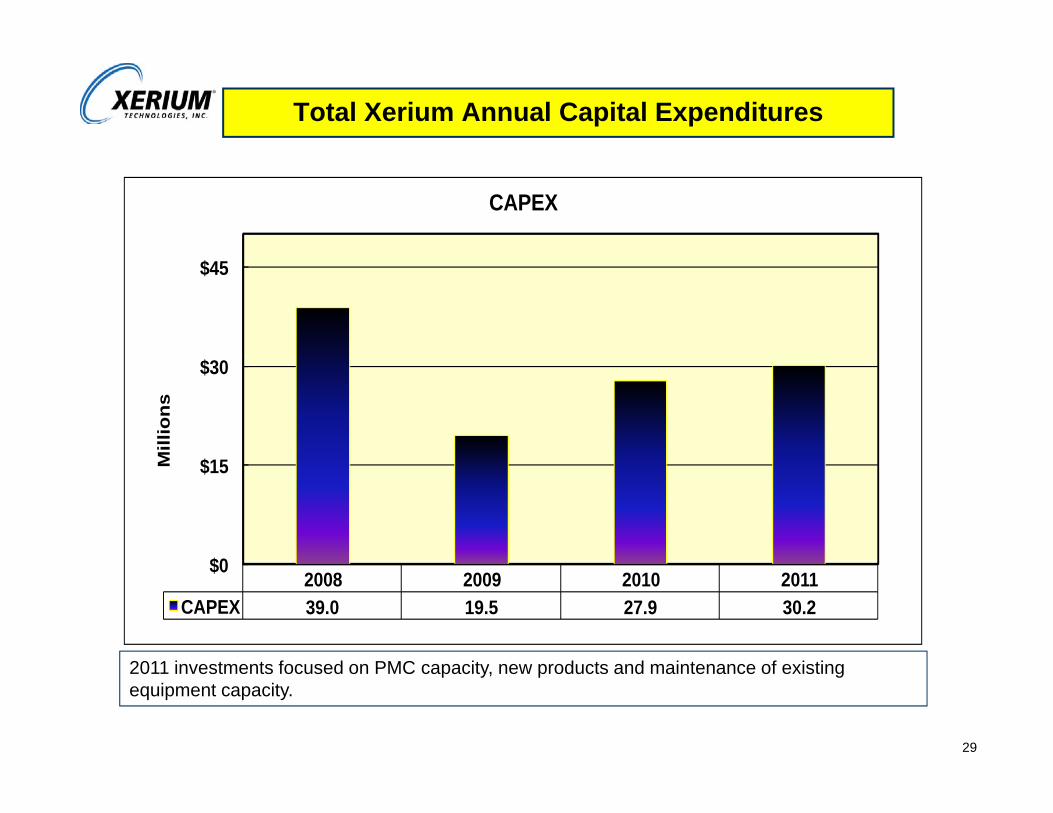
Total Xerium Annual Capital Expenditures
CAPEX
$45
$
$30
Mill
ion
s
$0
$15M
2008 2009 2010 2011CAPEX 39.0 19.5 27.9 30.2
$0
2011 i t t f d PMC it d t d i t f i ti2011 investments focused on PMC capacity, new products and maintenance of existing equipment capacity.
29
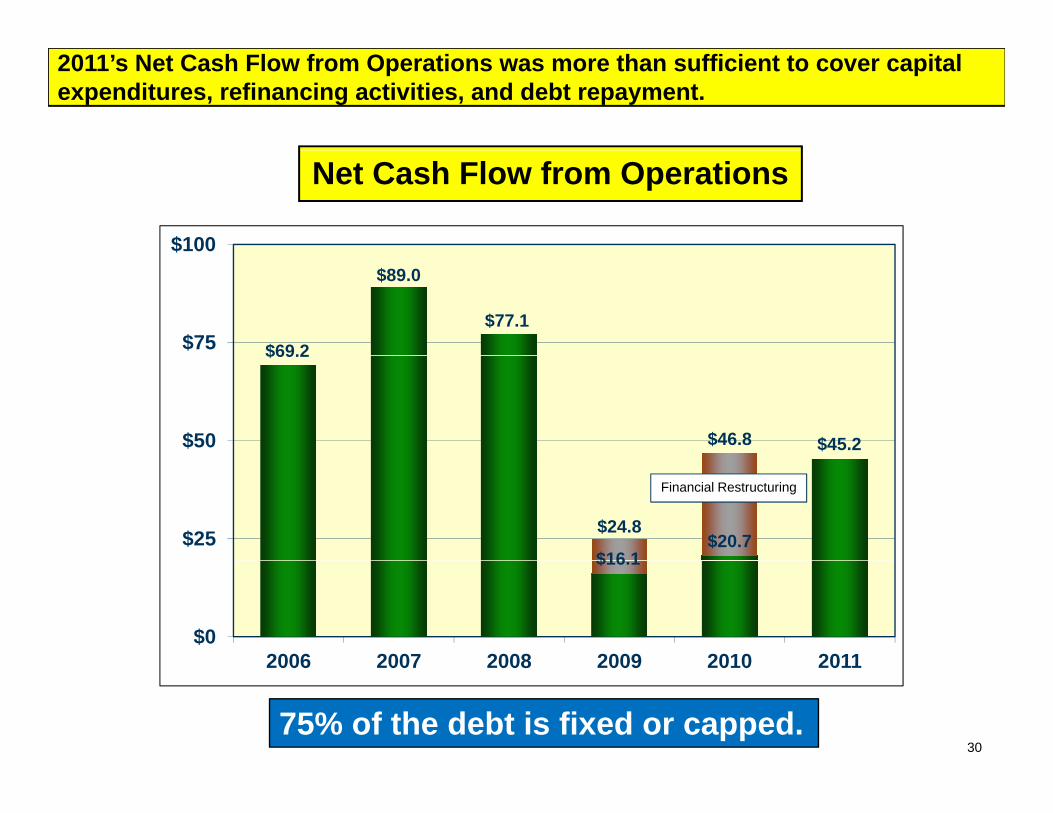
2011’s Net Cash Flow from Operations was more than sufficient to cover capital expenditures, refinancing activities, and debt repayment.
Net Cash Flow from Operations
$100
$69.2
$89.0
$77.1$75
$
$69.2
$45.2$46.8$50
$16 1$20.7
$24.8$25
Financial Restructuring
$16.1
$02006 2007 2008 2009 2010 2011
3075% of the debt is fixed or capped.
2006 2007 2008 2009 2010 2011
Xerium is well positioned to benefit from stability in developed paper markets and growth in emerging markets, with industry leading new products, world class execution and a solid balance sheet.
Top tier in a large, mature, and geographically diverse, $3.1 B market.
X i th i d i b ll k t i i Xerium revenue growth is driven by overall market expansion, mix driven market share gains, new products and expansion into Asia.
“Bottom line” growing faster than top line owing to improved margin new prod cts and contin ed operating cost red ctionsproducts, and continued operating cost reductions.
Sources of revenue highly diversified by customer, geography, and paper grade.
Recurring revenue stream – all Xerium products are consumables .
Earned customer loyalty.
31
Related Documents


![muhamed mahanaya pravachakan - ISLAMIC NET · s{]m^. sI.-F-kv. cma-Ir-jvW-dmhp](https://static.cupdf.com/doc/110x72/5b33ce8e7f8b9ae1108d80b1/muhamed-mahanaya-pravachakan-islamic-net-sm-si-f-kv-cma-ir-jvw-dmhp.jpg)


