Xenobiotics in Fish from the St. Lawrence River and Connecting Tributaries with Emphasis on the St. Lawrence River Area of Concern at Massena/Akwesasne Lawrence C. Skinner 1 Anthony David 2 Wayne Richter 1 1 Bureau of Ecosystem Health Division of Fish and Wildlife New York State Department of Environmental Conservation 625 Broadway Albany, NY 12233 2 Water Resources Program Environment Division Saint Regis Mohawk Tribe 412 State Route 37 Akwesasne, NY 13655 A report in partial fulfillment of the grant Xenobiotics in Fish from New York’s Great Lakes International Waters (GL-97229201) Phase 2 awarded by the United States Environmental Protection Agency July 2018

Welcome message from author
This document is posted to help you gain knowledge. Please leave a comment to let me know what you think about it! Share it to your friends and learn new things together.
Transcript
Xenobiotics in Fish from the St. Lawrence River and Connecting Tributaries with Emphasis on the St. Lawrence River Area of Concern at Massena/Akwesasne
Lawrence C. Skinner1 Anthony David2 Wayne Richter1
1Bureau of Ecosystem Health Division of Fish and Wildlife
New York State Department of Environmental Conservation 625 Broadway
Albany, NY 12233
2Water Resources Program Environment Division
Saint Regis Mohawk Tribe 412 State Route 37
Akwesasne, NY 13655
A report in partial fulfillment of the grant Xenobiotics in Fish from New York’s Great Lakes International Waters
(GL-97229201) Phase 2 awarded by the United States Environmental Protection Agency
July 2018

NOTICE This report was prepared by the authors during the performance of work pursuant to a grant from the United States Environmental Protection Agency and, in addition, is supported by the New York State Department of Environmental Conservation (the “Sponsors”). The opinions expressed in this report do not necessarily reflect those of the Sponsors and the State of New York, and reference to any product, service, process, or method does not constitute an implied or expressed recommendation or endorsement of it. Further, the Sponsors and the State of New York make no warranties or representations, expressed or implied, as to the fitness for any particular purpose or merchantability of any product, apparatus, or service, or the usefulness, completeness, or accuracy of any process, methods or information contained, describes, disclosed, or referred to in this project. The Sponsors and the State of New York make no representation that the use of any product, apparatus, process, method, or any other information will not infringe privately owned rights and will assume no liability for any loss, injury, or damage resulting from, or occurring in connection with, the use of information contained, described, disclosed, or referred to in this report.
i
TABLE OF CONTENTS Page LIST OF TABLES iii LIST OF FIGURES v ABSTRACT vi INTRODUCTION 1 METHODS 2 Sampling 2 Fish preparation 3 Chemical analysis 4 Statistical analysis 4 RESULTS 5 Lipids 5 Mercury 5 PCBs 6 DDT and metabolites 7 Mirex 7 Chlordane 7 DISCUSSION 8 Mercury 8 Lipid-based total PCBs 8 Temporal changes 8 Comparison with environmental and human health criteria 9 Other studies in the lower Great Lakes 11 Mercury 11 PCBs 12 Mirex 13 Relationship to beneficial use impairments 13 RECOMMENDATIONS 14 ACKNOWLEDGEMENTS 15 REFERENCES CITED 16
ii

LIST OF TABLES
Table Title Page 1 Sites for sampling fish in the St. Lawrence River and waters of the 23 Mohawk Nation at Akwesasne. 2 Collected fish species. 24 3 Numbers of fish collected and analyzed for each sampling site. 25 4 Mean fish length (mm), standard deviation, minimum and maximum. 26 5 Mean fish weight (g), standard deviation, minimum and maximum. 26 6 Detection limits and percent of samples with detections for mercury, PCBs 27 and organochlorine pesticides. 7 Lipids (percent wet weight) in fish by location. 28 8 Mercury concentrations (µg/g wet weight) in fish by location. 30 9 Spatial differences (p < 0.05) in mercury concentrations in fish from the 32 St. Lawrence River and its tributaries. 10 Number of samples by fish species which equaled or exceeded specified limits 34 (µg/g wet weight) for chemical residues in edible tissue. 11 Total PCB concentrations (µg/g wet weight) in fish by location. 35 12 Spatial differences (p < 0.05) in total PCB concentrations in fish from the 37 St. Lawrence River and its tributaries. 13 Total p,p'-DDT concentrations (µg/g wet weight) in fish from the 39 St. Lawrence River and its tributaries. 14 Total mirex concentrations (µg/g wet weight) in fish from the St. Lawrence 41
River and its tributaries. 15 Individual sample detections for chlordane and its metabolites in fish from 43
the St. Lawrence River and its tributaries. 16 Lipid-based total PCB concentrations (µg/g lipid) in fish from the St. 44
Lawrence River and its tributaries.
iii
17 Spatial differences (p < 0.05) in lipid-based total PCB concentrations in fish 46 from the St. Lawrence River and its tributaries. 18 Temporal changes in total PCB concentrations (µg/g wet weight) in fish 48 from the vicinity of the Area of Concern at Massena/Akwesasne. 19 Mercury in fish from lakes in the Grasse, Raquette and St. Regis 49
drainage basins.
iv

LIST OF FIGURES
Figure Title Page 1 Industrial locations in relation to sampling sites in the Massena- 50 Akwesasne area. 2 St. Lawrence River waters sampled for fish for chemical residue analysis. 51 3 Length-mercury relationships for fish in the St. Lawrence River and 52 its tributaries. 4 Concentration (µg/g wet weight) frequency distributions for p,p'-DDT 56
analytes. 5 Concentration (µg/g wet weight) frequency distributions of mirex and 57 photomirex. 6 Total PCBs in indicator fish species by location on wet weight and 58 lipid bases. 7 Mean of median total PCB concentrations (µg/g wet weight) in 59 young-of-year fish composites from the St. Lawrence River and tributaries, 2011-2012.
v
ABSTRACT The New York State Department of Environmental Conservation and the Saint Regis Mohawk Tribe collaborated on an extensive assessment of xenobiotics in fish from state and tribal waters on the St. Lawrence River during 1988 (Sloan and Jock 1990). PCB contamination of fish was the result of waste management practices from three aluminum smelters. The magnitude of the threat to human health led to implementation of provisions of the Federal Superfund including designation on the National Priority List, and implementation of Federal and State Superfund restoration activities at the three aluminum facilities. We provide data to update fish advisories and re-examine Beneficial Use Impairments for the St. Lawrence River Area of Concern (AOC) at Massena/Akwesasne. Sampling of fish was conducted at two reference areas (Cape Vincent and Ogdensburg) in 2012 and 2013, eleven areas in proximity to the AOC on the St. Lawrence River and adjoining tributaries, i.e., the Grasse, Raquette, and St. Regis Rivers, during 2013 and 2014. Sampling locations in the vicinity of the AOC were demarcated as inside or outside the AOC, usually by a hydropower dam or moderate-gradient riffle section. A total of 613 individual fish were analyzed for mercury, polychlorinated biphenyls (PCBs) and a selected group of organochlorine pesticides (OCPs), including dichlorodiphenyltrichloro-ethane (DDT) and its metabolites, chlordane and its metabolites, dieldrin, aldrin, mirex, photomirex, heptachlor, heptachlor epoxide, hexachlorocyclohexane (HCH) isomers, hexachlorobenzene (HCB) and octachlorostyrene. This monitoring is the first comprehensive effort to assess regional changes in fish contaminants in and around the Massena/Akwesasne AOC since the report by Sloan and Jock (1990). Summary Fish inside the AOC were significantly more contaminated than fish outside the AOC. Inside the AOC, the greatest risk to fish consumers is primarily driven by concentrations of PCBs; whereas outside the AOC, PCB concentrations were below detection or at low concentrations with few exceptions. PCB results inside the AOC varied by species, location and lipid content. The greatest PCB concentrations were in fish from the lower Grasse River and extended into the St. Lawrence River to the Franklin-St. Lawrence County line. PCBs were especially elevated in carp and channel catfish across all AOC sites. The remaining AOC sites demonstrated light to moderate PCB concentrations for species with low lipid content. PCB concentrations in fish have declined within the AOC but remain above levels acceptable for human consumption. Mercury concentrations were above the Great Lakes water quality objective in about 50% of samples. All other chemical residues examined were at low or non-detectable levels. Actions taken based on this study The observed reduction of PCBs has allowed the Saint Regis Mohawk Tribe (SRMT) to lift a ban on consumption of some fish species by sensitive risk groups at or near a recreational exposure scenario, while PCB residues in other species remain elevated and are not recommended for frequent consumption. A tribal subsistence consumption rate (basically, unrestricted fish consumption or multiple fish meals per week) is not supported inside the AOC due to excessive PCB concentrations. Fish consumption restrictions in the AOC are not caused by the other persistent organic pollutants (POPs) measured.
vi


1
INTRODUCTION The legacy of past pollution practices from three aluminum smelters (Figure 1) located between Massena, NY, and the Mohawk Territory of Akwesasne have resulted in their classification as Superfund hazardous waste sites under the Comprehensive Environmental Response Compensation and Liability Act (CERLCA). Alcoa Massena Operations-West Plant (renamed Arconic Inc. in 2016) contaminated the 7.2 river-miles of the lower Grasse River to the confluence with the St. Lawrence River. The closed Alcoa East plant (formerly owned by Reynolds Metals Company) and the razed General Motors plant (formerly General Motors Central Foundry Division or GM-CFD; a.k.a. GM or GM Powertrain) (closed in 2009; bankruptcy transfer to Racer Trust in 2011) are located on the southern shore of the St. Lawrence River, across from Canada. In 1983 the General Motors site was added to the National Priority List (USEPA 1992). Pursuant to the 1987 Great Lakes Water Quality Agreement (IJC 1988) the St. Lawrence River was designated a Binational Area of Concern (AOC). The St. Lawrence AOC at Massena/Akwesasne is situated on the southern St. Lawrence River at the confluence of three impacted watersheds of sizable drainage: Grasse River (632 square miles), Raquette River (1,260 square miles) and the St. Regis River (852 square miles). The Great Lakes are the world’s largest surface freshwater system, containing one-fifth of the world’s surface freshwater (Herdendorf 1990). The St. Lawrence River is the only natural outlet for the Great Lakes system. This region supports a diverse range of opportunities for fishing, hunting and trapping. These practices are particularly important to the cultural, social and economic practices of the Mohawk people of Akwesasne—a sovereign First Nation and federally recognized Indian Tribe. Several pollutants have found their way into fish, mammals and waterfowl in the Massena/Akwesasne AOC and bioaccumulated to levels that are potentially harmful for human consumers (Sloan and Jock 1990; Skinner 1992; NYSDOH 1995). The site impacts of the Massena/Akwesasne AOC represent an additional risk or concern for Great Lakes pollution. They have led to fish consumption restrictions by the Saint Regis Mohawk Tribe and the New York State Department of Health from 1990 to the present time (NYSDEC 1990; SRMT 2014; NYSDOH 2017).
Mercury is a widespread contaminant in aquatic environments (Wiener et al. 2012), and in freshwater fish methylmercury comprises 95% or more of the mercury present (Bloom 1992; Wiener and Spry 1996). Fish consumption is the major route of mercury exposure for the general population (Shimshack and Ward 2010) and mercury is the most frequent cause for fish consumption advisories in the United States (USEPA 2013). Mercury exists naturally in the environment, but human activities have increased its abundance. Global transport via emissions to the atmosphere are the current major sources of mercury globally (Pacyna et al. 2010). The emissions are primarily from artisanal and small-scale gold mining, and coal-fired electricity generation, but also waste incineration, other mining and precious metal extraction, and use in a wide variety of products or processes (Driscoll et al. 2013).
Polychlorinated biphenyls are a class of organic compounds used extensively worldwide in a variety of applications through the 1970s. PCBs were banned in the U.S. by the Toxic Substances Control Act (15 U.S.C. §2601 et seq.) of 1976. By direct discharge to waterways, migration from upland sources or atmospheric deposition, PCBs have become widespread in the Great Lakes system. At Alcoa East, Alcoa West, and GM-CFD discharge permits allowed for dispersal into waterways via a series of outfalls. A portion of the contamination remains locally as sediment-sorbed reservoirs. The remainder dispersed via the St. Lawrence River.
Organochlorine pesticides (OCPs) are a group of structurally diverse chlorinated organic compounds that were once widely used. Use of OCPs was banned in the United States due to environmental and human
2
health concerns but legacy contamination persists in the environment (USEPA 2003) and can be found in fish in Great Lakes waters (Bhavsar et al. 2007, Salamova et al. 2013; Li et al. 2014).
Beginning in the 1970s the New York State Department of Environmental Conservation (NYSDEC) and the Saint Regis Mohawk Tribe (SRMT) monitored the concentrations of contaminants in fish and other organisms in the St. Lawrence River including the Massena/Akwesasne area (Spagnoli and Skinner 1977; NYSDEC 1978, 1979; Sloan 1981; Sloan et al. 1987; Sloan and Jock 1990; Skinner 1992). Both the Saint Regis Mohawk Tribe and the New York State Department of Health have issued fish consumption advisories for the Massena/Akwesasne AOC. PCBs, mirex and polychlorinated dibenzo-p-dioxins and dibenzofurans (PCDD/Fs) have been the cause of advisories issued by the New York State Department of Health for the St. Lawrence and Grasse Rivers (NYSDOH 2017). The first SRMT advisory focused on PCBs (SRMEHD 1986) and recently added mercury (SRMT 2014). Remediation at two of the three hazardous waste sites contributing to the advisories and to the AOC is now complete. Remediation of the third site is in an intermediate design phase. Consequently, there may be the potential to change fish consumption restrictions and address the Beneficial Use Impairment of the AOC.
To address this need, the United States Environmental Protection Agency (USEPA), as part of the Great Lakes Restoration Initiative, provided funding for NYSDEC and SRMT to collect and analyze a variety of legacy and emerging contaminants in fish from 2012 through 2014. The study objectives were to identify the environmental status of select groups of chemical residues in fish from the St. Lawrence River and its tributaries, update health advisories where appropriate, and examine the status of beneficial use impairments.
METHODS
Sampling
Fish were collected at multiple sites in the Massena/Akwesasne area upstream and downstream from hazardous waste sites in the St. Lawrence, Grasse, Raquette and St. Regis Rivers and from the St. Lawrence River at the outlet of Lake Ontario at Cape Vincent and at Ogdensburg, about halfway between Cape Vincent and Massena. These latter sites both characterize the water draining into the St. Lawrence River and serve as reference sites for the Massena/Akwesasne area collections. Fish were obtained by boat electrofishing, angling and gill netting from 13 sites on the St. Lawrence River and tributaries with a focus on the Massena/Akwesasne area (Table 1 and Figure 2). The names of fish species collected are given in Table 2. All fish from the Massena/Akwesasne area were sampled by the Water Resources Program of the SRMT under contract with the NYSDEC. The sampling occurred April through October of 2013 and 2014. Sampling sites were selected in each watershed to represent the diversity of habitats and water quality conditions. Seven of the 13 sites sampled were within the Massena/Akwesasne Area of Concern (i.e., St. Lawrence River at the Franklin County line and at Raquette Point, the Massena Power Canal, and the portions of the Grasse, Raquette and St. Regis Rivers), while all remaining sites were outside the Area of Concern. Staff from the NYSDEC collected fish from the St. Lawrence River at Cape Vincent and Ogdensburg in 2012, and made a supplemental collection from Ogdensburg in May 2013.
To be consistent with the established baseline (Sloan and Jock 1990) targeted species met the following criteria:
3
• Species of restricted range, low fat content and found at most sampling sites: yellow perch, bass • Species of restricted range, high fat content and found at most sampling sites: common carp,
redhorse • Species of wide range, low fat content and uncommon at sampling sites: walleye, northern pike • Species of wide range, high fat content and uncommon at sampling sites: channel catfish • Species reflecting consumption preferences of the tribal members: brown bullhead
A minimum of ten specimens per species per sampling site were targeted in the Massena/Akwesasne area and 15 samples per species at Cape Vincent and Ogdensburg. Where species abundance was limited, a reasonable substitute was selected based on what fish were available. For example, carp, a preferred species, did not occur above the Hogansburg Dam on the St. Regis River, nor above the breached weir in Massena on the Grasse River; therefore, silver redhorse were substituted. The seasonal movements of migratory species required some samples to be collected in early parts of the year. Species with a small number of samples are reported in the tables but excluded from the discussion.
Samples were recorded in field log books and tagged with metal tags containing unique identification numbers. The sample location and collection method was recorded. Upon preparation for storage, weight, length and sex were recorded in the notes. Table 2 lists the species collected and the numbers of samples by location of collection is given in Table 3. Tables 4 and 5 provide an overall summary of lengths and weights, respectively, of samples.
Samples were stored in a secure location at a field processing station or the SRMT Environment Division laboratory. Sample chain of custody was maintained and tracked in accordance with the Quality Assurance Project Plan. Samples were delivered in person by the SRMT and DEC regional field staff to NYSDEC’s Hale Creek Field Station (HCFS), Gloversville, NY, where chain of custody was transferred to and samples were maintained in frozen storage until final preparation for analysis.
Two species reported by Sloan and Jock (1990) to have elevated PCB concentrations were purposely excluded from this study. The possession of American eel (Anguilla rostrata) is prohibited due to extremely low abundance (de Lafontaine et al. 2010), and the lake sturgeon (Acipenser fulvescens) is a state listed threatened species (6 NYCRR Part 182). The occurrence of American eel in SRMT sampling activities is now exceedingly rare and not enough samples could be collected to build a complete data set. The reproductive health and contaminant burden of lake sturgeon are the subjects of study under another GLRI funded project and are not included in this report.
Fish preparation
Fish samples were prepared at NYSDEC’s Hale Creek Field Station according to the laboratory’s standard operating procedures (NYSDEC 2014). Of the 613 fish samples analyzed, 569 were prepared as an NYSDEC standard fillet (i.e., scales off, skin on, left side fillet for most fish species; skin off left side fillet for brown bullhead and channel catfish). The remaining 44 fish were too small to provide sufficient analytical mass for a standard fillet. They were therefore prepared as whole body with scales, head and viscera removed. In general, whole body with head and viscera removed is a method that closely approximates the standard fillet, so we combined fish prepared with these methods in statistical analyses. Samples were thoroughly ground and homogenized, placed in appropriate glass bottles, labeled externally and stored in freezers at ̶ 18˚ C until removed for chemical analysis.
4
Chemical analysis All fish samples were analyzed for percent lipid, total mercury, PCBs and OCPs by the Analytical Services Unit at NYSDEC’s Hale Creek Field Station. Percent lipid was determined gravimetrically. Total mercury was analyzed using the protocol HCFS SOP HG.1998.FISH.1 (Mercury in Fish Tissues), which is based on EPA Method 245.6 (USEPA 1991). Briefly, fish samples were homogenized and digested in concentrated nitric acid and sulfuric acid. The digested samples were oxidized with potassium permanganate and potassium persulfate, and then reduced with stannous chloride. Mercury vapor was carried by argon gas to an optical cell with a mercury lamp (254 nm), using a Leeman Labs AP/PS200II Mercury Analysis System. Mercury concentration was determined by cold vapor atomic absorption spectrometry. HCFS analyzed PCBs and OCPs by a capillary GC-ECD method [HCFS SOP OC1.107 (Organochlorine Residues)] based on the U.S. Food and Drug Administration (USFDA) Pesticide Analytical Manual Vol. 1, 3rd Edition, Sections 202, 203 and 304. Fish samples were homogenized, freeze-dried and soxhlet-extracted with hexane/acetone (1:1). The extract was cleaned up by Florisil, evaporated to dryness on a rotovap, and dissolved with isooctane. For gas chromatography, hydrogen was used as the carrier gas and a DB-1 capillary column (60 m x 0.25 mm, 0.25 μm film) was used for GC-ECD and GC-MS. PCBs were analyzed as Aroclor 1242 and combined Aroclors 1254 and 1260 using 26 peaks for quantitation. A total of 22 organochlorine pesticides and their metabolites were analyzed: p,p'-DDE, p,p'-DDD, p,p'-DDT, o,p'-DDE, o,p'-DDD, o,p'-DDT, heptachlor, heptachlor epoxide, trans-chlordane, cis-chlordane, trans-nonachlor, cis-nonachlor, oxychlordane, aldrin, dieldrin, photomirex, mirex, HCB, alpha HCH, beta HCH, gamma HCH, and octachlorostyrene. Octachlorostyrene was analyzed with the OCPs due to its structural similarity, although it is mainly a byproduct of industrial processes involving chlorinated compounds and has never been manufactured as a pesticide (Kaminsky and Hites 1984; Chu et al. 2003; Yanagiba et al. 2009). At least ten percent of the samples were qualitatively confirmed by capillary GC-MS. The method detection limit for each analyte is given in Table 6.
As a quality control measure, one reference material sample, one laboratory duplicate, and one method blank were analyzed for every 20 samples. The reference material for mercury was DORM-2 Dogfish Muscle from the National Research Council, Canada. The laboratory used several types of reference materials for PCBs and OCPs, including NIST SRM 1947, Hudson Reference Material developed by NYSDEC (Sloan et al. 2007), and coho salmon collected on 10/18/2000 from the Salmon River.
All results were within control limits for accuracy, precision and potential contamination, based on recommended control limits in Guidance for Assessing Chemical Contaminant Data for Use in Fish Advisories, Volume 1, 3rd edition (USEPA 2000a).
Statistical analyses
For statistical summaries, values below method detection limits (Table 6) were treated by two methods depending on the analytes examined. For PCBs, if an Aroclor is not detected, one half the method detection limit is assigned because of the probability that some PCB congeners are present but not quantified either due to their low concentration and/or some peaks may not be included in the range of peaks used for PCB Aroclor quantitation. For example, where both Aroclor mixtures are non-detects the

5
sum for total PCBs would be 0.020 µg/g, the sum of one half of each method detection limit and may be indicated as ND in tables.
For all other compounds, non-detects were assigned a value of zero which may cause the total analyte concentration to be underestimated, albeit the scale of the underestimate is unknown but expected to be small. For purposes of clarity in the tables, where the median, mean, minimum or maximum values are non-detect, ND is given. In some cases, due to the rarity of analyte detection (e.g., chlordane compounds), only the individual samples with detections were enumerated in a table.
Total p,p’-DDT is the sum of detectable concentrations of p,p’-DDE, p,p’-DDD and p,p’-DDT. However, the mean high concentration is also given and assumes a value equal to the method detection limit of p,p’-DDE (0.002 µg/g) if the mean is less than detection. This provides the maximum possible total p,p’-DDT concentration but it also tends to overestimate total p,p’-DDT concentrations.
Spatial differences were assessed by use of the Kruskal-Wallis test with post-hoc analysis of group differences (Conover 1980) where the number of sites compared and the number of samples per site were three or more. Where only two sites were compared, the Mann-Whitney test was used. Spatial significance occurred when p < 0.05. In tables depicting spatial differences, underlined sites have statistically equivalent analyte concentrations.
RESULTS A total of 613 fish representing 13 species were collected (Tables 2 through 5). The Massena Power Canal and the middle section of the Raquette River produced very few fish. Because of the small sample numbers, the results were included in the data tables but were not addressed in the text. Species with fewer than four fish at a location are similarly omitted from the text.
Mercury was detected in every fish and PCBs were detected in 427 samples. Among the pesticides, only p,p'-DDE was detected in over half the samples. p,p'-DDD, p,p'-DDT and mirex were detected in one-fifth to one-fourth of samples, while photomirex, trans-nonachlor and cis-nonachlor were in 5% or fewer of the samples and the remaining pesticides and octachlorostyrene were not detected at all (Table 6).
The results are presented for lipids and then major analyte groups when detected.
Lipids
Lipid contents by fish species and location are summarized in Table 7. The usual pattern is evident with "fatty" fish being dominated by carp and channel catfish followed by leaner fish such as smallmouth bass and walleye, and much leaner fish such as brown bullhead and yellow perch. Some individual channel catfish and carp had particularly high lipid contents exceeding 10 percent. The mouth of the St. Regis River was exceptional because 6 of 11 channel catfish exceeded 20 percent lipids, with the maximum over 26 percent lipids in two fish.
Mercury
Thirteen fish (2.1%, six smallmouth bass, four walleye and three channel catfish) exceeded 1.0 µg/g mercury; all but one were in the tributaries (Table 8). By species, mercury concentrations in each

6
reference area are approximately the same as in the corresponding immediate downstream location (Tables 8 and 9). Overall, St. Lawrence River sites at Cape Vincent and Ogdensburg had the lowest mercury levels while the three tributaries had the greatest mercury concentrations but the pattern of the spatial distribution was not consistent between species (Table 9). In general, smallmouth bass and walleye, both predatory species, contain greater mercury concentrations than carp and channel catfish which, in turn, are greater than in yellow perch and brown bullhead (Table 8). Larger smallmouth bass, walleye, yellow perch and occasionally channel catfish have greater mercury concentrations than smaller fish (Table 8 and Figure 3).
About 26% of samples exceeded 0.5 µg/g and 50% exceeded 0.3 µg/g, the USEPA criterion for unrestricted fish consumption (USEPA 2001 and 2010). The species exceeding these levels were dominated by smallmouth bass and walleye, but carp, channel catfish, yellow perch and other species in small numbers were also above these concentrations (Table 10).
PCBs
Patterns for PCBs (Table 11) are distinctly different from mercury. In the St. Lawrence River, mean PCBs in fish from reference locations at Cape Vincent, Ogdensburg and above the Moses Saunders Dam are generally less than 0.3 µg/g. The 12 carp at Ogdensburg were an exception, averaging 1.00 µg/g total PCB. These included two carp with PCB concentrations exceeding 2.0 µg/g, two more between 1.0 and 2.0 µg/g and three others between 0.5 and 1.0 µg/g. The two mainstem locations downstream of the Moses Saunders Dam show marked increases in PCB concentrations compared to fish above the Moses Saunders Dam. Carp at the Franklin County line and Raquette Point averaged 5.03 µg/g and 2.53 µg/g total PCB, respectively. Indeed, one carp from the vicinity of the Franklin-St. Lawrence County line had 12.5 µg/g total PCB. At the two downstream locations, 7.3 % of all fish exceeded 2.0 µg/g total PCB and 14 % exceeded 1.0 µg/g total PCB. Carp most frequently exceeded these values but individual smallmouth bass, walleye and silver redhorse also contributed (Table 10).
In the tributaries (Table 11), fish from upstream locations on the Grasse and St. Regis Rivers generally had non-detectable PCBs. Nearly all downstream fish show a major increase in PCB levels, particularly for carp in the Grasse River, which exceeded a mean total PCB level of 2.0 µg/g (mean of 6.86 µg/g with a maximum of 24.6 µg/g in one carp). Also, channel catfish from the lower Grasse River had 2.67 µg/g mean total PCB. In contrast, PCBs concentrations in upstream Raquette River fish more closely approximate reference locations on the St. Lawrence River (i.e., detectable PCBs, albeit less than 0.3 µg/g), but downstream fish show an approximate doubling of PCB levels. At the mouth of the Raquette River channel catfish had mean total PCB levels exceeding 2.0 µg/g (2.05 µg/g mean total PCB, maximum 6.28 µg/g) while carp had mean total PCB of 1.77 µg/g (maximum 6.00 µg/g).
Overall, PCB concentration rankings by species were approximately as follows: carp > channel catfish > smallmouth bass > walleye > brown bullhead ≥ yellow perch.
Similarly, overall ranking by location (Table 12) produces an approximate order of: Grasse River mouth ≈ Franklin-St. Lawrence County line > Raquette River mouth ≈ Raquette Point ≈ St. Regis River mouth > Ogdensburg ≈ Cape Vincent ≈ upper Raquette River > upper Grasse River ≈ upper St. Regis River.
7
DDT and metabolites
The results focus on the p,p’-DDT compounds since the three o,p’-DDT compounds were not detected in any sample (Table 6). Total p,p’-DDT was calculated in 354 samples (57.7%) (Table 13) while the remaining samples lacked detectable p,p’-DDT compounds. Where detected, total p,p’-DDT was dominated by p,p’-DDE (Figure 4). About 60% of the samples with detectable p,p’-DDE lacked detectable p,p’-DDD or p,p’-DDT or both.
Nine carp exceeded 0.2 µg/g total p,p’-DDT, two orders of magnitude greater than the detection limit, with a maximum of 0.6 µg/g in a fish from the mouth of the St. Regis River. About 15% of fish, primarily carp and channel catfish, had total p,p'-DDT concentrations that were one order of magnitude above the detection limit of 0.002 µg/g (Table 10). Nearly all detections were in the mainstem St. Lawrence River or in the mouths of the tributaries. The distribution of DDT residues was not concentrated in any one location or region of the river.
Mirex
Mirex was detected in 24% of samples while its photodegradation product, photomirex, was found in about 5% of samples (Table 6, Figure 5). The summation of detected mirex and photomirex concentrations to form total mirex did not appreciably alter mirex concentrations.
The species with detectable mirex were primarily carp, channel catfish and smallmouth bass (Table 14). The greatest mirex concentration (0.0826 µg/g) was in a carp from the mouth of the Raquette River. In combination with photomirex, this fish had the greatest total mirex concentration at 0.102 µg/g. Most walleye at Cape Vincent had detectable mirex but walleye lacked mirex at all other locations.
Most photomirex detections were in carp and were scattered over the length of the St. Lawrence River and in the mouths of the tributaries. The maximum photomirex concentration detected was 0.0211 µg/g in a channel catfish from the mouth of the Raquette River.
Only 45 samples (7.3%) had total mirex concentrations that were 0.01 µg/g or greater, a value one-tenth the FDA guidance value for fish in commerce. The remaining 92.7% of samples had total mirex concentrations less than 0.01 µg/g (Table 10).
Chlordane
Chlordane analytes were seldom detected. The data for 21 samples (3.4% of all samples) that had detections, primarily trans-nonachlor and cis-nonachlor, are listed in Table 15. Carp and channel catfish from the mainstem St. Lawrence River and from the Raquette River were the primary species containing chlordane compounds, although walleye and smallmouth bass from Cape Vincent also had small quantities of chlordane metabolites.
8
DISCUSSION
Mercury
It has been frequently noted that there is a relationship between mercury and age or length of fish (Bache et al. 1971; Somers and Jackson 1993; Sonesten 2003; Gewurtz et al 2011; Li et al. 2014). Simonin et al. (2008) showed that for a given species taken from a large number of New York lakes, the length-mercury relationship may be significant but very weak; only when assessed on an individual lake or site basis was the relationship dramatically improved. However, the length-mercury relationship does not always exist, for instance when all fish from a water are of the same age or are of a limited size (age) range (Li et al. 2014). In the current study for the 49 calculations where n ≥ 5 samples (including northern pike, rock bass and silver redhorse), only 51% showed a significant (p < 0.05) length-mercury relationship (Figure 3). Brown bullhead (2 of 7 locations) and carp (1 of 7 locations) seldom showed a significant length-mercury relationship, which contrasts with smallmouth bass with 7 of 9 locations having a significant relationship. Fish at Cape Vincent, Ogdensburg and the mouth of the Grasse River had predominantly significant associations whereas non-significant associations dominated above the Moses Saunders Dam, at Raquette Point, in the Grasse River above the dam and at the mouth of the St. Regis River. Fish at the remaining sites had a roughly equal mixture of significant and non-significant length-mercury associations. The causes for these differences are unknown.
Lipid-based total PCBs
There was a wide distribution of lipid concentrations in the fish sampled (Table 7). Because PCBs are lipophilic and vary spatially, total PCB concentrations were lipid normalized (Table 16) to reduce or eliminate the impact of lipophilicity to provide an alternative assessment of spatial differences. Lipid-based total PCBs were most frequently less than 5 µg/g at St. Lawrence River locations upstream of the Moses Saunders Dam and at upstream reference areas of the Grasse and St. Regis Rivers. Downstream locations had lipid-based total PCBs at levels an order of magnitude or more than upstream locations (Figure 6). The greatest concentrations, over 50 µg/g lipid (some over 100 µg/g liupid), occurred at the Franklin-St. Lawrence County line and at the mouth of the Grasse River. A comparison of spatial differences for wet weight (Table 12) and lipid-based total PCBs (Table 17) showed some rearrangement of rank order of locations but the primary distribution of sites did not show dramatic differences. Further, it is evident from the small difference in concentrations that there was no effective barrier to upstream fish movement in the lower Raquette River at least to the sampling area above Route 420.
Temporal changes
The Massena/Akwesasne area was designated as an Area of Concern primarily because of excessive PCB contamination (NYSDEC 1995). Temporal changes in PCB concentrations were assessed for the Area of Concern and its primary upstream reference area and included data only for 1988, the period immediately prior to initiation of remedial actions (Sloan and Jock 1990), and the current study. This period addresses the effects of implementation of primarily land-based remedial actions although dredging of sediments from the St. Lawrence River did occur in waters adjacent to Alcoa East and sediment removal occurred from the river, river bank and the tributary adjacent to General Motors. The latter site is designated as the
9
Franklin County Line. Also, a small non-time critical removal action had been completed for sediments downstream of Alcoa (West) adjacent to Outfall 001 in the Grasse River.
In the 1988 collections, sample size for each species at each location was usually limited to three to five fish. Therefore, with only one exception, the minimum sample number considered for comparison with the current study is three samples. Where an outlier total PCB concentration was present, its impact is noted. Table 18 suggests that there was a positive impact caused by removal of PCB contaminated materials from the three industrial sites and from waterways, even though PCB removal was (and is) still incomplete. In most cases PCB concentrations in fish declined by 50 percent or more. However, the declines occurred at the reference sites as well as in the Area of Concern suggesting at least some of the decrease was also due to the loss of PCBs from the entire St. Lawrence River ecosystem independent of remedial work. The change may be inconsistent based on conflicting indicators at the Franklin County line where two relatively poor indicator species are compared. However, as evident in Table 11, total PCB concentrations in some fish species, primarily "fatty" species such as carp and channel catfish, taken from the vicinity of the Area of Concern continue to be quite high.
PCB concentrations have declined in Lake Ontario lake trout and walleye between 1977 and 2006 (Borgmann and Whittle 1991; DeVault et al. 1996; Huestis et al. 1996; Bentzen et al. 1999; Hickey et al. 2006; Bhavsar et al. 2007; Chang et al. 2012). Since 1988, PCB concentrations have declined by about 80% for lake trout, a species typically having higher lipid content. For this same period, no PCB declines were apparent for walleye from Lake Ontario. Whether declines observed for the Area of Concern are partially attributable to declines in upstream portions of the Great Lakes basin is unknown, but is suspected as being a contributing factor. Comparison with environmental and human health criteria Past and current criteria to protect human health and the environment were used for comparisons with chemical concentrations in fish (Table 10). Five analytes or analyte groups (i.e., mercury, total PCBs, total p,p'-DDT, total mirex and total chlordane) exceed criteria in some samples.
The current United States tolerance for mercury in fish in interstate commerce is 1.0 µg/g methylmercury (USFDA 1984a) which is exceeded by 2% of the samples. The Canadian one meal per week fish consumption advisory guideline for total mercury is 0.52 µg/g (Bhavsar et al. 2011), which is exceeded by 23% of the samples. The U.S. Environmental Protection Agency's recommended advisory level is 0.3 µg/g (USEPA 2001; 2010) is exceeded by 50% of the samples. The Great Lakes water quality objective for total mercury of 0.5 µg/g is designed to protect aquatic life and fish-consuming birds (IJC 1988). The Great Lakes Fish Advisory Workgroup (2007) recommended total mercury levels of 0.05 µg/g or less would support unrestricted fish consumption by people and 0.22 µg/g or less would support a meal per week advisory.
The former U.S. Food and Drug Administration (USFDA) temporary tolerance for PCBs in fish in interstate commerce was 5.0 µg/g (USFDA 1973) but was reduced to 2.0 µg/g as a tolerance (USFDA 1984b). The former USFDA temporary tolerance was exceeded by 2.4 % of samples while the current tolerance is exceeded by 5.2 % of samples. The Canadian fish advisory guideline is < 0.211 µg/g for all consumers of recreationally caught fish on a one meal per week basis (Bhavsar et al. 2011). The Great Lakes Sport Fish Advisory Task Force (Anderson et al. 1993) recommended use of 0.05 µg/g or less for unrestricted fish consumption while higher levels would result in varying levels of recommended restrictions on fish consumption.
10
The International Joint Commission (IJC 1988) adopted 0.1 µg/g in fish as a water quality objective for PCBs to protect fish-consuming wildlife; this is nearly identical to the 0.11 µg/g recommendation of Newell et al. (1987). Lastly, the 10-5 cancer risk concentration for PCBs is 0.012 µg/g, which is below the reporting limit for total PCBs used in this study, and lower than the detection limit of 0.030 µg/g for Aroclors 1254/1260. Aroclor 1242 had a detection limit of 0.010 µg/g. If only Aroclor 1242 is detected, then in most cases it is likely the 10-5 cancer risk concentration may be exceeded. If only Aroclors 1254/1260 are detected, then the cancer risk concentration would always be exceeded. However, if both Aroclors are not detected, the true status of total PCB concentrations in relation to the 10-5 cancer risk concentration cannot be determined. Using Tables 10 and 11, it is evident that "fatty" fish such as carp and channel catfish taken in the vicinity of the Area of Concern continue to exceed PCBs levels that are acceptable for unrestricted human consumption. Table 10 also gives the number of non-detects (< 0.02 µg/g), by species, for total PCBs.
The U.S. tolerance for total DDT is 5.0 µg/g (USFDA 1990) for fish in interstate commerce, which is about an order of magnitude greater than the highest total DDT level (0.467 µg/g) detected in this study. The IJC (1988) adopted an objective of 1.0 µg/g for protection of piscivorous wildlife while Newell et al. (1987) recommended 0.2 µg/g for the same purpose. A total of 4.9% of the samples exceed the 10-5 cancer risk concentration for total DDT of 0.069 µg/g (USEPA 2000b). Site and species means were below all of these criteria.
The US action level for consumption of fish containing mirex is 0.1 µg/g (USFDA 1990). This limit has been consistently interpreted to include degradation products of mirex. One sample, a carp from the mouth of the Raquette River exceeds this value but does not exceed the Ontario Ministry of the Environment and Climate Change maximum guideline of 0.164 µg/g mirex and 0.031 µg/g photomirex to permit consumption of fish on a one meal per week basis for all populations (Bhavsar et al. 2011; Gandhi et al. 2015). In contrast, the International Joint Commission (1988) adopted the very stringent water quality objective that mirex should be absent from aquatic organisms, i.e., “…less than detection levels as determined by the best scientific methodology available." The 143 fish samples with detectable mirex exceed this objective. The objective may be difficult to achieve as the capability to detect chemical residues improves over time. For example, the analytical detection limit employed in studies by Sloan and Jock (1990) was 0.01 µg/g and in the current study was 0.002 µg/g, an 80 % reduction. Similarly, existing high-resolution instrumentation can shift the detection limit downward by another three orders of magnitude.
For total chlordane, the tolerance for fish in interstate commerce is 0.3 µg/g (USFDA 1990) whereas the 10-5 cancer risk level is 0.067 µg/g (USEPA 2000b). Newell et al. (1987) recommended 0.37 µg/g for protection of piscivorous fish from a 10-2 risk of cancer. The Canadian fish consumption advisory guideline for total chlordane consumption on a one meal per week basis is < 0.117 µg/g (Bhavsar et al. 2011). The 10-5 cancer risk concentration was the only criterion exceeded by one carp from Ogdensburg with 0.0735 µg/g total chlordane.
The lack of detection of most other organochlorine pesticides in this study makes comparison with corresponding regulatory or advisory criteria meaningless, except to say that concentrations, if present, of any of these analytes are substantially less than their corresponding regulatory or advisory criteria.
11
Other studies in the lower Great Lakes Several studies have been published that provide a basis for comparing current contaminant levels in fish from the St. Lawrence River with those of other Great Lakes or other regional waters.
Mercury
Nationwide, mercury concentrations in fish declined in most waters between 1969 and 1983 but no trends were evident from 1996 to 2005 (Chalmers et al. 2011). In Adirondack lakes mercury trends are variable but overall a 14% decline was observed (Simonin et l. 2009). Mercury levels in lake trout and walleye throughout the Great Lakes have generally declined from the mid-1970s through 2007 (Bhavsar et al. 2010). However, there was an inconsistent trend in Lake Ontario that suggests mercury levels over time have remained stable in walleye while declining in lake trout. Zananski et al. (2011) confirmed the declining trend for lake trout. However, Monson et al. (2011) showed mercury concentrations in Lake Ontario walleye initially declined but suggest mercury has reversed the trend beginning in the 1990's. From 1990 through 2006, Bhavsar et al. (2010) found mercury concentrations in walleye ranged from about 0.15 to 0.3 µg/g which is lower than observed for walleye from the St. Lawrence River and tributaries in 2012-2014 (Table 8). In addition, mercury concentrations in St. Lawrence River and tributary smallmouth bass and channel catfish were generally two to five times greater than mercury concentrations in the same species from eastern Lake Ontario (Li et al. 2014).
In the three tributaries, mercury concentrations in fish above and below impassable barriers were most often equivalent (Table 8). Simonin et al. (2008) examined mercury concentrations in fish from 10 lakes within the upper portions of the three tributary drainage basins. In most comparisons mercury levels were within 50% of those reported in this study although exceptions did occur. Subsequent data for six out of seven locations in the Raquette River basin (Table 19; NYSDEC unpublished data) were similar to fish above and at the mouth of the Raquette River, but Stark Falls Reservoir had approximately double the mercury levels in fish from the lower Raquette River.
On the opposite shore of the river, several former companies in Cornwall, Ontario, were sources for 95% of the mercury to the St. Lawrence River near Cornwall, Ontario. Among the mercury sources were a mercury cell chlor-alkali plant, a paper mill, a rayon manufacturer and a chemical producer (Lessard 2012). Mercury in sediments of the river from Cornwall to Lake St. Francis were spatially related to sources in Cornwall and concentrations in sediments were much lower along the south shore east of Massena (IJC 2003; Hodson et al. 2014). Historically, maximum mercury concentrations ranged from 16 to 34 µg/g (Richman and Dreier 2001; Delongchamp et al. 2009) but more recently have declined to 0.5 to 0.8 µg/g (Delongchamp et al. 2010; Hodson et al. 2014). Excessive mercury concentrations have been found in fish from the Cornwall area to Lake St. Francis on the river downstream of Massena (Choy et al. 2008; Fowlie et al. 2008; Hodson et al. 2014). While the flow of the river is the primary barrier to cross-channel movement of mercury, there is no barrier to fish movement. Further, mercury from Cornwall sources could be aerially transported to nearby localities on the St. Lawrence River when discharges and emissions were on-going and via evasion from the sediments to the water column and subsequently the air during and after cessation of mercury discharges (Lessard 2012). Therefore, the mercury levels observed in the current study could be partially derived from past releases from the Cornwall area.

12
These few studies, among numerous others, support the concept that mercury sources are more diverse rather than just localized to sources in or near the sampling areas. This is consistent with the evidence that aerial transport from a wide array of sources, many of which have been reduced dramatically by regulatory controls, have affected residues in local and regional environmental resources. Fossil-fueled power plants and boilers (37%) and artisanal and small-scale gold mining (25%) continue to be primary mercury emission sources to global environments although sources from production of non-ferrous metals, cement, large-scale gold operations, waste incineration, iron manufacturing and other smaller sources contribute mercury to global, regional and local environments (Pacyna et al. 2010, 2016; Sundseth et al. 2017). In the Great Lakes basin, regional U.S. sources contribute an average of about 25% of mercury followed by global transport from Asian sources (particularly China and India) as the second largest source contributing an average of 6% of total mercury (Cohen et al. 2004; Cohen et al. 2007; Pacyna et al. 2010; Driscoll et al. 2013). Obviously, about two-thirds of mercury inputs to the Great Lakes are unaccounted for by these two major sources. Natural sources, historical inputs and existing uncontrolled sources still exert a major effect on all environments.
PCBs
Monitoring PCB concentrations in fish from the Grasse River is a requirement of the remedial program for Alcoa West. Since the early 1990s, PCB concentrations have declined in fish from the Grasse River below Alcoa West, partly due to remedial activities on the facility site and to a lesser extent in the river. For 2011, PCB levels remain greater than desired with averages near Alcoa Outfall 001 at 0.9, 0.6 and 2.7 µg/g in smallmouth bass, brown bullhead and young-of-year spottail shiners, respectively (Alcoa 2012). PCB levels declined in smallmouth bass and spottail shiners at sampling stations downstream of Alcoa Outfall 001 to the mouth of the river, but in brown bullhead there were no significant differences between locations. In the one common species, smallmouth bass near the river mouth had 0.4 µg/g in Alcoa’s study, which closely approximates 0.47 µg/g PCBs in the current study (Table 11). These concentrations are above the IJC (1988) objective of 0.1 µg/g.
General Motors Powertrain (GM) conducted assessments of PCB concentrations in edible fish in 2008, 2012 and 2016 (Arcadis 2008, 2017). In 2008, average PCB levels in six species of fish from above the Moses Saunders Dam ranged from 0.012 to 0.18 µg/g which was similar to the PCB concentrations found in this study. In 2008, fish from an embayment adjacent to GM had average PCBs ranging from 0.11 to 2.82 µg/g, while average PCBs in four of six fish species from the tributary on the Franklin County line exceeded 2.0 µg/g (averages ranged from 0.31 to 4.90 µg/g) (Arcadis 2008). The sampling program was reduced to two primary species (i.e., smallmouth bass and brown bullhead) for 2012 and 2016. For 2012, average PCB concentrations (2.0 and 0.5 µg/g, respectively) approximated 2008 levels, about two to three-fold greater than concentrations in this study. In 2016, PCB concentrations increased in smallmouth bass four- to six-fold to an average of 13 µg/g for the tributary on the Franklin County line and to 14 µg/g in the GM embayment. Brown bullhead PCB levels increased 2.5-fold from 2008 to 5.0 µg/g in the tributary on the Franklin County line but did not change appreciably elsewhere (Arcadis 2017). The 2016 PCB concentrations (Arcadis 2017) are dramatically greater than the PCB concentrations noted in Table 11.
PCBs have been examined periodically in young-of-year fish from the St. Lawrence River and other Great Lakes waters in New York (Skinner and Jackling 1989; Skinner et al. 1994; Preddice et al. 2002; Preddice et al. 2006). The most recent assessment for the St. Lawrence River occurred in 2011-2012 (Paul et al. 2018). The mean of the median total PCB concentrations across species by location (Figure 7)

13
displayed a distribution pattern that closely approximates observations in edible fish species in this study (Figure 6). Greatest PCB concentrations, exceeding 2.0 µg/g, were in proximity to General Motors while 1.0 µg/g total PCB was exceeded downstream of Alcoa (West) on the Grasse River and above Alcoa East.
Mirex
In recent measurements, Li et al. (2014) showed Lake Ontario fish had equivalent or greater mirex concentrations than fish in the current study. Within the Laurentian Great Lakes system, mirex is a significant contaminant only in the lower Niagara River, Lake Ontario and the St. Lawrence River. Mirex declines of approximately 90% occurred in salmon and trout from Lake Ontario between 1975 and 2010, and both mirex and photomirex decreased by 75% between 1993 and 2010 (Gandhi et al. 2015). Gandhi et al. (2015) predicted future declines in mirex and photomirex would continue, which would permit unrestricted fish consumption within 15 years (i.e., by 2030). Within Gandhi et al. (2015) supplemental material, limited data were presented for mirex in fish from the St. Lawrence River during 2000-2011. Concentrations of mirex and photomirex reported for carp and smallmouth bass were similar to those in this study while other species, mostly minnows, had concentrations approximating the detection limits of 0.005 µg/g and 0.004 µg/g, respectively.
Relationship to Beneficial Use Impairments
The Massena/Akwesasne Area of Concern contains two beneficial use impairments that can be evaluated by this study, i.e.,
• restrictions on fish and wildlife consumption, and • transboundary impacts of contaminants.
Both impairments were caused by excessive concentrations of PCBs (NYSDEC 1995). While PCB concentrations have declined (Table 18) due to partial implementation of remedial measures, the data in Tables 10 and 11 indicate PCBs in some species of fish continue to exceed acceptable levels.
On the Raquette River, the Route 420 reference site is located about 12 miles above the mouth and has no impassable barrier in that river reach. PCB concentrations in fish from upstream tend to be lower than at the river mouth but in two of the three species for which statistical comparisons could be made, there were seldom significant spatial differences in total PCB concentrations (Table 12). The lack of consistent spatial differences suggests the reference location above the Route 420 bridge may be subject to migration of fish from the St. Lawrence River and the mouth of the Raquette River despite its distance from the river mouth.
Based on data reported here, the Saint Regis Mohawk Tribe at Akwesasne modified recommended dietary restrictions for fish. In 1986, the St. Regis Mohawk Environmental Health Department advised that women of childbearing age, infants and children under the age of 15 should not eat fish with elevated contaminant levels and noted that all fish from the St. Lawrence River should be considered contaminated. In 2014, the health advice was changed to the following (SRMT 2014):
People may consume Species
Up to 8 portions/month Brown trout, brook trout, yellow perch, bluegill, brown bullhead, rock bass, pumpkinseed, walleye < 18”

14
Up to 4 portions/month Chinook salmon, coho salmon, rainbow trout, brown trout from
the St. Lawrence River, largemouth bass < 18”, smallmouth bass < 18”, walleye > 18”, white sucker
Up to 1 portion/month Muskellunge, northern pike, channel catfish, largemouth bass >
18”, smallmouth bass > 18”, lake sturgeon Do not eat American eel, carp
Further, no fish should be consumed from the Grasse River downstream of the dam in Massena and downstream of the Massena Power Canal, and in the St. Lawrence River downstream of the Grasse River to Raquette Point. A fish portion is described as edible fish of about 3 to 4 ounces in weight, while health professionals generally recommend healthy adults should consume 6 to 8 ounces of fish per week (SRMT 2014).
The New York State Department of Health did not revise its existing health advisories for consumers of fish from the St. Lawrence River and its tributaries in response to the findings in this study.
While concentrations of mercury and mirex exceed environmental objectives of the Great Lakes Water Quality Agreement (IJC 1988), they were not included as a cause for listing in the Massena/Akwesasne Area of Concern. Mirex is a residual of production and environmental contamination caused by a former manufacturer in Niagara Falls, NY. Separate actions have been taken to reduce and eliminate sources of mirex to the extent possible, although residuals remain primarily within the sediments of Lake Ontario (Gandhi et al. 2015).
Mercury sources are diverse and include numerous sources throughout the United States and globally. Direct discharges of mercury to the Great Lakes were controlled or eliminated in the 1970s. Discharges of mercury in the Cornwall Area of Concern were eliminated in the 1990s and reductions in mercury residuals in sediments have been on-going. Further, national and international efforts, including the Minamata Convention on Mercury that entered into force on August 16, 2017, are being conducted to reduce or eliminate remaining mercury sources to the environment and subsequently reduce their impacts on fish, wildlife and people (Driscoll et al. 2013; United Nations Environment Programme 2017).
As discussed previously, trans-boundary impacts of mercury for the Area of Concern are believed to be minimal due to the limited potential for cross-river transport of mercury, primarily by fish migration. Trans-boundary impacts of PCB are minimal for similar reasons as evidenced by lack of a beneficial use impairment due to PCB for fish in the Cornwall, Ontario, Area of Concern (Environment Canada and Ontario Ministry of the Environment 2010).
RECOMMENDATIONS
Completion of remedial efforts to control PCB sources to the St. Lawrence River and its tributaries continue to be supported.
It is recommended that PCB concentrations in fish from locations in and around the Massena/Akwesasne Area of Concern be reassessed. The action is recommended because: 1) at the time of sample collection for this study the concentrations of PCBs in fish from the Massena/Akwesasne Area of Concern continued to exceed water quality objectives within the Great Lakes Water Quality Agreement; 2) the

15
removal or isolation of PCBs in the vicinity of and downstream of the three industrial facilities was incomplete; and 3) planning for and conduct of additional removal or isolation of PCBs is anticipated to be completed in 2025. While there will be a period of time for the ecosystem to readjust to the physical and chemical alterations imposed on the ecosystem by remedial efforts, planning for reassessment of PCB concentrations in fish of the Massena area should be conducted in 2018 with implementation planned in 2025 or 2026. Periodic, perhaps every five years, reassessment of PCB concentrations in fish should be conducted until the beneficial use impairment can be removed.
Analysis of total mercury should be included for continued long-term temporal assessment and to reflect on the potential for trans-boundary mercury contamination from the Canadian side of the river.
Finally, since organochlorine contaminants are at low or non-detectable concentrations, analysis for these chemical residues in fish may not be necessary. However, continuation of the long-term data base for these analytes may provide useful and beneficial information, particularly for temporal assessment purposes. Therefore, a limited assessment of these compounds should be considered and incorporated in the next assessment for the Area of Concern.
ACKNOWLEDGEMENTS
The authors are especially grateful that the U.S. Environmental Protection Agency provided funding for the conduct of the study (EPA grant number GL-97229201). NYSDEC fisheries staff and numerous members of the Mohawk community collected and provided fish samples for chemical analysis. All chemical analyses were performed by members of NYSDEC's Analytical Services Unit at the Hale Creek Field Station, Gloversville, NY, under the supervision of Anthony Gudlewski, lead chemist. Helpful comments on the manuscript which improved the technical content of the report were provided by Jesse Becker at NYSDEC, Jessica Jock and Jay Wilkins at SRMT, and Kathleen Skinner, Russell Sage College (retired).
16
REFERENCES CITED
6 NYCRR Part 182. Endangered and threatened species of fish and wildlife; species of special concern; incidental take permits. New York Codes Rules and Regulations, Title 6, Part 182.
Alcoa. 2012. 2011 Data Summary Report, Grasse River Study Area, Massena, New York. Alcoa, Inc.
Anderson, H.A., J.F. Amrhein, P. Shubat, and J. Hesse. 1993. Protocol for a uniform Great Lakes sport fish consumption advisory. Great Lakes Sport Fish Advisory Task Force. Available at: www.health.state.mn.us/divs/eh/fish/consortium/pastprojects/pcbprotocol.pdf.
ARCADIS. 2008. General Motors Powertrain Site, Massena, New York. Results of the 2008 fish collection activities to evaluate fish consumption advisory in remediated cove, St. Lawrence River. Available at: https://p.enfos.com/publicdocs/33182/38cf7ed3-e4a8-4cdf-a158.
ARCADIS. 2017. Racer Trust (former General Motors Powertrain) Superfund Site, Massena, New York. Results of 2016 St. Lawrence River fish collection activities. Arcadis of New York, Inc., Syracuse, NY.
Bache, C.A., W.H. Gutenmann, and D.J. Lisk. 1971. Residues of total mercury and methylmercuric salts in lake trout as a function of age. Science 172:951-952.
Bentzen, E., D. Mackay, B.E. Hickle, and D.R.S. Lean. 1999. Temporal trends of polychlorinated biphenyls (PCBs) in Lake Ontario fish and invertebrates. Environ. Rev. 7:203-223.
Bhavsar, S.P., E. Awad, C.G. Mahon, and S. Petro. 2011. Great Lakes fish consumption advisories: is mercury a concern? Ecotoxicology 20:1588-1598. doi: 10.1007/s10646-011-0731-0.
Bhavsar, S.P., S.B. Gewurtz, D.J. McGoldrick, M.J. Keir, and S.M. Backus. 2010. Changes in mercury levels in Great Lakes fish between 1970s and 2007. Environ. Sci. Technol. 44:3273-3279. doi: 10.1021/es903874x. Bhavsar, S.P., D.A. Jackson, A. Hayton, E.J. Reiner, T. Chen, and J. Bodnar. 2007. Are PCB levels in fish from the Canadian Great Lakes still declining? J. Great Lakes Res. 33:592-605. doi: 10.3394/0384-1330(2007)33(592:APLIFF]2.0.CO;2.
Bloom, N. 1992. On the chemical form of mercury in edible fish and marine invertebrate tissue. J. Fish. Aquat. Sci. 49:1010-1017. doi: 10.1139/f92-113.
Borgmann, U. and D.M. Whittle. 1991. Contaminant concentration trends in Lake Ontario lake trout (Salvelinus namaycush): 1977-1988. J. Great Lakes Res. 17:368-381.
Chalmers, A., D.M. Argue, D.A. Gay, and D.L. Lorenz. 2011. Mercury trends in fish from rivers and lakes in the United States, 1969 - 2005. Environ. Monit. Assess. 175:175-191.
Chang, F., J.J. Pagano, B.S. Crimmins, M.S. Milligan, X. Xia, P.K. Hopke, and T.M. Holsen. 2012. Temporal trends of polychlorinated biphenyls and organochlorine pesticides in Great Lakes fish, 1999-2009. Sci. Total Environ. 439:284-290.
Choy, E.S., P.V. Hodson, L.M. Campbell, A.R. Fowlie, and J. Ridal. 2008. Spatial and temporal trends in mercury concentrations in young-of-the-year spottail shiners (Notropis hudsonius) in the St. Lawrence River at Cornwall, ON. Arch. Environ. Contam. Toxicol. 54:473-481.
17
Chu, S., A. Covaci, S. Voorspoel, and P. Schapa. 2003. The distribution of octachlorostyrene (OCS) in environmental samples in Europe. J. Environ. Monit. 5:619-625. doi: 10.1039/B304364A. Cohen, M., R. Artz, R. Draxler, P.Miller, L. Poissant, D. Niemi, D. Ratté, M. Deslauries, R. Duval, R. Laurin, J. Slotnick, T. Nettesheim, and J. McDonald. 2004. Modeling the atmospheric transport and deposition of mercury to the Great Lakes. Environ. Res. 95:247-265.
Cohen, M.D., R.S. Artz, and R.R. Draxler. 2007. Report to Congress: Mercury contamination in the Great Lakes. National Oceanic and Atmospheric Administration.
Conover, W.J. 1980. Practical nonparametric statistics, second edition. John Wiley & Sons, Inc.
de Lafontaine Y., P. Gagnon, and B. Côté. 2010. Abundance and individual size of American eel (Anguilla rostrata) in the St. Lawrence River over the past four decades. Hydrobiologia 647:185–198. doi: 10.1007/s10750-009-9850-5. DeVault, D.S., R.J. Hesselberg, P.W. Rodgers, and T.J. Feist. 1996. Contaminant trends in lake trout and walleye from the Laurentian Great Lakes. J. Great Lakes Res. 22:884-895. Delongchamp, T.M., D.R.S. Lean, J.J. Ridal, and J.M. Blais. 2009. Sediment mercury dynamics and historical trends of mercury deposition in the St. Lawrence River area of concern for Cornwall, Ontario, Canada. Sci. Total Environ. 407:4095-4104. Delongchamp, T.M., J.J. Ridal, D.R.S. Lean, L. Poissant, and J.M. Blais. 2010. Mercury transport between sediments and the overlying water of the St. Lawrence area of concern near Cornwall, Ontario. Environ. Pollut. 158:1487-1493. Driscoll, C.T., R.P. Mason, H.M. Chan, D.J. Jacob, and N. Pirrone. 2013. Mercury as a global pollutant: sources, pathways, and effects. Environ. Sci. Technol. 47:4967-4983. doi: 10.1021/es305071v. Environment Canada and Ontario Ministry of the Environment. 2010. St. Lawrence Area of Concern Canadian Section Status of Beneficial Use Impairments. Available at: www.ijc.org/files/publications/StLawrenceRiverAreaOfConcernStatusOfBeneficialUseImpairments.pdf. Fowlie, A.R., P.V. Hodson, and M.B.C. Hickey. 2008. Spatial and seasonal patterns of mercury concentrations in fish from the St. Lawrence River at Cornwall, Ontario: implications for monitoring. J. Great Lakes Res. 34:72-85. doi: 10.3394/0380-1330(2008)34[72:SASPOM]2.0.CO;2 Gandhi, N., R.W.K. Tang, S.P. Bhavsar, E.J. Reiner, D. Morse, G.B. Arhonditsis, K. Drouillard, and T. Chen. 2015. Is mirex still a contaminant of concern for the North American Great Lakes? J. Great Lakes Res. 41:1114-1122. doi: 10.1016/j.jglr.2015.09.015. Gewurtz, S.B., S.P. Bhavsar, and R. Fletcher. 2011. Influence of fish size and sex on mercury/PCB concentration: importance for fish consumption advisories. Environ. Int. 37:425-434. doi: 10.1016/j.envint.2010.11.005. Great Lakes Fish Advisory Workgroup. 2007. Protocol for mercury-based fish consumption advice: An addendum to the 1993 protocol for a uniform Great Lakes sport fish consumption advisory. Great Lakes Consortium. Available at: http://www.health.state.mn.us/divs/eh/fish/consortium/pastprojects/mercuryprol.pdf.

18
Herdendorf, C.E. 1990. Great Lakes estuaries. Estuaries 13:493-503. Hickey, J.P., S.A. Batterman, and S.M. Chernyak. 2006. Trends of chlorinated organic contaminants in Great Lakes trout and walleye from 1970 to 1998. Arch. Environ. Contam. Toxicol. 50:97-110. doi: 10.1007/s00244-005-1007-6. Hodson, P.V., K. Norris, M. Berquist, L.M. Campbell, and J.J. Ridal. 2014. Mercury concentrations in amphipods and fish of the St. Lawrence River (Canada) are unrelated to concentrations of legacy mercury in sediments. Sci. Total Environ. 494-495:218-228. doi: 10.1016/j.scitotenv.2014.06.137. Huestis, S., M.R. Servos, D.M. Whittle, and D.G. Dixon. 1996. Temporal and age-related trends in levels of polychlorinated biphenyl congeners and organochlorine contaminants in Lake Ontario lake trout (Salvelinus namaycush). J. Great Lakes Res. 22:310-330. doi: 10.1016/S0380-1330(96)70958-9. IJC. 1988. Revised Great Lakes Water Quality Agreement of 1978 as amended by Protocol signed November 18, 1987. International Joint Commission, United States and Canada. IJC. 2003. St. Lawrence River Area of Concern status assessment submitted to the governments of the United States and Canada. International Joint Commission, United States and Canada. Kaminsky, R., and R.A. Hites. 1984. Octachlorostyrene in Lake Ontario: sources and fates. Environ. Sci. Technol. 18:275-279. doi: 10.1021/es00122a013. Lessard, C. 2012. Mass balance model of mercury for the St. Lawrence River, Cornwall, Ontario. M.Sc. Thesis, Ottawa-Carleton Institute of Biology and University of Ottawa. Li, X., W. Richter, and L.C. Skinner. 2014. Xenobiotics in fish from Lake Erie, the Niagara River, Cayuga Creek and Lake Ontario, New York. Division of Fish, Wildlife and Marine Resources, NY State Department of Environmental Conservation, Albany NY. 95 p. Available at: http://www.dec.ny.gov/docs/fish_marine_pdf/xenobiofish2014.pdf. Monson, B.A., D.F. Staples, S.P. Bhavsar, T.M. Holsen, and K.A. Williams. 2011. Spatiotemporal trends of mercury in walleye and largemouth bass from the Laurentian Great Lakes region. Ecotoxicology 20:1555-1567. Newell, A.J., D.J. Johnson, and L. K. Allen. 1987. Niagara River Biota Contamination Project: fish flesh criteria for piscivorous wildlife. Tech. Rep. 87-3. Division of Fish and Wildlife, NY State Department of Environmental Conservation, Albany, NY. 182 p. Available at: http://www.dec.ny.gov/docs/wildlife.pdf/niagarabiotacontamproj.pdf. NYSDEC. 1978. Toxic substances in fish and wildlife: 1977 annual report. Volume 1. Tech Rep. 78-1(BEP). Division of Fish and Wildlife, New York State Department of Environmental Conservation, Albany, NY. 53 p. NYSDEC. 1979. Toxic substances in fish and wildlife: 1978 annual report. Volume 2. Tech Rep. 79-1(BEP). Division of Fish and Wildlife, New York State Department of Environmental Conservation, Albany, NY. 52 p. NYSDEC. 1990. News release number 90-101 dated April 26, 1990 regarding elevated PCBs in fish from the St. Lawrence and Grasse Rivers and resulting fish consumption advisories. NY State Department of Environmental Conservation, Albany, NY. 3 p.
19
NYSDEC. 1995. St. Lawrence River at Massena, New York Remedial Action Plan 1995 Update. Division of Water, NY State Department of Environmental Conservation, Albany, NY. NYSDEC. 2014. SOP PrepLab4 (5-28-2014). Prep Lab Standard Operating Procedure. New York State Department of Environmental Conservation, Gloversville, NY. 3 p. NYSDOH. 1995. Health risk assessment for the Akwesasne Mohawk population from exposure to chemical contaminants in fish and wildlife. Bureau of Toxic Substances Assessment, NY State Department of Health, Albany, NY. NYSDOH. 2017. Health advice on eating sportfish and game. NY State Department of Health, Albany, NY. 44 p. Pacyna, E.G., J.M. Pacnya, K. Sundseth, J. Munthe, K. Kindbom, S. Wilson, F. Steenhuisen, and P. Maxson. 2010. Global emission of mercury to the atmosphere from anthropogenic sources in 2005 and projections to 2020. Atmospheric Environ. 44:2487-2499. Pacyna, J.M., O. Travnikov, F. De Simone, I.M. Hedgecock, K. Sundseth, E.G. Pacyna, F. Steenhuisen, N. Pirrone, J. Munthe, and K. Kindbom. 2016. Current and future levels of mercury atmospheric pollution on a global scale. Atmos. Chem. Phys. 16:12495-12511. Paul, E.A., W. Richter, and L.C. Skinner. 2018. PCBs and organochlorine pesticide residues in young-of-year fish from new and traditional near-shore sampling areas in the eastern portion of New York State’s Great Lakes basin, 2011 and 2012. Division of Fish and Wildlife, New York State Department of Environmental Conservation, Albany, NY. Preddice, T.L., S.J. Jackling, and L.C. Skinner. 2002. Contaminants in young-of-the-year fish from near-shore areas of New York’s Great Lakes basin, 1997. Division of Fish, Wildlife and Marine Resources, New York State Department of Environmental Conservation, Gloversville, NY. 234 p. Preddice, T.L., L.C. Skinner, and A.J. Gudlewski. 2006. PCBs and organochlorine pesticides residue in young-of-the-year fish from traditional near-shore sampling areas, NYS’s Great Lakes basin, 2003. Division of Fish, Wildlife and Marine Resources, New York State Department of Environmental Conservation, Gloversville, NY. 68 p. Richman, L.A., and S.I. Dreier. 2001. Sediment contamination in the St. Lawrence River along the Cornwall, Ontario waterfront. J. Great Lakes Res. 27:60-83. Salamova, A., J.J. Pagano, T.M. Holsen, and R.A. Hites. 2013. Post-1990 temporal trends of PCBs and organochlorine pesticides in the atmosphere and in fish from Lakes Erie, Michigan, and Superior. Environ. Sci. Technol. 47:9109-9014. doi: 10.1021/es401895g. Shimshack, J.P., and M.B. Ward. 2010. Mercury advisories and household health trade-offs. J. Health Econ. 29:674-685. doi: 10.1016/j.jhealeco.2010.05.001. Simonin, H., J. Loukmas, L. Skinner, and K. Roy. 2008. Strategic monitoring of mercury in New York State fish. NYSERDA Report 08-11. New York State Energy Research and Development Authority, Albany, NY. Available at: http://www.dec.ny.gov/docs/wildlife_pdf/hgfish.pdf.
20
Simonin, H.A., J.L. Loukmas, L.C. Skinner, K.M. Roy, and E.A. Paul. 2009. Trends in mercury concentrations in New York State fish. Bull. Environ. Contam. Toxicol. 83:214-218. Skinner, L.C. 1992. Chemical contaminants in wildlife from the Mohawk Nation at Akwesasne and the vicinity of the General Motors Corporation/Central Foundry Division Massena, New York plant. Tech. Rep. 92-4(BEP). Division of Fish and Wildlife, New York State Department of Environmental Conservation, Albany, NY. 113 p. Skinner, L.C., and S.J. Jackling. 1989. Chemical contaminants in young-of-the-year fish from New York’s Great Lakes basin 1984 through 1987. Tech. Rep. 89-1. Division of Fish and Wildlife, New York State Department of Environmental Conservation, Albany, NY. Skinner, L.C., S.J. Jackling, and R.W. Karcher, Jr. 1994. Identification of and changes in chemical contaminant levels in young-of-the-year fish from New York’s Great Lakes basin. Tech Rep. 94-4. Division of Fish and Wildlife, New York State Department of Environmental Conservation, Albany, NY. 44 p. Sloan, R. 1981. Toxic substances in fish and wildlife: 1979 and 1980 annual reports. Volume 4, number 1. Tech Rep. 81-1(BEP). Division of Fish and Wildlife, New York State Department of Environmental Conservation, Albany, NY. 138 p. Sloan, R., R. Bauer, and M. Schantz. 2007. Development of Hudson River fish reference material (HRMs) for PCB analysis quality assurance/quality control purposes. NY State Department of Environmental Conservation, Albany, NY. Sloan, R.J., and K. Jock. 1990. Chemical contaminants in fish from the Mohawk Nation at Akwesasne and the vicinity of the General Motors Corporation/Central Foundry Division Massena, New York plant. Tech. Rep. 90-1(BEP). Division of Fish and Wildlife, New York State Department of Environmental Conservation, Albany, NY. 96 p. Sloan, R., E. O’Connell, and R. Diana. 1987. Toxic substances in fish and wildlife: analyses since May 1, 1982. Volume 6. Tech Rep. 87-4. Division of Fish and Wildlife, New York State Department of Environmental Conservation, Albany, NY. 182 p. Somers, K.M., and D.A. Jackson. 1993. Adjusting mercury concentration for fish-size covariation: a multivariate alternative to bivariate regression. Can. J. Fish. Aquat. Sci. 50:2388-2396. Sonesten, L. 2003. Fish mercury levels in lakes – adjusting for mercury and fish-size covariation. Environ. Pollut. 125:255-265. ` Spagnoli, J.J., and L.C. Skinner. 1977. PCB’s in fish from selected waters of New York State. Pestic. Monit. J. 11:69-87. SRMEHD. 1986. Mohawk Health Services fish consumption recommendations. Saint Regis Mohawk Environmental Health Department. SRMT. 2014. Akwesasne family guide to eating locally-caught fish. Environment Division, Saint Regis Mohawk Tribe, Akwesasne, NY. 7 p. Available at: srmt-nsn.gov/_uploads/site_files/FishAdvisory_WebFinal.pdf.
21
Sundseth, K., J.M. Pacyna, E.G. Pacyna, N. Pirrone, and R. Thorne. 2017. Global sources and pathways of mercury in the context of human health. Int. J. Environ. Res. Public Health 14:105. United Nations Environment Programme. 2017. Minamata Convention on Mercury. Text and Annexes. Available at: mercuryconvention.org/Portals/11/documents/Booklets/COP1%20version/Minamata-Convention-booklet-eng-full.pdf. USEPA. 1991. Method 245.6. Determination of mercury in tissues by cold vapor atomic absorption spectrometry, Revision 2.3. U.S. Environmental Protection Agency, Washington, DC. USEPA. 1992. Superfund Record of Decision: General Motors/Central Foundry Division, NY. EPA/ROD/R02-92/170. U.S. Environmental Protection Agency, Washington, DC. USEPA. 2000a. Guidance for assessing chemical contaminant data for use in fish advisories, Volume 1, 3rd edition. EPA-823-B-00-007. U.S. Environmental Protection Agency, Washington, DC. USEPA. 2000b. Guidance for assessing chemical contaminant data for use in fish advisories, Volume 2: Risk assessment and fish consumption limits, 3rd edition. EPA-823-B-00-008. U.S. Environmental Protection Agency, Washington, DC. USEPA. 2001. Water quality criteria: Notice of availability of water quality criterion for the protection of human health: Methylmercury. U.S. Environmental Protection Agency, Washington, D.C. Fed. Reg. 66(5):1344-1359. USEPA. 2003. Breaking the Cycle: 2001-2002 PBT Program Accomplishments. U.S. Environmental Protection Agency, Washington, DC. USEPA. 2006. Draft guidance for implementing the January 2001 methylmercury water quality criterion. EPA 823-B-04-001. U.S. Environmental Protection Agency, Washington, D.C. USEPA. 2010. Guidance for implementing the January 2001 methylmercury water quality criterion. EPA 823-R-10-001. U.S. Environmental Protection Agency, Washington, DC. USEPA. 2013. 2011 National Listing of Fish Advisories. EPA-820-F-13-058. U.S. Environmental Protection Agency, Washington, DC. Available at: www.epa.gov/fish-tech/national-listing-fish-advisories. USFDA (U.S. Food and Drug Administration). 1973. 42 FR 17487-17488. USFDA (U.S. Food and Drug Administration). 1984a. Action level for methyl mercury in fish; availability of compliance policy guide. 49 FR 45663. USFDA (U.S. Food and Drug Administration). 1984b. Polychlorinated biphenyls (PCBs) in fish and shellfish; reduction of tolerances; final decision. 49 FR 21514-21520. USFDA (U.S. Food and Drug Administration). 1990. Action levels for residues of certain pesticides in food and feed. 55 FR 14359-14363. Wiener, J.G., D.C. Evers, D.A. Gay, H.A. Morrison, and K.A. Williams. 2012. Mercury contamination in the Laurentian Great Lakes region: Introduction and overview. Environ. Pollut. 161:243-251. doi: 10.1016/j.envpol.2011.08.051.

22
Wiener, J.G., and D.J. Spry. 1996. Toxicological significance of mercury in freshwater fish. In: Environmental Contaminants in Wildlife: Interpreting Tissue Concentrations. Beyer, W.N., G.H. Heinz and A.W. Redmon-Norwood (Eds.), Lewis Publishers, Boca Raton, FL. Yanagiba, Y., Y. Ito, M. Kamijima, F.J. Gonzalez, and T. Nakajima. 2009. Octachlorostyrene induces cytochrome P450, UDP-glucoronosultransferase, and sulfotransferase via the aryl hydrocarbon receptor and constitutive androstane receptor. Toxicol. Sci. 111:19-26. doi: 10.1093/toxsci/kpf130. Zananski, T.J., T.M. Holsen, P.K. Hopke, and B.S. Crimmins. 2011. Mercury temporal trends in top predator fish of the Laurentian Great Lakes. Ecotoxicology 20:1568-1576.
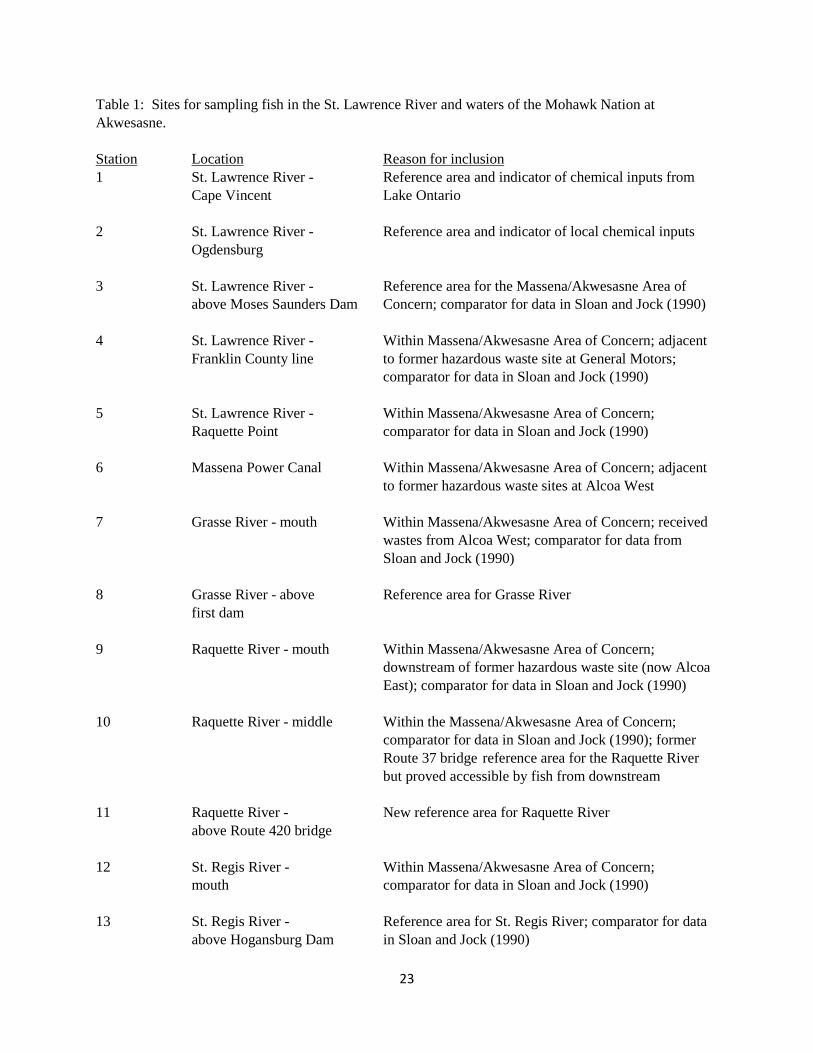
23
Table 1: Sites for sampling fish in the St. Lawrence River and waters of the Mohawk Nation at Akwesasne. Station Location Reason for inclusion 1 St. Lawrence River - Reference area and indicator of chemical inputs from Cape Vincent Lake Ontario 2 St. Lawrence River - Reference area and indicator of local chemical inputs Ogdensburg 3 St. Lawrence River - Reference area for the Massena/Akwesasne Area of above Moses Saunders Dam Concern; comparator for data in Sloan and Jock (1990) 4 St. Lawrence River - Within Massena/Akwesasne Area of Concern; adjacent Franklin County line to former hazardous waste site at General Motors; comparator for data in Sloan and Jock (1990) 5 St. Lawrence River - Within Massena/Akwesasne Area of Concern;
Raquette Point comparator for data in Sloan and Jock (1990) 6 Massena Power Canal Within Massena/Akwesasne Area of Concern; adjacent
to former hazardous waste sites at Alcoa West 7 Grasse River - mouth Within Massena/Akwesasne Area of Concern; received wastes from Alcoa West; comparator for data from Sloan and Jock (1990) 8 Grasse River - above Reference area for Grasse River first dam 9 Raquette River - mouth Within Massena/Akwesasne Area of Concern;
downstream of former hazardous waste site (now Alcoa East); comparator for data in Sloan and Jock (1990)
10 Raquette River - middle Within the Massena/Akwesasne Area of Concern;
comparator for data in Sloan and Jock (1990); former Route 37 bridge reference area for the Raquette River but proved accessible by fish from downstream
11 Raquette River - New reference area for Raquette River above Route 420 bridge 12 St. Regis River - Within Massena/Akwesasne Area of Concern; mouth comparator for data in Sloan and Jock (1990) 13 St. Regis River - Reference area for St. Regis River; comparator for data above Hogansburg Dam in Sloan and Jock (1990)
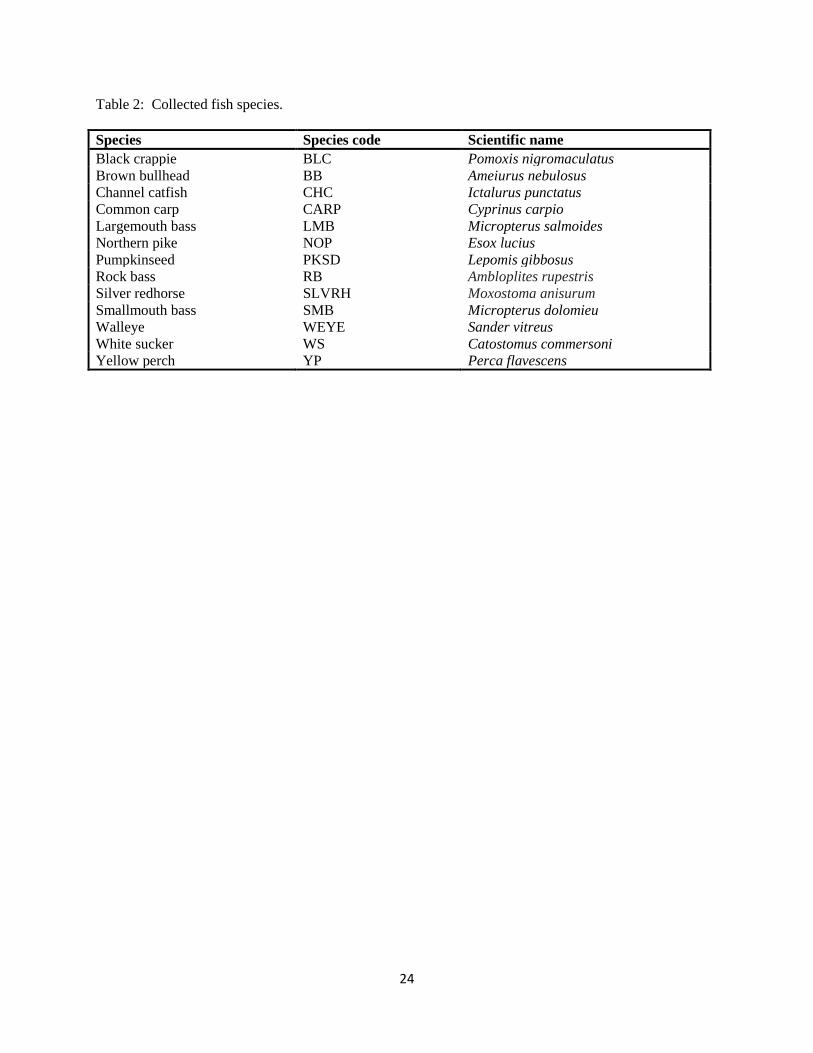
24
Table 2: Collected fish species. Species Species code Scientific name Black crappie BLC Pomoxis nigromaculatus Brown bullhead BB Ameiurus nebulosus Channel catfish CHC Ictalurus punctatus Common carp CARP Cyprinus carpio Largemouth bass LMB Micropterus salmoides Northern pike NOP Esox lucius Pumpkinseed PKSD Lepomis gibbosus Rock bass RB Ambloplites rupestris Silver redhorse SLVRH Moxostoma anisurum Smallmouth bass SMB Micropterus dolomieu Walleye WEYE Sander vitreus White sucker WS Catostomus commersoni Yellow perch YP Perca flavescens

25
Table 3: Numbers of fish collected and analyzed for each sample site1.
Species
St. Lawrence River Massena Power Canal
Grasse River Raquette River St. Regis River
Total Cape Vincent Ogdensburg
Above Moses
Saunders Dam
Franklin County
line
Raquette Point
Above dam Mouth
Above Route 420
Middle Mouth Above dam Mouth
BB 4 12 9 9 11 6 2 10 5 10 78 BLC 1 1 CARP 15 12 12 4 8 1 10 5 9 10 86 CHC 2 3 10 10 2 10 11 48 LMB 4 4 1 9 NOP 15 1 1 17 PKSD 1 1 RB 15 15 30 SLVRH 1 3 9 1 1 10 25 SMB 9 15 4 10 10 2 6 11 3 4 11 11 14 110 WEYE 15 15 6 10 9 10 10 3 10 2 10 100 WS 1 1 3 3 8 YP 15 15 11 16 9 10 12 1 2 9 100 Total 73 101 50 52 57 8 43 53 19 6 55 32 64 613
1 Highlighted areas are within the International Joint Commission’s Area of Concern at Massena/Akwesasne.
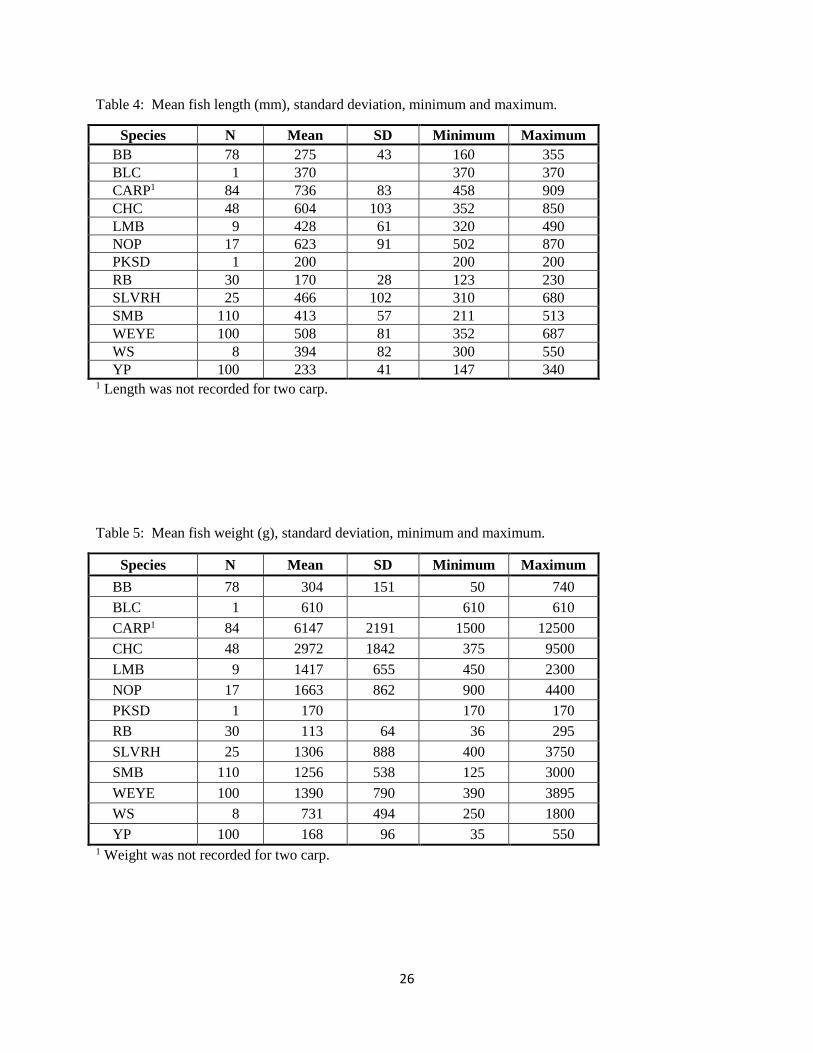
26
Table 4: Mean fish length (mm), standard deviation, minimum and maximum.
Species N Mean SD Minimum Maximum BB 78 275 43 160 355 BLC 1 370 370 370 CARP1 84 736 83 458 909 CHC 48 604 103 352 850 LMB 9 428 61 320 490 NOP 17 623 91 502 870 PKSD 1 200 200 200 RB 30 170 28 123 230 SLVRH 25 466 102 310 680 SMB 110 413 57 211 513 WEYE 100 508 81 352 687 WS 8 394 82 300 550 YP 100 233 41 147 340
1 Length was not recorded for two carp.
Table 5: Mean fish weight (g), standard deviation, minimum and maximum.
Species N Mean SD Minimum Maximum BB 78 304 151 50 740 BLC 1 610 610 610 CARP1 84 6147 2191 1500 12500 CHC 48 2972 1842 375 9500 LMB 9 1417 655 450 2300 NOP 17 1663 862 900 4400 PKSD 1 170 170 170 RB 30 113 64 36 295 SLVRH 25 1306 888 400 3750 SMB 110 1256 538 125 3000 WEYE 100 1390 790 390 3895 WS 8 731 494 250 1800 YP 100 168 96 35 550
1 Weight was not recorded for two carp.

27
Table 6: Detection limits and percent of samples with detections for mercury, PCBs and organochlorine pesticides.
Analyte Method
detection limit (µg/g)
% Detections1
Mercury 0.0052 100 PCB Aroclor 1242 0.010 62 PCB Aroclor 1254/1260 0.030 62 Total PCB na2 70 p,p'-DDE 0.002 58 o,p'-DDE 0.005 0 p,p'-DDD 0.002 20 o,p'-DDD 0.015 0 p,p'-DDT 0.002 21 o,p'-DDT 0.005 0 Total DDT na 58 Hexachlorobenzene 0.002 0 Oxychlordane 0.005 0 trans-chlordane 0.005 <1 cis-chlordane 0.005 <1 trans-nonachlor 0.005 3 cis-nonachlor 0.005 2 Total chlordane na 3 Dieldrin 0.025 0 Aldrin 0.005 0 Mirex 0.002 24 Photomirex 0.005 5 Total mirex na 24 Heptachlor 0.005 0 Heptachlor epoxide 0.010 0 α-hexachlorocyclohexane 0.005 0 β-hexachlorocyclohexane 0.005 0 γ-hexachlorocyclohexane 0.005 0 Octachlorostyrene 0.005 0
1 n = 613 samples. 2 na = not applicable.

28
Table 7: Lipids (percent wet weight) in fish by location. Highlighted locations are within the International Joint Commission's Area of Concern at Massena/Akwesasne.
Location Species N Mean SD1 Minimum Maximum St. Lawrence River - Cape Vincent
BB 4 2.59 1.18 1.47 4.00 CARP 15 8.48 4.57 2.74 18.04 RB 15 1.79 0.36 1.18 2.29 SMB 9 2.91 1.72 0.78 6.49 WEYE 15 3.09 1.13 1.32 5.19 YP 15 1.22 0.31 0.54 1.73
St. Lawrence River - Ogdensburg
BB 12 1.28 0.64 0.59 2.57 CARP 12 7.96 3.20 2.77 12.65 CHC 2 8.49 6.52 3.88 13.10 NOP 15 0.41 0.23 0.090 0.91 RB 15 1.25 0.62 0.41 2.69 SMB 15 3.27 1.42 1.74 7.67 WEYE 15 1.50 0.58 0.55 2.46 YP 15 1.03 0.23 0.66 1.37
St. Lawrence River - Above Moses Saunders Dam
BB 9 1.40 0.61 0.49 2.42 CARP 12 7.34 4.70 2.37 16.72 CHC 3 9.29 3.97 6.61 13.85 LMB 4 2.76 1.67 1.02 4.54 SLVRH 1 8.58 8.58 8.58 SMB 4 3.92 0.58 3.13 4.42 WEYE 6 1.56 0.51 1.03 2.44 YP 11 0.78 0.22 0.47 1.10
St. Lawrence River - Franklin-St. Lawrence County line
BB 9 0.77 0.22 0.50 1.23 CARP 4 6.63 3.97 3.47 12.29 SLVRH 3 2.00 1.76 0.74 4.01 SMB 10 3.49 0.92 2.00 5.08 WEYE 10 1.97 1.00 1.11 4.16 YP 16 0.65 0.18 0.41 1.04
St. Lawrence River - Raquette Point
BB 11 1.09 0.51 0.51 2.26 CARP 8 8.78 5.15 1.51 15.69 CHC 10 13.89 5.30 2.92 19.89 SMB 10 2.60 1.40 0.65 4.55 WEYE 9 1.52 0.45 0.77 2.03 YP 9 0.59 0.16 0.37 0.84
Massena Power Canal
CARP 1 11.18 11.18 11.18 LMB 4 2.11 0.66 1.33 2.89 SMB 2 0.97 0.085 0.91 1.03 WS 1 2.96 2.96 2.96

29
Table 7 continued. Location Species N Mean SD1 Minimum Maximum Grasse River - Above dam
BB 6 0.93 0.20 0.61 1.21 LMB 1 0.90 0.90 0.90 SLVRH 9 1.50 0.68 0.43 2.59 SMB 6 1.58 0.47 0.85 2.09 WEYE 10 0.75 0.60 0.25 1.89 WS 1 0.45 0.45 0.45 YP 10 0.63 0.11 0.42 0.79
Grasse River - Mouth
CARP 10 7.08 6.19 1.50 18.45 CHC 10 10.51 4.23 3.66 16.92 SMB 11 3.72 1.30 1.95 5.79 WEYE 10 2.00 1.34 0.48 4.49 YP 12 0.66 0.14 0.39 0.92
Raquette River - Above Route 420
BB 2 0.83 0.32 0.60 1.05 CARP 5 4.70 0.80 3.61 5.61 NOP 1 1.47 1.47 1.47 SLVRH 1 5.79 5.79 5.79 SMB 3 0.78 0.17 0.66 0.97 WEYE 3 0.52 0.18 0.36 0.71 WS 3 1.00 0.36 0.78 1.42 YP 1 0.61 0.61 0.61
Raquette River - Middle
CHC 2 11.64 0.035 11.61 11.66 SMB 4 2.77 0.58 2.23 3.56
Raquette River - Mouth
BB 10 1.08 0.49 0.56 2.28 BLC 1 1.72 1.72 1.72 CARP 9 7.10 4.15 1.28 14.37 CHC 10 12.35 5.20 3.15 18.46 PKSD 1 0.41 0.41 0.41 SLVRH 1 5.14 5.14 5.14 SMB 11 3.18 1.36 1.20 5.42 WEYE 10 1.66 1.09 0.20 3.86 YP 2 0.55 0.049 0.51 0.58
St. Regis River - Above dam
BB 5 1.62 0.46 1.31 2.43 NOP 1 0.98 0.98 0.98 SLVRH 10 0.96 0.46 0.28 1.68 SMB 11 1.91 0.84 0.82 3.36 WEYE 2 0.43 0.13 0.34 0.52 WS 3 0.79 0.58 0.33 1.45
St. Regis River - Mouth
BB 10 2.61 1.04 1.32 4.40 CARP 10 5.98 3.68 2.18 11.58 CHC 11 20.31 4.64 10.87 26.79 SMB 14 3.81 1.51 1.90 7.03 WEYE 10 1.77 0.47 0.99 2.36 YP 9 0.65 0.19 0.44 1.02
1 SD = Standard deviation.
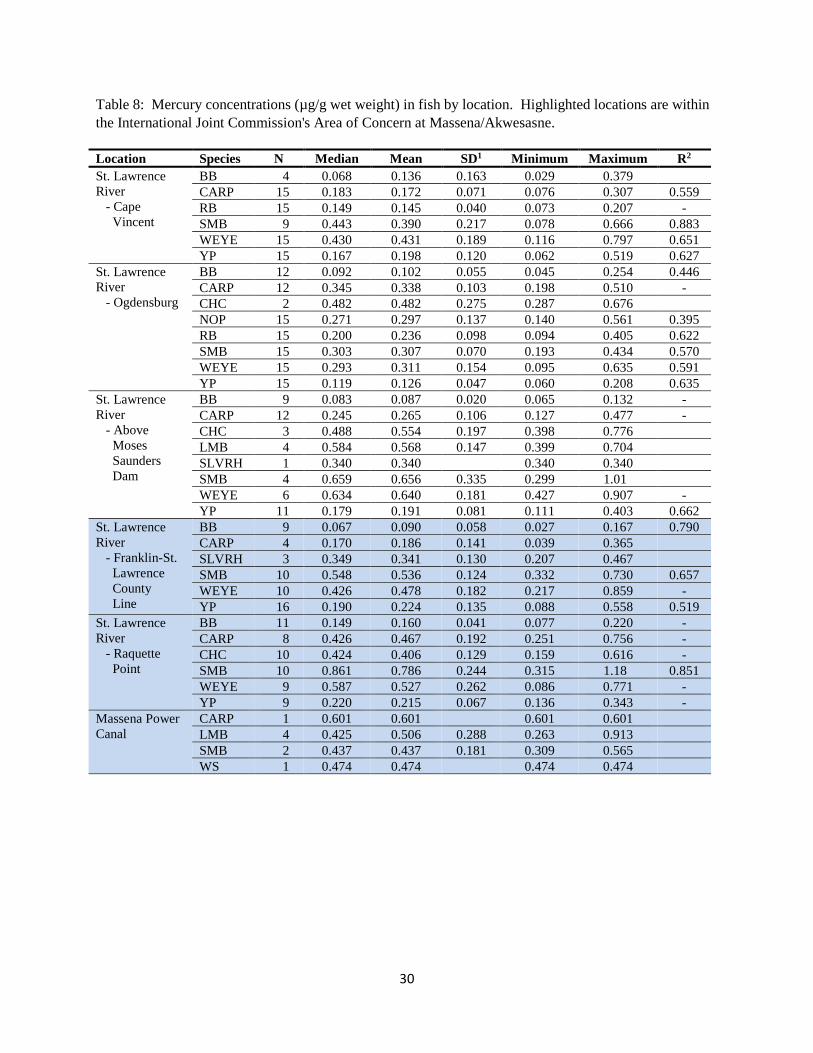
30
Table 8: Mercury concentrations (µg/g wet weight) in fish by location. Highlighted locations are within the International Joint Commission's Area of Concern at Massena/Akwesasne. Location Species N Median Mean SD1 Minimum Maximum R2
St. Lawrence River - Cape Vincent
BB 4 0.068 0.136 0.163 0.029 0.379 CARP 15 0.183 0.172 0.071 0.076 0.307 0.559 RB 15 0.149 0.145 0.040 0.073 0.207 - SMB 9 0.443 0.390 0.217 0.078 0.666 0.883 WEYE 15 0.430 0.431 0.189 0.116 0.797 0.651 YP 15 0.167 0.198 0.120 0.062 0.519 0.627
St. Lawrence River - Ogdensburg
BB 12 0.092 0.102 0.055 0.045 0.254 0.446 CARP 12 0.345 0.338 0.103 0.198 0.510 - CHC 2 0.482 0.482 0.275 0.287 0.676 NOP 15 0.271 0.297 0.137 0.140 0.561 0.395 RB 15 0.200 0.236 0.098 0.094 0.405 0.622 SMB 15 0.303 0.307 0.070 0.193 0.434 0.570 WEYE 15 0.293 0.311 0.154 0.095 0.635 0.591 YP 15 0.119 0.126 0.047 0.060 0.208 0.635
St. Lawrence River - Above Moses Saunders Dam
BB 9 0.083 0.087 0.020 0.065 0.132 - CARP 12 0.245 0.265 0.106 0.127 0.477 - CHC 3 0.488 0.554 0.197 0.398 0.776 LMB 4 0.584 0.568 0.147 0.399 0.704 SLVRH 1 0.340 0.340 0.340 0.340 SMB 4 0.659 0.656 0.335 0.299 1.01 WEYE 6 0.634 0.640 0.181 0.427 0.907 - YP 11 0.179 0.191 0.081 0.111 0.403 0.662
St. Lawrence River - Franklin-St. Lawrence County Line
BB 9 0.067 0.090 0.058 0.027 0.167 0.790 CARP 4 0.170 0.186 0.141 0.039 0.365 SLVRH 3 0.349 0.341 0.130 0.207 0.467 SMB 10 0.548 0.536 0.124 0.332 0.730 0.657 WEYE 10 0.426 0.478 0.182 0.217 0.859 - YP 16 0.190 0.224 0.135 0.088 0.558 0.519
St. Lawrence River - Raquette Point
BB 11 0.149 0.160 0.041 0.077 0.220 - CARP 8 0.426 0.467 0.192 0.251 0.756 - CHC 10 0.424 0.406 0.129 0.159 0.616 - SMB 10 0.861 0.786 0.244 0.315 1.18 0.851 WEYE 9 0.587 0.527 0.262 0.086 0.771 - YP 9 0.220 0.215 0.067 0.136 0.343 -
Massena Power Canal
CARP 1 0.601 0.601 0.601 0.601 LMB 4 0.425 0.506 0.288 0.263 0.913 SMB 2 0.437 0.437 0.181 0.309 0.565 WS 1 0.474 0.474 0.474 0.474

31
Table 8 continued. Location Species N Median Mean SD1 Minimum Maximum R2
Grasse River - Above dam
BB 6 0.177 0.173 0.028 0.150 0.210 - LMB 1 0.246 0.246 0.246 0.246 SLVRH 9 0.128 0.126 0.023 0.095 0.167 0.514 SMB 6 0.541 0.575 0.157 0.404 0.840 - WEYE 10 0.685 0.684 0.210 0.358 1.07 0.544 WS 1 0.120 0.120 0.120 0.120 YP 10 0.353 0.326 0.118 0.162 0.492 -
Grasse River - Mouth
CARP 10 0.600 0.553 0.173 0.165 0.742 - CHC 10 0.323 0.469 0.309 0.201 1.06 0.603 SMB 11 0.641 0.686 0.195 0.425 1.05 0.388 WEYE 10 0.511 0.609 0.219 0.309 0.985 0.440 YP 12 0.223 0.308 0.184 0.133 0.731 0.611
Raquette River - Above Route 420
BB 2 0.111 0.111 0.017 0.0984 0.123 CARP 5 0.488 0.459 0.179 0.248 0.671 - NOP 1 0.735 0.735 0.735 0.735 SLVRH 1 0.059 0.059 0.059 0.059 SMB 3 0.751 0.847 0.365 0.540 1.25 WEYE 3 0.631 0.666 0.072 0.619 0.749 WS 3 0.172 0.145 0.088 0.0466 0.217 YP 1 0.185 0.185 0.185 0.185
Raquette River - Middle
CHC 2 0.798 0.798 0.342 0.556 1.04 SMB 4 0.373 0.408 0.144 0.282 0.602
Raquette River - Mouth
BB 10 0.228 0.236 0.107 0.0749 0.420 - BLC 1 0.604 0.604 0.604 0.604 CARP 9 0.463 0.470 0.121 0.319 0.667 - CHC 10 0.493 0.580 0.308 0.189 1.22 0.577 PKSD 1 0.080 0.080 0.080 0.080 SLVRH 1 0.389 0.389 0.389 0.389 SMB 11 0.375 0.407 0.152 0.256 0.709 0.573 WEYE 10 0.469 0.535 0.206 0.253 0.894 - YP 2 0.234 0.234 0.045 0.202 0.265
St. Regis River - Above dam
BB 5 0.088 0.116 0.066 0.060 0.217 - NOP 1 0.511 0.511 0.511 0.511 SLVRH 10 0.157 0.241 0.171 0.098 0.550 0.724 SMB 11 0.860 0.812 0.213 0.276 1.14 0.421 WEYE 2 0.287 0.287 0.056 0.247 0.326 WS 3 0.136 0.201 0.120 0.128 0.339
St. Regis River - Mouth
BB 10 0.117 0.129 0.053 0.0737 0.240 - CARP 10 0.403 0.428 0.161 0.214 0.736 - CHC 11 0.255 0.252 0.082 0.141 0.398 - SMB 14 0.586 0.619 0.186 0.407 1.02 - WEYE 10 0.641 0.783 0.422 0.375 1.59 - YP 9 0.214 0.254 0.126 0.127 0.455 -
1 SD = Standard deviation.
R2 = Length:mercury coefficient of determination where sample size is 5 or more fish. A dash (-) indicates no significant (p > 0.05) length:mercury relationship. Blanks indicate an insufficient number of samples.

32
Table 9: Spatial differences (p < 0.05) in mercury concentrations in fish from the St. Lawrence River and its tributaries.
Species Spatial ranking (lowest to highest)1 Low2 High2
BB >MSD CV FCL Ogd SR>d SRm RP RRm 0.087 0.236 _______________________________ _______________________________ __________ ____________ Carp CV FCL >MSD Ogd >420 RP RRm 0.172 0.470 __________ ___________ ___________ __________________ CHC SRm GRm RP RRm >MSD 0.252 0.554 ____ _________________________ SMB Ogd RRm Rmid CV FCL GR>d SRm >MSD GRm RP >420 SR>d 0.307 0.812 ____ ________________ _________________________ _________________________ ________________________ _______________________________ WEYE Ogd CV FCL RRm RP GRm >MSD GR>d >420 0.311 0.666 ____ _______________________ ________________________________ _______________________________ YP Ogd CV >MSD FCL RP 0.126 0.215 ____ _______________________
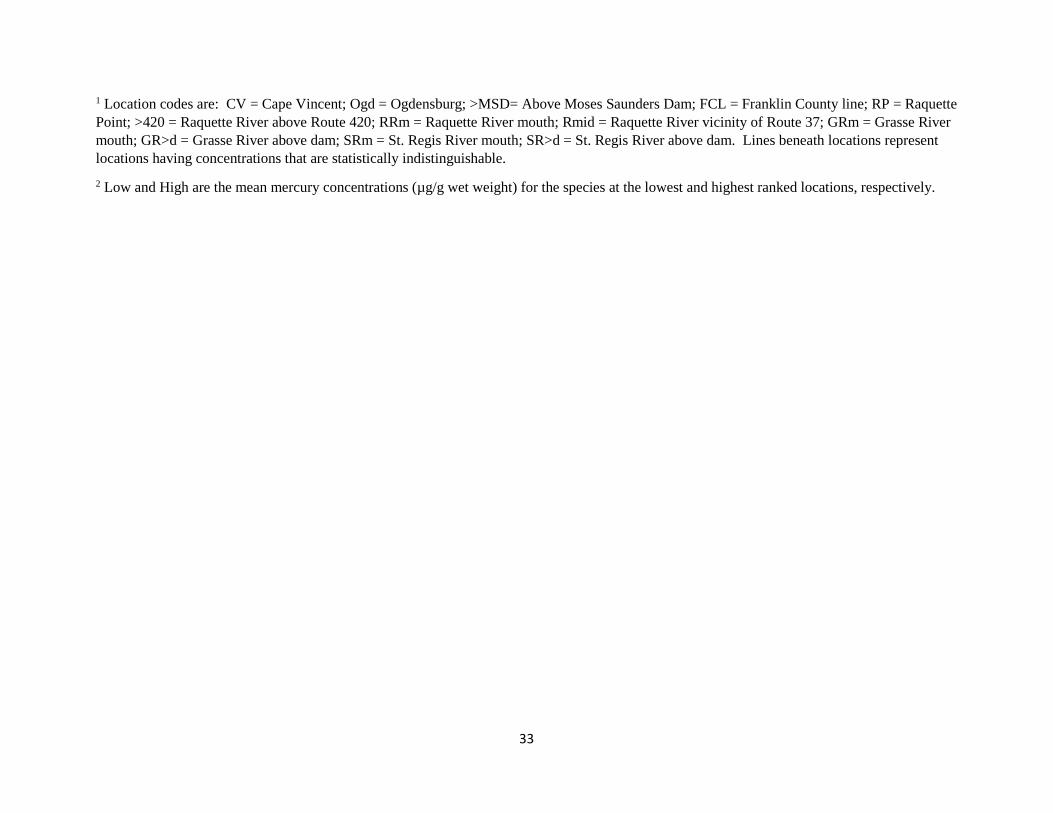
33
1 Location codes are: CV = Cape Vincent; Ogd = Ogdensburg; >MSD= Above Moses Saunders Dam; FCL = Franklin County line; RP = Raquette Point; >420 = Raquette River above Route 420; RRm = Raquette River mouth; Rmid = Raquette River vicinity of Route 37; GRm = Grasse River mouth; GR>d = Grasse River above dam; SRm = St. Regis River mouth; SR>d = St. Regis River above dam. Lines beneath locations represent locations having concentrations that are statistically indistinguishable. 2 Low and High are the mean mercury concentrations (µg/g wet weight) for the species at the lowest and highest ranked locations, respectively.
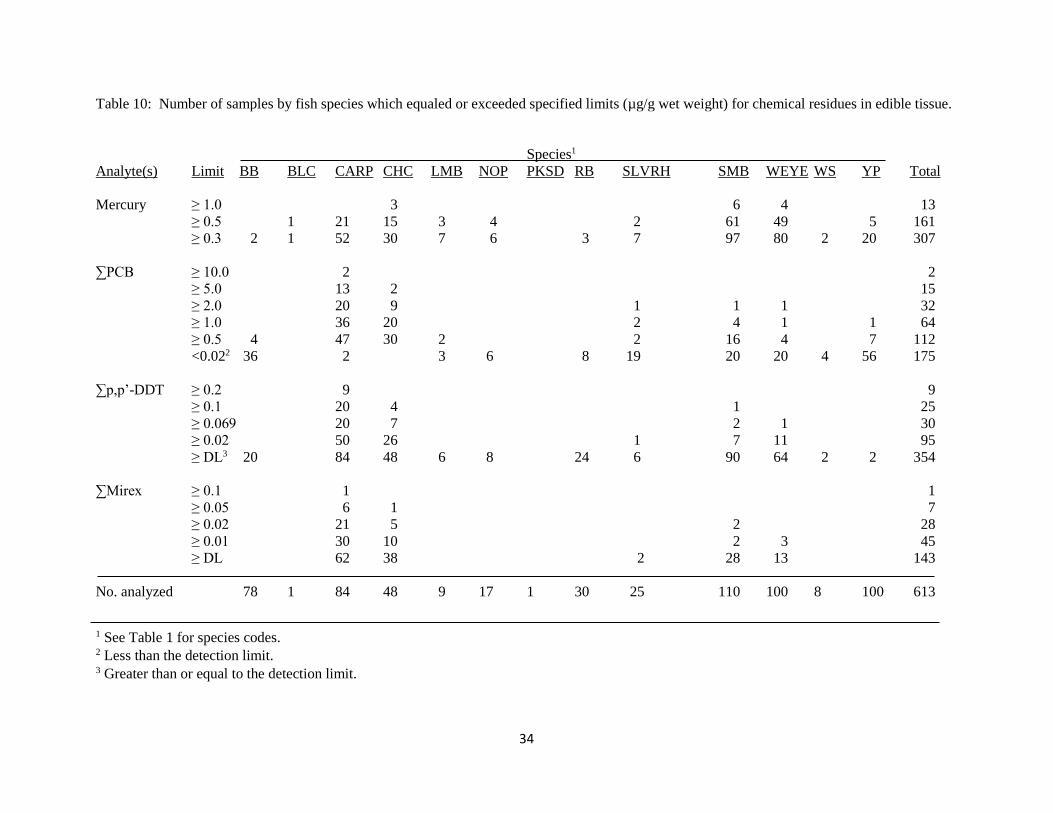
34
Table 10: Number of samples by fish species which equaled or exceeded specified limits (µg/g wet weight) for chemical residues in edible tissue. Species1 Analyte(s) Limit BB BLC CARP CHC LMB NOP PKSD RB SLVRH SMB WEYE WS YP Total Mercury ≥ 1.0 3 6 4 13 ≥ 0.5 1 21 15 3 4 2 61 49 5 161 ≥ 0.3 2 1 52 30 7 6 3 7 97 80 2 20 307 ∑PCB ≥ 10.0 2 2 ≥ 5.0 13 2 15 ≥ 2.0 20 9 1 1 1 32 ≥ 1.0 36 20 2 4 1 1 64 ≥ 0.5 4 47 30 2 2 16 4 7 112 <0.022 36 2 3 6 8 19 20 20 4 56 175 ∑p,p’-DDT ≥ 0.2 9 9 ≥ 0.1 20 4 1 25 ≥ 0.069 20 7 2 1 30 ≥ 0.02 50 26 1 7 11 95 ≥ DL3 20 84 48 6 8 24 6 90 64 2 2 354 ∑Mirex ≥ 0.1 1 1 ≥ 0.05 6 1 7 ≥ 0.02 21 5 2 28 ≥ 0.01 30 10 2 3 45 ≥ DL 62 38 2 28 13 143 No. analyzed 78 1 84 48 9 17 1 30 25 110 100 8 100 613 1 See Table 1 for species codes. 2 Less than the detection limit. 3 Greater than or equal to the detection limit.

35
Table 11: Total PCB concentrations (µg/g wet weight) in fish by location. Highlighted locations are within the International Joint Commission's Area of Concern at Massena/Akwesasne. Location Species N Median Mean SD1 Minimum Maximum St. Lawrence River - Cape Vincent
BB 4 0.028 0.034 0.019 ND2 0.061 CARP 15 0.093 0.161 0.163 ND 0.656 RB 15 ND 0.023 0.006 ND 0.039 SMB 9 0.136 0.185 0.193 ND 0.554 WEYE 15 0.137 0.154 0.097 ND 0.340 YP 15 ND ND ND
St. Lawrence River - Ogdensburg
BB 12 ND 0.034 0.027 ND 0.112 CARP 12 0.769 1.00 0.869 0.263 2.76 CHC 2 0.220 0.220 0.161 0.106 0.334 NOP 15 0.029 0.046 0.050 ND 0.214 RB 15 0.041 0.061 0.057 ND 0.234 SMB 15 0.069 0.073 0.029 ND 0.132 WEYE 15 0.046 0.047 0.027 ND 0.120 YP 15 0.030 0.035 0.015 ND 0.061
St. Lawrence River - Above Moses Saunders Dam
BB 9 ND ND ND CARP 12 0.243 0.303 0.195 0.085 0.697 CHC 3 0.508 0.602 0.220 0.446 0.853 LMB 4 0.057 0.068 0.058 ND 0.138 SLVRH 1 0.203 0.203 0.203 0.203 SMB 4 0.170 0.185 0.084 0.100 0.300 WEYE 6 0.051 0.052 0.022 ND 0.082 YP 11 ND 0.028 0.028 ND 0.112
St. Lawrence River - Franklin - St. Lawrence County line
BB 9 0.294 0.392 0.219 0.109 0.691 CARP 4 3.78 5.03 5.57 0.080 12.5 SLVRH 3 1.78 1.69 1.40 0.251 3.04 SMB 10 0.695 0.896 0.664 0.090 2.16 WEYE 10 0.097 0.372 0.729 0.040 2.41 YP 16 0.033 0.165 0.267 ND 0.908
St. Lawrence River - Raquette Point
BB 11 0.043 0.059 0.048 ND 0.163 CARP 8 1.38 2.53 2.53 0.146 5.85 CHC 10 0.595 0.757 0.470 0.255 1.48 SMB 10 0.262 0.245 0.107 0.083 0.388 WEYE 9 0.078 0.097 0.053 ND 0.187 YP 9 0.034 0.042 0.022 ND 0.072
Massena Power Canal
CARP 1 0.396 0.396 0.396 0.396 LMB 4 0.410 0.505 0.301 0.276 0.925 SMB 2 0.126 0.126 0.016 0.115 0.138 WS 1 0.403 0.403 0.403 0.403
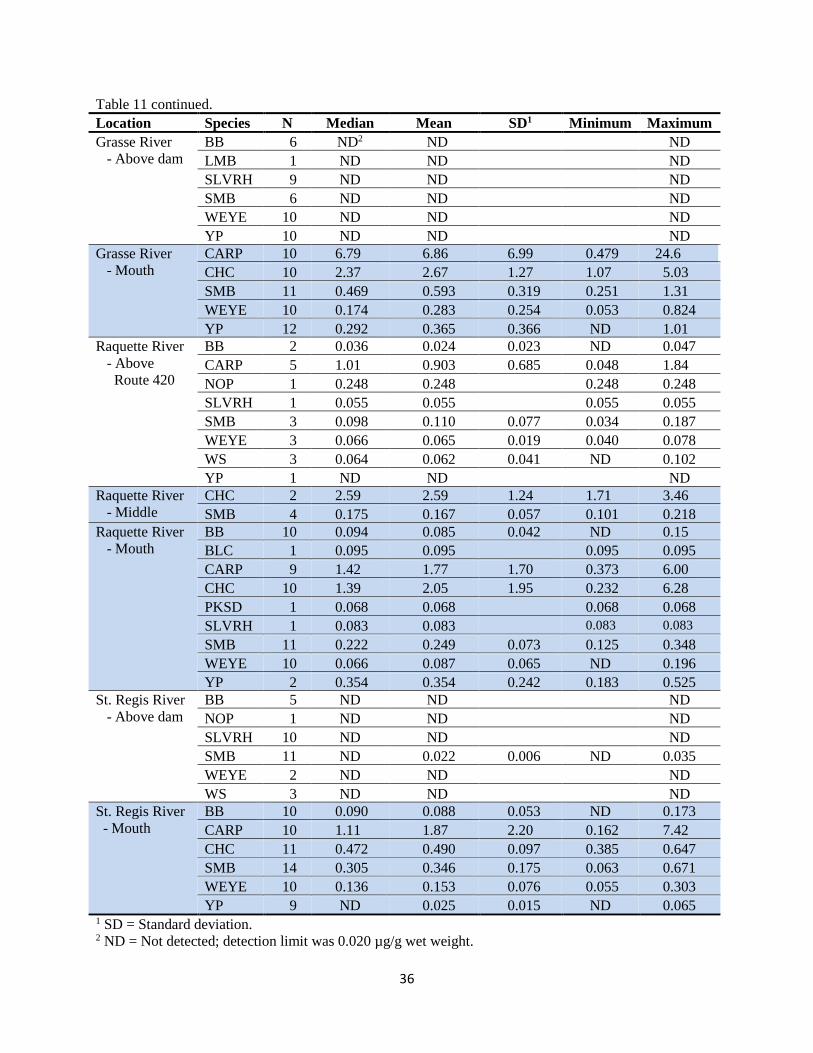
36
Table 11 continued. Location Species N Median Mean SD1 Minimum Maximum Grasse River - Above dam
BB 6 ND2 ND ND LMB 1 ND ND ND SLVRH 9 ND ND ND SMB 6 ND ND ND WEYE 10 ND ND ND YP 10 ND ND ND
Grasse River - Mouth
CARP 10 6.79 6.86 6.99 0.479 24.6 CHC 10 2.37 2.67 1.27 1.07 5.03 SMB 11 0.469 0.593 0.319 0.251 1.31 WEYE 10 0.174 0.283 0.254 0.053 0.824 YP 12 0.292 0.365 0.366 ND 1.01
Raquette River - Above Route 420
BB 2 0.036 0.024 0.023 ND 0.047 CARP 5 1.01 0.903 0.685 0.048 1.84 NOP 1 0.248 0.248 0.248 0.248 SLVRH 1 0.055 0.055 0.055 0.055 SMB 3 0.098 0.110 0.077 0.034 0.187 WEYE 3 0.066 0.065 0.019 0.040 0.078 WS 3 0.064 0.062 0.041 ND 0.102 YP 1 ND ND ND
Raquette River - Middle
CHC 2 2.59 2.59 1.24 1.71 3.46 SMB 4 0.175 0.167 0.057 0.101 0.218
Raquette River - Mouth
BB 10 0.094 0.085 0.042 ND 0.15 BLC 1 0.095 0.095 0.095 0.095 CARP 9 1.42 1.77 1.70 0.373 6.00 CHC 10 1.39 2.05 1.95 0.232 6.28 PKSD 1 0.068 0.068 0.068 0.068 SLVRH 1 0.083 0.083 0.083 0.083 SMB 11 0.222 0.249 0.073 0.125 0.348 WEYE 10 0.066 0.087 0.065 ND 0.196 YP 2 0.354 0.354 0.242 0.183 0.525
St. Regis River - Above dam
BB 5 ND ND ND NOP 1 ND ND ND SLVRH 10 ND ND ND SMB 11 ND 0.022 0.006 ND 0.035 WEYE 2 ND ND ND WS 3 ND ND ND
St. Regis River - Mouth
BB 10 0.090 0.088 0.053 ND 0.173 CARP 10 1.11 1.87 2.20 0.162 7.42 CHC 11 0.472 0.490 0.097 0.385 0.647 SMB 14 0.305 0.346 0.175 0.063 0.671 WEYE 10 0.136 0.153 0.076 0.055 0.303 YP 9 ND 0.025 0.015 ND 0.065
1 SD = Standard deviation. 2 ND = Not detected; detection limit was 0.020 µg/g wet weight.
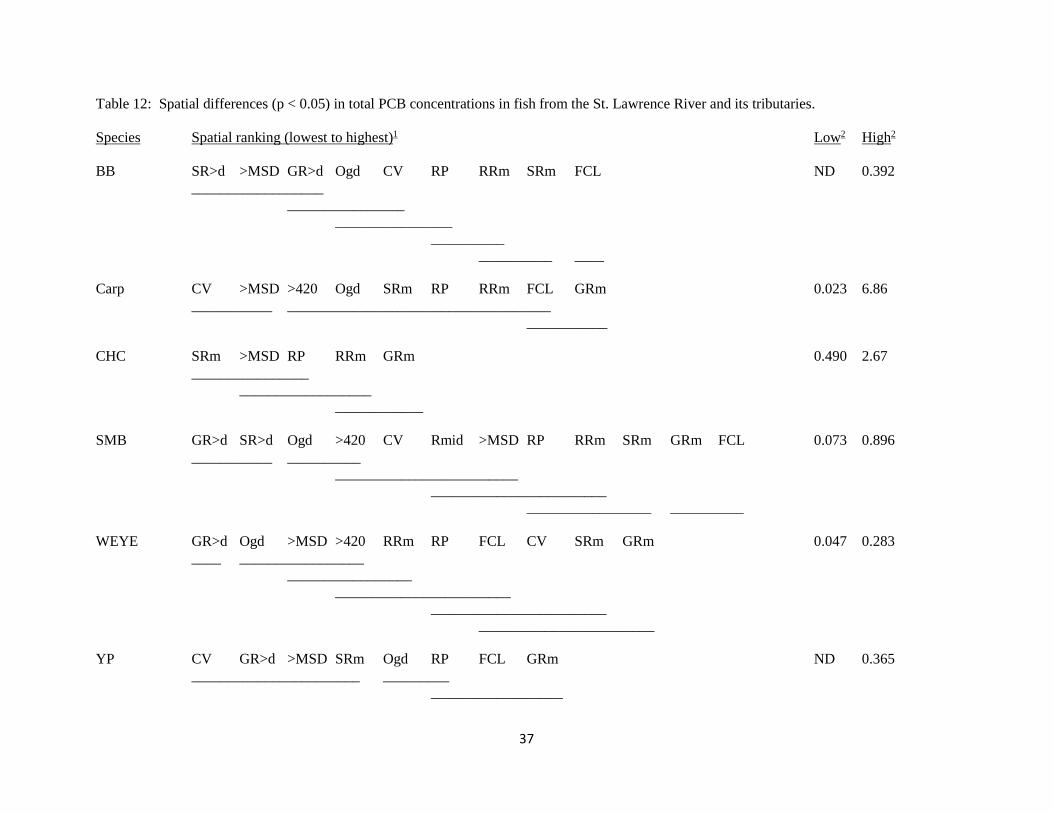
37
Table 12: Spatial differences (p < 0.05) in total PCB concentrations in fish from the St. Lawrence River and its tributaries. Species Spatial ranking (lowest to highest)1 Low2 High2 BB SR>d >MSD GR>d Ogd CV RP RRm SRm FCL ND 0.392 __________________ ________________ ________________ __________ __________ ____ Carp CV >MSD >420 Ogd SRm RP RRm FCL GRm 0.023 6.86 ___________ ____________________________________ ___________ CHC SRm >MSD RP RRm GRm 0.490 2.67 ________________ __________________ ____________ SMB GR>d SR>d Ogd >420 CV Rmid >MSD RP RRm SRm GRm FCL 0.073 0.896 ___________ __________ _________________________ ________________________ _________________ __________ WEYE GR>d Ogd >MSD >420 RRm RP FCL CV SRm GRm 0.047 0.283 ____ _________________ _________________ ________________________ ________________________ ________________________ YP CV GR>d >MSD SRm Ogd RP FCL GRm ND 0.365 _______________________ _________ __________________
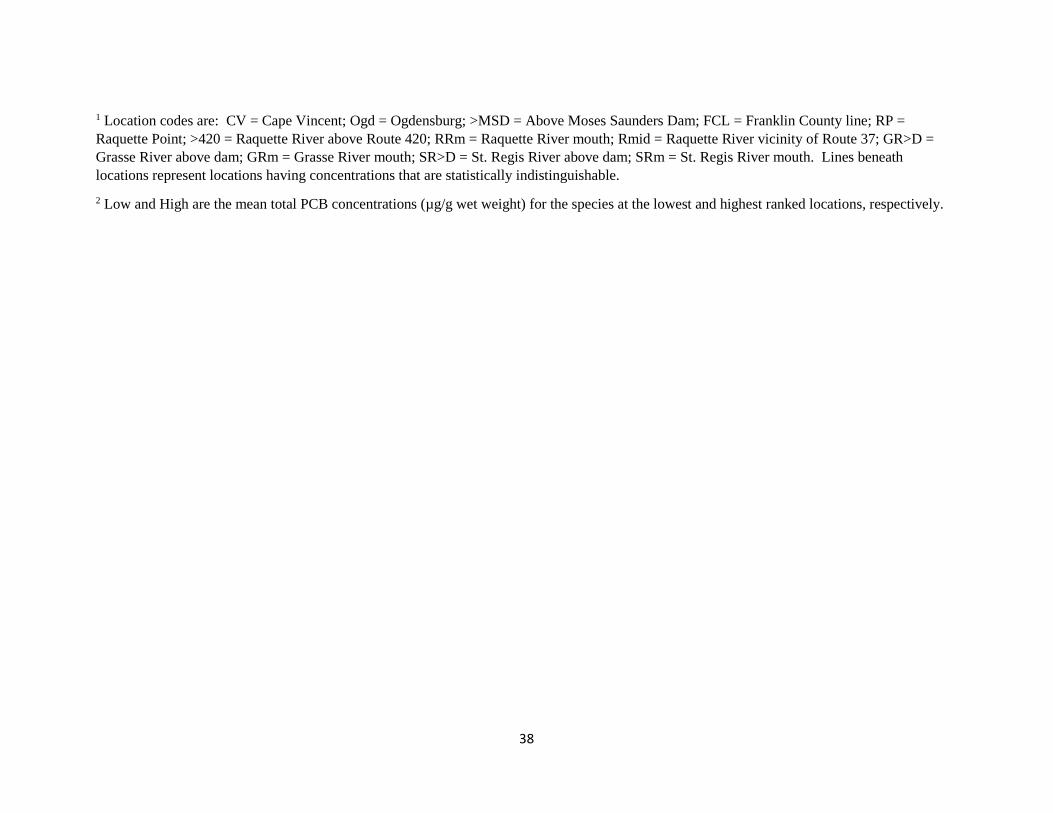
38
1 Location codes are: CV = Cape Vincent; Ogd = Ogdensburg; >MSD = Above Moses Saunders Dam; FCL = Franklin County line; RP = Raquette Point; >420 = Raquette River above Route 420; RRm = Raquette River mouth; Rmid = Raquette River vicinity of Route 37; GR>D = Grasse River above dam; GRm = Grasse River mouth; SR>D = St. Regis River above dam; SRm = St. Regis River mouth. Lines beneath locations represent locations having concentrations that are statistically indistinguishable. 2 Low and High are the mean total PCB concentrations (µg/g wet weight) for the species at the lowest and highest ranked locations, respectively.

39
Table 13: Total p,p’-DDT concentrations (µg/g wet weight) in fish from the St. Lawrence River and its tributaries. Highlighted locations are within the International Joint Commission's Area of Concern at Massena/Akwesasne.
Location Species N Median Mean high1 Minimum Maximum No. of
Detections St. Lawrence River - Cape Vincent
BB 4 0.00291 0.00355 0.00228 0.00611 4 CARP 15 0.0170 0.0345 0.00213 0.172 15 RB 15 0.00311 0.00322 0.00241 0.00480 15 SMB 9 0.0197 0.0342 ND2 0.120 8 WEYE 15 0.0275 0.0344 0.00387 0.0883 15 YP 15 ND 0.00200 ND 0.00204 1
St. Lawrence River - Ogdensburg
BB 12 ND 0.00244 ND 0.00616 4 CARP 12 0.133 0.152 0.0153 0.467 12 CHC 2 0.0197 0.0197 0.00335 0.0360 2 NOP 15 ND 0.0270 ND 0.00823 7 RB 15 0.00243 0.00240 ND 0.00296 9 SMB 15 0.00397 0.00409 ND 0.00911 14 WEYE 15 0.00237 0.00309 ND 0.00666 10 YP 15 ND 0.00202 ND 0.00223 1
St. Lawrence River - Above Moses Saunders Dam
BB 9 ND 0.00214 ND 0.00291 3 CARP 12 0.251 0.0353 0.00653 0.125 12 CHC 3 0.0472 0.0637 0.0374 0.107 3 LMB 4 0.00665 0.00382 ND 0.00793 2 SLVRH 1 0.0181 0.0181 0.0181 1 SMB 4 0.101 0.139 0.00803 0.0271 4 WEYE 6 0.0303 0.0293 ND 0.00396 5 YP 11 ND 0.002 ND 0
St. Lawrence River - Franklin – St. Lawrence County line
BB 9 ND 0.002 ND 0 CARP 4 0.0105 0.0205 ND 0.0592 3 SLVRH 3 0.00300 0.00954 ND 0.0236 2 SMB 10 0.00864 0.00848 0.00274 0.0133 10 WEYE 10 0.00250 0.00316 ND 0.00647 7 YP 16 ND 0.002 ND 0
St. Lawrence River - Raquette Point
BB 11 ND 0.00214 ND 0.00355 1 CARP 8 0.0202 0.0405 0.00467 0.178 8 CHC 10 0.0227 0.0294 0.00639 0.0751 10 SMB 10 0.00493 0.00680 ND 0.0213 9 WEYE 9 0.00264 0.00272 ND 0.00423 5 YP 9 ND 0.002 ND 0
Massena Power Canal
CARP 1 ND 0.002 ND 0 LMB 4 0.00265 0.00351 0.00203 0.00686 4 SMB 2 ND 0.002 ND 0 WS 1 0.00344 0.00344 0.00344 0.00344 1

40
Table 13 continued
Location Species N Median Mean high1 Minimum Maximum No. of
Detections Grasse River - Above Dam
BB 6 ND 0.002 ND 0 LMB 1 ND 0.002 ND 0 SLVRH 9 ND 0.00220 ND 0.00377 1 SMB 6 ND 0.00225 ND 0.00348 1 WEYE 10 ND 0.00210 ND 0.00251 2 WS 1 ND 0.002 ND 0 YP 10 ND 0.002 ND 0
Grasse River - Mouth
CARP 10 0.0398 0.0563 0.00601 0.170 10 CHC 10 0.0360 0.0334 0.00954 0.0558 10 SMB 11 0.103 0.0104 0.00375 0.0189 11 WEYE 10 0.00306 0.00362 ND 0.00642 7 YP 12 ND 0.002 ND 0
Raquette River - Above Route 420
BB 2 0.00119 0.00319 ND 0.00438 1 CARP 5 0.0267 0.0606 0.00251 0.201 5 NOP 1 0.00611 0.00611 0.00611 1 SLVRH 1 ND 0.002 ND 0 SMB 3 ND 0.00254 ND 0.00361 1 WEYE 3 ND 0.00201 ND 0.00203 1 WS 3 ND 0.002 ND 0 YP 1 ND 0.002 ND 0
Raquette River - Middle
CHC 2 0.141 0.141 0.111 0.171 2 SMB 4 0.00478 0.00500 0.00330 0.00714 4
Raquette River - Mouth
BB 10 ND 0.00220 ND 0.00400 1 BLC 1 ND 0.002 ND 0 CARP 9 0.0267 0.0523 0.0102 0.260 9 CHC 10 0.0497 0.0620 0.00524 0.183 10 PKSD 1 ND 0.002 ND 0 SLVRH 1 0.027 0.027 0.027 1 SMB 11 0.00562 0.00615 0.00255 0.0129 11 WEYE 10 ND 0.00321 ND 0.00955 4 YP 2 ND 0.002 ND 0
St. Regis River - Above Dam
BB 5 ND 0.002 ND 0 NOP 1 ND 0.002 ND 0 SLVRH 10 ND 0.00205 ND 0.00254 1 SMB 11 ND 0.00248 ND 0.00366 4 WEYE 2 ND 0.002 ND 0 WS 3 ND 0.00200 ND 0.00201 1
St. Regis River - Mouth
BB 10 0.00265 0.00314 ND 0.00673 6 CARP 10 0.0452 0.0666 0.00350 0.208 10 CHC 11 0.00878 0.0111 0.00678 0.0198 11 SMB 14 0.00828 0.00905 ND 0.0206 13 WEYE 10 0.00452 0.00649 ND 0.0216 8 YP 9 ND 0.002 ND 0
1 Mean high assumes the value of the detection limit of p,p’-DDE (0.002 µg/g) when the mean total p,p’-DDT is less than detection. 2 ND = Not detected.

41
Table 14: Total mirex concentrations (µg/g wet weight) in fish from the St. Lawrence River and its tributaries. Highlighted locations are within the International Joint Commission's Area of Concern at Massena/Akwesasne.
Location Species N Median Minimum Maximum No. of Detections
St. Lawrence River - Cape Vincent
BB 4 ND ND 0.00205 1 CARP 15 ND ND 0.0395 7 RB 15 ND ND 0 SMB 9 0.00421 ND 0.0386 6 WEYE 15 0.00669 ND 0.0197 13 YP 15 ND ND 0
St. Lawrence River - Ogdensburg
BB 12 ND ND 0 CARP 12 0.0372 0.00276 0.0794 12 CHC 2 0.00290 ND 0.00779 1 NOP 15 ND ND 0 RB 15 ND ND 0 SMB 15 ND ND 0.00244 1 WEYE 15 ND ND 0 YP 15 ND ND 0
St. Lawrence River - Above Moses Saunders Dam
BB 9 ND ND 0 CARP 12 0.0102 0.00331 0.0305 12 CHC 3 0.0187 0.0124 0.0335 3 LMB 4 ND ND 0 SLVRH 1 0.00221 0.00221 1 SMB 4 0.000785 ND 0.00519 2 WEYE 6 ND ND 0 YP 11 ND ND 0
St. Lawrence River - Franklin - St. Lawrence County line
BB 9 ND ND 0 CARP 4 ND ND 0.00323 1 SLVRH 3 ND ND 0.00486 1 SMB 10 ND ND 0.00229 2 WEYE 10 ND ND 0 YP 16 ND ND 0
St. Lawrence River - Raquette Point
BB 11 ND ND 0 CARP 8 0.00312 ND 0.041 5 CHC 10 0.00327 ND 0.00965 8 SMB 10 ND ND 0.00416 4 WEYE 9 ND ND 0 YP 9 ND ND 0
Massena Power Canal
CARP 1 ND ND 0 LMB 4 ND ND 0 SMB 2 ND ND 0 WS 1 ND ND 0
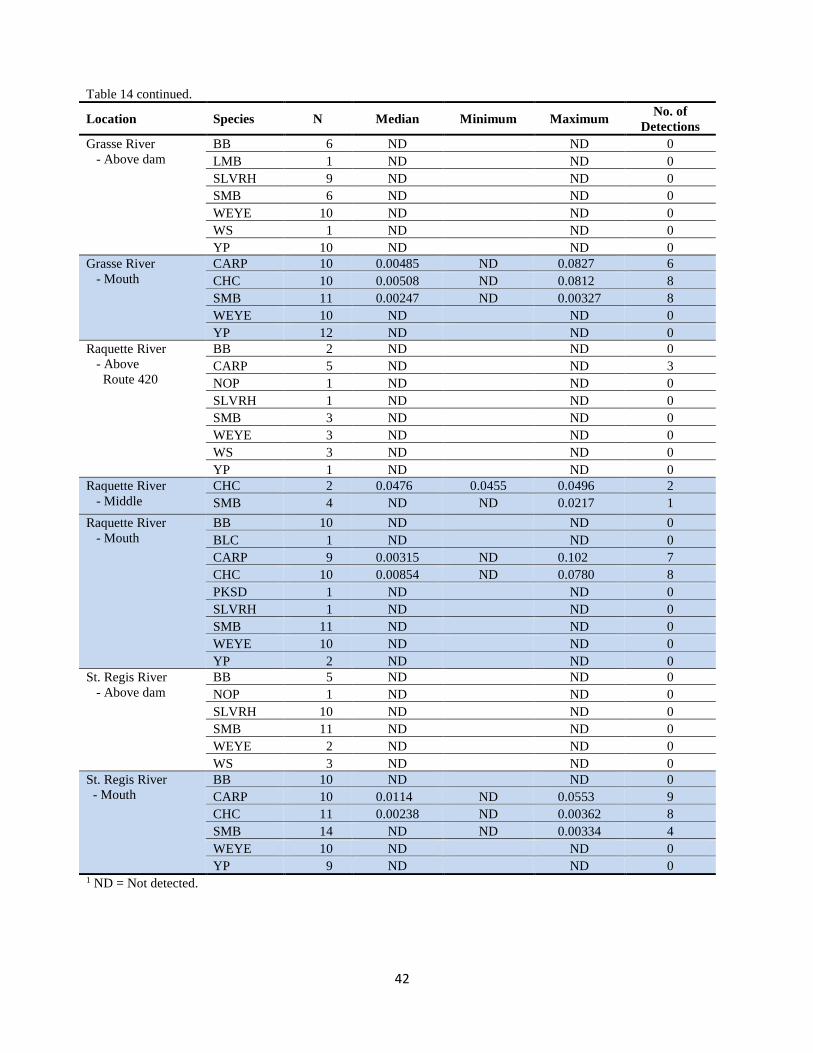
42
Table 14 continued.
Location Species N Median Minimum Maximum No. of Detections
Grasse River - Above dam
BB 6 ND ND 0 LMB 1 ND ND 0 SLVRH 9 ND ND 0 SMB 6 ND ND 0 WEYE 10 ND ND 0 WS 1 ND ND 0 YP 10 ND ND 0
Grasse River - Mouth
CARP 10 0.00485 ND 0.0827 6 CHC 10 0.00508 ND 0.0812 8 SMB 11 0.00247 ND 0.00327 8 WEYE 10 ND ND 0 YP 12 ND ND 0
Raquette River - Above Route 420
BB 2 ND ND 0 CARP 5 ND ND 3 NOP 1 ND ND 0 SLVRH 1 ND ND 0 SMB 3 ND ND 0 WEYE 3 ND ND 0 WS 3 ND ND 0 YP 1 ND ND 0
Raquette River - Middle
CHC 2 0.0476 0.0455 0.0496 2 SMB 4 ND ND 0.0217 1
Raquette River - Mouth
BB 10 ND ND 0 BLC 1 ND ND 0 CARP 9 0.00315 ND 0.102 7 CHC 10 0.00854 ND 0.0780 8 PKSD 1 ND ND 0 SLVRH 1 ND ND 0 SMB 11 ND ND 0 WEYE 10 ND ND 0 YP 2 ND ND 0
St. Regis River - Above dam
BB 5 ND ND 0 NOP 1 ND ND 0 SLVRH 10 ND ND 0 SMB 11 ND ND 0 WEYE 2 ND ND 0 WS 3 ND ND 0
St. Regis River - Mouth
BB 10 ND ND 0 CARP 10 0.0114 ND 0.0553 9 CHC 11 0.00238 ND 0.00362 8 SMB 14 ND ND 0.00334 4 WEYE 10 ND ND 0 YP 9 ND ND 0
1 ND = Not detected.
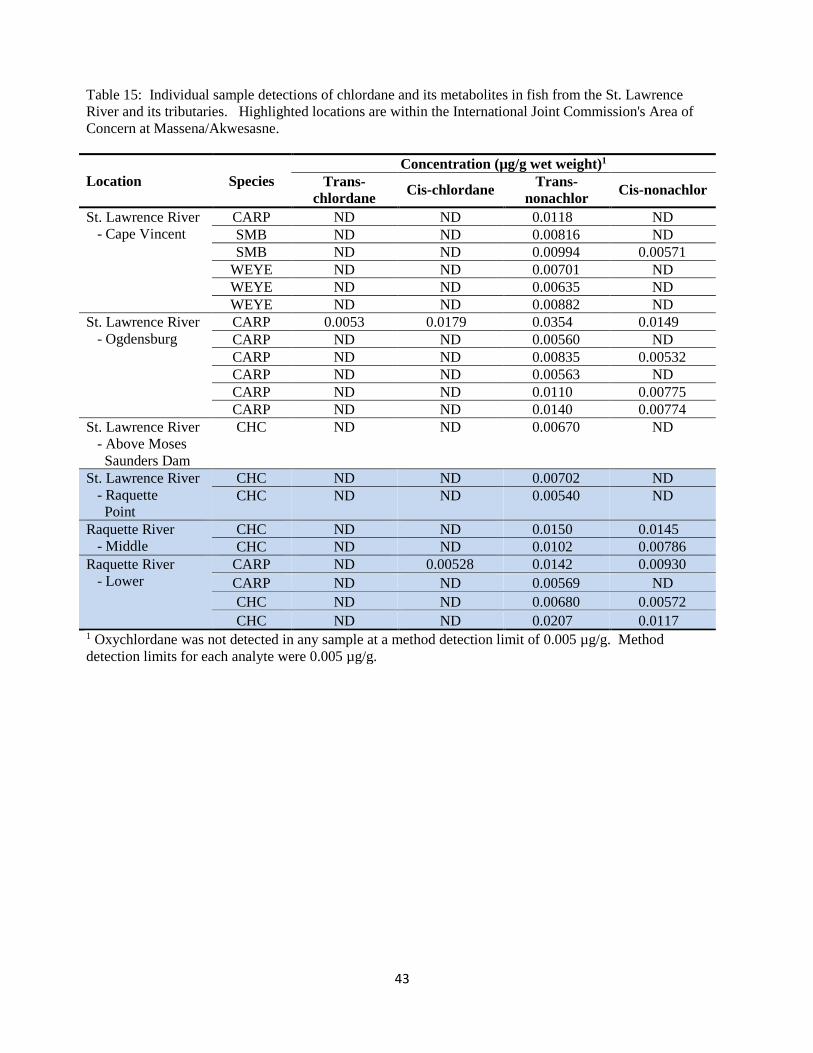
43
Table 15: Individual sample detections of chlordane and its metabolites in fish from the St. Lawrence River and its tributaries. Highlighted locations are within the International Joint Commission's Area of Concern at Massena/Akwesasne.
Location Species Concentration (µg/g wet weight)1
Trans-chlordane Cis-chlordane Trans-
nonachlor Cis-nonachlor
St. Lawrence River - Cape Vincent
CARP ND ND 0.0118 ND SMB ND ND 0.00816 ND SMB ND ND 0.00994 0.00571
WEYE ND ND 0.00701 ND WEYE ND ND 0.00635 ND WEYE ND ND 0.00882 ND
St. Lawrence River - Ogdensburg
CARP 0.0053 0.0179 0.0354 0.0149 CARP ND ND 0.00560 ND CARP ND ND 0.00835 0.00532 CARP ND ND 0.00563 ND CARP ND ND 0.0110 0.00775 CARP ND ND 0.0140 0.00774
St. Lawrence River - Above Moses Saunders Dam
CHC ND ND 0.00670 ND
St. Lawrence River - Raquette Point
CHC ND ND 0.00702 ND CHC ND ND 0.00540 ND
Raquette River - Middle
CHC ND ND 0.0150 0.0145 CHC ND ND 0.0102 0.00786
Raquette River - Lower
CARP ND 0.00528 0.0142 0.00930 CARP ND ND 0.00569 ND CHC ND ND 0.00680 0.00572 CHC ND ND 0.0207 0.0117
1 Oxychlordane was not detected in any sample at a method detection limit of 0.005 µg/g. Method detection limits for each analyte were 0.005 µg/g.
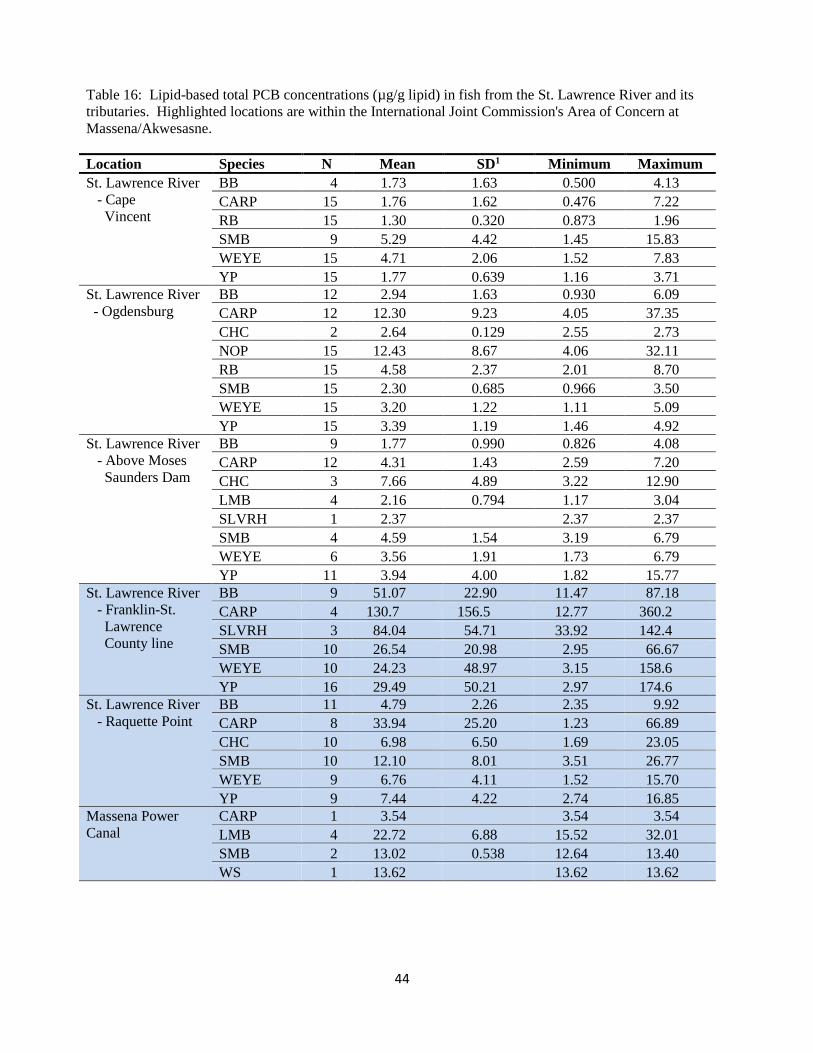
44
Table 16: Lipid-based total PCB concentrations (µg/g lipid) in fish from the St. Lawrence River and its tributaries. Highlighted locations are within the International Joint Commission's Area of Concern at Massena/Akwesasne. Location Species N Mean SD1 Minimum Maximum St. Lawrence River - Cape Vincent
BB 4 1.73 1.63 0.500 4.13 CARP 15 1.76 1.62 0.476 7.22 RB 15 1.30 0.320 0.873 1.96 SMB 9 5.29 4.42 1.45 15.83 WEYE 15 4.71 2.06 1.52 7.83 YP 15 1.77 0.639 1.16 3.71
St. Lawrence River - Ogdensburg
BB 12 2.94 1.63 0.930 6.09 CARP 12 12.30 9.23 4.05 37.35 CHC 2 2.64 0.129 2.55 2.73 NOP 15 12.43 8.67 4.06 32.11 RB 15 4.58 2.37 2.01 8.70 SMB 15 2.30 0.685 0.966 3.50 WEYE 15 3.20 1.22 1.11 5.09 YP 15 3.39 1.19 1.46 4.92
St. Lawrence River - Above Moses Saunders Dam
BB 9 1.77 0.990 0.826 4.08 CARP 12 4.31 1.43 2.59 7.20 CHC 3 7.66 4.89 3.22 12.90 LMB 4 2.16 0.794 1.17 3.04 SLVRH 1 2.37 2.37 2.37 SMB 4 4.59 1.54 3.19 6.79 WEYE 6 3.56 1.91 1.73 6.79 YP 11 3.94 4.00 1.82 15.77
St. Lawrence River - Franklin-St. Lawrence County line
BB 9 51.07 22.90 11.47 87.18 CARP 4 130.7 156.5 12.77 360.2 SLVRH 3 84.04 54.71 33.92 142.4 SMB 10 26.54 20.98 2.95 66.67 WEYE 10 24.23 48.97 3.15 158.6 YP 16 29.49 50.21 2.97 174.6
St. Lawrence River - Raquette Point
BB 11 4.79 2.26 2.35 9.92 CARP 8 33.94 25.20 1.23 66.89 CHC 10 6.98 6.50 1.69 23.05 SMB 10 12.10 8.01 3.51 26.77 WEYE 9 6.76 4.11 1.52 15.70 YP 9 7.44 4.22 2.74 16.85
Massena Power Canal
CARP 1 3.54 3.54 3.54 LMB 4 22.72 6.88 15.52 32.01 SMB 2 13.02 0.538 12.64 13.40 WS 1 13.62 13.62 13.62
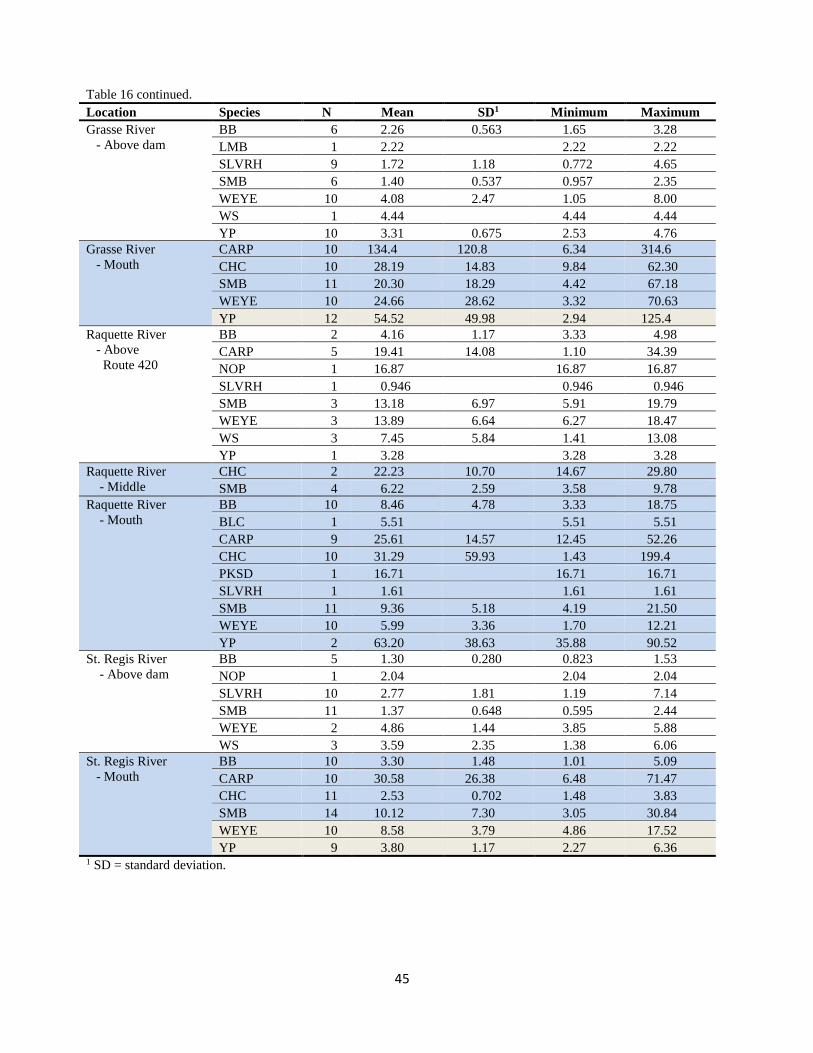
45
Table 16 continued. Location Species N Mean SD1 Minimum Maximum Grasse River - Above dam
BB 6 2.26 0.563 1.65 3.28 LMB 1 2.22 2.22 2.22 SLVRH 9 1.72 1.18 0.772 4.65 SMB 6 1.40 0.537 0.957 2.35 WEYE 10 4.08 2.47 1.05 8.00 WS 1 4.44 4.44 4.44 YP 10 3.31 0.675 2.53 4.76
Grasse River - Mouth
CARP 10 134.4 120.8 6.34 314.6 CHC 10 28.19 14.83 9.84 62.30 SMB 11 20.30 18.29 4.42 67.18 WEYE 10 24.66 28.62 3.32 70.63 YP 12 54.52 49.98 2.94 125.4
Raquette River - Above Route 420
BB 2 4.16 1.17 3.33 4.98 CARP 5 19.41 14.08 1.10 34.39 NOP 1 16.87 16.87 16.87 SLVRH 1 0.946 0.946 0.946 SMB 3 13.18 6.97 5.91 19.79 WEYE 3 13.89 6.64 6.27 18.47 WS 3 7.45 5.84 1.41 13.08 YP 1 3.28 3.28 3.28
Raquette River - Middle
CHC 2 22.23 10.70 14.67 29.80 SMB 4 6.22 2.59 3.58 9.78
Raquette River - Mouth
BB 10 8.46 4.78 3.33 18.75 BLC 1 5.51 5.51 5.51 CARP 9 25.61 14.57 12.45 52.26 CHC 10 31.29 59.93 1.43 199.4 PKSD 1 16.71 16.71 16.71 SLVRH 1 1.61 1.61 1.61 SMB 11 9.36 5.18 4.19 21.50 WEYE 10 5.99 3.36 1.70 12.21 YP 2 63.20 38.63 35.88 90.52
St. Regis River - Above dam
BB 5 1.30 0.280 0.823 1.53 NOP 1 2.04 2.04 2.04 SLVRH 10 2.77 1.81 1.19 7.14 SMB 11 1.37 0.648 0.595 2.44 WEYE 2 4.86 1.44 3.85 5.88 WS 3 3.59 2.35 1.38 6.06
St. Regis River - Mouth
BB 10 3.30 1.48 1.01 5.09 CARP 10 30.58 26.38 6.48 71.47 CHC 11 2.53 0.702 1.48 3.83 SMB 14 10.12 7.30 3.05 30.84 WEYE 10 8.58 3.79 4.86 17.52 YP 9 3.80 1.17 2.27 6.36
1 SD = standard deviation.
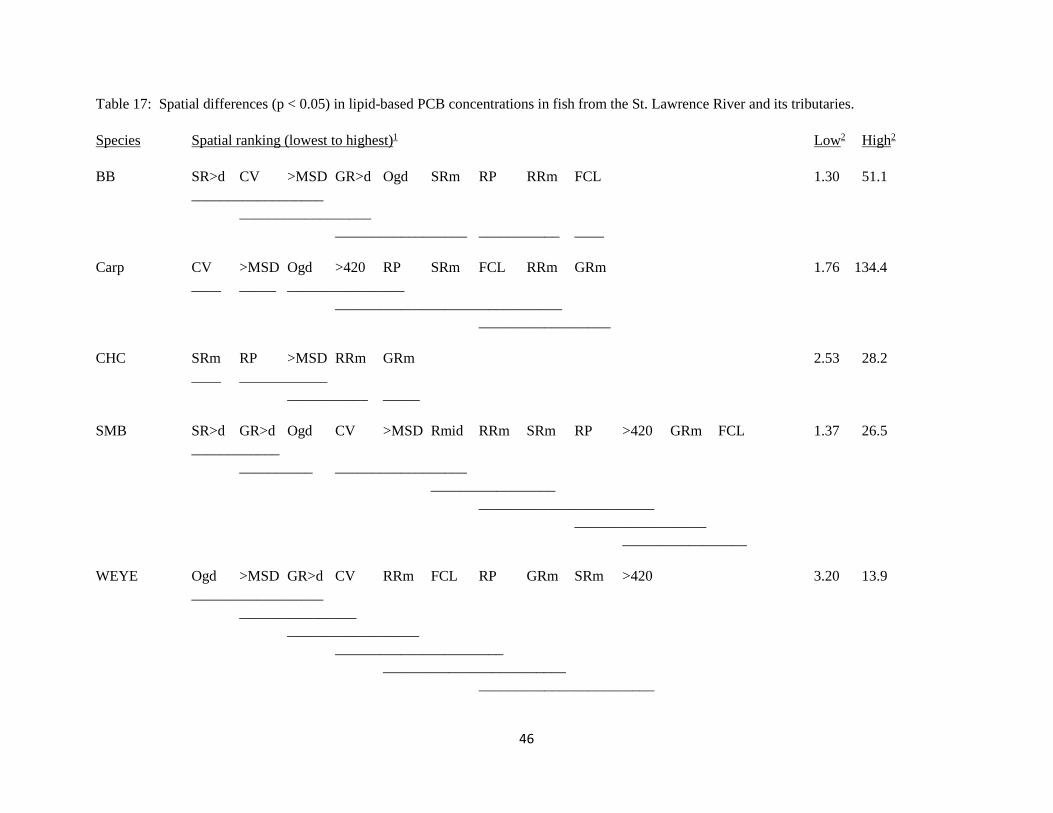
46
Table 17: Spatial differences (p < 0.05) in lipid-based PCB concentrations in fish from the St. Lawrence River and its tributaries. Species Spatial ranking (lowest to highest)1 Low2 High2 BB SR>d CV >MSD GR>d Ogd SRm RP RRm FCL 1.30 51.1 __________________ __________________ __________________ ___________ ____ Carp CV >MSD Ogd >420 RP SRm FCL RRm GRm 1.76 134.4 ____ _____ ________________ _______________________________ __________________ CHC SRm RP >MSD RRm GRm 2.53 28.2 ____ ____________ ___________ _____ SMB SR>d GR>d Ogd CV >MSD Rmid RRm SRm RP >420 GRm FCL 1.37 26.5 ____________ __________ __________________ _________________ ________________________ __________________ _________________ WEYE Ogd >MSD GR>d CV RRm FCL RP GRm SRm >420 3.20 13.9 __________________ ________________ __________________ _______________________ _________________________ ________________________
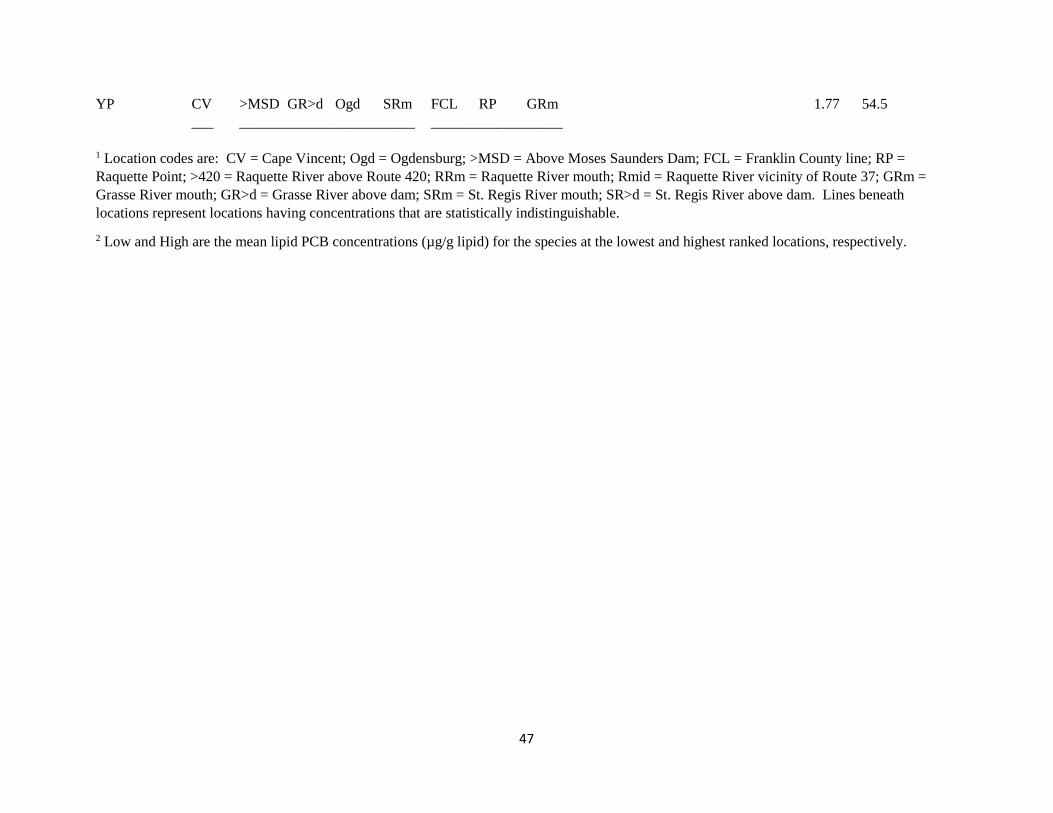
47
YP CV >MSD GR>d Ogd SRm FCL RP GRm 1.77 54.5 ___ ________________________ __________________ 1 Location codes are: CV = Cape Vincent; Ogd = Ogdensburg; >MSD = Above Moses Saunders Dam; FCL = Franklin County line; RP = Raquette Point; >420 = Raquette River above Route 420; RRm = Raquette River mouth; Rmid = Raquette River vicinity of Route 37; GRm = Grasse River mouth; GR>d = Grasse River above dam; SRm = St. Regis River mouth; SR>d = St. Regis River above dam. Lines beneath locations represent locations having concentrations that are statistically indistinguishable. 2 Low and High are the mean lipid PCB concentrations (µg/g lipid) for the species at the lowest and highest ranked locations, respectively.
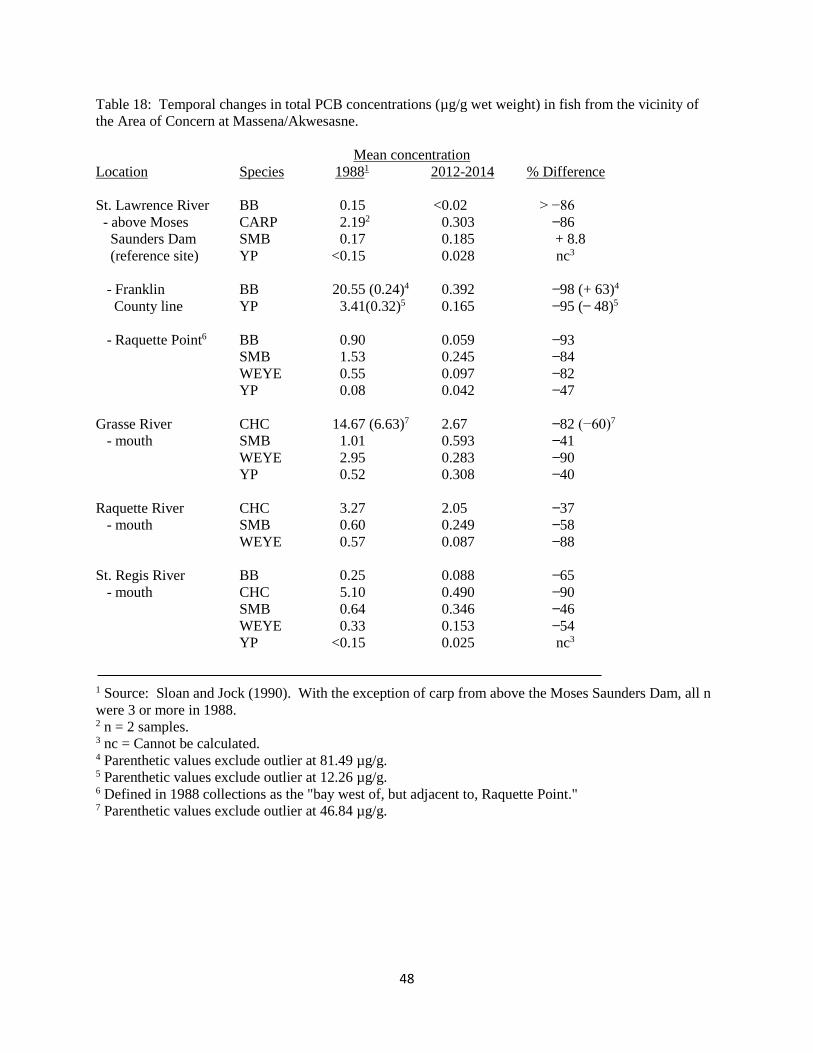
48
Table 18: Temporal changes in total PCB concentrations (µg/g wet weight) in fish from the vicinity of the Area of Concern at Massena/Akwesasne. Mean concentration Location Species 19881 2012-2014 % Difference St. Lawrence River BB 0.15 <0.02 > −86
- above Moses CARP 2.192 0.303 ̶ 86 Saunders Dam SMB 0.17 0.185 + 8.8 (reference site) YP <0.15 0.028 nc3 - Franklin BB 20.55 (0.24)4 0.392 ̶ 98 (+ 63)4 County line YP 3.41(0.32)5 0.165 ̶ 95 ( ̶ 48)5
- Raquette Point6 BB 0.90 0.059 ̶ 93 SMB 1.53 0.245 ̶ 84 WEYE 0.55 0.097 ̶ 82 YP 0.08 0.042 ̶ 47 Grasse River CHC 14.67 (6.63)7 2.67 ̶ 82 (−60)7 - mouth SMB 1.01 0.593 ̶ 41 WEYE 2.95 0.283 ̶ 90 YP 0.52 0.308 ̶ 40 Raquette River CHC 3.27 2.05 ̶ 37 - mouth SMB 0.60 0.249 ̶ 58 WEYE 0.57 0.087 ̶ 88 St. Regis River BB 0.25 0.088 ̶ 65 - mouth CHC 5.10 0.490 ̶ 90 SMB 0.64 0.346 ̶ 46 WEYE 0.33 0.153 ̶ 54 YP <0.15 0.025 nc3 1 Source: Sloan and Jock (1990). With the exception of carp from above the Moses Saunders Dam, all n were 3 or more in 1988. 2 n = 2 samples. 3 nc = Cannot be calculated. 4 Parenthetic values exclude outlier at 81.49 µg/g. 5 Parenthetic values exclude outlier at 12.26 µg/g. 6 Defined in 1988 collections as the "bay west of, but adjacent to, Raquette Point." 7 Parenthetic values exclude outlier at 46.84 µg/g.
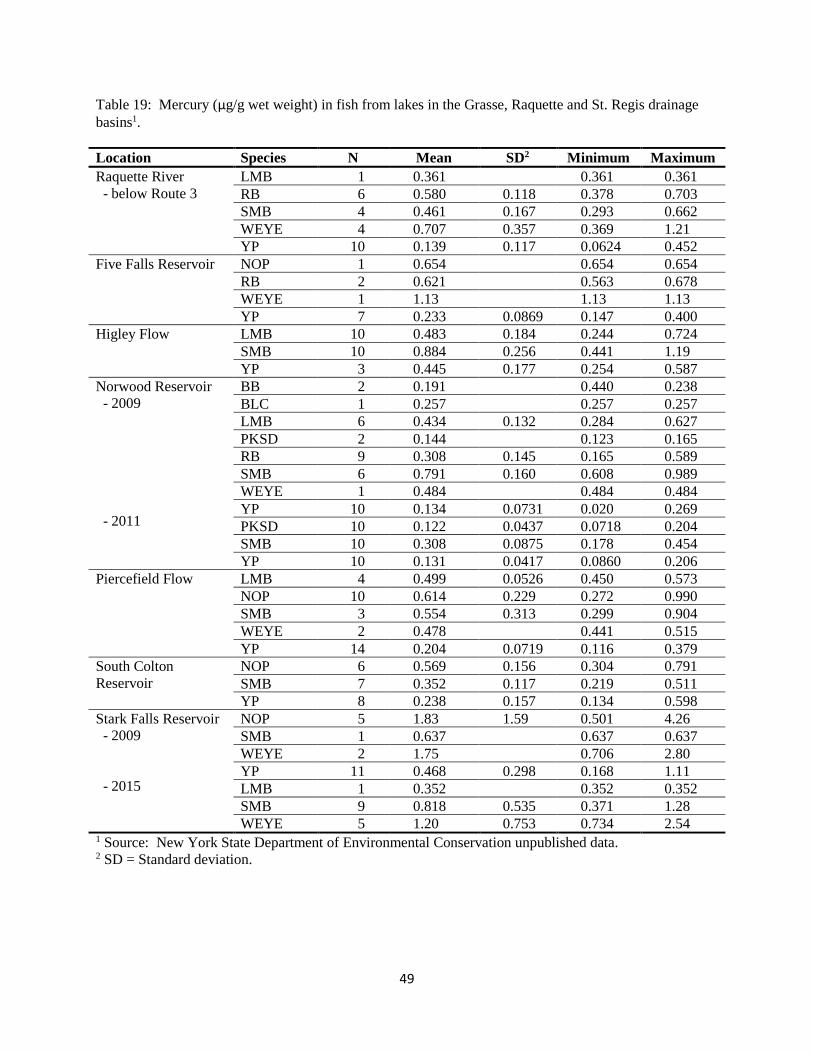
49
Table 19: Mercury (µg/g wet weight) in fish from lakes in the Grasse, Raquette and St. Regis drainage basins1. Location Species N Mean SD2 Minimum Maximum Raquette River - below Route 3
LMB 1 0.361 0.361 0.361 RB 6 0.580 0.118 0.378 0.703 SMB 4 0.461 0.167 0.293 0.662 WEYE 4 0.707 0.357 0.369 1.21 YP 10 0.139 0.117 0.0624 0.452
Five Falls Reservoir NOP 1 0.654 0.654 0.654 RB 2 0.621 0.563 0.678 WEYE 1 1.13 1.13 1.13 YP 7 0.233 0.0869 0.147 0.400
Higley Flow LMB 10 0.483 0.184 0.244 0.724 SMB 10 0.884 0.256 0.441 1.19 YP 3 0.445 0.177 0.254 0.587
Norwood Reservoir - 2009 - 2011
BB 2 0.191 0.440 0.238 BLC 1 0.257 0.257 0.257 LMB 6 0.434 0.132 0.284 0.627 PKSD 2 0.144 0.123 0.165 RB 9 0.308 0.145 0.165 0.589 SMB 6 0.791 0.160 0.608 0.989 WEYE 1 0.484 0.484 0.484 YP 10 0.134 0.0731 0.020 0.269 PKSD 10 0.122 0.0437 0.0718 0.204 SMB 10 0.308 0.0875 0.178 0.454 YP 10 0.131 0.0417 0.0860 0.206
Piercefield Flow LMB 4 0.499 0.0526 0.450 0.573 NOP 10 0.614 0.229 0.272 0.990 SMB 3 0.554 0.313 0.299 0.904 WEYE 2 0.478 0.441 0.515 YP 14 0.204 0.0719 0.116 0.379
South Colton Reservoir
NOP 6 0.569 0.156 0.304 0.791 SMB 7 0.352 0.117 0.219 0.511 YP 8 0.238 0.157 0.134 0.598
Stark Falls Reservoir - 2009 - 2015
NOP 5 1.83 1.59 0.501 4.26 SMB 1 0.637 0.637 0.637 WEYE 2 1.75 0.706 2.80 YP 11 0.468 0.298 0.168 1.11 LMB 1 0.352 0.352 0.352 SMB 9 0.818 0.535 0.371 1.28 WEYE 5 1.20 0.753 0.734 2.54
1 Source: New York State Department of Environmental Conservation unpublished data. 2 SD = Standard deviation.
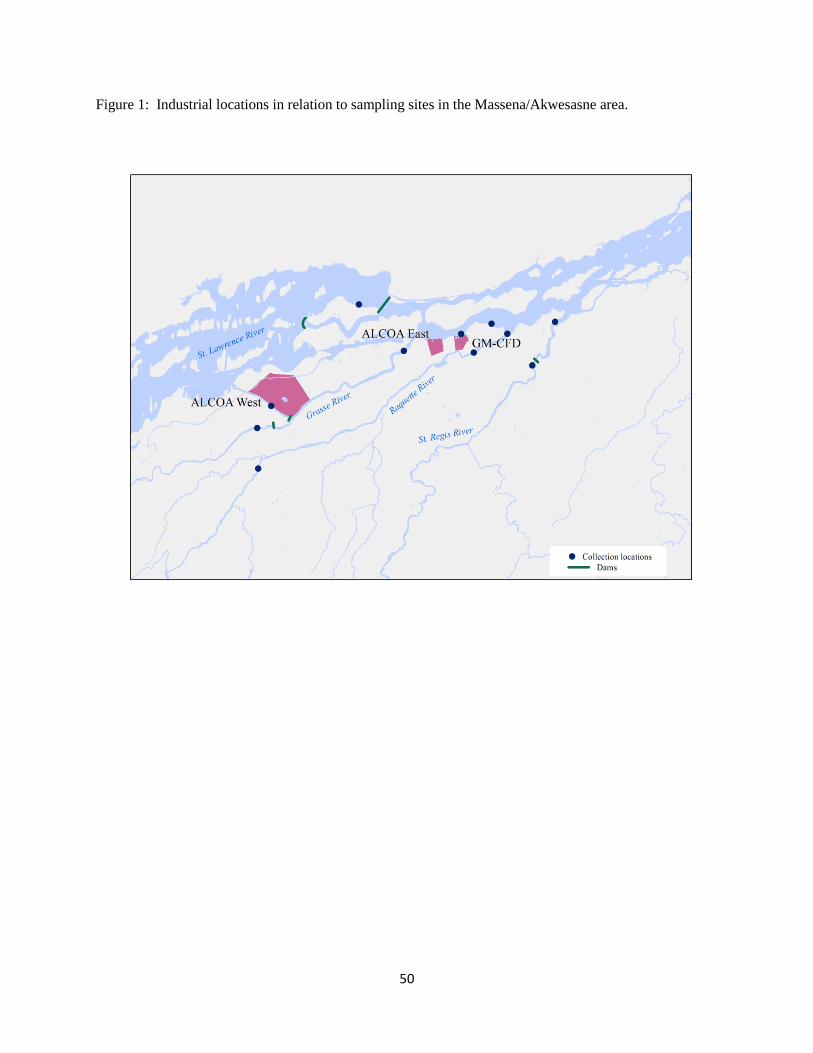
50
Figure 1: Industrial locations in relation to sampling sites in the Massena/Akwesasne area.
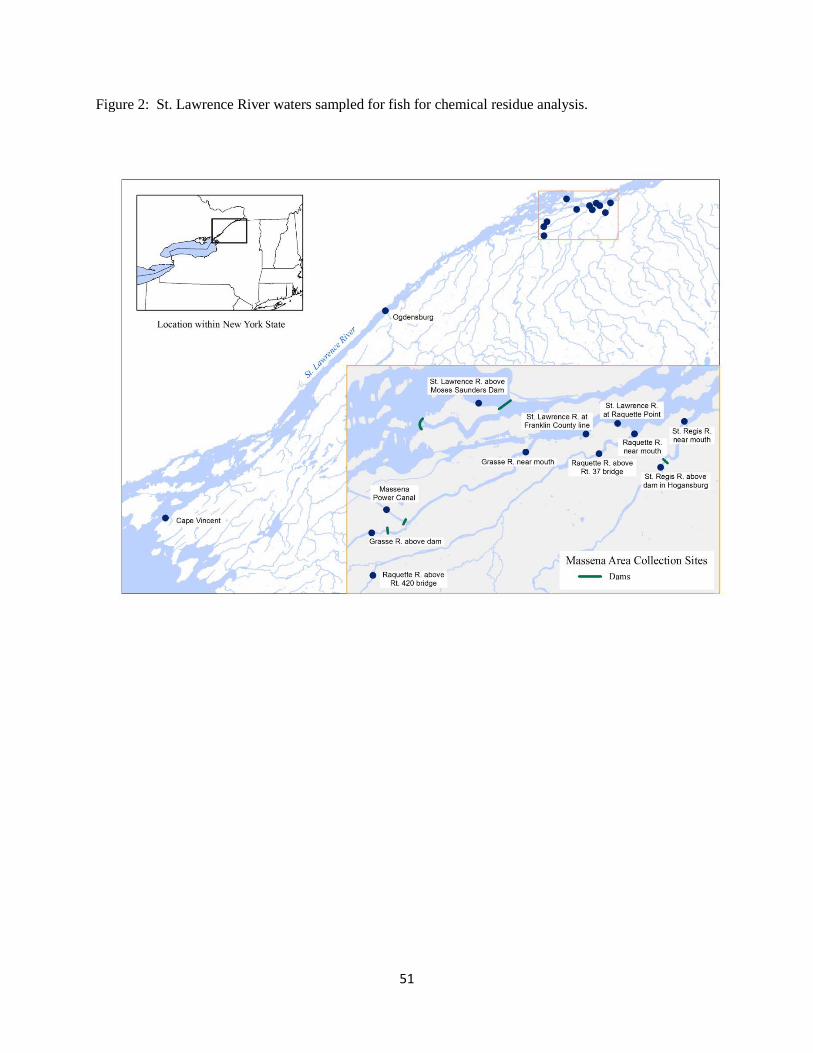
51
Figure 2: St. Lawrence River waters sampled for fish for chemical residue analysis.
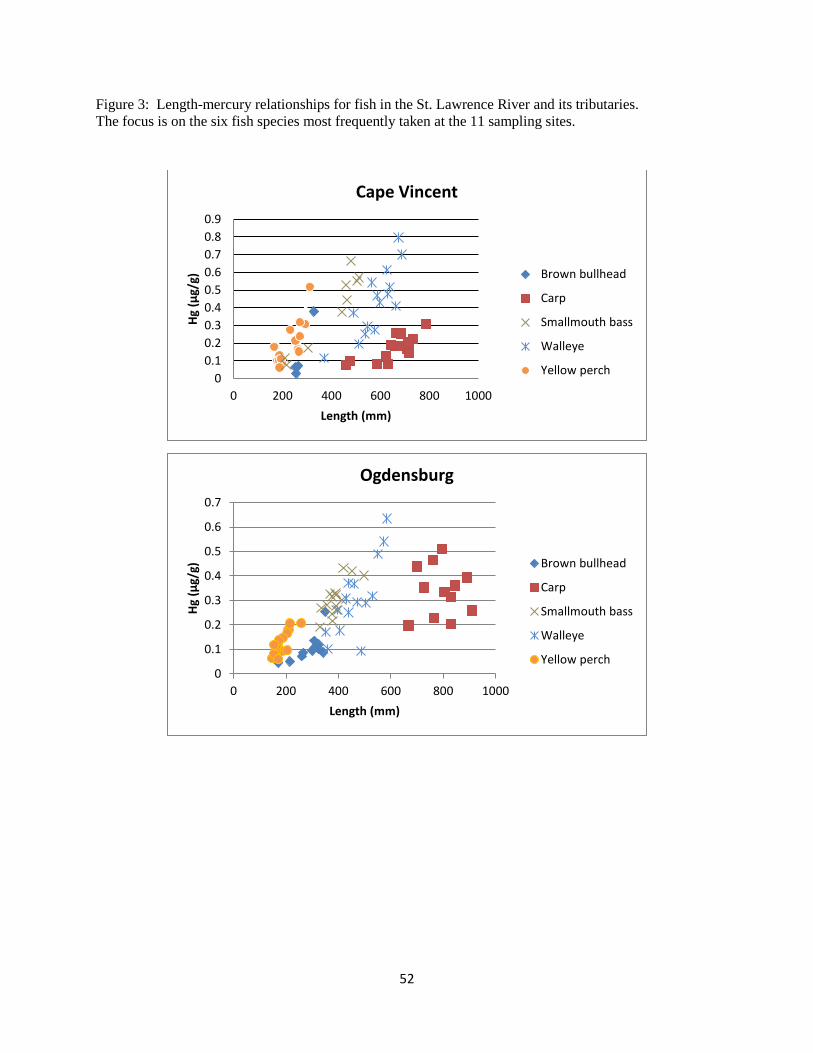
52
Figure 3: Length-mercury relationships for fish in the St. Lawrence River and its tributaries. The focus is on the six fish species most frequently taken at the 11 sampling sites.
00.10.20.30.40.50.60.70.80.9
0 200 400 600 800 1000
Hg (µ
g/g)
Length (mm)
Cape Vincent
Brown bullhead
Carp
Smallmouth bass
Walleye
Yellow perch
0
0.1
0.2
0.3
0.4
0.5
0.6
0.7
0 200 400 600 800 1000
Hg (µ
g/g)
Length (mm)
Ogdensburg
Brown bullhead
Carp
Smallmouth bass
Walleye
Yellow perch

53
0
0.2
0.4
0.6
0.8
1
1.2
0 200 400 600 800 1000
Hg (µ
g/g)
Length (mm)
Above Moses Saunders Dam
Brown bullhead
Carp
Channel catfish
Smallmouth bass
Walleye
Yellow perch
0
0.2
0.4
0.6
0.8
1
1.2
1.4
0 200 400 600 800 1000
Hg (µ
g/g)
Length (mm)
Raquette Point
Brown bullhead
Carp
Channel catfish
Smallmouth bass
Walleye
Yellow perch
00.10.20.30.40.50.60.70.80.9
1
0 200 400 600 800
Hg (µ
g/g)
Length (mm)
Franklin County line
Brown bullhead
Carp
Smallmouth bass
Walleye
Yellow perch
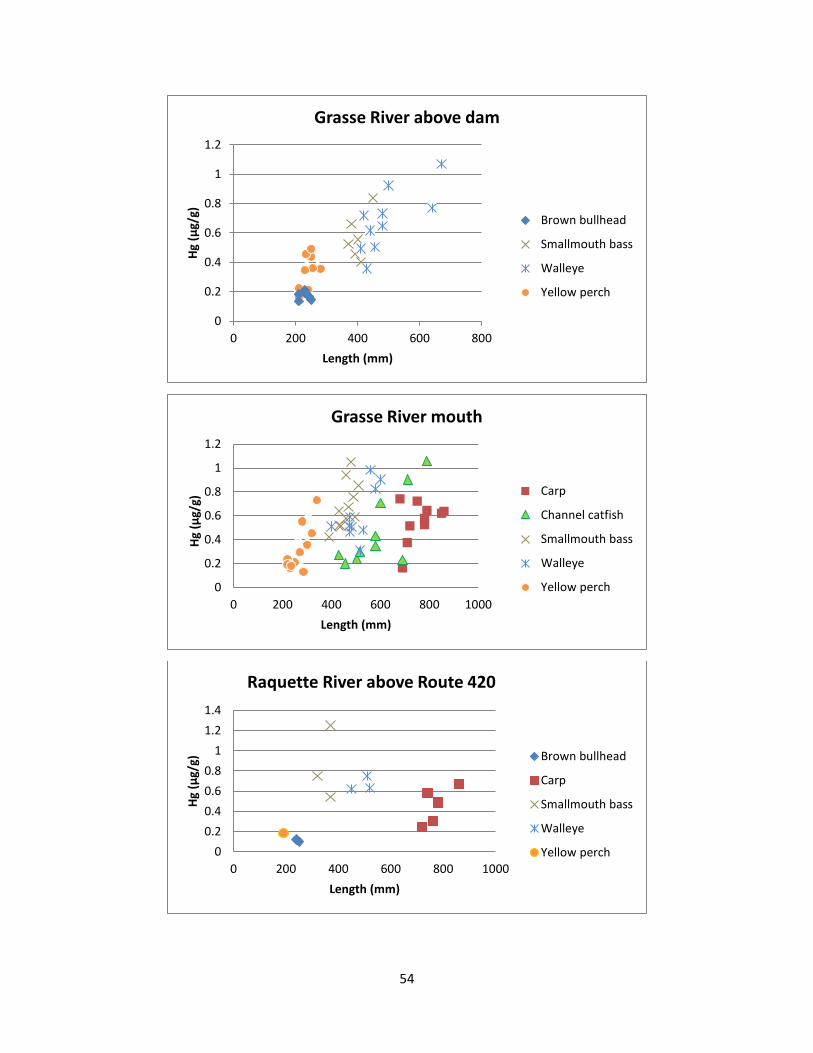
54
0
0.2
0.4
0.6
0.8
1
1.2
0 200 400 600 800
Hg (µ
g/g)
Length (mm)
Grasse River above dam
Brown bullhead
Smallmouth bass
Walleye
Yellow perch
0
0.2
0.4
0.6
0.8
1
1.2
0 200 400 600 800 1000
Hg (µ
g/g)
Length (mm)
Grasse River mouth
Carp
Channel catfish
Smallmouth bass
Walleye
Yellow perch
00.20.40.60.8
11.21.4
0 200 400 600 800 1000
Hg (µ
g/g)
Length (mm)
Raquette River above Route 420
Brown bullhead
Carp
Smallmouth bass
Walleye
Yellow perch
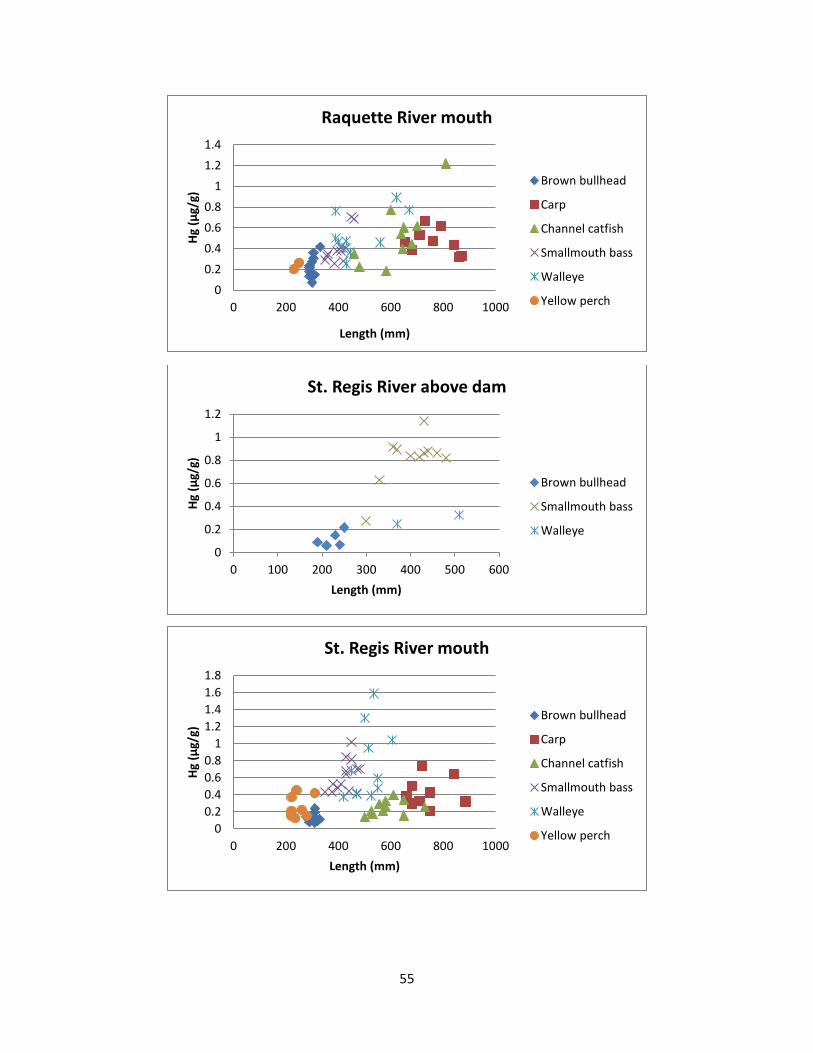
55
00.20.40.60.8
11.21.4
0 200 400 600 800 1000
Hg (µ
g/g)
Length (mm)
Raquette River mouth
Brown bullhead
Carp
Channel catfish
Smallmouth bass
Walleye
Yellow perch
0
0.2
0.4
0.6
0.8
1
1.2
0 100 200 300 400 500 600
Hg (µ
g/g)
Length (mm)
St. Regis River above dam
Brown bullhead
Smallmouth bass
Walleye
00.20.40.60.8
11.21.41.61.8
0 200 400 600 800 1000
Hg (µ
g/g)
Length (mm)
St. Regis River mouth
Brown bullhead
Carp
Channel catfish
Smallmouth bass
Walleye
Yellow perch

56
Figure 4: Concentration (µg/g wet weight) frequency distributions for p,p’-DDT analytes.
0
100
200
300
400
500
600
p,p'-DDD
0
50
100
150
200
250
300
p,p'-DDE
0
100
200
300
400
500
600
p,p'-DDT
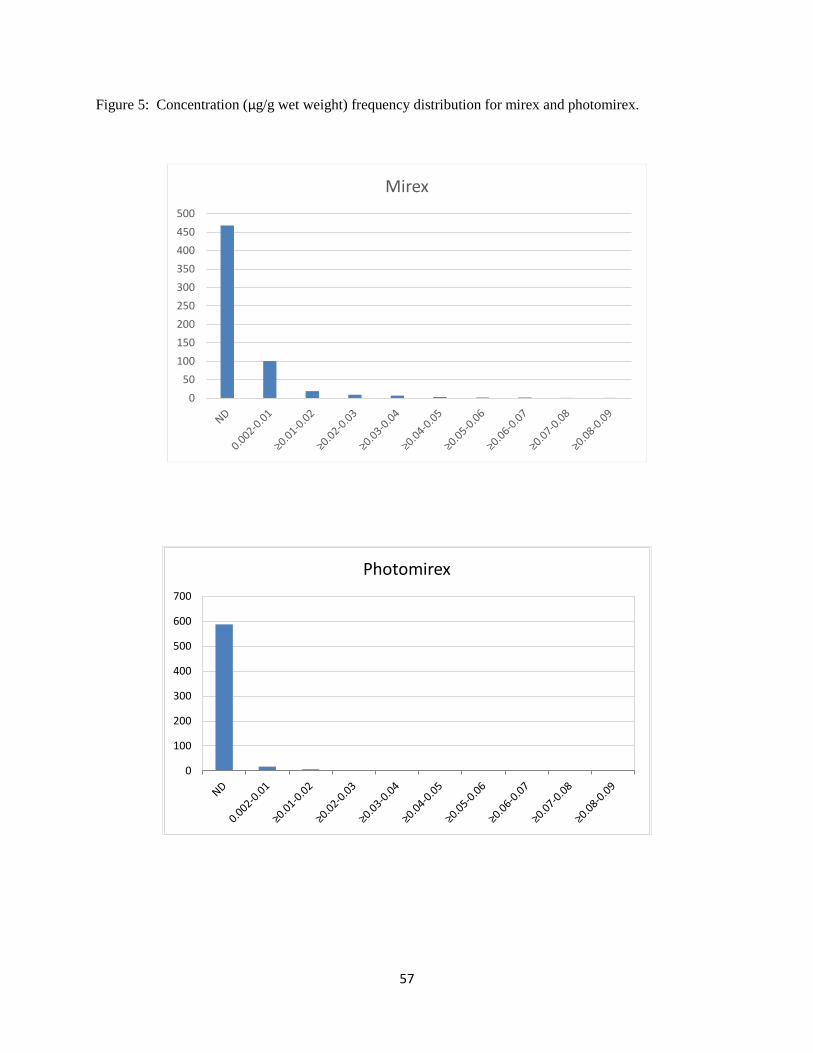
57
Figure 5: Concentration (µg/g wet weight) frequency distribution for mirex and photomirex.
050
100150200250300350400450500
Mirex
0
100
200
300
400
500
600
700
Photomirex
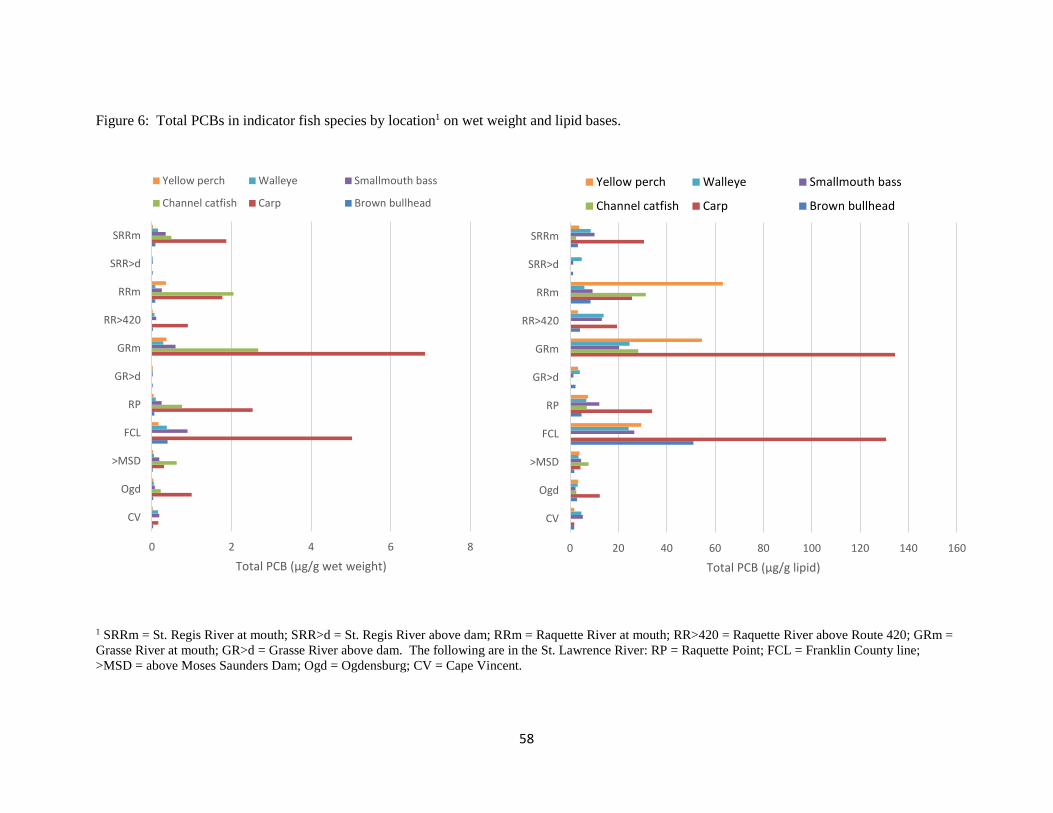
58
Figure 6: Total PCBs in indicator fish species by location1 on wet weight and lipid bases.
1 SRRm = St. Regis River at mouth; SRR>d = St. Regis River above dam; RRm = Raquette River at mouth; RR>420 = Raquette River above Route 420; GRm = Grasse River at mouth; GR>d = Grasse River above dam. The following are in the St. Lawrence River: RP = Raquette Point; FCL = Franklin County line; >MSD = above Moses Saunders Dam; Ogd = Ogdensburg; CV = Cape Vincent.
0 20 40 60 80 100 120 140 160
CV
Ogd
>MSD
FCL
RP
GR>d
GRm
RR>420
RRm
SRR>d
SRRm
Total PCB (µg/g lipid)
Yellow perch Walleye Smallmouth bass
Channel catfish Carp Brown bullhead
0 2 4 6 8
CV
Ogd
>MSD
FCL
RP
GR>d
GRm
RR>420
RRm
SRR>d
SRRm
Total PCB (µg/g wet weight)
Yellow perch Walleye Smallmouth bass
Channel catfish Carp Brown bullhead
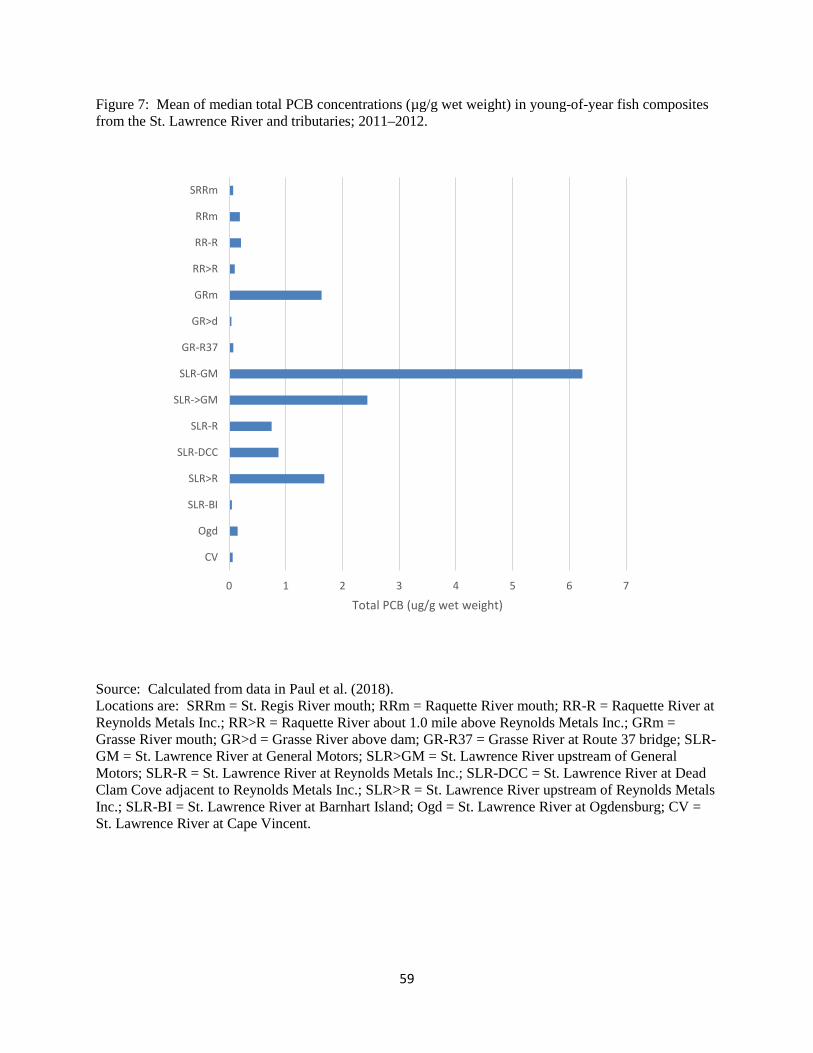
59
Figure 7: Mean of median total PCB concentrations (µg/g wet weight) in young-of-year fish composites from the St. Lawrence River and tributaries; 2011–2012.
Source: Calculated from data in Paul et al. (2018). Locations are: SRRm = St. Regis River mouth; RRm = Raquette River mouth; RR-R = Raquette River at Reynolds Metals Inc.; RR>R = Raquette River about 1.0 mile above Reynolds Metals Inc.; GRm = Grasse River mouth; GR>d = Grasse River above dam; GR-R37 = Grasse River at Route 37 bridge; SLR-GM = St. Lawrence River at General Motors; SLR>GM = St. Lawrence River upstream of General Motors; SLR-R = St. Lawrence River at Reynolds Metals Inc.; SLR-DCC = St. Lawrence River at Dead Clam Cove adjacent to Reynolds Metals Inc.; SLR>R = St. Lawrence River upstream of Reynolds Metals Inc.; SLR-BI = St. Lawrence River at Barnhart Island; Ogd = St. Lawrence River at Ogdensburg; CV = St. Lawrence River at Cape Vincent.
0 1 2 3 4 5 6 7
CV
Ogd
SLR-BI
SLR>R
SLR-DCC
SLR-R
SLR->GM
SLR-GM
GR-R37
GR>d
GRm
RR>R
RR-R
RRm
SRRm
Total PCB (ug/g wet weight)
Related Documents