10 4 - 10 6 ◦ ◦ z f z = f +∆z z = D D/f |∆z|

Welcome message from author
This document is posted to help you gain knowledge. Please leave a comment to let me know what you think about it! Share it to your friends and learn new things together.
Transcript
X-ray microlaminography with polycapillary opticsK. M. D¡browski, D. T. Dul, A. Wróbel, and P. Koreckia)
Institute of Physics, Jagiellonian University, Reymonta 4, 30-059 Kraków, Poland
(Dated: 20 May 2013)
We demonstrate layer-by-layer x-ray microimaging using polycapillary optics. The depth resolution is achievedwithout sample or source rotation and in a way similar to classical tomography or laminography. The methodtakes advantage from large angular apertures of polycapillary optics and from their speci�c microstructure,which is treated as a coded aperture. The imaging geometry is compatible with polychromatic x-ray sourcesand with scanning and confocal x-ray �uorescence setups.
Since their discovery, x-rays have been used to visualizethe internal structure of objects. The depth informationis, however, lost in a single x-ray projection. Imaging ofslices localized at particular depths is possible my meansof x-ray laminography.1 It was invented before the eraof computed tomography (CT)2 and is also referred toas classical or linear tomography.3 Nowadays laminog-raphy is mainly used in geometries with limited angleaccess in medical imaging4 or for material testing.5 Morerecently, laminography was implemented for x-ray mi-croscopy using synchrotron radiation6,7 and extended tophase-contrast imaging.8,9
The original geometry of laminography is presentedin Fig. 1(a). When the x-ray source and the �lm aretranslated synchronously in opposite directions only ob-jects located at the so called focal plane are imagedsharply. Projections of objects located at di�erent depthsare blurred. Contemporary approaches use 2D detectorsand by means of digital tomosynthesis10 or computedlaminography5 reconstruct the 3D image of the object.X-ray laminography can be performed using multiplesources or as demonstrated more recently, using multi-beam sources based on carbon nanotube �eld-emitters.11
The sources can be �ashed either sequentially or simul-taneously. In the latter case, the projections formed byindividual beams overlap and a speci�c arrangement ofsources12 and the so called coded aperture approach13,14
is required for object visualization.
A unique possibility to generate multiple x-ray micro-beams is provided by polycapillary optics.15,16 Polycapil-lary elements are arrays of a large number (104 − 106) ofglass capillaries in which x-rays travel by means of totalexternal re�ections. A special bending of capillaries al-lows one to focus radiation from laboratory x-ray sourcesor synchrotrons into micro-spots. Importantly, angularapertures of polycapillary optics are orders of magnitudelarger compared to typical x-ray optics17 and can reach10◦-20◦. Very recently we demonstrated a method forx-ray imaging of objects inside the focal spot of poly-capillary optics.18 This method is based on the codedaperture concept and resolves lateral details of objectssmaller than the focal spot dimensions.
a)Corresponding author:[email protected]
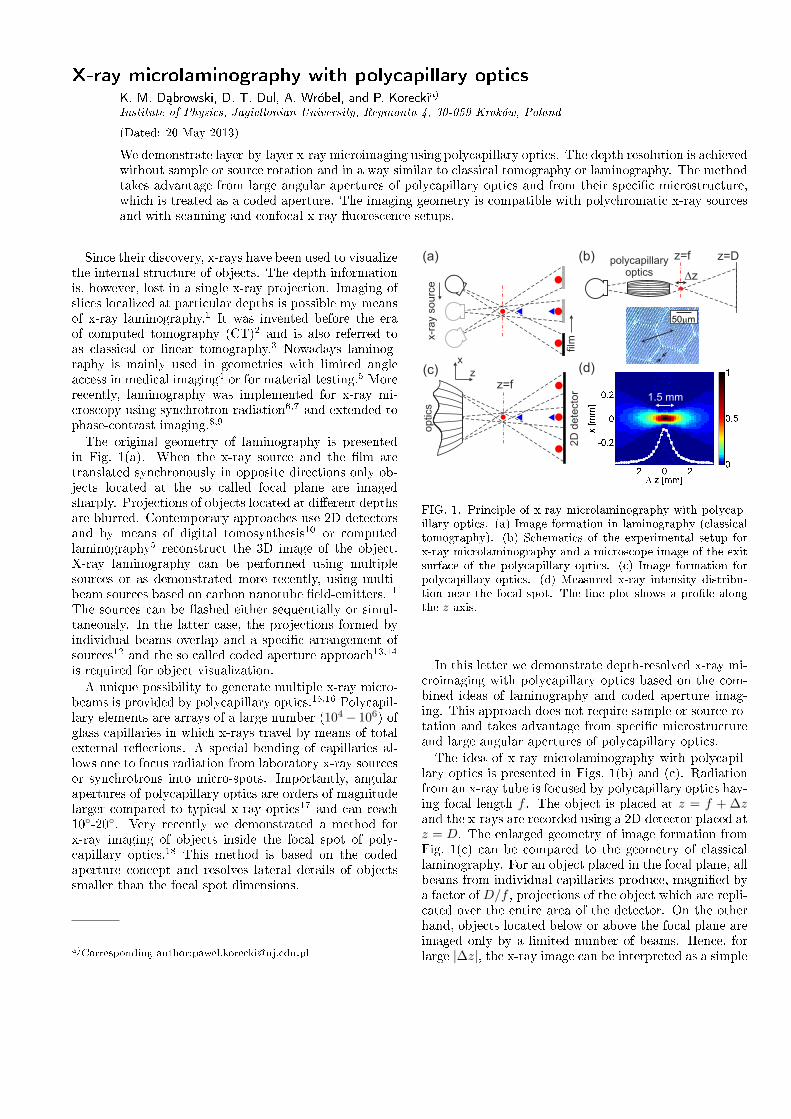
FIG. 1. Principle of x-ray microlaminography with polycap-illary optics. (a) Image formation in laminography (classicaltomography). (b) Schematics of the experimental setup forx-ray microlaminography and a microscope image of the exitsurface of the polycapillary optics. (c) Image formation forpolycapillary optics. (d) Measured x-ray intensity distribu-tion near the focal spot. The line plot shows a pro�le alongthe z axis.
In this letter we demonstrate depth-resolved x-ray mi-croimaging with polycapillary optics based on the com-bined ideas of laminography and coded aperture imag-ing. This approach does not require sample or source ro-tation and takes advantage from speci�c microstructureand large angular apertures of polycapillary optics.
The idea of x-ray microlaminography with polycapil-lary optics is presented in Figs. 1(b) and (c). Radiationfrom an x-ray tube is focused by polycapillary optics hav-ing focal length f . The object is placed at z = f + ∆zand the x-rays are recorded using a 2D detector placed atz = D. The enlarged geometry of image formation fromFig. 1(c) can be compared to the geometry of classicallaminography. For an object placed in the focal plane, allbeams from individual capillaries produce, magni�ed bya factor of D/f , projections of the object which are repli-cated over the entire area of the detector. On the otherhand, objects located below or above the focal plane areimaged only by a limited number of beams. Hence, forlarge |∆z|, the x-ray image can be interpreted as a simple
2
projection of the object relative to the focal point. Thisqualitative change in the character of the x-ray imagewill provide a basis for depth-resolved x-ray imaging.In order to realize x-ray microlaminography with poly-
capillary optics we used an experimental setup with a Wtarget x-ray tube having a 75 µm spot (Oxford Instru-ments, XTF 5011) operated at 1 mA and 50 keV. Poly-capillary focusing optics (IfG) had an output focal lengthf = 14 mm and exit surface diameter DA = 2.4 mm,which corresponds to an angular aperture α ≈ DA/f ≈9.8◦. Figure 1(b) shows a microscope image of the surfaceof the optics revealing a hexagonal mesh of capillaries anda coarser mesh corresponding to bundles of capillaries.Figure 1(d) presents the measured intensity distributionin the vicinity of the focal spot. The focal spot has anapproximate Gaussian shape with FWHM of 41 µm inthe lateral plane and a Lorenzian shape with FWHM of1.5 mm along the optical axis. Note that, when polycap-illary optics is used in scanning or confocal geometries,the dimensions of the focal spot set the limit of the spa-tial resolution.19�21 The �ux in the beam having a meanenergy of 22 keV was ∼ 108 photon/s. X-ray images weremeasured using a scintillator coupled to a CMOS sensor(Rad-Icon, RadEye1) with 1024×512 pixels spaced by 48µm. The camera was placed at a distance D = 165 mmfrom the exit surface of the lens.Let us �rst demonstrate the transmission from projec-
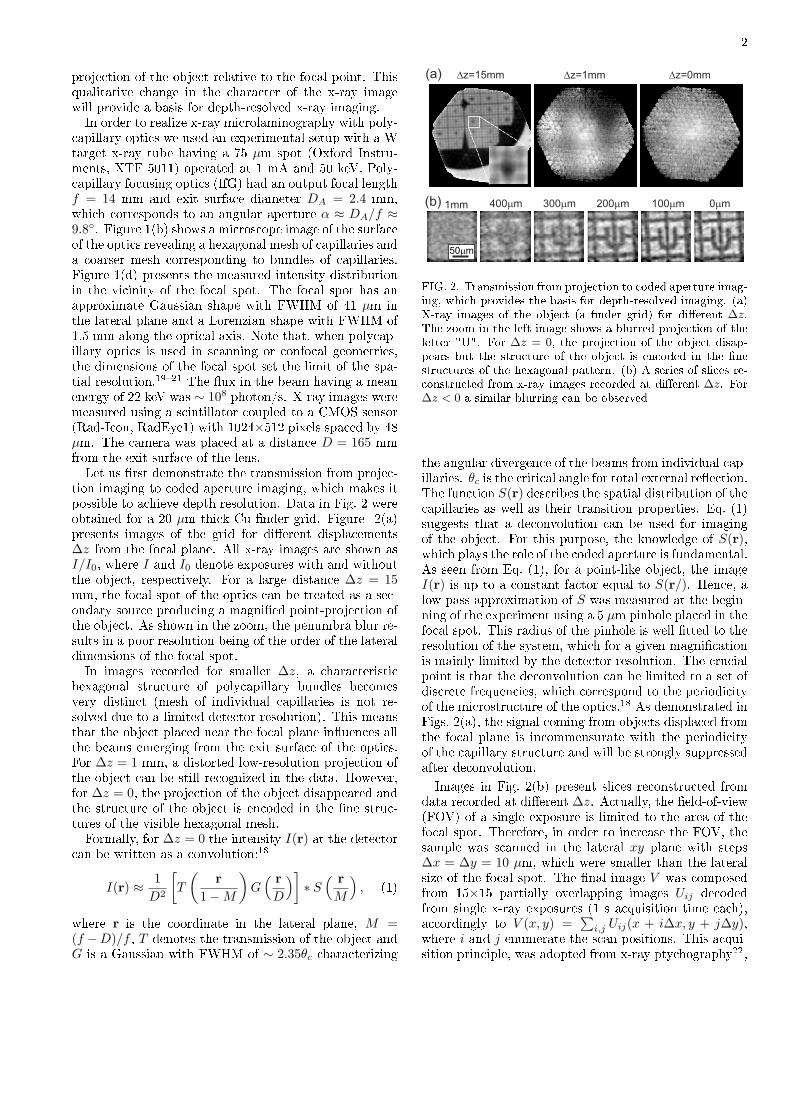
tion imaging to coded aperture imaging, which makes itpossible to achieve depth resolution. Data in Fig. 2 wereobtained for a 20 µm thick Cu �nder grid. Figure 2(a)presents images of the grid for di�erent displacements∆z from the focal plane. All x-ray images are shown asI/I0, where I and I0 denote exposures with and withoutthe object, respectively. For a large distance ∆z = 15mm, the focal spot of the optics can be treated as a sec-ondary source producing a magni�ed point-projection ofthe object. As shown in the zoom, the penumbra blur re-sults in a poor resolution being of the order of the lateraldimensions of the focal spot.In images recorded for smaller ∆z, a characteristic
hexagonal structure of polycapillary bundles becomesvery distinct (mesh of individual capillaries is not re-solved due to a limited detector resolution). This meansthat the object placed near the focal plane in�uences allthe beams emerging from the exit surface of the optics.For ∆z = 1 mm, a distorted low-resolution projection ofthe object can be still recognized in the data. However,for ∆z = 0, the projection of the object disappeared andthe structure of the object is encoded in the �ne struc-tures of the visible hexagonal mesh.Formally, for ∆z = 0 the intensity I(r) at the detector
can be written as a convolution:18
I(r) ≈ 1
D2
[T
(r
1−M
)G( r
D
)]∗ S
( r
M
), (1)
where r is the coordinate in the lateral plane, M =(f −D)/f , T denotes the transmission of the object andG is a Gaussian with FWHM of ∼ 2.35θc characterizing
FIG. 2. Transmission from projection to coded aperture imag-ing, which provides the basis for depth-resolved imaging. (a)X-ray images of the object (a �nder grid) for di�erent ∆z.The zoom in the left image shows a blurred projection of theletter "U". For ∆z = 0, the projection of the object disap-pears but the structure of the object is encoded in the �nestructures of the hexagonal pattern. (b) A series of slices re-constructed from x-ray images recorded at di�erent ∆z. For∆z < 0 a similar blurring can be observed
the angular divergence of the beams from individual cap-illaries. θc is the critical angle for total external re�ection.The function S(r) describes the spatial distribution of thecapillaries as well as their transition properties. Eq. (1)suggests that a deconvolution can be used for imagingof the object. For this purpose, the knowledge of S(r),which plays the role of the coded aperture is fundamental.As seen from Eq. (1), for a point-like object, the imageI(r) is up to a constant factor equal to S(r/). Hence, alow-pass approximation of S was measured at the begin-ning of the experiment using a 5 µm pinhole placed in thefocal spot. This radius of the pinhole is well �tted to theresolution of the system, which for a given magni�cationis mainly limited by the detector resolution. The crucialpoint is that the deconvolution can be limited to a set ofdiscrete frequencies, which correspond to the periodicityof the microstructure of the optics.18 As demonstrated inFigs. 2(a), the signal coming from objects displaced fromthe focal plane is incommensurate with the periodicityof the capillary structure and will be strongly suppressedafter deconvolution.
Images in Fig. 2(b) present slices reconstructed fromdata recorded at di�erent ∆z. Actually, the �eld-of-view(FOV) of a single exposure is limited to the area of thefocal spot. Therefore, in order to increase the FOV, thesample was scanned in the lateral xy plane with steps∆x = ∆y = 10 µm, which were smaller than the lateralsize of the focal spot. The �nal image V was composedfrom 15×15 partially overlapping images Uij decodedfrom single x-ray exposures (1 s acquisition time each),accordingly to V (x, y) =
∑i,j Uij(x + i∆x, y + j∆y),
where i and j enumerate the scan positions. This acqui-sition principle, was adopted from x-ray ptychography22,
3
and was shown to improve the data quality.18
For ∆z = 0, the reconstruction procedure provided animage of the object with a lateral resolution of δx ≈ 8µm,which is much better than the lateral size of the fo-cal spot. However, with increasing ∆z the image ofthe object becomes less intense and, most importantly,blurred. This blurring denotes, that the depth resolu-tion depends on the frequency of the object in the lateralplane. In classical laminography the depth resolution re-sulting from blurring of the out-of-focal plane signal canbe estimated as:3
δz(ν) ≈ 1
αν, (2)
where ν denotes the frequency in the lateral plane and αdescribes the range of viewing angles. Hence, for ∆z >∼δz(ν)/2 all frequencies in the decoded images that arehigher than ν will be strongly suppressed.Let us use Eq. (2) for a qualitative description of our
data. In such a case, α denotes the angular aperture ofthe polycapillary optics. While α is very large comparedto angular apertures of other types of x-ray optics, it isrelatively small compared to angular ranges in classicallaminography. This results in a limitation of the reso-lution along the depth direction. For example, for thehighest resolved frequency of νmax = 1/(2δx), Eq. (2)predicts a limit of the depth resolution as δzmin ≈ 93µm. However, for lower spatial frequencies, δz is propor-tionally larger as visible in Fig. 2(b).In order to directly demonstrate the depth resolution,
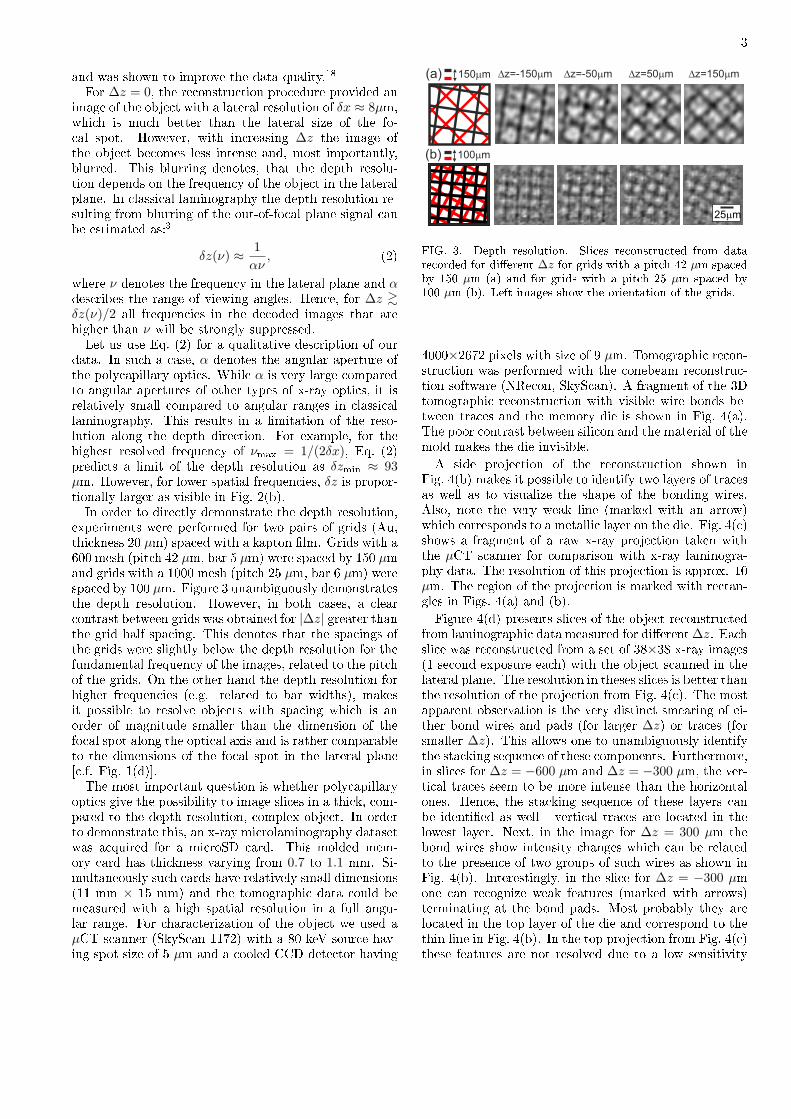
experiments were performed for two pairs of grids (Au,thickness 20 µm) spaced with a kapton �lm. Grids with a600 mesh (pitch 42 µm, bar 5 µm) were spaced by 150 µmand grids with a 1000 mesh (pitch 25 µm, bar 6 µm) werespaced by 100 µm. Figure 3 unambiguously demonstratesthe depth resolution. However, in both cases, a clearcontrast between grids was obtained for |∆z| greater thanthe grid half spacing. This denotes that the spacings ofthe grids were slightly below the depth resolution for thefundamental frequency of the images, related to the pitchof the grids. On the other hand the depth resolution forhigher frequencies (e.g. related to bar widths), makesit possible to resolve objects with spacing which is anorder of magnitude smaller than the dimension of thefocal spot along the optical axis and is rather comparableto the dimensions of the focal spot in the lateral plane[c.f. Fig. 1(d)].The most important question is whether polycapillary
optics give the possibility to image slices in a thick, com-pared to the depth resolution, complex object. In orderto demonstrate this, an x-ray microlaminography datasetwas acquired for a microSD card. This molded mem-ory card has thickness varying from 0.7 to 1.1 mm. Si-multaneously such cards have relatively small dimensions(11 mm × 15 mm) and the tomographic data could bemeasured with a high spatial resolution in a full angu-lar range. For characterization of the object we used aµCT scanner (SkyScan 1172) with a 80 keV source hav-ing spot size of 5 µm and a cooled CCD detector having
FIG. 3. Depth resolution. Slices reconstructed from datarecorded for di�erent ∆z for grids with a pitch 42 µm spacedby 150 µm (a) and for grids with a pitch 25 µm spaced by100 µm (b). Left images show the orientation of the grids.
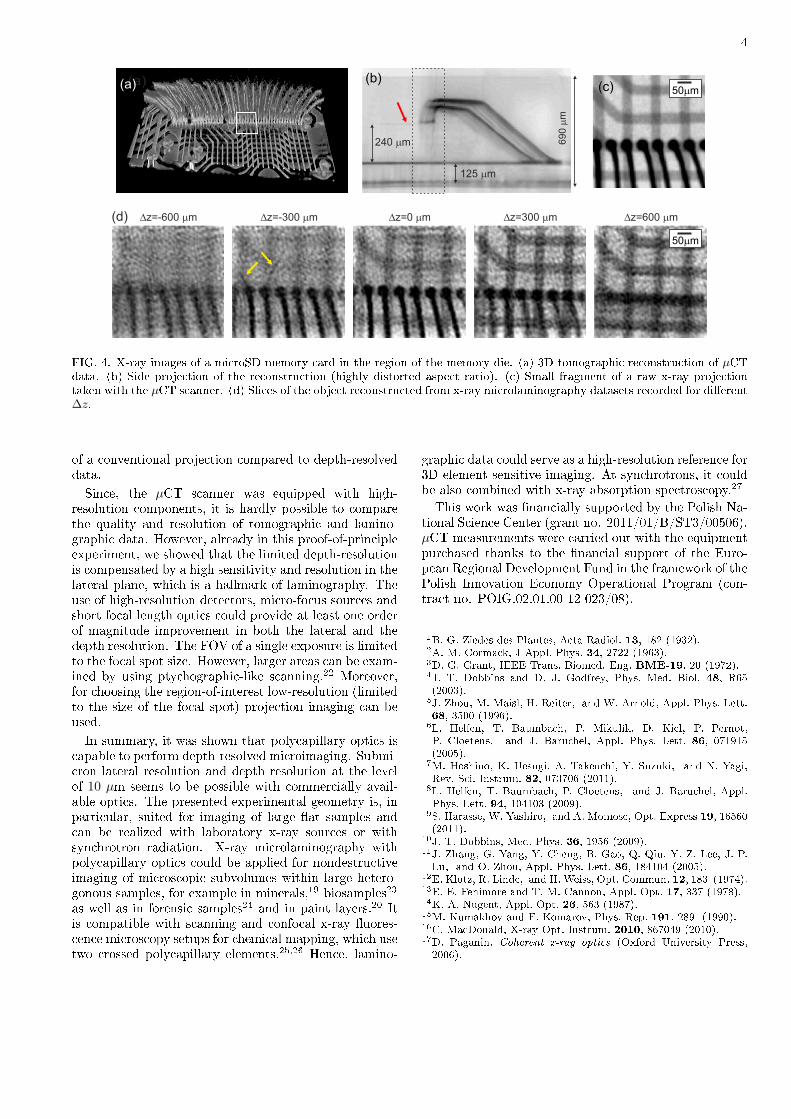
4000×2672 pixels with size of 9 µm. Tomographic recon-struction was performed with the conebeam reconstruc-tion software (NRecon, SkyScan). A fragment of the 3Dtomographic reconstruction with visible wire bonds be-tween traces and the memory die is shown in Fig. 4(a).The poor contrast between silicon and the material of themold makes the die invisible.
A side projection of the reconstruction shown inFig. 4(b) makes it possible to identify two layers of tracesas well as to visualize the shape of the bonding wires.Also, note the very weak line (marked with an arrow)which corresponds to a metallic layer on the die. Fig. 4(c)shows a fragment of a raw x-ray projection taken withthe µCT scanner for comparison with x-ray laminogra-phy data. The resolution of this projection is approx. 10µm. The region of the projection is marked with rectan-gles in Figs. 4(a) and (b).
Figure 4(d) presents slices of the object reconstructedfrom laminographic data measured for di�erent∆z. Eachslice was reconstructed from a set of 38×38 x-ray images(1 second exposure each) with the object scanned in thelateral plane. The resolution in theses slices is better thanthe resolution of the projection from Fig. 4(c). The mostapparent observation is the very distinct smearing of ei-ther bond wires and pads (for larger ∆z) or traces (forsmaller ∆z). This allows one to unambiguously identifythe stacking sequence of these components. Furthermore,in slices for ∆z = −600 µm and ∆z = −300 µm, the ver-tical traces seem to be more intense than the horizontalones. Hence, the stacking sequence of these layers canbe identi�ed as well - vertical traces are located in thelowest layer. Next, in the image for ∆z = 300 µm thebond wires show intensity changes which can be relatedto the presence of two groups of such wires as shown inFig. 4(b). Interestingly, in the slice for ∆z = −300 µmone can recognize weak features (marked with arrows)terminating at the bond pads. Most probably they arelocated in the top layer of the die and correspond to thethin line in Fig. 4(b). In the top projection from Fig. 4(c)these features are not resolved due to a low sensitivity
4
FIG. 4. X-ray images of a microSD memory card in the region of the memory die. (a) 3D tomographic reconstruction of µCTdata. (b) Side projection of the reconstruction (highly distorted aspect ratio). (c) Small fragment of a raw x-ray projectiontaken with the µCT scanner. (d) Slices of the object reconstructed from x-ray microlaminography datasets recorded for di�erent∆z.
of a conventional projection compared to depth-resolveddata.
Since, the µCT scanner was equipped with high-resolution components, it is hardly possible to comparethe quality and resolution of tomographic and lamino-graphic data. However, already in this proof-of-principleexperiment, we showed that the limited depth-resolutionis compensated by a high sensitivity and resolution in thelateral plane, which is a hallmark of laminography. Theuse of high-resolution detectors, micro-focus sources andshort focal length optics could provide at least one orderof magnitude improvement in both the lateral and thedepth resolution. The FOV of a single exposure is limitedto the focal spot size. However, larger areas can be exam-ined by using ptychographic-like scanning.22 Moreover,for choosing the region-of-interest low-resolution (limitedto the size of the focal spot) projection imaging can beused.
In summary, it was shown that polycapillary optics iscapable to perform depth-resolved microimaging. Submi-cron lateral resolution and depth resolution at the levelof 10 µm seems to be possible with commercially avail-able optics. The presented experimental geometry is, inparticular, suited for imaging of large �at samples andcan be realized with laboratory x-ray sources or withsynchrotron radiation. X-ray microlaminography withpolycapillary optics could be applied for nondestructiveimaging of microscopic subvolumes within large hetero-gonous samples, for example in minerals,19 biosamples23
as well as in forensic samples24 and in paint layers.20 Itis compatible with scanning and confocal x-ray �uores-cence microscopy setups for chemical mapping, which usetwo crossed polycapillary elements.25,26 Hence, lamino-
graphic data could serve as a high-resolution reference for3D element sensitive imaging. At synchrotrons, it couldbe also combined with x-ray absorption spectroscopy.27
This work was �nancially supported by the Polish Na-tional Science Center (grant no. 2011/01/B/ST3/00506).µCT measurements were carried out with the equipmentpurchased thanks to the �nancial support of the Euro-pean Regional Development Fund in the framework of thePolish Innovation Economy Operational Program (con-tract no. POIG.02.01.00-12-023/08).
1B. G. Ziedes des Plantes, Acta Radiol. 13, 182 (1932).2A. M. Cormack, J Appl. Phys. 34, 2722 (1963).3D. G. Grant, IEEE Trans. Biomed. Eng. BME-19, 20 (1972).4J. T. Dobbins and D. J. Godfrey, Phys. Med. Biol. 48, R65(2003).
5J. Zhou, M. Maisl, H. Reiter, and W. Arnold, Appl. Phys. Lett.68, 3500 (1996).
6L. Helfen, T. Baumbach, P. Mikulík, D. Kiel, P. Pernot,P. Cloetens, and J. Baruchel, Appl. Phys. Lett. 86, 071915(2005).
7M. Hoshino, K. Uesugi, A. Takeuchi, Y. Suzuki, and N. Yagi,Rev. Sci. Instrum. 82, 073706 (2011).
8L. Helfen, T. Baumbach, P. Cloetens, and J. Baruchel, Appl.Phys. Lett. 94, 104103 (2009).
9S. Harasse, W. Yashiro, and A. Momose, Opt. Express 19, 16560(2011).
10J. T. Dobbins, Med. Phys. 36, 1956 (2009).11J. Zhang, G. Yang, Y. Cheng, B. Gao, Q. Qiu, Y. Z. Lee, J. P.Lu, and O. Zhou, Appl. Phys. Lett. 86, 184104 (2005).
12E. Klotz, R. Linde, and H. Weiss, Opt. Commun. 12, 183 (1974).13E. E. Fenimore and T. M. Cannon, Appl. Opt. 17, 337 (1978).14K. A. Nugent, Appl. Opt. 26, 563 (1987).15M. Kumakhov and F. Komarov, Phys. Rep. 191, 289 (1990).16C. MacDonald, X-ray Opt. Instrum. 2010, 867049 (2010).17D. Paganin, Coherent x-ray optics (Oxford University Press,2006).

5
18K. M. Dabrowski, D. T. Dul, and P. Korecki, Opt. Express 21,2920 (2013).
19L. Vincze, B. Vekemans, F. Brenker, G. Falkenberg, K. Rickers,A. Somogyi, M. Kersten, and F. Adams, Anal. Chem. 76, 6786(2004).
20B. Kanngiesser, W. Malzer, A. Rodriguez, and I. Reiche, Spec-trochim. Acta B 60, 41 (2005).
21T. Sun and C. A. MacDonald, J. Appl. Phys. 113, 053104 (2013).22J. M. Rodenburg, A. C. Hurst, A. G. Cullis, B. R. Dobson,F. Pfei�er, O. Bunk, C. David, K. Je�movs, and I. Johnson,
Phys. Rev. Lett. 98, 034801 (2007).23M. D. de Jonge and S. Vogt, Curr. Opin. Struct. Biol. 20, 606(2010).
24K. Nakano, C. Nishi, K. Otsuki, Y. Nishiwaki, and K. Tsuji,Analytical Chemistry 83, 3477 (2011).
25K. Janssens, K. Proost, and G. Falkenberg, Spectrochim. ActaB 59, 1637 (2004).
26B. M. Patterson, J. Campbell, and G. J. Havrilla, X-Ray Spec-trom. 39, 184 (2010).
27L. Lühl, I. Mantouvalou, W. Malzer, I. Schaumann, C. Vogt,O. Hahn, and B. Kanngiesser, Anal. Chem. 84, 1907 (2012).
Related Documents