1 X-ray harmonic comb from relativistic electron spikes Alexander S. Pirozhkov 1 , Masaki Kando 1 , Timur Zh. Esirkepov 1 , Eugene N. Ragozin 2,3 , Anatoly Ya. Faenov 1,4 , Tatiana A. Pikuz 1,4 , Tetsuya Kawachi 1 , Akito Sagisaka 1 , Michiaki Mori 1 , Keigo Kawase 1 , James K. Koga 1 , Takashi Kameshima 1 , Yuji Fukuda 1 , Liming Chen 1,† , Izuru Daito 1 , Koichi Ogura 1 , Yukio Hayashi 1 , Hideyuki Kotaki 1 , Hiromitsu Kiriyama 1 , Hajime Okada 1 , Nobuyuki Nishimori 1 , Kiminori Kondo 1 , Toyoaki Kimura 1 , Toshiki Tajima 1,§ , Hiroyuki Daido 1 , Yoshiaki Kato 1,‡ & Sergei V. Bulanov 1,5 1 Advanced Photon Research Center, Japan Atomic Energy Agency, 8-1-7 Umemidai, Kizugawa-shi, Kyoto 619-0215, Japan; 2 P. N. Lebedev Physical Institute of the Russian Academy of Sciences, Leninsky Prospekt 53, 119991 Moscow, Russia; 3 Moscow Institute of Physics and Technology (State University), Institutskii pereulok 9, 141700 Dolgoprudnyi, Moscow Region, Russia; 4 Joint Institute of High Temperatures of the Russian Academy of Sciences, Izhorskaja Street 13/19, 127412 Moscow, Russia; 5 A. M. Prokhorov Institute of General Physics of the Russian Academy of Sciences, Vavilov Street 38, 119991 Moscow, Russia † Present address: Institute of Physics of the Chinese Academy of Sciences, Beijing, China. § Present address: Ludwig-Maximilians-University, Germany. ‡ Present address: The Graduate School for the Creation of New Photonics Industries, 1955-1 Kurematsu-cho, Nishiku, Hamamatsu, Shizuoka, 431- 1202, Japan. X-ray devices providing nanometre spatial 1 and attosecond 2 temporal resolution are far superior to longer wavelength and lower frequency optical ones. Such resolution is indispensable in biology, medicine, physics, material sciences, and their applications. A bright ultrafast coherent X-ray source is highly desirable, as

Welcome message from author
This document is posted to help you gain knowledge. Please leave a comment to let me know what you think about it! Share it to your friends and learn new things together.
Transcript

1
X-ray harmonic comb from relativistic electron spikes
Alexander S. Pirozhkov1, Masaki Kando1, Timur Zh. Esirkepov1, Eugene N. Ragozin2,3,
Anatoly Ya. Faenov1,4, Tatiana A. Pikuz1,4, Tetsuya Kawachi1, Akito Sagisaka1,
Michiaki Mori1, Keigo Kawase1, James K. Koga1, Takashi Kameshima1, Yuji Fukuda1,
Liming Chen1,†, Izuru Daito1, Koichi Ogura1, Yukio Hayashi1, Hideyuki Kotaki1,
Hiromitsu Kiriyama1, Hajime Okada1, Nobuyuki Nishimori1, Kiminori Kondo1,
Toyoaki Kimura1, Toshiki Tajima1,§, Hiroyuki Daido1, Yoshiaki Kato1,‡ & Sergei V.
Bulanov1,5
1Advanced Photon Research Center, Japan Atomic Energy Agency, 8-1-7 Umemidai,
Kizugawa-shi, Kyoto 619-0215, Japan; 2P. N. Lebedev Physical Institute of the Russian
Academy of Sciences, Leninsky Prospekt 53, 119991 Moscow, Russia; 3Moscow
Institute of Physics and Technology (State University), Institutskii pereulok 9, 141700
Dolgoprudnyi, Moscow Region, Russia; 4Joint Institute of High Temperatures of the
Russian Academy of Sciences, Izhorskaja Street 13/19, 127412 Moscow, Russia; 5A. M.
Prokhorov Institute of General Physics of the Russian Academy of Sciences, Vavilov
Street 38, 119991 Moscow, Russia
†Present address: Institute of Physics of the Chinese Academy of Sciences, Beijing, China. §Present
address: Ludwig-Maximilians-University, Germany. ‡Present address: The Graduate School for the
Creation of New Photonics Industries, 1955-1 Kurematsu-cho, Nishiku, Hamamatsu, Shizuoka, 431-
1202, Japan.
X-ray devices providing nanometre spatial1 and attosecond2 temporal resolution
are far superior to longer wavelength and lower frequency optical ones. Such
resolution is indispensable in biology, medicine, physics, material sciences, and
their applications. A bright ultrafast coherent X-ray source is highly desirable, as

2
its single shot3 would allow achieving high spatial and temporal resolution
simultaneously, which are necessary for diffractive imaging of individual large
molecules, viruses, or cells. Here we demonstrate experimentally a new compact X-
ray source involving high-order harmonics produced by a relativistic-irradiance
femtosecond laser in a gas target. In our first implementation using a 9 Terawatt
laser, coherent soft X-rays are emitted with a comb-like spectrum reaching the
'water window' range. The generation mechanism is robust being based on
phenomena inherent in relativistic laser plasmas: self-focusing,4 nonlinear wave
generation accompanied by electron density singularities,5 and collective radiation
by a compact electric charge proportional to the charge squared. The formation of
singularities (electron density spikes) is described by the elegant mathematical
catastrophe theory,6 which explains sudden changes in various complex systems,
from physics to social sciences. The new X-ray source has advantageous scalings,
as the maximum harmonic order is proportional to the cube of the laser amplitude
enhanced by relativistic self-focusing in plasma. This allows straightforward
extension of the coherent X-ray generation to the keV and tens of keV spectral
regions with 100 Terawatt and Petawatt lasers, respectively. The implemented X-
ray source is remarkably easily accessible: the requirements for the laser can be
met in a university-scale laboratory, the gas jet is a replenishable debris-free
target, and the harmonics emanate directly from the gas jet without additional
devices. Our results open the way to a compact coherent ultrashort brilliant X-ray
source with single shot and high-repetition rate capabilities, suitable for numerous
applications and diagnostics in many research fields.
High-order harmonic generation is the manifestation of one of the most
fundamental properties of nonlinear wave physics. Numerous examples of
nonlinearities producing high-frequency waves can be seen in everyday life: a whistle,
where a continuous air flow is converted into high-frequency sound, a human voice and

3
musical instruments, where harmonics called overtones enrich sound imparting
uniqueness and beauty. In intense laser-matter interactions, nonlinear electromagnetic
waves produce harmonics which are used as coherent radiation sources in many
applications; studying harmonics inspires new concepts of nonlinear wave theory.
Several compact laser-based X-ray sources have been implemented to date,
including plasma-based X-ray lasers,7 atomic harmonics in gases,8 nonlinear Thomson
scattering9, 10 from plasma electrons11, 12 and electron beams,13, 14 harmonics from solid
targets,15-21 and relativistic flying mirrors.22-25 Many of these compact X-ray sources9-25
are based on the relativistic laser-matter interaction, where the dimensionless laser pulse
amplitude a0 = eE0/mcω0 = (I0/Irel)1/2(λ0/µm) > 1. Here e and m are the electron charge
and mass, c is the speed of light in vacuum, ω0, λ0, E0, and I0 are the laser angular
frequency, wavelength, peak electric field, and peak irradiance, respectively, and Irel =
1.37×10¹⁸ W/cm2. Such a relativistic-irradiance laser pulse ionizes matter almost
instantly, so the interaction takes place in plasma, which can sustain extremely high
laser irradiance. This, in particular, allows generating very high harmonic orders in an
ultra-relativistic regime (a0>>1). Recently a great deal of attention has been paid to
harmonic generation from solid targets.17-21 Gas targets, which are easily accessible and
far less demanding with respect to the laser contrast, also have been employed to
generate harmonics via electro-optic shocks26 and nonlinear Thomson scattering.11, 12 In
our experiments, a relativistic-irradiance laser focused into a gas jet generates bright
harmonics having a large number of photons with energies of hundreds of electron-
Volts (eV). A new mechanism is invoked for explaining the obtained results.
A laser pulse with the power P0 = 9 TW, duration of 27 fs, and wavelength λ0 =
820 nm is focused onto a supersonic helium gas jet. The laser irradiance in vacuum is
6.5×10¹⁸ W/cm2, corresponding to the dimensionless amplitude a0,vac ≈ 1.7. The
harmonics in the 80-250 eV or 110-350 eV spectral regions have been recorded in the

4
forward (laser propagation) direction employing a flat-field grazing-incidence
spectrograph.
The harmonics are generated in a broad range of plasma densities from ~ 2×10¹⁹
to 7×1019 cm-3, with the harmonic yield increasing with density. Greater harmonic yield
is achieved at higher laser power by shortening the pulse duration while maintaining the
laser pulse energy. This is advantageous as it allows using more compact laser systems.
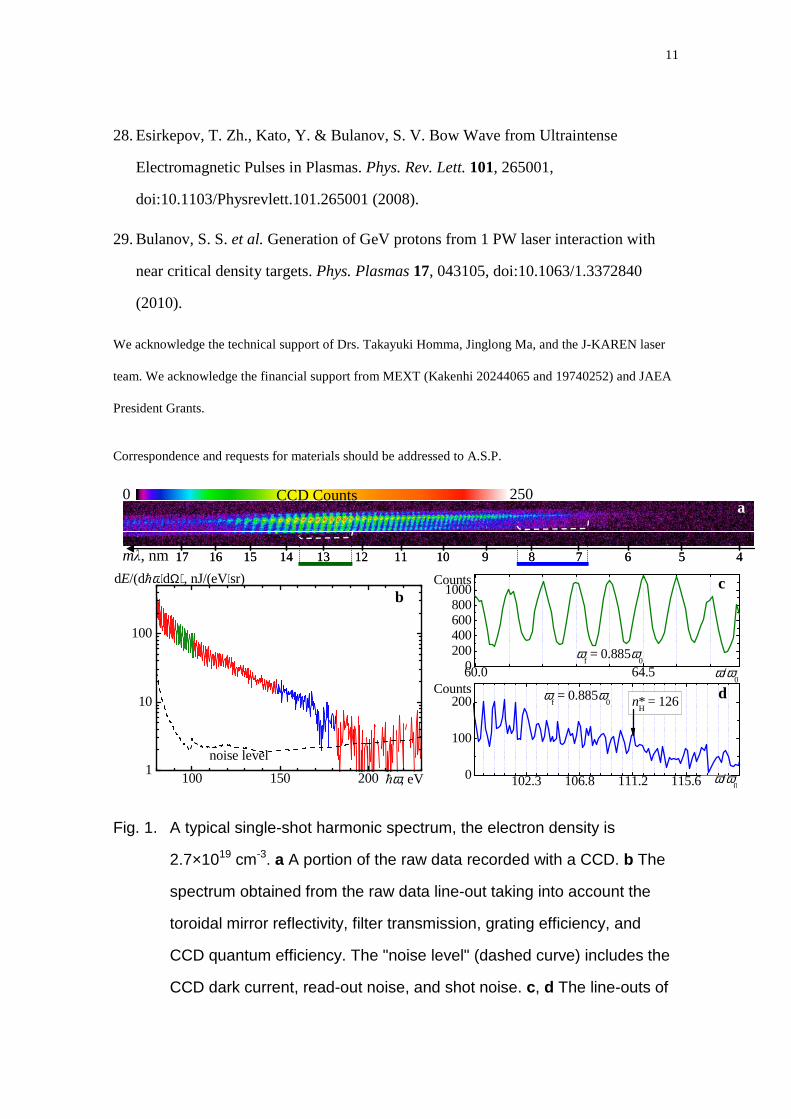
Figure 1 shows a typical comb-like spectrum consisting of odd and even
harmonics, which both are similar in intensity and shape. The base frequency of the
spectrum, ωf, is downshifted compared to the laser frequency ω0 due to the well-known
gradual downshift of the laser pulse frequency, as the pulse propagates in tenuous
plasma expending part of its energy. This frequency downshift has been observed in the
present experiment by recording the transmitted laser spectra.
The large photon number allows recording spectra in a single shot. In the data
shown in Fig. 1, the photon number and X-ray pulse energy within the spectral range of
90-250 eV reach (1.8±0.1)×1011 photons/sr and (3.2±0.2) µJ/sr, respectively. For the
harmonic source peak brightness a conservative estimate gives ~1021 photons/(mm2
mrad2 s 0.1% bandwidth) at 100 eV and ~1020 photons/(mm2 mrad2 s 0.1% bandwidth)
at ~200 eV, respectively; these numbers obtained in our first implementation compare
well with other sources.27
In Fig. 1d, harmonic orders up to nH*= ω*/ωf ~ 126 are resolved, and the
unresolved (continuum) spectrum extends up to 200 eV, being close to the cut-off of the
optical blocking filters used in the spectrograph. With another filter set, we have
observed spectra with photon energies exceeding 320 eV, well within the 'water
window' range (284 – 532 eV), which is an important region for high-contrast imaging

5
of biological samples. The large number of resolved harmonics places a strict limit on
the laser frequency drift during the harmonic emission, because resolving of the nH-th
harmonic allows a relative change of the laser frequency not greater than δ ≈ 1/(2nH).
For the case of Fig. 1, the upper bound is δmax ~ 0.4% (or, alternatively, the phase error
is <25 mrad). The gradual downshift of the laser frequency in plasma thus limits the
harmonic emission time. For the shot shown in Fig. 1 we obtain a conservative estimate
for the emission time of ≈ 13 fs.
In ~40% of the shots, the harmonic spectrum exhibits deep equidistant
modulations (Fig. 2a-c), suggesting interference between two almost identical coherent
sources. These modulations remain visible even in shots where the individual harmonics
are nearly unresolved (Fig. 2d). We attribute harmonic structure blurring to a larger
laser frequency drift due to longer harmonic emission time. The photon numbers in
these shots are correspondingly a few times larger.
The conservative estimate of the spatial coherence width in our experiment, with
the detector at 1.4 m, gives ~ 1 mm, which is large enough for phase contrast imaging in
a compact setup.
The unique properties of the observed harmonics prevent direct application of
previously suggested scenarios. Atomic harmonics are excluded because in the present
experiment odd and even harmonic orders are always generated and the sensitivity to
the gas pressure is weak. Betatron radiation consists of harmonics with a base frequency
determined by the plasma frequency and electron energy, and not the laser frequency.
Nonlinear Thomson scattering even under optimum conditions10 can only provide
photon numbers two orders of magnitude smaller than that experimentally observed.

6
Properties of the observed spectra and our 3-dimensional Particle-in-Cell
simulation of the harmonic generation during laser pulse propagation in tenuous plasma
(Fig. 3a) allow inferring the mechanism of harmonic generation. The laser pulse
undergoes self-focusing,4 expels electrons evacuating a cavity5 and generates a bow
wave.28 The resulting electron flow is two-stream: expelled electrons produce the
outgoing bow wave while peripheral electrons close the cavity. Fig. 3b illustrates this
flow by the evolution of an initially flat surface formed by electrons in their phase sub-
space (x,y, py), where py is the electron momentum component. The laser pulse stretches
the surface making folds – outer (the bow wave boundary) and inner (the cavity wall). A
projection of the surface onto the (x,y) plane gives the electron density distribution,
where a fold corresponds to the density singularity. Catastrophe theory6 predicts here
universal structurally stable singularities. The ‘fold’ type (A2, according to V. I.
Arnold’s ADE classification) is observed at the bow wave boundary and at the cavity
wall where the density grows as (∆r)–1/2 while the distance to the singularity, ∆r,
diminishes. At the point joining two folds, the density grows as (∆r)–2/3 producing a
higher order singularity, the ‘cusp’ (A3). Our simulation reveals the formation of the
electron density spike corresponding to the cusp singularity, located in a ring
surrounding the cavity head and modulated by the laser field. The density spike moving
together with the laser pulse carries a large localized electric charge, collective motion
of which under the action of the laser field generates high-order harmonics, Fig. 3a. A
large concentration of electrons ensured by the cusp singularity makes the emission
coherent, so that the emitted intensity is proportional to the square of the particle
number, Ne2. The estimated number of electrons within the singularity ring, Ne ~ 106,
provides the signal level similar to the experiment. For linear polarization, the harmonic
emitting ring breaks up into two segments (Fig. 3). In the symmetric case, these
segments radiate identical spectra, interference between which explains modulations

7
visible in Fig. 2. If the symmetry is violated, as in Fig. 3a, the radiation from one source
dominates, as in the shot shown in Fig. 1.
The critical harmonic order, nH*, is proportional to the cube of the electron energy
(≈ a0mc2), similar to synchrotron radiation and nonlinear Thomson scattering:
30
f
**H ~ an
ωω= . (1)
Estimating the laser amplitude a0 in the stationary self-focusing case,29 a0 =
[8πP0ne/(Pcncr)]1/3, the critical harmonic order becomes nH
* ~ 8πP0ne/(Pcncr), where Pc =
2m2c5/e2 = 17 GW and ncr = mω02/(4πe2) ≈ 1.1×1021 cm-3(µm/λ0)
2 is the critical density.
The observed harmonic orders are in good agreement with this scaling. The total energy
emitted by the cusp is proportional to the charge squared:
τωτγω 3/10
6/5e
3/40
2e
20
40
2e
2
8nPNaN
c
eW ∝≈ , (2)
where γ ≈ (ncr/ne)1/2 is the gamma-factor associated with the group velocity of the laser
pulse in plasma. The number of electrons Ne and the harmonic emission time τ depend
on the detailed structure of the cusp and its time evolution.
Using a compact femtosecond laser and relatively simple setup with a
replenishable, debris-free gas jet target suitable for repetitive operation, we demonstrate
a bright, coherent X-ray source with advantageous properties such as scalability in
photon energy and number, single-shot capability, and femtosecond pulse duration. Our
findings have immediate applications in ultrafast science and plasma physics and in the
near future will impact other fields of science, medicine, and technology, where
convenient X-ray sources are required, including those with time-resolved and single-
shot capabilities.

8
Received on 26 April 2010.
1. Chao, W., Harteneck, B. D., Liddle, J. A., Anderson, E. H. & Attwood, D. T. Soft
X-ray microscopy at a spatial resolution better than 15 nm. Nature 435, 1210-1213,
doi:10.1038/nature03719 (2005).
2. Krausz, F. & Ivanov, M. Attosecond physics. Rev. Mod. Phys. 81, 163-234,
doi:10.1103/RevModPhys.81.163 (2009).
3. Chapman, H. N. et al. Femtosecond diffractive imaging with a soft-X-ray free-
electron laser. Nature Phys. 2, 839-843, doi:10.1038/nphys461 (2006).
4. Askar’yan, G. A. Effects of the Gradient of a Strong Electromagnetic Beam on
Electrons and Atoms. Zh. Eksp. Teor. Fiz. 42, 1568 (1962) [Sov. Phys. JETP 15,
1088-1090 (1962)].
5. Esarey, E., Schroeder, C. B. & Leemans, W. P. Physics of laser-driven plasma-based
electron accelerators. Rev. Mod. Phys. 81, 1229, doi:10.1103/RevModPhys.81.1229
(2009).
6. Poston, T. & Stewart, I. Catastrophe theory and its applications. (Dover Pubns,
1996).
7. Daido, H. Review of soft x-ray laser researches and developments. Rep. Prog. Phys.
65, 1513, doi:10.1088/0034-4885/65/10/204 (2002).
8. Corkum, P. B. Plasma perspective on strong field multiphoton ionization. Phys. Rev.
Lett. 71, 1994-1997, doi:10.1103/PhysRevLett.71.1994 (1993).
9. Esarey, E., Ride, S. K. & Sprangle, P. Nonlinear Thomson Scattering of Intense
Laser-Pulses from Beams and Plasmas. Phys. Rev. E 48, 3003-3021,
doi:10.1103/PhysRevE.48.3003 (1993).

9
10. Lee, K., Cha, Y. H., Shin, M. S., Kim, B. H. & Kim, D. Relativistic nonlinear
Thomson scattering as attosecond x-ray source. Phys. Rev. E 67, 026502,
doi:10.1103/PhysRevE.67.026502 (2003).
11. Chen, S. Y., Maksimchuk, A. & Umstadter, D. Experimental observation of
relativistic nonlinear Thomson scattering. Nature 396, 653-655, doi:10.1038/25303
(1998).
12. Chen, S. Y., Maksimchuk, A., Esarey, E. & Umstadter, D. Observation of phase-
matched relativistic harmonic generation. Phys. Rev. Lett. 84, 5528-5531,
doi:10.1103/PhysRevLett.84.5528 (2000).
13. Schoenlein, R. W. et al. Femtosecond X-ray Pulses at 0.4 A Generated by 90°
Thomson Scattering: A Tool for Probing the Structural Dynamics of Materials.
Science 274, 236-238, doi:10.1126/science.274.5285.236 (1996).
14. Babzien, M. et al. Observation of the Second Harmonic in Thomson Scattering from
Relativistic Electrons. Phys. Rev. Lett. 96, 054802,
doi:10.1103/PhysRevLett.96.054802 (2006).
15. Mourou, G. A., Tajima, T. & Bulanov, S. V. Optics in the relativistic regime. Rev.
Mod. Phys. 78, 309-371, doi: 10.1103/RevModPhys.78.309 (2006).
16. Teubner, U. & Gibbon, P. High-order harmonics from laser-irradiated plasma
surfaces. Rev. Mod. Phys. 81, 445-479, doi:10.1103/RevModPhys.81.445 (2009).
17. Bulanov, S. V., Naumova, N. M. & Pegoraro, F. Interaction of an ultrashort,
relativistically strong laser pulse with an overdense plasma. Phys. Plasmas 1, 745-
757, doi:10.1063/1.870766 (1994).
18. Dromey, B. et al. High harmonic generation in the relativistic limit. Nature Phys. 2,
456-459, doi:10.1038/nphys338 (2006).

10
19. Thaury, C. et al. Plasma mirrors for ultrahigh-intensity optics. Nature Phys. 3, 424-
429, doi:10.1038/nphys595 (2007).
20. Tarasevitch, A., Lobov, K., Wünsche, C. & von der Linde, D. Transition to the
Relativistic Regime in High Order Harmonic Generation. Phys. Rev. Lett. 98,
103902, doi:10.1103/PhysRevLett.98.103902 (2007).
21. Nomura, Y. et al. Attosecond phase locking of harmonics emitted from laser-
produced plasmas. Nature Phys. 5, 124-128, doi:10.1038/nphys1155 (2009).
22. Bulanov, S. V., Esirkepov, T. Z. & Tajima, T. Light intensification towards the
Schwinger limit. Phys. Rev. Lett. 91, 085001, doi:10.1103/PhysRevLett.91.085001
(2003).
23. Kando, M. et al. Demonstration of laser-frequency upshift by electron-density
modulations in a plasma wakefield. Phys. Rev. Lett. 99, 135001,
doi:10.1103/PhysRevLett.99.135001 (2007).
24. Pirozhkov, A. S. et al. Frequency multiplication of light back-reflected from a
relativistic wake wave. Phys. Plasmas 14, 123106, doi: 10.1063/1.2816443 (2007).
25. Kando, M. et al. Enhancement of Photon Number Reflected by the Relativistic
Flying Mirror. Phys. Rev. Lett. 103, 235003, doi:10.1103/PhysRevLett.103.235003
(2009).
26. Gordon, D. F., Hafizi, B., Kaganovich, D. & Ting, A. Electro-optic shocks from
ultraintense laser-plasma interactions. Phys. Rev. Lett. 101, 045004,
doi:10.1103/Physrevlett.101.045004 (2008).
27. Hartemann, F. V., Siders, C. W. & Barty, C. P. J. Compton Scattering in Ignited
Thermonuclear Plasmas. Phys. Rev. Lett. 100, 125001,
doi:10.1103/PhysRevLett.100.125001 (2008).
11
28. Esirkepov, T. Zh., Kato, Y. & Bulanov, S. V. Bow Wave from Ultraintense
Electromagnetic Pulses in Plasmas. Phys. Rev. Lett. 101, 265001,
doi:10.1103/Physrevlett.101.265001 (2008).
29. Bulanov, S. S. et al. Generation of GeV protons from 1 PW laser interaction with
near critical density targets. Phys. Plasmas 17, 043105, doi:10.1063/1.3372840
(2010).
We acknowledge the technical support of Drs. Takayuki Homma, Jinglong Ma, and the J-KAREN laser
team. We acknowledge the financial support from MEXT (Kakenhi 20244065 and 19740252) and JAEA
President Grants.
Correspondence and requests for materials should be addressed to A.S.P.
100 150 2001
10
100
dE/(dħω⋅dΩ), nJ/(eV⋅sr)
ħω, eV
noise level
60.0 64.50200400600800
1000
102.3 106.8 111.2 115.60
100
200 ωf = 0.885ω
0
Counts
ω/ω0
nH = 126*
ω/ω0
Counts
ωf = 0.885ω
0
CCD Counts0 250
bc
d
mλ, nm 4567891011121314151617 4567891011121314151617
a
Fig. 1. A typical single-shot harmonic spectrum, the electron density is
2.7×1019 cm-3. a A portion of the raw data recorded with a CCD. b The
spectrum obtained from the raw data line-out taking into account the
toroidal mirror reflectivity, filter transmission, grating efficiency, and
CCD quantum efficiency. The "noise level" (dashed curve) includes the
CCD dark current, read-out noise, and shot noise. c, d The line-outs of

12
two selected regions (denoted by the dashed brackets in frame a and
the corresponding colours in frames a and b) demonstrating harmonic
structure with the base frequency ωf = 0.885ω0 denoted by the dotted
vertical lines, where ω0 is the laser frequency, and the highest distinctly
resolved order n* = ω*/ωf = 126.
74.3 83.0 91.70
200
400
600 ωf = 0.872ω
0
Counts
ω/ω0
49.1 66.1 83.1 100.1 117.10200400600800 ∆ω = 17ω
0
ω/ω0
Counts
CCD Counts0 400
CCD Counts0 150
b c
mλ, nm 4567891011121314151617 4567891011121314151617
mλ, nm 4567891011121314151617 4567891011121314151617
a
d
Fig. 2. Typical single-shot spectra modulated due to the interference between
two nearly identical sources (Fig. 3b). a A portion of the CCD raw data;
modulated spectrum with resolved harmonics, the electron density is
4.7×1019 cm-3. b and c, line outs of two selected regions (denoted by
the two dashed brackets and the corresponding colours in frame a).
The modulation period in the frequency domain ∆ω = 17ω0 and the base
frequency ωf = 0.872ω0 are denoted by the dotted vertical lines in frames
b and c, respectively. d A portion of the CCD raw data; modulated
spectrum with nearly unresolved harmonics, the electron density is
4.7×1019 cm-3.

13
Folds (A2)
Cusp (A3)
Bow wave
Cavity
Electrondensity
Laser-inducedmodulation
High harmonicsource
x
y
z, ne
py
Folds (A2)
Cusp (A3)
Bow waveCavity
Electron density
x
y
py, ne
py
Folds (A2)
Cusp (A3)
Bow waveCavity
Electron density
x
y
py, ne
x
y
py, ne
ba
Fig. 3. Mechanism of harmonic generation, three-dimensional Particle-in-Cell
simulation (a) and model (b). Electrons initially located in the plane (x,y)
form a flat surface in the electron phase sub-space (x,y, py) (Fig. 3b,
upper frame), where py is the electron momentum component. Near the
axis, the laser pulse stretches the surface making folds so that outer
folds represent the bow wave28 boundary, inner folds represent the
cavity walls. A projection of the surface onto the (x,y) plane gives the
electron density distribution, where according to catastrophe theory6 the
folds correspond to singularities of the density (Fig. 3 a and b). Higher
order singularities, the cusps, are seen in Fig. 3 a and b at the locations
of the joining of these folds. The cusps provide a large, localized electric
charge. This charge is situated well within the region where the laser
pulse amplitude is large, thus its nonlinear oscillations produce high-
order harmonics. The spatial distribution of the electromagnetic field of
the fourth and higher harmonics is shown by the red arcs in Fig. 3a.

14
X-ray harmonic comb from relativistic electron spikes:
Supplementary Information
Alexander S. Pirozhkov1, Masaki Kando1, Timur Zh. Esirkepov1, Eugene N. Ragozin2,3,
Anatoly Ya. Faenov1,4, Tatiana A. Pikuz1,4, Tetsuya Kawachi1, Akito Sagisaka1,
Michiaki Mori1, Keigo Kawase1, James K. Koga1, Takashi Kameshima1, Yuji Fukuda1,
Liming Chen1,†, Izuru Daito1, Koichi Ogura1, Yukio Hayashi1, Hideyuki Kotaki1,
Hiromitsu Kiriyama1, Hajime Okada1, Nobuyuki Nishimori1, Kiminori Kondo1,
Toyoaki Kimura1, Toshiki Tajima1,§, Hiroyuki Daido1, Yoshiaki Kato1,‡ & Sergei V.
Bulanov1,5
1Advanced Photon Research Center, Japan Atomic Energy Agency, 8-1-7 Umemidai,
Kizugawa-shi, Kyoto 619-0215, Japan; 2P. N. Lebedev Physical Institute of the Russian
Academy of Sciences, Leninsky Prospekt 53, 119991 Moscow, Russia; 3Moscow
Institute of Physics and Technology (State University), Institutskii pereulok 9, 141700
Dolgoprudnyi, Moscow Region, Russia; 4Joint Institute of High Temperatures of the
Russian Academy of Sciences, Izhorskaja Street 13/19, 127412 Moscow, Russia; 5A. M.
Prokhorov Institute of General Physics of the Russian Academy of Sciences, Vavilov
Street 38, 119991 Moscow, Russia
†Present address: Institute of Physics of the Chinese Academy of Sciences, Beijing, China. §Present
address: Ludwig-Maximilians-University, Germany. ‡Present address: The Graduate School for the
Creation of New Photonics Industries, 1955-1 Kurematsu-cho, Nishiku, Hamamatsu, Shizuoka, 431-
1202, Japan.
Experimental Setup
The experimental setup is shown in Fig. S1a. The gas jet density profile and
position of laser focus in vacuum are shown in Fig. S1b. The grazing-incidence

15
spectrograph is in-situ calibrated using the line emission from Ar and Ne plasmas
produced by the same laser in the same gas jet filled with the different gases. An
example of the spectrum used for the calibration is shown in Fig. S2a and b. The
resolving power of the spectrograph ω/∆ω estimated from the line widths is shown in
Fig. S2c, from which we can expect the maximum resolved harmonic order ~ 130 for
the fundamental wavelength λ0 = 820 nm and ~ 140 for the red-shifted wavelength λ0' =
927 nm (corresponding to ωf = 0.885ω0, which is the base frequency of the spectrum
shown in Fig. 1 of the main text). These estimations are approximate because the ability
to resolve harmonics also depends on the spectral shape and the Charge-Coupled Device
(CCD) noise at low signal levels. For this reason, the actually observed resolved
harmonic orders up to ~ 126 may correspond to the limit imposed by the detection
system.
Image processing
Because of the large signal-to-nose ratio, the image processing has been reduced
to minimum. The raw CCD counts have been converted into pseudo-colours, with the
linear colour bars shown together with each experimental data. In the raw data, there are
typically several bright spots generated by hard X-rays; these bright spots have been
removed by the procedure described in Ref.30 The images before and after bright spot
removal are shown in Fig. S3 a and b, respectively.
Absolute photon number and noise calculation
The absolute photon number in the harmonic spectra is calculated using the
idealized spectrograph throughput (shown by the dashed line in Fig. S2b), which is the
product of the toroidal mirror reflectivity (calculated using the atomic scattering
factors31, 32), filter transmission33 (calculated, the measured transmission at several
wavelengths agrees well with the calculation), grating efficiency,34 and CCD quantum

16
efficiency.35 The background has been carefully subtracted. The CCD gain g = 0.315
counts/electron has been measured by the manufacturer, and the energy per electron-
hole pair is 3.65 eV. The effects of optic contamination by Si is partly included,
calculated from the ~ 30% jump at the absorption edge near 12.4 nm observed in quasi-
continuous spectra; this contamination resulted from the spectrometer operation with
solid Si targets in different experiments. Other contaminations which always exist
(hydrocarbon, oxygen, etc.) are not included. Neither included is absorption in the outer
regions of the helium jet; this should have a small effect because the gas is ionized few
picoseconds before the main pulse by a pedestal. These excluded effects (optics
contamination and He absorption) can only add the brightness of the harmonics at the
source, and the conclusions of the paper remain valid.
The noise (standard deviation) for each CCD pixel is calculated from the
measured CCD dark and read-out noise σd and the shot noise given by the product of the
CCD gain and the observed counts C:36
gCd += 22 σσ (S1)
The line outs shown in Fig. 1 and 2 of the main text are binned vertically by
several pixels; the noise in each spectral point binσ is calculated as sum of independent
noise sources from each pixel: ∑= 22bin σσ . The noise level is much lower than the
typically observed signals, except at the edges of the spectrograph's throughput. The
error bars for the photon numbers and energy of the harmonics in the spectral range 90-
250 eV given in the main text are calculated from the photon number uncertainties at
each point in the spectrum.
Harmonics generated by the laser pulse with changing frequency

17
When the driving laser frequency changes during the harmonic emission into the
acceptance angle of the spectrograph, the observed time-integrated spectrum becomes
blurred due to the overlapping of different harmonic orders emitted with different base
frequencies at different times. A model example is shown in Fig. S4. The harmonics
around order nH become distinguishable when the relative frequency change ∆ω/ω0
becomes smaller than
H0 2
1
n≈∆
ωω
(S2)
For the resolvable harmonic orders up to nH = 126, as in the described experiments, this
gives ∆ω/ω0 ≈ 0.4%. Note that these estimations do not depend on the harmonic
generation mechanism. In the experiments, we sometimes observed spectra without or
with nearly indistinguishable harmonic structures, as it is shown in Fig. 2d of the main
text. This is attributed to the relative frequency drift larger than 1/2nH.
Laser pulse propagation in plasma: relativistic self-focusing, nonlinear depletion
and frequency downshift
A laser pulse propagating in tenuous plasma produces various nonlinear effects,
which in turn influence the laser pulse itself.37, 5 The laser pulse gradually changes due
to such processes as relativistic self-focusing, wake wave excitation, etc. In particular,
the relativistic self-focusing39, 4 leads to a significant increase of the laser amplitude. In
the stationary case, the amplitude and diameter of the self-focusing channel are
determined by the laser power P0 and electron density ne29
31
crc
e00 8
=
nP
nPa π ,
pe0sf 2
ωc
ad = . (S3)
Here Pc = 2m2c5/e2 ≈ 17 GW, ncr = mω02/(4πe2) ≈ 1.1×1021 cm-3(µm/λ0)
2 is the critical
density, ωpe = (4πe2ne/m)1/2 is the Langmuir frequency. For the experimental parameters

18
of Fig. 1 of the main text (P0 = 9 TW, ne = 2.7×1019 cm-3), we obtain a0 = 6 and dsf = 5
µm.
Another important effect is the laser pulse frequency downshift in plasma. An
example of the transmitted laser pulse spectrum is shown in Fig. S5a; this spectrum is
obtained in the same shot as the harmonic spectrum shown in Fig. 1 of the main text.
Due to this frequency downshift the base harmonic frequencies observed in the
experiment are somewhat smaller than the initial laser one. The frequency downshift is
attributed to the nonlinear depletion5, 42 of the laser pulse. If the plasma density is
sufficiently low, as in the case of the experiment, the energy loss rate for the wake wave
excitation is relatively small so that laser pulse changes nearly adiabatically, which
means that the number of photons is nearly preserved while the average frequency
gradually drifts to lower values.42 Assuming uniform plasma density, the average
frequency ω0' can be calculated as42
31
0
0 1'
−=
nll
x
ωω
. (S4)
Here lnl ≈ λpγ2 is the nonlinearity length, λp = 4(2γ)1/2c/ωpe is the nonlinear plasma
wavelength, and γ is the gamma-factor associated with the phase velocity of the
Langmuir wave, which coincides with the group velocity of the laser pulse. For the
parameters of the shot shown in Fig. 1 of the main text, the electron density is ne =
2.7×1019 cm-3, λp ≈ 14 µm, and lnl ≈ 0.5 mm. The gamma-factor γ = 6±1 has been
measured under similar experimental conditions by the frequency upshift of the
reflected counter-propagating laser pulse.25 The calculated dependence of ω0' on the
propagation distance is shown in Fig. S5b. As we see, the harmonics are generated by
the laser pulse with gradually changing frequency. If the harmonic emission length, ∆x,
is sufficiently long, this frequency downshift leads to blurring of the harmonic structure,
as in the case of Fig. 2d of the main text. Using the maximum frequency change found

19
in the previous section and the dependence shown in Fig. S5b, for the shot shown in
Fig. 1 of the main text we estimate the harmonic emission length as ∆x ≈ 4 µm, which
corresponds to the harmonic emission time ∆x/c ≈ 13 fs. Note that this gives a very
conservative estimate of the harmonic pulse duration, as the radiating cusp moves
forward with the velocity nearly equal to c, so that the expected harmonic pulse duration
is much shorter.
Estimation of the peak brightness
The peak brightness of the experimental harmonic source [photons/(mm2 mrad2 s
0.1% bandwidth)] is estimated using the absolute photon number calculated as
explained in the previous sections, the spectrograph acceptance angle of 2.4 mrad in the
laser polarization plane and 12 mrad in the perpendicular direction, 13 fs harmonic
pulse duration (conservative estimate), and the source area equals the area of ring,
which diameter equals the self-focusing channel diameter (5 µm) and the thickness
equals 1 µm (from the simulations). In the experiment, the polarization is linear, which
means that only part of this ring emits harmonics, as seen in Fig. 3a of the main text.
Also, we expect that the harmonic pulse is significantly shorter than the harmonic
emission time, because the cusp moves with a velocity nearly equal to the driving laser
pulse one. Thus, the peak brightness given in the main text is a conservative estimate,
while the real value is to be determined in future experiments, where the source size and
pulse duration are measured.
Ruling out of previously known mechanisms of harmonic generation in gas jets
Atomic harmonics.44, 45 Due to the symmetry with respect to the electric field
reversal, these harmonics are generated two times during each laser cycle, so the
harmonic separation is 2π/(T0/2) = 2ω0, and only odd harmonics are generated. Addition
of the second harmonic pulse breaks the symmetry, so even harmonics can also be
20
generated,46, 47 with the dependence on the intensity and delay of the second harmonic
pulse. The second harmonic may accidentally be generated in the experiment, but its
intensity and phase should depend on the parameters. However in all of the spectra
taken with a broad range of parameters the harmonics show no variation in amplitude
and shape between the even and odd orders. This means that the possible presence of a
self-generated variable second harmonic does not take part in the high order harmonic
generation process, which in turn means that atomic harmonics are not relevant to the
experiment. There are additional reasons which allow excluding the atomic harmonics:
(i) the laser irradiance is orders of magnitude larger than necessary for full He
ionization; (ii) the base frequency is down-shifted, which happens only within the high-
intensity region, where He is fully ionized; (iii) there is no strong sensitivity to backing
pressure, which is important for the atomic harmonics phase-matching.
Nonlinear Thomson scattering. The nonlinear Thomson scattering48-50 gives
single-electron spectra with the calculated shapes49, 50 which resemble the ones recorded
in our experiment. Low-order11, 12 and vacuum-ultraviolet53 harmonics and continuum
radiation54 attributed to the nonlinear Thomson scattering have been observed
experimentally. However, more detailed analysis shows that there are two spectral
features in our experiment which cannot be explained by the nonlinear Thomson
scattering. First, it is well known that along with the gradual downshift of the average
laser frequency, the laser spectrum in plasma is broadened, which in the experiment is
visible in the transmitted spectra (Fig. S5a), so that different parts of the pulse have
different frequencies. Typically, the head of the pulse has a lower frequency than the
tail. The nonlinear Thomson scattering in the field of such pulse indeed contains
resolvable lower harmonic orders,11, 53 but higher orders are blurred54 due to the
presence of different base frequencies. Note that the harmonic generation mechanism
proposed in this paper is based on the radiation by an electron density cusp, which is a
very localized charge, so that laser frequency does not change across the charge location

21
and resolvable harmonics can be generated up to high orders, as it is the case in the
experiment. Second, the number of photons recorded in our experiment cannot be
explained by the nonlinear Thomson scattering. Using numerical calculations,49 we
obtained the spectra of radiation scattered by a single electron in the field of a laser
pulse with an over-estimated amplitude a0 = 7, at a non-zero observation angle θ = 15°,
which is close to the optimum emission angle.49 Even for this amplitude and angle, at
100 eV the radiated energy is at most ≈ 2×10⁻¹⁰ nJ/eV/sr. The number of electrons
encountered by the self-focused laser pulse can be estimated as Ne = ne ∆x π dsf2/4 ≈
2×10⁹. Here we use the peak electron density ne = 2.7×1019 cm-3, the self-focusing
channel diameter (S3) dsf = 5 µm, and the harmonic emission length ∆x = 4 µm. These
give ≈ 0.4 nJ/eV/sr at the photon energy of 100 eV, which is more than two orders of
magnitude (~300 times) smaller than that observed in the experiment. Note that in this
estimation, we over-estimate wherever possible the Thomson scattering signal and
under-estimate the signal recorded in the experiment, because we do not take into
account a possible optics contamination and absorption in the outer gas jet regions.
More accurate estimation would give even a larger gap between nonlinear Thomson
scattering and the experiment.
Betatron radiation.55 In this case, the radiation consists of harmonics with the
base frequency determined by the plasma frequency ωpe and electron bunch gamma-
factor γe. This cannot provide the ωf values always close to the laser frequency, which is
observed in the experiment.
Particle-in-cell simulations
Three-dimensional particle-in-cell simulations were performed with the
Relativistic Electro-Magnetic Particle-mesh (REMP) code56 using SGI Altix 3700
supercomputer. In the simulations, the laser pulse propagates in a tenuous plasma along

22
the x-axis. The pulse is linearly polarized in the direction of the y-axis; its shape is
Gaussian and its full width at half-maximum is 10λ0 in every direction. The initial laser
pulse dimensionless amplitude is a = 6.6. The plasma is fully ionized; the electron
density is ne = 1.14×1018cm−3×(1µm/λ0)2. We consider interaction mainly near the
location of the laser pulse, so that the response from ions can be neglected in
comparison with much lighter electrons, i. e. the ion-to-electron mass ratio is assumed
to be mi/m → ∞. The simulation grid dimensions are 4000×992×992 along the x, y and z
axes; the grid mesh sizes are dx = λ0/32, dy = dz = λ0/8; total number of quasi-particles
is 2.3×10¹⁰.
Estimation of the energy emitted by the electron density singularity (cusp)
In the reference frame moving with the cusp, the total power emitted by Ne
electrons is57, §73
20
40
22
20
20
20
22
'cusp 88
31
3ωω aN
c
eaaN
c
eP ee ≈
+= (S5)
In the laboratory reference frame, this is multiplied by the gamma-factor corresponding
to the group velocity of laser pulse, γ. Thus, for the total emitted energy we obtain
τγω20
40
2e
2
8aN
c
eW ≈ . (S6)
30. Pirozhkov, A. S. et al. Frequency multiplication of light back-reflected from a
relativistic wake wave. Phys. Plasmas 14, 123106, doi: 10.1063/1.2816443 (2007).
31. Henke, B. L., Gullikson, E. M. & Davis, J. C. X-Ray Interactions: Photoabsorption,
Scattering, Transmission, and Reflection at E = 50-30,000 eV, Z = 1-92. At. Data
Nucl. Data Tables 54, 181-342, doi:10.1006/adnd.1993.1013 (1993).

23
32. Soufli, R. and Gullikson, E. M. Optical constants of materials for multilayer mirror
applications in the EUV/soft x-ray region. Proc. SPIE 3113, 222-229,
doi:10.1117/12.278851 (1997); http://henke.lbl.gov/optical-constants/.
33. Andreev, S. S. et al. Application of free-standing multilayer films as polarizers for
X-ray radiation. Nucl. Instr. Methods Phys. Res. Sect. A 543, 340-345,
doi:10.1016/j.nima.2005.01.252 (2005).
34. Yamazaki, T. et al. Comparison of mechanically ruled versus holographically varied
line-spacing gratings for a soft-x-ray flat-field spectrograph. Appl. Opt. 38, 4001-
4003, doi:10.1364/AO.38.004001 (1999).
35. Poletto, L., Boscolo, A. & Tondello, G. Characterization of a Charge-Coupled-
Device Detector in the 1100-0.14-nm (1-eV to 9-keV) Spectral Region. Appl. Opt.
38, 29-36, doi:10.1364/AO.38.000029 (1999).
36. Gudehus, D. H. & Hegyi, D. J. The design and construction of a charge-coupled
device imaging system. Astron. J. 90, 130-138, doi:10.1086/113720 (1985).
37. Mourou, G. A., Tajima, T. & Bulanov, S. V. Optics in the relativistic regime. Rev.
Mod. Phys. 78, 309-371, doi: 10.1103/RevModPhys.78.309 (2006).
38. Esarey, E., Schroeder, C. B. & Leemans, W. P. Physics of laser-driven plasma-based
electron accelerators. Rev. Mod. Phys. 81, 1229, doi:10.1103/RevModPhys.81.1229
(2009).
39. Askar’yan, G. A. Effects of the Gradient of a Strong Electromagnetic Beam on
Electrons and Atoms. Zh. Eksp. Teor. Fiz. 42, 1568 (1962) [Sov. Phys. JETP 15,
1088-1090 (1962)].
40. Sun, G.-Z., Ott, E., Lee, Y. C. & Guzdar, P. Self-focusing of short intense pulses in
plasmas. Phys. Fluids 30, 526-532, doi:10.1063/1.866349 (1987).

24
41. Bulanov, S. S. et al. Generation of GeV protons from 1 PW laser interaction with
near critical density targets. Phys. Plasmas 17, 043105, doi:10.1063/1.3372840
(2010).
42. Bulanov, S. V., Inovenkov, I. N., Kirsanov, V. I., Naumova, N. M. & Sakharov, A.
S. Nonlinear Depletion of Ultrashort and Relativistically Strong Laser-Pulses in an
Underdense Plasma. Phys. Fluids B 4, 1935-1942, doi:10.1063/1.860046 (1992).
43. Kando, M. et al. Enhancement of Photon Number Reflected by the Relativistic
Flying Mirror. Phys. Rev. Lett. 103, 235003, doi:10.1103/PhysRevLett.103.235003
(2009).
44. Corkum, P. B. Plasma perspective on strong field multiphoton ionization. Phys. Rev.
Lett. 71, 1994-1997, doi:10.1103/PhysRevLett.71.1994 (1993).
45. Krausz, F. & Ivanov, M. Attosecond physics. Rev. Mod. Phys. 81, 163-234,
doi:10.1103/RevModPhys.81.163 (2009).
46. Kim, I. J. et al. Highly Efficient High-Harmonic Generation in an Orthogonally
Polarized Two-Color Laser Field. Phys. Rev. Lett. 94, 243901,
doi:10.1103/PhysRevLett.94.243901 (2005).
47. Kondo, K., Kobayashi, Y., Sagisaka, A., Nabekawa, Y. & Watanabe, S. Tunneling
ionization and harmonic generation in two-color fields. J. Opt. Soc. Am. B 13, 424-
429, doi:10.1364/JOSAB.13.000424 (1996).
48. Esarey, E., Ride, S. K. & Sprangle, P. Nonlinear Thomson Scattering of Intense
Laser-Pulses from Beams and Plasmas. Phys. Rev. E 48, 3003-3021,
doi:10.1103/PhysRevE.48.3003 (1993).
49. Lee, K., Cha, Y. H., Shin, M. S., Kim, B. H. & Kim, D. Relativistic nonlinear
Thomson scattering as attosecond x-ray source. Phys. Rev. E 67, 026502,
doi:10.1103/PhysRevE.67.026502 (2003).

25
50. Lee, K., Kim, B. & Kim, D. Coherent radiation of relativistic nonlinear Thomson
scattering. Phys. Plasmas 12, 043107, doi:10.1063/1.1878832 (2005).
51. Chen, S., Maksimchuk, A. & Umstadter, D. Experimental observation of relativistic
nonlinear Thomson scattering. Nature 396, 653-655, doi:10.1038/25303 (1998).
52. Chen, S. Y., Maksimchuk, A., Esarey, E. & Umstadter, D. Observation of phase-
matched relativistic harmonic generation. Phys. Rev. Lett. 84, 5528-5531,
doi:10.1103/PhysRevLett.84.5528 (2000).
53. Banerjee, S., Valenzuela, A. R., Shah, R. C., Maksimchuk, A. & Umstadter, D.
High-harmonic generation in plasmas from relativistic laser-electron scattering. J.
Opt. Soc. Am. B 20, 182-190, doi:10.1364/JOSAB.20.000182 (2003).
54. Ta Phuoc, K. et al. X-ray radiation from nonlinear Thomson scattering of an intense
femtosecond laser on relativistic electrons in a helium plasma. Phys. Rev. Lett. 91,
195001, doi:10.1103/PhysRevLett.91.195001 (2003).
55. Albert, F. et al. Full characterization of a laser-produced keV x-ray betatron source.
Plasma Phys. Control. Fusion 50, 124008, doi:10.1088/0741-3335/50/12/124008
(2008).
56. Esirkepov, T. Zh. Exact charge conservation scheme for Particle-in-Cell simulation
with an arbitrary form-factor. Comput. Phys. Comm. 135, 144-153,
doi:10.1016/S0010-4655(00)00228-9 (2001).
57. Landau, L. D. & Lifshitz, E. M. The classical theory of fields. 4th revised English
edition edn, (Butterworth-Heinemann, 2003).
58. Kiriyama, H. et al. High-contrast, high-intensity laser pulse generation using a
nonlinear preamplifier in a Ti : sapphire laser system. Opt. Lett. 33, 645-647 (2008).

26
59. Pirozhkov, A. S. et al. Transient-Grating FROG for Measurement of Sub-10-fs to
Few-ps Amplified Pulses in Advanced Solid-State Photonics, MC8 (Optical Society
of America, 2008).
60. Choi, I. W., Lee, J. U. & Nam, C. H. Space-resolving flat-field extreme ultraviolet
spectrograph system and its aberration analysis with wave-front aberration. Appl.
Opt. 36, 1457-1466, doi:10.1364/AO.36.001457 (1997).
61. Tajima, T. & Dawson, J. Laser electron accelerator. Phys. Rev. Lett. 43, 267-270,
doi:10.1103/PhysRevLett.43.267 (1979).
62. Kando, M. et al. Sensitivity calibration of various phosphor screens for laser
electron acceleration experiments using 150 MeV electron beams. (Japan Atomic
Energy Agency, 4-49 Muramatsu, Tokai-mura, Naka-gun, Ibaraki, 319-1184, Japan,
2006). JAEA Review 2005-02, 39 (2006).
Correspondence and requests for materials should be addressed to A.S.P
-2.0 -1.5 -1.0 -0.5 0.0 0.5 1.0 1.5
0
2x10¹⁹
4x10¹⁹
6x10¹⁹
(4.7±1.6)×1019cm-3
ne, cm-3
x, mm
(2.7±0.9)×1019cm-3
Laser
Focus invacuum
Laser pulse400 mJ, 27 fs, 9 TW
Ø25 µm @ 1/e2
6.5×10¹⁸ W/cm2
Be-He
jetToroidal mirror
SlitFilters
Spherical grating B-C
CD
Grazing-incidenceflat-field spectrograph
(80-250 or 110-350 eV)
a bElectron
spectrometer
Fig. S1. a Experimental setup. A Ti:Sapphire laser pulse58 (wavelength of 820
nm, energy of 0.4 J, duration of 27 fs Full Width at Half Maximum
(FWHM) measured with a self-made Transient Grating FROG,59 peak
power of 9 TW, spot diameter of 25 µm at 1/e2, irradiance in vacuum of
6.5×10¹⁸ W/cm2, which corresponds to the amplitude a0,vac = 1.7)

27
irradiates a pulsed supersonic helium gas jet (conical nozzle with 1 mm
diameter orifice, Mach number M = 3.3). The harmonics in the soft X-
ray region are measured along the laser propagation direction with a
grazing-incidence flat-field spectrograph similar to the one described
in30, 60 comprising a gold-coated toroidal mirror with the main radii of
4897 mm and 23.74 mm operating at the incidence angle of 88°, a 200
µm slit, optical blocking filters, a spherical mechanically ruled flat-field
grating34 with the radius of 5649 mm and the nominal groove density of
1200 lines/mm operating at the incidence angle of 87°, and a 16 bit per
pixel, 1100×330 back-illuminated Charge-Coupled Device (CCD) with
the pixel size of 24 µm operated at -24°C. The acceptance angle of the
spectrograph is 3×10⁻⁵ sr. The estimated spatial resolution of the
spectrograph is several tens of micrometers, limited by the geometrical
aberrations of the grazing-incidence optics. Two spectral ranges have
been used, 80-250 eV (employing two 160 nm Mo/C multilayer filters33)
and 110-350 eV (with two 200 nm Pd filters). The electrons
accelerated61 in the gas jet are deflected by a permanent magnet (0.76
T, 10 cm × 10 cm) and directed to the phosphor screen (DRZ-High),
which is imaged onto the gated intensified CCD to obtain the electron
energy spectra in each shot.62 In some shots there are additional two
laser pulses used for the diagnostic and other purposes; we have
checked (by blocking and time delays) that these additional pulses do
not influence the processed described in this paper. b The electron
density profiles at 1 mm above the nozzle (laser irradiation position)
estimated from the neutral gas density assuming double ionization of
He atoms; this assumption is justified by the high intensity of the laser
pulse, which exceeds the threshold of the barrier suppression ionization

28
by few orders of magnitude. The neutral gas density profiles are
measured with the interferometry. The FWHM of the density distribution
is 840 µm. The arrow and vertical line show the laser beam direction
and the position of focus in vacuum, respectively. The error bars are
due to the noise of CCD used for the interferometry, which affects the
density reconstruction process.
6 8 10 12100
120
140
160
180
200
220
*nH1.0
= 133
nH0.885
= 144
ω/∆ω
λ, nm
*
c
5 10 150
200
400
600
800
1000
0.000
0.004
0.008
0.012
0.016
0.020
Ne7+
1s2 2
p -
1s2 4
d7.
347
& 7
.35
6 n
m
ω/∆ω = 170
ω/∆ω = 230
Ne7+
1s2 2
p -
1s2 3
d9.
812
& 9
.82
6nm
2×7.35 nm
ω/∆ω = 150
T
λ, nm
Counts
2nd spectralorder
b
a Neon
mλ, nm 4567891011121314151617 4567891011121314151617
CCD Counts0 250
Fig. S2. a CCD raw data, spectrum of Ne ion emission used for the in-place
spectrograph calibration; the Ne plasma is created by the same laser
pulse in the same nozzle backed with Ne gas. b Solid line shows the
lineout of the raw data shown in the frame a with the identification of
some Ne ion lines and estimated resolution using the line widths.
Dashed line shows the idealized spectrograph throughput, which is the
product of the toroidal mirror reflectivity, filter transmission, grating
efficiency, and CCD quantum efficiency. c The circles show the
resolving power of the spectrograph ω/∆ω estimated using the width of
Ne ion lines. The thick solid line is the 2nd order polynomial fit to the
data. The thin solid and dashed lines show the harmonic orders for the

29
base frequencies of ω0 and 0.885ω0. The crossings of these lines with
the curve ω/∆ω give the estimations of the maximum resolvable
harmonic orders.
Fig. S3. Example of bright spot removal, the same data as in Fig. 1 of the main
text. a Original data (no processing). b Image after the bright spot
removal.
122 123 124 125 126 127 1280
50
100
150
200
250
300
122 123 124 125 126 127 1280
50
100
150
200
250
300
122 123 124 125 126 127 1280
50
100
150
200
250
300
122 123 124 125 126 127 1280
50
100
150
200
250
300ω/ω0
ω/ω0
ω/ω0
ω/ω0
∆ω/ω0 = 1.2% ∆ω/ω0 = 0.8%
∆ω/ω0 = 0.36 %:Harmonics start to appear
∆ω/ω0 = 0.2%:Harmonics are clear
a b
c d
Fig. S4. A model example of harmonics generated by the laser pulse with
gradually changing frequency. The electric field is calculated as
( ) ( )[ ]∑=
−− +=140
1100
15110 12cos2n
n ttnE αωπ within the time range (-10, 10), so that
the frequency varies from (1-10α)ω0 to (1+10α)ω0, ∆ω/ω0 = 20α. The
CCD Counts 0 250
b
a

30
harmonics around order nH* = 126 become distinguishable when the
relative frequency change is smaller than ≈ 1/2nH* ≈ 0.4%.
0 100 200 300 4000.5
0.6
0.7
0.8
0.9
0.84660.85 31
0
0 1'
−=
nll
x
ωω
0.8964
ω'0/ω
0
x, µm
0.9∆x = 5 µm
∆x = 4 µm
750 800 850 900 9500
100
200
300
400
500
Counts
λ, nm
a b
Fig. S5. Broadening of the transmitted laser spectrum and downshift of the
average frequency due to nonlinear pulse depletion. a Solid line, the
spectrum of transmitted radiation in the same shot as shown in Fig. 1 of
the main text. Dashed line, the spectrum of laser obtained with the
same setup, but without plasma. The radiation around 800 nm is
suppressed by a dielectric-coated mirror so that the same setup can be
used to record the spectrum of original laser pulse and significantly
depleted and frequency downshifted pulse transmitted through plasma.
b Average laser pulse frequency estimated using Eq. (S4) assuming
uniform plasma density (ne = 2.7×1019 cm-3). The estimated values of
the propagation distance ∆x during which the laser frequency changes
by 0.4% are shown for two positions corresponding to the frequencies
of 0.9ω0 and 0.85ω0, similar to those observed in the experiment. Note
that the estimated ∆x value depends weakly on the position in plasma x
as long as x < lnl or, in other words, ω0' ≈ ω0, which is the case in the
experiment.
Related Documents