Med Buccale Chir Buccale 2010;16:23-43 www.mbcb-journal.org c SFMBCB, 2010 DOI: 10.1051/mbcb/2009039 Article original X-ray evaluation at 5-6 years of Straumann implants (part 1) Hamasat Gheddaf-Dam 1, , Semaan Abi Najm 2 , Stella Lysitsa 3 , Mark Bischof 2 , Rabah Nedir 2 1 Department of Prosthodontics and Operative Dentistry, Tufts School of Dental Medicine Boston, USA 2 Division of Stomatology and Oral Surgery, Dental School, Geneva, Switzerland 3 Department of Oral Surgery, Aristotle University, Thessaloniki, Greece (Received 21 September 2009, accepted 8 October 2009) Key words: implant / biomedical factors / private practice Abstract – The loss of bone around implants is, on an average, below 1 mm during the first year and 0.2 mm per year in the years that follow. It essentially depends upon biomechanical factors but the level at which the bone stabilizes is determines by the implant depth. Intraoral radiographs (paralleling technique) are considered as the "firs choice2 for the evaluation of the radiolucency with respect to the proximal peri-implant bone. This study was based on 528 implants placesd in private practice, with an objective to determine their success rate and their survival at 5-6 years, to evaluate the peri-implant proximal bone loss and outline the factors that could influence this bone loss. The results obtained from 411 accessible patient files are in accordance with the literature date (at 5-6 years, the survival rate is 99.2%, the success rate is 93%, the average bone los sis 1.16 mm). The bone loss was more severe in smokers and in implants with a TPS surface, those placed in the anterior regions or those with vestibular cortical bone below the 1 mm. Short implants were not associated with a more severe bone loss than longer implants. Introduction Implant therapy has long been proven to be a safe and reliable mode of treatment with a limited number of bio- logical and prosthetic postoperative complications [1]. Since the early studies of Brånemark et al. [2], osseointegrated implants have become the therapy of choice to rehabilitate edentulous ridges. Success rates are very high, as proven by the longitudinal studies of Adell et al. [3, 4] Concise success criteria were established in earlier stud- ies. They stated that the vertical bone loss at the implant cre- stal sites should, on average, be less than 1.0 mm following the first year of implants in function, and should not exceed 0.2 mm in subsequent years [5, 6]. Other parameters such as the absence of continuous radiolucency around the implants, lack of mobility, assessment of the degree of inflammation, gingival recession and pocket probing depths were also in- cluded in the classification of success criteria [5]. Later on, the definition of success was simplified by Buser et al. [7] as the following: 1. Absence of persistent subjective complaints, such as pain, foreign body sensation and/or dysthesia, Correspondence: [email protected] 2. Absence of recurrent peri-implant infection with suppura- tion, 3. Absence of mobility. These criteria were used in the present study for the determi- nation of success and survival rates for a population of 528 Straumann R implants, over a period of 5–6 years. A radio- logical bone level evaluation was also performed at the end of the study period, and was included in the determination of the success criteria. The following sections explain and justify the methods and principles of this evaluation. The introduc- tion concludes with an overview of the external factors that might influence the peri-implant bone level, which was con- sidered in the current study. Crestal bone remodeling Comprehension of the physiological principles governing crestal bone remodeling around implants facilitates the dis- tinction between an expected physiologic crestal bone remod- eling, and a pathologic condition resulting in bone loss [8]. Hermann et al. [9, 10] suggested that this bone remodeling was a consequence of biologic width formation around im- Article published by EDP Sciences 23

Welcome message from author
This document is posted to help you gain knowledge. Please leave a comment to let me know what you think about it! Share it to your friends and learn new things together.
Transcript

Med Buccale Chir Buccale 2010;16:23-43 www.mbcb-journal.orgc© SFMBCB, 2010DOI: 10.1051/mbcb/2009039
Article original
X-ray evaluation at 5-6 years of Straumann implants (part 1)
Hamasat Gheddaf-Dam1,�, Semaan Abi Najm2, Stella Lysitsa3, Mark Bischof2,Rabah Nedir21 Department of Prosthodontics and Operative Dentistry, Tufts School of Dental Medicine Boston, USA2 Division of Stomatology and Oral Surgery, Dental School, Geneva, Switzerland3 Department of Oral Surgery, Aristotle University, Thessaloniki, Greece
(Received 21 September 2009, accepted 8 October 2009)
Key words:implant /biomedical factors /private practice
Abstract – The loss of bone around implants is, on an average, below 1 mm during the first year and0.2 mm per year in the years that follow. It essentially depends upon biomechanical factors but the levelat which the bone stabilizes is determines by the implant depth.Intraoral radiographs (paralleling technique) are considered as the "firs choice2 for the evaluation of theradiolucency with respect to the proximal peri-implant bone.This study was based on 528 implants placesd in private practice, with an objective to determine theirsuccess rate and their survival at 5-6 years, to evaluate the peri-implant proximal bone loss and outlinethe factors that could influence this bone loss.The results obtained from 411 accessible patient files are in accordance with the literature date (at5-6 years, the survival rate is 99.2%, the success rate is 93%, the average bone los sis 1.16 mm). Thebone loss was more severe in smokers and in implants with a TPS surface, those placed in the anteriorregions or those with vestibular cortical bone below the 1 mm. Short implants were not associated with amore severe bone loss than longer implants.
Introduction
Implant therapy has long been proven to be a safe andreliable mode of treatment with a limited number of bio-logical and prosthetic postoperative complications [1]. Sincethe early studies of Brånemark et al. [2], osseointegratedimplants have become the therapy of choice to rehabilitateedentulous ridges. Success rates are very high, as proven bythe longitudinal studies of Adell et al. [3, 4]
Concise success criteria were established in earlier stud-ies. They stated that the vertical bone loss at the implant cre-stal sites should, on average, be less than 1.0 mm followingthe first year of implants in function, and should not exceed0.2 mm in subsequent years [5, 6]. Other parameters such asthe absence of continuous radiolucency around the implants,lack of mobility, assessment of the degree of inflammation,gingival recession and pocket probing depths were also in-cluded in the classification of success criteria [5]. Later on,the definition of success was simplified by Buser et al. [7] asthe following:
1. Absence of persistent subjective complaints, such as pain,foreign body sensation and/or dysthesia,
� Correspondence: [email protected]
2. Absence of recurrent peri-implant infection with suppura-tion,
3. Absence of mobility.
These criteria were used in the present study for the determi-nation of success and survival rates for a population of 528Straumann R© implants, over a period of 5–6 years. A radio-logical bone level evaluation was also performed at the endof the study period, and was included in the determination ofthe success criteria. The following sections explain and justifythe methods and principles of this evaluation. The introduc-tion concludes with an overview of the external factors thatmight influence the peri-implant bone level, which was con-sidered in the current study.
Crestal bone remodeling
Comprehension of the physiological principles governingcrestal bone remodeling around implants facilitates the dis-tinction between an expected physiologic crestal bone remod-eling, and a pathologic condition resulting in bone loss [8].Hermann et al. [9, 10] suggested that this bone remodelingwas a consequence of biologic width formation around im-
Article published by EDP Sciences 23
Med Buccale Chir Buccale 2010;16:23-43 H. Gheddaf-Dam et al.
(1) Connective tissue attachment: 1.07 mm(2) Junctional epithelium: 0.97 mm(3) Sulcus: 0.69 mm
A-B : Connective tissue attachment: 1.5+/– 0.5 mmB-C : Junctional epithelium: 1.5+/–0.5 mmC-D : Sulcus: 0.5–1 mm
Fig. 1. The biological width of a tooth compared to that of an implant.
plants, which was physiologically determined, stable and di-mensionally similar to that around teeth.
The formation of a biologic width can lead to a circum-ferential crater around the implant shoulder [4, 8, 9]. In ar-eas of thin bone, the development of a crater may result inthe loss of crestal bone height and gingival recession. Thisphysiologic dimension, that was established early and main-tained over time, appears to exist between the bone and theimplant-crown interface around one-piece implants. It is con-sistent with the formation of a biologic width similar to thatfound around the natural dentition [10, 11](Fig. 1). However,this biologic width is vulnerable to change. Bone loss may beobserved in order to maintain the biologic width, particularly,as a response to various external factors.
Two other phenomena may participate in expected boneremodeling [11]. The first phenomenon determining boneloss is the location of the microgap (implant-abutment con-nection), in 2-stage implant surgeries. This also explainsthe 1.5 mm bone loss observed around submerged implants(when a microgap is created after abutment connection atthe second-stage surgery) in the first year of function.
Secondly, the interface between the smooth and roughsurface on an implant, is thought to play a major role. Boneloss is an adaptation to biomechanical influences, and im-plant placement depth determines the level at which it sta-bilizes [8, 10, 11]. Bone loss occurs up to that interface, andbone rarely stays on the machined surface. Thus, height ofthe smooth collar (e.g. 1.8 mm on Straumann R© Esthetic im-plants) takes into consideration the notion of the biologi-cal width, in one-staged implant procedures. Having that inmind, any bone loss occurring further than that height (whichhappens to correspond to the smooth collar), could be con-sidered as non-physiological bone loss. Based on these obser-vations, this initial bone loss was considered as physiological
remodeling; bone loss occurring beyond that point was henceregarded as pathological bone loss [8, 11].
This finding has been incorporated in the current studyin an original way that enabled the investigators to considerthe smooth-rough interface as the baseline bone level, up towhich bone loss was considered as physiological.
In addition, external factors may participate in furtherbone remodeling, and hence bone loss. These will be detailedlater.
Radiographic methodology
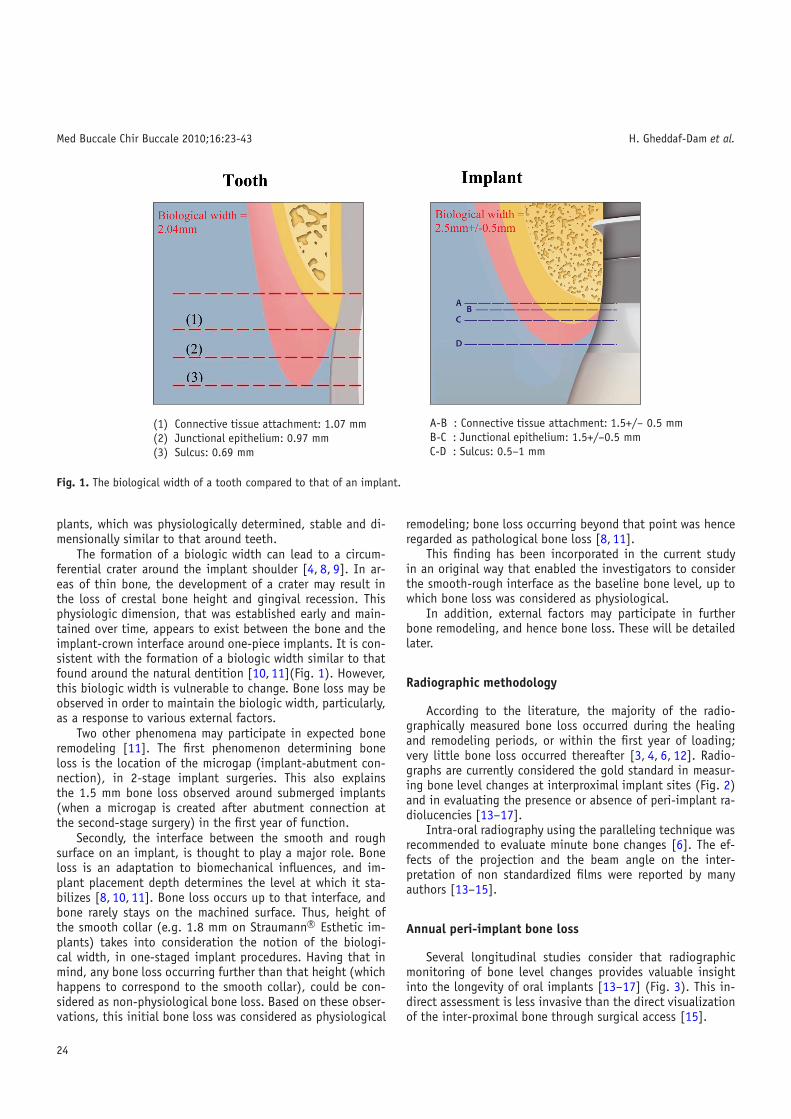
According to the literature, the majority of the radio-graphically measured bone loss occurred during the healingand remodeling periods, or within the first year of loading;very little bone loss occurred thereafter [3, 4, 6, 12]. Radio-graphs are currently considered the gold standard in measur-ing bone level changes at interproximal implant sites (Fig. 2)and in evaluating the presence or absence of peri-implant ra-diolucencies [13–17].
Intra-oral radiography using the paralleling technique wasrecommended to evaluate minute bone changes [6]. The ef-fects of the projection and the beam angle on the inter-pretation of non standardized films were reported by manyauthors [13–15].
Annual peri-implant bone loss
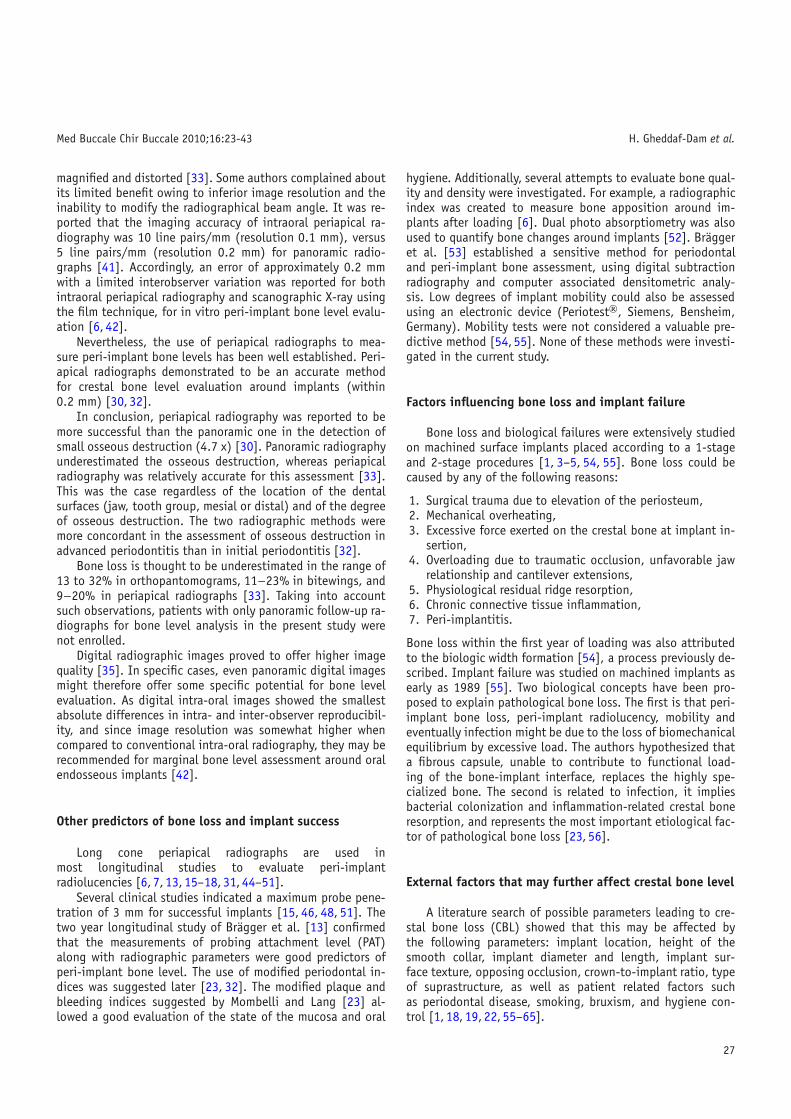
Several longitudinal studies consider that radiographicmonitoring of bone level changes provides valuable insightinto the longevity of oral implants [13–17] (Fig. 3). This in-direct assessment is less invasive than the direct visualizationof the inter-proximal bone through surgical access [15].
24

Med Buccale Chir Buccale 2010;16:23-43 H. Gheddaf-Dam et al.
Fig. 2. Interproximal estimation of the bone levels on a peri-apicalradiograph.
Fig. 3. A radiographic image ensures the visualization of the inter-proximal bone level.
Numerous long-term dental implant studies have utilizedintraoral radiographs to assess marginal bone loss over timeas a critical examination variable [15, 17, 18]. The consensusreport of the 3rd European Workshop on Periodontolgy [19]assessed that a maximal bone loss of 2 mm between baseline(prosthesis in place) and the 5-year examination is accept-able. The risk of developing peri-implantitis and eventual im-plant loss has led the scientific community to search for ac-curate and reliable prognostic parameters.
The early longitudinal studies of Adell et al. in the1980s [3, 4] established that the majority of bone loss oc-curred during the healing and remodeling periods or withinthe first year of loading; very little bone loss occurs there-after. Published data described a mean marginal bone loss of0.4–0.5 mm during the first year post-implantation and 0.05–
0.1 mm annually thereafter [7,14]. Similar observations werenoted later by other research groups [16,21,22], who definedthe following measurements for the one stage ITI implants:0.75 mm after the first year and less than 0.1 mm the fol-lowing years. Another study determined that a mean crestalbone loss ranging from 0.9–1.6 mm in the first year afterfunctional loading was acceptable [17]. A mean annual lossof 0.05–0.13 mm was reported in various studies with screw-type titanium implants [11, 14, 21].
In their 5-year prospective study using standardized ra-diographs, Weber et al. [16] showed that the mean crestalbone loss for Straumann implants during the first year wasapproximately 0.6 mm, followed by a yearly loss of 0.05 mm.This study considered bone levels on the day of surgery asthe baseline, which is uncommon in the dental implant liter-ature to date. Most of the previous studies on machined sur-faces measured bone loss in considering the point at whichabutment connection was made as baseline (in the 2-stagetechnique). Hence they did not take into account bone re-modeling that might have occurred previously. In contrast tothe two- stage procedure implant system where osseointegra-tion and marginal soft tissue adaptation occurs separately,theses healing events occur concomitantly usually within thefirst 3–4 months in 1-stage procedures, thus establishing astabilized situation [11].
Certain studies suggest that implants with bone losshigher than 4 mm often showed a progressive loss of os-seointegration, and possible implant loss in the subsequentyears [18,22]. Probing depths of 5 mm are usually associatedto a chronic inflammatory state. Thus, one major objectivehas been to develop therapies that aim to improve these crit-ical peri-implant situations, to eliminate soft tissue pockets,and /or to regenerate bone [23].
Different values presented in the different studies wererelated to the variability in analysis methods and data selec-tion. For instance, the Brånemark group excluded bone lossoccurring during the first year; their results were expressedas mean values, and concerned a population with large inter-individual deviation [24]. For Adell et al., the reported boneloss was 0.1 mm with high standard deviations [4]. Mea-surement errors were reported to be responsible for incorrectjudgment of peri-implant bone level [6, 15, 25]. The level atwhich implants were placed, implant surface textures (ma-chined, different rough surfaces), implant design, and oneversus 2-step surgical techniques were other factors that mayexplain the varying degrees of bone loss measured in the dif-ferent studies [26–29]. Further studies should focus on thequestions: does marginal bone height really decrease at a con-stant rate? What factors may affect such a decrease?
Limitations of the radiological method
Based on previously mentioned reports, radiographs withintraoral rectangular films were considered to ensure unbiasedand reproducible results. The paralleling technique allowsan optimum and reproducible quality of periapical radio-graphs [30, 33]. However, any deviation from the correct
25

Med Buccale Chir Buccale 2010;16:23-43 H. Gheddaf-Dam et al.
vertical angle leads to errors in the assessments of themarginal bone height. According to the longitudinal study ofSewerin [34] on peri-implant bone loss, the distance betweena reference point and the marginal bone level around implantscould be assessed with a great accuracy by means of thelong-cone paralleling technique, conventional or digitalised.The author measured, by evaluating bone height aroundboth threaded and cylindrical implants on intra-oral radio-graphs, a mean inter-examiner difference of 0.09 ± 0.16 mm.Digital radiographs led to the same mean absolute dif-ference (0.18 mm) as conventional intra-oral radiographicfilms [6, 35].
Differences in measurements may also be caused by thedifficulty of placing the film intraorally. This occurs most oftenin the posterior maxilla because of the steep inclination of thepalate, and in the anterior mandibular region. In the anteriormandible (especially in edentulous patients), many authorsmentioned that the atrophy related elevation of the floor ofthe mouth, the pain and discomfort to the patient, all yield todifficulties in establishing good radiographs. Superimpositionof the calcified structures of the jaw itself may also interferewith the measurement of the crestal bone level [34–36].
Spiekermann et al. [37] pointed out that with long obser-vation periods; data taken from radiographs could be liable toa wide range of measurement errors that might hide the truebone level heights and resulting pocket depths.
The evaluation of periodontal or peri-implant marginalbone loss on dental radiographs implies the obvious disad-vantage that only the mesial and distal bone levels could bedistinguished [38–40]. However, this should not be of impor-tance in crater-shaped peri-implant bone loss. The accuratevalue of bone loss tended to be underestimated on radio-graphs [39]. Moreover, variations in implant angulations inrelation to the film plan as well as the direction of the radio-graphic beam influenced the image on the film. Small devia-tions from strict parallelism between implant and film planewere also able to significantly change bone height measure-ments [38, 41].
Reliability of the radiological method
As previously mentioned, a paralleling technique shouldbe applied to minimize measurement errors. By using thistechnique, the film has to be positioned parallel to the axisof the implants and the film holder connected to the tube ofa dental radiograph (Fig. 4). Correct vertical angle of projec-tion is achieved when the threads on both sides are clearlyidentified [30].
Few studies dealt with accurate clinical and radiographicmethods for detecting changes in the bone level. Radio-graphic assessment was compared to the histological methodby Isidor [39]. In this study, clinical probing as well as ra-diographical and histological bone levels were assessed onmachined surface implants placed in monkeys according to a2-stage procedure. The author recommended the use of knownhallmarks on the implant (smooth surface and threads) and
Fig. 4. The radiographic paralleling technique ensures correct esti-mation of the peri-implant bone level.
showed a high correlation between the radiographic measure-ments and the histological evaluation.
The relationship between probing level and radiographicbone level for screw-type implants was also assessed byPapelessi and Diamanti-Kipioti [30]. Furthermore, correlationsbetween clinical probing and histological levels were alsoevaluated by an experimental study in the dog [40]. Hence,both radiographic interpretations of changes over time andmeasurements of attachment level changes are reliable in as-sessing the treatment outcome of inter-proximal intra-bonydefects [24].
The evaluation of bone level changes over time requireshigh precision methods. This means that the obtained resultsshould be similar when repeated by the same or different ob-servers [25]. Variations within observers can be substantialwhen alveolar bone loss around teeth is assessed. However,when determining bone loss over time, some observers mak-ing several and independent readings are more precise thanseveral readings by the same observer [25]. This principle wasfollowed in the present study.
Comparison of panoramic and periapical radiographs
Panoramic radiography has been proposed to be an al-ternative method to measure bone loss [41]. Because of itsstandardized projection in the vertical plane, it suits wellfor vertical bone measurement. In addition, panoramic radio-graphs might be more appropriate in some cases than peri-apical radiographs because they offer an image of both jaws.They could also be used in patients with limited mouth open-ing [41]. Panoramic radiographs proved to be comparable toregular intraoral radiographs in detection of bone loss aroundimplants in the anterior mandible, where periapical films weredifficult to place [34].
However, the bidimensional view obtained with panoramicradiographs is blurred by the superimposition of the cervicalcolumn on the anterior region; therefore, the images seem
26
Med Buccale Chir Buccale 2010;16:23-43 H. Gheddaf-Dam et al.
magnified and distorted [33]. Some authors complained aboutits limited benefit owing to inferior image resolution and theinability to modify the radiographical beam angle. It was re-ported that the imaging accuracy of intraoral periapical ra-diography was 10 line pairs/mm (resolution 0.1 mm), versus5 line pairs/mm (resolution 0.2 mm) for panoramic radio-graphs [41]. Accordingly, an error of approximately 0.2 mmwith a limited interobserver variation was reported for bothintraoral periapical radiography and scanographic X-ray usingthe film technique, for in vitro peri-implant bone level evalu-ation [6, 42].
Nevertheless, the use of periapical radiographs to mea-sure peri-implant bone levels has been well established. Peri-apical radiographs demonstrated to be an accurate methodfor crestal bone level evaluation around implants (within0.2 mm) [30, 32].
In conclusion, periapical radiography was reported to bemore successful than the panoramic one in the detection ofsmall osseous destruction (4.7 x) [30]. Panoramic radiographyunderestimated the osseous destruction, whereas periapicalradiography was relatively accurate for this assessment [33].This was the case regardless of the location of the dentalsurfaces (jaw, tooth group, mesial or distal) and of the degreeof osseous destruction. The two radiographic methods weremore concordant in the assessment of osseous destruction inadvanced periodontitis than in initial periodontitis [32].
Bone loss is thought to be underestimated in the range of13 to 32% in orthopantomograms, 11−23% in bitewings, and9−20% in periapical radiographs [33]. Taking into accountsuch observations, patients with only panoramic follow-up ra-diographs for bone level analysis in the present study werenot enrolled.
Digital radiographic images proved to offer higher imagequality [35]. In specific cases, even panoramic digital imagesmight therefore offer some specific potential for bone levelevaluation. As digital intra-oral images showed the smallestabsolute differences in intra- and inter-observer reproducibil-ity, and since image resolution was somewhat higher whencompared to conventional intra-oral radiography, they may berecommended for marginal bone level assessment around oralendosseous implants [42].
Other predictors of bone loss and implant success
Long cone periapical radiographs are used inmost longitudinal studies to evaluate peri-implantradiolucencies [6, 7, 13, 15–18, 31, 44–51].
Several clinical studies indicated a maximum probe pene-tration of 3 mm for successful implants [15, 46, 48, 51]. Thetwo year longitudinal study of Brägger et al. [13] confirmedthat the measurements of probing attachment level (PAT)along with radiographic parameters were good predictors ofperi-implant bone level. The use of modified periodontal in-dices was suggested later [23, 32]. The modified plaque andbleeding indices suggested by Mombelli and Lang [23] al-lowed a good evaluation of the state of the mucosa and oral
hygiene. Additionally, several attempts to evaluate bone qual-ity and density were investigated. For example, a radiographicindex was created to measure bone apposition around im-plants after loading [6]. Dual photo absorptiometry was alsoused to quantify bone changes around implants [52]. Bräggeret al. [53] established a sensitive method for periodontaland peri-implant bone assessment, using digital subtractionradiography and computer associated densitometric analy-sis. Low degrees of implant mobility could also be assessedusing an electronic device (Periotest�, Siemens, Bensheim,Germany). Mobility tests were not considered a valuable pre-dictive method [54,55]. None of these methods were investi-gated in the current study.
Factors influencing bone loss and implant failure
Bone loss and biological failures were extensively studiedon machined surface implants placed according to a 1-stageand 2-stage procedures [1, 3–5, 54, 55]. Bone loss could becaused by any of the following reasons:
1. Surgical trauma due to elevation of the periosteum,2. Mechanical overheating,3. Excessive force exerted on the crestal bone at implant in-
sertion,4. Overloading due to traumatic occlusion, unfavorable jaw
relationship and cantilever extensions,5. Physiological residual ridge resorption,6. Chronic connective tissue inflammation,7. Peri-implantitis.
Bone loss within the first year of loading was also attributedto the biologic width formation [54], a process previously de-scribed. Implant failure was studied on machined implants asearly as 1989 [55]. Two biological concepts have been pro-posed to explain pathological bone loss. The first is that peri-implant bone loss, peri-implant radiolucency, mobility andeventually infection might be due to the loss of biomechanicalequilibrium by excessive load. The authors hypothesized thata fibrous capsule, unable to contribute to functional load-ing of the bone-implant interface, replaces the highly spe-cialized bone. The second is related to infection, it impliesbacterial colonization and inflammation-related crestal boneresorption, and represents the most important etiological fac-tor of pathological bone loss [23, 56].
External factors that may further affect crestal bone level
A literature search of possible parameters leading to cre-stal bone loss (CBL) showed that this may be affected bythe following parameters: implant location, height of thesmooth collar, implant diameter and length, implant sur-face texture, opposing occlusion, crown-to-implant ratio, typeof suprastructure, as well as patient related factors suchas periodontal disease, smoking, bruxism, and hygiene con-trol [1, 18, 19, 22, 55–65].
27
Med Buccale Chir Buccale 2010;16:23-43 H. Gheddaf-Dam et al.
Aim of the study
It was three folds:
1. To determine the five to six years success and survivalrates of a population of 528 implants,
2. To evaluate radiographic bone changes around the im-plants,
3. To establish which factors may influence the degree ofperi-implant bone change.
Unlike life-table analysis studies, all implants were evaluatedat a minimum period of five years. All patients were treatedand controlled in a private practice.
An original method was used to assess the pathologicalcrestal bone loss (CBL) occurring during this period: the base-line bone level was considered to be located at the smooth-rough implant interface, thus avoiding the need of referenceradiographs. Bone loss was evaluated by only analyzing theradiographs taken at the 5- to 6-years control.
Different statistical tests were used to investigate the in-fluence of various clinical parameters on CBL. Analyzed pa-rameters were the following: implant location, implant diam-eter, implant length, implant collar height, implant surfacetexture type, implant prosthetic suprastructure type, implantvestibular bone lamella width (VBL) at surgery, implant dis-tance to adjacent tooth/implant, opposing dentition type, pa-tient smoking status.
The relevance of this study lies in the large number ofimplants and in the wide range of inclusive criteria for thepatient selection. Furthermore, the absence of strict routinehygiene recalls as carried on in academic institutions can leadto realistic results that would apply in an every day dentalpractice
Material and methods
Surgical and prosthetic procedures
Between January 1995 and December 2000, 528 ITI den-tal implants (Straumann AG, Waldenburg, Switzerland) wereinserted in 236 consecutive patients. These patients weretreated in a private practice environment (Ardentis CliniqueDentaire SA, Vevey, Switzerland). They belonged to the samepool of patients investigated in previous studies [64,66]. Im-plants were placed by two surgeons (RN, MB) under clean butnot sterile conditions as defined by Scharf & Tarnow [67].The patient population consisted of 145 females (61.4%) and91 males (38.6%). Age at implant placement ranged from18 to 89 years old; patients younger than 50 years old re-ceived 176 (33.3%) implants, patients aged between 50 and70 years received 278 (52.6%) implants, while 74 (14.0%)implants were placed in the elder patients. Before June 1999,264 (50%) titanium plasma sprayed (TPS) implants were in-serted. After this date, 264 (50.0%) sandblasted and acid-etched (SLA) implants were placed.
In the mandible, implant length was assessed consid-ering a 2-mm security margin above the mandibular canal;therefore, standard insertion was performed when 10 mm ofbone was available. In the maxilla, sinus perforation was notavoided; implant penetration in the sinus of 1 to 2 mm wastolerated. Standard insertion was performed when 5 mm ofbone height was available. Esthetic Plus� implants (provid-ing one additional millimetre for bone anchorage) were usedwhen the esthetic situation required a deeper placement ofthe implant–crown junction in the sulcus [68] but not an en-hanced anchoring length. Implant tilting to place a longerimplant was not considered; 6 mm long implants were usedonly in conjunction with longer implants. Implant length (8,10 or 12 mm) was not taken into consideration to determinethe number of implants, the type of prosthetic rehabilitationor its dimensions. Surgeons paid attention to place all rough-smooth junctions at the level of the mesial and distal crestalbone level or deeper. No implant was placed with the rough-machined limit above the crest at any proximal site.
The mean healing time for the TPS implants was3.9 months in the mandible and 4.5 months in the maxilla.For the SLA implants, it was respectively 2.3 and 2.5 months.Prior to implantation, general health evaluation was per-formed and local clinical examinations were performed. Nocomplementary biologic tests were requested. When required,implant treatment was decided after a benefit/risk analysiswith the patient. A specific oral hygiene protocol was notfollowed, but the patients were given instructions about theimportance of oral hygiene and the reduction/cessation ofsmoking habit, which was reinforced at every visit. A specifictime period between tooth extraction and implant placementwas not introduced: very few (2.3%) implants were placedconsecutively to tooth extraction, 34.9% after 3–6 months,15.9% after 6–12 months and 47.0% after 1 year.
The patients’ pool included bruxing patients (21.3%),smokers (26.3%) and medically compromised patients(20.1%) like HIV+, controlled diabetes, malignant pathologyother than in the cervico-facial area, heart disease or coagula-tion deficiency. Light or heavy smokers were included withoutdistinction; smoking cessation was not requested either be-fore or after surgery. Bruxers received one implant per rehabil-itated unit; in case of multiple implant rehabilitation, thesepatients were encouraged to wear night-guards to avoid pros-thetic complications. All surgical procedures were performedunder antibiotic prophylaxis (Amoxi-basan�, SchönenbergerPharma, Schönenwerd, Switzerland, 750 mg, 3x/d during 6days or Dalacin C�, Pfizer, Zürich, Switzerland, 300 mg, 3x/dduring 5 days, in case of penicillin allergy) – The differencein the duration of the antibiotic treatment is related to thepackaging system, in order to avoid for the patients to buyan extra pack in the case of Dalacin C�.
Treatment plans systematically included periodontal andcarious status evaluations and, when necessary, diseasemanagement and maintenance prior to implant placement. Allpatients were instructed to attend at least a yearly routinehygienist session [69]. However, patients were not enrolledin this maintenance program.
28
Med Buccale Chir Buccale 2010;16:23-43 H. Gheddaf-Dam et al.
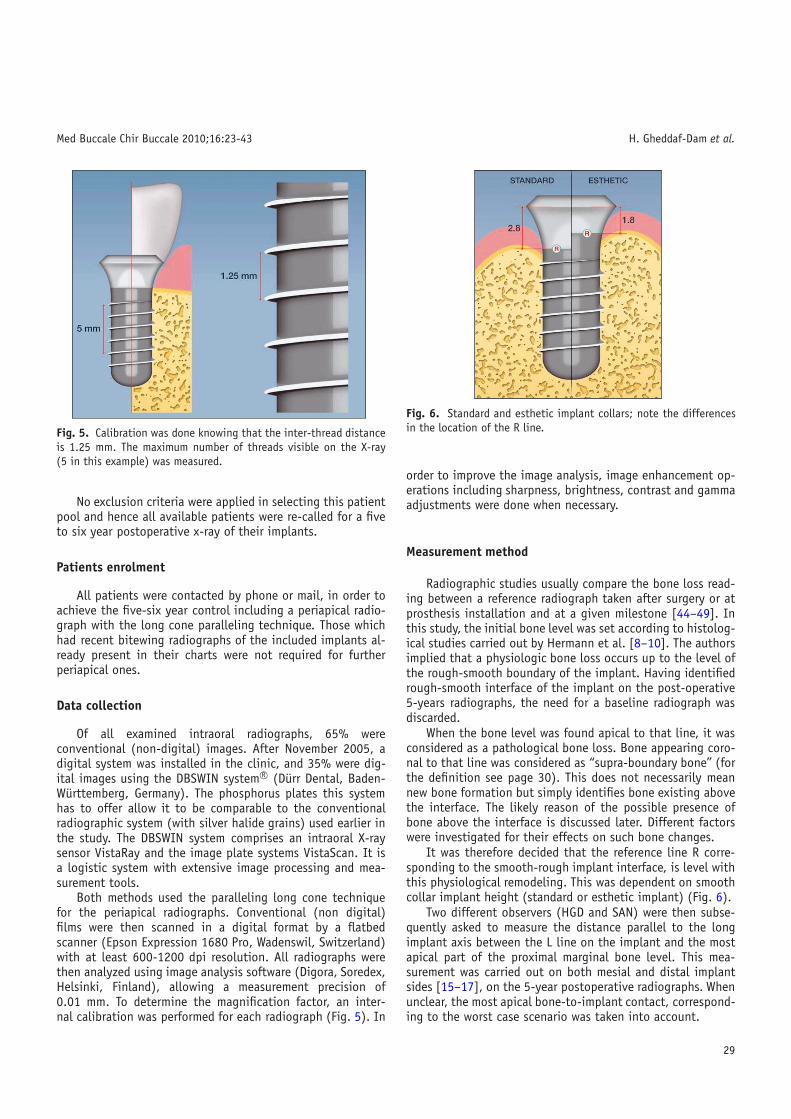
Fig. 5. Calibration was done knowing that the inter-thread distanceis 1.25 mm. The maximum number of threads visible on the X-ray(5 in this example) was measured.
No exclusion criteria were applied in selecting this patientpool and hence all available patients were re-called for a fiveto six year postoperative x-ray of their implants.
Patients enrolment
All patients were contacted by phone or mail, in order toachieve the five-six year control including a periapical radio-graph with the long cone paralleling technique. Those whichhad recent bitewing radiographs of the included implants al-ready present in their charts were not required for furtherperiapical ones.
Data collection
Of all examined intraoral radiographs, 65% wereconventional (non-digital) images. After November 2005, adigital system was installed in the clinic, and 35% were dig-ital images using the DBSWIN system R© (Dürr Dental, Baden-Württemberg, Germany). The phosphorus plates this systemhas to offer allow it to be comparable to the conventionalradiographic system (with silver halide grains) used earlier inthe study. The DBSWIN system comprises an intraoral X-raysensor VistaRay and the image plate systems VistaScan. It isa logistic system with extensive image processing and mea-surement tools.
Both methods used the paralleling long cone techniquefor the periapical radiographs. Conventional (non digital)films were then scanned in a digital format by a flatbedscanner (Epson Expression 1680 Pro, Wadenswil, Switzerland)with at least 600-1200 dpi resolution. All radiographs werethen analyzed using image analysis software (Digora, Soredex,Helsinki, Finland), allowing a measurement precision of0.01 mm. To determine the magnification factor, an inter-nal calibration was performed for each radiograph (Fig. 5). In
Fig. 6. Standard and esthetic implant collars; note the differencesin the location of the R line.
order to improve the image analysis, image enhancement op-erations including sharpness, brightness, contrast and gammaadjustments were done when necessary.
Measurement method
Radiographic studies usually compare the bone loss read-ing between a reference radiograph taken after surgery or atprosthesis installation and at a given milestone [44–49]. Inthis study, the initial bone level was set according to histolog-ical studies carried out by Hermann et al. [8–10]. The authorsimplied that a physiologic bone loss occurs up to the level ofthe rough-smooth boundary of the implant. Having identifiedrough-smooth interface of the implant on the post-operative5-years radiographs, the need for a baseline radiograph wasdiscarded.
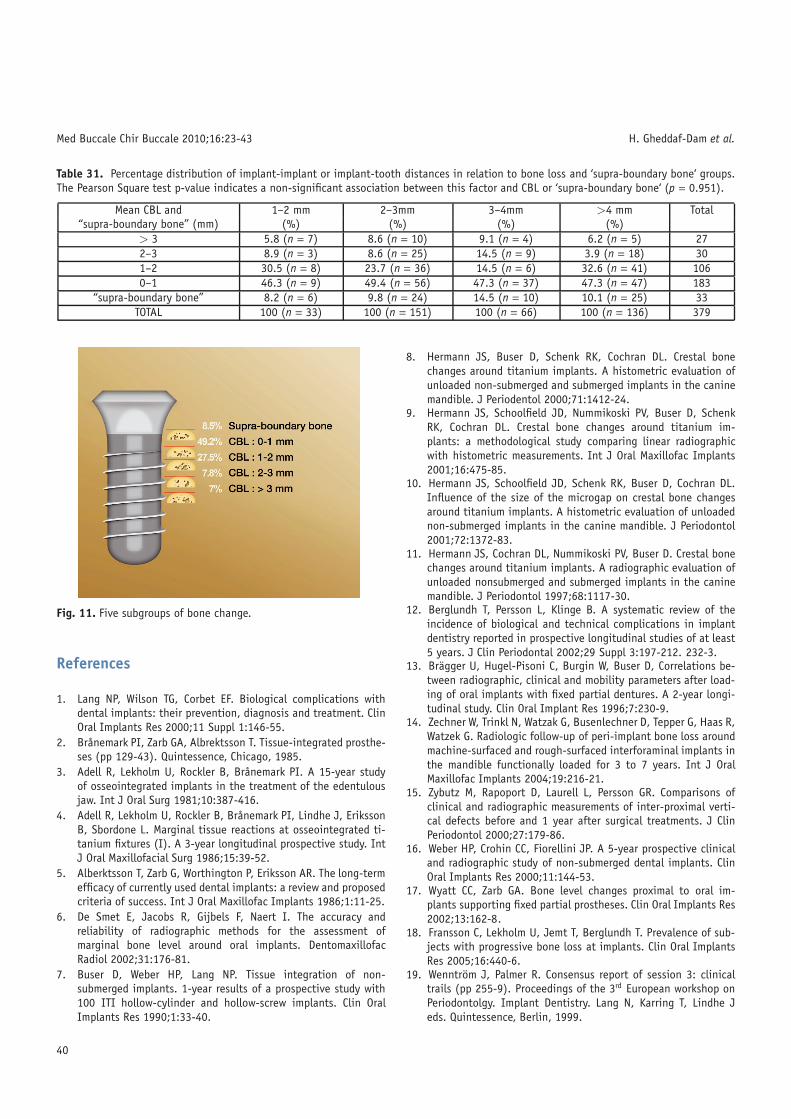
When the bone level was found apical to that line, it wasconsidered as a pathological bone loss. Bone appearing coro-nal to that line was considered as “supra-boundary bone” (forthe definition see page 30). This does not necessarily meannew bone formation but simply identifies bone existing abovethe interface. The likely reason of the possible presence ofbone above the interface is discussed later. Different factorswere investigated for their effects on such bone changes.
It was therefore decided that the reference line R corre-sponding to the smooth-rough implant interface, is level withthis physiological remodeling. This was dependent on smoothcollar implant height (standard or esthetic implant) (Fig. 6).
Two different observers (HGD and SAN) were then subse-quently asked to measure the distance parallel to the longimplant axis between the L line on the implant and the mostapical part of the proximal marginal bone level. This mea-surement was carried out on both mesial and distal implantsides [15–17], on the 5-year postoperative radiographs. Whenunclear, the most apical bone-to-implant contact, correspond-ing to the worst case scenario was taken into account.
29
Med Buccale Chir Buccale 2010;16:23-43 H. Gheddaf-Dam et al.
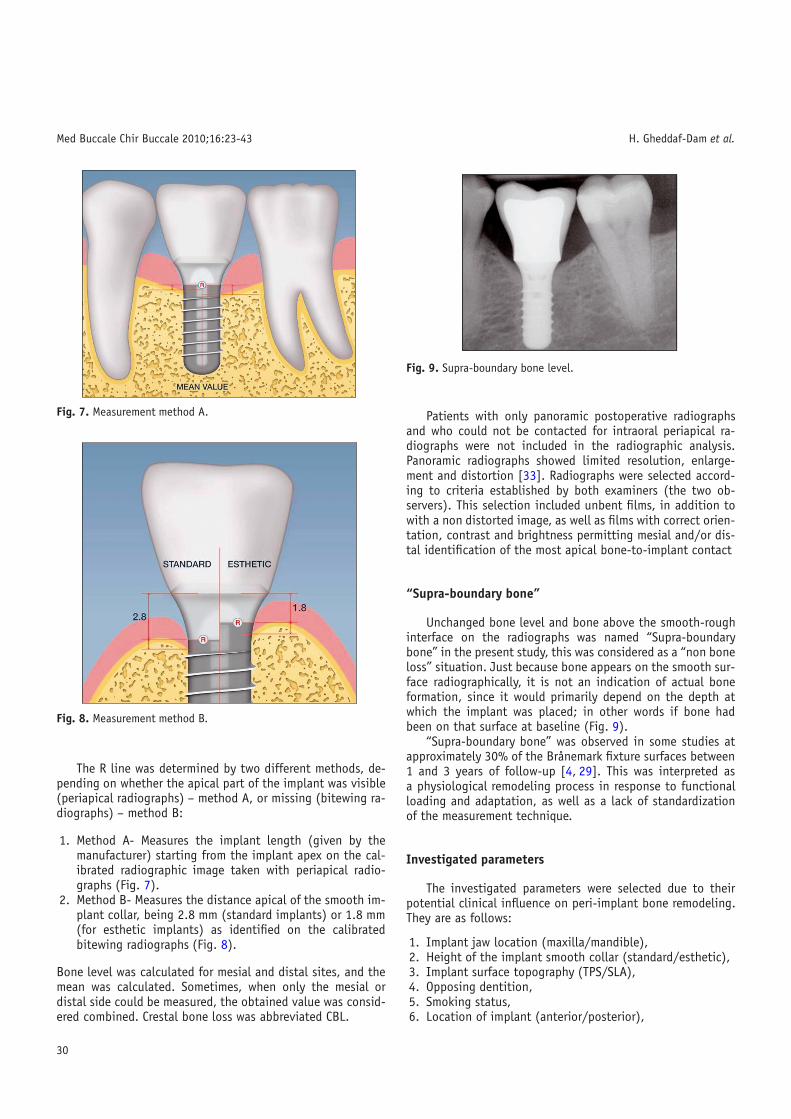
Fig. 7. Measurement method A.
Fig. 8. Measurement method B.
The R line was determined by two different methods, de-pending on whether the apical part of the implant was visible(periapical radiographs) – method A, or missing (bitewing ra-diographs) – method B:
1. Method A- Measures the implant length (given by themanufacturer) starting from the implant apex on the cal-ibrated radiographic image taken with periapical radio-graphs (Fig. 7).
2. Method B- Measures the distance apical of the smooth im-plant collar, being 2.8 mm (standard implants) or 1.8 mm(for esthetic implants) as identified on the calibratedbitewing radiographs (Fig. 8).
Bone level was calculated for mesial and distal sites, and themean was calculated. Sometimes, when only the mesial ordistal side could be measured, the obtained value was consid-ered combined. Crestal bone loss was abbreviated CBL.
Fig. 9. Supra-boundary bone level.
Patients with only panoramic postoperative radiographsand who could not be contacted for intraoral periapical ra-diographs were not included in the radiographic analysis.Panoramic radiographs showed limited resolution, enlarge-ment and distortion [33]. Radiographs were selected accord-ing to criteria established by both examiners (the two ob-servers). This selection included unbent films, in addition towith a non distorted image, as well as films with correct orien-tation, contrast and brightness permitting mesial and/or dis-tal identification of the most apical bone-to-implant contact
“Supra-boundary bone”
Unchanged bone level and bone above the smooth-roughinterface on the radiographs was named “Supra-boundarybone” in the present study, this was considered as a “non boneloss” situation. Just because bone appears on the smooth sur-face radiographically, it is not an indication of actual boneformation, since it would primarily depend on the depth atwhich the implant was placed; in other words if bone hadbeen on that surface at baseline (Fig. 9).
“Supra-boundary bone” was observed in some studies atapproximately 30% of the Brånemark fixture surfaces between1 and 3 years of follow-up [4, 29]. This was interpreted asa physiological remodeling process in response to functionalloading and adaptation, as well as a lack of standardizationof the measurement technique.
Investigated parameters
The investigated parameters were selected due to theirpotential clinical influence on peri-implant bone remodeling.They are as follows:
1. Implant jaw location (maxilla/mandible),2. Height of the implant smooth collar (standard/esthetic),3. Implant surface topography (TPS/SLA),4. Opposing dentition,5. Smoking status,6. Location of implant (anterior/posterior),
30

Med Buccale Chir Buccale 2010;16:23-43 H. Gheddaf-Dam et al.
Fig. 10. Implant-tooth and implant-implant distance measurement.
7. Implant length,8. Implant diameter,9. Implant prosthetic suprastructure,
10. Implant vestibular bone lamella width (VBL) at surgery:VBL < 1 mm or VBL � 1 mm,
11. Implant distance to adjacent tooth/implant. This wasmeasured by drawing a straight line from the R© line tothe adjacent tooth or implant (Fig. 10).
Criteria for determining interpretable radiographs
Strict inclusion criteria were used to determine the bonelevel changes for the obtained radiographs. All bent and un-clear radiographs were excluded from the analysis; however,they were included for success and survival rate evaluations.Radiographs had to fulfill the following criteria to be consid-ered -after calibration- for peri-implant bone level measure-ments:
1. An equal distance (1.25 mm) between all the threads ofthe implant along the entire implant surface,
2. An equal distance of the diameter of the implant (threadto thread) at two different random spots along the im-plant body,
3. The diameter of the collar and the implant length corre-sponded to the values given by the manufacturer; i.e. theR line had to present the same location when determinedfrom the collar (at a distance of 2.8 or 1.8 mm) or fromthe tip of the implant (corresponding to the value of theimplant length).
If the second trial of X-ray capture didn’t also yield therequired quality, the radiographs were eliminated from thestudy. When an observer could not confidently identify theimplant collar and the most apical bone-to-implant contact,radiographic measurements were not included. Bitewing ra-diographs were also considered for bone level evaluation,since bone level changes in the follow-up period always beganaround the neck of the implant [34].
Survival and success rates’ evaluation
Survival rate was defined as the proportion of implants inplace and in function [3,7,13,18,65,70] at the 5–6 years re-evaluation. Success rate was considered as the proportion ofimplants showing no mobility, no peri-implant radiolucency,no active or recurrent peri-implantitis [5,55,65] and no radi-ological CBL > 3 mm.
Statistical analysis
The coefficient of reliability was calculated in order to de-termine the accuracy of measurements between the two ob-servers. Descriptive tables were used to calculate the meanCBL according to the different parameters. The difference be-tween two similar variables i.e. TPS versus SLA or smokersversus non-smokers was evaluated using the Student T-Test(p < 0.001).
ANOVA regression analysis was used to analyze the influ-ence of the variables on CBL or “supra-boundary bone”. Thesevariables were classified in groups depending on values ofCBL and presence of “supra-boundary bone” 1) CBL > 3 mm,2) 2 mm < CBL � 3 mm, 3) 1 mm < CBL � 2 mm, 4)CBL � 1 mm, 5) “supra-boundary bone” (p < 0.05) (Fig. 10).
The Pearson Chi-Square Test was also used to evaluatethe correlation between the different parameters and bonechange.
Finally, the influence of various combined factors wasevaluated in regard to their influence on CBL. This was inves-tigated with the ANOVA Univariate Analysis Test (p < 0.05).
Results
Drop-outs and final patients population
Sixty-two participants (26.3%) dropped out of this study,corresponding to 117 (22.2%) implants. The reasons for drop-outs included deceased 7 patients (15 implants), 51 patientsout of reach (92 implants), 1 patient delaying implant load-ing because of financial problems (2 implants), 2 patients re-fusing irradiation (6 implants), 1 patient unwilling to attend(2 implants).
At the end of the 5–6 year study period, three implants intwo patients failed, bringing the survival rate down to 99.2%.
The radiographs of 15 patients (22 implants) did not cor-respond to the above established criteria for bone level eval-uation: 57% of the 22 implants were located in the posteriormaxilla and 43% in the anterior mandible (from canine to ca-nine). Nevertheless, these radiographs were included in thedetermination of the success and survival rates. The final im-plant population sample reached 411 implants (77.8% of theinitial population) in 174 patients for survival rate evalua-tion, and 386 implants (73.1% of the initial population) forbone level and hence success evaluations.
31
Med Buccale Chir Buccale 2010;16:23-43 H. Gheddaf-Dam et al.
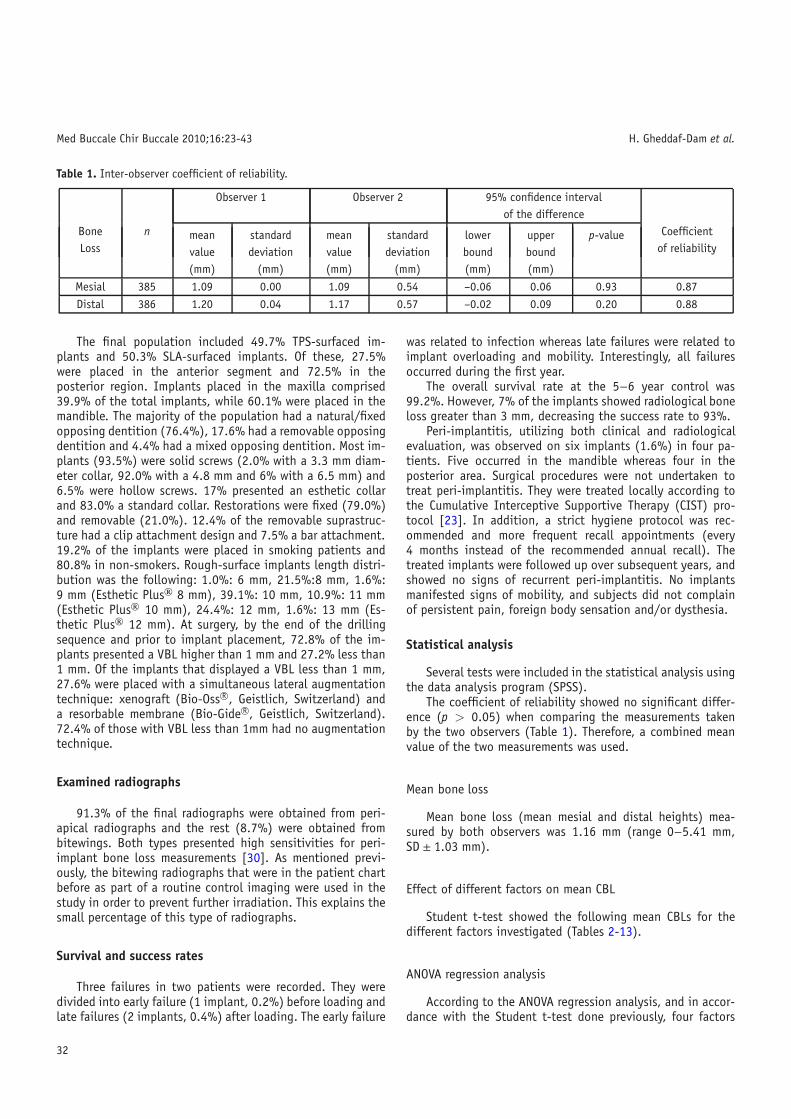
Table 1. Inter-observer coefficient of reliability.
Observer 1 Observer 2 95% confidence intervalof the difference
Bone n CoefficientLoss of reliability
mean standard mean standard lower upper p-valuevalue deviation value deviation bound bound(mm) (mm) (mm) (mm) (mm) (mm)
Mesial 385 1.09 0.00 1.09 0.54 –0.06 0.06 0.93 0.87
Distal 386 1.20 0.04 1.17 0.57 –0.02 0.09 0.20 0.88
The final population included 49.7% TPS-surfaced im-plants and 50.3% SLA-surfaced implants. Of these, 27.5%were placed in the anterior segment and 72.5% in theposterior region. Implants placed in the maxilla comprised39.9% of the total implants, while 60.1% were placed in themandible. The majority of the population had a natural/fixedopposing dentition (76.4%), 17.6% had a removable opposingdentition and 4.4% had a mixed opposing dentition. Most im-plants (93.5%) were solid screws (2.0% with a 3.3 mm diam-eter collar, 92.0% with a 4.8 mm and 6% with a 6.5 mm) and6.5% were hollow screws. 17% presented an esthetic collarand 83.0% a standard collar. Restorations were fixed (79.0%)and removable (21.0%). 12.4% of the removable suprastruc-ture had a clip attachment design and 7.5% a bar attachment.19.2% of the implants were placed in smoking patients and80.8% in non-smokers. Rough-surface implants length distri-bution was the following: 1.0%: 6 mm, 21.5%:8 mm, 1.6%:9 mm (Esthetic Plus� 8 mm), 39.1%: 10 mm, 10.9%: 11 mm(Esthetic Plus� 10 mm), 24.4%: 12 mm, 1.6%: 13 mm (Es-thetic Plus� 12 mm). At surgery, by the end of the drillingsequence and prior to implant placement, 72.8% of the im-plants presented a VBL higher than 1 mm and 27.2% less than1 mm. Of the implants that displayed a VBL less than 1 mm,27.6% were placed with a simultaneous lateral augmentationtechnique: xenograft (Bio-Oss R©, Geistlich, Switzerland) anda resorbable membrane (Bio-Gide R©, Geistlich, Switzerland).72.4% of those with VBL less than 1mm had no augmentationtechnique.
Examined radiographs
91.3% of the final radiographs were obtained from peri-apical radiographs and the rest (8.7%) were obtained frombitewings. Both types presented high sensitivities for peri-implant bone loss measurements [30]. As mentioned previ-ously, the bitewing radiographs that were in the patient chartbefore as part of a routine control imaging were used in thestudy in order to prevent further irradiation. This explains thesmall percentage of this type of radiographs.
Survival and success rates
Three failures in two patients were recorded. They weredivided into early failure (1 implant, 0.2%) before loading andlate failures (2 implants, 0.4%) after loading. The early failure
was related to infection whereas late failures were related toimplant overloading and mobility. Interestingly, all failuresoccurred during the first year.
The overall survival rate at the 5−6 year control was99.2%. However, 7% of the implants showed radiological boneloss greater than 3 mm, decreasing the success rate to 93%.
Peri-implantitis, utilizing both clinical and radiologicalevaluation, was observed on six implants (1.6%) in four pa-tients. Five occurred in the mandible whereas four in theposterior area. Surgical procedures were not undertaken totreat peri-implantitis. They were treated locally according tothe Cumulative Interceptive Supportive Therapy (CIST) pro-tocol [23]. In addition, a strict hygiene protocol was rec-ommended and more frequent recall appointments (every4 months instead of the recommended annual recall). Thetreated implants were followed up over subsequent years, andshowed no signs of recurrent peri-implantitis. No implantsmanifested signs of mobility, and subjects did not complainof persistent pain, foreign body sensation and/or dysthesia.
Statistical analysis
Several tests were included in the statistical analysis usingthe data analysis program (SPSS).
The coefficient of reliability showed no significant differ-ence (p > 0.05) when comparing the measurements takenby the two observers (Table 1). Therefore, a combined meanvalue of the two measurements was used.
Mean bone loss
Mean bone loss (mean mesial and distal heights) mea-sured by both observers was 1.16 mm (range 0−5.41 mm,SD ± 1.03 mm).
Effect of different factors on mean CBL
Student t-test showed the following mean CBLs for thedifferent factors investigated (Tables 2-13).
ANOVA regression analysis
According to the ANOVA regression analysis, and in accor-dance with the Student t-test done previously, four factors
32
Med Buccale Chir Buccale 2010;16:23-43 H. Gheddaf-Dam et al.
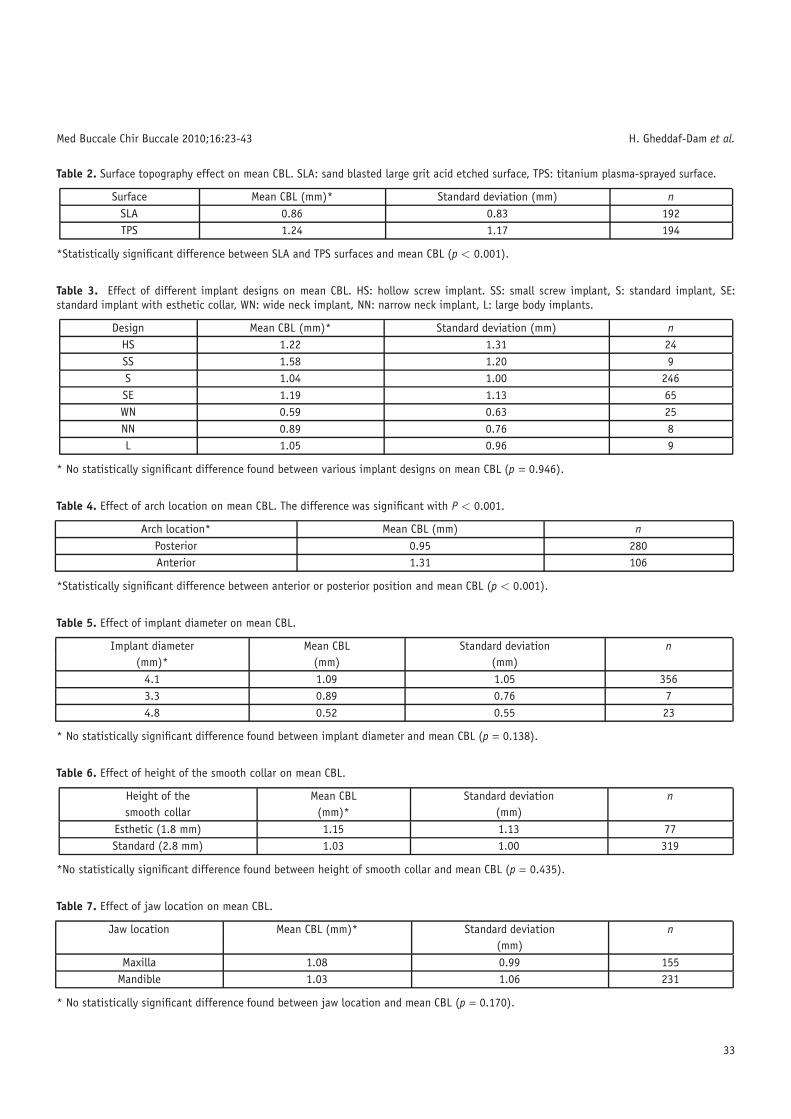
Table 2. Surface topography effect on mean CBL. SLA: sand blasted large grit acid etched surface, TPS: titanium plasma-sprayed surface.
Surface Mean CBL (mm)* Standard deviation (mm) nSLA 0.86 0.83 192TPS 1.24 1.17 194
*Statistically significant difference between SLA and TPS surfaces and mean CBL (p < 0.001).
Table 3. Effect of different implant designs on mean CBL. HS: hollow screw implant. SS: small screw implant, S: standard implant, SE:standard implant with esthetic collar, WN: wide neck implant, NN: narrow neck implant, L: large body implants.
Design Mean CBL (mm)* Standard deviation (mm) nHS 1.22 1.31 24SS 1.58 1.20 9S 1.04 1.00 246SE 1.19 1.13 65WN 0.59 0.63 25NN 0.89 0.76 8L 1.05 0.96 9
* No statistically significant difference found between various implant designs on mean CBL (p = 0.946).
Table 4. Effect of arch location on mean CBL. The difference was significant with P < 0.001.
Arch location* Mean CBL (mm) nPosterior 0.95 280Anterior 1.31 106
*Statistically significant difference between anterior or posterior position and mean CBL (p < 0.001).
Table 5. Effect of implant diameter on mean CBL.
Implant diameter Mean CBL Standard deviation n(mm)* (mm) (mm)
4.1 1.09 1.05 3563.3 0.89 0.76 74.8 0.52 0.55 23
* No statistically significant difference found between implant diameter and mean CBL (p = 0.138).
Table 6. Effect of height of the smooth collar on mean CBL.
Height of the Mean CBL Standard deviation nsmooth collar (mm)* (mm)
Esthetic (1.8 mm) 1.15 1.13 77Standard (2.8 mm) 1.03 1.00 319
*No statistically significant difference found between height of smooth collar and mean CBL (p = 0.435).
Table 7. Effect of jaw location on mean CBL.
Jaw location Mean CBL (mm)* Standard deviation n(mm)
Maxilla 1.08 0.99 155Mandible 1.03 1.06 231
* No statistically significant difference found between jaw location and mean CBL (p = 0.170).
33

Med Buccale Chir Buccale 2010;16:23-43 H. Gheddaf-Dam et al.
Table 8. Effect of opposing dentition on mean CBL.
Opposing dentition Mean CBL Standard deviation n(mm)* (mm)
Natural/Fix 1.00 1.03 296Removable 1.06 0.96 69
Mixed 1.56 1.11 21
* No statistically significant difference found between opposing dentition type and mean CBL (p = 0.931).
Table 9. Effect of suprastructure on mean CBL.
Suprastructure Mean CBL Standard deviation n(mm)* (mm)
Fixed 0.99 1.01 305Removable 1.28 1.03 81
*No statistically significant difference between suprastructure type and mean CBL (p = 0.7).
Table 10. Effect of smoking status on mean CBL.
Smoking status Mean CBL Standard deviation n(mm)* (mm)
Non-smoker 0.97 0.95 309Smoker 1.36 1.27 77
* A statistically significant difference was found between smoking status and mean CBL (p < 0.001). Smokers demonstrated significantlymore mean CBL.
Table 11. Effect of implant length on mean CBL.
Implant length Mean CBL Standard deviation n(mm)* (mm)
6 mm 1.33 0.76 48 mm 0.88 0.92 839 mm 0.86 0.96 610 mm 1.14 1.17 15111 mm 1.09 1.00 4212 mm 1.03 0.91 9413 mm 1.30 0.83 6
* No statistically significant difference was found when evaluating implant length in regard to mean CBL (p = 0.901).
Table 12. Effect of VBL width on mean CBL.
VBL Mean CBL Standard deviation n(mm)* (mm)
>1 mm 0.96 0.91 281<1 mm 1.29 1.28 105
* A statistically significant difference was found when evaluating VBL effect on mean CBL (p < 0.001). Increased mean CBL was observedwhen <1 mm VBL remained.
Table 13. Effect of adjacent tooth/ implant distance on mean CBL.
Distance to adjacent Mean CBL Standard deviation n
tooth/implant (mm)* (mm)
1–2 mm 1.02 0.94 33
2–3 mm 1.11 1.15 151
3–4 mm 1.05 1.25 66
>4 mm 1.04 0.93 136
* No statistically significant difference found when evaluating distance between adjacent tooth implant and mean CBL (p = 0.435).
34

Med Buccale Chir Buccale 2010;16:23-43 H. Gheddaf-Dam et al.
Table 14. Evaluation of implant surface (TPS versus SLA) and arch location (anterior versus posterior) in relation to mean crestal bone loss.
95%Confidence
Surface* Arch Mean bone Standard Lower intervallocation* loss (mm) error bound p-value n
(mm) (mm) Upperbound(mm)
SLAposterior 1.00 0.10 0.79 1.21 NS 133anterior 1.43 0.26 0.92 1.95 NS 59
TPSposterior 1.58 0.13 1.32 1.84 NS 149anterior 1.63 0.20 1.24 2.03 <0.05 47
* A statistically significant mean bone loss occurred for TPS surfaced implants located in the anterior arch (p < 0.05).
Table 15. Combination of implant surface (TPS versus SLA) and smoking status in assessing mean bone loss. Highest bone loss occurred forTPS-surfaced implants placed in smoking subjects.
95% confidenceinterval
Surface* Smoking Mean bone Standardstatus* loss (mm) error lower upper p-value n
(mm) bound bound(mm) (mm)
SLAnon-smoking 0.82 0.09 0.63 1.02 NS 146
smoking 1.40 0.28 1.06 2.15 NS 46
TPSnon-smoking 1.40 0.09 1.22 1.59 NS 163
smoking 1.61 0.21 1.41 2.21 <0.05 31
* A statistically significant mean bone loss occurred in smoker subjects on TPS surfaced implants located in the anterior arch (p < 0.05).
Table 16. Evaluation of arch location (anterior versus posterior) and smoking status in relation to mean bone loss.
95% confidenceinterval
Smoking Arch Mean Standardstatus* location* bone loss error lower upper p-value n
(mm) (mm) bound bound(mm) (mm)
Non-smokingposterior 1.03 0.24 0.54 1.52 NS 229anterior 1.25 0.18 0.90 1.59 NS 80
Smokingposterior 1.19 0.65 -0.10 2.48 NS 51anterior 1.68 0.56 0.57 2.79 <0.05 26
* A statistically significant mean bone loss occurred for implants located in the anterior arch and placed in smoking subjects (p < 0.05).
showed statistically significant results when investigatingtheir influence on peri-implant bone change (p < 0.05) (Ta-bles 14–25). These factors were:
1. Implant surface topography (TPS>SLA),2. Smoking status (smoking > non-smoking),3. Anterior versus posterior location (anterior > posterior),4. Width of the vestibular bone lamella (VBL< 1 mm showed
greater bone loss than VBL >1 mm).
Multiple regression analysis used to evaluate the significanceof the influence on the mean bone loss of the followingfactors: implant surface, smoking status, anterior-posteriorlocation and vestibular bone lamella width.
Multiple regression analysis of mean bone loss in rela-tion to: (a) implant surface, (b) smoking status, (c) anterior-posterior location and (d) vestibular bone width.
Independent variables: surface (SLA, TPS) + smoking sta-tus (non-smoking, smoking) + arch location + vestibular bone.
b0 = constant, b1, b2, b3, b4 = regression coefficients, R =correlation coefficient, R2= percentage of explained variance.
Multiple regression analysisY = −35.762 + b1 surface texture+ b2 tobacco + b3 arch
location + b4 vestibular bone width.Independent variables: surface texture, tobacco, arch lo-
cation, and vestibular bone width on bone loss.
35

Med Buccale Chir Buccale 2010;16:23-43 H. Gheddaf-Dam et al.
Table 17. Evaluation of arch location (anterior versus posterior), smoking status and implant surface (TPS versus SLA) in relation to meanbone loss.
95% confidenceinterval
Arch Smoking Mean Standardlocation* status* bone loss error lower upper p-value n
Surface* (mm) (mm) bound bound(mm) (mm)
SLAposterior
Non-smoking 0.69 0.11 0.48 0.89 NS 102Smoking 1.31 0.19 0.94 1.69 NS 31
anteriorNon-smoking 0.96 0.17 0.63 1.29 NS 44
Smoking 1.17 0.36 1.59 3.02 NS 15
TPSposterior
Non-smoking 1.11 0.09 0.92 1.30 NS 127Smoking 2.04 0.25 1.55 2.53 NS 20
anteriorNon-smoking 1.69 0.16 1.38 2.01 NS 36
Smoking 2.31 0.50 0.19 2.16 <0.05 11
* A statistically significant mean bone loss occurred when a combination TPS-surfaced implants were placed in a smoking patient in theanterior arch (p < 0.05)
Table 18. Evaluation of implant surface (TPS versus SLA) and width of vestibular bone lamella (VBL <1 mm or VBL > 1 mm) in relation tomean bone loss.
95% confidenceinterval
Surface* VBL* Mean bone Standardloss (mm) error (mm) lower upper p-value n
bound bound(mm) (mm)
SLA>1 mm 0.89 0.09 0.69 1.07 NS 142<1 mm 1.64 0.27 1.10 2.17 NS 50
TPS>1 mm 1.37 0.11 1.15 1.59 NS 139<1 mm 1.75 0.21 1.35 2.16 <0.05 55
* A statistically significant association occurred for TPS-surfaced implants with a VBL less than 1 mm (p < 0.05).
Table 19. Combination of implant location (anterior versus posterior arch) and width of vestibular bone lamella (VBL < 1 mm or VBL >1 mm) in relation to mean bone loss.
95% confidenceinterval
Arch Vestibular Mean bone Standardlocation* bone loss (mm) error (mm) lower upper p-value n
lamella* bound bound(mm) (mm)
Posterior>1 mm 0.98 0.09 0.80 1.15 NS 202<1 mm 1.60 0.15 1.31 1.89 NS 75
Anterior>1 mm 1.28 0.12 1.04 1.51 NS 72<1 mm 1.79 0.31 1.19 2.39 <0.05 30
* A statistically significant association occurred for anterior implants with a VBL less than 1 mm (p < 0.05).
Table 20. Combination of width of vestibular bone lamella (VBL > 1 mm or VBL < 1 mm) and smoking status in relation to mean bone loss.
95% confidence intervalSmoking Vestibular Mean bone Standardstatus* bone loss (mm) error (mm) lower upper p-value n
lamella* bound (mm) bound (mm)
Non-smoking> 1 mm 1.08 0.08 0.93 1.24 NS 219<1 mm 1.14 0.11 0.92 1.36 NS 88
Smoking> 1 mm 1.17 0.13 0.92 1.42 NS 55<1 mm 2.25 0.32 1.61 2.88 <0.05 17
* A statistically significant association occurred in smoker patients with a VBL less than 1 mm (P < 0.05).
36
Med Buccale Chir Buccale 2010;16:23-43 H. Gheddaf-Dam et al.
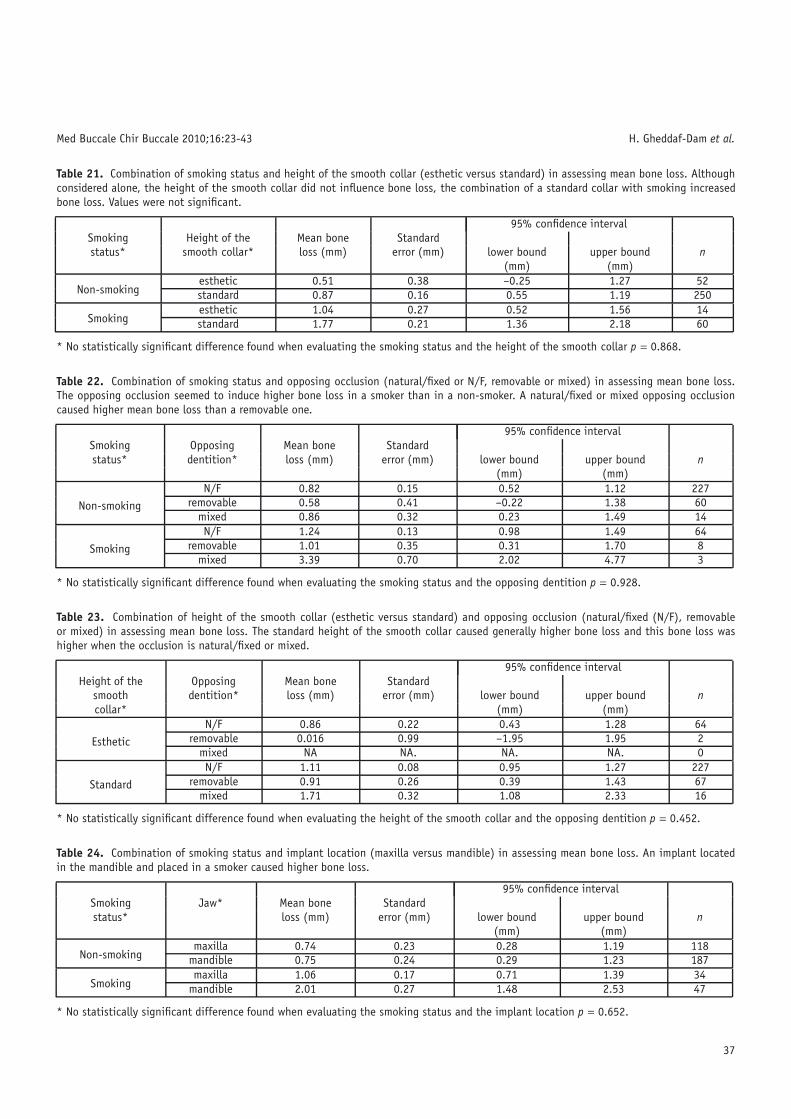
Table 21. Combination of smoking status and height of the smooth collar (esthetic versus standard) in assessing mean bone loss. Althoughconsidered alone, the height of the smooth collar did not influence bone loss, the combination of a standard collar with smoking increasedbone loss. Values were not significant.
95% confidence intervalSmoking Height of the Mean bone Standardstatus* smooth collar* loss (mm) error (mm) lower bound upper bound n
(mm) (mm)
Non-smokingesthetic 0.51 0.38 –0.25 1.27 52standard 0.87 0.16 0.55 1.19 250
Smokingesthetic 1.04 0.27 0.52 1.56 14standard 1.77 0.21 1.36 2.18 60
* No statistically significant difference found when evaluating the smoking status and the height of the smooth collar p = 0.868.
Table 22. Combination of smoking status and opposing occlusion (natural/fixed or N/F, removable or mixed) in assessing mean bone loss.The opposing occlusion seemed to induce higher bone loss in a smoker than in a non-smoker. A natural/fixed or mixed opposing occlusioncaused higher mean bone loss than a removable one.
95% confidence intervalSmoking Opposing Mean bone Standardstatus* dentition* loss (mm) error (mm) lower bound upper bound n
(mm) (mm)
Non-smokingN/F 0.82 0.15 0.52 1.12 227
removable 0.58 0.41 –0.22 1.38 60mixed 0.86 0.32 0.23 1.49 14
Smoking
N/F 1.24 0.13 0.98 1.49 64removable 1.01 0.35 0.31 1.70 8
mixed 3.39 0.70 2.02 4.77 3
* No statistically significant difference found when evaluating the smoking status and the opposing dentition p = 0.928.
Table 23. Combination of height of the smooth collar (esthetic versus standard) and opposing occlusion (natural/fixed (N/F), removableor mixed) in assessing mean bone loss. The standard height of the smooth collar caused generally higher bone loss and this bone loss washigher when the occlusion is natural/fixed or mixed.
95% confidence intervalHeight of the Opposing Mean bone Standard
smooth dentition* loss (mm) error (mm) lower bound upper bound ncollar* (mm) (mm)
Esthetic
N/F 0.86 0.22 0.43 1.28 64removable 0.016 0.99 –1.95 1.95 2
mixed NA NA. NA. NA. 0
StandardN/F 1.11 0.08 0.95 1.27 227
removable 0.91 0.26 0.39 1.43 67mixed 1.71 0.32 1.08 2.33 16
* No statistically significant difference found when evaluating the height of the smooth collar and the opposing dentition p = 0.452.
Table 24. Combination of smoking status and implant location (maxilla versus mandible) in assessing mean bone loss. An implant locatedin the mandible and placed in a smoker caused higher bone loss.
95% confidence intervalSmoking Jaw* Mean bone Standardstatus* loss (mm) error (mm) lower bound upper bound n
(mm) (mm)
Non-smokingmaxilla 0.74 0.23 0.28 1.19 118
mandible 0.75 0.24 0.29 1.23 187
Smokingmaxilla 1.06 0.17 0.71 1.39 34
mandible 2.01 0.27 1.48 2.53 47
* No statistically significant difference found when evaluating the smoking status and the implant location p = 0.652.
37

Med Buccale Chir Buccale 2010;16:23-43 H. Gheddaf-Dam et al.
Table 25. Combination of different implant lengths (mm) and smoking status in assessing mean bone loss. No correlation was observed.
95% confidence intervalSmoking Length* Mean bone Standardstatus* loss (mm) error (mm) lower bound upper bound n
(mm) (mm)
Non-smoking
6 mm 1.22 0.67 –1.05 2.54 48 mm 1.01 0.23 0.57 1.45 619 mm 0.48 0.55 –0.60 1.56 610 mm 1.37 0.16 1.05 1.69 8111 mm 1.39 0.33 0.73 2.05 2512 mm 1.08 0.27 0.56 1.61 6913 mm 0.98 0.52 –0.05 2.00 6
* No statistically significant difference found when evaluating the smoking status and the implant length p = 0.945.
95% confidence intervalSmoking Length* Mean bone Standardstatus* loss (mm) error (mm) lower bound upper bound n
(mm) (mm)
Smoking
6 mm 1.46 0.67 0.14 2.78 58 mm 1.63 0.39 0.87 2.39 119 mm 1.16 0.67 –0.17 2.48 810 mm 1.85 0.24 1.39 2.31 3011 mm 0.98 0.41 0.17 1.79 612 mm 1.07 0.28 0.50 1.63 1413 mm 0.99 0.53 –0.03 2.32 60
Table 26. Percentage distribution of TPS/SLA-surfaced implants in relation to crestal bone loss and “supra-boundary bone” groups. ThePearson Square test p-value indicates the significance of the correlation of this factor to CBL or “supra-boundary bone” (p < 0.05).
Mean CBL (mm) and Surface“supra-boundary bone”
SLA (%) n TPS (%) n>3 2.0 4 11.9 232–3 6.2 12 9.3 181–2 27.2 52 27.8 540–1 56.7 109 41.7 81
“supra-boundary bone” 7.8 15 9.3 18TOTAL 100 192 100 194
b0 = constant, b1, b2, b3 = regression coefficients, R =correlation coefficient, R2 = percentage of explained variance.
Pearson Chi square test confirmed the significance (p <0.05) of each investigated factor (mentioned above). All theother factors were not found to be statistically significant.
Effect of combined factors on mean CBL
Implants with different lengths and widths, differentheights of the smooth collar, different jaw locations, havinga removable or fixed suprastructure, having fixed, remov-able or mixed opposing dentitions, and at different distancesfrom the adjacent teeth/implants did not show a significantinfluence on mean bone levels, even when combined withother factors in the current study.
An ANOVA univariate analysis test was used to evaluatethe effect of a combination of different factors on meanCBL. Interesting correlations were noted when combining
factors that had already individually shown to have a sta-tistically significant impact on mean CBL For example, thecombination of a smoking subject and TPS-surfaced implantresulted in a higher bone loss than each parameter indepen-dently (Tables 14–20).
Moreover, the combination of not statistically significantfactors with statistically significant ones was performed. Someinteresting correlations were noted, but results were not sig-nificant (Tables 21–30)
The influence of the statistically significant parameters on 5subgroups of bone change
Parameters with significant influence on peri-implantbone change according to ANOVA were then distributed into 5subgroups (Fig. 11 and Tables 26–31). These groups were alsodivided according to implant length, although this was not astatistically significant factor.
38
Med Buccale Chir Buccale 2010;16:23-43 H. Gheddaf-Dam et al.
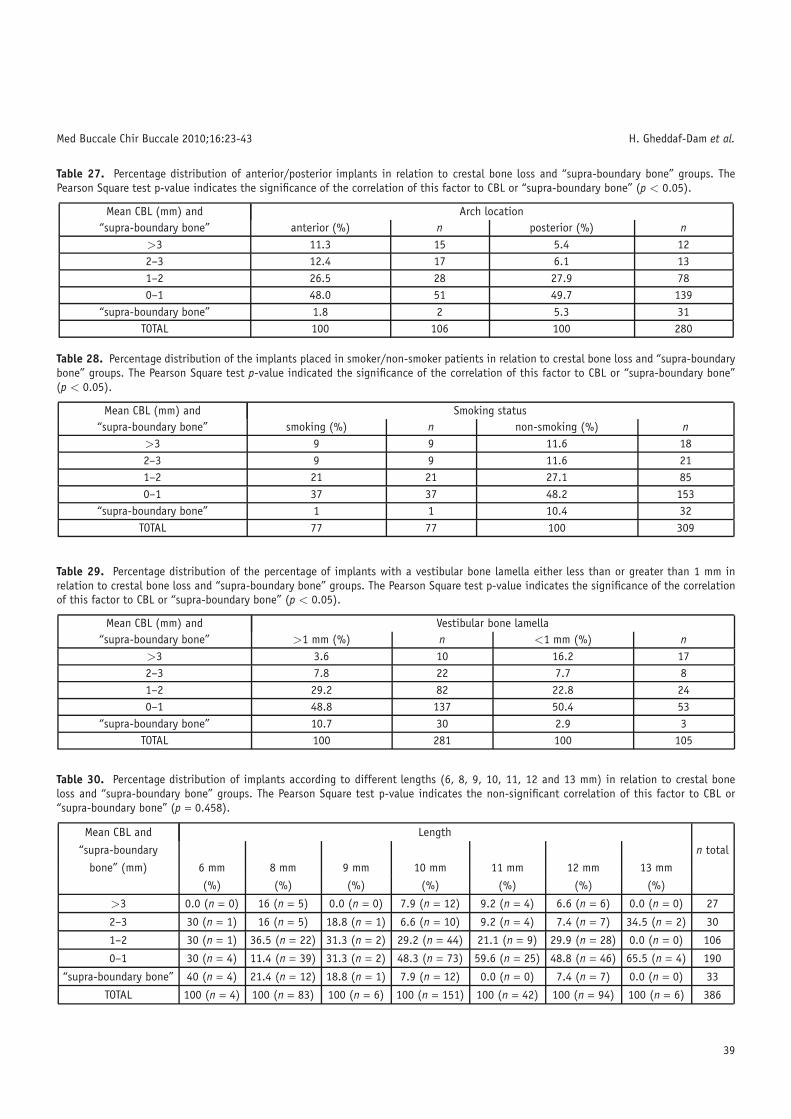
Table 27. Percentage distribution of anterior/posterior implants in relation to crestal bone loss and “supra-boundary bone” groups. ThePearson Square test p-value indicates the significance of the correlation of this factor to CBL or “supra-boundary bone” (p < 0.05).
Mean CBL (mm) and Arch location“supra-boundary bone” anterior (%) n posterior (%) n
>3 11.3 15 5.4 122–3 12.4 17 6.1 131–2 26.5 28 27.9 780–1 48.0 51 49.7 139
“supra-boundary bone” 1.8 2 5.3 31TOTAL 100 106 100 280
Table 28. Percentage distribution of the implants placed in smoker/non-smoker patients in relation to crestal bone loss and “supra-boundarybone” groups. The Pearson Square test p-value indicated the significance of the correlation of this factor to CBL or “supra-boundary bone”(p < 0.05).
Mean CBL (mm) and Smoking status“supra-boundary bone” smoking (%) n non-smoking (%) n
>3 9 9 11.6 182–3 9 9 11.6 211–2 21 21 27.1 850–1 37 37 48.2 153
“supra-boundary bone” 1 1 10.4 32TOTAL 77 77 100 309
Table 29. Percentage distribution of the percentage of implants with a vestibular bone lamella either less than or greater than 1 mm inrelation to crestal bone loss and “supra-boundary bone” groups. The Pearson Square test p-value indicates the significance of the correlationof this factor to CBL or “supra-boundary bone” (p < 0.05).
Mean CBL (mm) and Vestibular bone lamella“supra-boundary bone” >1 mm (%) n <1 mm (%) n
>3 3.6 10 16.2 172–3 7.8 22 7.7 81–2 29.2 82 22.8 240–1 48.8 137 50.4 53
“supra-boundary bone” 10.7 30 2.9 3TOTAL 100 281 100 105
Table 30. Percentage distribution of implants according to different lengths (6, 8, 9, 10, 11, 12 and 13 mm) in relation to crestal boneloss and “supra-boundary bone” groups. The Pearson Square test p-value indicates the non-significant correlation of this factor to CBL or“supra-boundary bone” (p = 0.458).
Mean CBL and Length
“supra-boundary n total
bone” (mm) 6 mm 8 mm 9 mm 10 mm 11 mm 12 mm 13 mm
(%) (%) (%) (%) (%) (%) (%)
>3 0.0 (n = 0) 16 (n = 5) 0.0 (n = 0) 7.9 (n = 12) 9.2 (n = 4) 6.6 (n = 6) 0.0 (n = 0) 27
2–3 30 (n = 1) 16 (n = 5) 18.8 (n = 1) 6.6 (n = 10) 9.2 (n = 4) 7.4 (n = 7) 34.5 (n = 2) 30
1–2 30 (n = 1) 36.5 (n = 22) 31.3 (n = 2) 29.2 (n = 44) 21.1 (n = 9) 29.9 (n = 28) 0.0 (n = 0) 106
0–1 30 (n = 4) 11.4 (n = 39) 31.3 (n = 2) 48.3 (n = 73) 59.6 (n = 25) 48.8 (n = 46) 65.5 (n = 4) 190
“supra-boundary bone” 40 (n = 4) 21.4 (n = 12) 18.8 (n = 1) 7.9 (n = 12) 0.0 (n = 0) 7.4 (n = 7) 0.0 (n = 0) 33
TOTAL 100 (n = 4) 100 (n = 83) 100 (n = 6) 100 (n = 151) 100 (n = 42) 100 (n = 94) 100 (n = 6) 386
39
Med Buccale Chir Buccale 2010;16:23-43 H. Gheddaf-Dam et al.
Table 31. Percentage distribution of implant-implant or implant-tooth distances in relation to bone loss and ‘supra-boundary bone‘ groups.The Pearson Square test p-value indicates a non-significant association between this factor and CBL or ‘supra-boundary bone‘ (p = 0.951).
Mean CBL and 1–2 mm 2–3mm 3–4mm >4 mm Total“supra-boundary bone” (mm) (%) (%) (%) (%)
> 3 5.8 (n = 7) 8.6 (n = 10) 9.1 (n = 4) 6.2 (n = 5) 272–3 8.9 (n = 3) 8.6 (n = 25) 14.5 (n = 9) 3.9 (n = 18) 301–2 30.5 (n = 8) 23.7 (n = 36) 14.5 (n = 6) 32.6 (n = 41) 1060–1 46.3 (n = 9) 49.4 (n = 56) 47.3 (n = 37) 47.3 (n = 47) 183
“supra-boundary bone” 8.2 (n = 6) 9.8 (n = 24) 14.5 (n = 10) 10.1 (n = 25) 33TOTAL 100 (n = 33) 100 (n = 151) 100 (n = 66) 100 (n = 136) 379
Fig. 11. Five subgroups of bone change.
References
1. Lang NP, Wilson TG, Corbet EF. Biological complications withdental implants: their prevention, diagnosis and treatment. ClinOral Implants Res 2000;11 Suppl 1:146-55.
2. Brånemark PI, Zarb GA, Albrektsson T. Tissue-integrated prosthe-ses (pp 129-43). Quintessence, Chicago, 1985.
3. Adell R, Lekholm U, Rockler B, Brånemark PI. A 15-year studyof osseointegrated implants in the treatment of the edentulousjaw. Int J Oral Surg 1981;10:387-416.
4. Adell R, Lekholm U, Rockler B, Brånemark PI, Lindhe J, ErikssonB, Sbordone L. Marginal tissue reactions at osseointegrated ti-tanium fixtures (I). A 3-year longitudinal prospective study. IntJ Oral Maxillofacial Surg 1986;15:39-52.
5. Alberktsson T, Zarb G, Worthington P, Eriksson AR. The long-termefficacy of currently used dental implants: a review and proposedcriteria of success. Int J Oral Maxillofac Implants 1986;1:11-25.
6. De Smet E, Jacobs R, Gijbels F, Naert I. The accuracy andreliability of radiographic methods for the assessment ofmarginal bone level around oral implants. DentomaxillofacRadiol 2002;31:176-81.
7. Buser D, Weber HP, Lang NP. Tissue integration of non-submerged implants. 1-year results of a prospective study with100 ITI hollow-cylinder and hollow-screw implants. Clin OralImplants Res 1990;1:33-40.
8. Hermann JS, Buser D, Schenk RK, Cochran DL. Crestal bonechanges around titanium implants. A histometric evaluation ofunloaded non-submerged and submerged implants in the caninemandible. J Periodentol 2000;71:1412-24.
9. Hermann JS, Schoolfield JD, Nummikoski PV, Buser D, SchenkRK, Cochran DL. Crestal bone changes around titanium im-plants: a methodological study comparing linear radiographicwith histometric measurements. Int J Oral Maxillofac Implants2001;16:475-85.
10. Hermann JS, Schoolfield JD, Schenk RK, Buser D, Cochran DL.Influence of the size of the microgap on crestal bone changesaround titanium implants. A histometric evaluation of unloadednon-submerged implants in the canine mandible. J Periodontol2001;72:1372-83.
11. Hermann JS, Cochran DL, Nummikoski PV, Buser D. Crestal bonechanges around titanium implants. A radiographic evaluation ofunloaded nonsubmerged and submerged implants in the caninemandible. J Periodontol 1997;68:1117-30.
12. Berglundh T, Persson L, Klinge B. A systematic review of theincidence of biological and technical complications in implantdentistry reported in prospective longitudinal studies of at least5 years. J Clin Periodontal 2002;29 Suppl 3:197-212. 232-3.
13. Brägger U, Hugel-Pisoni C, Burgin W, Buser D, Correlations be-tween radiographic, clinical and mobility parameters after load-ing of oral implants with fixed partial dentures. A 2-year longi-tudinal study. Clin Oral Implant Res 1996;7:230-9.
14. Zechner W, Trinkl N, Watzak G, Busenlechner D, Tepper G, Haas R,Watzek G. Radiologic follow-up of peri-implant bone loss aroundmachine-surfaced and rough-surfaced interforaminal implants inthe mandible functionally loaded for 3 to 7 years. Int J OralMaxillofac Implants 2004;19:216-21.
15. Zybutz M, Rapoport D, Laurell L, Persson GR. Comparisons ofclinical and radiographic measurements of inter-proximal verti-cal defects before and 1 year after surgical treatments. J ClinPeriodontol 2000;27:179-86.
16. Weber HP, Crohin CC, Fiorellini JP. A 5-year prospective clinicaland radiographic study of non-submerged dental implants. ClinOral Implants Res 2000;11:144-53.
17. Wyatt CC, Zarb GA. Bone level changes proximal to oral im-plants supporting fixed partial prostheses. Clin Oral Implants Res2002;13:162-8.
18. Fransson C, Lekholm U, Jemt T, Berglundh T. Prevalence of sub-jects with progressive bone loss at implants. Clin Oral ImplantsRes 2005;16:440-6.
19. Wenntröm J, Palmer R. Consensus report of session 3: clinicaltrails (pp 255-9). Proceedings of the 3rd European workshop onPeriodontolgy. Implant Dentistry. Lang N, Karring T, Lindhe Jeds. Quintessence, Berlin, 1999.
40

Med Buccale Chir Buccale 2010;16:23-43 H. Gheddaf-Dam et al.
20. Jemt T, Lekholm U. Oral implant treatment in posterior partiallyedentulous jaws: a 5-year follow-up report. Int J Oral MaxillofacImplants 1993;8:635-40.
21. Buser D, Mericske-Stern R, Bernard JP, Behneke A, BehnekeN, Hirt HP, Belser UC, Lang NP. Long-term evaluation of non-submerged. ITI implants. Part 1: 8-year life table analysis ofa prospective multi-center study with 2359 implants. Clin OralImplants Res 1997;8:161-172.
22. Snauwaert K, Duyck J, van Steenberghe D, Quirynen M, NaertI. Time dependent failure rate and marginal bone loss of im-plant supported prostheses: a 15-year follow-up study. Clin OralInvestig 2000;4:13-20.
23. Mombelli A, Lang NP. The diagnosis and treatment of peri-implantitis. Periodontol 2000 1998;17:63-76.
24. Lindquist LW, Carlsson GE, Jemt T. A prospective 15-year follow-up study of mandibular fixed prostheses supported by osseoin-tegrated implants. Clinical results and marginal bone loss. ClinOral Implants Res 1996;7:329-36.
25. Grondahl K, Sunden S, Grondahl HG. Inter- and intraobservervariability in radiographic bone level assessment at Brånemarkfixtures. Clin Oral Implants Res 1998;4:243-50.
26. Lee JH, Frias V, Lee KW, Wright RF. Effect of implant size andshape on implant success rates: a literature review. ProsthetDent 2005;94:377-81.
27. Hämmerle CH, Brägger U, Burgin W, Lang NP. The effect ofsubcrestal placement of the polished surface of ITI implantson marginal soft and hard tissues. Clin Oral Implants Res1996;7:111-9.
28. Hartmann GA, Cochran DL. Initial implant position deter-mines the magnitude of crestal bone remodeling. J Periodontol2004;75:572-7.
29. Bernard JP, Belser UC, Martinet JP, Borgis SA. Osseointegrationof Brånemark fixtures using a single-step operating technique.A preliminary prospective one-year study in the edentulousmandible. Clin Oral Implants Res 1995;6:122-9.
30. Pepelassi EA, Diamanti-Kipioti A. Selection of the most accuratemethod of conventional radiography for the assessment of peri-odontal osseous destruction. J Clin Periodontol 2000;27:179-86.
31. Romeo E, Lops D, Amorfini L, Chiapasco M, Ghisolfi M, Vogel G.Clinical and radiographic evaluation of small-diameter (3.3-mm)implants followed for 1-7 years: a longitudinal study. Clin OralImplants Res 2006;17:139-48.
32. Rosling B, Hollender L, Nyman S, Olsson G. A radiographicmethod for assessing changes in alveolar bone height follow-ing periodontal therapy. J Clin Periodontol 1975;2:211-7.
33. Zechner W, Watzak G, Gahleitner A, Busenlechner D, Tepper G,Watzek G. Rotational panoramic versus intraoral rectangular ra-diographs for evaluation of peri-implant bone loss in the anterioratrophic mandible. Int J Oral Maxillofac Implants 2003;18:873-8.
34. Sewerin IP. Errors in radiographic assessment of marginal boneheight around osseointegrated implants. Scand J Dent Res1990;98:428-33.
35. Benn DK. Limitations of the digital image subtraction tech-nique in assessing alveolar bone crest changes due to mis-alignment errors during image capture. Dentomaxillofac Radiol1990;19:97-104.
36. Wahl G, Lang H. Deformation at the implant interface to pros-thetic superstructure: an interferometric approach. Clin OralImplants Res 2004;15:233-8.
37. Spiekermann H, Jansen VK, Richter EJ. A 10-year follow-upstudy of IMZ and TPS implants in the edentulous mandible us-ing bar-retained overdentures. Int J Oral Maxillofac Implants1995;10:231-43.
38. Quirynen M, van Steenberghe D, Jacobs R, Schotte A, DariusP. The reliability of pocket probing around screw-type implants.Clin Oral Implants Res 1991;2:186-92.
39. Isidor F. Clinical probing and radiographic assessment in relationto the histologic bone level at oral implants in monkeys. ClinOral Implants Res 1997;8:255-64.
40. Ericsson I, Lindhe J. Probing depth at implants and teeth. Anexperimental study in the dog. J Clin Periodontol 1993;20:623-7.
41. Akesson L, Hakansson J, Rohlin M. Comparison of panoramic andintraoral radiography and pocket probing for the measurement ofthe marginal bone level. J Clin Periodontol 1992;19:326-32.
42. Lofthag-Hansen S, Lindh C, Petersson A. Radiographic assess-ment of the marginal bone level after implant treatment: a com-parison of periapical and Scanora detailed narrow beam radiog-raphy. Dentomaxillofac Radiol 2003;32:97-103.
43. Battenberg RH, Meijer HJ, Raghoebar GM, Van Port RP, BoeringG. Mandibular overdentures supported by two Brånemark, IMZor ITI implants. A prospective comparative preliminary study:one-year results. Clin Oral Implants Res 1998;9:374-383.
44. Fiorellini JP, Buser D, Paquette DW, Williams RC, Haghighi D,Weber HP. A radiographic evaluation of bone healing aroundsubmerged and non-submerged dental implants in beagle dogs.J Periodontol 1999;70:248-54.
45. Heydenrijk K, Raghoebar GM, Meijer HJ, Stegenga B. Clinicaland radiologic evaluation of 2-stage IMZ implants placed in asingle-stage procedure: 2-year results of a prospective compara-tive study. Int J Oral Maxillofac Implants 2003;18:424-32.
46. Karoussis K, Muller S, Salvi G, Heitz-Mayfield L, Brägger U,Lang N. Association between periodontal and peri-implant con-ditions ; a 10 year prospective study. Clin Oral Impl Res2004;15:1-7.
47. Meijer HJ, Heijdenrijk K, Raghoebar GM. Mucosal and radio-graphic aspects during the healing period of implants placedin a one-stage procedure. Int J Prosthodont 2003;16:397-402.
48. Mericske-Stern R, Oetterli M, Kiener P, Mericske E. A follow-upstudy of maxillary implants supporting overdentures. clinical andradiographic results. Int J Oral Maxillofac Implants 2002;17:678-86.
49. Penarrocha M, Palomar M, Sanchis JM, Guarinos J, BalaguerJ. Radiologic study of marginal bone loss around 108 dentalimplants and its relationship to smoking, implant location, andmorphology. Int J Oral Maxillofac Implants 2004;19:861-78.
50. Romeo E, Ghisolfi M, Rozza R, Chiapasco M, Lops D. Short (8mm)dental implants in the rehabilitation of partial and completeedentulism: a 3 to 14 year longitudinal study. Int J Prosthodont2006;19:586-92.
51. Blanes RJ, Bernard JP, Blanes ZM, Belser UC. A 10-year prospec-tive study of ITI dental implants placed in the posterior re-gion: I Clinical and radiographic results. Clin Oral Implants Res2007;18:699-706.
52. Von Wowern N. In vivo measurement of bone mineral contentof mandibles by dual photon absoptiometry. Scand J Dent Res1985;93:162-8.
53. Brägger U, Pasquali L, Kornman KS. Remodeling of interden-tal alveolar bone after periodontal flap procedures assessed
41

Med Buccale Chir Buccale 2010;16:23-43 H. Gheddaf-Dam et al.
by means of computer-assisted densitometric image analysis(CADIA). J Clin Periodontol 1988;15:558-4.
54. Cochran DL, Hermann JS, Schenk RK, Higginbottom FL, Buser D.Biologic width around titanium implants. A histometric analysisof the implanto-gingival junction around unloaded and loadednonsubmerged implants in the canine mandible. J Periodontol1997;68:186-98.
55. Smith DE, Zarb GA. Criteria for success of osseointegrated en-dosseous implants. J Prosthet Dent 1989;62:567-72.
56. Abrahamsson I, Zitzmann NU, Berglundh T, Wennerberg A,Lindhe J. Bone and soft tissue integration to titanium implantswith different surface topography: an experimental study in thedog. Int J Oral Maxillofac Implants 2001;16:323-33.
57. Meriscke-Stern R, Venetz E, Fahrlander F, Burgin W. In vivoforce measurements on maxillary implants supporting a fixedprosthesis or an overdenture: a pilot study. J Prosthet Dent2000;84:535-47.
58. Keller W, Brägger U, Mombelli A. Peri-implant microflora of im-plants with cemented and screw retained suprastructures. ClinOral Implants Res 1998;9:209-17.
59. Lindquist LW, Carlsson GE, Jemt T. Association betweenmarginal bone loss around osseointegrated mandibular implantsand smoking habits: a 10-year follow-up study. J Dent Res1997;76:1667-74.
60. Lum LB. A biomechanical rationale for the use of short implants.J Oral Implantol 1991;17:126-31.
61. Mailath G, Stoiber B, Watzek G, Matejka M. Bone resorption atthe entry of osseointegrated implants - a biomechanical phe-nomenon. Finite element study. Z Stomatol 1989;86:207-16.
62. Meriscke-Stern R. Force distribution on implants supportingoverdentures: the effect of distal bar extensions. A 3-D in vivostudy. Clin Oral Implants Res 1997;8:142-51.
63. Miyata T, Kobayashi Y, Araki H, Ohto T, Shin K. The influenceof controlled occlusal overload on peri-implant tissue. Part 4:a histologic study in monkeys. Int J Oral Maxillofac Implants2002;17:384-90.
64. Nedir R, Bischof M, Briaux JM, Beyer S, Szmukler-Moncler S,Bernard JP. A 7-year life table analysis from a prospective studyon ITI implants with special emphasis on the use of short im-plants. Results from a private practice. Clin Oral Implants Res2004;15:150-7.
65. Esposito M, Hirsch JM, Lekholm U, Thomsen P. Biologicalfactors contributing to failures of osseointegrated oral im-plants. (I) Success criteria and epidemiology. Eur J Oral Sci1998;106:527-51.
66. Nedir R, Bischof M, Szmukler-Moncler S, Belser UC, SamsonJ. Prosthetic complications with dental implants: from an up-to-8-year experience in private practice. Int J Oral MaxillofacImplants 2006;21:919-28.
67. Scharf DR, Tarnow DP. Success rates of osseointegration for im-plants placed under sterile versus clean conditions. J Periodontol1993;64:954-6.
68. Buser D, von Arx T. Surgical procedures in partially edentulouspatients with ITI implants. Clin Oral Implants Res 2000;11 Suppl1:83-100.
69. Hämmerle CH, Ingold HP, Lang NP. Evaluation of clinical andradiographic scoring methods before and after initial periodontaltherapy. J Clin Periodontol 1990;17:255-63.
70. Arlin ML. Survival and success of sandblasted, large-grit, acid-etched and titanium plasma-sprayed implants: a retrospectivestudy. J Can Dent Assoc 2007;73:821.
71. Cochran DL, Buser D, ten Bruggenkate CM, Weingart D, TaylorTM, Bernard JP, Peters F, Simpson JP. The use of reduced healingtimes on ITI implants with a sandblasted and acid-etched (SLA)surface: early results from clinical trials on ITI SLA implants.ClinOral Implants Res 2002;13:144-53.
72. Cochran DL, Schenk RK, Lussi A, Higginbottom FL, Buser D.Boneresponse to unloaded and loaded titanium implants with a sand-blasted and acid-etched surface: a histometric study in the ca-nine mandible. J Biomed Mater Res 1998;40:1-11.
73. Bornstein MM, Schmid B, Belser UC, Lussi A, Buser D. Early load-ing of non-submerged titanium implants with a sandblasted andacid-etched surface. 5-year results of a prospective study in par-tially edentulous patients. Clin Oral Implants Res 2005;16:631-8.
74. Roccuzzo M, Wilson TG. A prospective study evaluating a proto-col for 6 weeks’ loading of SLA implants in the posterior maxilla.Clin Oral Implants Res 2002:13:502–7.
75. DeLuca S, Zarb G. The effect of smoking on osseointegrated den-tal implants. Part II: Peri-implant bone loss. Int J Prosthodont2006;19:560-6.
76. Gruica B, Wang HY, Lang NP, Buser D. Impact of IL-1 geno-type and smoking status on the prognosis of osseointegratedimplants. Clin Oral Implants Res 2004;15:393-400.
77. Carlsson GE, Lindquist LW, Jemt T. Long-term marginal peri-implant bone loss in edentulous patients. Int J Prosthodont2000;13:295-302.
78. Ozkan Y, Ozcan M, Akoglu B, Ucankale M, Kulak-Ozkan Y. Three-year treatment outcomes with three brands of implants placedin the posterior maxilla and mandible of partially edentulouspatients. J Prosthet Dent 2007;97:78-84.
79. Quirynen M, Naert I, van Steenberghe D, Nys L. A study of 589consecutive implants supporting complete fixed prostheses. PartI: Periodontal aspects. J Prosthet Dent 1992;68:655-63.
80. Carmagnola D, Araujo M, Berglundh T, Albrektsson T, Lindhe J.Bone tissue reaction around implants placed in a compromisedjaw. J Clin Periodontol 1999;26:629-35.
81. Brägger U, Hafeli U, Huber B, Hammerle CH, Lang NP. Evaluationof postsurgical crestal bone levels adjacent to non-submergeddental implants. Clin Oral Implants Res 1998;9:218-24.
82. Renouard F, Arnoux JP, Sarment DP. Five-mm-diameter implantswithout a smooth surface collar: report on 98 consecutive place-ments. Int J Oral Maxillofac Implants 1999;14:101-7.
83. Ivanoff CJ, Grondahl K, Sennerby L, Bergstrom C, LekholmU. Influence of variations in implant diameters: a 3- to 5-year retrospective clinical report. Int J Oral Maxillofac Implants1999;14:173-80.
84. Block MS, Delgado A, Fontenot MG. The effect of diameterand length of hydroxylapatite-coated dental implants on ulti-mate pullout force in dog alveolar bone. J Oral Maxillofac Surg1990;48:174-8.
85. Bischof M, Nedir R, Abi Najm S, Szmukler-Moncler S, Samson J.A five-year life-table analysis on wide neck ITI implants withprosthetic evaluation and radiographic analysis: results from aprivate practice. Clin Oral Implants Res 2006;17:512-20.
86. Tallgren A. The continuing reduction of the residual alveolarridges in complete denture wearers: a mixed-longitudinal studycovering 25 years. J Prosthet Dent 1972;27:120-32.
87. Penarrocha M, Guarinos J, Sanchis JM, Balaguer J. A retro-spective study (1994-1999) of 441 ITI(r) implants in 114 pa-tients followed-up during an average of 2.3 years. Med Oral2002;7:144-55.
42
Med Buccale Chir Buccale 2010;16:23-43 H. Gheddaf-Dam et al.
88. Hanggi MP, Hanggi DC, Schoolfield JD, Meyer J, Cochran DL,Hermann JS. Crestal bone changes around titanium implants.Part I: A retrospective radiographic evaluation in humans com-paring two non-submerged implant designs with different ma-chined collar lengths. J Periodontol 2005;76:791-802.
89. Romeo E, Lops D, Margutti E, Ghisolfi M, Chiapasco M, VogelG. Long-term survival and success of oral implants in the treat-ment of full and partial arches: a 7-year prospective study withthe ITI dental implant system. Int J Oral Maxillofac Implants2004;19:247-59.
90. Kiener P, Oetterli M, Mericske E, Mericske-Stern R. Effectivenessof maxillary overdentures supported by implants: main-tenance and prosthetic complications. Int J Prosthodont2001;14:133-40.
91. Oetterli M, Kiener P, Mericske-Stern R. A longitudinal study onmandibular implants supporting an overdenture: the influenceof retention mechanism and anatomic-prosthetic variables onperi-implant parameters. Int J Prosthodont 2001;14:536-42.
92. Tarnow DP, Cho SC, Wallace SS. The effect of inter-implant dis-tance on the height of inter-implant bone crest. J Periodontol2000;71:546-9.
93. Ivanoff CJ, Grondahl K, Bergstrom C, Lekholm U, Brånemark PI.Influence of bicortical or monocortical anchorage on maxillaryimplant stability: a 15-year retrospective study of Brånemarksystem implants. Int J Oral Maxillofac Implants 2000;15:103-10.
94. Bernard JP, Szmukler-Moncler S, Pessotto S, Vazquez L, BelserUC. The anchorage of Brånemark and ITI implants of differentlengths. I. An experimental study in the canine mandible. ClinOral Implants Res 2003;14:593-600.
95. Deporter D, Todescan R, Caudry S. Simplifying management ofthe posterior maxilla using short, porous-surfaced dental im-plants and simultaneous indirect sinus elevation. Int J PeriodontRestorat Dent 2000;20:476-85.
96. Renouard F, Nisand D. Short implants in the severely resorbedmaxilla: a 2-year retrospective clinical study. Clin Implant DentRelat Res 2005;7 Suppl 1:104-10.
97. Rokni S, Todescan R, Watson P, Pharoah M, Adegbembo AO,Deporter D. An assessment of crown-to-root ratios with shortsintered porous-surfaced implants supporting prostheses inpartially edentulous patients. Int J Oral Maxillofac Implants2005;20:69-76.
43
Related Documents