WVRGCAL and Radiometric Phase Correction at ALMA B. Nikolic & R. Bolton Cavendish Laboratory/Kavli Institute University of Cambridge 1 April 2011 (University of Cambridge) WVRGCAL/WVR phase correction April 2011 1 / 52

Welcome message from author
This document is posted to help you gain knowledge. Please leave a comment to let me know what you think about it! Share it to your friends and learn new things together.
Transcript

WVRGCAL and Radiometric Phase Correction atALMA
B. Nikolic & R. Bolton
Cavendish Laboratory/Kavli InstituteUniversity of Cambridge
1 April 2011
(University of Cambridge) WVRGCAL/WVR phase correction April 2011 1 / 52
Introduction
Outline
1 Introduction
2 WVRs and ALMA Phase Calibration
3 wvrgcalGeneralitiesInside workings
4 Some Example ResultsGood examplesPoor examplesEffect on the beam“Dry” fluctuationsSummary
5 Future work
(University of Cambridge) WVRGCAL/WVR phase correction April 2011 2 / 52
Introduction
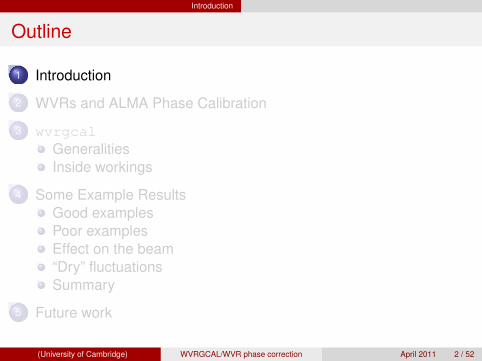
Tropospheric phase fluctuations
Refractive index of air n 6= 1:
n − 1 ≈10−6[
αPd
T+ β
Pw
T+ γ
Pw
T 2
]
Pd : Partial pressure of dry airPw : Partial pressure of water vapourT : Temperature of airThe refractive index is also a function of frequency (i.e., theatmosphere is dispersive), especially at sub-mm frequencies andclose to the edges of strong absorption features
(University of Cambridge) WVRGCAL/WVR phase correction April 2011 3 / 52
Introduction
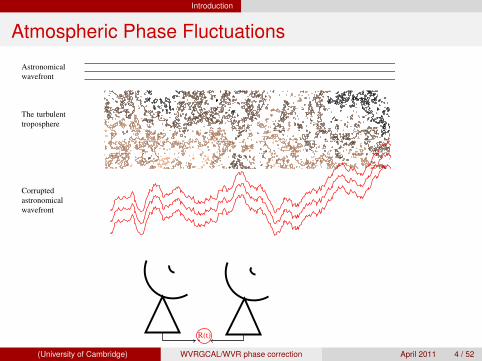
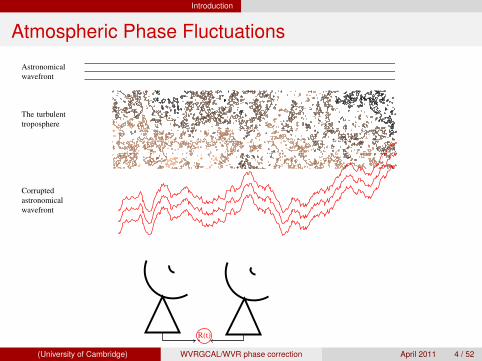
Atmospheric Phase Fluctuations
R(t)
The turbulenttroposphere
Astronomicalwavefront
Corruptedastronomicalwavefront
(University of Cambridge) WVRGCAL/WVR phase correction April 2011 4 / 52
Introduction
Atmospheric Phase Fluctuations
R(t)
The turbulenttroposphere
Astronomicalwavefront
Corruptedastronomicalwavefront
(University of Cambridge) WVRGCAL/WVR phase correction April 2011 4 / 52

Introduction
Atmospheric Phase Fluctuations
R(t)
The turbulenttroposphere
Astronomicalwavefront
Corruptedastronomicalwavefront
(University of Cambridge) WVRGCAL/WVR phase correction April 2011 4 / 52
Introduction
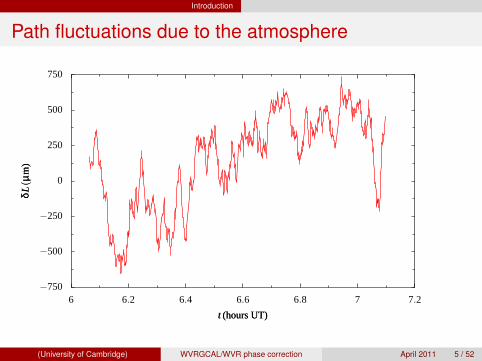
Path fluctuations due to the atmosphere
−750
−500
−250
0
250
500
750
δL(µ
m)
δL(µ
m)
6 6.2 6.4 6.6 6.8 7 7.2
t (hours UT)t (hours UT)
0.009
0.0092
0.0094
0.0096
0.0098
|A|
|A|
(University of Cambridge) WVRGCAL/WVR phase correction April 2011 5 / 52

Introduction
Phase closure (→ antenna based errors)Antenna 0 Vs 1 Antenna 0 Vs 2
−2000
−1500
−1000
−500
0
500
δL(µ
m)
δL(µ
m)
7.1 7.15 7.2 7.25 7.3 7.35 7.4 7.45
t (hours UT)t (hours UT)
0
250
500
750
1000
1250
δL(µ
m)
δL(µ
m)
7.1 7.15 7.2 7.25 7.3 7.35 7.4 7.45
t (hours UT)t (hours UT)
Antenna 1 Vs 2 Closure phase
−3500
−3000
−2500
−2000
−1500
−1000
δL(µ
m)
δL(µ
m)
7.1 7.15 7.2 7.25 7.3 7.35 7.4 7.45
t (hours UT)t (hours UT)
−1000
−500
0
500
1000
δL(µ
m)
δL(µ
m)
7.1 7.15 7.2 7.25 7.3 7.35 7.4 7.45
t (hours UT)t (hours UT)
(University of Cambridge) WVRGCAL/WVR phase correction April 2011 6 / 52
Introduction
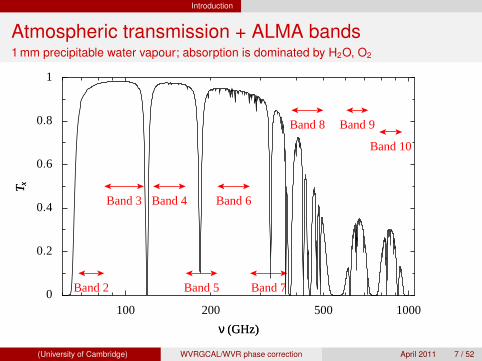
Atmospheric transmission + ALMA bands1 mm precipitable water vapour; absorption is dominated by H2O, O2
Band 2
Band 3 Band 4
Band 5
Band 6
Band 7
Band 8 Band 9
Band 10
0
0.2
0.4
0.6
0.8
1
T xT x
100 200 500 1000
ν (GHz)ν (GHz)
(University of Cambridge) WVRGCAL/WVR phase correction April 2011 7 / 52
Introduction
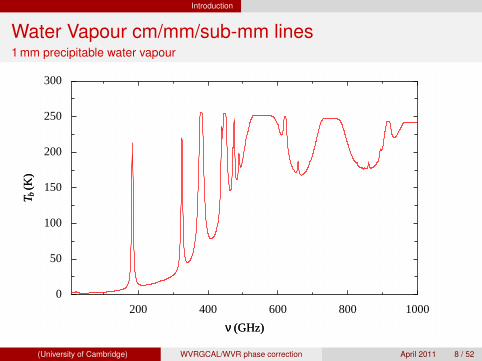
Water Vapour cm/mm/sub-mm lines1 mm precipitable water vapour
0
50
100
150
200
250
300
Tb
(K)
Tb
(K)
200 400 600 800 1000
ν (GHz)ν (GHz)
(University of Cambridge) WVRGCAL/WVR phase correction April 2011 8 / 52

Introduction
Water Vapour cm/mm/sub-mm lines1 mm precipitable water vapour
0
50
100
150
200
250
300
Tb
(K)
Tb
(K)
200 400 600 800 1000
ν (GHz)ν (GHz)
22 GHz Water Line –previous WVR systems
183 GHz Water Line –ALMA WVR system
(University of Cambridge) WVRGCAL/WVR phase correction April 2011 8 / 52

Introduction
The 183 GHz Water Vapour LineBlue rectangles are nominal WVR filters
0
50
100
150
200
250
T b(K
)T b
(K)
175 177.5 180 182.5 185 187.5 190
ν (GHz)ν (GHz)
(University of Cambridge) WVRGCAL/WVR phase correction April 2011 9 / 52
Introduction
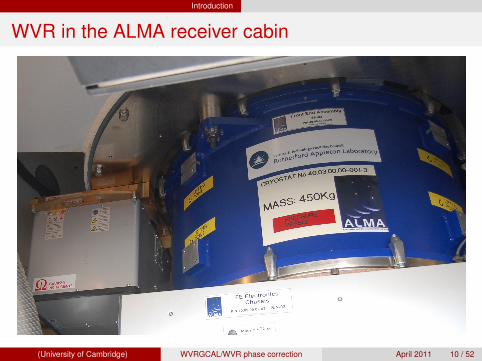
WVR in the ALMA receiver cabin
(University of Cambridge) WVRGCAL/WVR phase correction April 2011 10 / 52
Introduction
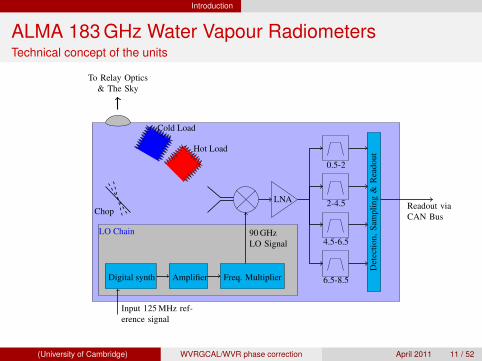
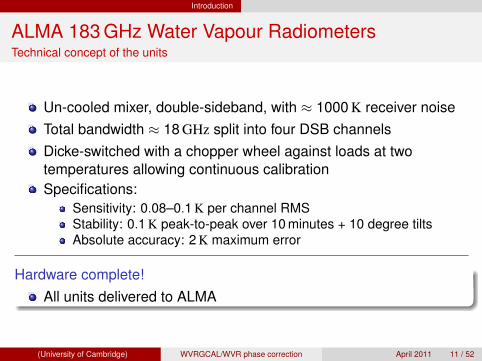
ALMA 183 GHz Water Vapour RadiometersTechnical concept of the units
To Relay Optics& The Sky
Chop
Cold Load
Hot Load
LO Chain
Input 125 MHz ref-erence signal
Digital synth Amplifier Freq. Multiplier
90 GHzLO Signal
LNA
0.5-2
2-4.5
4.5-6.5
6.5-8.5
Det
ectio
n,Sa
mpl
ing
&R
eado
ut
Readout viaCAN Bus
(University of Cambridge) WVRGCAL/WVR phase correction April 2011 11 / 52
Introduction
ALMA 183 GHz Water Vapour RadiometersTechnical concept of the units
Un-cooled mixer, double-sideband, with ≈ 1000 K receiver noiseTotal bandwidth ≈ 18 GHz split into four DSB channelsDicke-switched with a chopper wheel against loads at twotemperatures allowing continuous calibrationSpecifications:
Sensitivity: 0.08–0.1 K per channel RMSStability: 0.1 K peak-to-peak over 10 minutes + 10 degree tiltsAbsolute accuracy: 2 K maximum error
Hardware complete!All units delivered to ALMA
(University of Cambridge) WVRGCAL/WVR phase correction April 2011 11 / 52

WVRs and ALMA Phase Calibration
Outline
1 Introduction
2 WVRs and ALMA Phase Calibration
3 wvrgcalGeneralitiesInside workings
4 Some Example ResultsGood examplesPoor examplesEffect on the beam“Dry” fluctuationsSummary
5 Future work
(University of Cambridge) WVRGCAL/WVR phase correction April 2011 12 / 52

WVRs and ALMA Phase Calibration
Phase calibration schemes
WVR phase correction is only a part of the story:1 Self-calibration
Need high surface brightness (continuum) sourceFeasible for only small fraction of potential sub-mm science
2 Self-calibration + WVR correction?Allows longer averaging and therefore use on weaker sources
3 Phase switching onlyEventually cycles as rapid as 10 sOffset due to different line of sight
4 Phase switching + WVR correctionCorrect errors down to 1 second timescaleCorrect error due to different line of sight to calibratorAllow much slower phase switching
(University of Cambridge) WVRGCAL/WVR phase correction April 2011 13 / 52

WVRs and ALMA Phase Calibration
Sky brightness observed by WVRs
50
100
150
200
250
T B(K
)T B
(K)
6 6.25 6.5 6.75 7 7.25
t (hours UT)t (hours UT)
50
100
150
200
250
T B(K
)T B
(K)
6 6.25 6.5 6.75 7 7.25
t (hours UT)t (hours UT)
50
100
150
200
250
T B(K
)T B
(K)
6 6.25 6.5 6.75 7 7.25
t (hours UT)t (hours UT)
Observed brightness tem-peratures of WVR on thethree antennas involved inthis test observation. Thefour colours in each panelare the four channels of theWVRs.
(University of Cambridge) WVRGCAL/WVR phase correction April 2011 14 / 52

WVRs and ALMA Phase Calibration
Correlation between WVR signal and path fluctuation
−1
−0.5
0
0.5
1
∆TB
,1(K
)∆T
B,1
(K)
−200 −100 0 100 200 300
δL(µm)δL(µm)
0
2
4
6
8
−1.5
−1
−0.5
0
0.5
1
1.5
∆TB
,2(K
)∆T
B,2
(K)
−200 −100 0 100 200 300
δL(µm)δL(µm)
0
2
4
6
8
−1
−0.5
0
0.5
1
∆TB
,3(K
)∆T
B,3
(K)
−200 −100 0 100 200 300
δL(µm)δL(µm)
0
2
4
6
8
−0.5
0
0.5
1
∆TB
,4(K
)∆T
B,4
(K)
−200 −100 0 100 200 300
δL(µm)δL(µm)
0
2
4
6
8
(University of Cambridge) WVRGCAL/WVR phase correction April 2011 15 / 52
WVRs and ALMA Phase Calibration
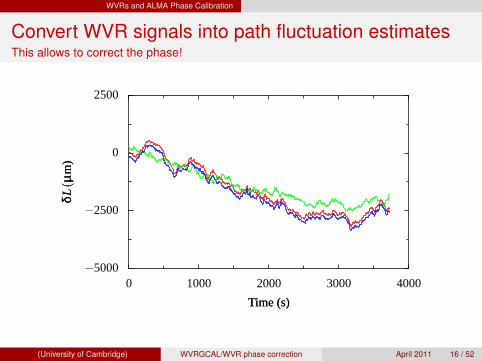
Convert WVR signals into path fluctuation estimatesThis allows to correct the phase!
−5000
−2500
0
2500
δL(µ
m)
δL(µ
m)
0 1000 2000 3000 4000
Time (s)Time (s)
(University of Cambridge) WVRGCAL/WVR phase correction April 2011 16 / 52
WVRs and ALMA Phase Calibration
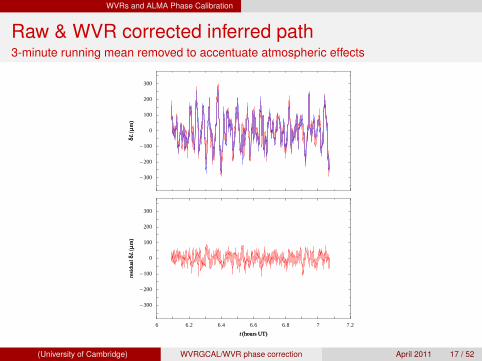
Raw & WVR corrected inferred path3-minute running mean removed to accentuate atmospheric effects
−300
−200
−100
0
100
200
300
resi
dual
δL(µ
m)
resi
dual
δL(µ
m)
6 6.2 6.4 6.6 6.8 7 7.2
t (hours UT)t (hours UT)
−300
−200
−100
0
100
200
300
δL(µ
m)
δL(µ
m)
(University of Cambridge) WVRGCAL/WVR phase correction April 2011 17 / 52
wvrgcal
Outline
1 Introduction
2 WVRs and ALMA Phase Calibration
3 wvrgcalGeneralitiesInside workings
4 Some Example ResultsGood examplesPoor examplesEffect on the beam“Dry” fluctuationsSummary
5 Future work
(University of Cambridge) WVRGCAL/WVR phase correction April 2011 18 / 52

wvrgcal Generalities
Outline
1 Introduction
2 WVRs and ALMA Phase Calibration
3 wvrgcalGeneralitiesInside workings
4 Some Example ResultsGood examplesPoor examplesEffect on the beam“Dry” fluctuationsSummary
5 Future work
(University of Cambridge) WVRGCAL/WVR phase correction April 2011 19 / 52

wvrgcal Generalities
What is wvrgcal
Off-line WVR phase correction application working with CASA[Alternative to: on-line WVR application, applywvr]Funded by EU Framework Programme 6 as an ALMAEnhancement(Funding ending end 2011 so send in any feature requests/bugreports soon!)Pre-built Linux binaries and source code publicly available: http://www.mrao.cam.ac.uk/˜bn204/alma/wvrsoft.html
(University of Cambridge) WVRGCAL/WVR phase correction April 2011 20 / 52

wvrgcal Generalities
Practical use of wvrgcal
wvrgcal is not a CASA “task” but it is fully callable and scriptablefrom CASAInputs: Normal ALMA Measurement SetOutput: CASA “T” Jones calibration table(“T” is for Troposphere)Use this table with CASA facilities like applycal, accum,plotcal & browsetable
More information:http://wikis.alma.cl/bin/view/AIV/Application
Mailing list: https://lists.cam.ac.uk/mailman/listinfo/mrao-wvrgcal –All comments/suggestions/bug reports gratefully received
(University of Cambridge) WVRGCAL/WVR phase correction April 2011 21 / 52
wvrgcal Inside workings
Outline
1 Introduction
2 WVRs and ALMA Phase Calibration
3 wvrgcalGeneralitiesInside workings
4 Some Example ResultsGood examplesPoor examplesEffect on the beam“Dry” fluctuationsSummary
5 Future work
(University of Cambridge) WVRGCAL/WVR phase correction April 2011 22 / 52
wvrgcal Inside workings
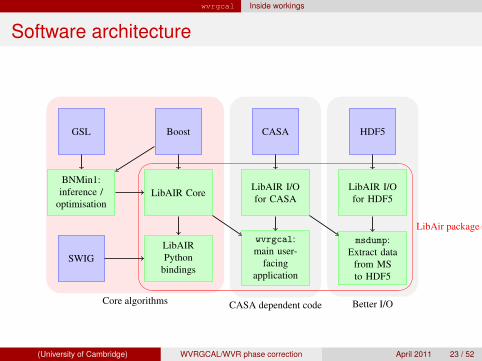
Software architecture
CASA dependent code Better I/OCore algorithms
LibAir package
GSL Boost CASA HDF5
BNMin1:inference /
optimisationLibAIR Core LibAIR I/O
for CASALibAIR I/Ofor HDF5
SWIGLibAIRPython
bindings
wvrgcal:main user-
facingapplication
msdump:Extract data
from MSto HDF5
(University of Cambridge) WVRGCAL/WVR phase correction April 2011 23 / 52
wvrgcal Inside workings
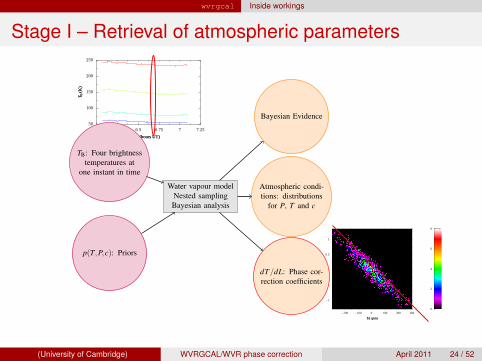
Stage I – Retrieval of atmospheric parameters
50
100
150
200
250
T B(K
)T B
(K)
6 6.25 6.5 6.75 7 7.25
t (hours UT)t (hours UT)
−1
−0.5
0
0.5
1
∆TB
,1(K
)∆T
B,1
(K)
−200 −100 0 100 200 300
δL(µm)δL(µm)
0
2
4
6
8
TB: Four brightnesstemperatures at
one instant in time
p(T,P,c): Priors
Water vapour modelNested samplingBayesian analysis
Atmospheric condi-tions: distributions
for P, T and c
Bayesian Evidence
dT/dL: Phase cor-rection coefficients
(University of Cambridge) WVRGCAL/WVR phase correction April 2011 24 / 52

wvrgcal Inside workings
Stage II – Conversion to path fluctuation
50
100
150
200
250
T B(K
)T B
(K)
6 6.25 6.5 6.75 7 7.25
t (hours UT)t (hours UT)
−1
−0.5
0
0.5
1
∆TB
,1(K
)∆T
B,1
(K)
−200 −100 0 100 200 300
δL(µm)δL(µm)
0
2
4
6
8
−5000
−2500
0
2500
δL(µ
m)
δL(µ
m)
0 1000 2000 3000 4000
Time (s)Time (s)
dT/dL: Phase cor-rection coefficients
TB: Four brightnesstemperatures as
function of time
Noise estimates
Linear trans-formation (or
something close)Path error toeach antenna
Error estimates
(University of Cambridge) WVRGCAL/WVR phase correction April 2011 25 / 52

wvrgcal Inside workings
Stage III – Application to visibilities (in CASA)
−5000
−2500
0
2500
δL(µ
m)
δL(µ
m)
0 1000 2000 3000 4000
Time (s)Time (s)
Observed visibilities
Path estimate
Other calibra-tion tables
CASA
Corrected visibilities
Map making,model fitting, etc
(University of Cambridge) WVRGCAL/WVR phase correction April 2011 26 / 52
Some Example Results
Outline
1 Introduction
2 WVRs and ALMA Phase Calibration
3 wvrgcalGeneralitiesInside workings
4 Some Example ResultsGood examplesPoor examplesEffect on the beam“Dry” fluctuationsSummary
5 Future work
(University of Cambridge) WVRGCAL/WVR phase correction April 2011 27 / 52
Some Example Results Good examples
Outline
1 Introduction
2 WVRs and ALMA Phase Calibration
3 wvrgcalGeneralitiesInside workings
4 Some Example ResultsGood examplesPoor examplesEffect on the beam“Dry” fluctuationsSummary
5 Future work
(University of Cambridge) WVRGCAL/WVR phase correction April 2011 28 / 52
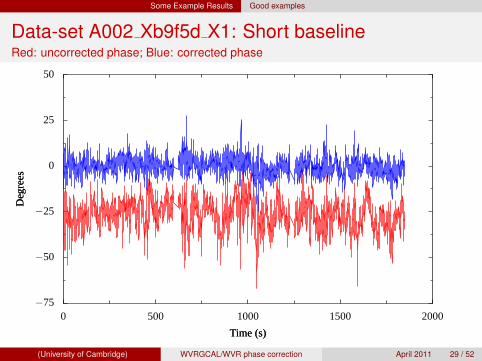
Some Example Results Good examples
Data-set A002 Xb9f5d X1: Short baselineRed: uncorrected phase; Blue: corrected phase
−75
−50
−25
0
25
50
Deg
rees
Deg
rees
0 500 1000 1500 2000
Time (s)Time (s)
(University of Cambridge) WVRGCAL/WVR phase correction April 2011 29 / 52
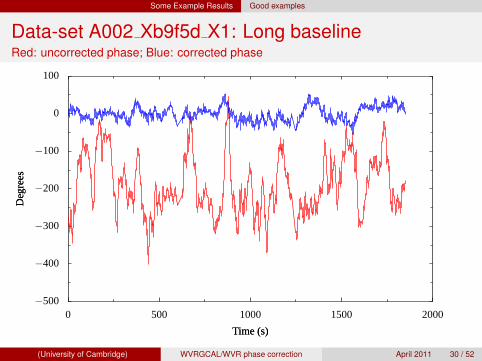
Some Example Results Good examples
Data-set A002 Xb9f5d X1: Long baselineRed: uncorrected phase; Blue: corrected phase
−500
−400
−300
−200
−100
0
100
Deg
rees
Deg
rees
0 500 1000 1500 2000
Time (s)Time (s)
(University of Cambridge) WVRGCAL/WVR phase correction April 2011 30 / 52
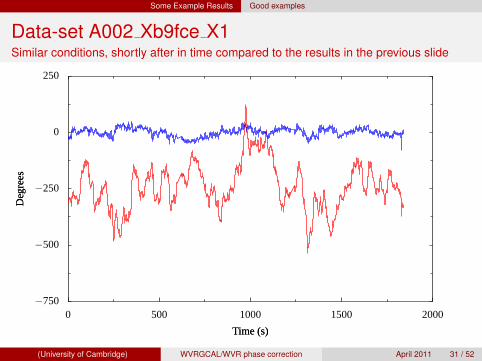
Some Example Results Good examples
Data-set A002 Xb9fce X1Similar conditions, shortly after in time compared to the results in the previous slide
−750
−500
−250
0
250
Deg
rees
Deg
rees
0 500 1000 1500 2000
Time (s)Time (s)
(University of Cambridge) WVRGCAL/WVR phase correction April 2011 31 / 52
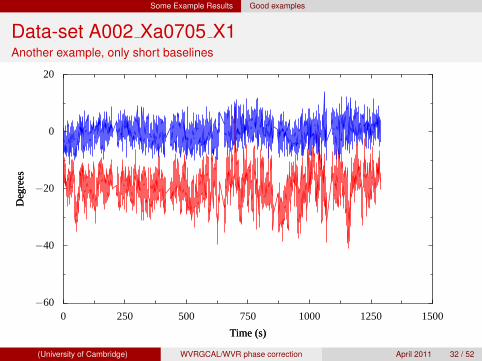
Some Example Results Good examples
Data-set A002 Xa0705 X1Another example, only short baselines
−60
−40
−20
0
20
Deg
rees
Deg
rees
0 250 500 750 1000 1250 1500
Time (s)Time (s)
(University of Cambridge) WVRGCAL/WVR phase correction April 2011 32 / 52

Some Example Results Good examples
March dataset X1849a5 X191Very wet weather, ∼ 600 m baseline
(University of Cambridge) WVRGCAL/WVR phase correction April 2011 33 / 52

Some Example Results Poor examples
Outline
1 Introduction
2 WVRs and ALMA Phase Calibration
3 wvrgcalGeneralitiesInside workings
4 Some Example ResultsGood examplesPoor examplesEffect on the beam“Dry” fluctuationsSummary
5 Future work
(University of Cambridge) WVRGCAL/WVR phase correction April 2011 34 / 52

Some Example Results Poor examples
Data-set A002 Xba2ed X1Short baselines, leak-through phase fluctuations (offset in coefficients due totime-constant cloud?)
−20
−15
−10
−5
0
5
10
Deg
rees
Deg
rees
0 500 1000 1500 2000
Time (s)Time (s)
Very short baseline (A0-A1), essentially no phase fluctuations tocorrect
(University of Cambridge) WVRGCAL/WVR phase correction April 2011 35 / 52
Some Example Results Poor examples
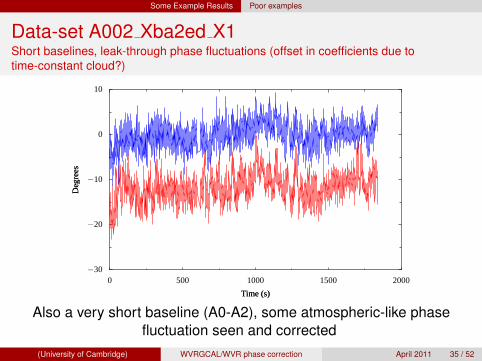
Data-set A002 Xba2ed X1Short baselines, leak-through phase fluctuations (offset in coefficients due totime-constant cloud?)
−30
−20
−10
0
10
Deg
rees
Deg
rees
0 500 1000 1500 2000
Time (s)Time (s)
Also a very short baseline (A0-A2), some atmospheric-like phasefluctuation seen and corrected
(University of Cambridge) WVRGCAL/WVR phase correction April 2011 35 / 52

Some Example Results Poor examples
Data-set A002 Xba2ed X1Short baselines, leak-through phase fluctuations (offset in coefficients due totime-constant cloud?)
−80
−60
−40
−20
0
20
40
Deg
rees
Deg
rees
0 500 1000 1500 2000
Time (s)Time (s)
Slightly longer baseline (A0-A3): atmospheric phase fluctuationsclearly seen, corrected somewhat but clear “leak-through”
(University of Cambridge) WVRGCAL/WVR phase correction April 2011 35 / 52
Some Example Results Poor examples
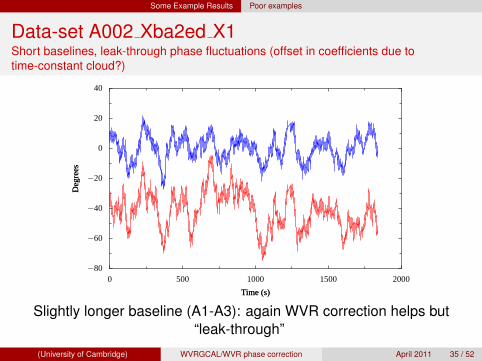
Data-set A002 Xba2ed X1Short baselines, leak-through phase fluctuations (offset in coefficients due totime-constant cloud?)
−80
−60
−40
−20
0
20
40
Deg
rees
Deg
rees
0 500 1000 1500 2000
Time (s)Time (s)
Slightly longer baseline (A1-A3): again WVR correction helps but“leak-through”
(University of Cambridge) WVRGCAL/WVR phase correction April 2011 35 / 52

Some Example Results Poor examples
Dataset A002 X9c46d X1Very good weather but dominated by instrumentals (BL A0-A1)
−300
−200
−100
0
100
Deg
rees
Deg
rees
0 500 1000 1500 2000
Time (s)Time (s)
(University of Cambridge) WVRGCAL/WVR phase correction April 2011 36 / 52
Some Example Results Poor examples
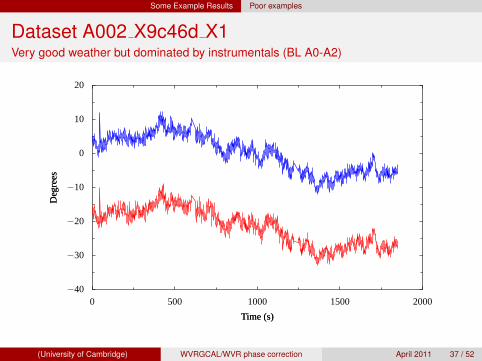
Dataset A002 X9c46d X1Very good weather but dominated by instrumentals (BL A0-A2)
−40
−30
−20
−10
0
10
20
Deg
rees
Deg
rees
0 500 1000 1500 2000
Time (s)Time (s)
(University of Cambridge) WVRGCAL/WVR phase correction April 2011 37 / 52
Some Example Results Effect on the beam
Outline
1 Introduction
2 WVRs and ALMA Phase Calibration
3 wvrgcalGeneralitiesInside workings
4 Some Example ResultsGood examplesPoor examplesEffect on the beam“Dry” fluctuationsSummary
5 Future work
(University of Cambridge) WVRGCAL/WVR phase correction April 2011 38 / 52

Some Example Results Effect on the beam
Inner ALMA pad positionsFrom http://www.alma.cl/˜dbarkats/pad_position_plotter/plots/ALMA_pad_viewer_zoom2.html
(University of Cambridge) WVRGCAL/WVR phase correction April 2011 39 / 52

Some Example Results Effect on the beam
Effect of WVR correction on the ALMA beam
No phase correction WVR phase correction
Short observation with very inhomogeneous uv distribution – one antennawas on a long north baseline and others were close together in a cluster
(University of Cambridge) WVRGCAL/WVR phase correction April 2011 40 / 52

Some Example Results “Dry” fluctuations
Outline
1 Introduction
2 WVRs and ALMA Phase Calibration
3 wvrgcalGeneralitiesInside workings
4 Some Example ResultsGood examplesPoor examplesEffect on the beam“Dry” fluctuationsSummary
5 Future work
(University of Cambridge) WVRGCAL/WVR phase correction April 2011 41 / 52
Some Example Results “Dry” fluctuations
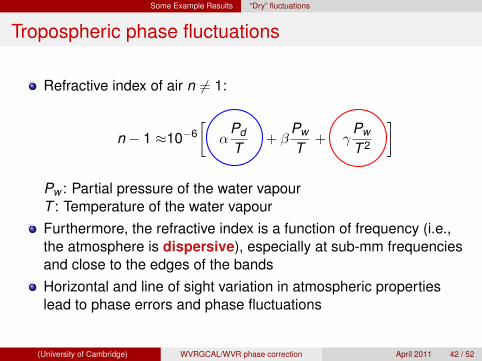
Tropospheric phase fluctuations
Refractive index of air n 6= 1:
n − 1 ≈10−6[
αPd
T+ β
Pw
T+ γ
Pw
T 2
]
Pw : Partial pressure of the water vapourT : Temperature of the water vapourFurthermore, the refractive index is a function of frequency (i.e.,the atmosphere is dispersive), especially at sub-mm frequenciesand close to the edges of the bandsHorizontal and line of sight variation in atmospheric propertieslead to phase errors and phase fluctuations
(University of Cambridge) WVRGCAL/WVR phase correction April 2011 42 / 52

Some Example Results “Dry” fluctuations
Evidence for ‘dry’ fluctuationsWeak correlation between path and TB fluctuations
25 m baseline 90 m baseline
−0.4
−0.2
0
0.2
∆TB
,1(K
)∆T
B,1
(K)
−1550 −1525 −1500 −1475 −1450
δL(µm)δL(µm)
0
2
4
6
8
10
4.2
4.4
4.6
4.8
5
5.2
∆TB
,1(K
)∆T
B,1
(K)
−25 0 25 50 75 100 125
δL(µm)δL(µm)
0
2
4
6
8
Very dry conditions (0.4 mm PWV)
(University of Cambridge) WVRGCAL/WVR phase correction April 2011 43 / 52

Some Example Results “Dry” fluctuations
Evidence for ‘dry’ fluctuationsBaseline length ∼ 25 m
8.0 8.2 8.4 8.6 8.8 9.0 9.2�0.06
�0.04
�0.02
0.00
0.02
0.04
0.06
0.08
(University of Cambridge) WVRGCAL/WVR phase correction April 2011 44 / 52

Some Example Results “Dry” fluctuations
Evidence for ‘dry’ fluctuationsBaseline length ∼ 100 m
8.0 8.2 8.4 8.6 8.8 9.0 9.2�0.10
�0.05
0.00
0.05
0.10
(University of Cambridge) WVRGCAL/WVR phase correction April 2011 45 / 52

Some Example Results Summary
Outline
1 Introduction
2 WVRs and ALMA Phase Calibration
3 wvrgcalGeneralitiesInside workings
4 Some Example ResultsGood examplesPoor examplesEffect on the beam“Dry” fluctuationsSummary
5 Future work
(University of Cambridge) WVRGCAL/WVR phase correction April 2011 46 / 52

Some Example Results Summary
Questions
Is WVR phase correction working well? According to spec?What is limiting overall phase stability?What is limiting WVR phase correction?What is the impact of residual phase errors on ALMA Science?What is the impact of residual phase errors operational efficiencyof ALMA?
Can’t have definite answers yet...Data on (majority) short or (some) intermediate baselinesFew consistent data sets (antenna moves, software upgrades,some hardware changes)
But...
(University of Cambridge) WVRGCAL/WVR phase correction April 2011 47 / 52

Some Example Results Summary
Is WVR Phase correction working well?
1 Phase stability is improved by application of WVR in essentially alldataset
2 In some cases magnitude phase of fluctuations are reduced by afactor of 5
3 Phase correction coefficients seem predictable and stable in time
4 The residual phase errors essentially never have thecharacteristics of thermal noise
5 Clouds present significant problemsConstant cloud→ error in correction coefficientsTime varying cloud→ causes errors in phase after WVR correction
6 Evidence of ‘dry’ fluctuations which we can not correct
(University of Cambridge) WVRGCAL/WVR phase correction April 2011 48 / 52

Future work
Outline
1 Introduction
2 WVRs and ALMA Phase Calibration
3 wvrgcalGeneralitiesInside workings
4 Some Example ResultsGood examplesPoor examplesEffect on the beam“Dry” fluctuationsSummary
5 Future work
(University of Cambridge) WVRGCAL/WVR phase correction April 2011 49 / 52

Future work
Future analysis work
Statistical analysis of more systematic testing data setsWhat are the limiting factors for WVR phase correction?Accuracy of phase correction for large airmass changes/all skyrunsWhat can we say about the physics of the atmosphere?
(University of Cambridge) WVRGCAL/WVR phase correction April 2011 50 / 52
Future work
Future development work
Your input is welcome! Our current thinking:Improve prediction of phase correction coefficientsBetter phase transfer between sources separated by largeairmassTake into account differences between WVRs/antenna altitudeBetter prediction of residual phase errors?“Fast” mode?Using WVRs to correct atmospheric transmission fluctuations?
(University of Cambridge) WVRGCAL/WVR phase correction April 2011 51 / 52

Future work
Documentation
Currently:Some ALMA MemosWiki pagehttp://wikis.alma.cl/bin/view/AIV/Application
Mailing list https://lists.cam.ac.uk/mailman/listinfo/mrao-wvrgcal
Planning:User and developer manualsQuick start guide with an example data setFormal writeup papers
Let us know what you’d like!
(University of Cambridge) WVRGCAL/WVR phase correction April 2011 52 / 52
Related Documents