For Peer Review On the Efficiency of Chinese Banks And WTO Challenges Journal: Applied Economics Manuscript ID: APE-05-0245.R1 Journal Selection: Applied Economics Date Submitted by the Author: 03-Oct-2005 JEL Code: B23 - Econometrics|Quantitative Studies < , N25 - Asia including Middle East < Keywords: Production efficiency, banking, China Editorial Office, Dept of Economics, Warwick University, Coventry CV4 7AL, UK Submitted Manuscript peer-00581940, version 1 - 1 Apr 2011 Author manuscript, published in "Applied Economics 39, 05 (2007) 629-643" DOI : 10.1080/00036840500447799

Welcome message from author
This document is posted to help you gain knowledge. Please leave a comment to let me know what you think about it! Share it to your friends and learn new things together.
Transcript

For Peer Review
On the Efficiency of Chinese Banks And WTO Challenges
Journal: Applied Economics
Manuscript ID: APE-05-0245.R1
Journal Selection: Applied Economics
Date Submitted by the Author:
03-Oct-2005
JEL Code:B23 - Econometrics|Quantitative Studies < , N25 - Asia including Middle East <
Keywords: Production efficiency, banking, China
Editorial Office, Dept of Economics, Warwick University, Coventry CV4 7AL, UK
Submitted Manuscriptpe
er-0
0581
940,
ver
sion
1 -
1 Ap
r 201
1Author manuscript, published in "Applied Economics 39, 05 (2007) 629-643"
DOI : 10.1080/00036840500447799
For Peer Review
1
WTO Challenges and Efficiency of Chinese Banks
Shujie Yao, Chunxia Jiang, Genfu Feng and Dirk Willenbockel*
Abstract: After joining the WTO in December 2001, China was given 5 years to
completely open up its banking market for international competition. Chinese banks
have been renowned for their mounting non-performing loans and low efficiency.
Despite gradual reforms, the banking system is still dominated by state ownership and
encapsulated monopolistic control. How to raise efficiency is a key to the survival and
success of domestic banks, especially the state-owned commercial banks. Two
important factors may be responsible for raising efficiency: ownership reform and hard
budget constraints. This paper uses a panel data of 22 banks over the period 1995-2001,
and employs a stochastic frontier production function to investigate the effects of
ownership structure and hard budget constraint on efficiency. Empirical results suggest
that non-state banks were 8-18% more efficient than state banks, and that banks facing
a harder budget tend to perform better than those heavily capitalized by the state or
regional governments. The results shed important light on banking sector reform in
China to face the tough challenges after WTO accession.
Keywords: WTO, Efficiency, Banking, ChinaJEL: C52 G14 G21
* Shujie Yao is professor of economics, Chunxia Jiang, Ph.D candidate, and Dirk Willenbockel senior lecturer,
Middlesex University Business School, London NW4 4BT, E-mail: [email protected]. Genfu Feng is professor of
economics, Xi’an Jiaotong University, China. Shujie Yao is also special chair professor of economics, Xi’an
Jiaotong University. The authors are grateful to valuable comments from participants of international seminars held
in London City University, Chongqing University and Middlesex University, but remain solely responsible for any
errors or omissions herein.
Page 1 of 35
Editorial Office, Dept of Economics, Warwick University, Coventry CV4 7AL, UK
Submitted Manuscript
123456789101112131415161718192021222324252627282930313233343536373839404142434445464748495051525354555657585960
peer
-005
8194
0, v
ersi
on 1
- 1
Apr 2
011

For Peer Review
2
1. Introduction
China has experienced rapid economic growth for more than a quarter century since
economic reforms started in 1978. In the meantime, the banking sector has been subject
to a process of fundamental structural change and reform. The key objective of reform
was to change the sector from a centralized, state-owned, monopolistic and
policy-driven to a decentralized, multi-ownership, competitive and profit-oriented
system.
Despite the significant changes and reforms in the past decades, the banking system in
China is still renowned for its low efficiency and mounting non-performing loans
(NPLs), making further reforms more and more difficult and challenging. As China
joined the World Trade Organization (WTO) in December 2001, the domestic banking
market will have to be completely open up for competition with foreign banks and other
overseas financial institutions. Many foreign banks have now entered China for
business activities involving foreign currency transactions. The Hong Kong and
Shanghai Bank Corporation (HSBC) is now allowed to do business in Shanghai
involving transactions in Renminbi, the Chinese currency. In two years time, all foreign
banks will be able to do any business that can be done by domestic banks. By June 2004,
there were already 100 foreign banks conducting Renminbi businesses in 13 large cities,
and 53 of them were allowed to do such businesses with domestic enterprises (People’s
Daily, 2004).
The time scale for intense competition is short, but most domestic banks, especially the
four large state-owned commercial banks, are still ridden with mounting NPLs and low
efficiency. The task to make these banks competitive with international banks such as
HSBC is undoubtedly onerous and extremely challenging for the Chinese authorities.
Page 2 of 35
Editorial Office, Dept of Economics, Warwick University, Coventry CV4 7AL, UK
Submitted Manuscript
123456789101112131415161718192021222324252627282930313233343536373839404142434445464748495051525354555657585960
peer
-005
8194
0, v
ersi
on 1
- 1
Apr 2
011
For Peer Review
3
In response to the immediate challenges, the central government has decided to speed
up the pace of reforms. Apart from bailing out a huge sum of NPLs from the four
state-owned banks, the state council has decided to support the Bank of China and
China Construction Bank with $45 billion from its total foreign exchange reserves of
$403 billion. This is by far the boldest and toughest decision of the government to
convert the big state banks into truly commercial institutions. The implication is that
these two banks will become joint-stock companies, which will soon be placed in the
stock exchanges. If this reform is successful, a similar reform measure will be applied
to the other two state banks, the China Industrial and Commercial Bank and the China
Agricultural Bank.
One theoretical rationale for the latest banking reform is provided by the agency theory.
In the past, whenever the state banks ran into difficulty, the principal (the state) had to
bail them out. The agents (the bank managers), knowing that the principal was the
ultimate resort of help, lent relentlessly to whatever clients they considered to be
trustworthy, resulting in mounting NPLs that could never be recovered. By turning the
state banks into joint stock companies, the incentive structure changes, and it is hoped
that the state will never have to bail them out in the future. In the short run, the state has
a responsibility to remove all or much of the NPLs to generate a fresh capital structure
similar to that of a truly commercial bank so that the banks can compete with foreign
entrants on a level playing field. In the long term, the state banks will have to be entirely
responsible for their own profits and losses without political or administrative
interference.
A second theoretical perspective on the banking reform is related to budgetary
constraints. In the past, soft budget constraints meant that state banks were largely
capitalized using state funds. In the future, once they are listed in the stock market, they
have to rely more and more on raising capital from shareholders, rendering them to be
responsible for shareholders’ interests rather than state or local government interests.
The competitiveness of these banks will depend on their ability to earn profits and
Page 3 of 35
Editorial Office, Dept of Economics, Warwick University, Coventry CV4 7AL, UK
Submitted Manuscript
123456789101112131415161718192021222324252627282930313233343536373839404142434445464748495051525354555657585960
peer
-005
8194
0, v
ersi
on 1
- 1
Apr 2
011
For Peer Review
4
paying dividends to shareholders.
Whether the motivation of reform is based on the principal-agent problem, or on the
impact of budgetary constraints, the ultimate goal is to increase efficiency and
competitiveness of domestic banks. Whether this goal can be achieved depends on the
answers to the following two questions. First, can ownership reform and hard budget
constraints help improve efficiency? Second, can China change the ownership structure
of its banking system and subject all the state banks to hard budgets in such a short time
before foreign banks flush into the country for competition?
In this paper, we aim to answer the first question based on available data and
information. We cannot answer the second question, as it is not yet clear how quickly
the state council can move to re-capitalize the four large state banks.
To answer the first question, we employ a stochastic frontier production function and
use panel data of 22 state-owned and non-state banks for the period 1995-2001. Two
hypotheses are tested. First, joint stock or non-state banks are more efficient than the
state-owned banks. Second, banks that are subject to a harder budget constraint are
more efficient than banks that are subject to a softer budget.
The regression results support both hypotheses and show that the average efficiency
level is 63% in the data period, which is relatively low compared with that of the US or
European banks. Two factors are found to have a significant impact on the level of
efficiency: ownership characteristics and equity/asset ratio. On average, non-state
banks outperform state banks by 8-18% depending on whether the output of banking is
measured by the amount of loans or by profitability. The equity/asset ratio measures the
extent of risk taken by banks. It also reflects the extent to which banks are subject to a
hard budget. If a bank is well capitalized by the state, the equity/asset ratio is high, and
hence less reluctant to take risk. It is found that banks with a high equity/asset ratio are
less efficient because they are better capitalized, less risk-taking, and hence subject to a
Page 4 of 35
Editorial Office, Dept of Economics, Warwick University, Coventry CV4 7AL, UK
Submitted Manuscript
123456789101112131415161718192021222324252627282930313233343536373839404142434445464748495051525354555657585960
peer
-005
8194
0, v
ersi
on 1
- 1
Apr 2
011

For Peer Review
5
softer budget constraint.
The empirical results not only support our hypotheses, but also support the government
efforts to reform the state banks through changing their ownership structure and
subjecting them to a hard budget. Whether the state can successfully transform the state
banks, however, remains a challenging issue for the future, but is beyond the scope of
this paper.
The rest of this paper is organized as follows. Section 2 provides background
information on the Chinese banking system. Section 3 reviews the literature on
efficiency studies, paying special attention to the banking sector. Section 4 discusses
methodological issues, including model specifications and data. Section 5 presents and
evaluates regression results. Section 6 concludes.
2. Bank reform and WTO challenges
2.1 Banking system reform
Throughout the pre-reform period 1949-78, the Chinese banking
system was entirely dominated by the People’s Bank of China
(PBOC), which acted as a central bank and the only commercial bank
in the country (Dai, 2003). Following economic reforms since 1978,
the banking system has undergone significant changes. The first
change was the breaking up of PBOC into two arms, the central bank
and the commercial operation. The central bank still retains the name
PBOC. The commercial operation was split into four specialized
state-owned banks, or the Big Four in the rest of this paper: the
Agricultural Bank of China (ABC), the China Construction Bank
(CCB), the Bank of China (BOC), and the Industrial and Commercial
Page 5 of 35
Editorial Office, Dept of Economics, Warwick University, Coventry CV4 7AL, UK
Submitted Manuscript
123456789101112131415161718192021222324252627282930313233343536373839404142434445464748495051525354555657585960
peer
-005
8194
0, v
ersi
on 1
- 1
Apr 2
011
For Peer Review
6
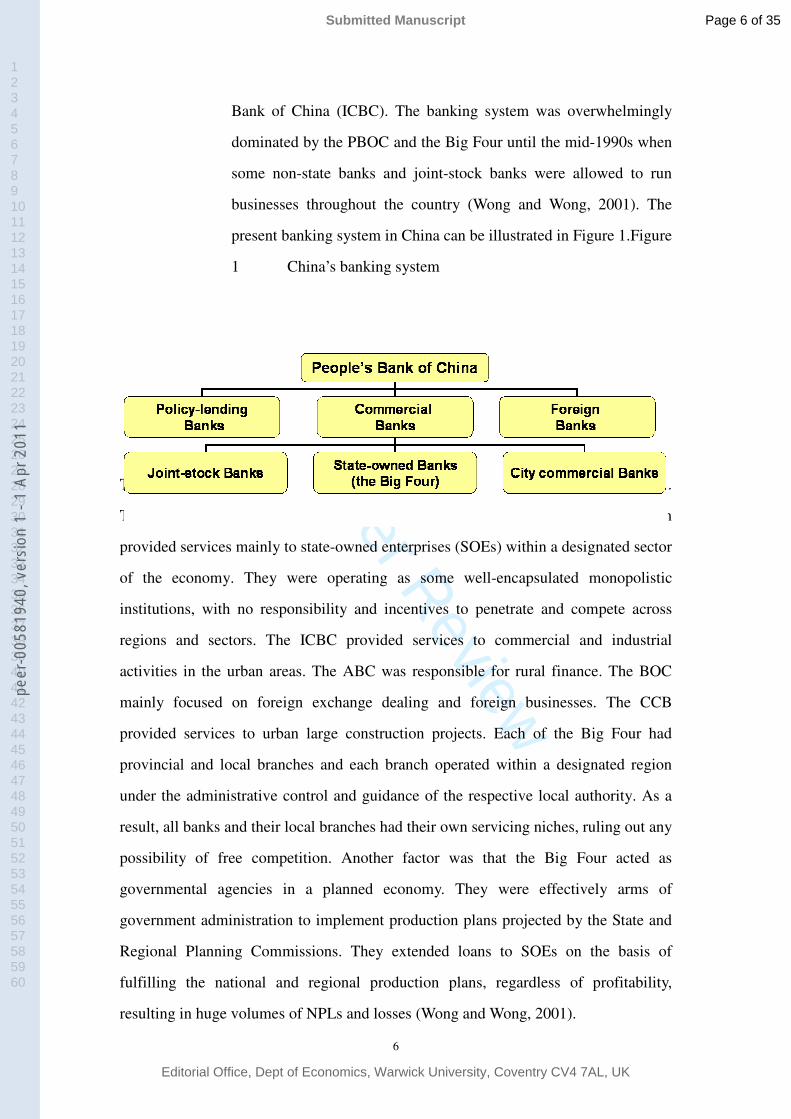
Bank of China (ICBC). The banking system was overwhelmingly
dominated by the PBOC and the Big Four until the mid-1990s when
some non-state banks and joint-stock banks were allowed to run
businesses throughout the country (Wong and Wong, 2001). The
present banking system in China can be illustrated in Figure 1.Figure
1 China’s banking system
The Big Four are renowned for their low efficiency, loss-making and mounting NPLs.
Two main factors were responsible for their current plight. One was that each of them
provided services mainly to state-owned enterprises (SOEs) within a designated sector
of the economy. They were operating as some well-encapsulated monopolistic
institutions, with no responsibility and incentives to penetrate and compete across
regions and sectors. The ICBC provided services to commercial and industrial
activities in the urban areas. The ABC was responsible for rural finance. The BOC
mainly focused on foreign exchange dealing and foreign businesses. The CCB
provided services to urban large construction projects. Each of the Big Four had
provincial and local branches and each branch operated within a designated region
under the administrative control and guidance of the respective local authority. As a
result, all banks and their local branches had their own servicing niches, ruling out any
possibility of free competition. Another factor was that the Big Four acted as
governmental agencies in a planned economy. They were effectively arms of
government administration to implement production plans projected by the State and
Regional Planning Commissions. They extended loans to SOEs on the basis of
fulfilling the national and regional production plans, regardless of profitability,
resulting in huge volumes of NPLs and losses (Wong and Wong, 2001).
Page 6 of 35
Editorial Office, Dept of Economics, Warwick University, Coventry CV4 7AL, UK
Submitted Manuscript
123456789101112131415161718192021222324252627282930313233343536373839404142434445464748495051525354555657585960
peer
-005
8194
0, v
ersi
on 1
- 1
Apr 2
011
For Peer Review
7
Since the early 1980s, the banking system has experienced some changes, and the
intention of such changes is to move the state banks away from being driven by policy
towards being driven by profit and competition. In the process of transition, the
government has assumed concrete steps to reform in order to create a more competitive
and efficient system. The first step was to remove the limits that a specialized bank had
to serve a designated sector in order to create a competitive market-based financial
system in 1985. However, the competition was limited because the operations of the
Big Four were subject to frequent intervention by the central and local governments.
The local branches were under government control and much of the lending activities
were still driven by the needs of policy makers.
The second step was the establishment of three policy banks in order to take over the
function of extending policy loans from the Big Four in 1994. Nevertheless, the state
commercial banks still play a significant role in policy lending. The serving and lending
capacity of the specialized policy banks are unable to meet the need of policy lending
previously provided by the Big Four due to the lack of a branch network and capital.
Moreover, the state commercial banks are often subject to pressure from both the
central and regional authorities to make loans to their preferred sector and enterprises.
The third step was the reorganization of the central bank in an effort to eliminate local
government interference at the end of 1998. The PBOC merged provincial-level
branches into nine large regional branches. Local governments no longer have the right
to appoint senior officials for the local branches of PBOC as they did before.
The fourth step was the establishment of four asset management companies (AMCs) in
order to unload NPLs from the Big Four in 1999. These AMCs, namely Cinda Asset
Management Company, China Great Wall Asset Management Company, Oriental
Asset Management Company, and China Huarong Asset Management Corporation, are
paired with CCB, ABC, BOC and ICBC, respectively. AMCs were expected to help the
Page 7 of 35
Editorial Office, Dept of Economics, Warwick University, Coventry CV4 7AL, UK
Submitted Manuscript
123456789101112131415161718192021222324252627282930313233343536373839404142434445464748495051525354555657585960
peer
-005
8194
0, v
ersi
on 1
- 1
Apr 2
011

For Peer Review
8
Big Four to clean up their balance sheets and to make them more competitive. In
addition, a five-classification loan standard scheme has been applied to all domestic
banks in order to control the NPL ratio of new loans.
Apart from reforming the Big Four, the state allowed regional banks or even non-state
banks to be established and to compete with the Big Four. The establishment of
joint-stock commercial banks has injected vigor into the Chinese banking industry by
creating a new source of competition. In addition, 90 local banks, known as city
commercial banks, were formed by consolidating former local urban cooperatives. City
commercial banks all adopted a shareholding ownership structure and were restricted
geographically within their own localities. These joint-stock banks operate on a pure
commercial basis focusing on profit maximization and market share.
Having assumed effective measures in a step by step manner, much headway has been
made in enhancing the competitiveness and efficiency of the banking system. Currently,
an open and competitive system has been primarily established, comprising the PBOC
as the central bank, along with the Big Four as mainstay, joint-stock commercial banks
as growth engines, local commercial banks and foreign banks as complementarities.
However, despite a rapid expansion of non-state banks, the Big Four still
overwhelmingly dominate the Chinese banking industry. The four firm concentration
ratios of total assets, loans and deposits were respectively 84.93%, 84.26%, and
88.51% in 1998, whilst the four firm concentration ratios of profits was only 55.33%
(Wong and Wong, 2001). These rough indicators suggest that the Big Four are large but
much less profitable than other types of banks, an issue of interest to be investigated in
this paper.
2.2 Facing WTO challenges
Although much progress has been made on reforming the banking system, the Big Four
still face with many internal and external challenges. The internal plight is the huge
Page 8 of 35
Editorial Office, Dept of Economics, Warwick University, Coventry CV4 7AL, UK
Submitted Manuscript
123456789101112131415161718192021222324252627282930313233343536373839404142434445464748495051525354555657585960
peer
-005
8194
0, v
ersi
on 1
- 1
Apr 2
011
For Peer Review
9
volume of NPLs, resulting from policy lending to loss-making SOEs. The external
plight is the lack of operational experiences in a market-based financial system, brought
about by the specialization of the Big Four to serve the SOE sector. The current
competitive position of Chinese banks is insufficient to compete with foreign banks
with immense financial muscles and international experience. For example, the second
largest bank of the UK, the Royal Bank of Scotland, generated £6.19 billion of pre-tax
profit in 2003. Its workforce was only 120,000, implying that each employee generated
on average more than £50,000 (or $90,000) of profit. Obviously, none of the Chinese
Big Four would be able to compete with the Royal Bank of Scotland if there were no
protection.
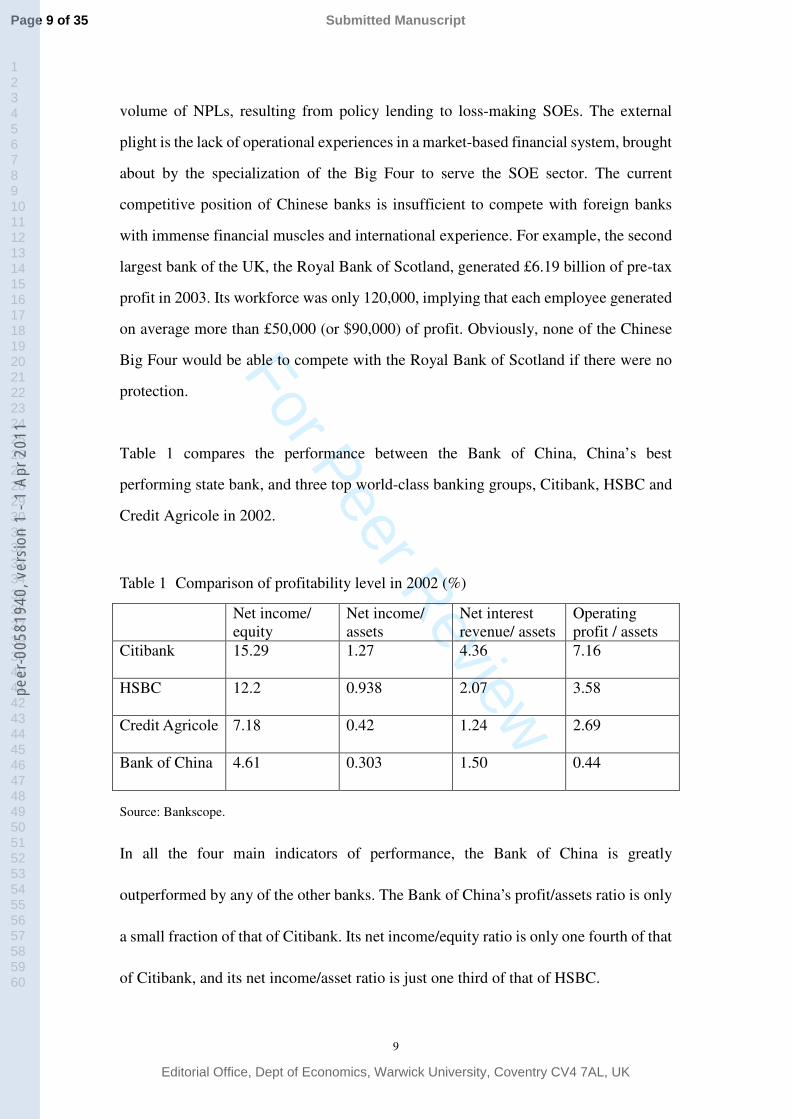
Table 1 compares the performance between the Bank of China, China’s best
performing state bank, and three top world-class banking groups, Citibank, HSBC and
Credit Agricole in 2002.
Table 1 Comparison of profitability level in 2002 (%)
Net income/ equity
Net income/ assets
Net interest revenue/ assets
Operating profit / assets
Citibank 15.29 1.27 4.36 7.16
HSBC 12.2 0.938 2.07 3.58
Credit Agricole 7.18 0.42 1.24 2.69
Bank of China 4.61 0.303 1.50 0.44
Source: Bankscope.
In all the four main indicators of performance, the Bank of China is greatly
outperformed by any of the other banks. The Bank of China’s profit/assets ratio is only
a small fraction of that of Citibank. Its net income/equity ratio is only one fourth of that
of Citibank, and its net income/asset ratio is just one third of that of HSBC.
Page 9 of 35
Editorial Office, Dept of Economics, Warwick University, Coventry CV4 7AL, UK
Submitted Manuscript
123456789101112131415161718192021222324252627282930313233343536373839404142434445464748495051525354555657585960
peer
-005
8194
0, v
ersi
on 1
- 1
Apr 2
011
For Peer Review
10
In the past, there were high entry barriers and business restrictions for foreign banks,
including geographic restrictions and entry requirements. Under the WTO rules, there
is no restriction on foreign currency business upon accession in all parts of the country.
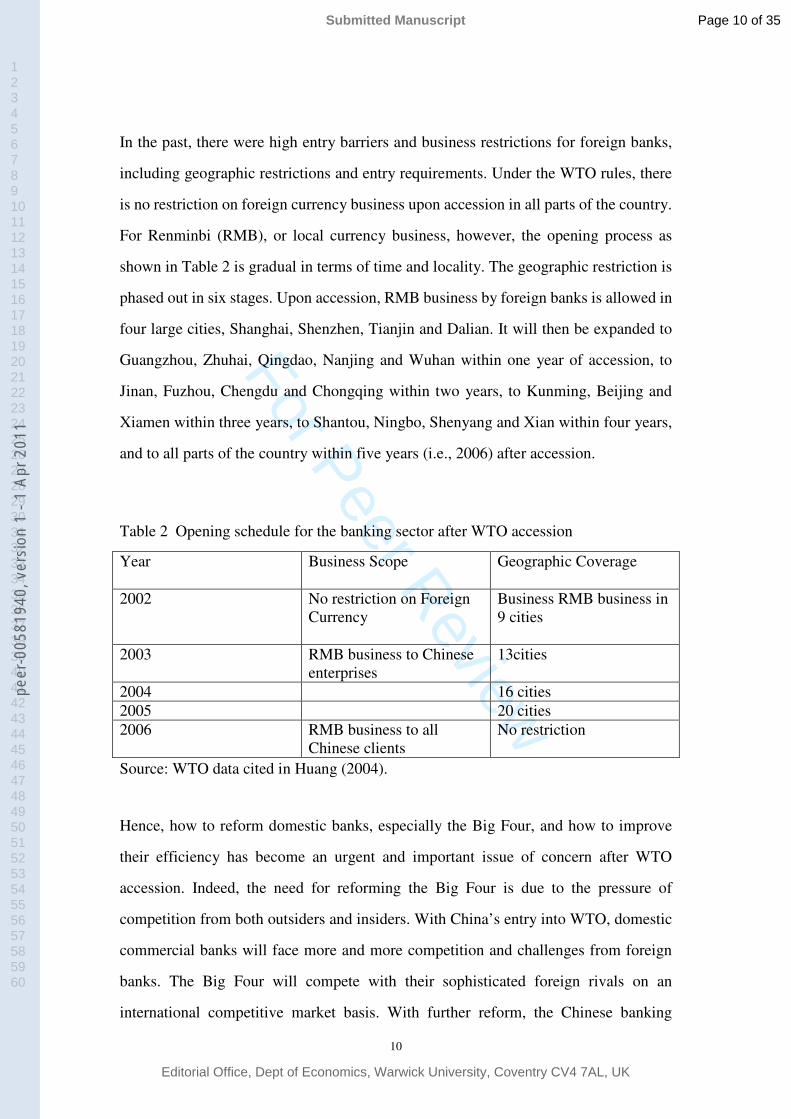
For Renminbi (RMB), or local currency business, however, the opening process as
shown in Table 2 is gradual in terms of time and locality. The geographic restriction is
phased out in six stages. Upon accession, RMB business by foreign banks is allowed in
four large cities, Shanghai, Shenzhen, Tianjin and Dalian. It will then be expanded to
Guangzhou, Zhuhai, Qingdao, Nanjing and Wuhan within one year of accession, to
Jinan, Fuzhou, Chengdu and Chongqing within two years, to Kunming, Beijing and
Xiamen within three years, to Shantou, Ningbo, Shenyang and Xian within four years,
and to all parts of the country within five years (i.e., 2006) after accession.
Table 2 Opening schedule for the banking sector after WTO accession
Year Business Scope Geographic Coverage
2002 No restriction on Foreign Currency
Business RMB business in 9 cities
2003 RMB business to Chinese enterprises
13cities
2004 16 cities2005 20 cities2006 RMB business to all
Chinese clientsNo restriction
Source: WTO data cited in Huang (2004).
Hence, how to reform domestic banks, especially the Big Four, and how to improve
their efficiency has become an urgent and important issue of concern after WTO
accession. Indeed, the need for reforming the Big Four is due to the pressure of
competition from both outsiders and insiders. With China’s entry into WTO, domestic
commercial banks will face more and more competition and challenges from foreign
banks. The Big Four will compete with their sophisticated foreign rivals on an
international competitive market basis. With further reform, the Chinese banking
Page 10 of 35
Editorial Office, Dept of Economics, Warwick University, Coventry CV4 7AL, UK
Submitted Manuscript
123456789101112131415161718192021222324252627282930313233343536373839404142434445464748495051525354555657585960
peer
-005
8194
0, v
ersi
on 1
- 1
Apr 2
011

For Peer Review
11
institutions will have unprecedented opportunities to enjoy their increasing weight in
the international financial system. The prospect of the Chinese economy also motivates
the Big Four to reform themselves.
3. Measuring banking efficiency: a selective review
Over the last half a century, much attention has been devoted to banking efficiency
study. Regarding the sources of inefficiency in banking, earlier studies tended to focus
on economies of scale by examining whether costs per unit can be reduced by
increasing output, and economies of scope by examining whether costs per unit can be
lowered by joint production. Empirical studies of scale and scope economies show
significant scale economies for medium-sized banks of $100 million to $5 billion in
assets in the 1980s. However, recent studies indicate that scale economies have
increased substantially, existing for large banks of $10 billion to $25 billion in assets in
the 1990s. The recent merger and acquisition in the UK banking sector provides a good
example of scale economies involving huge commercial banks. Such examples include
the merger of the Royal Bank of Scotland with the National Westminster Bank, the
Bank of Scotland with Halifax, and the earlier acquisition of Midlands Bank by HSBC
and the merger of Lloyds and TSB. As for scope economies, however, empirical studies
reveal small cost inefficiencies (Saunders, 1999).
More recently, efficiency research has shifted to production efficiency which consists
of two components: technical efficiency and allocative efficiency. Technical efficiency
refers to the ability of optimal utilization of available resources either by producing
maximum output for a given input bundle or by using minimum inputs to produce a
given output. Allocative efficiency refers to the ability to achieve the optimal
combination of inputs and outputs for a given level of prices (Lovell, 1993). In the
context of production efficiency, x-efficiency first introduced by Leibenstein (1966) is
attributed to overall objective determinants, such as improvement in management and
application of technologies, regardless of size (scale) and product mix (scope). Within a
Page 11 of 35
Editorial Office, Dept of Economics, Warwick University, Coventry CV4 7AL, UK
Submitted Manuscript
123456789101112131415161718192021222324252627282930313233343536373839404142434445464748495051525354555657585960
peer
-005
8194
0, v
ersi
on 1
- 1
Apr 2
011
For Peer Review
12
data set, the best-practice frontier or the worst-practice frontier can be estimated. The
difference between the best-practice frontier and the practice of a particular firm
reflects its x-inefficiency (Reifschneider and Stevenson, 1991, Molyneux et al, 1996).
In the literature, two main controversial issues addressed by researchers are how to
define and measure inputs and outputs of banks and how to determine the best-practice
frontier to evaluate their performance. Indeed, how to measure banking outputs and
inputs is one of the most difficult issues because of the distinct features of banks.
Unlike manufacturing firms producing physical goods, banks not only produce
unidentifiable products—intermediary services, but also provide a wide range of
products—multi-products. A number of measures on banking output have been
employed in early efficiency research, such as the number of deposit and loan accounts
and the dollars in each account.
By emphasizing the basic nature of a bank’s production process rather than stock
variables, a services flow offered to customers can be considered as bank output. There
are two main approaches to measure services flow: the production approach and the
intermediation approach. The production approach treats banks as firms producing
different deposit and loan accounts. The number and type of transactions and
documents are considered to be the best measure of bank output. However, such
specific data are generally unavailable and therefore, in practice, the number of deposit
and loan accounts is usually employed as the measure of bank output. The
intermediation approach pioneered by Sealey and Lindley (1977) treats banks as
financial intermediaries channeling funds between depositors and creditors. In the
production process, the value of bank loan and investment is considered to be output,
while labour and deposit capital are treated as inputs. This approach is distinguished
from the production approach by adding deposits to inputs, with consideration of both
operating cost and interest cost (Goddard et al., 2001). Neither the production approach
nor the intermediation approach is perfect, they are complementary instead (Berger and
Humphrey 1997). Each approach emphasizes one side of the role played by banks and
Page 12 of 35
Editorial Office, Dept of Economics, Warwick University, Coventry CV4 7AL, UK
Submitted Manuscript
123456789101112131415161718192021222324252627282930313233343536373839404142434445464748495051525354555657585960
peer
-005
8194
0, v
ersi
on 1
- 1
Apr 2
011

For Peer Review
13
can be applied to different levels of efficiency research. The production approach is
appropriate for studying the cost efficiency of banks by addressing the operation costs
of banking. The intermediation approach is appropriate for studying the economic
differentiation of banks by controlling the overall costs of banking (Ferrier and Lovell,
1990). This approach takes interest expenses into account, which is useful not only for
examining bank efficiency but also for frontier analysis.
Different estimation techniques have been applied to bank efficiency research. Berger
and Humphrey (1997) provides a valuable survey on 130 financial institution efficiency
studies in which five main approaches are identified. These approaches can be
classified into two main categories — parametric and non-parametric techniques.
Parametric technique and non-parametric technique were roughly equally adopted.
Overall, their survey shows similar efficiency estimates resulting from parametric and
non-parametric techniques. On average, there is about 20% cost inefficiency and about
half of profit inefficiency in the US. Studies employing non-parametric techniques
obtain lower average efficiency estimates and greater dispersion than studies using
parametric techniques. Despite the similarity of average efficiency estimates,
disagreement about inefficiency rankings of individual firms exists.
Parametric methods can be subdivided into three main approaches to determine the
best-practice frontier. The first approach is the stochastic frontier approach (SFA)
developed independently by Aigner, Lovell, and Schmidt (1977) and Meeusen and van
den Broeck (1977). SFA specifies a functional form for the cost, profit or production
function, which allows inefficiencies to be included in the error term. Two
distributional assumptions on the error terms to separate the two components are (1) the
inefficiencies follow an asymmetric half-normal distribution, based on the logic that
inefficiencies only increase costs above frontier levels, and (2) random errors follow a
symmetric standard normal distribution because random fluctuations can either
increase or reduce costs (Bauer at el.,1993). Relevant literature on applications of SFA
to banking can be found in Ferrier and Lovell (1990) and Bauer at el. (1993). In China,
Page 13 of 35
Editorial Office, Dept of Economics, Warwick University, Coventry CV4 7AL, UK
Submitted Manuscript
123456789101112131415161718192021222324252627282930313233343536373839404142434445464748495051525354555657585960
peer
-005
8194
0, v
ersi
on 1
- 1
Apr 2
011
For Peer Review
14
this approach has been used to investigate grain production and technical efficiency by
Yao and Liu (1998). However, to the best of our knowledge there is no such study for
the Chinese banking sector. On the other hand, there are many empirical studies for the
banking sector in other countries or economies, including Shen (2005) and Huang and
Wang (2004) for Taiwanese banks, Elyasiani and Mehdian (1995) and Fare et al (2004)
for the US banks, and Girardone et al (2004) for Italian banks.
The other two parametric approaches are the distribution free approach (DFA) and the
thick frontier approach (TFA). DFA assumes that efficiency differences are stable over
time. The estimated efficiency of each firm is the difference between its mean residual
and industrial mean residual on the frontier. TFA has no restriction of distributional
assumption. TFA estimates provide an overall level of efficiency rather than point
efficiency estimates for individual firms. This approach has been employed in Berger
and Humphrey (1997), Bauer et al. (1993) and Drake and Simper (2002).
Unlike parametric techniques that specify a functional form for the production function,
non-parametric techniques impose fewer restrictions on the production frontier.
Non-parametric methods can be divided into two subcategories: data envelopment
analysis (DEA) and free disposal hull (FDH). DEA is a linear programming method
used for estimating efficiency of decision making units. DEA creates a production
frontier directly based on a particular data set of firms rather than a specific functional
form. The distance from the best-practice frontier reflects a firm’s inefficiency
(Charnes et al. 1978). Examples of DEA applications in banking are Ferrier and Lovell
(1990). In China, one recent application of the DEA technique is found in Zheng et al.
(2003) on state-owned enterprise performance. FDH is a special case of DEA by
relaxing the hypothesis of convexity (Berger and Humphrey, 1997). DEA has been
widely applied in many recent empirical studies, including Hauner (2005) for German
and Austrian banks, Ataullah et al (2004) for Indian and Pakistani banks, Casu and
Molyneux (2003) for European banks, and Favero and Pari (1995) for Italian banks.
Page 14 of 35
Editorial Office, Dept of Economics, Warwick University, Coventry CV4 7AL, UK
Submitted Manuscript
123456789101112131415161718192021222324252627282930313233343536373839404142434445464748495051525354555657585960
peer
-005
8194
0, v
ersi
on 1
- 1
Apr 2
011
For Peer Review
15
Each approach to determine the efficiency frontier possesses certain advantages and
disadvantages. Non-parametric technique allows efficiency to vary over time and does
not require prior assumptions about the distribution of inefficiency across observations.
However, its important drawback is the assumption of no random errors influencing
bank performance. Ignoring the existence of potential errors, the effects of omitted
errors may be included into efficiency estimates (Berger and Humphrey, 1997).
Another drawback of the non-parametric technique is the neglect of price effects on
efficiency—allocative efficiency, addressing only technological efficiency. As to the
parametric technique, a crucial disadvantage is the pre-specified functional form for
efficiency frontier, which may result in an inaccurate efficiency measurement (Berger
and Humphrey, 1997). Given that we use a panel data of 22 banks covering 6 years,
there will be significant variations of efficiencies across different kinds of banks in
different time periods. In other words, the effects of random errors could be large. As a
result, the parametric approach, especially the stochastic frontier production function
approach, is considered to be most suitable for this study.
4. The stochastic frontier production model
4.1 A theoretical model
This study adopts the intermediation approach to measure bank inputs and outputs
since its key concern is to identify the main determinants of efficiency. Outputs of
banks are defined as the book value of pre-tax profit, and/or the book value of loans.
This is because the specific frontier production model does not allow multi-outputs.
The value of loans includes short-term, medium and long-term, and other loans, after
deducting loan loss reserves. The value of pre-tax profit is an accounting item. Bank
inputs are defined as fixed assets, deposit, equity and labour in both profit and loan
models.
Previous studies have adopted a two-stage estimation procedure with shortcoming of
Page 15 of 35
Editorial Office, Dept of Economics, Warwick University, Coventry CV4 7AL, UK
Submitted Manuscript
123456789101112131415161718192021222324252627282930313233343536373839404142434445464748495051525354555657585960
peer
-005
8194
0, v
ersi
on 1
- 1
Apr 2
011

For Peer Review
16
the inconsistency in its assumptions concerning the independence of the inefficiency
effects in the two estimation stages. This study adopts a single-stage estimation
technique proposed by Battese and Coelli (1995) and Coelli (1992), with an assumption
that non-negative technical inefficiency effects are a function of firm-specific variables
and time. The distributional assumption is that the inefficiency effects are
independently distributed as truncations of normal distributions with constant variance,
but with means that are a linear function of observable variables. The model shown
below allows the estimation of both technical change in the stochastic frontier and
time-varying technical inefficiencies.
)(0 ititittit UVxtY −+++= βββ , i=1, …, N; t=1,…,T, (1)
where i and t denote firm and time, Yit the logged output variable, itx a vector of logged
input variables, itV a random variable assumed to be distributed with mean zero and a
constant variance N (0, 2vσ ), β a vector of unknown parameters to be estimated, itU a
non-negative random variable associated with technical inefficiency of production,
which is assumed to be independently distributed as truncation at zero of N( itm , 2uσ ).
The specification of the technical inefficiency effects, itU , is
itittit WztU +++= δδδ 0 , (2)
where itz is a vector of explanatory variables associated with technical inefficiency of
production over time, δ a vector of unknown coefficients to be estimated, itW a
random variable defined by the truncation of the normal distribution with zero mean
and variance 2σ .
The technical efficiency of production for the i-th bank at the t-th time is defined as:
Page 16 of 35
Editorial Office, Dept of Economics, Warwick University, Coventry CV4 7AL, UK
Submitted Manuscript
123456789101112131415161718192021222324252627282930313233343536373839404142434445464748495051525354555657585960
peer
-005
8194
0, v
ersi
on 1
- 1
Apr 2
011
For Peer Review
17
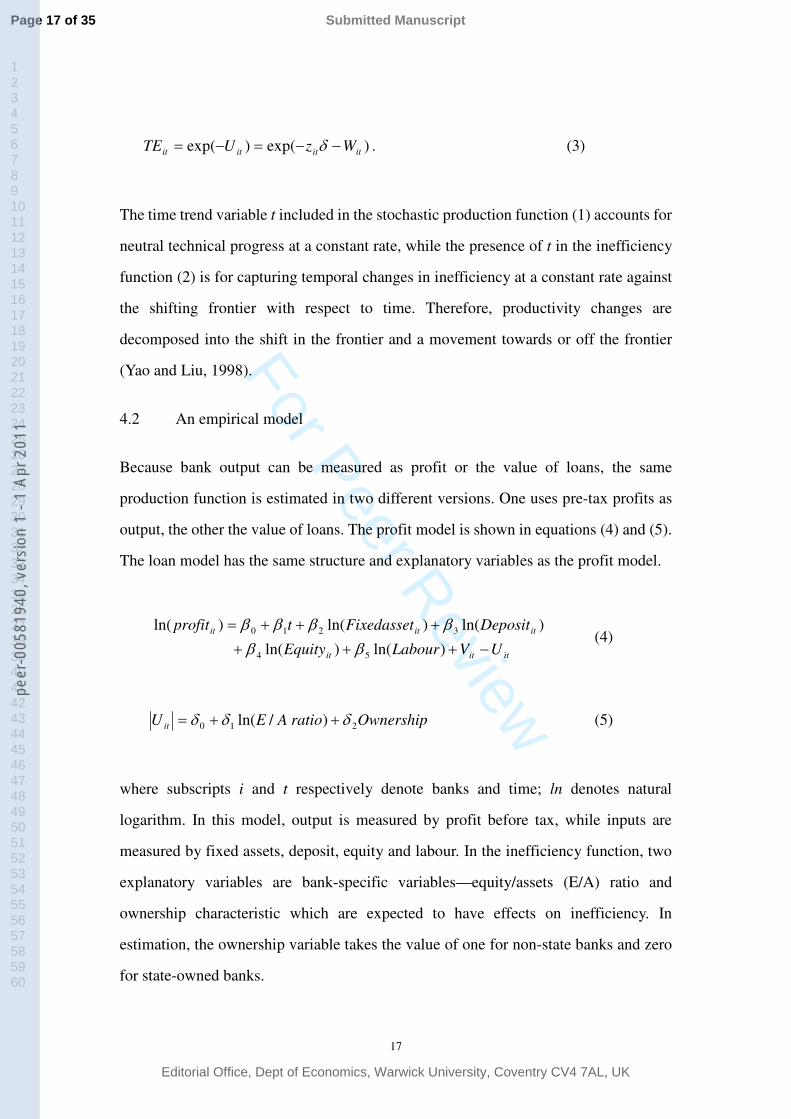
)exp()exp( itititit WzUTE −−=−= δ . (3)
The time trend variable t included in the stochastic production function (1) accounts for
neutral technical progress at a constant rate, while the presence of t in the inefficiency
function (2) is for capturing temporal changes in inefficiency at a constant rate against
the shifting frontier with respect to time. Therefore, productivity changes are
decomposed into the shift in the frontier and a movement towards or off the frontier
(Yao and Liu, 1998).
4.2 An empirical model
Because bank output can be measured as profit or the value of loans, the same
production function is estimated in two different versions. One uses pre-tax profits as
output, the other the value of loans. The profit model is shown in equations (4) and (5).
The loan model has the same structure and explanatory variables as the profit model.
ititit
ititit
UVLabourEquity
DepositFixedassettprofit
−+++
+++=
)ln()ln(
)ln()ln()ln(
54
3210
ββββββ
(4)
OwnershipratioAEUit 210 )/ln( δδδ ++= (5)
where subscripts i and t respectively denote banks and time; ln denotes natural
logarithm. In this model, output is measured by profit before tax, while inputs are
measured by fixed assets, deposit, equity and labour. In the inefficiency function, two
explanatory variables are bank-specific variables—equity/assets (E/A) ratio and
ownership characteristic which are expected to have effects on inefficiency. In
estimation, the ownership variable takes the value of one for non-state banks and zero
for state-owned banks.
Page 17 of 35
Editorial Office, Dept of Economics, Warwick University, Coventry CV4 7AL, UK
Submitted Manuscript
123456789101112131415161718192021222324252627282930313233343536373839404142434445464748495051525354555657585960
peer
-005
8194
0, v
ersi
on 1
- 1
Apr 2
011

For Peer Review
18
Equity includes share or/and own capital, as well as retained profits. Assets include
loans, fixed assets and other assets. It can also be defined as total liabilities plus equity,
where total liabilities include deposits, borrowing from other institutions and other
funds. If a bank is capitalized and supported by the state, equity also includes state
capital. If a bank is a joint-stock company, part of its equity will be share capital. As
total assets include loans, a bank is subject to higher risk with a lower E/A ratio, as for a
given amount of equity, the bank is exposed to more liabilities. If a bank is well
capitalized with support from the government, E/A can be increased if total liabilities
are fixed. The recent efforts of the state council to inject $45 billion to BOC and CCB
are to help them raise the E/A ratio, and hence reduce their risk. An earlier effort by the
government to use AMCs to remove some NPLs from the Big Four served the same
purpose.
Hence, the E/A ratio can be interpreted in different aspects. A lower E/A may mean that
the bank is less capitalized and subject to a harder budget constraint, but it has to take
more risk in order to increase loans to its clients. If the government is involved in
changing the E/A ratio, different banks will be subject to different budget constraints.
Usually, the state will support the state-owned banks, helping them to have a lower E/A
ratio than the non-state banks, ceteris paribus. As a result, if the E/A ratio is negatively
associated with efficiency, it implies that soft budget will lead to low efficiency, or vice
versa.
4.3 Data
The data are obtained from Bankscope for 22 commercial banks over the period
1995-2001. Of the 22 banks, 2 have data for 1996-2001, 7 for 1995-2000, and the rest
for 1995-2001, forming an unbalanced panel data set. In terms of ownership, the
sample banks include the Big Four, 11 shareholding banks, and 7 small commercial
banks that are ultimately owned by one of the Big Four or state council. The summary
statistics of banking outputs and inputs are reported in Table 3.
Page 18 of 35
Editorial Office, Dept of Economics, Warwick University, Coventry CV4 7AL, UK
Submitted Manuscript
123456789101112131415161718192021222324252627282930313233343536373839404142434445464748495051525354555657585960
peer
-005
8194
0, v
ersi
on 1
- 1
Apr 2
011

For Peer Review
19
Table 3 Summary statistics, mean values of 22 banks 1995-2001 (billion yuan)
variables 1995 1996 1997 1998 1999 2000 2001Pre-tax profit 6.81 8.26 9.19 8.49 8.50 8.77 7.81
Loan 745.5 903.3 1004.6 1142.2 1214.7 1210.7 1359.9Fixed assets 13.52 19.22 20.15 22.46 29.80 36.41 32.97
Deposit 334.27 406.07 512.72 604.70 716.04 820.51 920.97
Equity 48.28 49.12 50.75 94.42 93.25 96.24 97.31E/A ratio
(%) 6.67 6.115 6.955 8.25 8.135 8.165 8.172Source: Calculated by authors based on data for sample period obtained from Bankscope:
http://bankscope.bvdep.com.
5. Results and interpretations
5.1 The profit model
Maximum-likelihood (ML) estimates of parameters in the profit model are obtained
using a modification of the computer program, FRONTIER 4.1 (Coelli, 1996). These
ML estimates and the standard errors are reported in Table 4.
Page 19 of 35
Editorial Office, Dept of Economics, Warwick University, Coventry CV4 7AL, UK
Submitted Manuscript
123456789101112131415161718192021222324252627282930313233343536373839404142434445464748495051525354555657585960
peer
-005
8194
0, v
ersi
on 1
- 1
Apr 2
011
For Peer Review
20
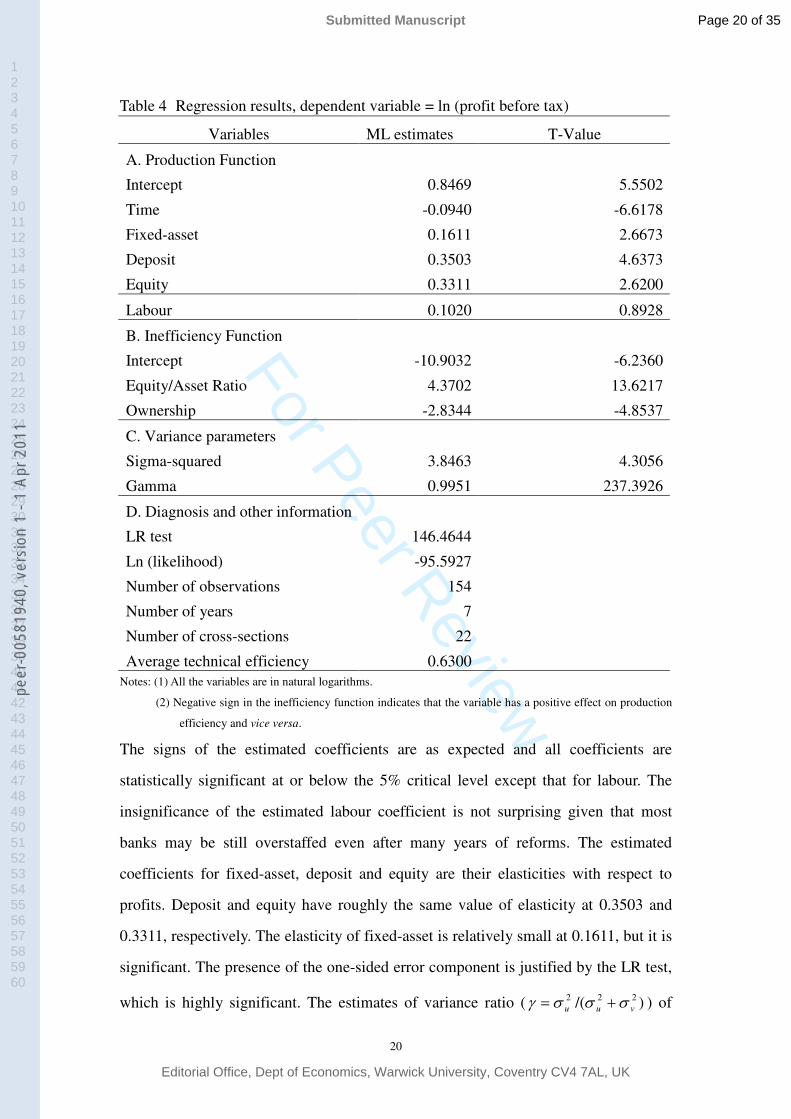
Table 4 Regression results, dependent variable = ln (profit before tax)
Variables ML estimates T-Value
A. Production Function
Intercept 0.8469 5.5502
Time -0.0940 -6.6178
Fixed-asset 0.1611 2.6673
Deposit 0.3503 4.6373
Equity 0.3311 2.6200
Labour 0.1020 0.8928
B. Inefficiency Function
Intercept -10.9032 -6.2360
Equity/Asset Ratio 4.3702 13.6217
Ownership -2.8344 -4.8537
C. Variance parameters
Sigma-squared 3.8463 4.3056
Gamma 0.9951 237.3926
D. Diagnosis and other information
LR test 146.4644
Ln (likelihood) -95.5927
Number of observations 154
Number of years 7
Number of cross-sections 22
Average technical efficiency 0.6300 Notes: (1) All the variables are in natural logarithms.
(2) Negative sign in the inefficiency function indicates that the variable has a positive effect on production
efficiency and vice versa.
The signs of the estimated coefficients are as expected and all coefficients are
statistically significant at or below the 5% critical level except that for labour. The
insignificance of the estimated labour coefficient is not surprising given that most
banks may be still overstaffed even after many years of reforms. The estimated
coefficients for fixed-asset, deposit and equity are their elasticities with respect to
profits. Deposit and equity have roughly the same value of elasticity at 0.3503 and
0.3311, respectively. The elasticity of fixed-asset is relatively small at 0.1611, but it is
significant. The presence of the one-sided error component is justified by the LR test,
which is highly significant. The estimates of variance ratio ( )/( 222vuu σσσγ += ) of
Page 20 of 35
Editorial Office, Dept of Economics, Warwick University, Coventry CV4 7AL, UK
Submitted Manuscript
123456789101112131415161718192021222324252627282930313233343536373839404142434445464748495051525354555657585960
peer
-005
8194
0, v
ersi
on 1
- 1
Apr 2
011

For Peer Review
21
0.9951 indicates that the inefficiency element itU is stochastic.
The average level of technical efficiency over the sample period is 63%, leaving a gap
with the maximum possible level of 37%. The average estimated efficiencies of 22
banks are plotted in Figure 2. The most efficient bank is China Merchants Bank Co Ltd
with an average technical efficiency of 91.23%, whilst the most inefficient bank is ABC
with an efficiency of 40.95%. Wide efficiency differentiations across banks observed
here indicate that there is a substantial potential for improving the overall efficiency of
Chinese banks.
Figure 2 Average Efficiency of China's banks (profit) (1995--2001)
0.00
0.10
0.20
0.30
0.40
0.50
0.60
0.70
0.80
0.90
1.00
0 1 2 3 4 5 6 7 8 9 10 11 12 13 14 15 16 17 18 19 20 21 22 23 24
banks
ዊ�ዊ�ዊ�ዊ�ዊ�ዊ�ዊ�ዊ�ዊ�ዊ�
Note: The numbers on the X-axis represent individual banks (see appendix A for detail).
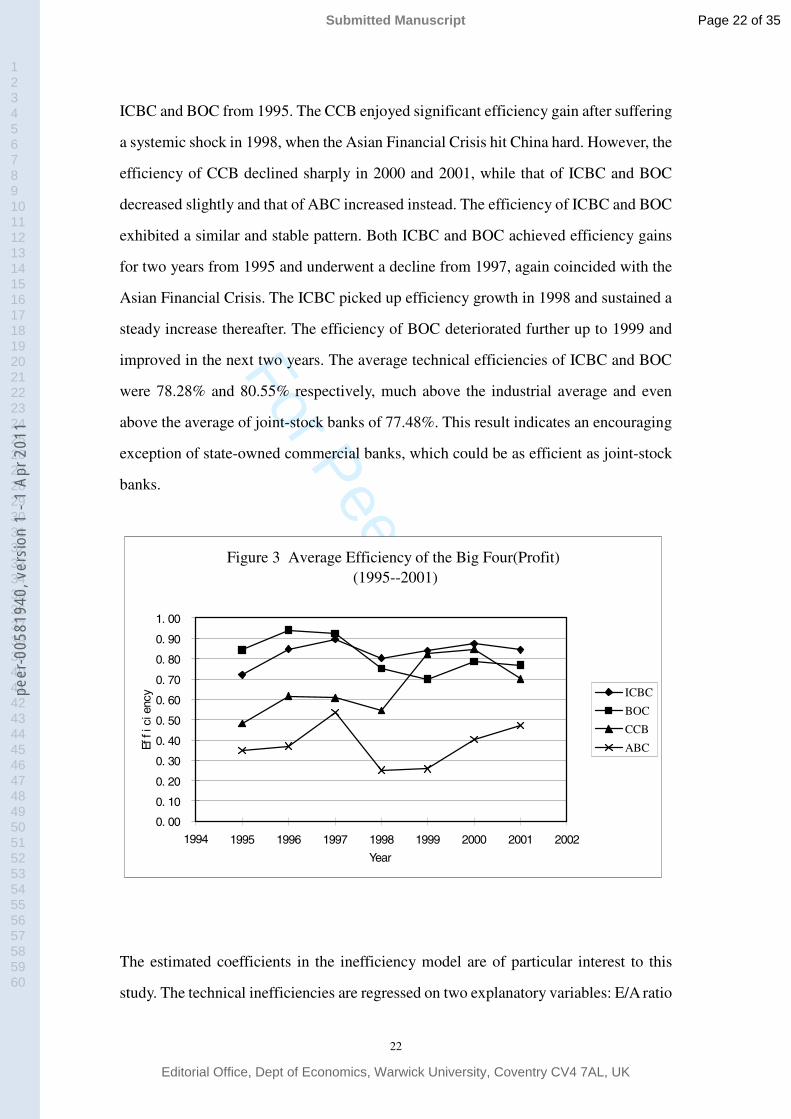
As the Big Four have a dominant position in the banking industry and are the focus of
imminent reform, it is worth looking at their efficiency levels in detail. The average
efficiencies of the Big Four during the data period are plotted in Figure 3. ABC is the
least efficient bank in terms of profitability. Its efficiency also fluctuates drastically
over time. On the other hand, its efficiency rose slightly with the same pattern as that of
Page 21 of 35
Editorial Office, Dept of Economics, Warwick University, Coventry CV4 7AL, UK
Submitted Manuscript
123456789101112131415161718192021222324252627282930313233343536373839404142434445464748495051525354555657585960
peer
-005
8194
0, v
ersi
on 1
- 1
Apr 2
011
For Peer Review
22
ICBC and BOC from 1995. The CCB enjoyed significant efficiency gain after suffering
a systemic shock in 1998, when the Asian Financial Crisis hit China hard. However, the
efficiency of CCB declined sharply in 2000 and 2001, while that of ICBC and BOC
decreased slightly and that of ABC increased instead. The efficiency of ICBC and BOC
exhibited a similar and stable pattern. Both ICBC and BOC achieved efficiency gains
for two years from 1995 and underwent a decline from 1997, again coincided with the
Asian Financial Crisis. The ICBC picked up efficiency growth in 1998 and sustained a
steady increase thereafter. The efficiency of BOC deteriorated further up to 1999 and
improved in the next two years. The average technical efficiencies of ICBC and BOC
were 78.28% and 80.55% respectively, much above the industrial average and even
above the average of joint-stock banks of 77.48%. This result indicates an encouraging
exception of state-owned commercial banks, which could be as efficient as joint-stock
banks.
Figure 3 Average Efficiency of the Big Four(Profit) (1995--2001)
0. 00
0. 10
0. 20
0. 30
0. 40
0. 50
0. 60
0. 70
0. 80
0. 90
1. 00
1994 1995 1996 1997 1998 1999 2000 2001 2002
Year
ዊ�ዊ�ዊ�ዊ�ዊ�ዊ�ዊ�ዊ�ዊ�ዊ� ICBC
BOC
CCB
ABC
The estimated coefficients in the inefficiency model are of particular interest to this
study. The technical inefficiencies are regressed on two explanatory variables: E/A ratio
Page 22 of 35
Editorial Office, Dept of Economics, Warwick University, Coventry CV4 7AL, UK
Submitted Manuscript
123456789101112131415161718192021222324252627282930313233343536373839404142434445464748495051525354555657585960
peer
-005
8194
0, v
ersi
on 1
- 1
Apr 2
011
For Peer Review
23
and ownership characteristic. The E/A ratio has a positive impact on inefficiencies.
Banks are more efficient with a low E/A ratio which reflects more risk-taking. In other
words, well-capitalized banks are less efficient, confirming our hypothesis on budget
constraints. If banks are subject to a soft budget, such as the state-owned banks, their
capital assets are manly raised from state funds. But if banks are subject to a hard
budget, they have to raise capital from shareholders. One consequence is that they will
tend to be less capitalized, and hence have to take more risk to make profits (Koch and
MacDonald, 2000).
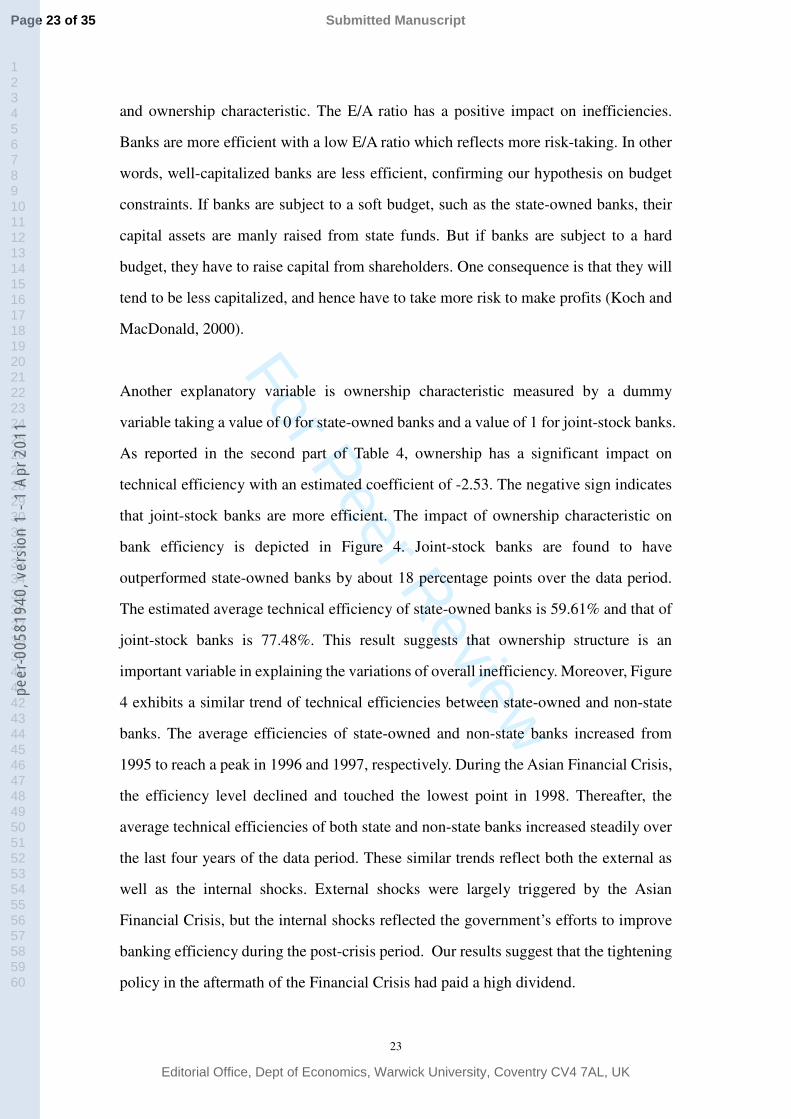
Another explanatory variable is ownership characteristic measured by a dummy
variable taking a value of 0 for state-owned banks and a value of 1 for joint-stock banks.
As reported in the second part of Table 4, ownership has a significant impact on
technical efficiency with an estimated coefficient of -2.53. The negative sign indicates
that joint-stock banks are more efficient. The impact of ownership characteristic on
bank efficiency is depicted in Figure 4. Joint-stock banks are found to have
outperformed state-owned banks by about 18 percentage points over the data period.
The estimated average technical efficiency of state-owned banks is 59.61% and that of
joint-stock banks is 77.48%. This result suggests that ownership structure is an
important variable in explaining the variations of overall inefficiency. Moreover, Figure
4 exhibits a similar trend of technical efficiencies between state-owned and non-state
banks. The average efficiencies of state-owned and non-state banks increased from
1995 to reach a peak in 1996 and 1997, respectively. During the Asian Financial Crisis,
the efficiency level declined and touched the lowest point in 1998. Thereafter, the
average technical efficiencies of both state and non-state banks increased steadily over
the last four years of the data period. These similar trends reflect both the external as
well as the internal shocks. External shocks were largely triggered by the Asian
Financial Crisis, but the internal shocks reflected the government’s efforts to improve
banking efficiency during the post-crisis period. Our results suggest that the tightening
policy in the aftermath of the Financial Crisis had paid a high dividend.
Page 23 of 35
Editorial Office, Dept of Economics, Warwick University, Coventry CV4 7AL, UK
Submitted Manuscript
123456789101112131415161718192021222324252627282930313233343536373839404142434445464748495051525354555657585960
peer
-005
8194
0, v
ersi
on 1
- 1
Apr 2
011

For Peer Review
24
Figure 4 Average efficiency of the Big Four and joint-stock banks (profit)(1995--2001)
0.00
0.10
0.20
0.30
0.40
0.50
0.60
0.70
0.80
0.90
1.00
1994 1995 1996 1997 1998 1999 2000 2001 2002
ዊ�ዊ�ዊ�ዊ�ዊ�ዊ�ዊ�ዊ�ዊ�ዊ�
ዊ�ዊ�ዊ�ዊ�ዊ�ዊ�ዊ�ዊ�ዊ�ዊ�ዊ�ዊ�ዊ�ዊ�ዊ�ዊ�ዊ� ዊ�ዊ�ዊ�ዊ�ዊ�ዊ�ዊ�ዊ�ዊ�ዊ�ዊ�ዊ�ዊ�ዊ�ዊ�ዊ�ዊ�ዊ�
5.2 The loan model
The picture that emerges from the loan model is similar to that of the profit model, as
shown in Table 5. The signs of the coefficients are consistent with that of the profit
model and all coefficients are statistically significant except for labour. The estimated
coefficients for fixed-asset, deposit and equity are 0.0841, 0.4606 and 0.6232,
respectively. Deposit and equity have stronger impact than in the profit model. The
negative coefficient of year indicates that the output level tends to decrease by 1.09%
per year over the data period. The LR test and the estimates of variance ratios also
confirm the presence of a one-sided error component which represents the stochastic
inefficiency component itU .
Page 24 of 35
Editorial Office, Dept of Economics, Warwick University, Coventry CV4 7AL, UK
Submitted Manuscript
123456789101112131415161718192021222324252627282930313233343536373839404142434445464748495051525354555657585960
peer
-005
8194
0, v
ersi
on 1
- 1
Apr 2
011

For Peer Review
25
Table 3 Regression results, dependent variable = ln (loans)
Variables ML estimates T-Value
A. Production Function
Intercept 0.1909 1.6207
Time -0.0109 -0.6404
Fixed-asset 0.0841 2.4651
Deposit 0.4606 11.5178
Equity 0.6232 9.5670
Labour 0.0860 1.2203
B. Inefficiency Function
Intercept -0.2683 -1.9051
Time 0.0268 1.4709
Equity/Asset Ratio 0.4525 7.3413
Ownership -0.2756 -6.4406
C. Variance parameters
Sigma-squared 0.0347 8.6795
Gamma 0.1141 0.5730 D. Diagnosis and other information
LR test 92.2811
Ln (likelihood) 40.7622
Number of observations 154
Number of years 7
Number of cross-sections 22
Average technical efficiency 0.6392 Notes: (1) All the variables are in natural logarithms.
(2) Negative sign in the inefficiency function indicates that the variable has a positive effect on production
efficiency and vice versa.
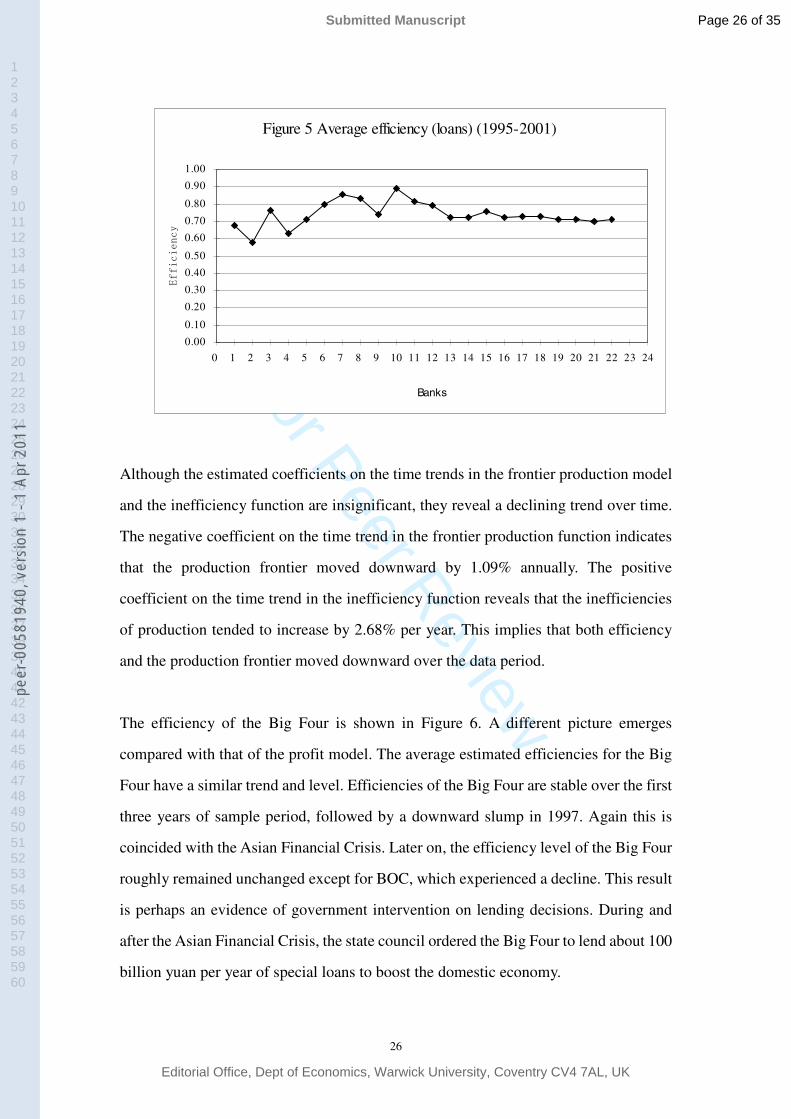
The estimated average technical efficiency is 63.91%, which is slightly higher than in
the profit model. The average estimated efficiencies for 22 individual banks are
graphed in Figure 5. The most efficient bank is China Minsheng Banking Corporation
with an average technical efficiency of 89%, while the most inefficient bank is the Bank
of China (BOC) with an average technical efficiency of 58.03%.
Page 25 of 35
Editorial Office, Dept of Economics, Warwick University, Coventry CV4 7AL, UK
Submitted Manuscript
123456789101112131415161718192021222324252627282930313233343536373839404142434445464748495051525354555657585960
peer
-005
8194
0, v
ersi
on 1
- 1
Apr 2
011
For Peer Review
26
Figure 5 Average efficiency (loans) (1995-2001)
0.00
0.10
0.20
0.30
0.40
0.50
0.60
0.70
0.80
0.90
1.00
0 1 2 3 4 5 6 7 8 9 10 11 12 13 14 15 16 17 18 19 20 21 22 23 24
Banks
ዊ�ዊ�ዊ�ዊ�ዊ�ዊ�ዊ�ዊ�ዊ�ዊ�
Although the estimated coefficients on the time trends in the frontier production model
and the inefficiency function are insignificant, they reveal a declining trend over time.
The negative coefficient on the time trend in the frontier production function indicates
that the production frontier moved downward by 1.09% annually. The positive
coefficient on the time trend in the inefficiency function reveals that the inefficiencies
of production tended to increase by 2.68% per year. This implies that both efficiency
and the production frontier moved downward over the data period.
The efficiency of the Big Four is shown in Figure 6. A different picture emerges
compared with that of the profit model. The average estimated efficiencies for the Big
Four have a similar trend and level. Efficiencies of the Big Four are stable over the first
three years of sample period, followed by a downward slump in 1997. Again this is
coincided with the Asian Financial Crisis. Later on, the efficiency level of the Big Four
roughly remained unchanged except for BOC, which experienced a decline. This result
is perhaps an evidence of government intervention on lending decisions. During and
after the Asian Financial Crisis, the state council ordered the Big Four to lend about 100
billion yuan per year of special loans to boost the domestic economy.
Page 26 of 35
Editorial Office, Dept of Economics, Warwick University, Coventry CV4 7AL, UK
Submitted Manuscript
123456789101112131415161718192021222324252627282930313233343536373839404142434445464748495051525354555657585960
peer
-005
8194
0, v
ersi
on 1
- 1
Apr 2
011

For Peer Review
27
Different pictures from the profit and loan models can perhaps be attributed to the
distinct degree of government intervention on banks. Direct government intervention
resulted in a similar efficiency trend and level among the Big Four in the loan model.
The Big Four still acted as government’s arms in a policy-driven financial system
despite many years of reform to reduce intervention and policy lending.
Figure 6 Average efficiency of the Big Four (Loan) (1995-2001)
0.00
0.20
0.40
0.60
0.80
1.00
1.20
1994 1995 1996 1997 1998 1999 2000 2001 2002
ዊ�ዊ�ዊ�ዊ�ዊ�ዊ�ዊ�ዊ�ዊ�ዊ�
I CBC BOC CCB ABC
As for the inefficiencies, they are also influenced by the E/A ratio and ownership
characteristic. The elasticity of E/A ratio is 0.4525 and statistically significant,
indicating a positive impact on inefficiencies. It is consistent with the result of the profit
model. Again, ownership is found to have different impact on inefficiency with an
estimated coefficient of -0.2756, which is small but significant. The smaller impact of
ownership characteristic on bank inefficiencies compared to that of the profit model can
be considered as evidence that both state-owned banks and joint-stock banks are both
subject to government intervention in lending. The impact of ownership characteristic
on bank efficiency from 1995 to 2001 is shown in Figure 7. The Big Four are more
Page 27 of 35
Editorial Office, Dept of Economics, Warwick University, Coventry CV4 7AL, UK
Submitted Manuscript
123456789101112131415161718192021222324252627282930313233343536373839404142434445464748495051525354555657585960
peer
-005
8194
0, v
ersi
on 1
- 1
Apr 2
011

For Peer Review
28
efficient than the joint-stock banks in the first three years by 10 percentage points. In
1998, the efficiency of the Big Four encountered a sharp downward slump from
76.90% to 52.68%, while that of the joint-stock banks remained unchanged. During the
last three years, joint-stock banks became more efficient than the Big Four. This result
is different from that of the profit model in which joint-stock banks are 18% more
efficient than the state-owned banks throughout the sample period. However,
joint-stock banks are still more efficient than the state-owned banks by 8 percentage
points on average over the sample period. This result is attributable to the different
degree of government intervention. Although government can influence lending
decision of both state and non-state banks, the extent of intervention on the latter tends
to be less than on the former.
Figure 7 Average efficiency of the Big Four and joint-stock banks (loan)(1995-2001)
0.00
0.10
0.20
0.30
0.40
0.50
0.60
0.70
0.80
0.90
1994 1995 1996 1997 1998 1999 2000 2001 2002
ዊ�ዊ�ዊ�ዊ�ዊ�ዊ�ዊ�ዊ�ዊ�ዊ�
The Big Four Shareholding banks
Page 28 of 35
Editorial Office, Dept of Economics, Warwick University, Coventry CV4 7AL, UK
Submitted Manuscript
123456789101112131415161718192021222324252627282930313233343536373839404142434445464748495051525354555657585960
peer
-005
8194
0, v
ersi
on 1
- 1
Apr 2
011
For Peer Review
29
6. Conclusions
The estimated average efficiency of the sample banks is quite low at 63% in both the
profit and loan models, but not fundamentally different from that of previous studies for
other countries. In the literature, the average efficiency score is about 80% for the US
banks (Berger and Humphrey, 1997). The difference of efficiency estimates is
consistent with the fact that Chinese banks are more subject to government control and
intervention despite many years of reform.
The Big Four have a dominant position in the banking industry. They were given a legal
status in 1995, the first year of our data period, as commercial banks with a principal
objective of making profits. However, after many years of reforms, the efficiency level
was still low and did not improve significantly over time. On the one hand, it suggests
that government intervention in lending decision still persists, on the other hand, it
reveals that there exists a great potential for efficiency improvement.
In this paper, we hypothesize that ownership reform and change of budgetary
constraints should lead to more competition and hence greater efficiency gains. Our
data set provides information for constructing a stochastic frontier production function
indicating that joint-stock banks outperform state-banks by 18% in profitability and 8%
in loans. The empirical results also suggest that banks which are subject to a hard
budget, and hence less capitalized, tend to take more risk and become more efficient
than those which are subject to a softer budget constraint and hence more capitalized.
The results have important policy implications on bank reforms in China in face of the
WTO challenges in the immediate future.
As China has to open up its banking market for international competition, domestic
banks have to become more efficient as quickly as possible. Two fundamental reforms
are needed. First, the state banks, which have enjoyed a dominant position, have to
become truly commercialized, to be entirely free from government control and
Page 29 of 35
Editorial Office, Dept of Economics, Warwick University, Coventry CV4 7AL, UK
Submitted Manuscript
123456789101112131415161718192021222324252627282930313233343536373839404142434445464748495051525354555657585960
peer
-005
8194
0, v
ersi
on 1
- 1
Apr 2
011
For Peer Review
30
intervention, to be re-capitalized so that their capital structure will resemble that of a
western commercial bank, to have a better corporate government and incentive
structure so that internal efficiency can increase as rapidly as possible. The second
reform is to allow more and more medium and small banks to enter the market and
compete with the state banks. The number of small and medium banks has increased
enormously in recent years, but most of them are still under control by regional or local
governments. Most of them are not well managed and may lack the economies of scale
and scope to compete with foreign banks.
Although the empirical results in this paper confirms that ownership reforms and
change of budgetary constraints can force banks to become more efficient, the
problems faced by the Chinese banks are so many and so difficult that it may take many
more years for them to compete successfully with foreign banks. The most recent
decision to re-capitalize BOC and CCB is a significant step towards this direction.
However, whether this reform is successful will depend on how the Big Four respond to
the new reform method. We have not paid much attention to the problem of NPLs
which is estimated to be as high as 30-40%, although the official figure is only 15-20%.
If banks are still ridden with so much NPLs and if corporate governance is still heavily
influenced by politics, the chance of success is very small. Hence, our conclusion is that
China will have to face more pains in the near future when foreign large banks enter the
domestic market and compete head on with the Big Four. This is where the real fight
will begin and more radical reform measures have to be taken not only on
re-capitalization but also on appointment of senior management and the way that banks
are currently managed.
Page 30 of 35
Editorial Office, Dept of Economics, Warwick University, Coventry CV4 7AL, UK
Submitted Manuscript
123456789101112131415161718192021222324252627282930313233343536373839404142434445464748495051525354555657585960
peer
-005
8194
0, v
ersi
on 1
- 1
Apr 2
011
For Peer Review
31
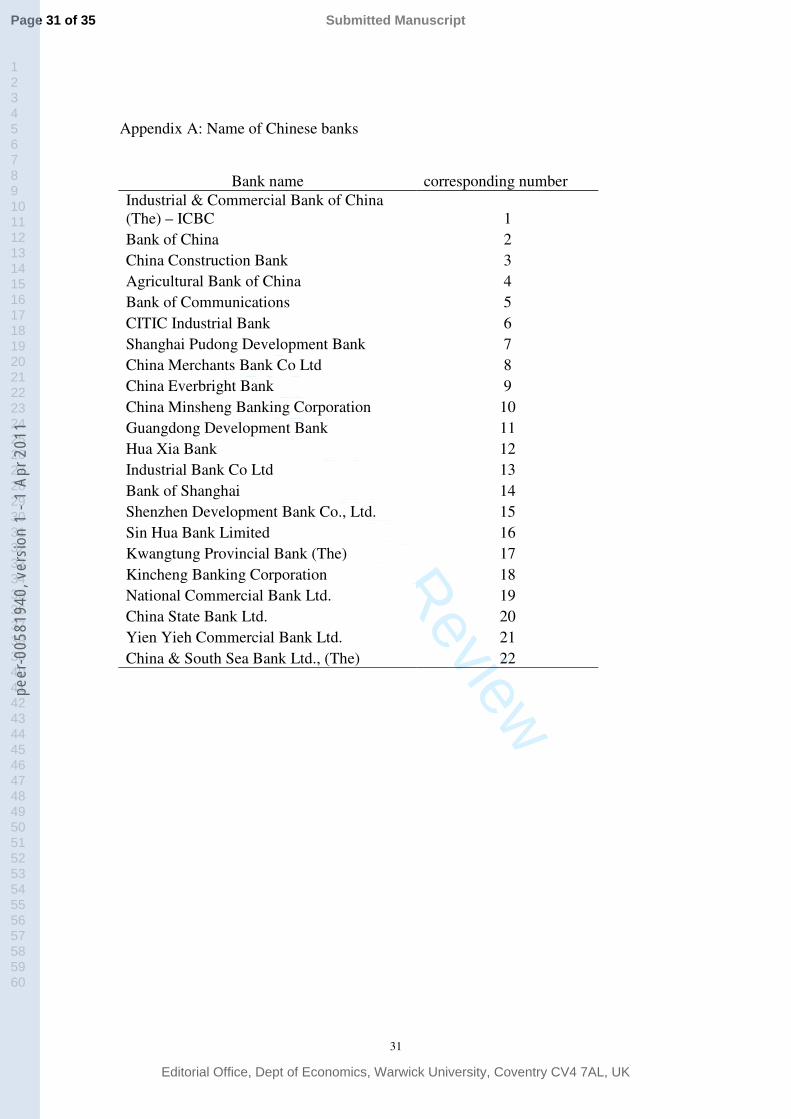
Appendix A: Name of Chinese banks
Bank name corresponding numberIndustrial & Commercial Bank of China (The) – ICBC 1Bank of China 2China Construction Bank 3Agricultural Bank of China 4Bank of Communications 5CITIC Industrial Bank 6Shanghai Pudong Development Bank 7China Merchants Bank Co Ltd 8China Everbright Bank 9China Minsheng Banking Corporation 10 Guangdong Development Bank 11Hua Xia Bank 12Industrial Bank Co Ltd 13Bank of Shanghai 14Shenzhen Development Bank Co., Ltd. 15Sin Hua Bank Limited 16Kwangtung Provincial Bank (The) 17Kincheng Banking Corporation 18National Commercial Bank Ltd. 19China State Bank Ltd. 20Yien Yieh Commercial Bank Ltd. 21China & South Sea Bank Ltd., (The) 22
Page 31 of 35
Editorial Office, Dept of Economics, Warwick University, Coventry CV4 7AL, UK
Submitted Manuscript
123456789101112131415161718192021222324252627282930313233343536373839404142434445464748495051525354555657585960
peer
-005
8194
0, v
ersi
on 1
- 1
Apr 2
011
For Peer Review
32
References:
Aigner, D., Lovell, C. A. K. and Schmidt, P. (1977) Formulation and estimation of
stochastic frontier production models, Journal of Econometrics, 6, 21-37.
Ataullah, A., Cockerill, T., Lee, H (2004) Financial liberalization and bank efficiency:
a comparative analysis of India and Pakistan, Applied Economics, 36, 1915-24.
Bankscope, Data sources of over 2000 banks in all countries,
http://bankscope.bvdep.com.
Battese, G. E. and Coelli, T. J. (1995) A model for technical inefficiency effects in
stochastic frontier production function for panel data, Empirical Economics, 120,
325-332.
Bauer, P.W., Berger, A.N. and Humphrey, D.B. (1993) Efficiency and productive
growth in US banking, in Fried, H. O., Lovell, C. A. K. and Schmidt, S. S. (eds), The
measurement of productive efficiency: techniques and applications, Oxford University
Press: New York.
Berger, A.N and Humphrey, D.B. (1997) Efficiency of financial institutions:
international survey and directions for future research, European Journal of
Operational Research, 98, 175-212.
Casu, B., and Molyneux, P. (2003) A comparative study of efficiency in European
banking, Applied Economics, 35(17), 1865-76.
Charnes, A., Cooper, W. W. and Rhodes, E. (1978) Measuring the efficiency of decision
making units, European Journal of Operational Research, 6, 429-444.
Page 32 of 35
Editorial Office, Dept of Economics, Warwick University, Coventry CV4 7AL, UK
Submitted Manuscript
123456789101112131415161718192021222324252627282930313233343536373839404142434445464748495051525354555657585960
peer
-005
8194
0, v
ersi
on 1
- 1
Apr 2
011
For Peer Review
33
Coelli, T. (1992) A computer program for frontier production function estimation:
FRONTIER, version 2.0, Economics Letters, 39, 29-32.
Coelli, T. (1996), A Guide to FRONTIER Version 4.1: A computer program for
stochastic frontier production and cost function estimation, University of New England:
Centre for Efficiency and Productivity Analysis Working Paper No.7.
Dai, X. (2003) Developing China’s capital market and speeding up banking reform,
Journal of Chinese Economic and Business Studies, 1, 131-135.
Drake, L., Simper, R. (2002) X-efficiency and scale economies in policing: a
comparative study using the distribution free approach and DEA, Applied Economics,
34(15), 1859-70.
Elyasiani, E., Mehdian, S. (1995) The comparative efficiency performance of small and
large US commercial banks in the pre-deregulation and post-deregulation eras, Applied
Economics, 27(11), 1069-79.
Fare, R., Grosskopf, S., and Weber, W. L. (2004) The effect of risk-based capital
requirements on profit efficiency in banking, Applied Economics, 36 (15), 1731-43.
Favero, C.A., Papi, L. (1990) Technical efficiency and scale efficiency in the Italian
banking sector – a nonparametric approach, Applied Economics, 27(4), 385-95.
Ferrier, G.D.,and Lovell,C.A.K.(1990), ‘Measuring cost efficiency in banking:
econometric and linear programming evidence, Journal of Econometrics, 46, 229-245.
Girardone, S., Molyneux, P., and Garderer, E.P.M. (2004) Analyzing the determinants
of bank efficiency: the case of Italian banks, Applied Economics, 36, 215-27.
Page 33 of 35
Editorial Office, Dept of Economics, Warwick University, Coventry CV4 7AL, UK
Submitted Manuscript
123456789101112131415161718192021222324252627282930313233343536373839404142434445464748495051525354555657585960
peer
-005
8194
0, v
ersi
on 1
- 1
Apr 2
011
For Peer Review
34
Goddard, J., Molyneux, P. and Wilson, J. (2001) European banking, John Wiley &
Sons.
Hauner, D (2005) Explaining efficiency differences among large German and
Australian banks, Applied Economics, 37 (9), 969-80.
Huang, T.H., and Wang, M.H. (2004) Estimating of scale and scope economies in
multiproduct banking: evidence from the Fourier flexible functional form with panel
data, Applied Economics, 36(11), 1245-53.
Huang, Z. (2004) Is WTO accession an opportunity or challenge for Chinese state
commercial banks? MSc dissertation, Middlesex University.
Koch T. W. and MacDonald S. S. (2000) Bank management, 4th edition, Dryden Press.
Leibenstein, H. (1966) Allocative efficiency versus ‘X-efficiency’, American
Economic Review, 56, 392–415.
Lovell, C. A. K. (1993), Production frontiers and productive efficiency, in Fried, H. O.,
Lovell, C. A. K. and Schmidt, S. S. (eds), The measurement of productive efficiency:
techniques and applications, Oxford University Press, New York.
Meeusen, W. and van den Broeck, J. (1977) Efficiency estimation from Cobb-Douglas
production functions with composed Error, International Economic Review, 18,
435-444.
Molyneux, P., Altunbas, Y. and Gardener, E. (1996) Efficiency in European banking,
Chichester: John Wiley & Sons.
Page 34 of 35
Editorial Office, Dept of Economics, Warwick University, Coventry CV4 7AL, UK
Submitted Manuscript
123456789101112131415161718192021222324252627282930313233343536373839404142434445464748495051525354555657585960
peer
-005
8194
0, v
ersi
on 1
- 1
Apr 2
011

For Peer Review
35
People’s Daily (2004) One hundred foreign banks are allowed to do Renminbi business,
19 July, p1.
Reifschneider, D. and Stevenson, R. (1991) Systematic departures from the frontier: a
framework for the analysis of firm inefficiency, International Economics Review, 32,
715-723.
Saunders A. (1999) Financial institutions management, McGraw-Hill HE.
Sealey, C.W. and Lindley, J.T. (1977) Inputs, outputs and a theory of production and
cost at depository financial institutions, Journal of Finance, 32,1251-1266.
Shen, C. H. (2005) Cost efficiency and banking performances in a partial universal
banking system: application of the panel smooth threshold model, Applied Economics,
37 (9), 993-1009.
Wong, Y. C. R. and Wong M. L. S. (2001) Competition in China's domestic banking
industry, Cato Journal, 21(1), 19-41.
Yao, S. and Liu, Z. (1998) Determinants of grain production and technical efficiency in
China, Journal of Agricultural Economics, 49, 171-184.
Zheng, Jinghai, Xiaoxuan Liu, and Arne Bisgsten (2003) Efficiency, technical progress,
and best practice in Chinese state enterprises (1980-94), Journal of Comparative
Economics, 31 (1):134-52.
Page 35 of 35
Editorial Office, Dept of Economics, Warwick University, Coventry CV4 7AL, UK
Submitted Manuscript
123456789101112131415161718192021222324252627282930313233343536373839404142434445464748495051525354555657585960
peer
-005
8194
0, v
ersi
on 1
- 1
Apr 2
011
Related Documents


