WSDOT’s quarterly performance report on transportation systems, programs, and department management Quarter ending September 30, 2016 • Published November 2016 Roger Millar, Secretary of Transportation, PE, AICP 63 State-operated airports seeing wide scale improvements p. 13 WSDOT Aviation programs reaching new heights Safety in numbers p. 11 WSDOT analyzes transit safety records in the state Looking at buildings from the ground floor up How WSDOT is taking steps to maintain and preserve its aging facilities p. 16 15 YEARS

Welcome message from author
This document is posted to help you gain knowledge. Please leave a comment to let me know what you think about it! Share it to your friends and learn new things together.
Transcript
WSDOT’s quarterly performance report on transportation systems, programs, and department managementQuarter ending September 30, 2016 • Published November 2016 Roger Millar, Secretary of Transportation, PE, AICP
63
State-operated airports seeing wide scale improvements
p. 13
WSDOT Aviation programs reaching new heights
Safety in numbers
p. 11
WSDOT analyzes transit safety records in the state
Looking at buildings from the ground floor upHow WSDOT is taking steps to maintain and preserve its aging facilities
p. 1615 YEARS

2 | GNB Edition 63 – September 30, 2016 Table of Contents
Table of Contents63Navigating the Gray Notebook 3Statewide Transportation Policy Goals 4Moving Ahead for Progress in the 21st Century (MAP-21) 5Results WSDOT – Setting WSDOT’s Direction 7Results Washington 8Multimodal Asset Performance Dashboard 9SafetyPublic Transit Safety Annual Report 11PreservationAsset Management: Capital Facilities Annual Report 13Asset Management: Aviation Annual Report 16MobilityWSDOT Ferries Quarterly Update 20Rail: Amtrak Cascades Quarterly Update 22Incident Response Quarterly Update 242016 Corridor Capacity Report Executive Summary 26
EnvironmentWater Quality Annual Report 28Economic Vitality and Stewardship Construction Contracts Annual Report 31Lean Process Improvements Quarterly Update 33Capital Project Delivery Programs Quarterly Update 34 Current Legislative Evaluation and Accountability Program (LEAP) 36
Completed Projects 38 Watch List 40 Advertisement Record 41 Schedule and Budget Summaries 42 Original LEAP 43 Pre-existing Funds 45Gray Notebook Information Guide 47
PERFORMANCE HIGHLIGHTS reported for the quarter ending September 30, 2016
CONSTRUCTIONTHE ENGINEER’SESTIMATE INFY2016
CONTRACTS BELOW
WSDOT AWARDED
58.3%OF
ITS 95% GOAL
FOR REGISTRATION
WSDOT SURPASSED
6,519 WASHINGTON COMPLIANCE WITH
AIRCRAFT RENEWED
3transit-related fatalities occurred in Washington in 2015, showing no change in the total number of these fatalities from 2014
374construction projects have been completed with Nickel or Transportation Partnership Account funds
$22.7 millionin economic benefit was provided by WSDOT’s Incident Response teams clearing 15,102 incidents during the quarter
43 yearsaverage age of WSDOT’s 284 primary buildings; 35% of these structures are more than 51 years old
3new Lean improvement projects were launched by WSDOT during the quarter, bringing the total to 83
98%of WSDOT’s 2,002 stormwater management facilities were inspected in FY2016
On the cover: An Intercity Transit bus drives on the State Capitol Campus in Olympia.

GNB Edition 63 – September 30, 2016 | 3Navigating the Gray Notebook
Navigating the Gray Notebook 63
Travel Time has increased by seven minutes and 95% Reliable Travel Time by 13 minutes—indicating that traffic conditions have become much less predictable for this route. The second worst commute was a reverse commute, Bellevue to Seattle, SR 520 evening commute. Duration of congestion was four hours and 50 minutes, up 40 minutes from 2003. Another commute that shares the same route, Redmond to Seattle, SR 520 evening commute, turned out to be similarly bad, with a 45 minute increase in peak period duration to three hours and 55 minutes.”
While the 2006 edition provided performance analyses of delay, congestion, travel time analysis, lost throughput productivity and High Occupancy Vehicle lanes on state highways, WSDOT’s reporting on congestion was just getting started.
More recent editions of this earlier report have dramatically expanded the scope of what is measured to include multimodal transportation as well myriad of additional subjects. The new, recently published 2016 Corridor Capacity Report—which is no longer in the Gray Notebook and is a standalone publication—still reviews corridor-based congestion data, but the performance measures include in-depth analyses ranging from greenhouse gas emissions to drive alone, carpooling, bicycling and public transit commuting rates. See pp. 26-27.
WSDOT celebrates 15 years of the Gray Notebook Continuing WSDOT’s celebration marking 15 years of the Gray Notebook, editions published in 2016 include a look back to articles from 2001, 2006 and 2011 to provide insight on how the report, agency and state have changed since the Gray Notebook’s inception as Measures Markers and Mileposts in 2001.
WSDOT announces new Incident Response program and sees it flourishIn the September 2001 edition of Measures Markers and Mileposts, WSDOT announced a turning point in the evolution of what has become widely known as Incident Response.
“The Washington State Department of Transportation and the Washington State Patrol have agreed to begin a special operations initiative to help relieve freeway and highway traffic congestion created by non-recurring incidents. The organizations are working together on a plan that puts an emphasis on clearing accidents and reopening lanes, removing stalled vehicles, providing better traveler information and minimizing the effects of rush hour construction and maintenance work.”
In this edition, WSDOT reports that its Incident Response teams assisted at 15,102 incidents during the third quarter (July through September) of 2016. WSDOT’s assistance at incident scenes provided an estimated $22.7 million in economic benefits during the third quarter of 2016 by reducing the impacts of incidents on drivers. See pp. 24-25.
WSDOT expands congestion reporting to provide a multimodal perspectiveIn Measures, Markers and Mileposts edition 23 (published in September 2006) WSDOT’s annual travel time analysis determined that Bellevue-based worksite commutes were the worst in the state, noting, “The worst two commutes were going home from Bellevue. The worst route was Bellevue to Tukwila, I-405 evening commute, with five hours and 35 minutes in congestion duration; for four hours and 10 minutes of that period, average speeds fell below 35 mph (severe congestion). Since 2003, the Average
Statewide transportation policy goals
Laws enacted in 2007 established policy goals for transportation agencies in Washington (RCW 47.04.280). The six statewide transportation policy goals are:
� Safety: To provide for and improve the safety and security of transportation customers and the transportation system; � Preservation: To maintain, preserve, and extend the life and utility of prior investments in transportation systems and services; �Mobility (Congestion Relief): To improve the predictable movement of goods and people throughout Washington, including congestion relief and improved freight mobility; � Environment: To enhance Washington’s quality of life through transportation investments that promote energy conservation, enhance healthy communities, and protect the environment; � Economic Vitality: To promote and develop transportation systems that stimulate, support, and enhance the movement of people and goods to ensure a prosperous economy; and � Stewardship: To continuously improve the quality, effectiveness, and efficiency of the transportation system.
Return toTable of Contents

4 | GNB Edition 63 – September 30, 2016 Statewide Transportation Policy Goals
Statewide TransportationPolicy Goals63
Statewide policy goal/ WSDOT performance measure
Previous period
Current period Goal Goal met Five-year trend (unless noted)
Desired trend
SafetyRate of traffic fatalities per 100 million vehicle miles traveled statewide(Annual measure: calendar years 2014 & 2015)
0.80 0.951 <1.000.770
0.955
Rate of recordable incidents for every 100 full-time WSDOT workers (Annual measure: calendar years 2014 & 2015)
5.4 4.3 <5.0
PreservationPercentage of state highway pavement in fair or better condition by vehicle miles traveled(Annual measure: calendar years 2013 & 2014)
92.6% 93.3% > 90.0%91.900002
Percentage of state bridges in fair or better condition by bridge deck area(Annual measure: as reported for 2015 & 2016)
92.1% 91.2% > 90.0%91.099998
Mobility (Congestion Relief)Highways: Annual (weekday) vehicle hours of delay statewide relative to maximum throughput speeds2 (Annual measure: calendar years 2014 & 2015)
32.3 million N/A N/A N/A
30.900000
31.724999
32.549999
Highways: Average incident clearance times for all Incident Response program responses(Calendar quarterly measure: Q2 2016 & Q3 2016)
11.3 minutes
12.0 minutes N/A N/A
11.30
12.46
Ferries: Percentage of trips departing on time3
(Fiscal quarterly measure: year to year Q1 FY2016 & Q1 FY2017)91.1% 90.9% > 95%
90.400002
91.950002
Rail: Amtrak Cascades on-time performance4
(Annual measure: fiscal years 2015 & 2016)72.1% 74.8% > 80%
71.0
73.8
EnvironmentNumber of WSDOT stormwater management facilities constructed(Annual measure: fiscal years 2015 & 2016)
130 151 N/A N/A129.000000
155.999974
182.999949
209.999923
Not applicable
Cumulative number of WSDOT fish passage improvement projects constructed(Annual measure: calendar years 2014 & 2015)
291 301 N/A N/A257.0
279.5
302.0
StewardshipCumulative number of Nickel and TPA projects completed5 and percentage on time6
(Calendar quarterly measure: Q2 2016 & Q3 2016, trendline for percentage on time)
371/87%
374/87%
> 90% on time
86
88
Cumulative number of Nickel and TPA projects completed5 and percentage on budget6
(Calendar quarterly measure: Q2 2016 & Q3 2016, trendline for percentage on budget)
371/91%
374/92%
> 90% on budget
90
92
Variance of total project costs5 compared to budget expectations6
(Calendar quarterly measure: Q2 2016 & Q3 2016)
Under budget by 1.9%
Under budget by 2.2%
On or under
budget -2.2
Not applicable
Data source: WSDOT Office of Strategic Assessment and Performance Analysis.
Notes: N/A = not available: goal has not been set. Dash (—) = goal was not met in the reporting period. For the Economic Vitality Policy Goal, see p. 8 for Results Washington Goal 2: Prosperous Economy measures. 1 Traffic fatality data for 2015 is considered preliminary until January 1, 2017. 2 Compares actual travel time to travel time associated with “maximum throughput” (defined as 70-85% of the posted speeds), where the greatest number of vehicles occupy the highway at the same time. 3 WSDOT Ferries’ on-time departures include any trip recorded by automated tracking as leaving the terminal within 10 minutes of scheduled time. 4 Amtrak Cascades’ on-time performance includes any trip arriving within 10-15 minutes, depending on the route, of scheduled arrival time. 5 Construction projects only. 6 Budget and schedule expectations are defined in the last approved State Transportation Budget. See p. 34 for more information.
4.300000
4.933334
5.566668
(Five-quarter trend)
(Five-quarter trend)
(Five-quarter trend)
(Five-quarter trend)
Return toTable of
Contents

GNB Edition 63 – September 30, 2016 | 5MAP-21
Moving Ahead for Progress in the 21st Century (MAP-21) 63
Highway Safety Improvement Program – FINAL RULE Federal Register Vol. 79, No. 60
Rate of traffic fatalities per 100 million vehicle miles traveled (VMT) on all public roads
NoTo be
determined(TBD)
YesFinal
3/15/16Traffic fatality rates using the NHTSA4 methodology; see GNB 62, p. 13
Rate of serious traffic injuries per 100 million VMT on all public roads
No TBD YesFinal
3/15/16
WSDOT does not currently track the data or metrics for this measure as it is proposed in this Final Highway Safety Rule
Number of traffic fatalities on all public roads
No TBD YesFinal
3/15/16Traffic fatalities using the NHTSA4 methodology; see GNB 62, p. 10
Number of serious traffic injuries on all public roads
No TBD YesFinal
3/15/16Serious injuries using the NHTSA4 methodology; see GNB 62, p. 10
Number of non-motorized traffic fatalities and serious injuries
No TBD YesFinal
3/15/16
Non-motorized (pedestrian/bicyclist) fatalities and serious injuries using the NHTSA4 methodology; see GNB 61, p. 10
Rate of per capita traffic fatalities for drivers and pedestrians 65 or older
No TBD NoFinal
3/15/16
The rate of traffic fatalities for pedestrians (65 or older) is part of Washington’s Target Zero5 traffic safety campaign
Rate of fatalities on high-risk rural roads No TBD YesFinal
3/15/16Traffic fatality rates on high-risk rural roads as part of Target Zero5
Highway-railway crossing fatalities No TBD NoFinal
3/15/16Number of fatalities at highway-railway crossings
MAP-21 measures by program area
Federal threshold/
benchmark1
MAP-21 target2
WSDOT penalty3 (Yes/No)
Rule release
dateExisting WSDOT performance measures for this program area
WSDOT, partners working on MAP-21 safety targets WSDOT is currently working with partners to set Moving Ahead for Progress in the 21st Century (MAP-21) goals for the final safety rule, which became effective April 14, 2016. WSDOT has 12 months from the effective date to develop performance targets for each of the new nationally-established performance measures and report those to the Federal Highway Administration (FHWA). Following the initial 12 months given to state departments of transportation (DOTs), affected Municipal Planning Organizations (MPOs) will have an additional six months to adopt the states’ targets or establish their own performance targets.
This is the first time all state DOTs and MPOs are required to track and report performance data using a national framework of consistent performance measures. State DOTs have been encouraged to coordinate with MPOs to establish consistent targets, to the maximum extent practicable. WSDOT must report its targets and the most recent five years of data on the measures in
the annual Highway Safety Improvement Plan report that is due April 14, 2017, and each following year. In order to avoid penalties, WSDOT must meet (or be making significant progress to meet) performance targets set for four out of the five measures. Significant progress is defined under 23 U.S.C. 148(i).
Fatalities on all public roads see increases2011 through 2015; Washington state
2011 2012 2013 2014 2015
Traffic Fatalities
Number of fatalities 454 438 436 462 567
Fatality rate (per 100 million VMT1)
0.80 0.77 0.76 0.80 0.95
Traffic Serious Injuries
Number of serious injuries
2,136 2,200 1,917 2,006 2,072
Serious injury rate (per 100 million VMT1)
3.75 3.89 3.35 3.46 3.52
Bicyclist/Pedestrian Fatalities and Serious Injuries
Number of fatalities and serious injuries
481 534 403 493 494
Data source: Washington Traffic Safety Commission, Fatality Analysis Reporting System, WSDOT Transportation Data and GIS Office.
Notes: Data for 2015 is preliminary until January 2017. 1 VMT = Vehicle miles traveled.
Continued on p. 6
Return toTable of Contents

6 | GNB Edition 63 – September 30, 2016 MAP-21
�A description of the state department of transportation’s progress in achieving performance targets; and,
�A description of the ways in which the state department of transportation is addressing congestion at freight bottlenecks.
For additional information on WSDOT’s Initial State Performance Report and how it ties into MAP-21, visit www.wsdot.wa.gov/Accountability/MAP-21.
MAP-21 measures by program area
Federal threshold/
benchmark1
MAP-21 target2
WSDOT penalty3 (Yes/No)
Rule release
dateExisting WSDOT performance measures for this program area
Combined Draft Rule – Notice for Proposed Rule Making (NPRM) Federal Register Vol. 81, No. 78
- System Performance (Congestion)
Percent of the Interstate System providing for reliable travel
No TBD NoDraft
4/22/16
WSDOT does not currently track the specific data or metrics for this measure as it is proposed in this NPRM
Percent of the non-Interstate National Highway System (NHS) providing for reliable travel
No TBD NoDraft
4/22/16
WSDOT does not currently track the specific data or metrics for this measure as it is proposed in this NPRM
Percent of the Interstate System where peak hour travel times meet expectations
No TBD NoDraft
4/22/16
WSDOT does not currently track the specific data or metrics for this measure as it is proposed in this NPRM
Percent of the non-Interstate NHS where peak hour travel times meet expectations
No TBD NoDraft
4/22/16
WSDOT does not currently track the specific data or metrics for this measure as it is proposed in this NPRM
- National Freight Movement Program
Percent of the Interstate System mileage providing for reliable truck travel time
No TBD NoDraft
4/22/16
WSDOT does not currently track the specific data or metrics for this measure as it is proposed in this NPRM
Percent of the Interstate System mileage uncongested
No TBD NoDraft
4/22/16
WSDOT does not currently track the specific data or metrics for this measure as it is proposed in this NPRM
- Congestion Mitigation and Air Quality Program
Annual hours of excessive delay per capita
No TBD TBDDraft
4/22/16
WSDOT does not currently track the specific data or metrics for this measure as it is proposed in this NPRM
Two- and four-year total emission reductions for each applicable criteria pollutant and precursor
No TBD TBDDraft
4/22/16No existing performance measure for criteria pollutants
National Highway Performance Program – Notice for Proposed Rule Making Federal Register Vol. 80, No. 2
National Highway System interstate pavement in good and poor condition
% of interstate pavement lane
miles in poor condition not to
exceed 5%
TBD YesDraft
1/5/15
See GNB 60, p. 19 for an update on MAP-21 implications for pavement. On February 20, 2015, the Asset Management Plan draft rule was released which is linked to the draft rule for pavement and bridge performance measures.
National Highway System bridges classified in good and poor condition
% of SD6 bridges not to exceed
10%TBD Yes
Draft1/5/15
Several measures of bridge condition including good/fair/poor condition rating and structural deficiency rating; see GNB 62, p. 14
Data source: WSDOT Office of Strategic Assessment and Performance Analysis.
Notes: 1 Minimum threshold or benchmark to be established by the U.S. Department of Transportation, Secretary of Transportation. 2 Performance targets to be set for each performance measure by WSDOT in coordination with Metropolitan Planning Organizations (MPOs) statewide. 3 Penalties apply for some measures if WSDOT or the MPO does not attain the target within a given time frame. Penalties apply only to WSDOT and include minimum allocations of federal funding toward programs to progress toward the desired target. 4 NHTSA = National Highway Traffic Safety Administration. 5 Washington state’s strategic highway safety plan. 6 SD = structurally deficient.
WSDOT submits Initial State Performance ReportWSDOT submitted its Initial State Performance Report to the Federal Highway Administration (FHWA) in September 2016. The report highlights the agency’s current efforts to address or provide information in the following areas:
�The condition/performance of the National Highway System (NHS) in the state;
�The effectiveness of the investment strategy document in the State Asset Management plan for the NHS;
GNB Edition 63 – September 30, 2016 | 7Results WSDOT
Results WSDOT –Setting WSDOT’s Direction 63
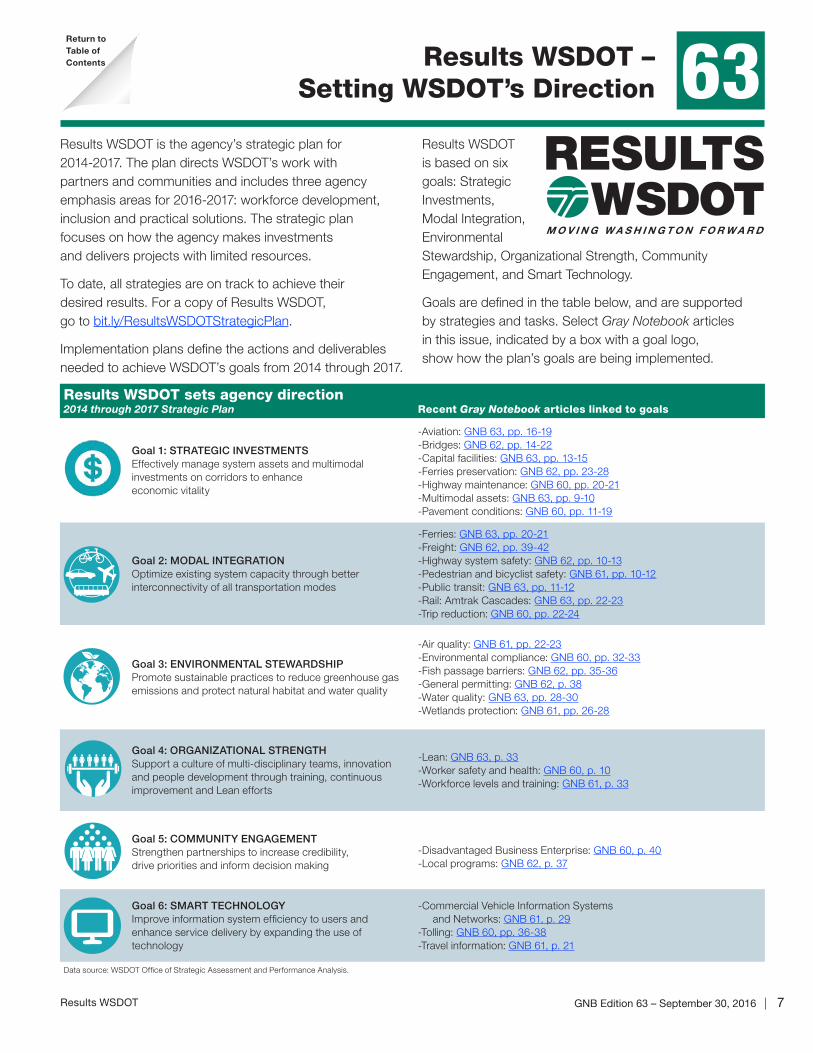
Results WSDOT is the agency’s strategic plan for 2014-2017. The plan directs WSDOT’s work with partners and communities and includes three agency emphasis areas for 2016-2017: workforce development, inclusion and practical solutions. The strategic plan focuses on how the agency makes investments and delivers projects with limited resources.
To date, all strategies are on track to achieve their desired results. For a copy of Results WSDOT, go to bit.ly/ResultsWSDOTStrategicPlan.
Implementation plans define the actions and deliverables needed to achieve WSDOT’s goals from 2014 through 2017.
Results WSDOT is based on six goals: Strategic Investments, Modal Integration, Environmental Stewardship, Organizational Strength, Community Engagement, and Smart Technology.
Goals are defined in the table below, and are supported by strategies and tasks. Select Gray Notebook articles in this issue, indicated by a box with a goal logo, show how the plan’s goals are being implemented.
Results WSDOT sets agency direction 2014 through 2017 Strategic Plan Recent Gray Notebook articles linked to goals
Goal 1: STRATEGIC INVESTMENTSEffectively manage system assets and multimodal investments on corridors to enhance economic vitality
-Aviation: GNB 63, pp. 16-19-Bridges: GNB 62, pp. 14-22-Capital facilities: GNB 63, pp. 13-15-Ferries preservation: GNB 62, pp. 23-28-Highway maintenance: GNB 60, pp. 20-21-Multimodal assets: GNB 63, pp. 9-10-Pavement conditions: GNB 60, pp. 11-19
Goal 2: MODAL INTEGRATIONOptimize existing system capacity through better interconnectivity of all transportation modes
-Ferries: GNB 63, pp. 20-21-Freight: GNB 62, pp. 39-42-Highway system safety: GNB 62, pp. 10-13-Pedestrian and bicyclist safety: GNB 61, pp. 10-12 -Public transit: GNB 63, pp. 11-12-Rail: Amtrak Cascades: GNB 63, pp. 22-23-Trip reduction: GNB 60, pp. 22-24
Goal 3: ENVIRONMENTAL STEWARDSHIPPromote sustainable practices to reduce greenhouse gas emissions and protect natural habitat and water quality
-Air quality: GNB 61, pp. 22-23-Environmental compliance: GNB 60, pp. 32-33-Fish passage barriers: GNB 62, pp. 35-36-General permitting: GNB 62, p. 38-Water quality: GNB 63, pp. 28-30-Wetlands protection: GNB 61, pp. 26-28
Goal 4: ORGANIZATIONAL STRENGTHSupport a culture of multi-disciplinary teams, innovation and people development through training, continuous improvement and Lean efforts
-Lean: GNB 63, p. 33-Worker safety and health: GNB 60, p. 10-Workforce levels and training: GNB 61, p. 33
Goal 5: COMMUNITY ENGAGEMENTStrengthen partnerships to increase credibility, drive priorities and inform decision making
-Disadvantaged Business Enterprise: GNB 60, p. 40-Local programs: GNB 62, p. 37
Goal 6: SMART TECHNOLOGYImprove information system efficiency to users and enhance service delivery by expanding the use of technology
-Commercial Vehicle Information Systems and Networks: GNB 61, p. 29-Tolling: GNB 60, pp. 36-38-Travel information: GNB 61, p. 21
Data source: WSDOT Office of Strategic Assessment and Performance Analysis.
Return toTable of Contents

8 | GNB Edition 63 – September 30, 2016 Results Washington
Results Washington63
Results Washington, the state’s performance management system, outlines Gov. Jay Inslee’s priorities. This strategic framework sets
the state’s vision and mission, as well as the foundational expectations for state agencies to achieve goals collaboratively. Results
Washington has five focus areas: World Class Education; Prosperous Economy; Sustainable Energy and a Clean Environment; Healthy
and Safe Communities; and Efficient, Effective and Accountable Government. For more information, visit http://www.results.wa.gov/.
Results Washington measures by goal area1Previous
periodCurrent
periodOn
target2
Current trend
Desired trend
Annual measures for which WSDOT is the lead agency
Goal 2: Prosperous EconomyBased on current funding levels, maintain the percent of Washington infrastructure assets in satisfactory condition at 2013 baseline levels through 2020 (2013 & 2014)
86%3 85% No Based on current funding levels, control the percent of state and local bridges4 in poor condition from increasing over 10% by 2017 (Fiscal years 2015 & 2016)
8.8% 9.3% Yes Based on current funding levels, control the percent of state and local pavement4 in poor condition from increasing over 10% by 2017 (2013 & 2014)
6.0% 6.0%3 Yes
Based on current funding levels, control the percent of ferry terminal systems that are past due for replacement from increasing over 6% by 2020 (Fiscal years 2015 & 2016)
3.7% 5.4%3 Yes Based on current funding levels, control the percent of ferry vessel systems that are past due for replacement from increasing over 10% by 2020 (Fiscal years 2015 & 2016)
8.3% 10.9% No Maintain percentage of transit fleet that exceeds the Federal Transit Administration’s minimum useful life at 25% or below through 2020 (2014 & 2015)
37.3%5 34.6%5 No Increase the percentage of Washingtonians using alternative transportation commute methods to 29% by 2020 (2014 & 2015)
27.6% 27.6% No
Ensure travel and freight reliability (impacted by economic growth) on strategic corridors does not deteriorate beyond 5% from 2012 levels through 2017 (2014 & 2015)
6.6% 8.1% No Operate strategic corridors at 90% efficiency or higher through 2017 (2014 & 2015) 94.6% 93.4% Yes Reduce the number of pedestrian and bicyclist fatalities on public roadways from 84 in 2012 to zero in 2030 (2014 & 2015)
853 1006 No Annual measures for which WSDOT is not the lead agency, but has an interest
Goal 2: Prosperous EconomyIncrease state agency and educational institution utilization of state-certified small businesses in public works and other contracting and procurement by 2017 to: Minority-owned businesses, 10%; Women-owned businesses, 6%; Veteran-owned businesses, 5%
Measure is under development. Expected to report in December 2016
Goal 3: Sustainable Energy and a Clean EnvironmentReduce transportation related greenhouse gas emissions from 44.9 million metric tons/year (projected 2020) to 37.5 million metric tons/year (1990) by 2020 (2012 & 2013)
42.4 40.43 Yes Reduce the average emissions of greenhouse gases for each vehicle mile traveled in Washington by 25% from 1.15 pounds in 2010 to 0.85 pounds by 2020 (2012 & 2013)
1.113 1.11 No
Increase the average miles traveled per gallon of fuel for Washington’s overall passenger and light duty truck fleet (private and public) from 19.2 mpg in 2010 to 23 mpg in 2020 (2013 & 2014) 20.2 20.6 No Increase the number of plug-in electric vehicles registered in Washington from approximately 8,000 in 2013 to 50,000 by 2020 (2014 & 2015) 12,351 16,529 No
Increase miles of stream habitat opened from 350 to 450 (per year) by 2016 (2014 & 2015)7 5993 365 No Increase number of fish passage barriers corrected per year from 375 to 500 by 2016 (2014 & 2015)7
4243 479 No Goal 4: Healthy and Safe Communities
Decrease number of traffic-related fatalities on all roads from 454 in 2011 to zero in 2030(2014 & 2015) 462 5676 No Data sources: WSDOT Office of Strategic Assessment and Performance Analysis and Results Washington’s Open Performance Program.Notes: 1 In addition to the measures listed in the table, WSDOT contributes performance information that is combined and reported with data from all state agencies in Goal 5: Efficient, Effective and Accountable Government. 2 “On target” is defined as currently meeting the goal or making enough progress to meet the goal by the target date. Some measures may be trending in the desired direction but are not on track. 3 Data has been corrected from previous Gray Notebook editions. 4 This measures assets on the National Highway System. 5 Values differ from previous editions. To better align with the FTA, WSDOT has updated its method for calculating useful life; it is now based on age or mileage instead of just age. 6 Data is preliminary. 7 Includes work completed by all state agencies.
Return toTable of
Contents

GNB Edition 63 – September 30, 2016 | 9Multimodal Asset Performance Dashboard
Multimodal Asset Performance Dashboard 63
WSDOT performance measurePrevious
periodCurrent
period Goal Goal met Five-year trend (unless noted)Desired
trend
Highway Assets Bridges
Percentage of state bridges in fair or bettercondition by bridge deck area(Calendar years 2015 & 2016, GNB 62, p. 14)
92.1% 91.2% ≥90.0%
Number of state bridgesload restricted or load posted(Fiscal years 2015 & 2016, GNB 62, p. 18)
120 126 N/A
Current steel bridge painting backlog;Millions of dollars(Fiscal years 2015 & 2016, GNB 62, p. 20)
$394.0 $414.5 N/A
Steel bridge projected 10-yearpainting backlog; Millions of dollars(Fiscal years 2015-2025 & 2016-2026, GNB 62, p. 20)
$684.0 $706.6 N/A
Current state bridge deck area due or past duefor replacement; Millions of dollars(Fiscal years 2015 & 2016, GNB 62, p. 19)
$70.8 $115.6 N/A
State bridge projected 10-year deck area due or past due for replacement; Millions of dollars(Fiscal years 2015-2025 & 2016-2026, GNB 62, p. 19)
$71.5 $726.51 N/A
Structurally deficient state NHS bridges; Percentage of deck area (MAP-21 proposed criteria)(Fiscal years 2015 & 2016, GNB 62, p. 15)
8.8% 9.3% ≤10.0%
PavementPercentage of state highway pavement2
in fair or better condition; (Calendar years 2013 & 2014, GNB 60, p. 11)
92.6% 93.3% >90.0%
Highway Pavement Asset Sustainability Ratio;Long term service replenishment rate3
(Calendar years 2013 & 2014, GNB 60, p. 11)
65% 53% >90.0%
Highway Pavement Deferred Preservation Liability (backlog); Millions of dollars(Calendar years 2013 & 2014, GNB 60, p. 11)
$391 $351 $0
Highway Pavement Remaining Service Life aspercentage of total useful life(Calendar years 2013 & 2014, GNB 60, p. 11)
46.1% 46.9% 45%-55%
Percentage of lane miles of interstate pavement in poor condition (MAP-21 proposed criteria)(Calendar years 2014 & 2015)
3.9% 4.0% ≤5.0%
Safety Rest AreasSafety rest area score4 through theMaintenance Accountability Process(Calendar years 2014 & 2015, GNB 61, p. 13)
B B B
Total visitors at safety rest areas;Millions of visitors(Calendar years 2014 & 2015, GNB 61, p. 13)
22.5 23.1 N/A N/A
Highway MaintenancePercentage of funded maintenance condition targets achieved5;(Calendar years 2014 & 2015, GNB 60, p. 20)
79% 85% 100%
(Two-year trend)
(Two-year trend)
(Four-year trend)
53.5 million square feet of bridge deck
18,680 lane miles of pavement
47 safety rest areas
Continued on p. 10
(Two-year trend)
Return toTable of Contents
10 | GNB Edition 63 – September 30, 2016 Multimodal Asset Performance Dashboard
(Three-year trend)
(Three-year trend)
(Three-year trend)
(Three-year trend)
WSDOT performance measurePrevious
periodCurrent
period Goal Goal met Five-year trend (unless noted)Desired
trend
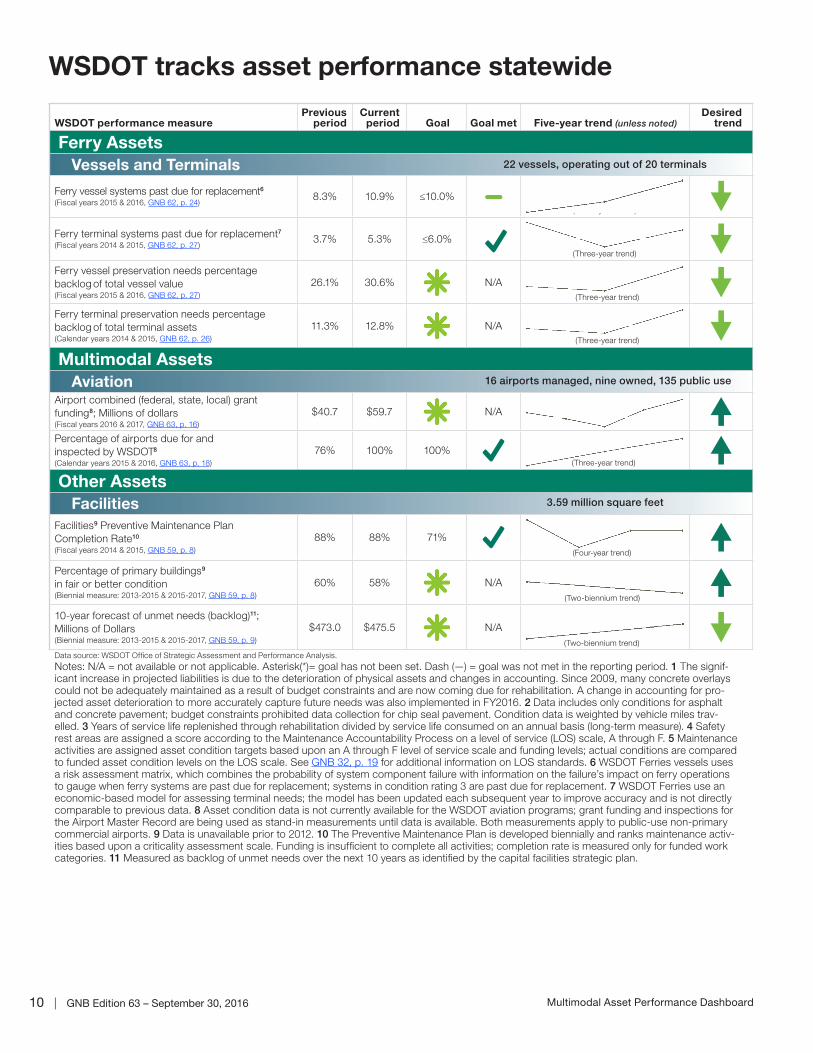
Ferry Assets Vessels and Terminals
Ferry vessel systems past due for replacement6
(Fiscal years 2015 & 2016, GNB 62, p. 24)8.3% 10.9% ≤10.0%
Ferry terminal systems past due for replacement7
(Fiscal years 2014 & 2015, GNB 62, p. 27)3.7% 5.3% ≤6.0%
Ferry vessel preservation needs percentage backlog of total vessel value(Fiscal years 2015 & 2016, GNB 62, p. 27)
26.1% 30.6% N/A
Ferry terminal preservation needs percentage backlog of total terminal assets(Calendar years 2014 & 2015, GNB 62, p. 26)
11.3% 12.8% N/A
Multimodal Assets Aviation
Airport combined (federal, state, local) grant funding8; Millions of dollars(Fiscal years 2016 & 2017, GNB 63, p. 16)
$40.7 $59.7 N/A
Percentage of airports due for andinspected by WSDOT8
(Calendar years 2015 & 2016, GNB 63, p. 18)
76% 100% 100%
Other Assets Facilities
Facilities9 Preventive Maintenance Plan Completion Rate10
(Fiscal years 2014 & 2015, GNB 59, p. 8)
88% 88% 71%
Percentage of primary buildings9
in fair or better condition(Biennial measure: 2013-2015 & 2015-2017, GNB 59, p. 8)
60% 58% N/A
10-year forecast of unmet needs (backlog)11;Millions of Dollars(Biennial measure: 2013-2015 & 2015-2017, GNB 59, p. 9)
$473.0 $475.5 N/A
Data source: WSDOT Office of Strategic Assessment and Performance Analysis.
Notes: N/A = not available or not applicable. Asterisk(*)= goal has not been set. Dash (—) = goal was not met in the reporting period. 1 The signif-icant increase in projected liabilities is due to the deterioration of physical assets and changes in accounting. Since 2009, many concrete overlays could not be adequately maintained as a result of budget constraints and are now coming due for rehabilitation. A change in accounting for pro-jected asset deterioration to more accurately capture future needs was also implemented in FY2016. 2 Data includes only conditions for asphalt and concrete pavement; budget constraints prohibited data collection for chip seal pavement. Condition data is weighted by vehicle miles trav-elled. 3 Years of service life replenished through rehabilitation divided by service life consumed on an annual basis (long-term measure). 4 Safety rest areas are assigned a score according to the Maintenance Accountability Process on a level of service (LOS) scale, A through F. 5 Maintenance activities are assigned asset condition targets based upon an A through F level of service scale and funding levels; actual conditions are compared to funded asset condition levels on the LOS scale. See GNB 32, p. 19 for additional information on LOS standards. 6 WSDOT Ferries vessels uses a risk assessment matrix, which combines the probability of system component failure with information on the failure’s impact on ferry operations to gauge when ferry systems are past due for replacement; systems in condition rating 3 are past due for replacement. 7 WSDOT Ferries use an economic-based model for assessing terminal needs; the model has been updated each subsequent year to improve accuracy and is not directly comparable to previous data. 8 Asset condition data is not currently available for the WSDOT aviation programs; grant funding and inspections for the Airport Master Record are being used as stand-in measurements until data is available. Both measurements apply to public-use non-primary commercial airports. 9 Data is unavailable prior to 2012. 10 The Preventive Maintenance Plan is developed biennially and ranks maintenance activ-ities based upon a criticality assessment scale. Funding is insufficient to complete all activities; completion rate is measured only for funded work categories. 11 Measured as backlog of unmet needs over the next 10 years as identified by the capital facilities strategic plan.
(Three-year trend)
(Four-year trend)
(Two-biennium trend)
(Two-biennium trend)
3.59 million square feet
16 airports managed, nine owned, 135 public use
22 vessels, operating out of 20 terminals
WSDOT tracks asset performance statewide

GNB Edition 63 – September 30, 2016 | 11Strategic goal: Safety – Public Transit
Public Transit SafetyAnnual Report 63
occurred. For reporting purposes, incidents are categorized as collision, derailment, fire, security (such as a bomb threat, theft or assault) or not otherwise classified (NOC). NOCs, which can include slips, trips and falls, electric shocks, vehicles leaving the roadway and train derailments in a rail yard, accounted for 61% (167) of incidents in 2015. The remaining incidents were 93 collisions (34%), 12 fires (4%), and two security events (1%); no derailments were reported. Some rural transit agency data is not included in these calculations; see p. 12 for more information on transit reporting requirements.
WSDOT administers three transit safety programs statewideWSDOT administers three different statewide transit safety and compliance oversight programs to promote safe public transportation services throughout the state. The State Safety Oversight, Transit Asset Management, and Drug and Alcohol Policy programs ensure Washington’s 31 transit agencies provide public transportation systems that are safe for passengers, employees and the communities they serve.
No change in transit-related fatalities in 2015There were three transit-related fatalities in Washington state across all modes (including bus, light rail, trolley bus and vanpool) in 2015, the same as in 2014. The fatality rate in 2015 was 0.01 per million unlinked passenger trips (UPT; the number of boardings on transit vehicles), showing no change from 2014 (see graph below). UPT decreased from 218.1 million in 2014 to 217.3 million in 2015.
Injuries on transit increased by 26%—from 234 in 2014 to 295 in 2015. Of the 295 injuries in 2015, 220 (75%) involved passengers either on, waiting for or exiting a transit vehicle (see graph at right). The injury rate was 1.36 per million UPT in 2015, a 26% increase from the 2014 injury rate of 1.07.
There were 274 incidents involving transit in 2015, a 21% increase from the 227 incidents reported in 2014. The number of transit-related incidents has shown a five-year decrease of nearly 6% since 2011, when 290 incidents
Notable results � Washington had three transit-related fatalities
in 2015, showing no change from the number of fatalities in 2014
� There was a 26% increase in reported injuries on Washington’s transit systems, from 234 in 2014 to 295 in 2015
� There were 274 transit incidents in 2015, a 21% increase from the 227 events reported in 2014
� WSDOT helps Washington’s 31 transit agencies comply with federal and state rules and requirements
Data source: WSDOT Public Transportation and the National Transit Database.
Notes: Percentages may not add to 100 due to rounding. 1 Includes injuries reported to the Federal Transit Administration; injury types are not specified. 2 “Other” includes trespassing, suicide and persons not otherwise specified.
Pedestrians/Bicyclists17 (6%)
Passengers on atransit vehicle 143 (49%)
Employees 15 (5%)
Other vehicleoccupants42 (14%)
Transit agenciesreport
295 total injuries 2015
Other1 (0%)
2
1
Passengers waiting for or leaving transit 77 (26%)
Transit-related injuries increase by 26%, fatalities remain the same from 2014 to 2015 in Washington2011 through 2015; Number of injuries and fatalities; Rate of injuries and fatalities per million unlinked passenger trips1
Data source: WSDOT Public Transportation and the National Transit Database.
Note: 1 Unlinked passenger trips (UPT) refers to the number of passenger boardings on transit vehicles.
0
50
100
150
200
250
300
0.00
0.25
0.50
0.75
1.00
1.25
1.50
20152014201320122011
Injuries
Fatalities
Fatalityrate
Injuryrate
Number Rate
Return toTable of Contents

12 | GNB Edition 63 – September 30, 2016 Strategic goal: Safety – Public Transit
WSDOT assists transit agencies with federal regulationsState Safety Oversight programWSDOT’s State Safety Oversight (SSO) program, established in response to a Federal Transit Administration (FTA) rule, ensures that rail transit agencies in Washington design, construct and operate safe and secure transit systems while remaining compliant with federal and state regulations. Washington state has four transit services that fall within the SSO program: Seattle’s Link light rail, the Seattle Streetcar, Seattle Center Monorail and the Tacoma Link light rail.
The SSO program’s primary focus is on the FTA requirement for rail transit agencies to develop and implement a comprehensive safety and security program. WSDOT submits annual reports to the FTA that include accident data, corrective action plans (CAPs) and updates to an agency’s comprehensive safety and security plan. WSDOT maintains a monthly tracking log of CAPs to monitor progress on tasks that address specific improvement opportunities.
The SSO program is required to conduct investigations of incidents that involve a fatality, multiple injuries, a collision at an intersection or grade crossing, a mainline derailment, an evacuation for life safety reasons, or damage in excess of $25,000. The program’s goal is to eliminate or mitigate the hazards or deficiencies that caused the incident.
Transit Asset Management programAs part of the Moving Ahead for Progress in the 21st Century Act (see pp. 5-6), the FTA adopted Transit Asset Management (TAM) rules and processes with the aim of improving safety and increasing service reliability and performance for public transportation providers. TAM is a model that uses assets’ conditions and performance to guide prioritization of transit system funding to maintain an overall state of good repair. Transit assets are defined as rolling stock (vehicles), facilities, infrastructure and equipment.
Federal and state codes require WSDOT to ensure Washington’s transit agencies are in compliance with these federal and state asset management rules. Transit agencies that receive federal financial assistance and own, operate or manage transit capital assets for public transportation are required to develop and implement a TAM plan. Agencies must provide this plan for WSDOT’s review and approval and provide regular updates on the status of their assets. For more information, visit bit.ly/MAP21TAM.
Drug and Alcohol Policy programWSDOT provides technical assistance in the form of training, networking and policy development to transit agencies receiving federal grants from the FTA that require drug abuse and alcohol misuse testing for safety-sensitive employees, such as vehicle operators, dispatch staff and maintenance crews. When an agency receives a grant, WSDOT requires the agency to submit their policies and procedures for review and approval. WSDOT conducts regular on-site reviews of transit agencies to ensure compliance with federal drug and alcohol program requirements. WSDOT has conducted 16 of the 21 site reviews scheduled for 2016 and is on track to complete the remaining five by December 20, 2016.
Contributors include Mike Flood, Robert Gibson, Debbie Ruggles, Hiep Tran, Helen Goldstein and Tricia Hasan
Reporting to the Federal Transit AdministrationWashington state has 31 transit agencies that provide public transportation services. Transit agencies receiving federal grants from the Federal Transit Administration (FTA) are required to report safety data to the FTA on an annual basis for all modes of transit provided, including bus, light rail, trolley bus, and vanpool. Agencies that operate 30 or fewer transit vehicles can submit a Small Systems Waiver for reduced reporting requirements (this does not pertain to MAP-21 Transit Asset Management rules and regulations). Agencies that do not receive federal grants may choose to voluntarily report data to the FTA.
Transit agencies report the numbers of fatalities and injuries by person type (passengers, employees, other vehicle occupants, pedestrians/bicyclists and other) for each transit mode. Additionally, transit agencies submit data to the FTA on incident events, which are categorized into five types: collision, derailment, fire, security and not otherwise classified.
Strategic Plan Goal 2: MODAL INTEGRATIONMultimodal Safety Strategy – Align multimodal
safety policy-making across the agency.
In support of this strategy, WSDOT has created modal safety reports that have been integrated into the Gray Notebook. The inclusion of this Public Transit Safety report completes the list of modes represented in this effort: pedestrians and bicyclists, ferry passengers, aviation passengers, rail passengers and highway system users.

GNB Edition 63 – September 30, 2016 | 13Strategic goal: Preservation – Capital Facilities
Asset Management:Capital Facilities Annual Report 63
Of the 98 primary buildings that are 51 years or older, 16 were 80 years or older as of September 2016.
Connecting Washington funds two new regional headquartersThe 2015 Connecting Washington funding package will invest $16 billion in Washington’s multimodal transportation system over the next 16 years. Two capital facilities projects are included in the funding package and address high-priority facility replacements.
North Central Region headquartersWSDOT is in the final planning stages for construction of a new North Central Region administration building on Euclid Avenue in Wenatchee. The Legislature authorized $10 million for the 2015-2017 biennium and $2 million for the 2017-2019 biennium for this project. The project contract was awarded in October 2016 with a scheduled completion date in spring 2018.
The project will construct a new regional headquarters to house both administrative and project engineering staff and will replace two existing buildings—the Wenatchee Avenue Administration Building built in 1936 and the modular Euclid Avenue Project Engineering Office built in 1984 , which was originally intended to be temporary. For more information on the project, visit: bit.ly/NCRheadquarters.
Olympic Region headquartersThe current Olympic Region headquarters in Tumwater was built in 1938 to serve regional maintenance and administrative functions. The site cannot accommodate newer equipment and vehicles, and no longer supports modern transportation operations in the region.
The new Olympic Region headquarters will be constructed on Marvin Road in Lacey and will be designed to meet new guidance for state-owned buildings. It will meet or exceed LEED standards, an environmental building certification program. For more information, see www.usgbc.org/LEED.
WSDOT’s primary buildings 43 years old on averageOut of its inventory of nearly 1,300 buildings and structures, WSDOT owned 284 buildings that are 2,000 square feet or larger as of September 2016. WSDOT categorizes structures of this size as primary buildings, and they support the majority of agency staff. Primary buildings represent approximately 21% of WSDOT capital facilities and 63% of total building area by square footage.
The average age of WSDOT’s 284 primary buildings is 43 years old. Less than one-third of the primary building inventory (30%) is 25 years old or less, and 36% of primary buildings fall in the 26-50 years old category. Primary buildings 51 years or older increased to 35% of WSDOT’s inventory after seven buildings transitioned into the category during 2016:
�Everett signals/bridge office
�Preston storage building
�Lakeview vehicle storage building
�Morton salt storage building
�Morton vehicle storage building
�Washougal office/vehicle storage building
�Copalis storage building
Approximately one-third of WSDOT’s primary buildings are more than a half-century oldNumber of WSDOT’s primary buildings by age as of September 2016 compared to September 2015
Building age Sept 20151 Sept 2016
25 years or less 83 (29%) 84 (30%)
26 to 50 years 109 (39%) 102 (36%)
51 years or older 91 (32%) 98 (35%)
Total 283 2842
Data source: WSDOT Capital Facilities Office.
Notes: Percentages may not add to 100 due to rounding. 1 Building age counts as of September 2015 have been updated from Gray Notebook 59. 2 Adding the new Northwest Region Traffic Management Center, which opened in October 2015, increased the number of primary buildings WSDOT owns from 283 to 284.
Notable results � WSDOT’s planned water and energy
improvements are expected to save over $1 million annually
� WSDOT-owned primary buildings have an average age of 43 years, and more than one-third are 51 years or older
Return toTable of Contents

14 | GNB Edition 63 – September 30, 2016 Strategic goal: Preservation – Capital Facilities
WSDOT works to reduce building energy useThe Legislature approved $4 million for the 2015-2017 biennium, with $21 million and $15 million expected in the next two biennia for the Olympic Region headquarters relocation. The project has a planned advertisement date for spring 2017 and is scheduled to be completed during winter 2020.
WSDOT slates $4.23 million for minor projects in the 2015-2017 bienniumProjects in support of ongoing preservation and repairs in WSDOT’s facilities have been allocated $4.23 million in the 2015-2017 biennium The table below provides examples of projects that have been funded in this biennium.
WSDOT updates program to improve facility condition trackingWSDOT implemented Facilities Inventory Condition Assessment Program (FICAP) software in 2016 to provide the most accurate facility condition data for both the preservation backlog (repair needs) and facility replacement while remaining cost-effective. Facility condition data is unavailable for 2016 because WSDOT is still testing the program to ensure consistent results throughout the state. The system is expected to be fully calibrated and deployed in time to generate reportable preservation backlog and condition assessments in summer 2017.
WSDOT investments in energy conservation reduce emissionsWSDOT reduced its estimated greenhouse gas emissions (GHGs) from stationary sources, which include building energy use and highway utilities, by 16% from approximately 55,520 metric tons of carbon dioxide equivalents (CO2e) in 2014 to 46,680 CO2e in 2015. WSDOT’s estimated GHG emissions from natural gas, fuel oil, propane and diesel decreased 4% from 2014 to 2015. Estimated GHG emissions from electricity decreased 17% during the same period. In addition to a change in fuel and electricity consumption, the Washington Department of Ecology updated the formulas for converting energy consumption to CO2e to better reflect current methodologies.
WSDOT is working with the Governor’s budget office at the Office of Financial Management on a potential
WSDOT facility minor repair and preservation projects funded for the 2015-2017 bienniumExamples of projects; Dollars in thousands
Project description Estimate
Projects addressing occupant safety and code compliance
SW Region HQ building chiller replacement $584.8
Ephrata wash pad $75.0
Projects addressing preservation
Vancouver Main Street office roof replacement $342.2
Spokane Street shop building roof replacement $240.6
Everett signals/bridge shop structural wall repair $150.0
Ritzville vehicle storage building roof repairs $108.2
White Pass office and shop overhead door replacement $100.7
Data source: WSDOT Capital Facilities Office.
Note: Additional project categories include environmental compliance and emergent need (when there is a facility failure or immediate operational need). See Gray Notebook 43, pp. 11-12 for WSDOT’s minor works project pri-oritization. Cost estimates were updated from Gray Notebook 59, p. 10. SW = Southwest; HQ = headquarters; HVAC = heating, ventilation and air conditioning.
Project upgrades expected to conserve energy, result in long-term cost savings2017 through 2030; Projected annual savings and costs in thousands of dollars
Data source: WSDOT Capital Facilities Office.
Note: 1 Projected costs represent the cost of financing ($1.27 million annual loan payments) the Energy Savings Performance Contract.
$1,200
$1,250
$1,300
$1,350
$1,400
$1,450
$1,500
$1,550
$1,600
$1,650
2030202820262024202220202018
Projected cost1
Projected savings
Results Washington Leading Indicator
Reduce the energy use by state-owned
facilities from 7,580,195 million British thermal units (mBtu)/
square feet/year to 5,306,137 mBtu/ square feet/year by 2017
Status: On plan (green)Strategies: 1. Energy savings performance contracting - WSDOT is
working with an energy service company to make energy conservation improvements to more than 60% of its buildings.
2. Improving benchmarking efforts - WSDOT is updating its facility condition tracking program.
GNB Edition 63 – September 30, 2016 | 15Strategic goal: Preservation – Capital Facilities
WSDOT seeks conservation with proposed energy projectEnergy Savings Performance Contract (ESPC), which would include hiring an energy service company to make conservation upgrades to more than 60% of its buildings. This contract allows WSDOT to save energy and improve facilities, including lighting fixtures, plumbing components, mechanical systems and building modifications, with no up-front capital costs. The contract also requires the energy service company to guarantee 94% of projected cost savings from recommended facility upgrades. If actual savings are less than 94%, the energy savings company will pay WSDOT the difference.
Statewide building improvements, anticipated to begin in 2017, are expected to have significant environmental and economic benefits. Energy and water savings are projected to be in excess of $1.2 million each year (see graph at the bottom of p. 14), and maintenance staff will be able to reallocate hours to more critical tasks. Net savings from the project fluctuate year to year due to the expiration of product warranties, evaluation studies and expected maintenance.
The $14.7 million facility energy conservation upgrade project would likely be funded by a combination of grants ($350,000), utility rebates and incentives ($1.2 million), and a loan financed through the Office of the State Treasurer ($13.1 million). Budget savings from reduced utility costs will be redirected from utilities to loan payments.
WSDOT expects 69% of total project savings to come from more efficient lighting, 24% from improved building heating and cooling, and 7% from reduced water usage. The project is also expected to avoid more than 11 million pounds of CO2e emissions annually.
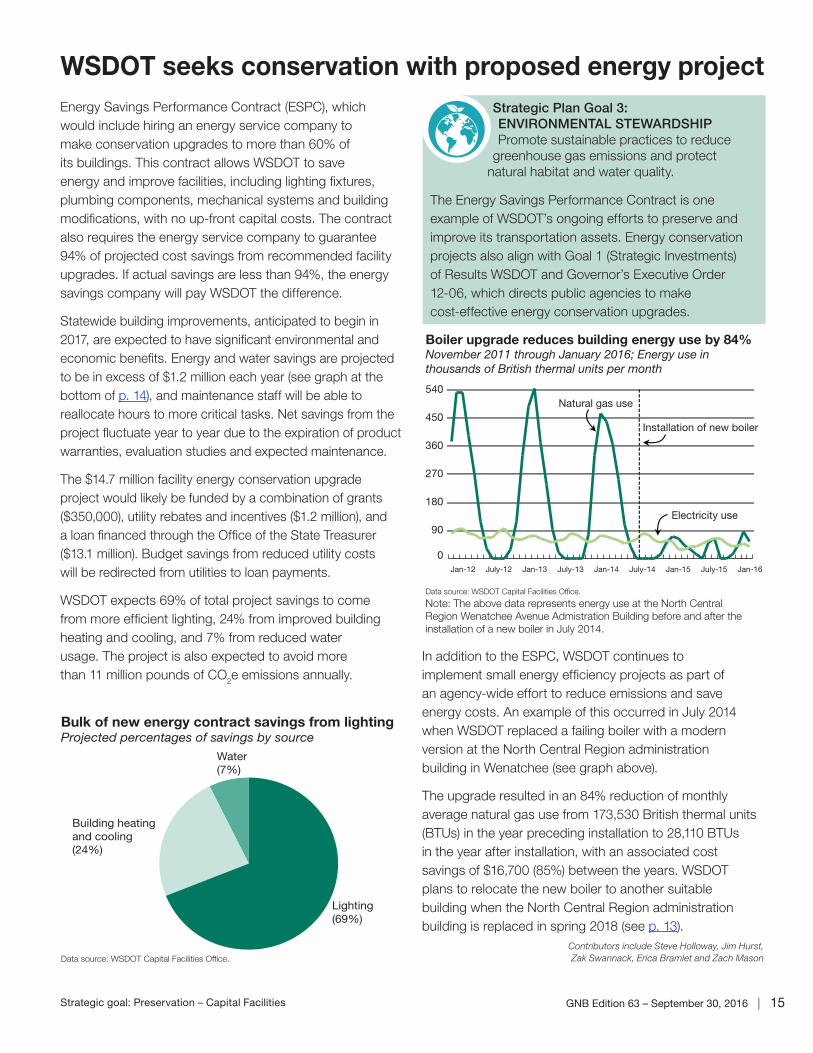
In addition to the ESPC, WSDOT continues to implement small energy efficiency projects as part of an agency-wide effort to reduce emissions and save energy costs. An example of this occurred in July 2014 when WSDOT replaced a failing boiler with a modern version at the North Central Region administration building in Wenatchee (see graph above).
The upgrade resulted in an 84% reduction of monthly average natural gas use from 173,530 British thermal units (BTUs) in the year preceding installation to 28,110 BTUs in the year after installation, with an associated cost savings of $16,700 (85%) between the years. WSDOT plans to relocate the new boiler to another suitable building when the North Central Region administration building is replaced in spring 2018 (see p. 13).
Contributors include Steve Holloway, Jim Hurst, Zak Swannack, Erica Bramlet and Zach Mason
Bulk of new energy contract savings from lightingProjected percentages of savings by source
Data source: WSDOT Capital Facilities Office.
Lighting(69%)
Building heatingand cooling(24%)
Water(7%)
Boiler upgrade reduces building energy use by 84%November 2011 through January 2016; Energy use in thousands of British thermal units per month
Data source: WSDOT Capital Facilities Office.
Note: The above data represents energy use at the North Central Region Wenatchee Avenue Admistration Building before and after the installation of a new boiler in July 2014.
0
90
180
270
360
450
540
Jan-16July-15Jan-15July-14Jan-14July-13Jan-13July-12Jan-12
Natural gas use
Electricity use
Installation of new boiler
Strategic Plan Goal 3: ENVIRONMENTAL STEWARDSHIPPromote sustainable practices to reduce
greenhouse gas emissions and protect natural habitat and water quality.
The Energy Savings Performance Contract is one example of WSDOT’s ongoing efforts to preserve and improve its transportation assets. Energy conservation projects also align with Goal 1 (Strategic Investments) of Results WSDOT and Governor’s Executive Order 12-06, which directs public agencies to make cost-effective energy conservation upgrades.
16 | GNB Edition 63 – September 30, 2016 Strategic goal: Preservation – Aviation
Asset Management: Aviation Annual Report63
Projects that preserve and improve airport pavement account for 43% of the total dollars ($25.7 million), with the remaining 7% ($4.0 million) allocated for planning, maintenance, security, and equipment acquisition projects. For more information about WSDOT’s Airport Aid Grant Program, visit: www.wsdot.wa.gov/aviation/Grants.
Aviation tax reallocation funds state’s public-use airportsIn 2015, Gov. Jay Inslee signed the Transportation Appropriations Bill, which mandated that 100% of state
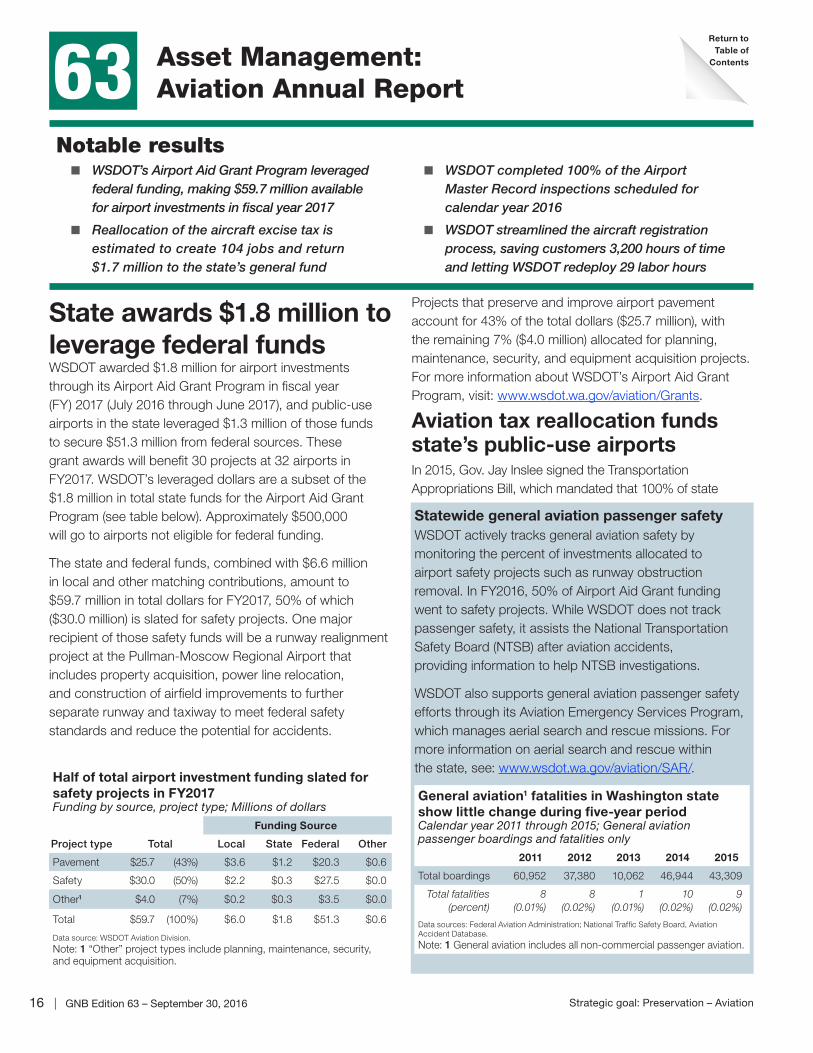
State awards $1.8 million to leverage federal fundsWSDOT awarded $1.8 million for airport investments through its Airport Aid Grant Program in fiscal year (FY) 2017 (July 2016 through June 2017), and public-use airports in the state leveraged $1.3 million of those funds to secure $51.3 million from federal sources. These grant awards will benefit 30 projects at 32 airports in FY2017. WSDOT’s leveraged dollars are a subset of the $1.8 million in total state funds for the Airport Aid Grant Program (see table below). Approximately $500,000 will go to airports not eligible for federal funding.
The state and federal funds, combined with $6.6 million in local and other matching contributions, amount to $59.7 million in total dollars for FY2017, 50% of which ($30.0 million) is slated for safety projects. One major recipient of those safety funds will be a runway realignment project at the Pullman-Moscow Regional Airport that includes property acquisition, power line relocation, and construction of airfield improvements to further separate runway and taxiway to meet federal safety standards and reduce the potential for accidents.
Notable results � WSDOT’s Airport Aid Grant Program leveraged
federal funding, making $59.7 million available for airport investments in fiscal year 2017
� Reallocation of the aircraft excise tax is estimated to create 104 jobs and return $1.7 million to the state’s general fund
� WSDOT completed 100% of the Airport Master Record inspections scheduled for calendar year 2016
� WSDOT streamlined the aircraft registration process, saving customers 3,200 hours of time and letting WSDOT redeploy 29 labor hours
Half of total airport investment funding slated for safety projects in FY2017Funding by source, project type; Millions of dollars
Funding Source
Project type Total Local State Federal Other
Pavement $25.7 (43%) $3.6 $1.2 $20.3 $0.6
Safety $30.0 (50%) $2.2 $0.3 $27.5 $0.0
Other1 $4.0 (7%) $0.2 $0.3 $3.5 $0.0
Total $59.7 (100%) $6.0 $1.8 $51.3 $0.6
Data source: WSDOT Aviation Division.
Note: 1 “Other” project types include planning, maintenance, security, and equipment acquisition.
Statewide general aviation passenger safetyWSDOT actively tracks general aviation safety by monitoring the percent of investments allocated to airport safety projects such as runway obstruction removal. In FY2016, 50% of Airport Aid Grant funding went to safety projects. While WSDOT does not track passenger safety, it assists the National Transportation Safety Board (NTSB) after aviation accidents, providing information to help NTSB investigations.
WSDOT also supports general aviation passenger safety efforts through its Aviation Emergency Services Program, which manages aerial search and rescue missions. For more information on aerial search and rescue within the state, see: www.wsdot.wa.gov/aviation/SAR/.
General aviation1 fatalities in Washington state show little change during five-year periodCalendar year 2011 through 2015; General aviation passenger boardings and fatalities only
2011 2012 2013 2014 2015
Total boardings 60,952 37,380 10,062 46,944 43,309
Total fatalities(percent)
8(0.01%)
8(0.02%)
1(0.01%)
10(0.02%)
9(0.02%)
Data sources: Federal Aviation Administration; National Traffic Safety Board, Aviation Accident Database.
Note: 1 General aviation includes all non-commercial passenger aviation.
Return toTable of
Contents

GNB Edition 63 – September 30, 2016 | 17Strategic goal: Preservation – Aviation
Tax reallocation improves state’s public-use airports
were not rated with respect to those facets because their runway surfaces were turf, gravel or water.
Of the 30 airports inspected for runway pavement condition in 2016, all were ranked as being in fair or better condition. None were ranked as being in poor condition, and none failed the assessment. The condition of runway markings was assessed as being in fair or good condition at 28 of those same 30 airports (93%).
During the past three years, WSDOT has taken the lead on performing these inspections, gradually reducing its need for consultant support. The change has benefitted both WSDOT and airport partners by allowing WSDOT to get firsthand knowledge and ideas from airport sponsors on the condition of their airports. Physical and operational characteristics at 123 of the 135 public-use airports (excluding primary commercial airports like Seattle-Tacoma
aircraft excise tax fees fund airport projects. Previously, 10% of aircraft excise tax funds went toward airport projects, with the remaining 90% deposited into the state general fund. Due to the reallocation, an additional $637,000 in aviation funding became available during the 2015-2017 biennium.
In FY2016, the tax reallocation allowed 24 additional projects across the state to be funded, and leveraged $10.6 million in Federal Aviation Administration (FAA) funding. The reallocation ultimately resulted in more than $13 million for airport preservation, safety and improvement projects when combined with local matching and federal grant funds. These funds were a subset of the total awarded through WSDOT’s Airport Aid Grant program in FY2016.
All revenue from the aircraft excise tax now funds WSDOT’s Airport Aid Grant Program, which supports airport preservation, safety and improvement projects, including runway rehabilitation and realignment, taxiway reconstruction, and beacon and wind cone installations. These projects help keep airport facilities up-to-date and support safety measures.
WSDOT hits milestone with Airport Master Record inspectionsWSDOT successfully completed 100% of the 42 airport inspections scheduled in 2016 for the first time since bringing the process in-house three years ago. In 2014 and 2015, WSDOT completed 50% and 75%, respectively, of the scheduled inspections, with the remainder completed by a contractor.
WSDOT inspected 30 of the 42 airports for runway pavement condition, and for condition of paved runway markings this year. The remaining 12 airports
Good,23 (77%)
Excellent,4 (13%)
Runway pavement condition
Rating assessed duringWSDOT’s 2016inspections at
30 airports
Fair,3 (10%)
Data source: WSDOT Aviation. Note: The condition of runway markings was assessed at 30 of the 42 inspected airports because runways at the other 12 locations were turf, gravel,or water surfaces.
Fair,9 (30%)Good,
19 (63%)
Poor,2 (7%)
Condition of pavedrunway markings
Rating assessed duringWSDOT’s 2016inspections at
30 airportsPositive impacts of aircraft excise tax reallocation could exceed expectationsTwo estimates indicate positive economic benefits from the aircraft excise tax reallocation. An initial analysis from the Office of Financial Management identified the creation of 64 jobs and almost $910,000 in additional state general fund revenue. A second analysis completed by WSDOT Economic Analysis predicted 104 new jobs would garner $1.7 million in sales and Business and Occupation tax revenue.

18 | GNB Edition 63 – September 30, 2016 Strategic goal: Preservation – Aviation
WSDOT streamlines aircraft registration programowners to pay. The bill was signed by Gov. Jay Inslee and went into effect July 2016.
�WSDOT stopped requiring backup documentation for non-airworthy aircraft requesting exemption from registration, as this was not required per Revised Code of Washington.
�WSDOT launched an online exemption request form to improve customer service and user-friendliness, and reduce administrative paperwork.
�WSDOT’s Aviation Division routed aircraft registration payments directly to WSDOT’s Accounting Division, centralizing the processing system and avoiding duplication.
�Accounting and Aviation staff received training on methods to increase efficiencies and communications.
Because this Lean project created policy changes and internal reorganization of duties, no costs were associated with this phase of the project. WSDOT has set aside funding for the final phase to redesign the current registration system by providing automated programs for customers to access their accounts and complete their registrations. WSDOT continues to review feedback and suggestions from customers for streamlining this program.
Washington state law requires that most airworthy general aviation aircraft be registered with WSDOT. Aircraft registration fees directly support WSDOT’s airport preservation, maintenance and improvement programs.
Capital improvement program prioritizes projects efficiently After the Statewide Capital Improvement Program (SCIP) submission window closed on October 31, 2016, WSDOT analyzed 480 projects valued at $441 million. WSDOT analyzed more than 500 airport projects totaling approximately $454 million during last year’s cycle. The SCIP helps WSDOT and the FAA prioritize projects at the state’s 135 public-use airports. The five-year list of prioritized projects helps WSDOT and the FAA better allocate resources and award grants, and increases the predictability, consistency and efficiency among airport authorities requesting funds.
WSDOT hosts joint planning conferences with the FAA and airport sponsors after projects are submitted. These conferences allow open discussion about projects, helping refine the airports’ project lists into an approved plan for each airport.
International) are inspected approximately every three years in order to update the Airport Master Record for the FAA.
Approximately every five years, WSDOT conducts a study to assess the relative condition of pavements for selected Washington state airports. Results from the prior 2012 study are featured in GNB 51, p. 8, and online at: bit.ly/WSDOTAviationPavement. Look for highlights from the upcoming 2017 pavement condition study in future editions of the Gray Notebook.
Aircraft registration program undergoes process improvementDuring the 2016 renewal cycle (November 2015 through February 2016), WSDOT registered 6,519 aircraft and provided 3,469 total exemptions to aircraft that qualified, reaching its goal of registering 95% of aircraft for the fifth consecutive year.
WSDOT undertook an innovative effort to improve this aircraft registration program after listening to customer feedback. The Aircraft Registration Lean Project has made the program more efficient, user-friendly and cost-effective.
WSDOT saved customers 3,239 hours during the 2016 renewal cycle by reducing the average time needed for non-airworthy aircraft to submit an exemption request from two hours to two minutes, a 98% reduction. There were 1,647 such aircraft owners requesting this type of exemption, amounting to 47% of all exemptions. There were 1,270 such cases in the 2015 renewal cycle.
Time spent processing all exemption request types also decreased for WSDOT staff after program improvements were made. The average time required to process any type of exemption request was reduced from 90 to 45 seconds, making 29 hours of staff time available for redeployment during the 2016 renewal cycle.
To streamline the program for customers and staff, the following changes were implemented:
�The Legislature passed a bill to eliminate escalating late-registration penalties in favor of a one-time, $100 late fee. Through the Lean process, WSDOT conducted a customer satisfaction survey and determined the previous penalty system was cumbersome to customers and staff. The prior system involved issuing escalating penalties over time, resulting in numerous notifications for staff to process and steep late penalties for aircraft

GNB Edition 63 – September 30, 2016 | 19Strategic goal: Preservation – Aviation
exercise to prepare the Pacific Northwest for a coordinated response to a major Cascadia Subduction Zone earthquake and resulting tsunami. The scenario simulated a 9.0 magnitude earthquake lasting 5-10 minutes, a 13-foot peak tsunami, and landslide incidents affecting areas from Canada to California. WSDOT integrated liaisons from Civil Air Patrol, Washington Military Department, Northwest Regional Aviation, Washington State Guard, Washington National Guard, Kansas Air National Guard, and NORTHCOM Joint Personnel Recovery Center. All participants operated within WSDOT’s Aviation Emergency Coordination Center alongside WSDOT staff serving as the state’s Air Operations Branch (AOB).
WSDOT focused on refining processes that support airport operations and the availability of critical aviation resources during a post-disaster response. WSDOT strengthened partnerships with aviation stakeholders critical to emergency response and recovery efforts. Major tasks accomplished included:
�Further training of staff positions within the state AOB
�Coordinating and reporting airfield damage assessments
�Coordinating airfield repairs
�Monitoring aviation-related resources at airports
�Strengthening emergency communications with the public
�Developing an all-hazards plan for state aviation operations during large-scale emergencies
Incorporating lessons learned from last year’s “Evergreen Tremor” exercise, WSDOT improved disaster response communications and equipment during “Cascadia Rising” by coordinating a mobile, high-bandwidth, satellite communications capability referred to as a Joint Incident Site Communications Capability through the Kansas Air National Guard. This preserves WSDOT’s ability to correspond via phone, internet and radio in situations when communications would normally deteriorate.
WSDOT continues to work with the FAA, Federal Emergency Management Agency, State Emergency Management Division, National Guard and other critical aviation partners to better prepare the state’s aviation system for the risks associated with a major event in the Cascadia Subduction Zone. An aviation exercise is scheduled for summer 2017 to further refine areas of improvement identified during “Cascadia Rising.”
Contributors include Eric Johnson, John Macarthur, Nisha Marvel, Matt Clark and Dan Davis
WSDOT’s Airport Investment Study leads to improved airport fundingThe Airport Investment Solutions Handbook was released in 2015 as the second and final phase of WSDOT’s Airport Investment Study, which identified $3.6 billion in needed investment and a $1.6 billion gap between needs and available funding over the coming 20 years. The new handbook proposed solutions to cover the state’s share—$8.4 million annually—of the current airport investment funding gap. Among the top solutions resulting from the study were:
1. Establish a state-sponsored revolving aviation infrastructure loan fund
2. Realign current transportation revenue allocations
3. Modify the state aircraft excise tax program
4. Develop a best management practices guidebook/toolkit for state airports
Of these solutions, modifying the state aircraft excise tax (Solution 3) has been implemented through legislative action. Approximately $637,000 in state aviation funding was reallocated to fund airport projects during the 2015-2017 biennium (see p. 16).
WSDOT is moving forward with Solution 4 by developing a best management practices guidebook/toolkit for state airports. The guidebook is planned to be available by summer 2018.
WSDOT is providing technical assistance to the Washington State Aviation Alliance (WSAA) as that group prepares proposals for the upcoming legislative session based on findings from the 2014 Airport Investment Study and the 2015 Airport Investment Solutions Handbook. WSDOT is also assisting WSAA to propose an increase to the cap for WSDOT Airport Aid Grants. The higher cap would enable the state to match the typical 5% share of larger federally-funded projects more often. It would also increase grant aid contributions to larger infrastructure preservation and improvement projects at smaller airports, decreasing the need to phase work over serval grant periods, thereby increasing the efficiency of both project implementation and grant administration.
“Cascadia Rising” exercise improves disaster responseIn June 2016, WSDOT led aviation partners from across the nation during “Cascadia Rising,” a multi-state, multi-agency
WSDOT’s Airport Investment Study sparks legislation

20 | GNB Edition 63 – September 30, 2016 Strategic goal: Mobility – WSDOT Ferries
WSDOT FerriesQuarterly Update63
Notable results � Ferries made 99.8% of its regularly scheduled
trips in the first quarter of fiscal year 2017, exceeding its annual reliability goal of 99%
� Ferries ridership was more than 7.46 million in the first quarter of fiscal year 2017, roughly 300,000 more people than live in Washington
The online version of this article links
to an interactive map with more route
information; visit bit.ly/GNBferriesmap.
Ferries reliability increases, exceeds annual goal of 99%There were 42,591 regularly scheduled ferry trips during the first quarter of fiscal year (FY) 2017 (July through September 2016). WSDOT Ferries completed 99.8% (42,488) of them, exceeding its annual reliability performance goal of 99% and coming in 0.4 percentage points higher than the same quarter in FY2016 (see table on p. 21). In the first quarter of FY2017, Ferries cancelled 157 trips and was able to replace 54 of them, resulting in 103 net missed trips. This was 145 fewer net trips missed compared to the same quarter in FY2016 and the fewest since the fourth quarter of FY2011.
Vessel mechanical and electrical problems were the leading reasons for cancellations during the quarter, totaling 62 (39%) of all cancellations. The Motor/Vessel (M/V) Klahowya had four separate mechanical problems that resulted in 32 cancelled sailings. The remaining
30 vessel mechanical cancellations were distributed among nine different vessels, with the M/V Walla Walla missing eight sailings due to a generator problem. Weather and tides accounted for an additional 39 (25%) cancelled trips during the quarter, with all of them occurring on the Port Townsend – Coupeville route.
Ridership once again booms during the summer quarterWSDOT ferries’ ridership was more than 7.45 million during the first quarter of FY2017. This was about 26,600 (0.4%) higher than WSDOT projected for the quarter and about 147,300 (2.0%) more in total ridership than the corresponding quarter in FY2016. To put the quarterly ridership in perspective, 7.45 million is also roughly 300,000 more than the entire population of Washington state as of April 2016.
The increase in ridership last quarter can be mostly attributed to a strong regional economy and lower fuel prices increasing discretionary travel.
On-time performance decreasesOn-time performance dropped slightly from the same quarter in FY2016, decreasing from 91.1% to 90.9% for the first quarter of FY2017. The quarterly rate misses Ferries’ annual on-time performance goal of 95%.
The increase in ridership that accompanies the summer months results from more people traveling and typically causes a decrease in Ferries’ on-time performance. Ridership during the first quarter has increased 7.6% since FY2013, adversely affecting on-time performance.
On average in the first quarter of FY2017, 42 out of 467 daily trips did not leave the terminal within 10 minutes of the scheduled departure time, an increase from an average of 41 out of 463 trips for the same quarter last year.
On-time performance declined on seven of nine routes compared to the first quarter of FY2016. During the quarter, the Anacortes/Friday Harbor – Sidney, B.C., route
Data source: WSDOT Ferries.
Notes: Fiscal years run from July 1 through June 30. Percentages may not add to 100 due to rounding. 1 Ferries replaced 54 of the 157 cancelled trips, for a total of 103 net missed trips. 2 “Other” includes events like disabled vehicles, issues at terminals, environmental reasons or non-ferries related incidents that can impact operations.
Vessel62 (39%)
Crewing14 (9%)
Tides/Weather 39 (25%)
Schedule reset 4 (3%)
Emergency/Security21 (13%)
Vessel issuestop reason for
157 cancelled trips first quarter
(July - September) fiscal year 2017
Other17 (11%)
2
1
Return toTable of
Contents

GNB Edition 63 – September 30, 2016 | 21Strategic goal: Mobility – WSDOT Ferries
Ferries revenue follows increasing ridership numbers
first quarter of FY2017, representing a jump from two to seven total passenger injuries. The rate of Occupational Safety and Health Administration recordable crew injuries per 10,000 revenue service hours decreased from 4.4 in FY2016 to 3.0 in FY2017. This represents five less injuries compared to the same quarter in FY2016, and continues to be well below Ferries’ annual goal of having a rate of less than 7.6 crew injuries per 10,000 revenue service hours.
Revenue trends up for the quarterFerries farebox revenue followed higher ridership numbers, continuing its upward trend and coming in at about $61.1 million for the first quarter of FY2017. Farebox revenue was $3.2 million (5.4%) more than the same quarter in FY2016, and about $1.6 million (2.7%) more than projections. Farebox revenue is the largest source of funding for ferry operations, bringing in about 70% of these funds.
Reservation complaints decreaseIn total, Ferries received 392 complaints and 41 compliments from 7.46 million riders during the first quarter of FY2017. This was a decrease of 58 complaints from the same quarter in FY2016. Compliments remained steady at 41. The biggest improvement was in reservations where complaints decreased from 80 to 34 during the period.
Contributors include Matt Hanbey, Kynan Patterson and Joe Irwin
had the biggest decline compared to the first quarter of FY2016, decreasing from 93.6% to 88.0% in FY2017. Heavy traffic on the international route was the primary reason for the overall decrease in on-time performance during the quarter. Because this route had 342 scheduled departures during the first quarter of FY2017, small changes in the number of late or on-time departures has a larger impact on the on-time performance percentage.
WSDOT also experienced a large decrease in on-time performance on the Edmonds – Kingston route during this period, where it declined from 97.4% to 94.2%. Edmonds – Kingston departure delays were mostly caused by heavy weekend traffic in July and August.
The one improvement in on-time performance was on the Fauntleroy – Vashon – Southworth route, which increased from 87.3% in the first quarter of FY2016 to 89.8% in the corresponding quarter in FY2017. This route benefited from a modification to the weekend schedule that improved on-time performance.
Passenger injuries increase, employee injuries decreaseThe rate of passenger injuries per million riders increased from 0.27 in the first quarter of FY2016 to 0.94 in the
Ferries’ on-time performance dips slightly, trip reliability increases for the first quarter of fiscal year 2017July through September FY2016 and FY2017; Annual on-time goal = 95%; Annual reliability goal = 99%
Route
On-time performance (first quarter) Trip reliability (first quarter)
FY2016 FY2017 Status Trend FY2016 FY2017 Status Trend
San Juan Domestic 86.7% 84.3% -2.4% 99.8% 99.8% 0.0% Anacortes/Friday Harbor – Sidney, B.C. 93.6% 88.0% -5.6% 100.0% 100.0% 0.0% Edmonds – Kingston 97.4% 94.2% -3.2% 99.8% 99.8% 0.0% Fauntleroy – Vashon – Southworth 87.3% 89.8% +2.5% 99.1% 99.8% +0.7% Port Townsend – Coupeville 94.3% 94.2% -0.1% 96.2% 98.6% +2.4% Mukilteo – Clinton 92.8% 92.8% 0.0% 99.9% 99.8% -0.1% Point Defiance – Tahlequah 99.3% 99.1% -0.2% 99.8% 100.0% +0.2% Seattle – Bainbridge Island 87.1% 86.9% -0.2% 99.9% 99.9% 0.0% Seattle – Bremerton 95.4% 94.4% -1.0% 100.0% 99.8% -0.2% Total system 91.1% 90.9% -0.2% 99.4% 99.8% +0.4% Data source: WSDOT Ferries.
Notes: FY = fiscal year (July 1 through June 30). A trip is considered delayed when a vessel leaves the terminal more than 10 minutes later than the scheduled departure time. Ferries operates 10 routes but combines the Anacortes – Friday Harbor route with the San Juan Interisland route as the San Juan Domestic for on-time performance and service reliability. Due to unique fare collection methods in the San Juan Islands, and similar origin and destination legs on both routes, some statistics cannot be separated between the two routes.

22 | GNB Edition 63 – September 30, 2016 Strategic goal: Mobility – Passenger Rail
Rail: Amtrak Cascades Quarterly Update63
landslide mitigation work to stabilize slopes and install walls to stop debris from reaching the tracks in the most landslide-prone areas along the corridor. Additionally, construction projects to address capacity at major chokepoints have decreased the congestion that results when too many trains are competing for the same tracks.
In contrast to the rest of the year, July 2015 saw a substantial decrease in year-over-year on-time performance—a drop of 20.5 percentage points. July’s 59.7% on-time performance was primarily due to heat restrictions that require trains to travel at reduced speeds. During July, 133 Amtrak Cascades trains were delayed by heat restrictions issued by the host railroads between Seattle and Portland. This safety measure delays train travel when the temperature reaches a point where tracks could get bent or kinked. The result is a domino effect of delayed trains throughout the corridor as schedules are compromised.
When all of WSDOT’s rail capital improvement projects are completed in June 2017 (see gray box on p. 23) the goal will be to reach 88% on-time performance in the following fiscal year (FY2018).
On-time train performance improves in fiscal year 2016An average of 74.8% of Washington’s Amtrak Cascades trains were on time in fiscal year (FY) 2016 (July 2015 through June 2016). While not meeting the 80% performance goal, it marked a 2.7 percentage point improvement over 72.1% of trains on time in FY2015 (this FY2015 value has been updated since Gray Notebook 59). On-time performance improved in nine of the 12 months of the fiscal year, including a 13.0 percentage point improvement in August 2015 and an 11.8 percentage point improvement in February 2016, compared to the same months in the previous fiscal year.
This increase in on-time performance was due in part to WSDOT completing several infrastructure improvement projects along the Amtrak Cascades corridor. As projects are completed, delays caused by construction activities decrease, and the corridor benefits from the infrastructure improvements. For example, in FY2016 there was a decrease in the number of landslides that reached the railroad tracks in the northern corridor during the winter months. This is due in part to WSDOT’s
Notable results � Rail infrastructure improvements helped
increase trains’ on-time performance FY2016 to 74.8%, up from 72.1% in FY2015
� Thirteen federally funded rail projects were complete and seven were in construction as of September 30, 2016
Most months during FY2016 saw on-time performance improvements from FY2015Fiscal years 2015 and 2016; Percent of trains on time
Data source: WSDOT Rail, Freight and Ports Division.
Note: Data is for trains traveling on Washington segments only.
50%
60%
70%
80%
90%
MayMarchJan.Nov.Sept.July
FY2016
FY2015
On-time performance improves after two-year declineFiscal years 2012 through 2016; Percent of trains on time
Data source: WSDOT Rail, Freight and Ports Division.
Notes: See definition of “on time” in Gray Notebook 55, p. 13. Data is for trains traveling on Washington segments only. 1 The goal for on-time performance will become 88% in FY2018 once the 20 capital projects are complete (see p. 23).
50%
60%
70%
80%
90%
FY2012 FY2013 FY2014 FY2015 FY2016
71.0%
76.5%74.2%
72.1%74.8%
On-time performance goal: 80%1
Return toTable of
Contents
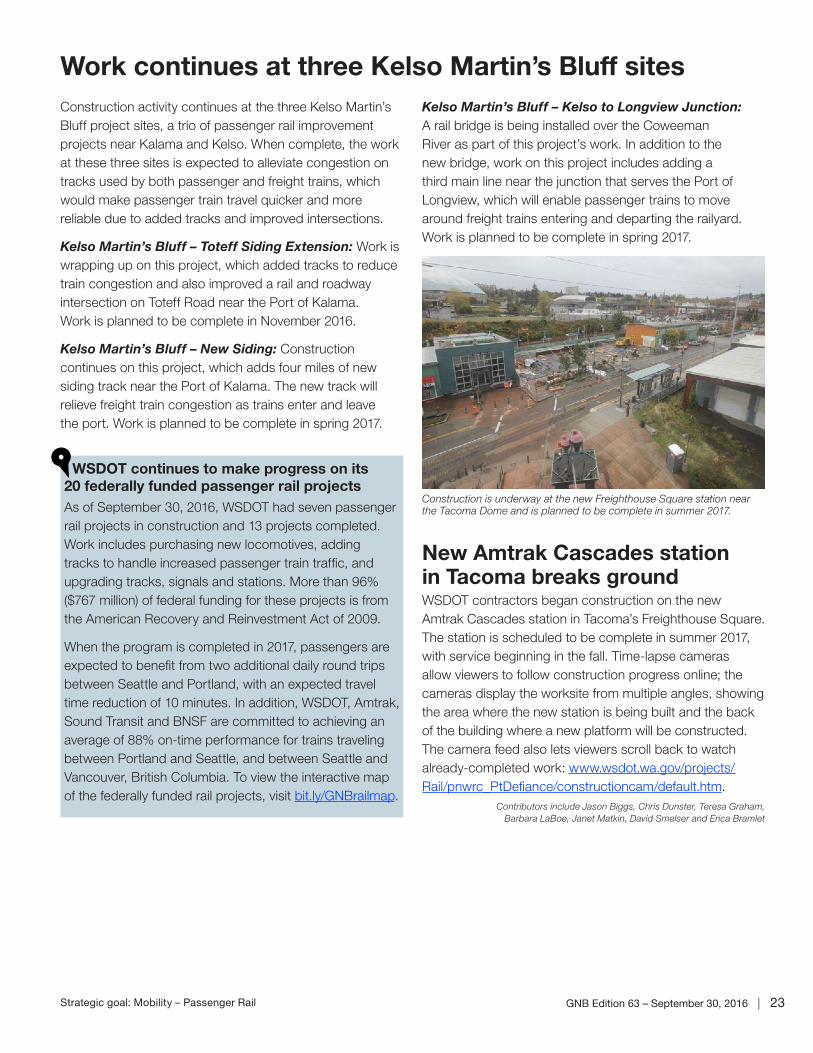
GNB Edition 63 – September 30, 2016 | 23Strategic goal: Mobility – Passenger Rail
Work continues at three Kelso Martin’s Bluff sitesConstruction activity continues at the three Kelso Martin’s Bluff project sites, a trio of passenger rail improvement projects near Kalama and Kelso. When complete, the work at these three sites is expected to alleviate congestion on tracks used by both passenger and freight trains, which would make passenger train travel quicker and more reliable due to added tracks and improved intersections.
Kelso Martin’s Bluff – Toteff Siding Extension: Work is wrapping up on this project, which added tracks to reduce train congestion and also improved a rail and roadway intersection on Toteff Road near the Port of Kalama. Work is planned to be complete in November 2016.
Kelso Martin’s Bluff – New Siding: Construction continues on this project, which adds four miles of new siding track near the Port of Kalama. The new track will relieve freight train congestion as trains enter and leave the port. Work is planned to be complete in spring 2017.
Kelso Martin’s Bluff – Kelso to Longview Junction: A rail bridge is being installed over the Coweeman River as part of this project’s work. In addition to the new bridge, work on this project includes adding a third main line near the junction that serves the Port of Longview, which will enable passenger trains to move around freight trains entering and departing the railyard. Work is planned to be complete in spring 2017.
New Amtrak Cascades station in Tacoma breaks groundWSDOT contractors began construction on the new Amtrak Cascades station in Tacoma’s Freighthouse Square. The station is scheduled to be complete in summer 2017, with service beginning in the fall. Time-lapse cameras allow viewers to follow construction progress online; the cameras display the worksite from multiple angles, showing the area where the new station is being built and the back of the building where a new platform will be constructed. The camera feed also lets viewers scroll back to watch already-completed work: www.wsdot.wa.gov/projects/Rail/pnwrc_PtDefiance/constructioncam/default.htm.
Contributors include Jason Biggs, Chris Dunster, Teresa Graham, Barbara LaBoe, Janet Matkin, David Smelser and Erica Bramlet
Construction is underway at the new Freighthouse Square station near the Tacoma Dome and is planned to be complete in summer 2017.
WSDOT continues to make progress on its 20 federally funded passenger rail projectsAs of September 30, 2016, WSDOT had seven passenger rail projects in construction and 13 projects completed. Work includes purchasing new locomotives, adding tracks to handle increased passenger train traffic, and upgrading tracks, signals and stations. More than 96% ($767 million) of federal funding for these projects is from the American Recovery and Reinvestment Act of 2009.
When the program is completed in 2017, passengers are expected to benefit from two additional daily round trips between Seattle and Portland, with an expected travel time reduction of 10 minutes. In addition, WSDOT, Amtrak, Sound Transit and BNSF are committed to achieving an average of 88% on-time performance for trains traveling between Portland and Seattle, and between Seattle and Vancouver, British Columbia. To view the interactive map of the federally funded rail projects, visit bit.ly/GNBrailmap.

24 | GNB Edition 63 – September 30, 2016 Strategic goals: Safety and Mobility – Incident Response
Incident Response Quarterly Update63
be caused by distracted driving, unexpected slowdowns or debris in the roadway. The IR teams help alert drivers about incidents and clear the roadway to reduce the likelihood of new incidents. A table summarizing the IR program’s performance and benefits for the quarter is on p. 25.
WSDOT’s assistance at incident scenes provided an estimated $22.7 million in economic benefits during the third quarter of 2016 by reducing the impacts of incidents on drivers. These benefits are provided in two ways:
�WSDOT reduces the time and fuel motorists waste in incident-induced traffic delay by clearing incidents quickly. About $12.8 million of IR’s economic benefits for the quarter result from reduced traffic delay.
�WSDOT helps prevent secondary incidents by proactively managing traffic at incident scenes. About $9.9 million of IR’s economic benefits result from preventing an estimated 2,893 secondary incidents and resulting delay. This figure is based on Federal Highway Administration data that indicates 20% of all incidents are secondary incidents.
Based on WSDOT’s budget for IR (see box at left), every $1 spent on the program this quarter provided drivers roughly $18.20 in economic benefit.
Incident Response teams help at 15,102 incidentsWSDOT’s Incident Response (IR) teams assisted at 15,102 incidents during the third quarter (July through September) of 2016. This averages to a WSDOT team responding to an incident scene roughly every nine minutes during the quarter. There were 1,396 more incidents during the third quarter of 2016 compared with the same period in 2015, about a 10% increase.
WSDOT teams cleared incidents in an average of 12 minutes. This is 48 seconds faster than the average incident clearance time for the same quarter last year. During this time there was a 5.5% decrease in incidents lasting more than 90 minutes while incidents lasting 15-90 minutes increased 3.8% and incidents lasting less than 15 minutes increased 12.3%. The proportion of incidents which blocked at least one lane was 24% for this quarter compared to 22.3% during the same quarter last year.
WSDOT focuses on safety when clearing incidents, working to reduce incident-induced delay as well as the potential for secondary incidents to occur. Secondary incidents occur in the congestion resulting from a prior incident and may
Notable results � WSDOT responded to 15,102 incidents
during the quarter, providing an estimated $22.7 million in economic benefits
� WSDOT cleared incident scenes in an average of 12 minutes, reducing traffic delay and the risk of secondary incidents
The mission of WSDOT’s Incident Response program is to clear traffic incidents safely and quickly, minimizing congestion and the risk of secondary incidents. The statewide program has a biennial budget of $9 million, funding about 47 full-time equivalent positions (approximately 80 trained drivers) and 62 dedicated vehicles. Teams are on-call 24/7 and actively patrol 493 centerline miles (about 32% of all urban centerline miles) of highway on major corridors around the state such as I-5 or I-205 during peak traffic hours.
12.8-minute average incident clearance time
12.0-minute average incident clearance time
Data source: Washington Incident Tracking System.
WSDOT responds to fewer incidents while average clearance times go up Third quarter (July through September) 2015 and 2016
Notes: Data above only account for incidents to which an IR unit responded. IR data reported for the current quarter (Q3 2016) are considered preliminary. In the previous quarter (Q2 2016), WSDOT responded to 14,923 incidents, clearing them in an average of 11.3 minutes. These numbers have been confirmed and are now finalized.
2015 - Q3 13,706
15,102
incident responses
incident responses
incident responses increased
10.2% clearance time decreased 6.3%
2016 - Q3
WSDOT achieves reduced clearance times while responding to more incidentsThird quarter (July through September) 2015 and 2016
Return toTable of
Contents

GNB Edition 63 – September 30, 2016 | 25Strategic goals: Safety and Mobility – Incident Response
Incident-induced traffic delay on state highways cost motorists an estimated $51.3 million during the third quarter of 2016. This is about $1.6 million more than in the same quarter of 2015. Without WSDOT’s assistance, this economic impact would have been roughly $74 million ($22.7 million in prevented delay and secondary incidents plus $51.3 million in actual delay costs).
For more information on how WSDOT calculates these figures and all IR performance metrics, see WSDOT’s Handbook for Corridor Capacity Evaluation, 2nd edition, pp. 45-47.
WSDOT teams respond to 173 over-90-minute incidentsWSDOT Incident Response units provided assistance at the scene of 173 incidents that lasted more than 90 minutes during the third quarter of 2016. This is 10 fewer incidents—roughly a 5.5% decrease—than the same quarter in 2015. While these over-90-minute incidents accounted for 1.1% of all incidents, they resulted in 20.6% of all incident-related delay costs.
Twelve of the 173 over-90-minute incidents took six hours or more to clear (referred to as extraordinary incidents). This is three more incidents than the same quarter in 2015. The 12 extraordinary incidents took an average of eight hours and two minutes to clear, accounting for about 3.8% of all incident-induced delay costs for the quarter.
The average incident clearance time for all over-90-minute incidents was about three hours and one minute. This is about 10 minutes faster than the same quarter in 2015. Excluding the 12 extraordinary incidents, WSDOT’s average clearance time for over-90-minute incidents was two hours and 39 minutes. Performance data reported in this article is from WSDOT’s Washington Incident Tracking System, which tracks incidents to which a WSDOT IR team responded.
Contributors include Vince Fairhurst, Ida van Schalkwyk, Bradley Bobbitt, Sreenath Gangula and Zachary Mason
Customer feedback: Incident Response teams provide quick assistance during the third quarter
WSDOT IR teams give comment cards to drivers they help. Below are samples of the comments received from drivers WSDOT assisted during the third quarter of 2016:
� I was in a medical transport vehicle that broke down. I felt very unsafe sitting on a shoulder in a wheelchair. I felt safer when Glen pulled up behind us.
�Heather is a life saver. She makes Washington roads safer and the DOT support of this vital program must continue. Thank you so much!
�Frank was right there within five minutes of my blown tire. He did everything. I could not ask for more.
“
“WSDOT’s Incident Response prevents $22.7 million in costs due to traffic delays and secondary incidentsJuly through September 2016; Incidents by duration; Times in minutes; Costs and benefits in millions of dollars
Incident duration
Number of incidents1
Percent blocking2
Average roadway clearance time3
(blocking only)
Average roadway clearance time3
(all incidents)
Average incident clearance time4
(all incidents)
Cost of incident-
induced delay
Economic benefits from
IR program5
Less than 15 min. 11,832 15.9% 4.2 0.7 4.8 $14.4 $6.7
Between 15 and 90 min.
3,097 52.3% 25.6 13.4 30.2 $26.3 $11.6
Over 90 min. 173 89.6% 170.9 153.1 181.4 $10.6 $4.4
Total 15,102 24.0% 20.9 5.0 12.0 $51.3 $22.7
Percent change from third quarter 2015
10.2% 1.7% 0% 5.1% 6.3% 3.2% 3.3%
Data source: Washington Incident Tracking System.
Notes: Some numbers do not add up due to rounding. 1 Teams were unable to locate 636 of the 15,102 incidents. Because an IR team attempted to respond, these incidents are included in the total incident count, but are not factored into other performance measures. 2 An incident is considered blocking when it shuts down one or more lanes of travel. 3 Roadway clearance time is the time between the IR team’s first awareness of an incident (when a call comes in or the incident is spotted by a patrolling IR unit) and when all lanes are available for traffic flow. 4 Incident clearance time is the time between an IR team’s first awareness of an incident and when the last responder has left the scene. 5 Estimated economic benefits include benefits from delay reduction and prevented secondary incidents. See WSDOT’s Handbook for Corridor Capacity Evaluation, 2nd edition, pp. 45-47, for WSDOT’s methods to calculate IR benefits.
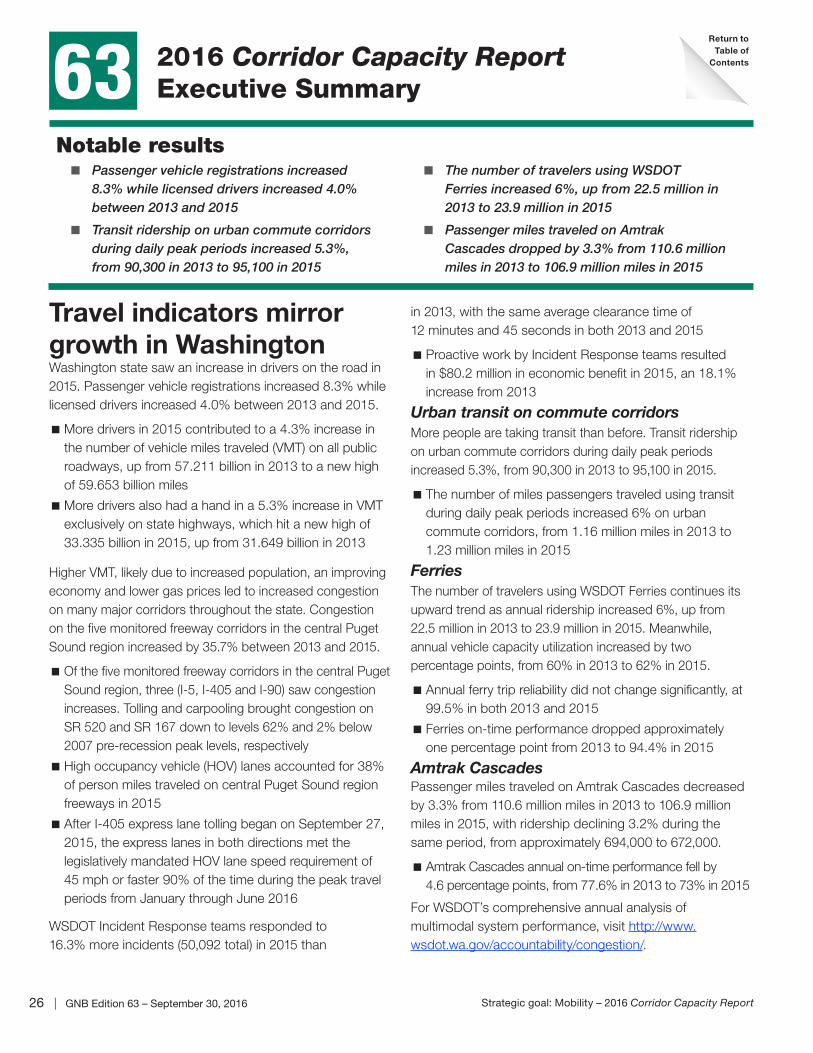
26 | GNB Edition 63 – September 30, 2016 Strategic goal: Mobility – 2016 Corridor Capacity Report
2016 Corridor Capacity ReportExecutive Summary63
Notable results � Passenger vehicle registrations increased
8.3% while licensed drivers increased 4.0% between 2013 and 2015
� Transit ridership on urban commute corridors during daily peak periods increased 5.3%, from 90,300 in 2013 to 95,100 in 2015
� The number of travelers using WSDOT Ferries increased 6%, up from 22.5 million in 2013 to 23.9 million in 2015
� Passenger miles traveled on Amtrak Cascades dropped by 3.3% from 110.6 million miles in 2013 to 106.9 million miles in 2015
Travel indicators mirror growth in WashingtonWashington state saw an increase in drivers on the road in 2015. Passenger vehicle registrations increased 8.3% while licensed drivers increased 4.0% between 2013 and 2015.
�More drivers in 2015 contributed to a 4.3% increase in the number of vehicle miles traveled (VMT) on all public roadways, up from 57.211 billion in 2013 to a new high of 59.653 billion miles
�More drivers also had a hand in a 5.3% increase in VMT exclusively on state highways, which hit a new high of 33.335 billion in 2015, up from 31.649 billion in 2013
Higher VMT, likely due to increased population, an improving economy and lower gas prices led to increased congestion on many major corridors throughout the state. Congestion on the five monitored freeway corridors in the central Puget Sound region increased by 35.7% between 2013 and 2015.
�Of the five monitored freeway corridors in the central Puget Sound region, three (I-5, I-405 and I-90) saw congestion increases. Tolling and carpooling brought congestion on SR 520 and SR 167 down to levels 62% and 2% below 2007 pre-recession peak levels, respectively
�High occupancy vehicle (HOV) lanes accounted for 38% of person miles traveled on central Puget Sound region freeways in 2015
�After I-405 express lane tolling began on September 27, 2015, the express lanes in both directions met the legislatively mandated HOV lane speed requirement of 45 mph or faster 90% of the time during the peak travel periods from January through June 2016
WSDOT Incident Response teams responded to 16.3% more incidents (50,092 total) in 2015 than
in 2013, with the same average clearance time of 12 minutes and 45 seconds in both 2013 and 2015
�Proactive work by Incident Response teams resulted in $80.2 million in economic benefit in 2015, an 18.1% increase from 2013
Urban transit on commute corridorsMore people are taking transit than before. Transit ridership on urban commute corridors during daily peak periods increased 5.3%, from 90,300 in 2013 to 95,100 in 2015.
�The number of miles passengers traveled using transit during daily peak periods increased 6% on urban commute corridors, from 1.16 million miles in 2013 to 1.23 million miles in 2015
FerriesThe number of travelers using WSDOT Ferries continues its upward trend as annual ridership increased 6%, up from 22.5 million in 2013 to 23.9 million in 2015. Meanwhile, annual vehicle capacity utilization increased by two percentage points, from 60% in 2013 to 62% in 2015.
�Annual ferry trip reliability did not change significantly, at 99.5% in both 2013 and 2015
�Ferries on-time performance dropped approximately one percentage point from 2013 to 94.4% in 2015
Amtrak CascadesPassenger miles traveled on Amtrak Cascades decreased by 3.3% from 110.6 million miles in 2013 to 106.9 million miles in 2015, with ridership declining 3.2% during the same period, from approximately 694,000 to 672,000.
�Amtrak Cascades annual on-time performance fell by 4.6 percentage points, from 77.6% in 2013 to 73% in 2015
For WSDOT’s comprehensive annual analysis of multimodal system performance, visit http://www.wsdot.wa.gov/accountability/congestion/.
Return toTable of
Contents

GNB Edition 63 – September 30, 2016 | 27Strategic goal: Mobility – 2016 Corridor Capacity Report
2016 Corridor Capacity Report Dashboard of Indicators
2011 2012 2013 2014 2015Difference‘13 vs. ‘151
Demographic and economic indicators
State population (in millions) 6.77 6.82 6.88 6.97 7.06 2.6%
Gasoline price per gallon (annual average)2 $3.92 $3.96 $3.71 $3.56 $2.70 -27.2%
Washington total employment (in thousands of workers)3 2,872 2,919 2,986 3,065 3,154 5.6%
Taxable retail sales (in billions of dollars)2 $109.3 $112.6 $119.2 $125.0 $135.4 13.5%
Statewide multimodal performance measures
Drive alone commuting rate4 73.3% 72.2% 72.7% 72.4% 72.4% -0.3%
Carpool commuting rate4 10.2% 10.7% 10.1% 10.1% 9.8% 0.3%
Bicycling and walking commuting rate4 4.2% 4.5% 4.3% 4.5% 4.7% 0.4%
Public transit commuting rate4 5.6% 5.8% 6.3% 6.3% 6.2% -0.1%
Transit ridership5 (in millions) 195.1 218.1 221.2 227.2 N/A N/A
WSDOT Ferries ridership5 (in millions) 22.3 22.2 22.5 23.2 23.9 6.2%
Amtrak Cascades ridership6 (in thousands) 742 725 694 700 672 -3.2%
Statewide congestion indicators
Per person, total vehicle miles traveled on all public roads, state highways only
All public roads vehicle miles traveled (VMT) (in billions) 56.965 56.607 57.211 58.060 59.653 4.3%
All public roads per person VMT (miles) 8,417 8,303 8,313 8,332 8,448 1.6%
State highways VMT (in billions) 31.455 31.214 31.649 32.177 33.335 5.3%
State highways per person VMT (miles) 4,648 4,578 4,599 4,618 4,721 2.7%
Congestion on state highway system
Total state highway lane miles 18,642 18,659 18,662 18,680 18,699 0.2%
Percent of state highway system congested8 5.4% 5.5% 5.5% 5.8% N/A N/A
Per person, total, and cost of delay on state highways
Annual hours of per person delay on state highways9 4.8 4.7 4.7 4.7 N/A N/A
Total vehicle hours of delay (in millions of hours)9 32.0 30.9 32.5 32.3 N/A N/A
Cost of delay on state highways (in millions)2,9 $783 $773 $823 $834 N/A N/A
Results Washington system performance measures
Throughput productivity10 96.0% 95.7% 95.2% 94.6% 93.4% -1.8%
Reliability index10 1.15 1.17 1.19 1.24 1.26 5.9%
Corridor-specific congestion indicators (84 commutes statewide)11
Annual Maximum Throughput Travel Time Index (MT3I) 1.26 1.29 1.34 1.37 1.42 6.0%
Number of commute routes with MT3I > 112 60 59 61 62 68 11.5%
WSDOT congestion relief projects (cumulative)
Number of completed Nickel and Transportation Partnership Account mobility projects as of December 31 each year
82 91 94 98 99 5.3%
Project value (in millions of dollars) $2,802 $3,851 $3,985 $4,287 $4,669 17.2%
Data sources: Washington State Office of Financial Management, U.S. Energy Information Administration, Bureau of Labor Statistics – Consumer Price Index, Washington State Employment Security Department, Washington State Department of Revenue, WSDOT State Highway Log, U.S. Census Bureau - American Community Survey, National Transit Database, Washington Department of Ecology.
Notes: N/A = Not available. 1 Due to rounding, some percentages are not computable based on numbers in the table. 2 These dollar values are inflation-adjusted using the Consumer Price Index, and are reported in 2015 dollars. 3 Employment only includes non-agricultural workers. 4 Based on 1-year estimates from the American Community Survey, commuting rates are of workers age 16 and older. Totals do not equal 100 because “Worked at home” and “Other” categories not included here. 5 Ridership is the number of boardings, also called unlinked passenger trips. Complete 2015 data was not yet available from the National Transit Database, as some rural transit agency data had not been updated. 6 These figures include riders on Washington segments only. 7 Values for 2013 and 2014 will be published by the Washington Department of Ecology in December 2016. See pp. 11, 15, 21, 25, 29, 36, 40, 43 and 49 of the 2016 Corridor Capacity Report for corridor-specific greenhouse gas emissions data. 8 Based on below 70% of posted speed. 9 Based on maximum throughput speed threshold (85% of posted speed). 2015 statewide delay data was unavailable at the time of this publication. 10 See pp. 6-7 of the 2016 Corridor Capacity Report for descriptions of these measures. 11 Does not include Tri-Cities data. 12 MT3I greater than one means the commute route experiences congestion.
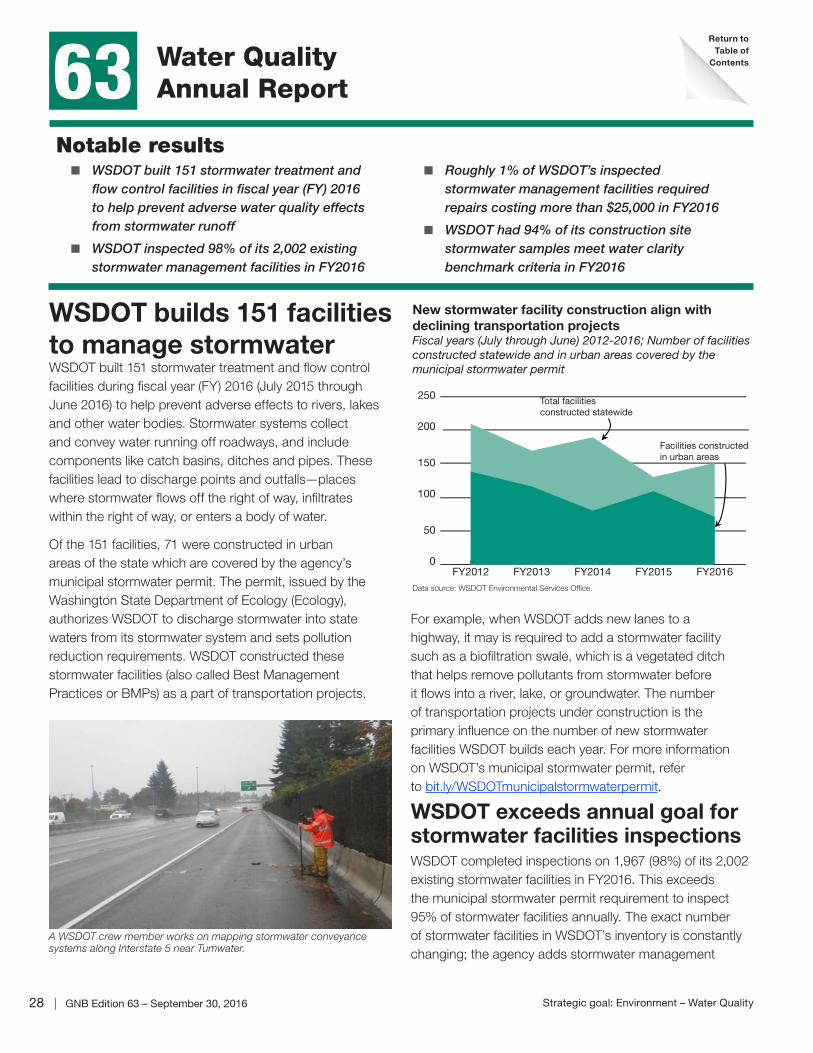
28 | GNB Edition 63 – September 30, 2016 Strategic goal: Environment – Water Quality
Water Quality Annual Report63
For example, when WSDOT adds new lanes to a highway, it may is required to add a stormwater facility such as a biofiltration swale, which is a vegetated ditch that helps remove pollutants from stormwater before it flows into a river, lake, or groundwater. The number of transportation projects under construction is the primary influence on the number of new stormwater facilities WSDOT builds each year. For more information on WSDOT’s municipal stormwater permit, refer to bit.ly/WSDOTmunicipalstormwaterpermit.
WSDOT exceeds annual goal for stormwater facilities inspectionsWSDOT completed inspections on 1,967 (98%) of its 2,002 existing stormwater facilities in FY2016. This exceeds the municipal stormwater permit requirement to inspect 95% of stormwater facilities annually. The exact number of stormwater facilities in WSDOT’s inventory is constantly changing; the agency adds stormwater management
WSDOT builds 151 facilities to manage stormwaterWSDOT built 151 stormwater treatment and flow control facilities during fiscal year (FY) 2016 (July 2015 through June 2016) to help prevent adverse effects to rivers, lakes and other water bodies. Stormwater systems collect and convey water running off roadways, and include components like catch basins, ditches and pipes. These facilities lead to discharge points and outfalls—places where stormwater flows off the right of way, infiltrates within the right of way, or enters a body of water.
Of the 151 facilities, 71 were constructed in urban areas of the state which are covered by the agency’s municipal stormwater permit. The permit, issued by the Washington State Department of Ecology (Ecology), authorizes WSDOT to discharge stormwater into state waters from its stormwater system and sets pollution reduction requirements. WSDOT constructed these stormwater facilities (also called Best Management Practices or BMPs) as a part of transportation projects.
Notable results � WSDOT built 151 stormwater treatment and
flow control facilities in fiscal year (FY) 2016 to help prevent adverse water quality effects from stormwater runoff
� WSDOT inspected 98% of its 2,002 existing stormwater management facilities in FY2016
� Roughly 1% of WSDOT’s inspected stormwater management facilities required repairs costing more than $25,000 in FY2016
� WSDOT had 94% of its construction site stormwater samples meet water clarity benchmark criteria in FY2016
A WSDOT crew member works on mapping stormwater conveyance systems along Interstate 5 near Tumwater.
New stormwater facility construction align with declining transportation projectsFiscal years (July through June) 2012-2016; Number of facilitiesconstructed statewide and in urban areas covered by the municipal stormwater permit
Data source: WSDOT Environmental Services Office.
0
50
100
150
200
250
FY2016FY2015FY2014FY2013FY2012
Total facilitiesconstructed statewide
Facilities constructedin urban areas
Return toTable of
Contents

GNB Edition 63 – September 30, 2016 | 29Strategic goal: Environment – Water Quality
WSDOT completes facility maintenance on timefacilities to its inventory as they are constructed, and removes facilities as necessary. Reasons for removal include determining city ownership of a facility, discovering a duplicate record in the inventory or the determination that the facility was not designed for stormwater management. Inspecting stormwater facilities helps WSDOT identify deficiencies that might limit their effectiveness.
In FY2016, WSDOT performed all typical maintenance on stormwater management facilities within the one-year time frame required by the permit. Typical maintenance often includes vegetation control and debris removal to enhance stormwater facility performance. WSDOT also completed all non-typical maintenance costing less than $25,000 within the required two-year time frame. Non-typical maintenance may include major vegetation removal or structural repairs. Non-typical repairs that cost more than $25,000 must be prioritized and corrected as funding becomes available. Approximately 1% (23) of WSDOT’s stormwater facilities require repairs costing more than $25,000.
WSDOT continues mapping its stormwater conveyance systemWSDOT began mapping the entire stormwater system along state highways within the agency’s municipal stormwater permit coverage area in spring 2014. As required by the permit, WSDOT set a pace (in terms of centerline miles per year) for system mapping based on existing resources. Ecology approved WSDOT’s pace to map 79.5 centerline miles per year in April 2016. With Ecology’s approval, this pace is now a performance requirement, applicable during the remaining three years
of WSDOT’s permit. The status of meeting the first year of the established pace will be reported in the next Water Quality Annual Report in the Gray Notebook.
To set the target pace, WSDOT categorized highways based on common characteristics that affect the time needed to map the stormwater system. The agency also considered traffic control and staffing, and used data collected during pilot mapping efforts in 2014 and 2015 as supporting documentation.
Mapping complete stormwater systems will help WSDOT maintain facilities, meet permit requirements, and be an environmental steward.
WSDOT on track to meet permit conditions for 367 facilities that lacked documentationIn Gray Notebook 55, WSDOT reported that 367 stormwater facilities lacked the design documentation the agency uses to determine maintenance needs. WSDOT must complete maintenance work on these facilities by the end of 2016 to remain in compliance with its municipal stormwater permit. WSDOT removed 237 of the facilities from its inventory for various reasons such as determining city ownership. The agency completed maintenance on 120 of the facilities still in WSDOT’s inventory and added five to the list needing non-typical maintenance exceeding $25,000. Four facilities are located at active construction sites and will be maintained at the end of the projects. WSDOT is on track to complete maintenance on the final facility before December 31, 2016.
WSDOT crews perform typical maintenance, including vegetation and sediment removal, on a retention pond in the Tri-Cities area near State Route 182. Maintenance activities like these ensure continued stormwater facility performance.
Before After
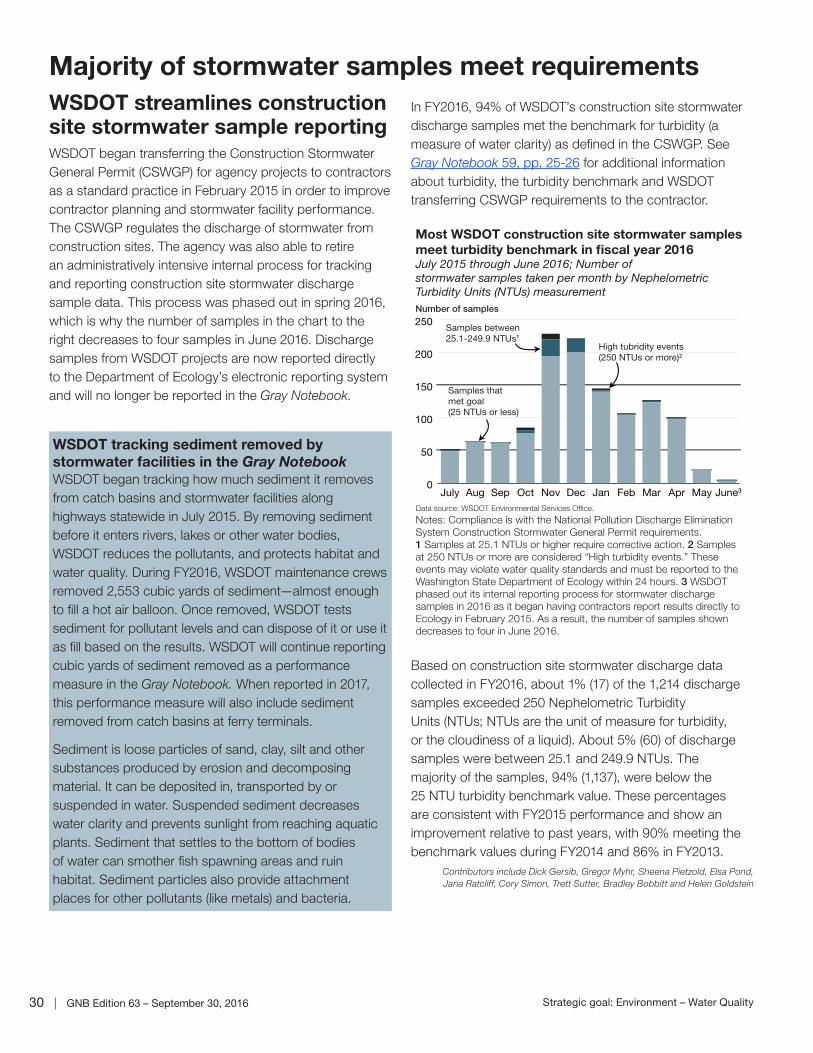
30 | GNB Edition 63 – September 30, 2016 Strategic goal: Environment – Water Quality
Majority of stormwater samples meet requirementsWSDOT streamlines construction site stormwater sample reportingWSDOT began transferring the Construction Stormwater General Permit (CSWGP) for agency projects to contractors as a standard practice in February 2015 in order to improve contractor planning and stormwater facility performance. The CSWGP regulates the discharge of stormwater from construction sites. The agency was also able to retire an administratively intensive internal process for tracking and reporting construction site stormwater discharge sample data. This process was phased out in spring 2016, which is why the number of samples in the chart to the right decreases to four samples in June 2016. Discharge samples from WSDOT projects are now reported directly to the Department of Ecology’s electronic reporting system and will no longer be reported in the Gray Notebook.
In FY2016, 94% of WSDOT’s construction site stormwater discharge samples met the benchmark for turbidity (a measure of water clarity) as defined in the CSWGP. See Gray Notebook 59, pp. 25-26 for additional information about turbidity, the turbidity benchmark and WSDOT transferring CSWGP requirements to the contractor.
Based on construction site stormwater discharge data collected in FY2016, about 1% (17) of the 1,214 discharge samples exceeded 250 Nephelometric Turbidity Units (NTUs; NTUs are the unit of measure for turbidity, or the cloudiness of a liquid). About 5% (60) of discharge samples were between 25.1 and 249.9 NTUs. The majority of the samples, 94% (1,137), were below the 25 NTU turbidity benchmark value. These percentages are consistent with FY2015 performance and show an improvement relative to past years, with 90% meeting the benchmark values during FY2014 and 86% in FY2013.
Contributors include Dick Gersib, Gregor Myhr, Sheena Pietzold, Elsa Pond, Jana Ratcliff, Cory Simon, Trett Sutter, Bradley Bobbitt and Helen Goldstein
WSDOT tracking sediment removed by stormwater facilities in the Gray NotebookWSDOT began tracking how much sediment it removes from catch basins and stormwater facilities along highways statewide in July 2015. By removing sediment before it enters rivers, lakes or other water bodies, WSDOT reduces the pollutants, and protects habitat and water quality. During FY2016, WSDOT maintenance crews removed 2,553 cubic yards of sediment—almost enough to fill a hot air balloon. Once removed, WSDOT tests sediment for pollutant levels and can dispose of it or use it as fill based on the results. WSDOT will continue reporting cubic yards of sediment removed as a performance measure in the Gray Notebook. When reported in 2017, this performance measure will also include sediment removed from catch basins at ferry terminals.
Sediment is loose particles of sand, clay, silt and other substances produced by erosion and decomposing material. It can be deposited in, transported by or suspended in water. Suspended sediment decreases water clarity and prevents sunlight from reaching aquatic plants. Sediment that settles to the bottom of bodies of water can smother fish spawning areas and ruin habitat. Sediment particles also provide attachment places for other pollutants (like metals) and bacteria.
Most WSDOT construction site stormwater samplesmeet turbidity benchmark in fiscal year 2016 July 2015 through June 2016; Number ofstormwater samples taken per month by NephelometricTurbidity Units (NTUs) measurement
Data source: WSDOT Environmental Services Office.
Notes: Compliance is with the National Pollution Discharge EliminationSystem Construction Stormwater General Permit requirements. 1 Samples at 25.1 NTUs or higher require corrective action. 2 Samplesat 250 NTUs or more are considered “High turbidity events.” These events may violate water quality standards and must be reported to theWashington State Department of Ecology within 24 hours. 3 WSDOTphased out its internal reporting process for stormwater discharge samples in 2016 as it began having contractors report results directly to Ecology in February 2015. As a result, the number of samples shown decreases to four in June 2016.
0
50
100
150
200
250
June3MayAprMarFebJanDecNovOctSepAugJuly
Samples that met goal (25 NTUs or less)
Samples between25.1-249.9 NTUs1
High tubridity events (250 NTUs or more)2
Number of samples

GNB Edition 63 – September 30, 2016 | 31Strategic goal: Stewardship – Construction Contracts
Construction Contracts Annual Report 63
WSDOT completes 141 construction contractsWSDOT completed 141 construction contracts valued at $540.3 million during fiscal year (FY) 2016 (July 2015 through June 2016). Final costs for these contracts were 10.3% ($61.9 million) less than the WSDOT engineer’s estimate of $602.1 million. These competitively-bid projects, which do not include design-build contracts (see p. 32 for definition), were completed for 3.2% ($16.9 million) more than the total award amount of $523.3 million.
Notable results � WSDOT completed 141 contracts valued at
$540.3 million in FY2016, 10.3% below the WSDOT engineer’s estimate
� WSDOT awarded 70 of 120 construction contracts (58.3%) below the engineer’s estimate in FY2016
WSDOT completes $540.3 million in contractsFiscal years 2015 and 2016; Dollars in millions
FY2015 FY2016
Number of contracts completed 147 141
Total award amount $926.0 $523.3
Total final contract cost $1,152 $540.3
Percent final contract cost exceeded award amount 24.4% 3.2%
Total engineer’s estimate $1,086 $602.1
Percent final cost above/below engineer’s estimate 6.1% -10.3%
Data source: WSDOT Construction Office.
How WSDOT tracks cost estimation accuracy
Engineer’s estimate
WSDOT engineers estimate the cost of a contract during the design phase. This estimate is based on current and forecasted material prices and takes into account the rate of inflation and recent bids on similar contracts. The engineer’s estimate is WSDOT’s forecasted cost for the work to be done by the contractor at the time it is advertised. WSDOT compares this estimate to the bids it receives to ensure they are reasonable. For more information on how WSDOT estimates construction costs, see Gray Notebook 56, p. 29.
Award amount
The award amount is equal to the lowest responsive bid (unless a contractor is unable to provide a satisfactory explanation for an unexpectedly low bid). WSDOT records the difference between the engineer’s estimate and the award amount in order to track the agency’s estimating accuracy and as an indicator of possible changes in market conditions. WSDOT’s goal is to have the engineer’s estimate be accurate and to award the contract to the lowest responsive bidder.
Final contract cost
For every completed contract, WSDOT tracks the final cost—the amount paid to the contractor at the end of construction—and compares it to the engineer’s estimate and the award amount. WSDOT’s goal is for the final cost to be no more than 10% above the award amount, a common benchmark in the construction industry.
Although WSDOT prepares detailed plans for estimating costs, changes may occur during construction. Final contract costs can be affected by unforeseen conditions, such as adding new items to the contract or changing the quantities of materials used. These changes can increase the cost of completing a construction contract as planned.
$0
$50
$100
$150
$200
20% or more1
10% to 19.99%
0% to 9.99%
0% to -9.99%
-10% to -19.99%
-20% or less
19
23
WSDOT completes construction contracts for 10.3% less than original engineer’s estimatesFiscal year 2016; Dollars in millions; Total final cost of contracts by percent above or below WSDOT’s estimate; Number of contracts in each category
25
30
28
16
Data source: WSDOT Construction Office.
Note: 1 The Mashel River Bridge – Bridge Scour contract had unusually large differences between the final cost and the engineer’s estimate and between the final cost and the award amount. See p. 32 for details.
Return toTable of Contents
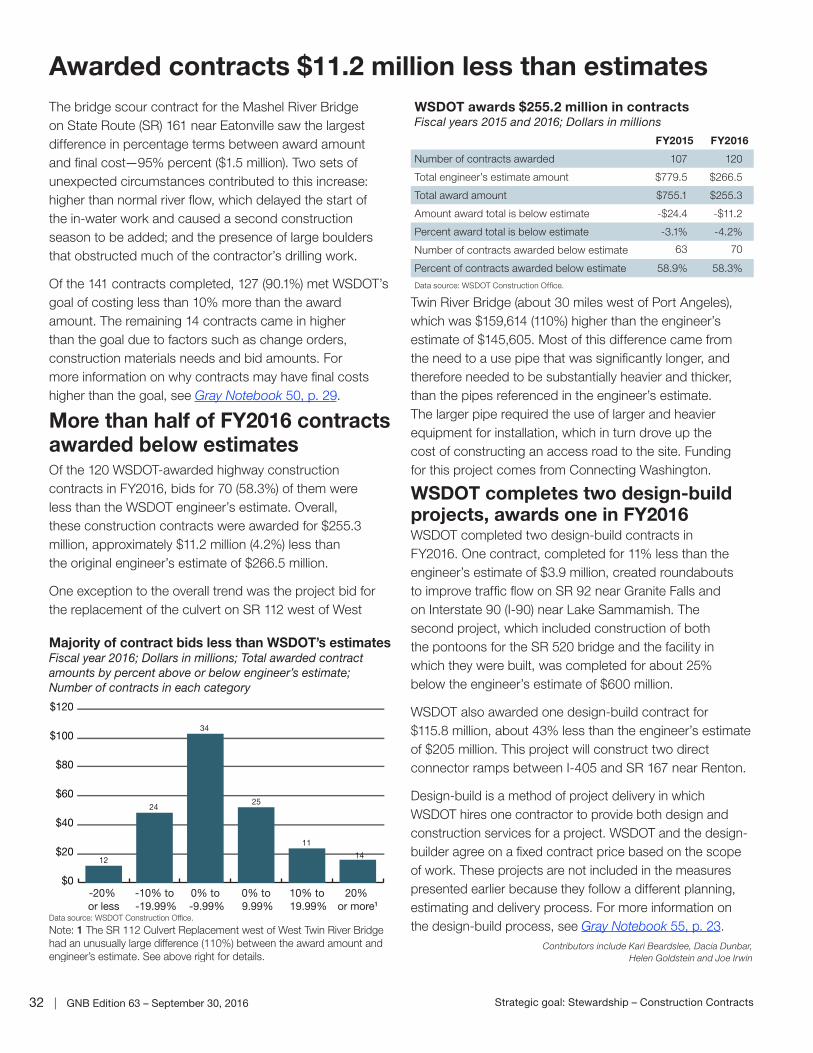
32 | GNB Edition 63 – September 30, 2016 Strategic goal: Stewardship – Construction Contracts
Awarded contracts $11.2 million less than estimatesThe bridge scour contract for the Mashel River Bridge on State Route (SR) 161 near Eatonville saw the largest difference in percentage terms between award amount and final cost—95% percent ($1.5 million). Two sets of unexpected circumstances contributed to this increase: higher than normal river flow, which delayed the start of the in-water work and caused a second construction season to be added; and the presence of large boulders that obstructed much of the contractor’s drilling work.
Of the 141 contracts completed, 127 (90.1%) met WSDOT’s goal of costing less than 10% more than the award amount. The remaining 14 contracts came in higher than the goal due to factors such as change orders, construction materials needs and bid amounts. For more information on why contracts may have final costs higher than the goal, see Gray Notebook 50, p. 29.
More than half of FY2016 contracts awarded below estimatesOf the 120 WSDOT-awarded highway construction contracts in FY2016, bids for 70 (58.3%) of them were less than the WSDOT engineer’s estimate. Overall, these construction contracts were awarded for $255.3 million, approximately $11.2 million (4.2%) less than the original engineer’s estimate of $266.5 million.
One exception to the overall trend was the project bid for the replacement of the culvert on SR 112 west of West
Twin River Bridge (about 30 miles west of Port Angeles), which was $159,614 (110%) higher than the engineer’s estimate of $145,605. Most of this difference came from the need to a use pipe that was significantly longer, and therefore needed to be substantially heavier and thicker, than the pipes referenced in the engineer’s estimate. The larger pipe required the use of larger and heavier equipment for installation, which in turn drove up the cost of constructing an access road to the site. Funding for this project comes from Connecting Washington.
WSDOT completes two design-build projects, awards one in FY2016 WSDOT completed two design-build contracts in FY2016. One contract, completed for 11% less than the engineer’s estimate of $3.9 million, created roundabouts to improve traffic flow on SR 92 near Granite Falls and on Interstate 90 (I-90) near Lake Sammamish. The second project, which included construction of both the pontoons for the SR 520 bridge and the facility in which they were built, was completed for about 25% below the engineer’s estimate of $600 million.
WSDOT also awarded one design-build contract for $115.8 million, about 43% less than the engineer’s estimate of $205 million. This project will construct two direct connector ramps between I-405 and SR 167 near Renton.
Design-build is a method of project delivery in which WSDOT hires one contractor to provide both design and construction services for a project. WSDOT and the design-builder agree on a fixed contract price based on the scope of work. These projects are not included in the measures presented earlier because they follow a different planning, estimating and delivery process. For more information on the design-build process, see Gray Notebook 55, p. 23.
Contributors include Kari Beardslee, Dacia Dunbar, Helen Goldstein and Joe Irwin
$0
$20
$40
$60
$80
$100
$120
20% or more1
10% to 19.99%
0% to 9.99%
0% to -9.99%
-10% to -19.99%
-20% or less
Data source: WSDOT Construction Office.
Note: 1 The SR 112 Culvert Replacement west of West Twin River Bridge had an unusually large difference (110%) between the award amount and engineer’s estimate. See above right for details.
Majority of contract bids less than WSDOT’s estimates Fiscal year 2016; Dollars in millions; Total awarded contract amounts by percent above or below engineer’s estimate; Number of contracts in each category
12
24
34
25
14
11
WSDOT awards $255.2 million in contracts Fiscal years 2015 and 2016; Dollars in millions
FY2015 FY2016
Number of contracts awarded 107 120
Total engineer’s estimate amount $779.5 $266.5
Total award amount $755.1 $255.3
Amount award total is below estimate -$24.4 -$11.2
Percent award total is below estimate -3.1% -4.2%
Number of contracts awarded below estimate 63 70
Percent of contracts awarded below estimate 58.9% 58.3%
Data source: WSDOT Construction Office.
GNB Edition 63 – September 30, 2016 | 33Strategic goal: Stewardship – Lean
Lean Process Improvements Quarterly Update 63
WSDOT’s Lean training numbers remain steadyWSDOT continues to train its employees on Lean tools and practices with in-house training delivered by trainers and practitioners. WSDOT’s practitioners provided Introduction to Lean training to 88 active WSDOT employees during the third quarter of 2016 (July through September). Since the class began in January 2015, 3,228 active (current) employees have received introductory Lean training—46% of the WSDOT workforce (this percentage remained the same as last quarter due to attrition, with a net gain of 15 employees this quarter after accounting for those who have left the agency). This exceeds the goal of training 2,600 employees by November 2016. The percent of the current workforce trained is a more stable measure of Lean participation as it accounts for WSDOT employees who gradually retire or leave the agency.
WSDOT continues to offer Lean problem solving training. In the third quarter of 2016, 69 employees participated in the problem solving class. As of September 30, 2016, a total of 259 active WSDOT employees have participated in this half-day training. The course better enables participants to evaluate the current state of an issue, conduct a root- cause analysis, and test and implement countermeasures.
WSDOT’s Lean practitioners launched three new Lean improvement projects this quarter. One focuses
Notable results � WSDOT trained a total of 259 employees in
Lean problem solving in 2016, with 69 trained this quarter
� WSDOT’s out of state travel planning process improvement resulted in 18.9 hours of staff time redeployed to other valuable tasks
Strategic Plan Goal 4: ORGANIZATIONAL STRENGTHWorkforce Strategy – Implement various strategies that foster a safe, capable,
engaged and valued workforce.
WSDOT has set calendar year 2016 goals for the number of Lean process improvement projects, as well as training targets for two of the in-house Lean classes that WSDOT offers, to be achieved by November 2016. See table below for progress toward these goals.
WSDOT’s 2016 goals for Lean endeavors
MeasureAs of
Sep 2016Goal for
Nov 2016
Total Lean process improvement projects1 83 100
Employees trained through Intro to Lean2 3,228 2,600
Employees trained through problem solving2 259 500
Data source: WSDOT Lean Process Improvement Office.
Notes: 1 Includes new, in progress and completed projects. 2 In-house course offered by WSDOT.
on a six-year planning process which communicates WSDOT’s intentions regarding the agency’s transportation infrastructure investments. The second new project is to improve quality, consistency and speed in processing construction project documents. The third new project looks to improve the reporting and reimbursement process for third party damages. Results from a recently completed project are highlighted in the table below.
Contributors include Russell Burgess, Amber Sander, Bryan Turner and Yvette Wixson
WSDOT’s Lean project streamlines out of state travel processesJuly through September 2016; Progress reported on a sample project
Project, program Changes to process Measuring success Results
COMPLETE: Streamlining proposed out of state travel plan yearly process
Development Division and Office of Engineering and Policy Innovation
� Developed a system to track and monitor work-related trips that are substituted for other pre-approved trips (the system includes data on availability of trips, cost comparisons and expenditures)
� The new system provides real-time tracking of expenditures and pending payments
In the past 12 months: � Reduced time required to access information for a substitute trip from 30 to 3 minutes
� Reduced steps in the process from six to two, and eliminated four points at which rework often occurred in the past
� WSDOT typically processes more than 90 travel requests per year. There were 21 substitute trips in the first year after implementation of the Lean process improvement. As a result, WSDOT employees redeployed 18.9 hours per year to work on higher priority items
Data sources: WSDOT Development Division, Office of Engineering and Policy Innovation and WSDOT Lean Process Improvement Office.
Return toTable of Contents

34 | GNB Edition 63 – September 30, 2016 Strategic goal: Stewardship – Capital Project Delivery Programs
Capital Project Delivery Programs Quarterly Update63
WSDOT completes three new Nickel, TPA projectsWSDOT completed three Nickel and Transportation Partnership Account (TPA) construction projects during the fifth quarter of the 2015-2017 biennium (July through September 2016). WSDOT has completed 374 of 421 Nickel and TPA construction projects since July 2003, with 87% on time and 92% on budget. The agency has 12 Nickel and TPA projects underway; see p. 41 for details.
This quarter, WSDOT reconciled its Nickel and TPA project counts to update how they have progressed since their inception. Changes include:
�Removing four former Nickel and TPA projects that are now funded by the Connection Washington transportation package;
�Counting five non-construction commitments (which include studies, right of way and engineering work) that have been completed. (These, added to the 374 construction projects, brings the overall total completed to 379); and,
�Removing 13 projects from the list that have been deleted or deferred indefinitely.
As a result of this reconciliation process, 17 of the 421 projects will be removed from future Gray Notebook reporting of Nickel and TPA projects, bringing the new total project count to 404.
The cost at completion for the 374 Nickel and TPA construction projects is $6.66 billion, 2.2% less than the baseline cost of $6.81 billion. As of September 30, 2016, WSDOT has 25 projects (including the 12 projects currently underway) that have yet to be completed. These remaining projects have a total value of more than $8.69 billion.
WSDOT has completed eight Nickel and TPA construction projects so far in the 2015-2017 biennium on time and on budget when compared to the lastlegislatively approved schedules and budgets. The cost at completion for these eight projects is $609.1 million, 5.1% less than the baseline cost of $641.5 million.
Nickel, TPA funding remains short of original 2003, 2005 projectionsFuel tax collections show that the revenue forecasts from 2003 and 2005, which were used to determine the project lists, did not anticipate the economic recession in projecting future growth in fuel tax revenues. The 2003 Nickel and 2005 TPA gas taxes that fund projects are based on a fixed tax rate per gallon and do not change with the price of fuel. As a result, reduced gasoline and diesel consumption leads to reduced tax revenue.
374 9287 construction projects complete
% on time
% on budget
Data source: WSDOT Capital Program Development and Management.
Notes: Construction projects complete are cumulative since July 2003. A project is “on time” if it is operationally complete within the quarter planned in the last approved schedule, and “on budget” if the costs are within 5% of the last approved budget. The goal for both measures is 90% or higher. 1 The count of total completed projects (including non-construction) is 379 out of the planned 421 projects.
Goal for Nickel and TPA is 90%1
Strategic Plan Goal 1: STRATEGIC INVESTMENTSProject Delivery – Deliver transportation projects that are on time and on budget.
WSDOT continues to deliver its Nickel and TPA program funded projects with a high rate of success. Of the total 374 construction projects completed to date, 87% have been on time and 92% have been on budget.
Notable results � WSDOT completed three additional Nickel
and TPA construction projects during the fifth quarter of the 2015-2017 biennium
� WSDOT reconciled its Nickel and TPA counts this quarter to include non-construction projects, bringing the total to 379 completed
� WSDOT removed five projects from its Watch List during the fifth quarter of the 2015-2017 biennium; three remain
� WSDOT advertised 16 of 21 Pre-existing Funds projects on time; two emergent projects were also advertised
Return toTable of
Contents

GNB Edition 63 – September 30, 2016 | 35Strategic goal: Stewardship – Capital Project Delivery Programs
Not all Nickel/TPA projects involve constructionThe 2003 Nickel transportation package was originally a 10-year plan, with revenues forecasted to total $1.9 billion from 2003 through 2013. Fuel tax revenues collected during this period came in 10.2% less than the original March 2003 projections. Four Nickel projects have been deferred indefinitely (see chart below) while other projects have continued past the original 10-year period.
Fuel tax funding from the 2005 TPA package is also less than the original March 2005 projections. The original projection for the TPA account was $4.9 billion over a 16-year period from 2005 through 2021. The current projections through 2021 are estimated to be $4 billion, roughly $900 million less (18.2%) than the original 2005 projection. This revenue shortfall has caused nine TPA projects to be deferred indefinitely (see chart below).
Nickel and TPA gas tax revenues are used to pay the debt on the bonds sold to finance the planned
projects. Once all the bonds are sold, revenues collected will be used to pay the debt.
Beige Page contributors include Mike Ellis, Mitzi Frick, Penny Haeger, Heather Jones, Claudia Lindahl, Thanh Nguyen,
Theresa Scott, Aaron Ward, Matt Clark and Joe Irwin
WSDOT confirms Nickel and TPA project reconciliation listJune 2013 through September 2016
Completed non-construction projects1 (5)
I-90/Issaquah to North Bend - Route Development Study SR 167 Improvement Projects - Corridor Mobility Improvement Analysis
SR 167/I-5 to SR 161 Stage Two - New Freeway SR 509/I-5/SeaTac to I-5 - Design and Critical Right of Way
SR 302/Elgin Clifton Rd. to SR 16 - Corridor Study
Projects deleted or deferred indefinitely (13)
I-5/SR 525 Interchange Phase SR 161/36th to Vicinity 24th St. East - Widen to Five Lanes
SR 9/SR 528 - Improve Intersection SR 305/Agate Pass Bridge - Upgrade Bridge Rail
SR 3/Fairmont Ave. to Goldsborough Creek Bridge - Replace Bridge I-5/Columbia River Crossing/Vancouver - Environmental Impact Statement
US 101/Dawley Rd. Vicinity to Blyn Highway - Add Climbing Lane US 12/Old Naches Highway - Build Interchange
US 101/Gardiner Vicinity - Add Climbing Lane US 195/Spring Flat Creek - Bridge Replacement
US 101/Corriea Rd. Vicinity to Zaccardo Rd. - Slope Flattening I-405/NE 44th St. to 112th Ave. Southeast - Widening
SR 109/Moclips River Bridge - Replace Bridge
Former Nickel/TPA projects now funded by Connecting Washington (4)
SR 20/Sharpes Corner Vicinity - New Interchange SR 4/Abernathy Creek Bridge - Replace Bridge
SR 3/Belfair Bypass - New Alignment I-405/NE 132nd St. - New Interchange
Data source: WSDOT Capital Program Development and Management.
Note: 1 Completed non-construction projects include right of way, design work, and studies for the projects listed.
Data source: WSDOT Capital Project Delivery Programs.
Construction projects completed374 (89%)
Deleted or deferredinde�nitely, 13 (3%) Projects now
funded by Connecting Washington,4 (1%)
Remaining construction projects, 25 (6%)
Non-construction projects completed, 5 (1%)
WSDOT reconciles Nickel/TPA projectsJuly through September 2016; 421 total planned
projects

36 | GNB Edition 63 – September 30, 2016 Strategic goal: Stewardship – Current Legislative Evaluation and Accountability Program
WSDOT has 25 Nickel, TPA projects left to completeHighway construction performance summary shows about $9.6 billion in projects remain to be completedCurrent Legislative Evaluation and Accountability Program as of September 30, 2016; Dollars in millions
Combined Nickel and TPA programsNumber of
projectsValue of
program
Subtotal of completed projects1 374 $6,808.7
Non-construction projects that have been completed or otherwise removed from Nickel/TPA lists2, 3 5 $74.4
Projects included in the current transportation budget but not yet complete 25 $8,693.9
Projects that have been deferred indefinitely or deleted and removed from Nickel/TPA lists2, 4 13 $499.2
Projects now funded by Connecting Washington and removed from Nickel/TPA lists (see p. 37) 4 $101.7
Total number of projects4 in improvement and preservation budget 421 $16,177.9
Schedule and budget summary Nickel & TPA combined: Results of completed projects in the current Legislative Transportation Budget and prior budgets.
Completed in 2015- 2017 biennium budget
Cumulative program
Number of projects completed 8 374
Percent completed early or on time 100% 87%
Percent completed under or on budget 100% 92%
Baseline cost at completion $641.5 $6,808.2
Current cost at completion $609.1 $6,657.9
Percent of total program over or under budget 5.1% under 2.2% under
Advertisement record: Results of projects entering into the construction phase or under construction, detailed on p. 41. Combined Nickel & TPA
Total current number of projects in construction phase as of September 30, 2016 12
Percent advertised early or on time 83%
Total number of projects advertised for construction in the 2015-2017 biennium (July 1, 2015, through June 30, 2017)
2
Percent advertised early or on time 50%
Projects to be advertised: Results of projects now being advertised for construction or planned to be advertised, detailed below. Combined Nickel & TPA
Total projects being advertised for construction bids (October 1, 2016, through March 31, 2017) 0
Percent on target for advertisement on schedule or early 0%
Budget status for the 2015-2017 biennium: WSDOT biennial budget
Budget amount for 2015-2017 biennium $1,769.7
Actual expenditures in 2015-2017 biennium to date (July 1, 2015, through September 30, 2016) $953.5
Total 2003 Transportation Funding Package (Nickel) expenditures $58.9
Total 2005 Transportation Partnership Account expenditures $549.8
Total Pre-existing Funds expenditures5 $344.8
Data source: WSDOT Capital Program Development and Management.
Notes: Numbers have been rounded. This chart was updated in GNB 63 to reflect reconciled Nickel and TPA project counts, and as a result it does not exactly match Current Legislative Evaluation and Accountability Program charts from previous editions. 1 Cumulative projects completed from July 1, 2003, to September 30, 2016. 2 Non-construction projects include commitments for engineering and right of way work. 3 Projects that have been deferred indefinitely or deleted include projects that have no funding available, projects that have been halted by the Legislature and those for which other entities (e.g., cities and counties) are now serving as the lead agency. 4 The project total has been updated to show “unbundled” projects which may have been previously reported in programmatic construction groupings (such as Roadside Safety Improvements or Bridges Seismic Retrofit). See Gray Notebook 38, p. 55 for more details. 5 For full details of the Pre-existing Funds program, see pp. 45-46.

GNB Edition 63 – September 30, 2016 | 37Strategic goal: Stewardship – Current Legislative Evaluation and Accountability Program
WSDOT finishes 12 Nickel rail projects since 2003
Schedule, scope, and budget summary: Completed LEAP projects
Cumulative to date (July 1, 2003, through September 30, 2016) 12 7 19
Percent completed early or on time1 100% 100% 100%
Percent completed within scope1 100% 100% 100%
Percent completed under or on budget1 100% 100% 100%
Baseline cost at completion $72.6 $41.0 $113.6
Current cost at completion $72.6 $41.0 $113.6
Percent of total program on or under budget1 100% 100% 100%
Advertisement record: LEAP projects under construction or entering construction phase
Cumulative to date (July 1, 2003, through September 30, 2016) 1 2 3
Total advertised 1 2 3
Percent advertised early or on time 100% 100% 100%
Total award amounts to date $119.6 $27.1 $146.7
Data source: WSDOT Capital Program Development and Management.
Notes: Numbers may not total 100% due to rounding. The rail projects are primarily delivered through master agreements with BNSF, which administers construction activities on the projects. The data above is unchanged from the previous quarter because no additional rail projects were completed. 1 Rail projects are commitments delivered by BNSF, Sound Transit, ports and operators. Master agreements between WSDOT and lead agencies become the documents that govern the delivery of the project including budget, scope and schedule. The administrative process allows for amendments enabling the projects to be delivered within the parameters of the new amended agreement (on time, and on budget).
2003 NickelPackage
2005 TPAPackage
Combined Nickel & TPA
Schedule, scope, and budget summary: Completed LEAP projects1
Cumulative to date (July 1, 2003, through September 30, 2016) 12 10 22
Percent completed early or on time2 100% 100% 100%
Percent completed within scope2 100% 100% 100%
Percent completed under or on budget2 100% 100% 100%
Baseline cost at completion $180.7 $343.5 $524.2
Current cost at completion $180.7 $343.5 $524.2
Percent of total program on or under budget2 100% 100% 100%
Advertisement record: LEAP projects under construction or entering construction phase
Cumulative to date (July 1, 2003, through September 30, 2016) 1 0 1
Percent advertised early or on time2 100% N/A 100%
Total award amounts to date $123.0 $0 $123.0
Data source: WSDOT Capital Program Development and Management.
Notes: Numbers may not total 100% due to rounding. 1 Ferries completed projects record includes two 144-car vessels: the Motor/Vessel Samish, which started service in June 2015, and the M/V Tokitae, which started service in June 2014. It also includes three 64-car vessels: the M/V Chetzemoka, which started service in November 2010, the M/V Salish, which started service in July 2011, and the M/V Kennewick, which started service in February 2012. 2 The Legislature funds Ferries’ projects at a grouped-project or Budget Identification Number (BIN) level for terminals and vessels; however, the delivery of construction projects requires that each of these BIN groups be broken into sub-projects with specific scopes, budgets and schedules. The list of sub-projects is updated as the project progresses into the design phase and the budget and schedule are better defined. This process enables WSDOT to deliver the projects within the updated budget amounts and milestones (on time, and on budget).
2003 NickelPackage
2005 TPAPackage
Combined Nickel & TPA
WSDOT did not complete any new Legislative Evaluation and Accountability Program rail or ferry projects this quarter. WSDOT has used the 2003 (Nickel) and 2005 (TPA) funding packages to complete 19 rail projects and 22 ferries projects since 2003. Approximately $524.2 million in ferries projects have been funded by the Nickel, TPA
and multimodal accounts. The multimodal account has also funded approximately $103.3 million in rail projects. WSDOT advertised three multimodal account rail projects, with awards amounting to $146.7 million. An additional new $123 million ferry vessel, funded with Nickel cash and bond proceeds, is also currently under construction.
WSDOT completes 19 rail and 22 ferries project to date
Current Legislative Evaluation and Accountability Program as of September 30, 2016; Dollars in millions
Current Legislative Evaluation and Accountability Program as of September 30, 2016; Dollars in millions
WSDOT finishes 12 Nickel ferries projects since 2003
38 | GNB Edition 63 – September 30, 2016 Strategic goal: Stewardship – Completed Projects
WSDOT completes three TPA projects in the quarterWSDOT completed three Transportation Partnership Account (TPA) projects in the fifth quarter of the 2015-2017 biennium (July through September 2016).
I-5/Blakeslee Junction Railroad Crossing to Grand Mound Interchange – Add Lanes (TPA) Lewis CountyA scope of work to add capacity to Interstate 5 (I-5) from Centralia north to Grand Mound was originally wholly contained within this project but was divided into four subprojects to provide better clarity when reporting progress. This subproject focused on the four-mile section between Blakeslee Junction and Grand Mound and was completed in November 2011 (see GNB 44, p. 84), but it is also serves as the principal reference project for all subprojects comprising the original scope. With the completion of work on the interstate section from Blakeslee Junction south to Centralia (described next) the original scope of work is now reported as operationally complete.
I-5/Mellen Street to Blakeslee Junction – Add Lanes, Interchange Improvements (TPA) Lewis CountyThis project widened I-5 to three lanes in each direction between Blakeslee Junction and the interchange at Harrison Street in Centralia to the south. Additionally, a new overcrossing was constructed south of Mellen Street, the Harrison Avenue interchange was improved and a new bridge over the railroad tracks was built at Blakeslee Junction. Additionally, two Skookumchuck River bridges were repaired and painted.
Project benefits: Separated, additional lanes aim to reduce congestion, improve traffic flow and enhance safety by eliminating traffic weaving and merging, and by keeping local traffic off of the freeway.
Budget performance: The project was completed for $110 million, on target with the original and last legislatively approved budget. The original budget allocated $155 million.
Schedule performance: The original schedule approved by the legislature and the most recently approved schedule called for project completion in November and December 2015, respectively. The project was completed in August 2016.
Highlights/challenges: Repair and repainting work on the Skookumchuck River bridges was not completed in time for paving work to be carried out during summer 2015, delaying project completion until August 2016.
I-205/Mill Plain Interchange Stage 2 – Build Interchange (TPA) Clark CountyThis project constructed a new Interstate 205 (I-205) northbound off-ramp and a new southbound on-ramp at Northeast 18th Street in Vancouver.
Project benefits: The new ramps aim to improve safety and mobility on I-205 by preventing traffic backups forming on congested interchanges.
Budget performance: The project was completed at a cost of $40.6 million, consistent with the last legislatively approved budget. The original budget allocated $58 million.
Schedule performance: The project was completed on time compared with the last legislatively approved timeline (December 2016) despite the project’s advertisement date being postponed. This project was not completed on time with the original schedule, which called for completion in June 2013.
Highlights/challenges: Originally designed in 2007, the project’s advertisement date was delayed to incorporate construction aspects identified through
Measuring operationally complete projectsDelivery performance of completed projects is measured against the last legislatively approved schedules and budgets in accordance with criteria established by the Legislature. For this quarter, it is the 2016 transportation supplemental budget. In addition to the projects’ last approved budgets and schedules, original legislative budgets and schedules are included to show changes that may have occurred during design and construction phases.
Projects are “on time” if they are operationally complete within the quarter planned in the last approved schedule, and “on budget” if the costs are within 5% of the last approved budget.
Nickel and TPA budgets and schedules reset whenever changes are made in the last approved legislative budget. For information on previously completed Nickel and TPA projects, visit www.wsdot.wa.gov/projects/completed.

GNB Edition 63 – September 30, 2016 | 39Strategic goal: Stewardship – Completed Projects
A worker moves chains on the new Secret Creek box culvert watches an excavator bury it to allow SR 532 to be reconstructed on top. The 18-foot wide by 10-foot tall culvert replaces a 4-foot diameter pipe and will feature a rebuilt streambed and native vegetation.
Capacity grows for fish traveling under State Route 532value engineering and practical design in May 2014. WSDOT redesigned a roundabout which eliminated the need for left-turn lanes, and preserved two overpasses instead of reconstructing them.
Further cost reductions occurred because revised traffic projections warranted only single-lane instead of two-lane exit ramps, and material costs on several bid items had declined since the initial design.
SR 532/Pilchuck Creek Tributary (Secret Creek) – Fish Barrier Removal (TPA) Snohomish CountyThe culvert at Secret Creek, a tributary to Pilchuck Creek, was replaced with an oversized box culvert to recreate natural stream conditions and improve fish passage under State Route 532. This relates to five other projects which target enhanced traffic flow and motorist safety for those traveling between Camano Island and I-5.
Project benefits: The project aims to improve access to nearly three miles of habitat for salmon, trout and steelhead.
Budget performance: The project was completed at a cost of $3.4 million, in line with the last legislatively approved budget. The original budget approved by the legislature for this project was $170,000. That budget was later adjusted when WSDOT decided against retrofitting the existing fish passage, and opted to construct a new box culvert.
Schedule performance: The project was completed three weeks ahead of the last legislatively approved date, October 2016. The project was not completed on time compared with the originally scheduled date (January 2010).
Highlights/challenges: In coordination with Washington Department of Fish and Wildlife, WSDOT decided against retrofitting the existing fish passage, and elected to construct a new box culvert.
Challenges with right-of-way acquisition and a schedule to relocate power lines as part of interrelated projects along the SR 532 corridor led to delays, and these also had an impact on the construction of this project.
I-90/Freya Street Interchange – Ramp Improvements (TPA) Spokane CountyThis TPA subproject addressed operational inefficiencies at the westbound off-ramp of I-90, and modified its intersection with the local roadway. Work on this subproject is complete, but it does not count as an operationally complete project in the quarter because it is part of the larger North Spokane Corridor project.
Subproject benefits: The lengthened ramp has capacity for vehicles queueing during peak hours, preventing backups onto mainline I-90.
Budget performance: The project was completed under budget for $3.1 million, 21% less than the $3.9 million allocated in the original and the last legislatively approved budgets.
Schedule performance: The project was completed in August 2016, on time with the last legislatively approved schedule. The original schedule approved by the legislature called for completion in November 2015.
Highlights/challenges: Budget constraints in the previous biennium and a planned delay to enable federal funding meant all construction expenditures for this project were postponed until the 2015-2017 biennium.
WSDOT and Spokane Regional Transportation Council jointly agreed to a further delay to coordinate funding with the federal Congestion Mitigation and Air Quality Improvement Program, ensuring those funds would be available to the project.

40 | GNB Edition 63 – September 30, 2016 Strategic goal: Stewardship – Watch List
WSDOT’s Watch List steady as three projects remainWSDOT added four new projects to its Watch List and removed five this quarter (July through September 2016), leaving three projects on the Watch List as of September 30. See table below for this quarter’s Watch List projects.
WSDOT maintains the Watch List to deliver on the agency’s commitment to “No Surprises” reporting. WSDOT continuously monitors its projects’ performance to ensure issues affecting schedule or budget are brought to the attention of legislators, executives and the public. The Watch List provides information on issues that currently affect projects or have the potential to impact project schedules and budgets.
WSDOT’s Watch List projects with schedule or budget concernsQuarter ending September 30, 2016
Project (County)Date
addedDate
removed Watch List issue
Projects no longer on Watch List
SR 18/Westbound East of Green River Bridge - Unstable Slope (King)
Sep- 2016
Sep- 2016
Heavy rainfall in November 2015 caused a landslide which impacted the westbound lanes of State Route (SR) 18 near Auburn. WSDOT temporarily closed the westbound lane and shoulder, removed trees and debris and placed plastic sheeting on the hillside to allow for drainage. Permanent restoration work will stabilize the failing hillside by backfilling the site with large rocks and installing new drains. This project has been removed from the Watch List.
US 101/Elwha River Bridge - Scour Repair (Clallam)
Sep- 2016
Sep- 2016
The bridge pier foundations require emergency scour protection from erosion during the winter, as it has experienced significant scour resulting from the Elwha River Dam removal and changes in river flow. The emergency work will be completed in November 2016, but the bridge may require emergency closure for specific river flow events. WSDOT is also establishing a monitoring system and may construct a permanent solution. This project has been removed from the Watch List.
SR 539/Nooksack River Bridge - Special Repair (Whatcom)
Sep- 2016
Sep- 2016
A truck traveling northbound on SR 539 struck the Nooksack River Bridge in September, damaging the support beams. One lane of SR 539 was closed temporarily while WSDOT inspectors worked to determine the bridge had not been structurally compromised. All lanes were re-opened to traffic. WSDOT will install replacement beams during summer 2017. This project has been removed from the Watch List
I-5 Chamber Way Overpass - Repair Bridge (Lewis)1
Sep- 2016
Sep- 2016
The Chamber Way overpass bridge was damaged by an over-height load and was closed as a safety precaution. After an inspection, bridge engineers determined that most of the girders supporting the bridge deck were not repairable, and the bridge span over the southbound lanes of I-5 was removed. A temporary bridge span has been installed and traffic access was restored. Construction work for a permanent bridge restoration project is planned to begin in fall 2017, and the project has been removed from the Watch List.
SR 3/Belfair Area – Widening and Safety Improvements (Mason)
Mar- 2016
Sep- 2016
Heavy rainfall and a higher than expected water table caused three detention ponds to flood. The ponds are being redesigned, resulting in cost increases and project delays. This project has been removed from the Watch List.
Projects remaining on Watch List
SR 161/24th St. East to Jovita – Add Lanes (Pierce)
Sep- 2014
This project was operationally complete in August 2014 and is facing a potential cost increase pending a claim from the contractor.
SR 112/Nordstrom Creek – Remove Fish Barrier (Clallam)2
Mar- 2016
Continued delays in acquiring a temporary construction easement have further delayed advertisement for the project. WSDOT is currently in negotiations with the property owner to secure the easement. Construction is anticipated to begin in 2017.
SR 99/South King St. Vicinity to Roy St. – Viaduct Replacement (King)
Dec- 2013
The project completion date has been delayed. The project’s contractor, Seattle Tunnel Partners, updated the projected tunnel opening date to early 20193.
Data sources: WSDOT Capital Program Development and Management and WSDOT Regions.
Notes: 1 This project was originally added to the Watch List in July 2016 when the bridge was struck by an over-height load. It was removed from the Watch List in August 2016 when a temporary bridge span was installed. In September 2016 WSDOT decided on a permanent restoration project for the bridge; it was then added and removed again in that month. 2 This project was originally added to the Watch List in March 2016. It was removed in May 2016. Further delays in the project’s advertisement date occurred and it was added again in September 2016. 3 The schedule for this project changes frequently and WSDOT cannot verify the contractor’s schedule.
The Watch List helps WSDOT track these projects, providing status reports, explaining the factors affecting delivery and what the agency is doing to address them. Projects are removed from the Watch List when these issues are resolved.
See Gray Notebook 51, p. 40, for a list of common issues that might put projects on the Watch List. To read more about the Watch List items, visit: bit.ly/WSDOTWatchList. Future editions of the Gray Notebook will also report Watch List issues for projects funded by the Connecting Washington transportation package. For an overview of the 2015 revenue package, see Gray Notebook 58, p. 9.

GNB Edition 63 – September 30, 2016 | 41Strategic goal: Stewardship – Advertisement Record
Project descriptionCumulative to date (County) Fund Type
On-time advertised
Ad date Contractor
Operationally complete date
Award amount
I-5 Concrete Rehabilitation Program (King)Nickel √ Jul-2009
Multiple contractors
May-2023 $9.8Multiple contractors continue to work on this project.
SR 99/Alaskan Way Viaduct – Replacement (King)
This project replaces an aging viaduct with a new viaduct on the south end and adds a tunnel in downtown Seattle. WSDOT is funding or leading 30 contracts or projects as part of the viaduct replacement effort. Active Nickel/TPA projects are shown below:
• SR 99/South King Street Vicinity to Roy Street – Viaduct Replacement
Nickel/TPA √ May-2010Seattle Tunnel Partners
TBD $1,089.7
Oct-2013Guy F. AtkinsonConstruction
TBD $41.6
This subproject has several contract components; the bored tunnel, north and south access connections and associated work. The schedule for this project changes frequently and WSDOT cannot verify the contractor’s schedule at this time.
US 395/North Spokane Corridor (NSC) – Design and Right of Way – New Alignment (Spokane)
Nickel/TPA
SR 502/I-5 to Battle Ground – Add Lanes – Stage 2 (Clark) TPA √ Jan-2014 Rotschy Oct-2016 $27.5
I-90/Concrete Rehabilitation
• I-90/Oakes Avenue Interchange to Peoh Road Bridge Vicinity Westbound – Replace/Rehabilitate Concrete (Kittitas)
Nickel √ Mar-2015Midmountain Contractors
Nov-2016 $10.6
SR 520/Bridge Replacement and HOV (King)
• SR 520/I-5 to Medina – Evergreen Point Floating Bridge and Landings
TPA √ Dec-2010Kiewit-General, A Joint Venture
Jul-2017 $586.6
An additional contract award for this project is pending.
SR 3/Belfair Area – Widening and Safety Improvements (Mason)
TPA Late Apr-2015 Ceccanti Nov-2016 $10.3
Advertisement was delayed due to revised project limits, which affected right of way acquisition.
SR 167/8th St. East Vicinity to South 277th St. Vicinity – Southbound Managed Lane (King, Pierce)
TPA √ Aug-2014Guy F. AtkinsonConstruction
Jun-2017 $53.9
SR 167/SR 18 Interchange West-North Ramp North-East Ramp Overcrossing – Seismic Retrofit (Pierce)
TPA √ Combined with project above for construction efficiencies.
I-5/Tacoma HOV Improvements (Pierce) Nickel/TPA
• I-5/M Street to Portland Avenue – Add HOV Lanes
Nickel √ Mar-2014Mid-Mountain Contractors
Feb-2017 $1.7
I-90/Snoqualmie Pass East – Hyak to Keechelus Dam – Corridor Improvement (Kittitas)
TPA
• I-90/Snowshed to Keechelus Dam Phase 1C – Replace Snowshed and Add Lanes
TPA Late Apr-2011Guy F. Atkinson Construction
Oct-2017 $177.1
Advertisement was delayed to address fire and safety issues with the original snowshed design, resulting in long-term savings.
SR 16/Anderson Creek Tributary to Sinclair Inlet — Fish Barriers (Kitsap)
TPA Late Feb-2016Scarsella Bros.
Oct-2016 $4.4
Data source: WSDOT Capital Program Development and Management.
Twelve WSDOT projects in construction phase as of September 2016Nickel and Transportation Partnership Account projects; Costs estimated at completion; Dollars in millions
WSDOT continues to complete Nickel, TPA projects
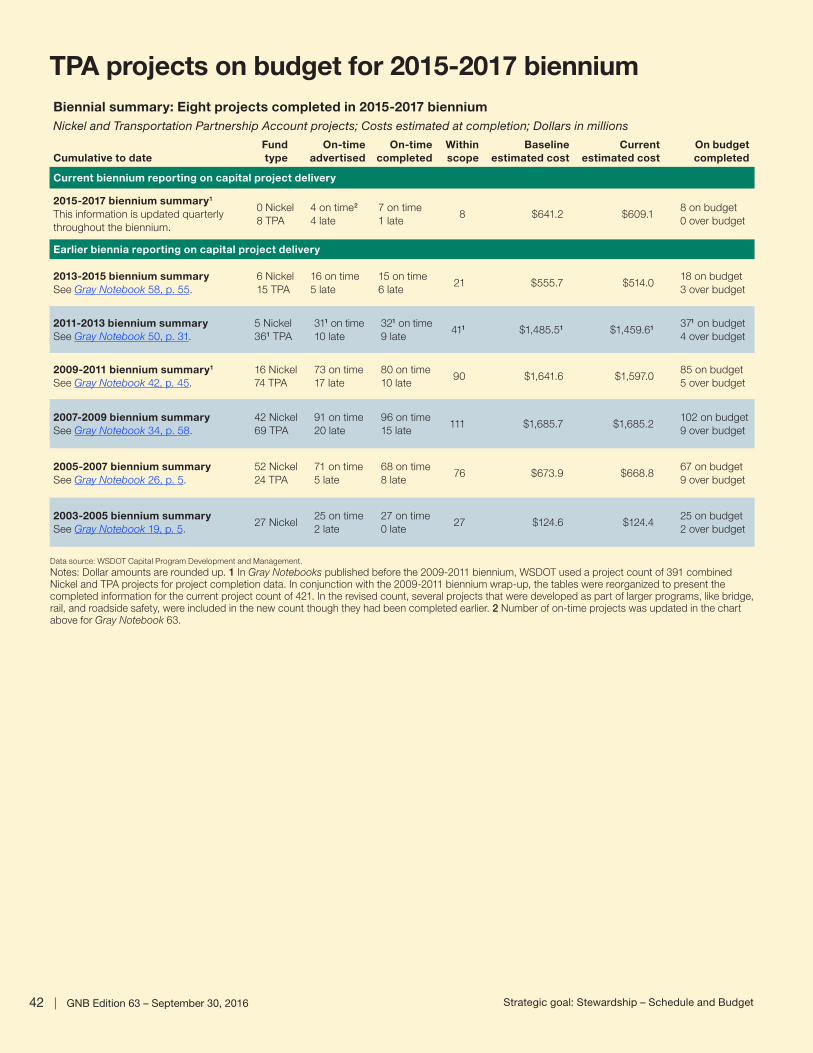
42 | GNB Edition 63 – September 30, 2016 Strategic goal: Stewardship – Schedule and Budget
Biennial summary: Eight projects completed in 2015-2017 bienniumNickel and Transportation Partnership Account projects; Costs estimated at completion; Dollars in millions
Cumulative to dateFund type
On-time advertised
On-time completed
Within scope
Baseline estimated cost
Current estimated cost
On budget completed
Current biennium reporting on capital project delivery
2015-2017 biennium summary1
This information is updated quarterly throughout the biennium.
0 Nickel8 TPA
4 on time2
4 late7 on time1 late
8 $641.2 $609.18 on budget0 over budget
Earlier biennia reporting on capital project delivery
2013-2015 biennium summarySee Gray Notebook 58, p. 55.
6 Nickel15 TPA
16 on time5 late
15 on time6 late
21 $555.7 $514.018 on budget3 over budget
2011-2013 biennium summarySee Gray Notebook 50, p. 31.
5 Nickel 361 TPA
311 on time10 late
321 on time9 late
411 $1,485.51 $1,459.61 371 on budget 4 over budget
2009-2011 biennium summary1
See Gray Notebook 42, p. 45.16 Nickel74 TPA
73 on time17 late
80 on time10 late
90 $1,641.6 $1,597.085 on budget5 over budget
2007-2009 biennium summarySee Gray Notebook 34, p. 58.
42 Nickel69 TPA
91 on time20 late
96 on time15 late
111 $1,685.7 $1,685.2102 on budget9 over budget
2005-2007 biennium summarySee Gray Notebook 26, p. 5.
52 Nickel24 TPA
71 on time5 late
68 on time8 late
76 $673.9 $668.867 on budget9 over budget
2003-2005 biennium summary See Gray Notebook 19, p. 5.
27 Nickel25 on time2 late
27 on time0 late
27 $124.6 $124.425 on budget2 over budget
TPA projects on budget for 2015-2017 biennium
Data source: WSDOT Capital Program Development and Management.
Notes: Dollar amounts are rounded up. 1 In Gray Notebooks published before the 2009-2011 biennium, WSDOT used a project count of 391 combined Nickel and TPA projects for project completion data. In conjunction with the 2009-2011 biennium wrap-up, the tables were reorganized to present the completed information for the current project count of 421. In the revised count, several projects that were developed as part of larger programs, like bridge, rail, and roadside safety, were included in the new count though they had been completed earlier. 2 Number of on-time projects was updated in the chart above for Gray Notebook 63.

GNB Edition 63 – September 30, 2016 | 43Strategic goal: Stewardship – Original Legislative Evaluation and Accountability Program
WSDOT delivers 135 Nickel projects since 2003The performance summaries below and those on p. 44 provide status reports on WSDOT’s delivery of the Nickel and Transportation Partnership Account programs compared to the original legislative funding packages presented in the 2003 and 2005 Legislative Evaluation and Accountability Program lists.
The Legislature has approved changes to these funding packages and assigned funds to different projects since these two funding packages were created. As a result, the data listed below and on the next page show the original LEAP, which differs from the current legislative budgets on pp. 36-37.
The 2003 and 2005 tables feature budget items including pre-construction and environmental studies that were in the original funding packages. The original LEAP tables do not include projects that cities, counties and tribes collaborate on with WSDOT to complete.
These tables show the total number of projects and the percentage of projects that are complete, underway, scheduled to start or affected by a legislatively approved change of project scope. They also give budget updates showing original planned budgets and the current planned or actual expenditure, breaking out programs by category: highways, ferries and rail.
Total program Highways Ferries Rail
Project budget update BudgetPercent of total Budget
Percent of program Budget
Percent of program Budget
Percent of program
Total original legislativeplanned budget
$3,887.5 $3,380.1 $297.9 $209.5
Original plan, 2003 through 2013-2015 biennium
$3,887.5 100% $3,380.1 100% $297.9 100% $209.5 100%
Actual expenditures, 2003 through 2013-2015 biennium
$4,093.7 105% $3,537.7 105% $423.2 142%1 $132.8 63%
Original plan through 2015-2017 biennium
$3,887.5 100% $3,380.1 100% $297.9 100% $209.5 100%
Current plan through 2015-2017 biennium
$4,323.8 111%1 $3,644.8 108%1 $545.2 183%1 $133.7 64%
Actual expenditures, 2003 through June 30, 2016
$4,227.8 109%1 $3,597.7 106%1 $497.0 167%1 $133.1 64%
Data source: WSDOT Capital Program Development and Management.Notes: Expenditures are Nickel funds only. Totals do not include projects that cities, counties and tribes collaborate on with WSDOT to complete. 1 The Legislature added funds for construction of a second 144-vehicle ferry for WSDOT Ferries and for highway construction during the first quarter (July through September 2013) of the 2013-2015 biennium. These funds put WSDOT Ferries above its original funding level and will result in continued over-performance by this program.
Total program Highways Ferries Rail
Project delivery update Number of projects
Percent of total
Number of projects
Percent of program
Number of projects
Percent of program
Number of projects
Percent of program
Project number and phase 156 127 5 24
Completed projects 135 87% 119 94% 2 40% 14 58%
Total projects underway 8 5% 5 4% 2 40% 1 4%
In pre-construction phase 4 3 1 0
In construction phase 4 2 1 1
Projects starting in the future 1 1% 0 0% 0 0% 1 4%
Projects deferred or deleted from program
12 8% 3 2% 1 20% 8 33%
Number of legislatively approved scope changes
20 18 0 2
Pre-construction starts within six months
0 0 0 0
Construction starts within six months 0 0 0 0
Data source: WSDOT Capital Program Development and Management.Notes: Totals do not include projects that cities, counties and tribes collaborate on with WSDOT to complete. Percents may not add to 100 due to rounding.
WSDOT project delivery and budget update: Original 2003 Nickel Transportation Funding PackageAs of September 30, 2016; Dollars in millions

44 | GNB Edition 63 – September 30, 2016 Strategic goal: Stewardship – Original Legislative Evaluation and Accountability Program
Total program Highways Ferries Rail
Project delivery update Number of projects
Percent of total
Number of projects
Percent of program
Number of projects
Percent of program
Number of projects
Percent of program
Project number and phase 248 229 4 15
Completed projects 206 83% 197 86% 1 25% 8 53%
Total projects underway 22 9% 19 8% 0 3 20%
In pre-construction phase 8 7 0 1
In construction phase 14 12 0 2
Projects starting in the future 6 2% 2 1% 1 25% 3 20%
Projects deferred or deleted from program 15 6% 12 5% 2 50% 1 7%
Number of legislatively approved scope changes
23 23 0 0
Pre-construction starts within six months
1 1 0 0
Construction starts within six months 0 0 0 0
Data source: WSDOT Capital Program Development and Management.Notes: Totals do not include projects that cities, counties and tribes collaborate on with WSDOT to complete. Percents may not add to 100 due to rounding. Since the Transportation Partnership Account program was passed in 2005, the Legislature has approved changes to WSDOT Ferries’ construction program so that the current budget does not match the original budget. Among the changes, TPA funding was provided for three 64-car ferries. For definitions about terminology used in Original LEAP, see Gray Notebook 53, p. 40.
WSDOT project delivery and budget update: Original 2005 Transportation Partnership AccountAs of September 30, 2016; Dollars in millions
Total program Highways Ferries Rail
Project budget update BudgetPercent of total Budget
Percent of program Budget
Percent of program Budget
Percent of program
Total original legislative planned budget
$6,982.1 $6,678.5 $185.4 $118.3
Original plan, 2005 through 2013-2015 biennium
$6,472.5 93% $6,218.0 93% $136.3 74% $118.3 100%
Actual expenditures, 2005 through 2013-2015 biennium
$4,627.1 66% $4,476.3 67% $77.1 42% $73.7 62%
Original plan through 2015-2017 biennium
$6,472.5 93% $6,218.0 93% $136.3 74% $118.3 100%
Current plan through 2015-2017 biennium
$5,706.0 82% $5,548.6 83% $77.1 42% $80.4 68%
Actual expenditures, 2005 through June 30, 2016
$5,179.5 74% $5,026.2 75% $77.1 42% $76.3 65%
Data source: WSDOT Capital Program Development and Management.Notes: Expenditures are TPA funds only. Totals do not include projects that cities, counties and tribes collaborate on with WSDOT to complete. Since the Transportation Partnership Account program was passed in 2005, the Legislature has approved changes to WSDOT Ferries’ construction program so that the current budget does not match the original budget.
WSDOT completes 206 TPA projects since 2005
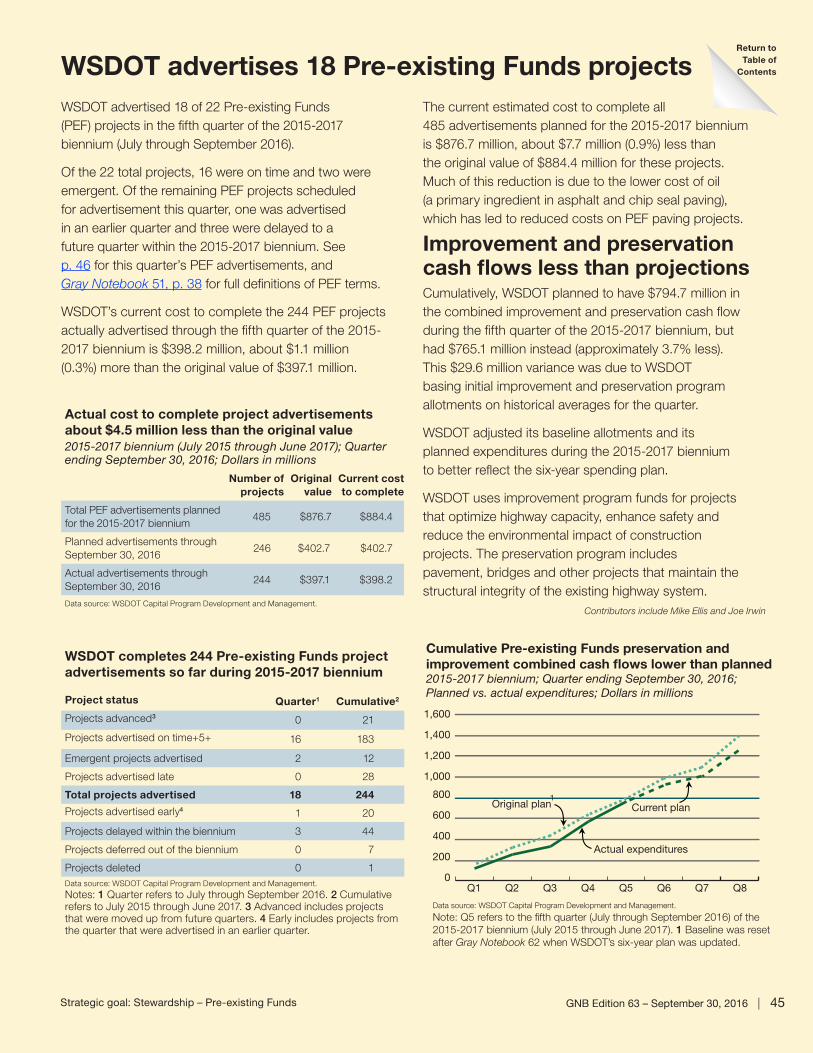
GNB Edition 63 – September 30, 2016 | 45Strategic goal: Stewardship – Pre-existing Funds
WSDOT advertised 18 of 22 Pre-existing Funds (PEF) projects in the fifth quarter of the 2015-2017 biennium (July through September 2016).
Of the 22 total projects, 16 were on time and two were emergent. Of the remaining PEF projects scheduled for advertisement this quarter, one was advertised in an earlier quarter and three were delayed to a future quarter within the 2015-2017 biennium. See p. 46 for this quarter’s PEF advertisements, and Gray Notebook 51, p. 38 for full definitions of PEF terms.
WSDOT’s current cost to complete the 244 PEF projects actually advertised through the fifth quarter of the 2015-2017 biennium is $398.2 million, about $1.1 million (0.3%) more than the original value of $397.1 million.
WSDOT advertises 18 Pre-existing Funds projects
Actual cost to complete project advertisements about $4.5 million less than the original value2015-2017 biennium (July 2015 through June 2017); Quarter ending September 30, 2016; Dollars in millions
Number of projects
Original value
Current cost to complete
Total PEF advertisements planned for the 2015-2017 biennium
485 $876.7 $884.4
Planned advertisements through September 30, 2016
246 $402.7 $402.7
Actual advertisements through September 30, 2016
244 $397.1 $398.2
Data source: WSDOT Capital Program Development and Management.
The current estimated cost to complete all 485 advertisements planned for the 2015-2017 biennium is $876.7 million, about $7.7 million (0.9%) less than the original value of $884.4 million for these projects. Much of this reduction is due to the lower cost of oil (a primary ingredient in asphalt and chip seal paving), which has led to reduced costs on PEF paving projects.
Improvement and preservation cash flows less than projectionsCumulatively, WSDOT planned to have $794.7 million in the combined improvement and preservation cash flow during the fifth quarter of the 2015-2017 biennium, but had $765.1 million instead (approximately 3.7% less). This $29.6 million variance was due to WSDOT basing initial improvement and preservation program allotments on historical averages for the quarter.
WSDOT adjusted its baseline allotments and its planned expenditures during the 2015-2017 biennium to better reflect the six-year spending plan.
WSDOT uses improvement program funds for projects that optimize highway capacity, enhance safety and reduce the environmental impact of construction projects. The preservation program includes pavement, bridges and other projects that maintain the structural integrity of the existing highway system.
Contributors include Mike Ellis and Joe Irwin
Cumulative Pre-existing Funds preservation and improvement combined cash flows lower than planned 2015-2017 biennium; Quarter ending September 30, 2016; Planned vs. actual expenditures; Dollars in millions
Data source: WSDOT Capital Program Development and Management.
Note: Q5 refers to the fifth quarter (July through September 2016) of the 2015-2017 biennium (July 2015 through June 2017). 1 Baseline was reset after Gray Notebook 62 when WSDOT’s six-year plan was updated.
0
200
400
600
800
1,000
1,200
1,400
1,600
Q8Q7Q6Q5Q4Q3Q2Q1
Original plan
Actual expenditures
Current plan1
WSDOT completes 244 Pre-existing Funds project advertisements so far during 2015-2017 biennium
Project status Quarter1 Cumulative2
Projects advanced3 0 21
Projects advertised on time+5+ 16 183
Emergent projects advertised 2 12
Projects advertised late 0 28
Total projects advertised 18 244
Projects advertised early4 1 20
Projects delayed within the biennium 3 44
Projects deferred out of the biennium 0 7
Projects deleted 0 1Data source: WSDOT Capital Program Development and Management.
Notes: 1 Quarter refers to July through September 2016. 2 Cumulative refers to July 2015 through June 2017. 3 Advanced includes projects that were moved up from future quarters. 4 Early includes projects from the quarter that were advertised in an earlier quarter.
Return toTable of
Contents
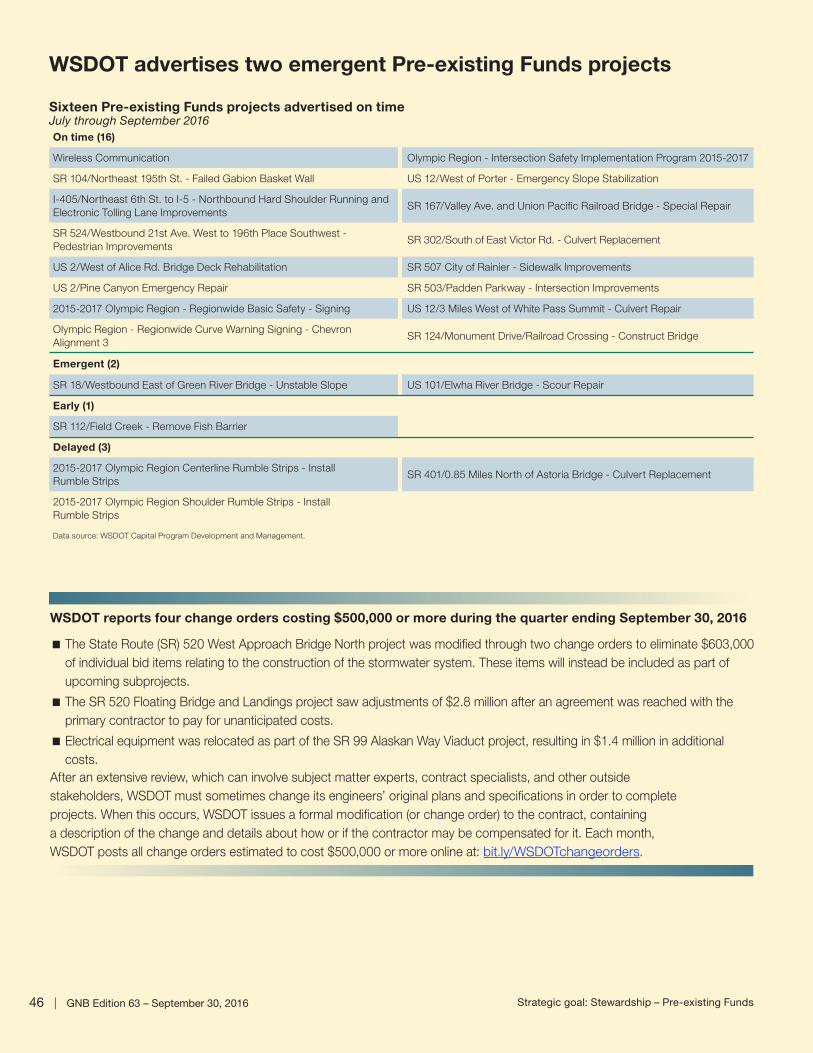
46 | GNB Edition 63 – September 30, 2016 Strategic goal: Stewardship – Pre-existing Funds
WSDOT advertises two emergent Pre-existing Funds projects
Sixteen Pre-existing Funds projects advertised on timeJuly through September 2016On time (16)
Wireless Communication Olympic Region - Intersection Safety Implementation Program 2015-2017
SR 104/Northeast 195th St. - Failed Gabion Basket Wall US 12/West of Porter - Emergency Slope Stabilization
I-405/Northeast 6th St. to I-5 - Northbound Hard Shoulder Running and Electronic Tolling Lane Improvements
SR 167/Valley Ave. and Union Pacific Railroad Bridge - Special Repair
SR 524/Westbound 21st Ave. West to 196th Place Southwest - Pedestrian Improvements
SR 302/South of East Victor Rd. - Culvert Replacement
US 2/West of Alice Rd. Bridge Deck Rehabilitation SR 507 City of Rainier - Sidewalk Improvements
US 2/Pine Canyon Emergency Repair SR 503/Padden Parkway - Intersection Improvements
2015-2017 Olympic Region - Regionwide Basic Safety - Signing US 12/3 Miles West of White Pass Summit - Culvert Repair
Olympic Region - Regionwide Curve Warning Signing - Chevron Alignment 3
SR 124/Monument Drive/Railroad Crossing - Construct Bridge
Emergent (2)
SR 18/Westbound East of Green River Bridge - Unstable Slope US 101/Elwha River Bridge - Scour Repair
Early (1)
SR 112/Field Creek - Remove Fish Barrier
Delayed (3)
2015-2017 Olympic Region Centerline Rumble Strips - Install Rumble Strips
SR 401/0.85 Miles North of Astoria Bridge - Culvert Replacement
2015-2017 Olympic Region Shoulder Rumble Strips - Install Rumble Strips
Data source: WSDOT Capital Program Development and Management.
WSDOT reports four change orders costing $500,000 or more during the quarter ending September 30, 2016
� The State Route (SR) 520 West Approach Bridge North project was modified through two change orders to eliminate $603,000 of individual bid items relating to the construction of the stormwater system. These items will instead be included as part of upcoming subprojects.
� The SR 520 Floating Bridge and Landings project saw adjustments of $2.8 million after an agreement was reached with the primary contractor to pay for unanticipated costs.
� Electrical equipment was relocated as part of the SR 99 Alaskan Way Viaduct project, resulting in $1.4 million in additional costs.
After an extensive review, which can involve subject matter experts, contract specialists, and other outside stakeholders, WSDOT must sometimes change its engineers’ original plans and specifications in order to complete projects. When this occurs, WSDOT issues a formal modification (or change order) to the contract, containing a description of the change and details about how or if the contractor may be compensated for it. Each month, WSDOT posts all change orders estimated to cost $500,000 or more online at: bit.ly/WSDOTchangeorders.

GNB Edition 63 – September 30, 2016 | 47Gray Notebook Information Guide
Gray Notebook Information Guide 63
The Gray Notebook and Gray Notebook Lite are printed in-house by Ronnie Jackson, Trudi Phillips, Talon Randazzo, Larry Shibler, Oma Venable and Deb Webb. OSAPA’s Kate Wilfong coordinates distribution. WSDOT’s graphics team of Erica Mulherin and Steve Riddle provides creative help and assists with graphics, while WSDOT communicators typically take the photographs featured throughout each edition.
Americans with Disabilities Act (ADA) information for the publicAccommodation requests for people with disabilities can be made by contacting the WSDOT Diversity/ADA Affairs team at [email protected] or by calling toll-free, 855-362-4ADA (4232). Persons who are deaf or hard of hearing may make a request by calling the Washington State Relay at 711.
Civil Rights Act of 1964, Title VI Statement to the PublicIt is the Washington State Department of Transportation’s policy to assure that no person shall, on the grounds of race, color, national origin, or sex, as provided by Title VI of the Civil Rights Act of 1964, be excluded from participation in, be denied the benefits of, or be otherwise subjected to discrimination under any of its federally funded programs and activities. Any person who believes his/her Title VI protection has been violated may file a complaint with WSDOT’s Office of Equal Opportunity (OEO). For additional information regarding Title VI complaint procedures and/or information regarding our non-discrimination obligations, contact OEO’s Title VI Coordinator at (360) 705-7082.
The Gray Notebook is prepared by theOffice of Strategic Assessment and Performance Analysis Washington State Department of Transportation 310 Maple Park Ave SE, Olympia, WA 98504
© 2016 WSDOT. All rights reserved.
Reduce - Reuse - RecycleThe Gray Notebook is printed in Washington on recycled paper.
Readers wanting to receive the Gray Notebook electronically can
request a subscription by emailing [email protected].
Be sure to include instructions stating whether you wish to receive
the electronic version in lieu of or in addition to a paper copy.
Calendar, fiscal and federal fiscal quarters
Jan Feb Mar Apr May Jun Jul Aug Sep Oct Nov Dec
GNB 61 GNB 62 GNB 63 GNB 64
Q1 2016 Q2 2016 Q3 2016 Q4 2016
Q3 FY2016 Q4 FY2016 Q1 FY2017 Q2 FY2017
Q2 FFY2016 Q3 FFY2016 Q4 FFY2016 Q1 FFY2017
2015-2017 biennial quarters
Period Quarter Period Quarter
Jul – Sep 2015 Q1 Jul – Sep 2016 Q5
Oct – Dec 2015 Q2 Oct – Dec 2016 Q6
Jan – Mar 2016 Q3 Jan – Mar 2017 Q7
Apr – Jun 2016 Q4 Apr – Jun 2017 Q8
Notes: A calendar year begins January 1 and ends December 31. Washington state’s fiscal year begins July 1 and ends June 30. The federal fiscal year begins October 1 and ends September 30. Biennia begin July 1 and end two years later on June 30.
Gray Notebook subject index, archives and acronym list onlineReaders can access the Gray Notebook subject index online at bit.ly/GNBsubjectindex. Gray Notebook editions are available at bit.ly/GNBarchives, and WSDOT’s transportation acronym guide can be viewed at bit.ly/WSDOTacronyms.
Understanding reporting periodsWSDOT programs report their performance data during different periods to best fit the work they do. For example, a program that receives substantial federal funds may report performance based on the federal fiscal year.
The charts below show the reporting periods for Gray Notebook 63. July through September 2016 is the third quarter of the calendar year (Q3 2016); the first quarter of the state’s fiscal year (Q1 FY2017); and the fourth quarter of the federal fiscal year (Q4 FFY2016). It is also the fifth quarter of the 2015-2017 biennium, which follows the current budget set by the Washington State Legislature.
Gray Notebook credits
The Gray Notebook is developed and produced by the small team at WSDOT’s Office of Strategic Assessment and Performance Analysis (OSAPA), and articles feature bylines indicating key contributors from dozens of WSDOT programs.
Return toTable of Contents
Related Documents