Washington State Department of Transportation Recruitment and Retention Study FINAL REPORT June 27, 2016 Prepared by Corporate Office San Francisco Office Seattle Office 1735 Market Street 50 California Street 1200 Fifth Avenue 43 rd Floor Suite 2300 Suite 1220 Philadelphia, PA 19103 San Francisco, CA 94111 Seattle, WA 98101 Phone 215-567-6100 Phone 415-982-5544 Phone 206-264-8900 Fax 215-567-4180 Fax 415-982-4513 Fax 206-264-9699 www.pfm.com

Welcome message from author
This document is posted to help you gain knowledge. Please leave a comment to let me know what you think about it! Share it to your friends and learn new things together.
Transcript

Washington State Department of
Transportation
Recruitment and Retention Study
FINAL REPORT June 27, 2016
Prepared by
Corporate Office San Francisco Office Seattle Office
1735 Market Street 50 California Street 1200 Fifth Avenue 43rd Floor Suite 2300 Suite 1220
Philadelphia, PA 19103 San Francisco, CA 94111 Seattle, WA 98101 Phone 215-567-6100 Phone 415-982-5544 Phone 206-264-8900
Fax 215-567-4180 Fax 415-982-4513 Fax 206-264-9699 www.pfm.com

2 Table of Contents
Table of Contents
List of Tables and Figures ........................................................................................................................................... 4
Executive Summary ..................................................................................................................................................... 6
Findings and Recommendations ............................................................................................................................... 9
Organization of Report and Study Methodology ..................................................................................................... 18
Chapter 1: WSDOT Workforce Composition and Vacancy Projection .................................................................. 22
Introduction .............................................................................................................................................................. 22
Workforce Composition ............................................................................................................................................ 22
Vacancy Analysis and Projections ........................................................................................................................... 24
Projected Staffing Levels ......................................................................................................................................... 26
Conclusion ............................................................................................................................................................... 32
Chapter 2: WSDOT Compensation ........................................................................................................................... 33
Cash Compensation ................................................................................................................................................ 33
Non-Cash Benefits ................................................................................................................................................... 39
Compression/Inversion ............................................................................................................................................ 42
Comparison to Local Government Employers ......................................................................................................... 44
Comparison to Other Public and Private Sector Employers ..................................................................................... 56
Conclusion ............................................................................................................................................................... 60
Chapter 3: Issues Affecting Retention of Engineering Employees ....................................................................... 61
Introduction .............................................................................................................................................................. 61
Methodology ............................................................................................................................................................ 61
Retention Experience and Expectations .................................................................................................................. 61
Drivers of Attrition .................................................................................................................................................... 65
Employee Satisfaction ............................................................................................................................................. 66
Compensation .......................................................................................................................................................... 69
Findings and Recommendations ............................................................................................................................. 71
Conclusion ............................................................................................................................................................... 76
Chapter 4: Staffing Plan and Issues Affecting Recruitment of Engineering Employees ..................................... 78
Introduction .............................................................................................................................................................. 78
Staffing Plan ............................................................................................................................................................ 78
Recruitment Overview.............................................................................................................................................. 81
Outreach and Marketing .......................................................................................................................................... 84
Training/Mentoring Programs .................................................................................................................................. 85
Findings and Recommendations ............................................................................................................................. 86
Conclusion.................................................................................................................................................................. 88

3 Table of Contents
Appendices ................................................................................................................................................................. 89
Appendix A: PFM Survey Administered to Former WSDOT Employees in Benchmark Classes ................................. 89
Appendix B: Detailed Vacancy Projection .................................................................................................................... 93
Appendix C: Ten-Year Retirement Projection .............................................................................................................. 94
Appendix D: Detailed Compensation Comparison Tables ........................................................................................... 95
Appendix E: ERI Level Definitions.............................................................................................................................. 105
Appendix F: Market-Specific WSDOT Pay Variance (Recommendation 10.1) ......................................................... 106
4 Tables and Figures
List of Tables and Figures Tables
Table 1: Summary of Local Public Sector Employers Wage Comparisons ........................................................... 8
Table 2: WSDOT Geographic Assignment Pays ................................................................................................. 12
Table 3: WSDOT Variance from Median Pay in Select Regions ......................................................................... 14
Table 4: Comparable Jurisdictions ...................................................................................................................... 19
Table 5: WSDOT Employees .............................................................................................................................. 23
Table 6: WSDOT Attrition by Tenure and Reason .............................................................................................. 25
Table 7: Number of Employees by Classification (As of 12/31/2015) .................................................................. 26
Table 8: WSDOT Retirements in Each Calendar Year, 2016-2026 ..................................................................... 29
Table 9: Supervisory Titles Vacancy Rates, CY2016-2021 ................................................................................. 31
Table 10: CY2016-2021 Hiring Needs (All Classifications).................................................................................. 32
Table 11: CY2016-2026 Hiring Needs (All Classifications).................................................................................. 32
Table 12: WSDOT Engineering and Technical Benchmark Classifications (Base Compensation + Longevity) .. 34
Table 13: WSDOT Assignment Pays .................................................................................................................. 36
Table 14: WSDOT Geographic Assignment Pay ................................................................................................ 37
Table 15: WSDOT Stipends and Allowances ...................................................................................................... 38
Table 16: WSDOT Vacation Leave Allowances .................................................................................................. 39
Table 17: Washington Employee Contribution to Health Care Coverage (Plan Year 2016) ................................ 40
Table 18: Washington State DOT Retirement Benefits ....................................................................................... 41
Table 19: Total Employer Cost ............................................................................................................................ 41
Table 20: Transportation Engineer and Transportation Technical Engineer Compression/Inversion Analysis .... 42
Table 21: Transportation Technician Compression/Inversion Analysis ............................................................... 43
Table 22: Property & Acquisition Specialist Compression/Inversion Analysis ..................................................... 43
Table 23: Comparable Jurisdictions .................................................................................................................... 44
Table 24: Transportation Engineer Wage Comparisons ...................................................................................... 46
Table 25: Transportation Technician Wage Comparisons ................................................................................... 47
Table 26: Property & Acquisition Specialist Wage Comparisons ......................................................................... 47
Table 27: Property & Acquisition Specialist Pay with Assignment Pay ................................................................ 48
Table 28: Shift Differential at Local Washington Employers ............................................................................... 49
Table 29: Overtime at Local Washington Employers ........................................................................................... 50
Table 30: WSDOT and Local Washington Employer Pension Benefits ............................................................... 51
Table 31: Local Washington Employers Employee Percent of Premium for Health Insurance (New Hires) ........ 52
Table 32: Local Washington Employers Leave Accrual (Per Year) ..................................................................... 53
Table 33: Annual Leave by Completed Years of Service .................................................................................... 54
Table 34: Transportation Engineer 3 State Salary Survey Comparison .............................................................. 56
Table 35: Transportation Technician 2 State Salary Survey Comparison ........................................................... 57

5 Tables and Figures
Table 36: Property & Acquisition Specialist 3 State Salary Survey Comparison ................................................. 57
Table 37: Transportation Engineer 2 ERI Comparison ........................................................................................ 58
Table 38: Transportation Technician 3 ERI Comparison ..................................................................................... 59
Table 39: Property & Acquisition Specialist 3 ERI Comparison ........................................................................... 59
Table 40: WSDOT Engineering and Technical Employees Attrition, 2013-2015 ................................................. 62
Table 41: New Workplace of Resigned Employees (Where Known) ................................................................... 63
Table 42: WSDOT Separated Employees Current Employer .............................................................................. 64
Table 43: Survey Results: “What were your primary reasons for leaving WSDOT?” ........................................... 67
Table 44: WSDOT Engineering and Technical Compensation by Type (CY2015) .............................................. 69
Table 45: WSDOT Geographic Assignment Pays ............................................................................................... 73
Table 46: WSDOT Variance from Median Pay in Select Regions ....................................................................... 75
Table 47: Staffing Options for Projected Work Volume ....................................................................................... 79
Table 48: CY2016-2021 Hiring Needs (All Classifications).................................................................................. 80
Table 49: Positions Hired by Year ....................................................................................................................... 82
Table 50: Average Days to Hire by Year ............................................................................................................. 83
Figures
Figure 1: Historical FTE Count Benchmark Positions ............................................................................................ 6
Figure 2: WSDOT Attrition by Tenure and Reason (1/1/2013 – 12/31/2015) ........................................................ 7
Figure 3: Engineering and Technical Positions Vacancies CY2016-2021 ............................................................. 7
Figure 4: Pay at WSDOT vs. Comparable Agencies (Jurisdictions Where or Near Resigning Employees are Going).................................................................................................................................................................. 13
Figure 5: WSDOT Attrition by Tenure and Reason (1/1/2013 – 12/31/2015) ...................................................... 25
Figure 6: WSDOT Retirement Projection CY2016-2021...................................................................................... 28
Figure 7: WSDOT Retirement Projection By Region CY2016-2021 .................................................................... 29
Figure 8: Engineering and Technical Positions Vacancies CY2016-2021 ........................................................... 30
Figure 9: WSDOT Attrition by Tenure and Reason (1/1/2013 – 12/31/2015) ...................................................... 63
Figure 10: Pay at WSDOT vs. Comparable Agencies (Jurisdictions Where or Near Resigning Employees are Going).................................................................................................................................................................. 65
Figure 11: Survey Results: “While working for WSDOT I was __ with the variety of work I was asked to perform” ............................................................................................................................................................................ 68
Figure 12: Survey Results: “Since leaving WSDOT, my monthly take-home pay has…” .................................... 70
Figure 13: Pay at WSDOT vs. Comparable Agencies (Jurisdictions Where or Near Resigning Employees are Going).................................................................................................................................................................. 74
Figure 14: Historical FTE Count Benchmark Positions ........................................................................................ 78
Figure 15: Reduction in Select Positions 2011-2015 ........................................................................................... 81

6 Executive Summary
1,875 1,638 1,552 1,461 1,415 1,372
0
500
1,000
1,500
2,000
Dec. '10 Dec. '11 Dec. '12 Dec. '13 Dec. '14 Dec. '15
Figure 1: Historical FTE Count Benchmark Positions
Executive Summary Report Overview
The Washington State Department of Transportation (WSDOT) performs critical work throughout the State in providing safe and efficient transportation systems. These systems are designed, built, and maintained by the nearly 7,000 employees that work for WSDOT. A critical component of that workforce is the approximately 2,000 engineers and technical employees that perform or oversee the majority of technical duties required to carry out this mission.
The scope of this study is to consider issues affecting program oversight and delivery including compensation issues that may hinder the recruitment and retention of a quality core workforce for engineering and technical employees in the preliminary engineering segment of the workforce. The approximately 1,372 preliminary engineering and technical positions benchmarked in the study are in the right-of-way, design and construction programs in the following classifications:
Transportation Engineer 1-5 Transportation Technical Engineer Transportation Technician 1-3 Property and Acquisition Specialist 1-6
For the remainder of the report, all references to “the benchmark classifications” are the positions in the classifications listed above. WSDOT reduced the total highway construction engineering and technical workforce by 800 full-time equivalents (FTEs) to achieve workforce levels in line with projected project expenditures. The Legislature (ESHB 2190) mandated the reduction to meet revenue estimates that would sustain an estimated 2,000 positions by the end of the 2013-2015 biennium. The bill required the workforce levels to be reduced by 400 positions in the 2011-2013 biennium and 400 positions in the 2013-2015 biennium, to reach the target staff level of 2,000 FTEs. The number of benchmark classification positions was reduced by just over 500 positions.
As WSDOT moves from a mode of reducing staff and doing their best to maintain existing systems to managing a $16 billion construction program over the next decade and a half, these
7 Executive Summary
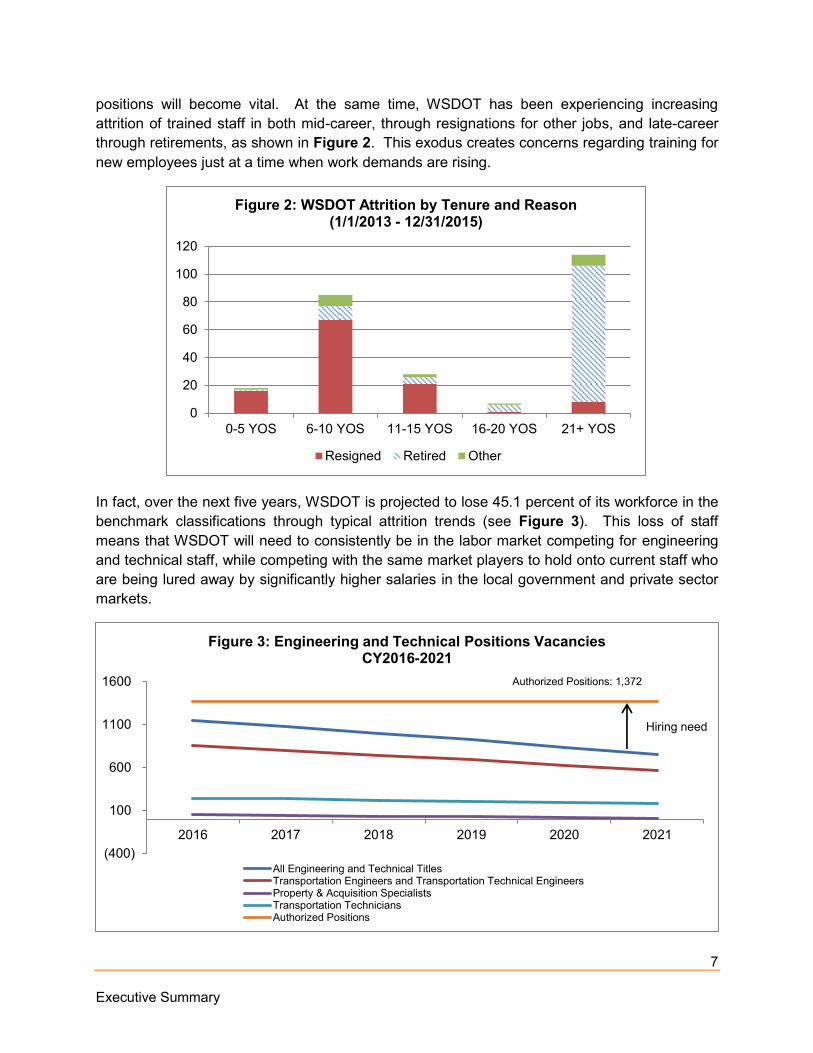
positions will become vital. At the same time, WSDOT has been experiencing increasing attrition of trained staff in both mid-career, through resignations for other jobs, and late-career through retirements, as shown in Figure 2. This exodus creates concerns regarding training for new employees just at a time when work demands are rising.
In fact, over the next five years, WSDOT is projected to lose 45.1 percent of its workforce in the benchmark classifications through typical attrition trends (see Figure 3). This loss of staff means that WSDOT will need to consistently be in the labor market competing for engineering and technical staff, while competing with the same market players to hold onto current staff who are being lured away by significantly higher salaries in the local government and private sector markets.
0
20
40
60
80
100
120
0-5 YOS 6-10 YOS 11-15 YOS 16-20 YOS 21+ YOS
Figure 2: WSDOT Attrition by Tenure and Reason (1/1/2013 - 12/31/2015)
Resigned Retired Other
(400)
100
600
1100
1600
2016 2017 2018 2019 2020 2021
Figure 3: Engineering and Technical Positions Vacancies CY2016-2021
All Engineering and Technical TitlesTransportation Engineers and Transportation Technical EngineersProperty & Acquisition SpecialistsTransportation TechniciansAuthorized Positions
Hiring need
Authorized Positions: 1,372
8 Executive Summary
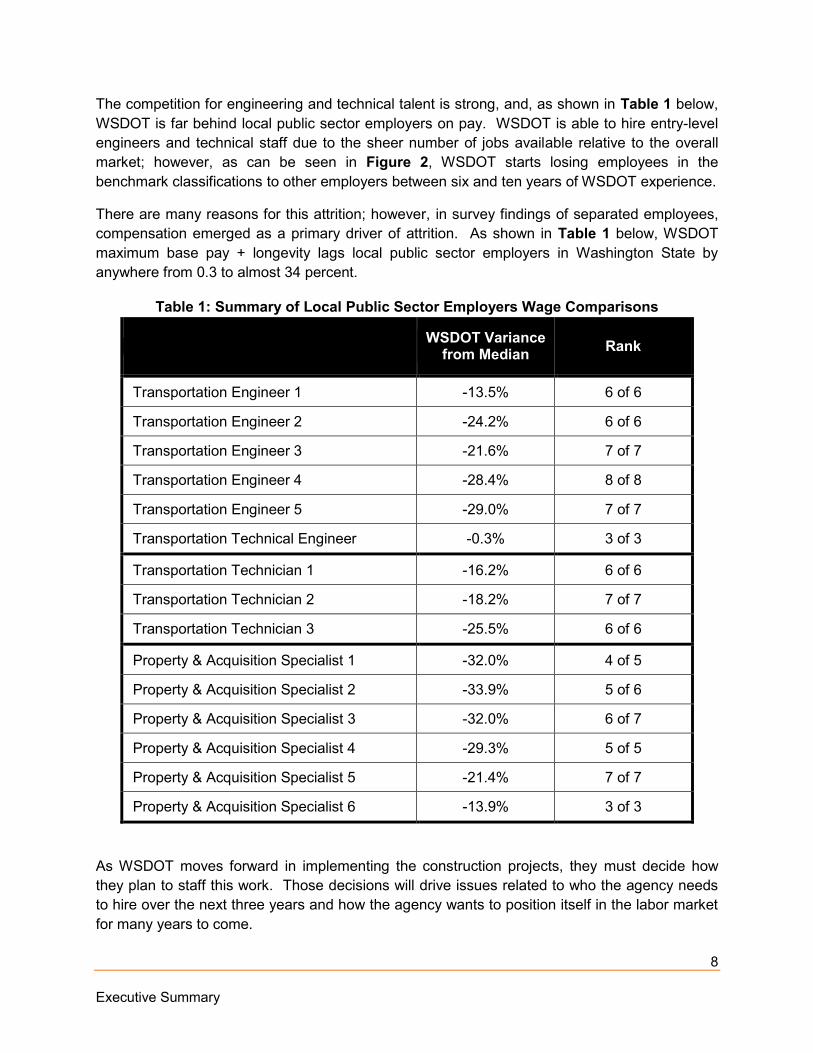
The competition for engineering and technical talent is strong, and, as shown in Table 1 below, WSDOT is far behind local public sector employers on pay. WSDOT is able to hire entry-level engineers and technical staff due to the sheer number of jobs available relative to the overall market; however, as can be seen in Figure 2, WSDOT starts losing employees in the benchmark classifications to other employers between six and ten years of WSDOT experience.
There are many reasons for this attrition; however, in survey findings of separated employees, compensation emerged as a primary driver of attrition. As shown in Table 1 below, WSDOT maximum base pay + longevity lags local public sector employers in Washington State by anywhere from 0.3 to almost 34 percent.
Table 1: Summary of Local Public Sector Employers Wage Comparisons
WSDOT Variance from Median Rank
Transportation Engineer 1 -13.5% 6 of 6
Transportation Engineer 2 -24.2% 6 of 6
Transportation Engineer 3 -21.6% 7 of 7
Transportation Engineer 4 -28.4% 8 of 8
Transportation Engineer 5 -29.0% 7 of 7
Transportation Technical Engineer -0.3% 3 of 3
Transportation Technician 1 -16.2% 6 of 6
Transportation Technician 2 -18.2% 7 of 7
Transportation Technician 3 -25.5% 6 of 6
Property & Acquisition Specialist 1 -32.0% 4 of 5
Property & Acquisition Specialist 2 -33.9% 5 of 6
Property & Acquisition Specialist 3 -32.0% 6 of 7
Property & Acquisition Specialist 4 -29.3% 5 of 5
Property & Acquisition Specialist 5 -21.4% 7 of 7
Property & Acquisition Specialist 6 -13.9% 3 of 3
As WSDOT moves forward in implementing the construction projects, they must decide how they plan to staff this work. Those decisions will drive issues related to who the agency needs to hire over the next three years and how the agency wants to position itself in the labor market for many years to come.

9 Executive Summary
Under any circumstance, three changes are needed. Ideally, these changes would be made simultaneously:
1. Compensation for engineering and technical workers is significantly under market in most classifications. This disparity must be addressed in the near term. This can be done through a combination of across-the-board increases to base salary, targeted specialty pay for difficult-to-hire positions, geographic pay, or a combination of these types of compensation increases.
2. Management needs to develop a service-delivery plan for the recently-
approved construction program to determine how much of the upcoming design and construction management work will be done in-house and how much will be contracted out. This will drive hiring needs not so much in how many to hire, but more what skillset to hire.
3. Recruitment processes need to utilize more proactive methods to find and
attract qualified candidates for essential engineering and technical positions. This could include re-establishing relationships with engineering departments in colleges and universities statewide and expanding the recently-revived internship program to provide necessary backfill for more senior employees who might depart the agency in coming years. These methods are likely to work better for entry-level employees. Experienced engineers are unlikely to come to WSDOT without adjustments in compensation first.
This study looks first to the competitive position the agency is in on a full-cost compensation basis relative to comparative local agencies. Along the way, the study also reviews additional issues that are affecting overall retention in addition to compensation. Secondarily, this study reviews the WSDOT recruitment processes and recommends opportunities to initiate changes that will improve both the quality and longevity of future hires.
The full list of findings and recommendations made in this study are provided below.
FINDINGS AND RECOMMENDATIONS
Compensation
Finding #1: WSDOT compensation for each classification ranks at or near the bottom of the comparison group at every pay juncture (minimum, midpoint, maximum, and maximum base plus longevity).
Finding #2: WSDOT provides additional opportunities for compensation that are not offered as readily by other jurisdictions in the comparison group, including various assignment pays and geographic assignment pay for select classifications and regions.

10 Executive Summary
Finding #3: Geographic assignment pay offered to the Property & Acquisition classifications and the Transportation Engineer 3 (Cadastral Surveyors) does not improve WSDOT’s relative position among the comparison group. In fact, when limiting the comparison group to those jurisdictions that fall in the WSDOT regions where geographic assignment pay is offered, the agency’s variance from the group median worsens for three classifications. This indicates that the geographic assignment pay is not having its intended effect of improving recruitment and retention in those classifications.
Finding #4: WSDOT employee contributions to health benefits are among the highest in the comparison group, while employee pension contributions are among the lowest of those jurisdictions that offer a retirement plan other than PERS.
Finding #5: WSDOT pay lags other public sector and private sector employers by significant margins, as shown in comparisons with data provided in the 2016 State Salary Survey and Economic Research Institute (ERI) data.
Finding #6: The WSDOT classifications are very broad and individuals within each class may experience different competitive opportunities with both governmental and private jobs. Typically, work requiring higher skill levels and employees with Professional Engineer licenses will have more ability to leave the agency for higher-paying jobs.
Retention
Finding #7: Impact of Design-Build Contracting. Both current and former engineering employees report that because of a contemplated move from design-bid-build to design-build, engineers will become contract managers in charge of overseeing consultant engineers.
Recommendation 7.1. As WSDOT moves into the 2017-2019 biennium, the agency should carefully consider how use of the design-build model will impact the current WSDOT engineering and technical workforce. While design-build is more cost and time-effective, current employee opinion of this process is negative overall, as it takes away employees’ ability to do the engineering work they believe they were hired to do. Employee feedback on how best to use this process, and when, should be solicited. This can be addressed by having a portion of key projects designed by WSDOT engineering staff.
Finding #8: Broad Classification Specifications. While not reflected in survey or focus group responses, the project team found the current classification specifications for the benchmark classes to be very broad. Moreover, these classifications encompass a significant number of working titles. Focus group participants and WSDOT management both indicated that an employee in a class in one office might perform entirely different work than an employee in that same class in another office. Some working titles within a class might require additional specialized skills that are not recognized with a comparable adjustment in pay because the class is limited to a specific pay grade. This is the case for hydraulic and geotechnical engineers, but can also be present in other working titles as well.
11 Executive Summary
Recommendation 8.1. While the project team acknowledges that a major shift in the way the State classifies employees is not likely, it recommends a comprehensive review of the engineering and technical class specifications. It would provide the opportunity to reevaluate if the duties and requirements of these specifications are in line with pay. Having broad classifications has the benefit of providing flexibility in the hiring process; therefore, alternative compensation options may need to be considered to address recruitment and retention concerns (e.g., expanded assignment pay or licensing pay).
Finding #9: As shown in Chapter 2, WSDOT compensation lags both public and private employers in various local labor markets across the state by significant margins. Additionally, many employees are at maximum base pay (reached after five and one-half years employment) and are thus wholly reliant on across-the-board increases or promotions to improve their compensation year-to-year.
Recommendation 9.1. Working with the Office of Financial Management, WSDOT should develop a long-term compensation strategy to address pay competitiveness within the State’s ability to pay. Such a plan will help address current employee dissatisfaction with pay levels and improve the agency’s ability to both recruit and retain valuable employees.
Recommendation 9.2. The State should strongly consider significant across-the-board pay increases for engineering and technical employees to remedy a portion of the current disparities with local-government employers.
Finding #10: Geographic Pay. Geographic assignment pay is offered to a limited number of classifications and in varying amounts based on classification, as shown in Table 2.
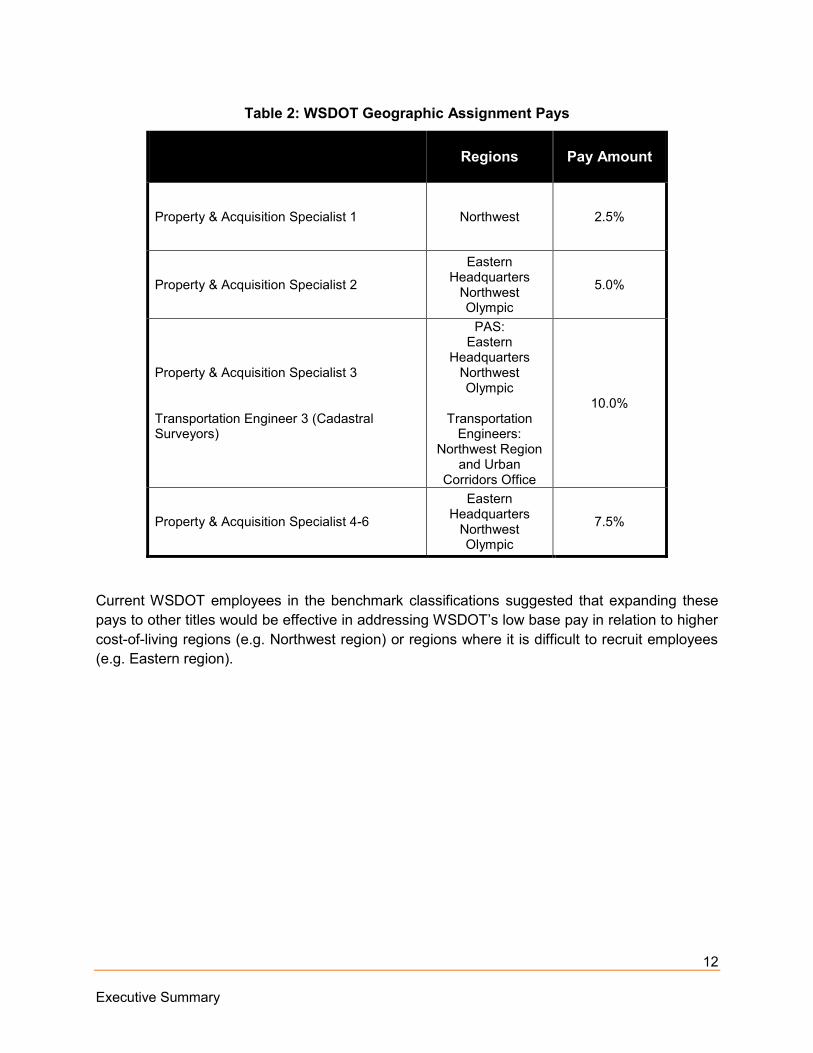
12 Executive Summary
Table 2: WSDOT Geographic Assignment Pays
Regions Pay Amount
Property & Acquisition Specialist 1 Northwest 2.5%
Property & Acquisition Specialist 2
Eastern Headquarters
Northwest Olympic
5.0%
Property & Acquisition Specialist 3 Transportation Engineer 3 (Cadastral Surveyors)
PAS: Eastern
Headquarters Northwest Olympic
Transportation
Engineers: Northwest Region
and Urban Corridors Office
10.0%
Property & Acquisition Specialist 4-6
Eastern Headquarters
Northwest Olympic
7.5%
Current WSDOT employees in the benchmark classifications suggested that expanding these pays to other titles would be effective in addressing WSDOT’s low base pay in relation to higher cost-of-living regions (e.g. Northwest region) or regions where it is difficult to recruit employees (e.g. Eastern region).

13 Executive Summary
Figure 4 shows the pay differences between WSDOT and several local government comparators for three classifications. Pay differences are greatest in the heavily-populated, high cost-of-living Northwest region.
Recommendation 10.1. Geographic assignment pay should be expanded to include all benchmark classifications. In addition, the agency should consider setting this pay not based on classification, but rather based on region. For example, employees in higher cost-of-living regions should receive higher geographic assignment pay.
Any new structure for assignment pay, especially if it is expanded for recruitment and retention purposes, should be based on the market. Table 3 below shows WSDOT’s variance from the median compensation at maximum base1 in labor markets where the project team benchmarked local public sector employer compensation. Also included in this median calculation is private sector ERI data.2 More detailed tables are available in Appendix F.
1 Maximum base was used instead of maximum base + longevity as ERI data is only captured for maximum base pay. 2 ERI data was included for Seattle and Mount Vernon in the Northwest Region, Tacoma and Olympia in the Olympia Region, Spokane in the Eastern Region, and Vancouver in the Southwest Region. ERI data was only available for the Transportation Engineer 2, Transportation Technician 3, and Property & Acquisition Specialist 3 classifications.
14 Executive Summary
In order to implement different geographic pay, WSDOT will need to be able to demonstrate difficulty in retention, hiring, or both in order to justify.
Table 3 shows that significant adjustments in geographic assignment pay will need to be made in most of these key regions to bring WSDOT compensation up to market levels. These changes should be made in tandem with across-the-board compensation increases.3
Making geographic assignment pay applicable to all benchmark classifications, as well as basing pay on region rather than classification will not only help retain existing employees whose base pay is significantly below the market, but will also help to attract high quality candidates from areas where pay is more competitive, such as the Northwest region, or where hiring is difficult, such as the eastern side of the State. Adjustments to geographic assignment pay allow the agency to adjust pay without changes to the pay grades of each classification, which are set by State HR. Changes to geographic assignment pay must be made through the collective bargaining process/State HR.
Finding #11: Specialty Pays. WSDOT does not currently provide any additional pay for the possession of a Professional Engineer (PE) Licensure or other needed specialties/licensures. While many classifications do not require this licensure, many of the jobs done in the agency do, and advancement to Assistant Project Engineer and Project Engineer in the WMS requires a PE license.4
Recommendation 11.1. Another method for increasing take-home pay outside of across-the-board pay increases, while also encouraging professional development and training, would be to provide an annual educational allowance to support the attainment of a Professional Engineering license. While the allowance amount for the PE licensure should be determined by WSDOT and State HR, the allowance should be contingent upon the employee remaining at WSDOT for a period of years in order to ensure that employees do not leave the organization immediately upon obtaining the license. In
3 The average of the market for each region was determined by calculating the percentage difference between WSDOT compensation for each title at maximum and the median of compensation at maximum for all benchmark jurisdictions located in that particular WSDOT region. In addition to compensation at the benchmark jurisdictions, private sector ERI data was included in the median calculation for the Transportation Engineer 2, Transportation Technician 3, and Property & Acquisition Specialist 3 titles. Detailed tables showing all jurisdictions and ERI data included in the market median calculation can be found in Appendix F. 4 Some Transportation Engineer 4 positions and all Transportation Engineer 5 positions require a PE license.
Table 3: WSDOT Variance from Median Pay in Select Regions
Region WSDOT Variance from Regional Median for all Titles
Northwest -33.2% Olympic -25.3% Eastern -4.9% Southwest -15.5%

15 Executive Summary
addition to providing additional training, having a PE license will prepare more employees for promotion to TE4 and TE5 and to rise to the ranks of the WMS.
Subsidizing the attainment of a PE license would have the additional effect of improving the quality of engineering employees and making it possible for some current Transportation Technicians and Transportation Engineers 1-3 to move into or advance within the Transportation Engineer classifications, providing an incentive, and ability, to seek promotions to these classifications.
Finding #12: Promotion Process. The process for promotion at WSDOT varies by positon, manager, and office location. Uncertainty about the process and requirements for promotion creates uncertainty regarding a career path for employees in the benchmark classifications.
Recommendation 12.1. The agency should undertake a comprehensive review of the processes by which engineering and technical employees in all classifications are promoted to ensure that promotional processes are internally consistent and consistent with current staffing needs.
Finding #13: Employee Dissatisfaction. Feeling valued by the department, along with dissatisfaction with management, were key issues with separated employees. While some level of dissatisfaction lives in any organization, the low pay at WSDOT makes employee satisfaction with management a critical issue.
Recommendation 13.1. WSDOT should include in manager performance reviews a component for review by subordinates. This will allow upper management to understand where managers are doing well and where managers are in need of coaching to improve. Focusing on management performance is a critical issue as the agency works to retain qualified and trained employees. The agency has already begun efforts to improve management performance through individual performance plans and leadership training.
Recruitment
Finding #14: Staffing Plan. The staffing plan through 2019 is to maintain current levels of FTE allocations. Management is in the process of determining how to staff future projects, and is likely to utilize some mixture of WSDOT staff and consultants; however, that mix is not yet determined.
Recommendation 14.1. WSDOT management needs to develop a plan for how they are going to staff projects to be constructed under the new construction funding bill. Once a plan is in place, WSDOT can develop an implementation strategy that will help guide training and recruitment programs.
Recommendation 14.2. There should be regular and scheduled meetings between top WSDOT staff and recruitment staff to help identify staffing needs as early as possible. This provides the opportunity to be more proactive in the hiring process, identifying and

16 Executive Summary
marketing to potential applicants ahead of actual job openings. This cannot be done without a detailed staffing plan and direction for future hiring needs.
Finding #15: Recruitment Plan. An ongoing dialogue between WSDOT managers and the recruiting office has not been established. Currently, the recruitment office works on a reactive rather than proactive basis, as they don’t know future recruitment needs. WSDOT HR is working on establishing these connections and developing a detailed hiring plan for the engineering/technical positions.
Recommendation 15.1. WSDOT HR and other senior management should create a proactive recruitment plan in tandem with identification of staffing needs and a formal staffing plan. This recruitment plan should be revisited periodically to ensure that recruitment efforts are effective and meeting staffing needs.
Recommendation 15.2. WSDOT HR should evaluate its use of NEOGOV to ensure use of full functionality of the system to recruit, track, review, and provide statistics on applicants. WSDOT should work with the Department of Enterprise Services and Washington Technology Solutions to determine if enhancements can be made to NEOGOV to provide search methods effective for sourcing candidates.
Recommendation 15.3. WSDOT HR should consider developing a method to track candidates from previous recruitment and outreach efforts to allow for efficient sourcing of candidates for future vacancies. This would maximize sourcing efforts and provide an additional resource for recruiters and HR professionals to quickly identify potential candidates.
Finding #16: Training. There is a need for training of new employees that will be difficult to meet. The reduction in allocated positions over the last several years affected lower-tenured employees the most. WSDOT has fewer trained lower-level employees and a looming retirement bubble that will further drain experienced engineers out of the workforce.
Recommendation 16.1. Using existing vacant FTE positions to bring on new hires as early as possible for training from more experienced staff that is likely to be leaving the agency. This allows the agency to train new hires in an unrushed fashion.
Recommendation 16.2. As training needs intensify with increased new hires and decreased staff at the higher levels, WSDOT should recruit qualified retirees who can help provide training on an ad hoc basis as retired annuitants. This will allow training to occur on a focused basis by someone who understands the job but is not burdened by other project or administrative duties.
Finding #17: Proactive Recruitment. The current recruitment process is reactive to immediate needs identified by managers and approved for hiring. The technical nature of many of the WSDOT jobs requires the early identification of potential applicants with training and interest in civil engineering, transportation engineering, and related fields. A portion of each
17 Executive Summary
recruiter’s time should be spent being proactive in developing relationships for future hiring needs.
Recommendation 17.1. WSDOT recruiters should reestablish ties with college engineering programs throughout the State and in nearby states.
Recommendation 17.2. WSDOT should seek to build a robust internship program with the goal of this program feeding into entry-level engineering positions. This will provide the backfill needed for upper-level positions as retirements increase in the coming years.
Finding #18: Specialized Hiring. The WSDOT has had difficulty identifying and hiring specialized technical positions that are critical to the mission of the agency, such as hydrologists, geotechnical, and traffic engineers. This difficulty is largely due to the low pay associated with these positions in the broader job classifications utilized by WSDOT.
Recommendation 18.1. Provide compensation incentives for most difficult to hire positions, such as hydrologist or other specialized positions, that have far lower compensation than comparative agencies. In areas where the WSDOT is already significantly below market, it may be most cost effective for the agency to target specialty pay for critical positions that are difficult to hire. This is highlighted by the fact that the broad job classifications used by WSDOT most likely lead to disparities in comparative pay that do not show up in pay comparisons.
18 Organization of Report and Study Methodology
Organization of Report and Study Methodology This report is organized into four chapters. Chapter 1 explores the drivers behind recent attrition and presents a vacancy projections in the next five and ten years. Chapter 2 details WSDOT compensation, including cash, health, pension, and other benefits, and compares it to compensation and benefits at local public sector employers. Chapter 3 explores the WSDOT’s recent attrition, the drivers of that attrition, and presents recommendations aimed at keeping WSDOT employees longer. Chapter 4 gives an overview of the WSDOT recruitment process and provides findings and recommendations related to how WSDOT engineering employees are recruited, selected, and trained. This chapter also provides a staffing plan for 2017-2019 developed with assistance from WSDOT personnel.
Study Methodology
Over the course of the study, the project team used a variety of tools to evaluate the WSDOT’s recruitment process, retention experience, and competitive market position. The tools used in this study included:
Interviews with WSDOT staff Review of data provided by the WSDOT Office of Human Resources and the Office of
Financial Management State Human Resources Benchmark compensation surveys of local public sector employers in Washington State Survey of WSDOT former employees in the benchmark classifications who separated
from the agency between January 1, 2013 and December 31, 2015
The specific methodology used in this report varies for each area discussed in the following chapters. A detailed description of the specific methodologies used are contained in each of the subsequent chapters. The tools used throughout the study are discussed more fully below.
On-Site Visits
The project team met with key stakeholders inside WSDOT during a two-day period in February 2016, and following. Interviewees included:
WSDOT Human Resources Personnel (WSDOT HR) Office of Financial Management – State Human Resources (State HR) WSDOT Recruitment Team WSDOT Regional Administrators and Assistant Regional Administrators Focus groups of employees in benchmarked titles, including:
o Property & Acquisition Specialists o Transportation Engineers o Transportation Technicians
19 Organization of Report and Study Methodology
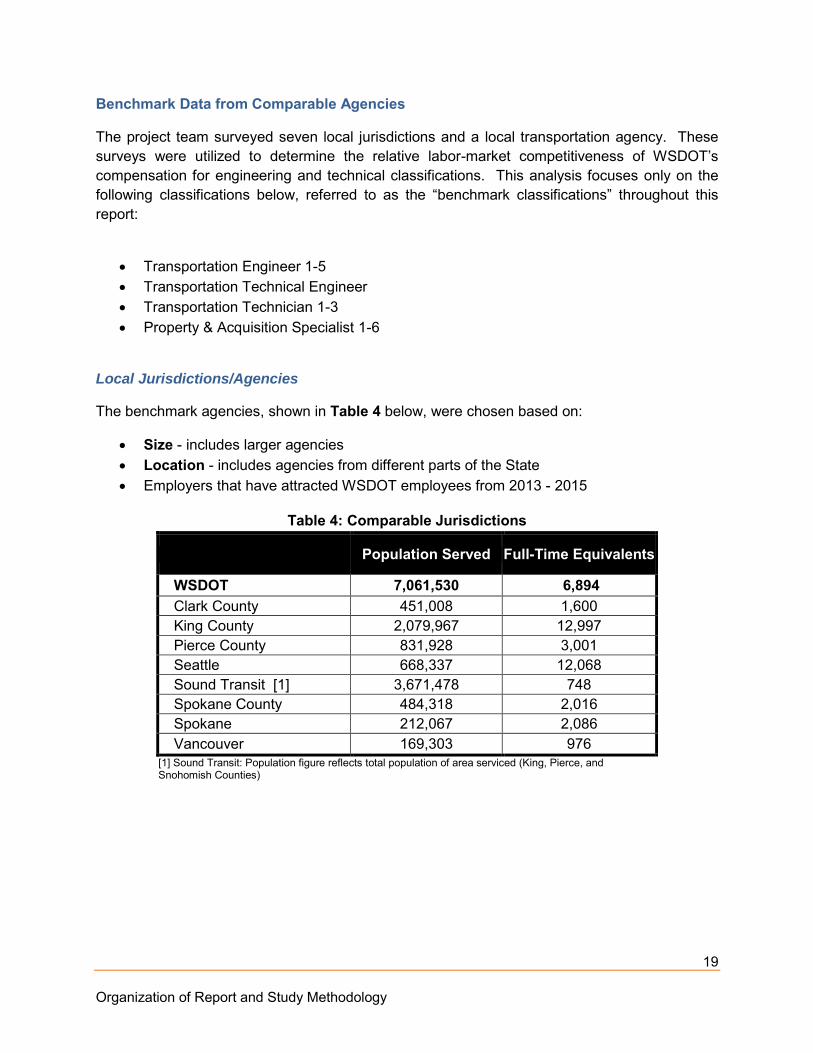
Benchmark Data from Comparable Agencies
The project team surveyed seven local jurisdictions and a local transportation agency. These surveys were utilized to determine the relative labor-market competitiveness of WSDOT’s compensation for engineering and technical classifications. This analysis focuses only on the following classifications below, referred to as the “benchmark classifications” throughout this report:
Transportation Engineer 1-5 Transportation Technical Engineer Transportation Technician 1-3 Property & Acquisition Specialist 1-6
Local Jurisdictions/Agencies
The benchmark agencies, shown in Table 4 below, were chosen based on:
Size - includes larger agencies Location - includes agencies from different parts of the State Employers that have attracted WSDOT employees from 2013 - 2015
Table 4: Comparable Jurisdictions
Population Served Full-Time Equivalents
WSDOT 7,061,530 6,894 Clark County 451,008 1,600 King County 2,079,967 12,997 Pierce County 831,928 3,001 Seattle 668,337 12,068 Sound Transit [1] 3,671,478 748 Spokane County 484,318 2,016 Spokane 212,067 2,086 Vancouver 169,303 976
[1] Sound Transit: Population figure reflects total population of area serviced (King, Pierce, and Snohomish Counties)
20 Organization of Report and Study Methodology
To evaluate relative compensation, the project team developed and circulated a detailed survey instrument (see Appendix A), and collected and reviewed key documents (e.g., pay plans, collective bargaining agreements, and job specifications) covering the benchmark classifications listed above. Unless otherwise noted, all analysis was conducted to compare compensation and benefits as of June 30, 2016.
Comparisons across employers are often imprecise due to differences in economic base and ability to pay, organizational structure, working conditions, types of duties assigned, qualification and skill requirements, and other relevant factors that may vary for similar jobs. The best job match across employers is often not a perfect match, and such variations may contribute to some reported differences in relative compensation.
To achieve reasonable and generally useful matches, classification summaries were prepared from State of Washington classification specifications and incorporated into the survey instrument to assist participants in matching their classifications to the State’s benchmark classifications. In some cases, no match was available. In other cases matches provided were for similar but not identical jobs. Classification matches for each jurisdiction can be found in Appendix D.
The project team followed up with phone calls and emails to clarify many written survey responses, and conducted independent analysis of job specifications towards identifying the most relevant job matches. In general, however, our findings rely on the matches provided by the survey participants. Because such matches vary in “closeness of fit” to the State’s job classifications, it is likely that some outlier pay rates reported may result from relatively weak matches. Greater weight should generally be given to survey medians and modes. Minor variances (approximately 5% or less) may not be significant.
Survey Data
The project team developed a survey that was administered to WSDOT employees in the benchmark classifications who separated between 2013 and 2015. The goal of the survey was to solicit a broad spectrum of information and opinions regarding WSDOT from former employees to provide both an inside and outside view of the agency.
The survey, conducted via Survey Monkey, was open to respondents for one month between April and May 2016. In total, 86 former employees were surveyed, with 40 (46.5%) responding.5
The complete list of survey questions is provided in Appendix A.
5 Survey invitations were sent to all employees separated from 2013-2015 for whom an email address could be determined.

21 Organization of Report and Study Methodology
Data Provided by WSDOT
WSDOT HR provided data regarding headcounts, vacancies, payroll, and attrition. WSDOT HR also provided the WSDOT-specific results from the State exit survey. Data provided by WSDOT is as of 12/31/2015 unless noted otherwise. State HR also provided the Economic Research Institute (ERI) and 2016 State Salary Survey data.

22 Chapter 1: WSDOT Workforce Composition and Vacancy Projection
Chapter 1: WSDOT Workforce Composition and Vacancy Projection
INTRODUCTION
The workforce evaluation provides context for this comprehensive study of WSDOT recruitment and retention challenges and opportunities. This initial chapter provides an analysis of WSDOT vacancies and attrition, along with projections of potential staffing levels going forward.
WORKFORCE COMPOSITION
The Washington State Department of Transportation (WSDOT) provides oversight of the State’s multimodal transportation system and is responsible for ensuring that people and goods move throughout the State safely and efficiently. The agency operates and maintains 18,000 miles of highways and 3,600 bridges and runs the nation’s largest ferry system. To more effectively operate and maintain these resources, the WSDOT is divided into six regions, shown in the map below.

23 Chapter 1: WSDOT Workforce Composition and Vacancy Projection
These regions are comprised of approximately 6,894 full-time and part-time staff (as of 12/31/2015). The total number of employees in the benchmark classifications comprises 19.4% of this total headcount, or 1,336 employees, as shown in Table 5 below.
6 Italicized percentages are percentages of the total number of employees in the benchmark classifications examined in this report.
Table 5: WSDOT Employees
Filled Positions Percent6
Total Employees 6,894 -
Employees in Benchmark Classifications 1,336 19.4%
Transportation Engineers 1-5 940 70.4%
Transportation Technicians 1-3 253 18.9%
Transportation Technical Engineers 79 5.9%
Property & Acquisition Specialists 1-6 64 4.8%
24 Chapter 1: WSDOT Workforce Composition and Vacancy Projection
VACANCY ANALYSIS AND PROJECTIONS
Between FY2011 and FY2015, WSDOT was actively reducing its workforce as mandated in legislation (ESHB 2190) in response to revenue issues and the associated lack of projects. In this time period, WSDOT reduced staff in the benchmark classifications by over 500. The majority of the reductions were achieved through attrition, and vacant positions were not replaced.
With the passage of the Connecting Washington $16 billion transportation revenue package, WSDOT is now in a position of needing to be fully staffed and must be able to replace staff that leave the agency with high-quality applicants. WSDOT has seen increasing attrition of its employees in the benchmark classifications in recent years (2013-2015). While a substantial amount of attrition is due to retirement, a growing portion is due to voluntary resignation. During this period, some attrition may have been due to continuing concerns regarding the reduction and the stability of the engineering and technical workforce. From 2013 to 2015, the rate of resignation, or “quit rate” nearly doubled from 1.3 percent to 3.4 percent. While these rates are not out of line with national norms in the state and local government sector, their growth might indicate a negative trend within the agency at a time when it needs to retain valuable employees.
This chapter of the report will address how current attrition rates, including expected retirements, will impact the agency’s staffing over the next five years in the benchmark job classes.
Recent Attrition
Based on 2013-2015 separation data provided by WSDOT HR, the majority of resignations among employees in the benchmark classifications occur within the first ten years of employment, with over a third of resignations coming between six and ten years of service. While the historical attrition trends for resignations is colored by the mandated reduction, the pattern of when employees choose to leave is an important factor to consider in analyzing attrition within the agency.

25 Chapter 1: WSDOT Workforce Composition and Vacancy Projection
Table 6: WSDOT Attrition by Tenure and Reason Resigned Retired Other Total
0-5 YOS 16 1 1 18 (7.1%) 6-10 YOS 67 10 8 85 (33.7%) 11-15 YOS 21 5 2 28 (11.1%) 16-20 YOS 1 5 1 7 (2.8%) 21+ YOS 8 98 8 114 (45.2%) Total 113 (44.8%) 119 (47.2%) 20 (7.9%) 252 (100.0%)
As employees gain tenure with the agency, the resignation rate decreases; by 21 years of service the primary reason for attrition is retirement.
The agency keeps little data on where employees go to work when they voluntarily resign. State exit survey results and PFM survey results indicate many separated employees go to local governments within the State. This will be discussed in more detail in Chapter 3.
0
20
40
60
80
100
120
0-5 YOS 6-10 YOS 11-15 YOS 16-20 YOS 21+ YOS
Figure 5: WSDOT Attrition by Tenure and Reason (1/1/2013 - 12/31/2015)
Resigned Retired Other
26 Chapter 1: WSDOT Workforce Composition and Vacancy Projection
PROJECTED STAFFING LEVELS
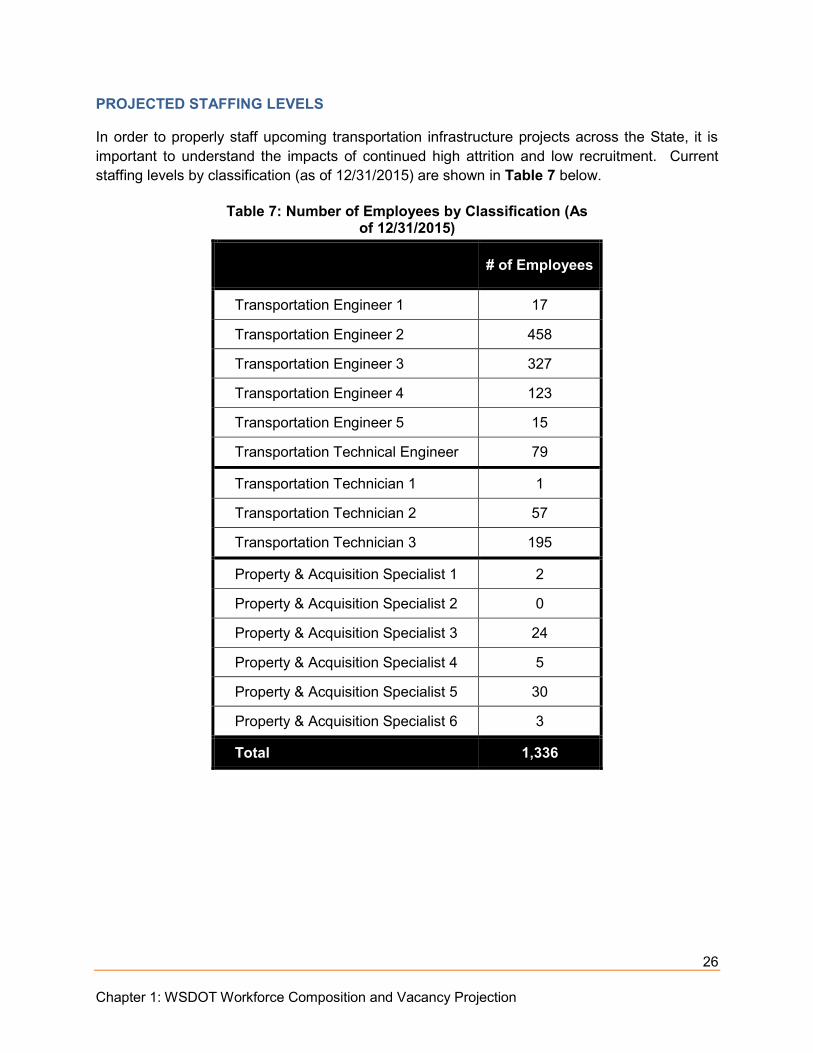
In order to properly staff upcoming transportation infrastructure projects across the State, it is important to understand the impacts of continued high attrition and low recruitment. Current staffing levels by classification (as of 12/31/2015) are shown in Table 7 below.
Table 7: Number of Employees by Classification (As of 12/31/2015)
# of Employees
Transportation Engineer 1 17
Transportation Engineer 2 458
Transportation Engineer 3 327
Transportation Engineer 4 123
Transportation Engineer 5 15
Transportation Technical Engineer 79
Transportation Technician 1 1
Transportation Technician 2 57
Transportation Technician 3 195
Property & Acquisition Specialist 1 2
Property & Acquisition Specialist 2 0
Property & Acquisition Specialist 3 24
Property & Acquisition Specialist 4 5
Property & Acquisition Specialist 5 30
Property & Acquisition Specialist 6 3
Total 1,336

27 Chapter 1: WSDOT Workforce Composition and Vacancy Projection
Projection Methodology
The projection focuses on staffing levels for the benchmark classifications using the following general methodology:
Start with authorized benchmark positions – approximately 1,372 full-time as of December 31, 2015
SUBTRACT all employees eligible for retirement as of January 1 of each year SUBTRACT non-voluntary attrition – estimated at two per year for all classifications and
one per year for each individual classifications and geographic region SUBTRACT 2015 resignations The result is the expected increase or decrease in the total workforce over the five or
ten-year projection period
The projections are helpful in understanding the expected hiring needs for the agency over the next several years, but is not meant to be determinative of actual resignation levels or retirement decisions. The projections show that there will be an ongoing hiring need for the agency even without an increase in total FTEs. Detailed vacancy projections can be found in Appendix B.
Projection Assumptions
This projection assumes the following:
2015 resignation levels will continue over the next ten years (there were 45 total resignations in 2015)
Employees who become eligible to retire in each year will retire7 Non-voluntary attritions will remain low No additional hiring to replace lost employees—this does not assume that positions will
not be filled, but is meant to show the employee gap that will need to be filled Authorized positions remain the same year-to-year
Retirements: Retirement of existing employees will have a marked impact on WSDOT’s staffing levels. Retirement projections included in the vacancy projection above assume that an employee will retire in the calendar year in which they become eligible. While not every employee will retire as soon as they are eligible, retirements in the PERS system generally occur within one to three years of eligibility, as shown in the table below. This table shows the average age and years of service (YOS) at the time of retirement in comparison to normal retirement eligibility criteria for each of the PERS plans.8
7 This is an assumption applied to facilitate a projection. Actual employee experience will, of course, vary. 8 Data provided by the Washington State Department of Retirement Systems. Data reflects normal retirements for the last ten years in each PERS plan. Data reflects all State retirements (total enterprise), not just retirements within WSDOT. WSDOT-specific data was not available.

28 Chapter 1: WSDOT Workforce Composition and Vacancy Projection
Normal Service Retirement Eligibility
Average Age and YOS at Retirement
PERS 1 Any age with 30 YOS Age 55 with 25 YOS Age 60 with 5 YOS
Age: 60.9 YOS: 30.8
PERS 2 Age: 65 YOS: 5 YOS
Age 66.0 YOS: 17.2
PERS 3 Age: 65 YOS: 10 YOS
Age: 65.7 YOS: 19.2
Figure 6 shows engineering and technical employees who will be eligible for retirement through 2021 (a little over five years) and Table 8 provides this information in tabular form. For all job classifications, 65 of the current 1,4459 employees (including part time employees) will be eligible to retire in 2016. During this period, 217 employees will be eligible to retire.10
9 This figure differs from figure on page 12 because this figure includes part-time and employees on extended leave as of 12/31/2015. 10 A ten year retirement projection can be found in Appendix C.

29 Chapter 1: WSDOT Workforce Composition and Vacancy Projection
Table 8: WSDOT Retirements in Each Calendar Year, 2016-2026 2016 2017 2018 2019 2020 2021 Total
All Classifications 65 23 31 25 40 33 217
Transportation Engineer Classifications and Transportation Technical Engineers 48 18 23 13 31 22 155
Property & Acquisition Specialists 10 4 1 3 1 4 23
Transportation Technicians 7 1 7 9 8 7 39
If these employees retire as projected, WSDOT will need to replace about 15 percent of its workforce by the end of 2021 to replace retirements alone. The replacements will likely be recent college graduates, thus replacing the person but not the lost experience and expertise.
Figure 7 shows the number of retirements by WSDOT region or other subdivision (Alaskan Way Viaduct, Bridges, Tolls, and Ferries) for the same time period.
Over 35 percent of projected retirements through 2021 will occur in the northwest region, where a significant portion of WSDOT work takes place.
Resignations: Resignations are the most difficult factor to project. As previously shown, recent attrition has increased from 1.3 percent of all employees in 2013 to 3.4 percent in 2015. Based on attrition data provided by WSDOT, many of the employees who resign are leaving for employment with nearby local governments.
30 Chapter 1: WSDOT Workforce Composition and Vacancy Projection
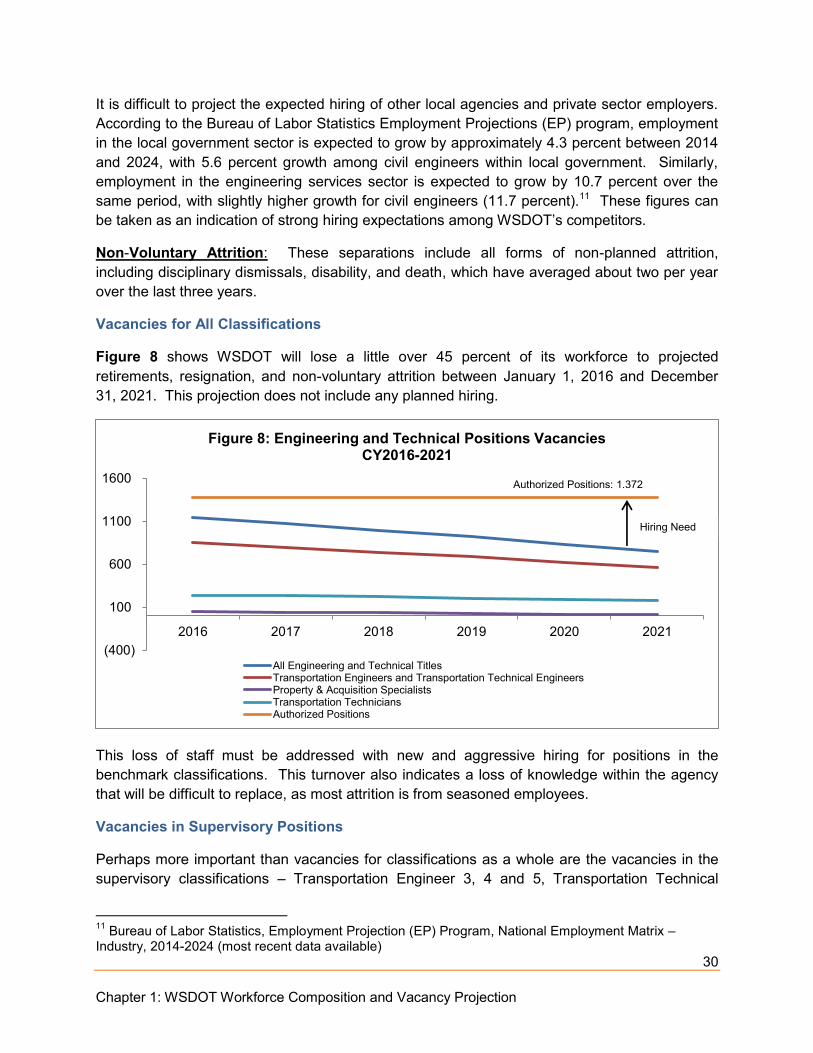
It is difficult to project the expected hiring of other local agencies and private sector employers. According to the Bureau of Labor Statistics Employment Projections (EP) program, employment in the local government sector is expected to grow by approximately 4.3 percent between 2014 and 2024, with 5.6 percent growth among civil engineers within local government. Similarly, employment in the engineering services sector is expected to grow by 10.7 percent over the same period, with slightly higher growth for civil engineers (11.7 percent).11 These figures can be taken as an indication of strong hiring expectations among WSDOT’s competitors.
Non-Voluntary Attrition: These separations include all forms of non-planned attrition, including disciplinary dismissals, disability, and death, which have averaged about two per year over the last three years.
Vacancies for All Classifications
Figure 8 shows WSDOT will lose a little over 45 percent of its workforce to projected retirements, resignation, and non-voluntary attrition between January 1, 2016 and December 31, 2021. This projection does not include any planned hiring.
This loss of staff must be addressed with new and aggressive hiring for positions in the benchmark classifications. This turnover also indicates a loss of knowledge within the agency that will be difficult to replace, as most attrition is from seasoned employees.
Vacancies in Supervisory Positions
Perhaps more important than vacancies for classifications as a whole are the vacancies in the supervisory classifications – Transportation Engineer 3, 4 and 5, Transportation Technical
11 Bureau of Labor Statistics, Employment Projection (EP) Program, National Employment Matrix – Industry, 2014-2024 (most recent data available)
(400)
100
600
1100
1600
2016 2017 2018 2019 2020 2021
Figure 8: Engineering and Technical Positions Vacancies CY2016-2021
All Engineering and Technical TitlesTransportation Engineers and Transportation Technical EngineersProperty & Acquisition SpecialistsTransportation TechniciansAuthorized Positions
Authorized Positions: 1,372
Hiring Need

31 Chapter 1: WSDOT Workforce Composition and Vacancy Projection
Engineer, and Property & Acquisition Specialists 5 and 6. As shown in Table 9 below, projected turnover in these classifications by 2021 is staggering. Without sufficient hiring, WSDOT will lose most, if not all, of their current supervisory workforce to attrition by 2021. With these employees goes the institutional knowledge that is critical to training a new generation of employees in the benchmark classifications.
Table 9: Supervisory Titles Vacancy Rates, CY2016-2021
2016 2017 2018 2019 2020 2021 All Supervisory Titles -13.6% -23.1% -32.5% -40.8% -50.9% -61.5% Transportation Engineer 3 -7.0% -8.5% -11.9% -16.9% -20.9% -24.4% Transportation Engineer 4 -9.2% -17.6% -26.9% -34.5% -44.5% -53.8% Transportation Engineering 5 -25.0% -37.5% -50.0% -62.5% -81.3% -93.8% Transportation Technical Engineer -15.3% -17.6% -22.4% -28.2% -31.8% -35.3% Property & Acquisition Specialist 5 -29.0% -41.9% -54.8% -67.7% -77.4% -96.8% Property & Acquisition Specialist 6 0.0% -33.3% -33.3% -33.3% -33.3% -33.3%
Most supervisory positions are filled from within the agency. Therefore, high turnover in lower-level jobs will significantly impact the recruitment pool for these positions. Succession planning will be critical to maintain institutional knowledge and encourage retention. The agency will need to begin hiring now to “backfill” for these employees. This not only raises the question of hiring but also that of training new employees.
Projection Implications
The projections above have significant implications for WSDOT’s recruitment and retention efforts. Significant hiring needs in 2016: In order to adequately staff a substantial increase in project work during the 2017-2019 biennium, WSDOT will need to hire a significant number of new employees into current classification allocations. To fill existing vacancies and expected attrition by the end of Calendar Year 2016, WSDOT will need to hire about 227 people.
Additional hiring through 2021: Over the next five years, year-to-year hiring needs will remain modest. As shown in Table 10, WSDOT will need to hire a little over 100 people a year to maintain its current authorized level of positions. In total, from 2016 to 2021, the agency will need to hire over 600 people. More importantly, the agency will need to hire to fill the positions of supervisory employees who may leave in significant numbers through 2021. This will create a training issue for those employees just entering the agency. This may also mean that the agency will need to target hiring of already-seasoned staff. This will put more emphasis on pay than for entry-level employees.

32 Chapter 1: WSDOT Workforce Composition and Vacancy Projection
Table 10: CY2016-2021 Hiring Needs (All Classifications)
2016 2017 2018 2019 2020 2021
Cumulative 227 298 377 450 538 619
Year-by-Year 227 71 79 73 88 81
Hiring to backfill for retirements beyond 2021: As the number of projected retirements increases after 2021 (see Appendix C), hiring needs will also increase. As shown in Table 11, from 2022 to 2026 the agency will be required to hire an average of 106 people per year, or a total of 544 people to maintain authorized staffing levels. While not in this report’s analysis period, it is important to show that a high level of projected recruitment effort will be ongoing for the next decade at least for the purposes of devising recruitment strategies.
Table 11: CY2016-2026 Hiring Needs (All Classifications)
2016 2017 2018 2019 2020 2021 2022 2023 2024 2025 2026
Cumulative 227 298 377 450 538 619 722 831 949 1058 1163
Year-by-Year 255 71 79 73 88 81 103 109 118 109 105
CONCLUSION
Over the next five years, WSDOT is projected to lose just over 45 percent of its workforce in the benchmark classifications to retirement, resignation, and other non-voluntary attrition. This will lead to increased and ongoing hiring of engineers and technical personnel. This will result in opportunities for promotions for many existing staff, but will result in a large influx of largely untrained new employees into entry-level positions. At the same time, the recent passage of a $16 billion construction bill will begin to change the type of work that these jobs are needed for. While there may be increased direct project work, there will also be a need to manage consulting contracts as well. This will create additional issues in identifying the different skill sets needed in the future as well as how to on-board and train these new employees.
33 Chapter 2: WSDOT Compensation
Chapter 2: WSDOT Compensation This chapter will lay out the overall compensation plan for WSDOT benchmark classifications being addressed in this report. Compensation is broadly classified into cash compensation and non-cash benefits. The details of each of the broad classifications are provided below.
Classification Descriptions
The benchmark classifications in this analysis fall within the scope of engineering and technical positions at WSDOT. Brief descriptions of each classification are provided below:
Transportation Engineers: Performs transportation engineering work in the areas of survey, design, construction, traffic, marine, and materials.
Transportation Technical Engineers: Manages highly specialized technical engineering programs or functions as a senior technical program specialist.
Transportation Technicians: Perform technical tasks in support of engineering projects and program in the areas of survey, materials, inspection, bridges and structures, traffic, maintenance, and administration
Property & Acquisition Specialists: Perform specialized activities in real or personal property including appraisals, audits, property management, negotiations, relocation, title examination, acquisition, leasing, valuation, and project management
All but three classifications are subject to collective bargaining through the Professional and Technical Employees (PTE) Local 17. The current agreement is effective through June 30, 2017.
PTE Local 17 Non-Represented Employees
Transportation Engineer 1-3 Transportation Technician 1-3
Property & Acquisition Specialist 1-6
Transportation Engineer 4-5 Transportation Technical Engineer
Cash Compensation
Cash compensation is comprised of any pay that results in direct pay to an employee. This is inclusive of base pay, specialty pays, and overtime.
Base pay, longevity, and pay progression
WSDOT engineering and technical employees are paid according to the general service salary scale. This scale contains 12 progression steps which employees move through up to the maximum base pay.
34 Chapter 2: WSDOT Compensation
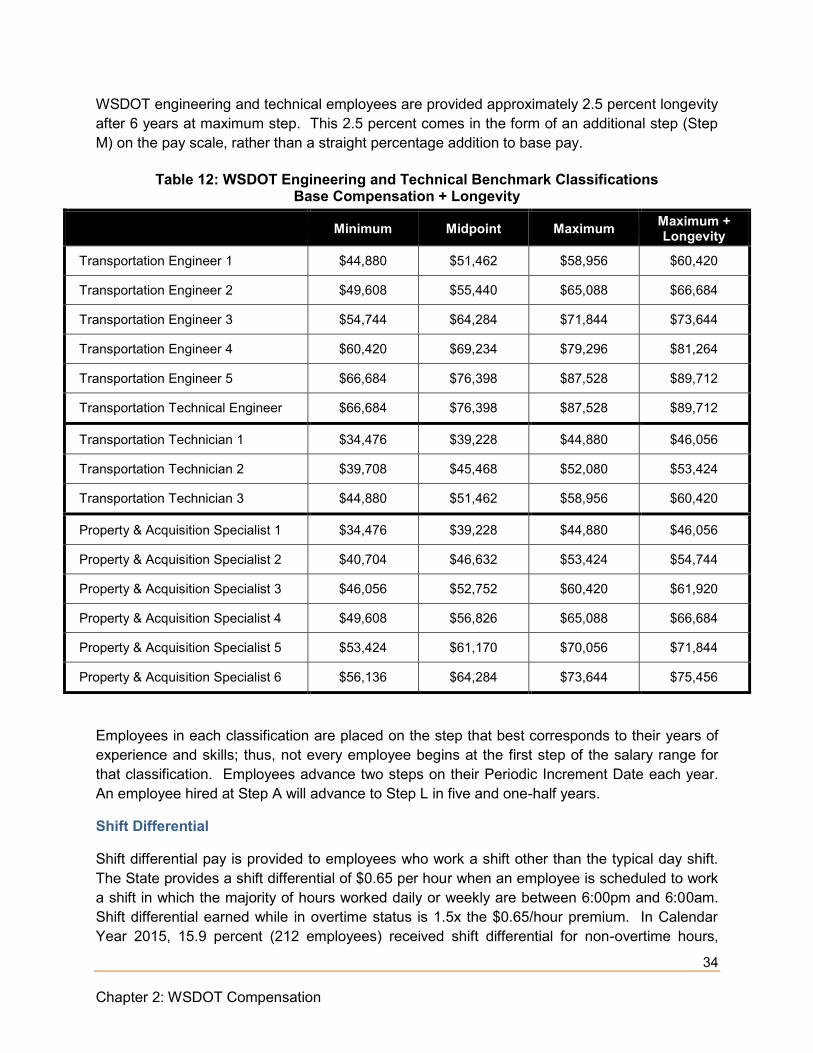
WSDOT engineering and technical employees are provided approximately 2.5 percent longevity after 6 years at maximum step. This 2.5 percent comes in the form of an additional step (Step M) on the pay scale, rather than a straight percentage addition to base pay.
Table 12: WSDOT Engineering and Technical Benchmark Classifications Base Compensation + Longevity
Minimum Midpoint Maximum Maximum + Longevity
Transportation Engineer 1 $44,880 $51,462 $58,956 $60,420
Transportation Engineer 2 $49,608 $55,440 $65,088 $66,684
Transportation Engineer 3 $54,744 $64,284 $71,844 $73,644
Transportation Engineer 4 $60,420 $69,234 $79,296 $81,264
Transportation Engineer 5 $66,684 $76,398 $87,528 $89,712
Transportation Technical Engineer $66,684 $76,398 $87,528 $89,712
Transportation Technician 1 $34,476 $39,228 $44,880 $46,056
Transportation Technician 2 $39,708 $45,468 $52,080 $53,424
Transportation Technician 3 $44,880 $51,462 $58,956 $60,420
Property & Acquisition Specialist 1 $34,476 $39,228 $44,880 $46,056
Property & Acquisition Specialist 2 $40,704 $46,632 $53,424 $54,744
Property & Acquisition Specialist 3 $46,056 $52,752 $60,420 $61,920
Property & Acquisition Specialist 4 $49,608 $56,826 $65,088 $66,684
Property & Acquisition Specialist 5 $53,424 $61,170 $70,056 $71,844
Property & Acquisition Specialist 6 $56,136 $64,284 $73,644 $75,456
Employees in each classification are placed on the step that best corresponds to their years of experience and skills; thus, not every employee begins at the first step of the salary range for that classification. Employees advance two steps on their Periodic Increment Date each year. An employee hired at Step A will advance to Step L in five and one-half years.
Shift Differential
Shift differential pay is provided to employees who work a shift other than the typical day shift. The State provides a shift differential of $0.65 per hour when an employee is scheduled to work a shift in which the majority of hours worked daily or weekly are between 6:00pm and 6:00am. Shift differential earned while in overtime status is 1.5x the $0.65/hour premium. In Calendar Year 2015, 15.9 percent (212 employees) received shift differential for non-overtime hours,
35 Chapter 2: WSDOT Compensation
averaging $204 in CY2015, while 8.5 percent (114 employees) received overtime shift differential, averaging approximately $60.
Overtime
The State of Washington provides time-and-a-half pay in accordance with the Fair Labor Standards Act for all hours of work occurring before or after a shift or on a regular day off. Transportation Engineers 1-3, Transportation Technicians 1-3, and Property & Acquisition Specialists 1-6 are all overtime eligible. In Calendar Year 2015, 59.4 percent of employees in the benchmark classes received overtime (794 employees). For those receiving this premium, overtime pay averaged $3,476 in CY2015.
Call Back, Standby, and Schedule Change Penalty Pays
Under the Local 17 agreement, bargaining unit employees are also offered the following additional pays:
Call Back Pay: This pay is provided to overtime-eligible employees when called back to work after their regular shift without receiving prior notice. In Calendar Year 2015, 101 employees in the benchmark classifications received this pay, averaging $251.
Standby Pay: This pay is provided to employees waiting to be engaged in work at a
specific location or prepared to report immediately for work. Overtime-eligible employees are compensated at 7 percent of hourly base salary for hours in standby status. In Calendar Year 2015, only 1.2 percent (16 employees) received this pay, averaging $1,748. Overtime-exempt employees are compensated at $25/day spent in standby status. In Calendar Year 2015, only 3 employees in the benchmark classifications received this pay, averaging $4,658.
Schedule Change Penalty Pay: Employees receive an amount of half their hourly rate
when they do not receive appropriate notice of a change to their work schedule. In Calendar Year 2015, 118 employees in the benchmark classifications received this pay, averaging $192.
Holiday Pay
All of the WSDOT employees in the benchmark classifications also receive ten paid holidays plus one paid personal holiday per year. This pay averaged $2,963 for all benchmark employees. Local 17 represented employees receive an additional personal leave day each fiscal year.
36 Chapter 2: WSDOT Compensation
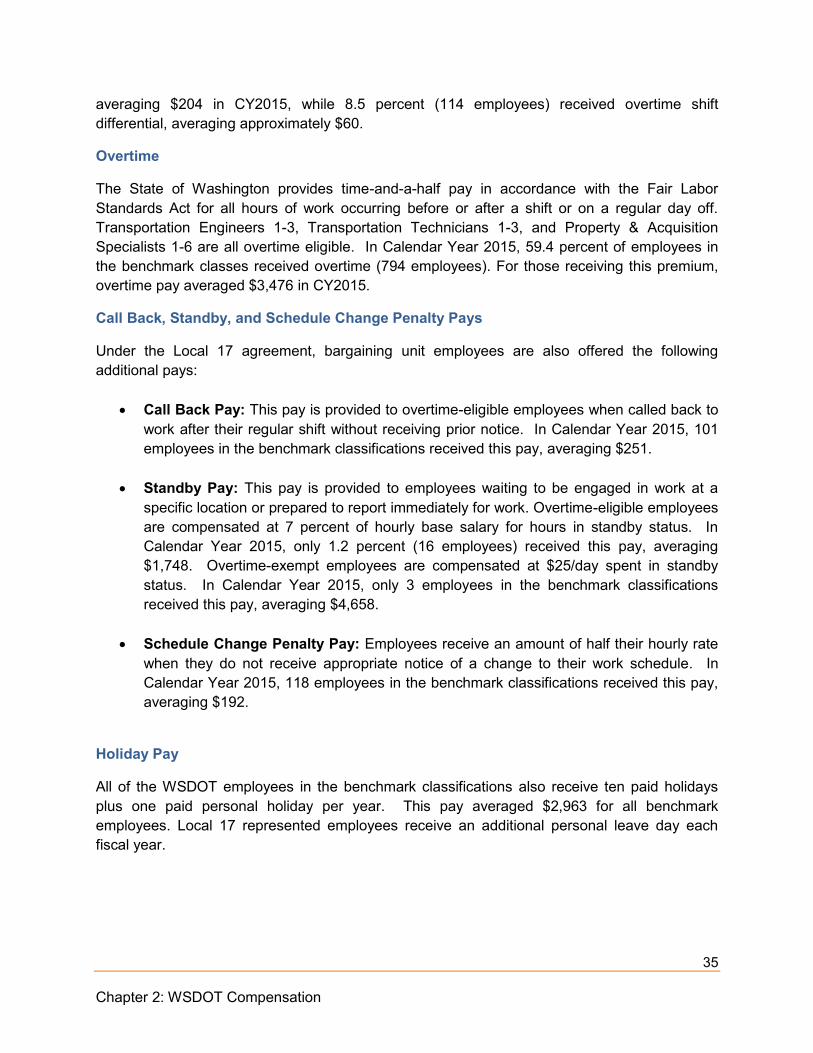
Assignment Pays
WSDOT employees in certain classifications are eligible for a range of assignment pays. Transportation Engineers and Technicians are eligible for assignment pays based on the type of work performed.
Table 13: WSDOT Assignment Pays
Type of Pay Pay Amount # of
Employees Receiving as of 12/31/2015
Average Pay as of
12/31/2015
Transportation Engineer 1-3 Transportation Technician 1-3
Bridge Painting
Inspection Duty
10.0% of base pay for hours worked
in this capacity
4 $861
Transportation Engineer 2-3 Transportation Technician 1-3
Under-Bridge Inspection
Truck (UBIT) Operation
10.0% of base pay for hours worked
in this capacity
3 $562

37 Chapter 2: WSDOT Compensation
Employees who are classified as Transportation Engineer 3 and are working as cadastral surveyors, as well as Property & Acquisition Specialists are eligible for assignment pay based on their geographic location. These pays range from 2.5 to 10.0 percent, depending on classification, and were instituted to counteract recruitment and retention issues for these classifications.
Table 14: WSDOT Geographic Assignment Pay
Regions Pay Amount
# of Employees Receiving
as of 12/31/2015
Average Pay as of
12/31/2015
Property & Acquisition Specialist 1 Northwest 2.5% 1 $360
Property & Acquisition Specialist 2
Eastern Headquarters
Northwest Olympic
5.0% 1 $1,802
Property & Acquisition Specialist 3 Transportation Engineer 3 (Cadastral Surveyors)
PAS: Eastern
Headquarters Northwest Olympic
Transportation
Engineers: Northwest
Region and Urban Corridors
Office
10.0% 29 $4,585
Property & Acquisition Specialist 4-6
Eastern Headquarters
Northwest Olympic
7.5% 26 $4,308
Note: 10.0% assignment pay for Property & Acquisition Specialists 3 and Transportation Engineers 3 could not be separated by classification
38 Chapter 2: WSDOT Compensation
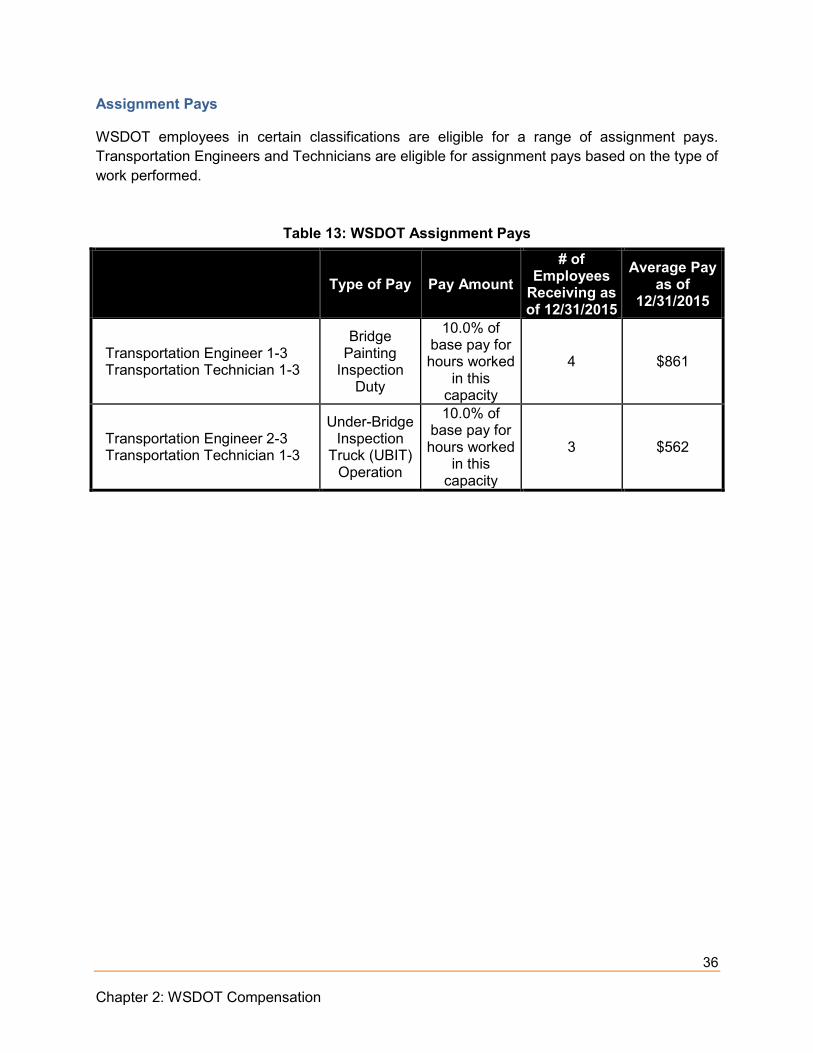
Stipends and Allowances WSDOT provides stipends to employees for business use of their personal cell phone in lieu of a state-issued device. The amount of these stipends and the number of WSDOT employees receiving them are shown in Table 15.
Table 15: WSDOT Stipends and Allowances
Pay Amount # of Employees Receiving as of
12/31/2015 Average Pay as of
12/31/2015
Cell Phone Stipend
Voice: $10/month Data: $30/month Voice and data:
$40/month
96 $275
Commute Incentive
Varies based on how employee choses to
commute – transit fare, carpool incentive
159 $139
WSDOT Earnings in Context
In comparison to the overall Washington State labor market, a career at WSDOT provides competitive wages. According to the U.S. Census Bureau, the median household income in Washington State for individuals age 25 and over with a high school diploma was $31,016 as of 2014. Individuals with some college or an associate degree had a median household income of $35,409 and individuals with a bachelor’s degree earned $54,844 per year.12 While the WSDOT engineering and technical jobs require a high level of expertise and on-the-job training, total pay is reasonable compared to statewide averages.
12 U.S. Census Bureau, American Community Survey, 2014, 1-Year Estimates
39 Chapter 2: WSDOT Compensation
Non-Cash Benefits
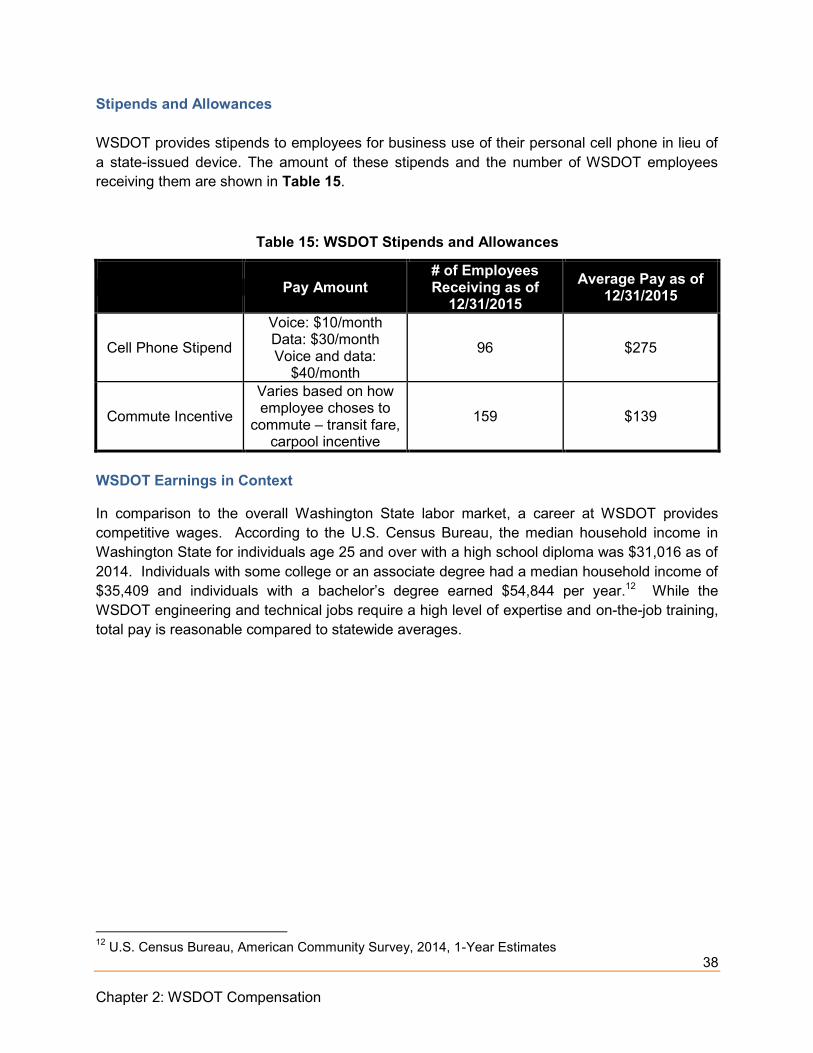
Leave
In addition to cash compensation, WSDOT employees receive vacation leave allowances based on years of service, as detailed in the chart below. Including personal leave, these employees receive between 104 and 184 hours of regular leave per year.
WSDOT employees also receive ten paid holidays plus one personal holiday per year. If required to work during a holiday, employees receive pay at the overtime (1.5x) rate for actual hours worked in addition to the straight-time rate for the hours they are regularly scheduled to work on that day.
Other forms of paid leave include severe inclement weather/natural disaster leave, jury duty leave, bereavement leave, volunteer leave, military leave, work-related injury/illness leave, and sick leave.
13 Personal leave is granted to all PTE Local 17 employees after four months of employment. It must be used in the fiscal year it is granted and cannot be carried over to the following fiscal year.
Table 16: WSDOT Vacation Leave Allowances
Completed Years of Service Hours of Leave
Vacation Leave
0 YOS 96 hours 1 YOS 104 hours
2-3 YOS 112 hours 4-6 YOS 120 hours 7-9 YOS 128 hours
10+ YOS Additional 8 hours of leave for each
additional YOS, to a maximum of 176 hours
Personal Leave13 All years of service 8 hours
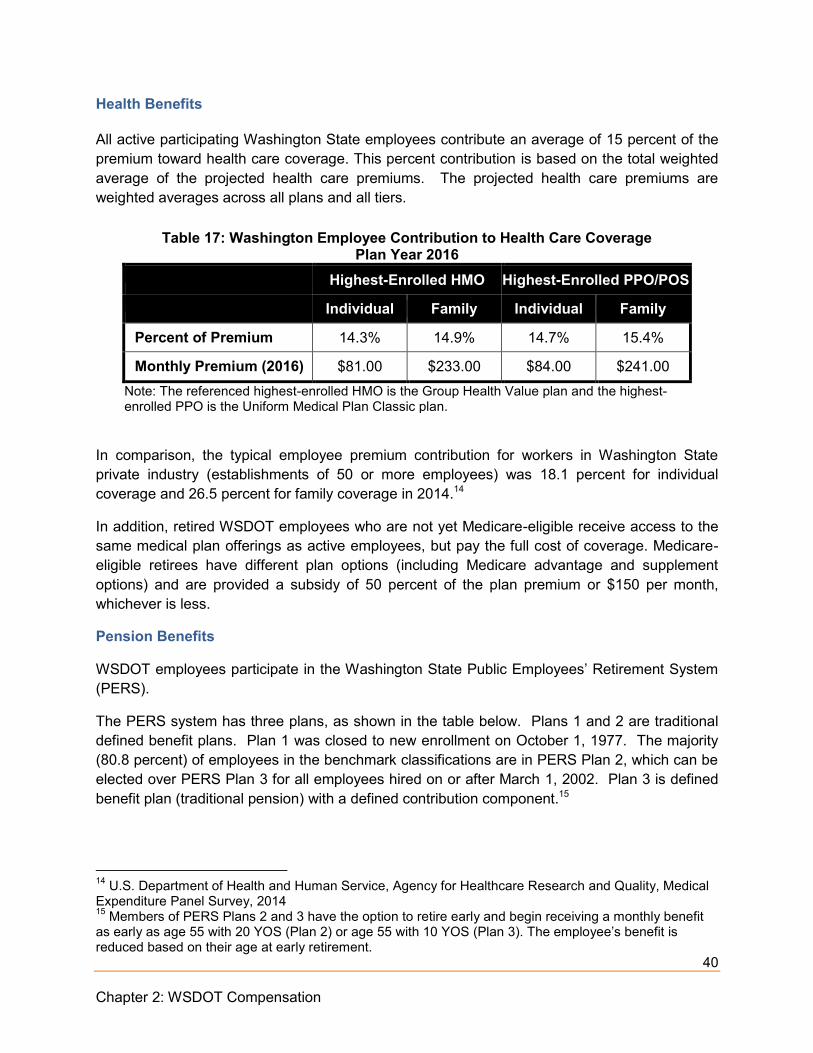
40 Chapter 2: WSDOT Compensation
Health Benefits
All active participating Washington State employees contribute an average of 15 percent of the premium toward health care coverage. This percent contribution is based on the total weighted average of the projected health care premiums. The projected health care premiums are weighted averages across all plans and all tiers.
In comparison, the typical employee premium contribution for workers in Washington State private industry (establishments of 50 or more employees) was 18.1 percent for individual coverage and 26.5 percent for family coverage in 2014.14
In addition, retired WSDOT employees who are not yet Medicare-eligible receive access to the same medical plan offerings as active employees, but pay the full cost of coverage. Medicare-eligible retirees have different plan options (including Medicare advantage and supplement options) and are provided a subsidy of 50 percent of the plan premium or $150 per month, whichever is less.
Pension Benefits
WSDOT employees participate in the Washington State Public Employees’ Retirement System (PERS).
The PERS system has three plans, as shown in the table below. Plans 1 and 2 are traditional defined benefit plans. Plan 1 was closed to new enrollment on October 1, 1977. The majority (80.8 percent) of employees in the benchmark classifications are in PERS Plan 2, which can be elected over PERS Plan 3 for all employees hired on or after March 1, 2002. Plan 3 is defined benefit plan (traditional pension) with a defined contribution component.15
14 U.S. Department of Health and Human Service, Agency for Healthcare Research and Quality, Medical Expenditure Panel Survey, 2014 15 Members of PERS Plans 2 and 3 have the option to retire early and begin receiving a monthly benefit as early as age 55 with 20 YOS (Plan 2) or age 55 with 10 YOS (Plan 3). The employee’s benefit is reduced based on their age at early retirement.
Table 17: Washington Employee Contribution to Health Care Coverage Plan Year 2016
Highest-Enrolled HMO Highest-Enrolled PPO/POS Individual Family Individual Family
Percent of Premium 14.3% 14.9% 14.7% 15.4%
Monthly Premium (2016) $81.00 $233.00 $84.00 $241.00 Note: The referenced highest-enrolled HMO is the Group Health Value plan and the highest-enrolled PPO is the Uniform Medical Plan Classic plan.

41 Chapter 2: WSDOT Compensation
Table 18: Washington State DOT Retirement Benefits
Membership Normal
Retirement Eligibility
Employee Contribution Benefits Formula FAS Period
% of Benchmark Employees in
Tier (as of 12/31/2015)
Public Employees’ Retirement System Plan 1
Hired before October 1, 1977
Age 55 with 25 YOS, Age 60 with
5 YOS, or Any Age with 30 YOS
6.00% 2.0% x AFC x
YOS (capped at 30 YOS)
24 months 1.1%
Public Employees’ Retirement System Plan 2
Hired on or after October 1, 1977
and selected Plan 2
Age 65 with 5 YOS 6.12% 2.0% x AFC x
YOS 60 months 80.8%
Public Employees’ Retirement System Plan 3 Defined Benefit Plan with Defined Contribution component
Hired on or after March 1, 2002 and
selected Plan 3
Age 65 and 10 YOS
DB: 0% DC: Six rate
options ranging from 5% to 15%
DB: 1.0% x AFC x YOS
DC: based on market returns
60 months 18.1%
YOS = Years of Service
FAS = Final Average Salary
Total Cost to Employer
The major costs to WSDOT for an employee in one of the four most populous classifications – Transportation Engineer 2, Transportation Technical Engineer, Transportation Technician 3, and Property & Acquisition Specialist 5 – including all cash earnings and the largest benefit categories, are shown in Table 19 below.
Table 19: Total Employer Cost
Total Cash Compensation
Pension Contribution
(11.18%)
Insurance Benefits
Cost Social
Security Medicare Total
Employer Cost
Property & Acquisition Specialist 5 $83,915 $8,978 $15,984 $5,203 $1,217 $115,297 Transportation Engineer 2 $85,020 $9,174 $15,984 $5,271 $1,233 $116,682 Transportation Technical Engineer $98,100 $10,624 $15,984 $6,082 $1,422 $132,213
Transportation Technician 3 $72,300 $7,768 $15,984 $4,483 $1,048 $101,583
Total cash compensation is derived from actual Calendar Year 2015 payroll data and is the average of annual salary, overtime, shift differential, assignment pay, and other stipends and allowances paid to engineering and technical employees in that fiscal year.

42 Chapter 2: WSDOT Compensation
Benefits in the above table include the employer contribution to PERS Plan 2 and 3 (11.18 percent as of 7/1/2015). The table also includes the employer portion of the health insurance premium for family coverage regardless of plan selection and payroll taxes (Medicare and Social Security).
Compression/Inversion
Office of Financial Management State Human Resources seeks to maintain a reasonable differential between the highest subordinate and the supervisor level in each classification. The amount of differential may vary depending on the difference in the level of responsibility, skill level or qualifications such as between a lead worker and the supervisor or if the subordinate is required to have a license and/or use higher level technical skills.
As shown in the analysis below, WSDOT currently maintains above a 10 percent differential for supervisory positions in all but one classification group, the Property & Acquisition Specialists.
Transportation Engineers and Transportation Technical Engineers
The highest subordinate classification in the Transportation Engineer series is the Transportation Engineer 2. Transportation Engineer 3s, 4s, and 5s and Transportation Technical Engineers supervise lower Transportation Engineers. As shown in Table 20, current compensation for these classifications maintains over a 10 percent differential between subordinate and supervisor.
Table 20: Transportation Engineer and Transportation Technical Engineer Compression/Inversion Analysis
Minimum Midpoint Maximum Maximum + Longevity
Percent Difference in Base Pay Over Preceding Classification
Transportation Engineer 3 10.4% 10.3% 10.4% 10.4%
Transportation Engineer 4 10.4% 10.4% 10.4% 10.3%
Transportation Engineer 5/ Transportation Technical Engineer 10.4% 10.3% 10.0% 10.4%
Transportation Technicians
The Transportation Technician series leadership responsibility is normally limited to on-the-job training of other staff or crew lead. Transportation Technicians are typically supervised by Transportation Engineer 3s. As shown in Table 21, The differential between the Transportation Technician 3 and the Transportation Engineer 3 is just under 22 percent at maximum base + longevity.
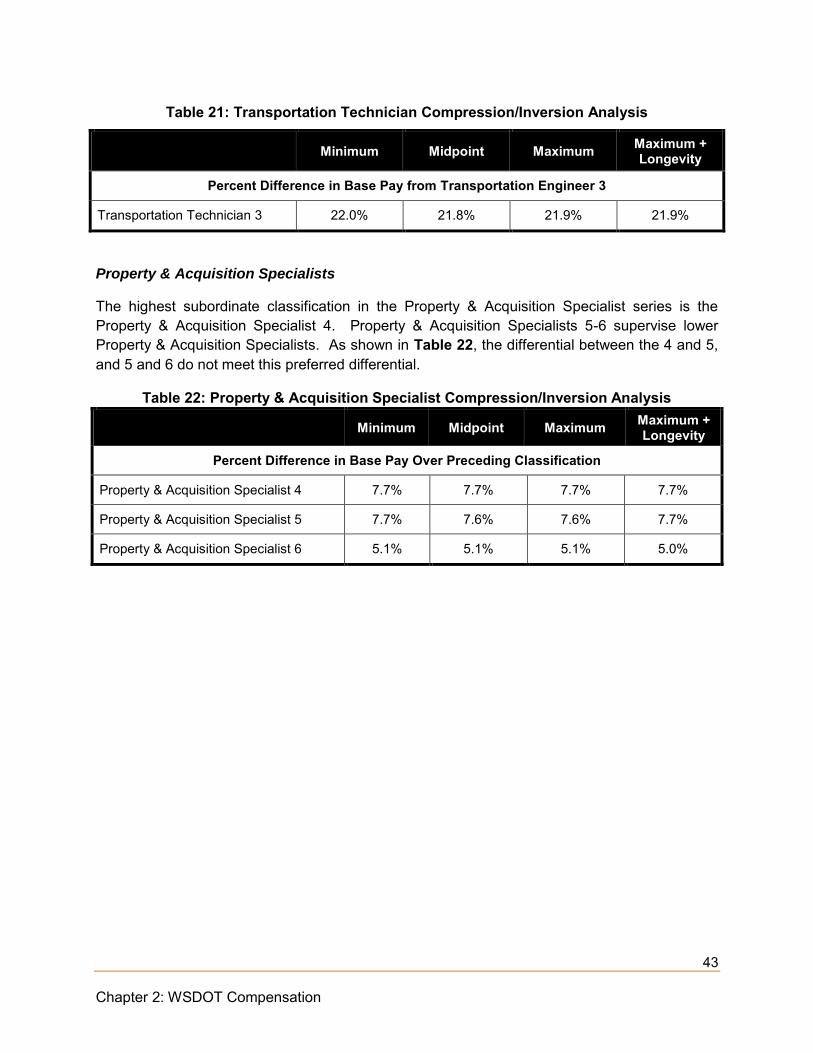
43 Chapter 2: WSDOT Compensation
Table 21: Transportation Technician Compression/Inversion Analysis
Minimum Midpoint Maximum Maximum + Longevity
Percent Difference in Base Pay from Transportation Engineer 3
Transportation Technician 3 22.0% 21.8% 21.9% 21.9%
Property & Acquisition Specialists
The highest subordinate classification in the Property & Acquisition Specialist series is the Property & Acquisition Specialist 4. Property & Acquisition Specialists 5-6 supervise lower Property & Acquisition Specialists. As shown in Table 22, the differential between the 4 and 5, and 5 and 6 do not meet this preferred differential.
Table 22: Property & Acquisition Specialist Compression/Inversion Analysis
Minimum Midpoint Maximum Maximum + Longevity
Percent Difference in Base Pay Over Preceding Classification
Property & Acquisition Specialist 4 7.7% 7.7% 7.7% 7.7%
Property & Acquisition Specialist 5 7.7% 7.6% 7.6% 7.7%
Property & Acquisition Specialist 6 5.1% 5.1% 5.1% 5.0%

44 Chapter 2: WSDOT Compensation
COMPARISON TO LOCAL GOVERNMENT EMPLOYERS
To benchmark compensation, the project team chose a variety of local public employers based on size, location, and number of WSDOT employees who have left for a given agency in 2013 through 2015. Benchmarked employers are shown in Table 23.
Table 23: Comparable Jurisdictions
Population Served Full-Time Equivalents
WSDOT 7,061,530 6,894
Clark County 451,008 1,600
King County 2,079,967 12,997
Pierce County 831,928 3,001
Seattle 668,337 12,068
Sound Transit [1] 3,671,478 748
Spokane County 484,318 2,016
Spokane 212,067 2,086
Vancouver 169,303 976 [1] Sound Transit: Population figure reflects total population of area serviced (King, Pierce, and Snohomish Counties)
To evaluate relative compensation, the project team developed and circulated a detailed survey instrument (see Appendix A), and collected and reviewed key documents (e.g., pay plans and collective bargaining agreements and job descriptions) covering the benchmark classifications listed above. Unless otherwise noted, all analysis was conducted to compare compensation and benefits as of June 30, 2016.
Comparisons across employers are often imprecise due to differences in economic base and ability to pay, organizational structure, working conditions, types of duties assigned, qualification and skill requirements, and other relevant factors that may vary for similar classifications. The best job match across employers is often not a perfect match, and such variations may contribute to some reported differences in relative compensation.
To achieve reasonable and generally useful matches, summaries were prepared from State of Washington classification specifications and incorporated into the questionnaire to assist participants in matching their jobs to the State’s benchmark jobs. In some cases, no match was available. In other cases, again, matches provided were for similar but not identical jobs
The project team followed up with phone calls and emails to clarify many written survey responses, and conducted independent analysis of job descriptions towards identifying the most

45 Chapter 2: WSDOT Compensation
relevant job matches. In general, however, our findings rely on the matches provided by the survey participants. Because such matches vary in “closeness of fit” to the State’s job classifications, it is likely that some outlier pay rates reported may result from relatively weak matches. Greater weight should generally be given to survey medians and modes, and minor variances (approximately 5% or less) may not be significant.
It is important to note that wage comparison tables below and in the appendix only include wage levels for comparable jurisdictions that reported a job match. Base Pay
The elements of compensation used for benchmarking the WSDOT and comparative agencies include base pay and longevity (at applicable junctures). Additional cash compensation, which may not be received by all classifications in all jurisdictions, is detailed later in this section, but not included in compensation comparisons with other jurisdictions. Highly variable forms of cash compensation (e.g., overtime) and premiums that may not be received by a typical employee are not included in the benchmarking that follows due to the difficulty of presenting such pays on an apples-to-apples basis.
Again, it is important to note comparisons across employers are often imprecise due to differences in economic base and ability to pay, organizational structure, working conditions, types of duties assigned, qualification and skill requirements, and other relevant factors that may vary for similar jobs. The best job match across employers is often not a perfect match, and such variations may contribute to some reported differences in relative compensation.
Shown below are summary tables detailing the median compensation, WSDOT’s variance from that median, and WSDOT’s rank for each classification at maximum base plus longevity.16 More detailed tables that include the actual compensation levels for each jurisdiction at all pay junctures (minimum, midpoint, maximum, maximum base plus longevity) are shown in Appendix D.
16 This pay juncture was chosen based on the fact that most WSDOT employees are at maximum base plus longevity as of 12/31/2015.

46 Chapter 2: WSDOT Compensation
Transportation Engineers and Transportation Technical Engineers
Most comparable jurisdictions surveyed provided classification matches for each of the Transportation Engineer and Transportation Technical Engineer classifications. The comparison of base compensation between the WSDOT and these jurisdictions shows that the agency lags the multi-jurisdictional median at maximum base plus longevity by anywhere from 13.5 to 29 percent.
Table 24: Transportation Engineer Wage Comparisons
WSDOT
Maximum Base +
Longevity
Median at Maximum
Base + Longevity
WSDOT Variance from
Median Rank
Transportation Engineer 1 $60,420 $69,823 -13.5% 6 of 6
Transportation Engineer 2 $66,684 $87,996 -24.2% 6 of 6
Transportation Engineer 3 $73,644 $93,903 -21.6% 7 of 7
Transportation Engineer 4 $81,264 $113,464 -28.4% 8 of 8
Transportation Engineer 5 $89,712 $126,403 -29.0% 7 of 7 Transportation Technical Engineer $89,712 $89,958 -0.3% 3 of 3
Only two jurisdictions – Sound Transit and Spokane County – reported a job match for the classification of Transportation Technical Engineer. Because of the small number of matches, comparisons shown in the table below must be taken with caution.
WSDOT’s compensation is, again, at or near the bottom of this comparison group, however the agency’s variance from the median is smaller – only 0.3 percent at maximum base plus longevity.

47 Chapter 2: WSDOT Compensation
Transportation Technicians
WSDOT compensation for the Transportation Technician classifications is at or near the bottom at all pay junctures (see Appendix D for full tables). The comparison of base compensation between the WSDOT and these jurisdictions shows that the agency lags the median at maximum base plus longevity by anywhere from 16.2 to 25.5 percent.
Table 25: Transportation Technician Wage Comparisons
WSDOT
Maximum Base +
Longevity
Median at Maximum
Base + Longevity
WSDOT Variance from
Median Rank
Transportation Technician 1 $46,056 $54,954 -16.2% 6 of 6
Transportation Technician 2 $53,424 $65,291 -18.2% 7 of 7
Transportation Technician 3 $60,420 $81,140 -25.5% 6 of 6
Property & Acquisition Specialists
WSDOT compensation for the Property & Acquisition Specialist classifications is at or near the bottom at all pay junctures (see Appendix D for full tables). The comparison of base compensation between the WSDOT and these jurisdictions shows that the agency lags the median at maximum base plus longevity by anywhere from 13.9 to almost 34 percent.
Table 26: Property & Acquisition Specialist Wage Comparisons
WSDOT
Maximum Base +
Longevity
Median at Maximum
Base + Longevity
WSDOT Variance
from Median Rank
Property & Acquisition Specialist 1 $46,056 $67,748 -32.0% 4 of 5
Property & Acquisition Specialist 2 $54,744 $82,813 -33.9% 5 of 6
Property & Acquisition Specialist 3 $61,920 $91,009 -32.0% 6 of 7
Property & Acquisition Specialist 4 $66,684 $94,271 -29.3% 5 of 5
Property & Acquisition Specialist 5 $71,844 $91,426 -21.4% 7 of 7
Property & Acquisition Specialist 6 $74,456 $87,673 -13.9% 3 of 3
Geographic Assignment Pay. Property & Acquisition Specialists and Transportation Engineering 3s working as Cadastral Surveyors are among the only classifications eligible for geographic assignment pay. Table 27 shows maximum base pay plus longevity with and

48 Chapter 2: WSDOT Compensation
without applicable geographic assignment pay for each classification in the series. This amount is then compared to the median maximum base plus longevity for the group of comparison jurisdictions that falls in the WSDOT regions for which assignment pay is granted. For example, only Property & Acquisition Specialist 1s in the northwest region receive 2.5% geographic assignment pay, therefore only King County, Seattle, and Sound Transit were included in that median calculation even though other jurisdictions outside of the Northwest region provided job matches. Because there are only two matches for the Property & Acquisition Specialist 6, no comparison was made for this classification.
Table 27: Property & Acquisition Specialist Pay with Assignment Pay
Maximum Base +
Longevity Median Variance from Median
Property & Acquisition Specialist 1 $45,056 $67,748 -33.5%
w/ 2.5% assignment pay $46,182 $75,176 -38.6%
Property & Acquisition Specialist 2 $54,744 $82,813 -33.9%
w/ 5.0% assignment pay $57,481 $83,506 -31.2%
Property & Acquisition Specialist 3 $61,920 $91,009 -32.0%
w/ 10.0% assignment pay $68,112 $92,390 -26.3%
Property & Acquisition Specialist 4 $66,684 $94,271 -29.3%
w/ 7.5% assignment pay $71,685 $94,271 -24.0%
Property & Acquisition Specialist 5 $71,844 $91,426 -21.4%
w/ 7.5% assignment pay $77,232 $91,427 -15.5%
As Table 27 shows, inclusion of assignment pay improves WSDOT’s variance from the multi-jurisdictional median for the Property & Acquisition Specialist 3 and 5, but the variance from the median worsens for the 1, 2, and 4, in some cases by a substantial amount. This indicates that, even with this assignment pay – which was instituted to improve recruitment and retention – wages are lagging that of the labor markets in which they are applicable.
Additional Compensation
Like WSDOT, many of the comparable employers surveyed offer additional opportunities for compensation. These additional pays are outlined below. The project team did not collect information regarding how many employees in the benchmark classifications receive these pays and in what amounts.

49 Chapter 2: WSDOT Compensation
Shift Differential
All but three comparable jurisdictions offer shift differential pay to all or some of their engineering and technical titles.
Table 28: Shift Differential at Local Washington Employers
Shift Differential
WSDOT [1] $0.65 per hour when an employee if scheduled to work a shift in which the majority of hours worked daily or weekly are between 6:00pm and 6:00am
Clark County [2] Regular shift begins after 2:00pm: $1.25/hour
King County $1.00/hour
Pierce County -
Seattle $0.70/hour and $1.10/hour for shifts/hours determined by individual office policy
Sound Transit -
Spokane Engineering Technicians
4:00pm - 12:00am: $0.35/hour 12:00am - 8:00am: $0.70/hour
Spokane County -
Vancouver 3:00pm - 12:00am: $1.50/hour 10:00pm - 6:00am: $1.75/hour
[1] WSDOT: All benchmark classes are eligible for shift differential [2] Clark County: Employees regularly scheduled to work Saturdays will also receive an additional $1.25 per hour for all hours worked between midnight Friday and midnight Saturday

50 Chapter 2: WSDOT Compensation
Overtime
Most comparable employers offer overtime pay at 1.5 times the employee’s regular hourly rate. This time can be taken as either pay or leave.
Table 29: Overtime at Local Washington Employers Overtime Rate of Pay Pay/Leave
WSDOT 1.5x Pay or Leave
Clark County [1] 1.5x Pay or Leave
King County 1.5x Pay or Leave
Pierce County [2] 1.5x Pay or Leave
Seattle 1.5x Pay
Sound Transit 1.5x Pay
Spokane 1.5x Pay or Leave
Spokane County 1.5x Pay
Vancouver 1.5x Pay
[1] Clark County: Employees may choose to be compensated with compensatory time off up to a maximum of 80 hours [2] Pierce County: Overtime details applicable to engineering titles only
Specialty and Assignment Pays
None of the benchmarked jurisdictions provided any type of specialty or assignment pay for specific types of work or work assignments. Additionally, none of the local governments provided any type of geographic assignment pay.
Pension Benefits
As previously discussed, WSDOT employees participate in the Washington State Public Employees’ Retirement System (PERS). New hires are offered the option of enrolling in PERS Plan 2 or 3.
Five comparable jurisdictions participate in PERS, while Seattle, Sound Transit, and Spokane provide their own retirement plans. Sound Transit’s plan is a 401(a) defined contribution plan, not a traditional defined benefit pension.
As shown in Table 30, WSDOT employees are provided better retirement benefits than those local government employees who are not enrolled in PERS. WSDOT employees contribute the

51 Chapter 2: WSDOT Compensation
lowest percentage of pay to their defined benefit plans and their contributions to the defined contribution portion of the PERS 3 Plan are set by the employee, compared to Sound Transit, where employees are required to contribute 10 percent.
Table 30: WSDOT and Local Washington Employer Pension Benefits
Plan Name Employee Contribution
Normal Retirement Eligibility Benefit Formula
WSDOT Clark County, King County, Pierce County, Spokane County, Vancouver
PERS Plan 1 (Hired before October 1,
1977) 6.00%
Age 55 with 25 YOS, Age 60 with 5 YOS,
or Any Age with 30
YOS
2.0% x AFC x YOS
WSDOT Clark County, King County, Pierce County, Spokane County, Vancouver
PERS Plan 2 (Hired on or after October 1, 1977 and selected Plan 2)
6.12% Age 65 with 5 YOS 2.0% x AFC x YOS
WSDOT Clark County, King County, Pierce County, Spokane County, Vancouver
PERS Plan 3 (State gov't: Hired on or
after March 1, 2002, Local gov't: Hired on or after
September 1, 2002 and selected Plan 3)
DB: 0% DC: Six rate
options ranging from 5% to 15%
Age 65 with 10 YOS Defined Benefit: 1.0% x AFC
x YOS + Defined Contributions and
Investment Returns
Seattle Seattle City Employees' Retirement System 10.03%
Age 62 with 5 YOS, Age 57 with 10 YOS, Age 52 with 20 YOS,
or Any Age with 30 YOS
Greater of 1) percent of AFC based on age and YOS at
retirement ranging from 9.10 to 60% or 2) two times the
employee contribution with interest
Sound Transit Sound Transit 401a (Defined Contribution)
10% (12% employer
match) Age 55 with 4 YOS
Employee and Employer Contributions + Investment
Returns
Spokane Spokane Employees' Retirement System 7.75%
Normal Retirement Age: 65
Age + YOS must equal 80
2.0% x AFC x YOS (maximum 35 YOS)
YOS = Years of Service AFC = Average Final Compensation

52 Chapter 2: WSDOT Compensation
Health Benefits
The table below provides a summary of the percent of premium contributed by local engineering and technical employees in Washington. Based on this comparison, WSDOT employees contribute among the highest percentages of premium toward health care coverage under both the highest-enrolled HMO plan and PPO/POS plan offered to employees at each agency.
Table 31: Local Washington Employers Employee Percent of Premium for Health Insurance (New Hires)
Effective 6/30/2016
Highest-Enrolled HMO Highest-Enrolled PPO Individual Family Individual Family
WSDOT [1] 14.3% 14.9% 14.7% 15.4%
Clark County 7.0% 7.0% 7.0% 7.0%
Pierce County 5.9% 5.9% 5.9% 5.9%
King County 0.0% 0.0% 0.0% 0.0%
Seattle 4.2% 8.5% 4.7% 9.7%
Sound Transit 0.0% 10.9% 0.0% 10.0%
Spokane 0.0% 18.0% 0.0% 15.3%
Spokane County 5.0% 10.0% 5.0% 10.0%
Vancouver 5.3% 14.3% 4.7% 14.2%
Median (excluding WSDOT) 4.6% 9.3% 4.7% 9.8%
WSDOT Variance from Median 212.2% 66.3% 212.1% 56.6%
Rank 9 of 9 8 of 9 9 of 9 8 of 9
[1] WSDOT: Enrollments do not measure plan comparability in terms of actuarial value or metal tier as defined by the Affordable Care Act.
While the WSDOT percent of premium is at or near the top of the comparison group, it is important to keep in mind that it is below statewide private sector norms. Typical employee premium contribution for workers in Washington State private industry (establishments of 50 or more employees) was 18.1 percent for individual coverage and 26.5 percent for family coverage in 2014.17
17 U.S. Department of Health and Human Service, Agency for Healthcare Research and Quality, Medical Expenditure Panel Survey, 2014

53 Chapter 2: WSDOT Compensation
Leave
A significant non-cash benefit provided by public sector employers is leave time. Typically, agencies have a combination of vacation time and personal leave or floating holidays. Table 32 details the various forms of leave and amounts provided to WSDOT and benchmarked local employers.
Table 32: Local Washington Employers Leave Accrual (Per Year)
Annual Leave Personal Leave Sick Leave Paid Holidays
WSDOT
0-1 YOS: 12 days 2 YOS: 13 days
3-4 YOS: 14 days 5-7 YOS: 15 days
8-10 YOS: 16 days 1 additional day of leave
per YOS to a maximum of 22 days
1/fiscal year 12/year 11/year
Clark County
0-1 YOS: 17 days 2-4 YOS: 20 days 5-9 YOS: 23 days
10-14 YOS: 26 days 15-19 YOS: 29 days 20-24 YOS: 32 days 25+ YOS: 35 days
- - 10/year
King County
0-5 YOS: 12 days 6-8 YOS: 15 days 9-10 YOS: 16 days
11-16 YOS: 20 days 1 additional day of leave per YOS, to a maximum of 30
days
2/year 12/year 10/year
Pierce County
1-3 YOS: 12 days 4-7 YOS: 16 days 8-13 YOS: 20 days
14-18 YOS: 23 days 1 additional day of leave per YOS, to a maximum of 30
days
2/year 12/year 10/year
Seattle
1-4 YOS: 12 days 5-9 YOS: 15 days
10-14 YOS: 16 days 15-19 YOS: 23 days 20-24 YOS: 25 days 25+ YOS: 30 days
2 (4 after 9 YOS) 12/year 10/year
Sound Transit 15 days - 12/year 10/year
Spokane
0-4 YOS: 12 days 5-10 YOS: 17 days 11 YOS: 18 days 12 YOS: 19 days 13 YOS: 20 days 14 YOS: 21 days 15 YOS: 22 days 20 YOS: 27 days 25 YOS: 29 days 30 YOS: 31 days
4/year 12/year 7/year
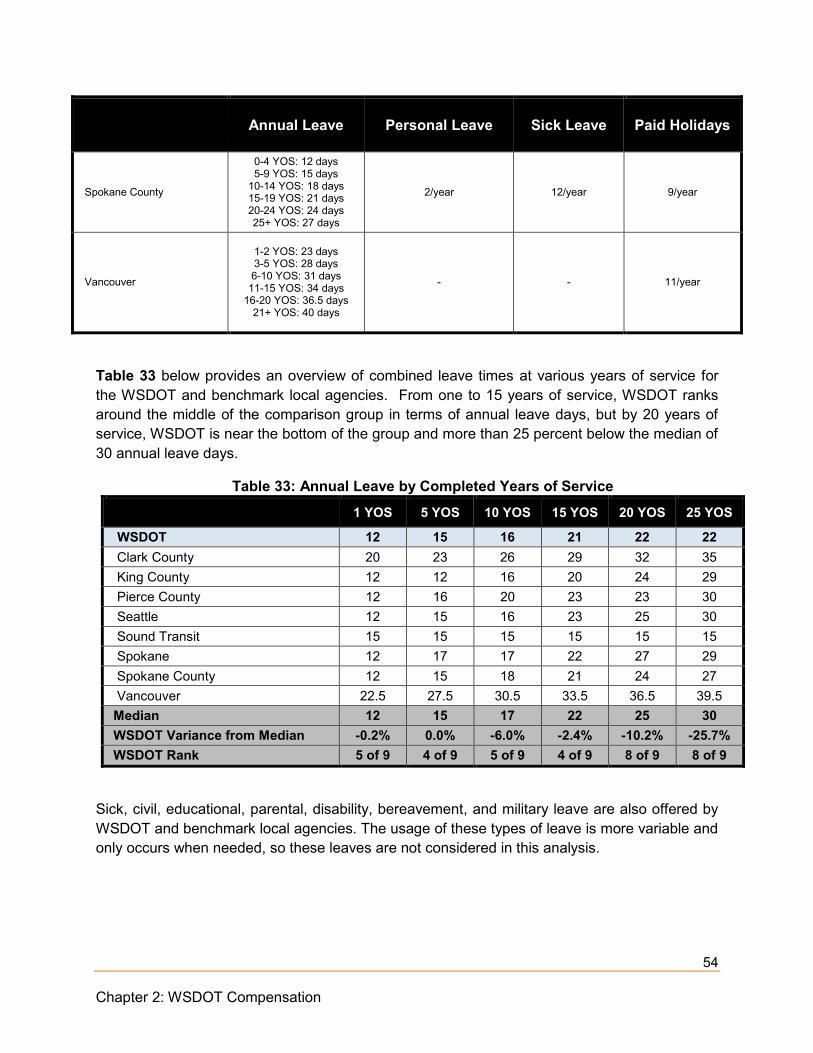
54 Chapter 2: WSDOT Compensation
Annual Leave Personal Leave Sick Leave Paid Holidays
Spokane County
0-4 YOS: 12 days 5-9 YOS: 15 days
10-14 YOS: 18 days 15-19 YOS: 21 days 20-24 YOS: 24 days 25+ YOS: 27 days
2/year 12/year 9/year
Vancouver
1-2 YOS: 23 days 3-5 YOS: 28 days 6-10 YOS: 31 days
11-15 YOS: 34 days 16-20 YOS: 36.5 days
21+ YOS: 40 days
- - 11/year
Table 33 below provides an overview of combined leave times at various years of service for the WSDOT and benchmark local agencies. From one to 15 years of service, WSDOT ranks around the middle of the comparison group in terms of annual leave days, but by 20 years of service, WSDOT is near the bottom of the group and more than 25 percent below the median of 30 annual leave days.
Table 33: Annual Leave by Completed Years of Service
1 YOS 5 YOS 10 YOS 15 YOS 20 YOS 25 YOS
WSDOT 12 15 16 21 22 22 Clark County 20 23 26 29 32 35 King County 12 12 16 20 24 29 Pierce County 12 16 20 23 23 30 Seattle 12 15 16 23 25 30 Sound Transit 15 15 15 15 15 15 Spokane 12 17 17 22 27 29 Spokane County 12 15 18 21 24 27 Vancouver 22.5 27.5 30.5 33.5 36.5 39.5 Median 12 15 17 22 25 30 WSDOT Variance from Median -0.2% 0.0% -6.0% -2.4% -10.2% -25.7% WSDOT Rank 5 of 9 4 of 9 5 of 9 4 of 9 8 of 9 8 of 9
Sick, civil, educational, parental, disability, bereavement, and military leave are also offered by WSDOT and benchmark local agencies. The usage of these types of leave is more variable and only occurs when needed, so these leaves are not considered in this analysis.

55 Chapter 2: WSDOT Compensation
FINDINGS
Finding #1: WSDOT compensation for each classification ranks at or near the bottom of the comparison group at every pay juncture (minimum, midpoint, maximum, and maximum base plus longevity).
Finding #2: WSDOT provides additional opportunities for compensation that are not offered as readily by other jurisdictions in the comparison group, including various assignment pays and geographic assignment pay for select classifications and regions.
Finding #3: Geographic assignment pay offered to the Property & Acquisition classifications and the Transportation Engineer 3 (Cadastral Surveyors) does not improve WSDOT’s relative position among the comparison group. In fact, when limiting the comparison group to those jurisdictions that fall in the WSDOT regions where geographic assignment pay is offered, the agency’s variance from the group median worsens for three classifications. This indicates that the geographic assignment pay is not having its intended effect of improving recruitment and retention in those classifications.
Finding #4: WSDOT employee contributions to health benefits are among the highest in the comparison group, while employee pension contributions are among the lowest of those jurisdictions that offer a retirement plan other than PERS.

56 Chapter 2: WSDOT Compensation
COMPARISON TO OTHER PUBLIC AND PRIVATE SECTOR EMPLOYERS
To evaluate general labor market compensation, the project team relied primarily on third-party data collected for the 2016 State of Washington Total Compensation Survey and the Economic Research Institute (ERI).
State Salary Survey
State Human Resources is required by law to conduct a salary survey to determine the prevailing pay rates for jobs that are comparable to state jobs in the State’s public and private sector markets. The recent report was prepared by Segal Consulting.
The 2016 report includes results from 62 organizations, including 23 private sector employers, 26 public sector employers, and 13 state governments. The report contains information on 183 benchmark titles in 15 job families. Classifications within the scope of this report, and included in this survey data, are shown below.
WSDOT Benchmark Classifications State Salary Survey Matching Classifications
Transportation Engineer 1-5 Civil Engineer 3
Transportation Technician 1-3 Engineering Technician 2
Property & Acquisition Specialist 1-6 Property & Acquisition Specialist 3
Compensation information for the classifications above was collected for in-state public sector respondents and a handful of private sector employers. The tables below show the average minimum, midpoint, and maximum for public sector employers and for all respondents. Private sector employer responses are included in the “All Respondents” line of each table. Only base compensation is reflected and is effective as of July 2015.
Transportation Engineer 3
In comparison to 14 in-state public sector employers and four private sector employers, base compensation for the Transportation Engineer 3 classification lags the market by over nearly 39 percent.
Table 34: Transportation Engineer 3 State Salary Survey Comparison
Percentage to reach Market (From State
Midpoint Range)
Percent to Reach Market (2.5%)
Transportation Engineer 3 38.5% 37.5%

57 Chapter 2: WSDOT Compensation
Transportation Technician 2
In comparison to 14 in-state public sector employers and four private sector employers, base compensation for the Transportation Technician 2 classification lags the market by nearly 30 percent.
Table 35: Transportation Technician 2 State Salary Survey Comparison
Percentage to reach Market (From State
Midpoint Range)
Percent to Reach Market (2.5%)
Transportation Technician 2 29.6% 30.0%
Property & Acquisition Specialist 3
In comparison to 14 in-state public sector employers and four private sector employers, base compensation for for the Property & Acquisition Specialist 3 classification lags the market by nearly 49 percent.
Table 36: Property & Acquisition Specialist 3 State Salary Survey Comparison
Percentage to reach Market (From State
Midpoint Range)
Percent to Reach Market (2.5%)
Property & Acquisition Specialist 3 48.8% 50.0%
Economic Research Institute (ERI)
The ERI Salary Assessor is a compensation database with information from public, private, and nonprofit employers. Compensation information within the database is provided based on years of experience as well as level of responsibility. Comparisons below were developed with input from State Human Resources and take into account the agency’s typical methodology for using this data. The level of responsibility (see Appendix E for level definitions) used for each classification was determined based on job specifications and input from State Human Resources personnel.
WSDOT Benchmark Classification ERI Matching Title and Level Transportation Engineer 2 Engineer Civil, Level 2
Transportation Technician 3 Engineering Technician Civil, Level 3
Property & Acquisition Specialist 3 Agent Right-of-Way, Level 2

58 Chapter 2: WSDOT Compensation
Compensation comparisons are shown both statewide and for five other locations within the State – Seattle, Spokane, Vancouver, Mount Vernon, and Yakima. These locations were chosen to provide comparisons in differing labor markets throughout the State. Comparisons are made at the 25th percentile and the mean. To align with State HR policy for comparison of this data, the 25th percentile is aligned with the General Service Scale Step A and the mean is aligned with Step L.
The State compares the top step of the salary range, excluding the longevity increase, to the private sector market mean. Step L is the top step for standard progression salary schedules. The market mean reflects the salary needed to align with the average/relative middle of the market. State leaders use tools such as salary surveys to help find the appropriate balance between containing the cost of government operations, compensating state employees fairly, and competing in the job market for employees with the specialized skills and knowledge required to perform the work of state government. A salary survey is one source of data and should be used in conjunction with other workforce factors when informing potential changes to employee pay, benefits or working conditions.
Transportation Engineer 2
The largest discrepancies with the ERI data are seen in the comparison with WSDOT wages for Transportation Engineer 2. WSDOT compensation lags the mean across all geographic areas, with this lag ranging from 16 percent in WSDOT’s South Central region (Yakima) to 26.3 percent in the Northwest region (Seattle), where the cost of living is higher.
Table 37: Transportation Engineer 2 ERI Comparison
25th Percentile Mean WSDOT Variance
from ERI Mean
WSDOT Transportation Engineer 2 $49,608 $65,088 -
Seattle $79,836 $88,320 -26.3%
Statewide $76,524 $84,624 -23.1%
Vancouver $75,828 $84,000 -22.5%
Mount Vernon $75,024 $83,052 -21.6%
Spokane $70,032 $77,712 -16.2%
Yakima $69,852 $77,568 -16.1%
Transportation Technician 3
Pay discrepancies with the ERI data are more modest for the Transportation Technician 3. Again, WSDOT compensation lags the mean across all geographic areas, with this lag ranging from just 1.0 percent in WSDOT’s South Central region (Yakima) to 14.8 percent in the Northwest region (Seattle).

59 Chapter 2: WSDOT Compensation
Table 38: Transportation Technician 3 ERI Comparison
25th Percentile Mean WSDOT Variance
from ERI Mean
WSDOT Transportation Technician 3 $44,880 $58,956 -
Seattle $63,084 $69,204 -14.8%
Statewide $60,036 $65,940 -10.6%
Mount Vernon $59,028 $64,980 -9.3%
Vancouver $58,212 $64,044 -7.9%
Spokane $54,348 $59,784 -1.4%
Yakima $54,024 $59,532 -1.0%
Property & Acquisition Specialist 3
For the Property & Acquisition Specialist 3 classification, WSDOT again lags the mean across all geographic areas. The lag ranges from 4.0 percent in WSDOT’s Eastern region (Spokane) to 15.6 percent in the Northwest region (Seattle).
Table 39: Property & Acquisition Specialist 3 ERI Comparison
25th Percentile Mean
WSDOT Variance from
ERI Mean
WSDOT Property & Acquisition Specialist 3 $46,056 $60,420 -
Seattle $65,568 $71,580 -15.6%
Mount Vernon $62,460 $68,352 -11.6%
Vancouver $61,620 $67,404 -10.4%
Statewide $61,128 $66,732 -9.5%
Yakima $58,008 $63,564 -4.9%
Spokane $57,516 $62,916 -4.0%
60 Chapter 2: WSDOT Compensation
FINDINGS
Finding #5: WSDOT pay lags other public sector and private sector employers by significant margins, as shown in comparisons with data provided in the 2016 State Salary Survey and Economic Research Institute (ERI) data.
Finding #6: The WSDOT classifications are very broad and individuals within each class may experience different competitive opportunities with both governmental and private jobs. Typically, work requiring higher skill levels and employees with Professional Engineer licenses will have more ability to leave the agency for higher-paying jobs.
Recommendations regarding compensation will be addressed in the following chapter.
CONCLUSION
Less competitive wages put the WSDOT in a difficult position from a recruitment and retention perspective, and place a much greater emphasis on the WSDOT’s attractiveness as an employer of choice when it comes to non-compensation aspects of the job. Wages are a critical factor in attracting and retaining qualified employees, and the WSDOT needs to address the significant pay differentials to competitive agencies. At the same time, the WSDOT classifications are broad, and it may be more effective to target compensation differences for employees that have the most sought-after skill levels. These issues will be addressed more thoroughly in Chapters 3 and 4.
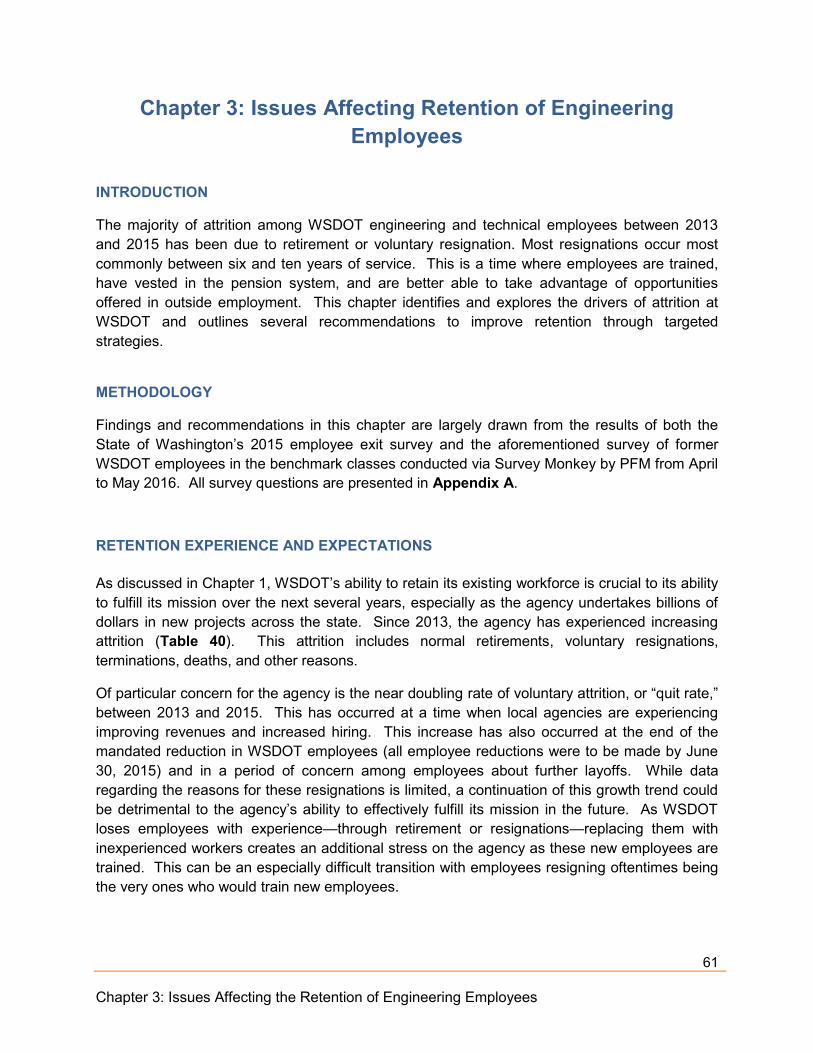
61 Chapter 3: Issues Affecting the Retention of Engineering Employees
Chapter 3: Issues Affecting Retention of Engineering Employees
INTRODUCTION
The majority of attrition among WSDOT engineering and technical employees between 2013 and 2015 has been due to retirement or voluntary resignation. Most resignations occur most commonly between six and ten years of service. This is a time where employees are trained, have vested in the pension system, and are better able to take advantage of opportunities offered in outside employment. This chapter identifies and explores the drivers of attrition at WSDOT and outlines several recommendations to improve retention through targeted strategies.
METHODOLOGY
Findings and recommendations in this chapter are largely drawn from the results of both the State of Washington’s 2015 employee exit survey and the aforementioned survey of former WSDOT employees in the benchmark classes conducted via Survey Monkey by PFM from April to May 2016. All survey questions are presented in Appendix A.
RETENTION EXPERIENCE AND EXPECTATIONS
As discussed in Chapter 1, WSDOT’s ability to retain its existing workforce is crucial to its ability to fulfill its mission over the next several years, especially as the agency undertakes billions of dollars in new projects across the state. Since 2013, the agency has experienced increasing attrition (Table 40). This attrition includes normal retirements, voluntary resignations, terminations, deaths, and other reasons.
Of particular concern for the agency is the near doubling rate of voluntary attrition, or “quit rate,” between 2013 and 2015. This has occurred at a time when local agencies are experiencing improving revenues and increased hiring. This increase has also occurred at the end of the mandated reduction in WSDOT employees (all employee reductions were to be made by June 30, 2015) and in a period of concern among employees about further layoffs. While data regarding the reasons for these resignations is limited, a continuation of this growth trend could be detrimental to the agency’s ability to effectively fulfill its mission in the future. As WSDOT loses employees with experience—through retirement or resignations—replacing them with inexperienced workers creates an additional stress on the agency as these new employees are trained. This can be an especially difficult transition with employees resigning oftentimes being the very ones who would train new employees.

62 Chapter 3: Issues Affecting the Retention of Engineering Employees
Turnover and Quit Rates
In 2015, WSDOT experienced the greatest attrition among employees in the benchmark classifications – 6.8 percent of these employees left the agency. While retirements drove turnover in 2013, with 62.5 percent of total turnover due to retirements, in 2014 and 2015, voluntary resignations – “quits” – overtook the number of retirements. 18
Table 40: WSDOT Engineering and Technical Employees Attrition, 2013 - 2015
2013 2014 2015 Total Separated Employees 72 89 91
Retirement 45 36 38 Terminated for Cause/Disciplinary 2 2 4 Deceased 1 2 1 Resigned 21 47 45 Other 3 2 3
Turnover Rate 4.6% 6.3% 6.8% Quit Rate 1.3% 3.3% 3.4% JOLTS State and Local Government Turnover Rate 16.1% 16.4% 18.3% JOLTS State and Local Government Quit Rate 7.5% 8.2% 9.0%
Note: “Other” includes separations for reasons of disability; JOLTS data as of February 2016
According to the Bureau of Labor Statistics Job Openings and Labor Turnover Survey (JOLTS), WSDOT’s total turnover and quit rates are well below similar rates for state and local governments nationally.19
Attrition by Tenure
Figure 9 shows the breakdown of reasons for separation by years of service at the time of separation from January 1, 2013 through December 31, 2015. Among employees with 21 or more years of service, retirement is the primary reason for leaving the agency.
Also shown in Figure 9, resignations from the agency occur most commonly among employees with six to ten years of service, with 59.3 percent of total resignations occuring during this tenure bracket. Additionally, 92 percent of all resignations occur before 15 years of service. While this reflects only three years of attrition information, it is clear that the agency is struggling to keep
18
The turnover rate is calculated by dividing the number of separated employees (including those who retired, were terminated for cause, died, or voluntary resigned) by the total number of employees at the beginning of each year The quit rate is calculated by dividing the total number of employees who voluntary resigned (including those who resigned for other state agencies) by the total number of employees at the beginning of the each year. 19 JOLTS data is collected monthly by the BLS from private and public sector establishments across the United States. Data is collected on a voluntary basis, and the state and local data shown is not specific to any particular employee group. In addition, JOLTS data includes temporary and seasonal workers, who tend to experience higher turnover rates.
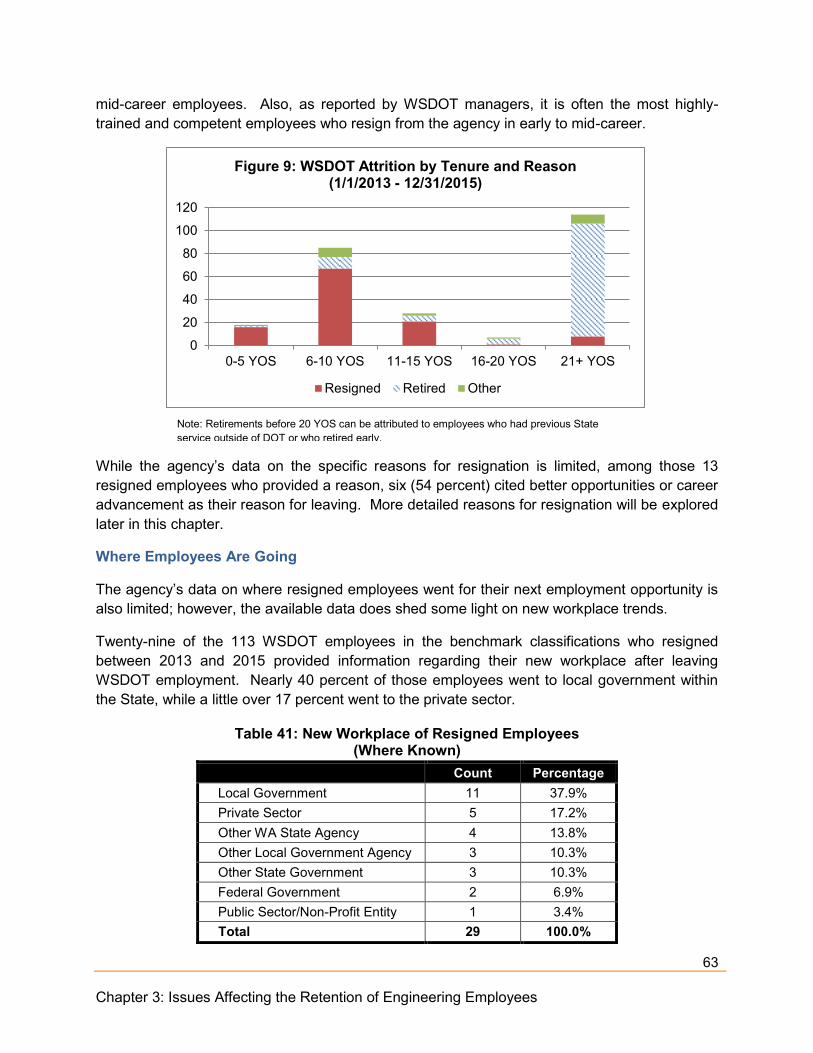
63 Chapter 3: Issues Affecting the Retention of Engineering Employees
mid-career employees. Also, as reported by WSDOT managers, it is often the most highly-trained and competent employees who resign from the agency in early to mid-career.
While the agency’s data on the specific reasons for resignation is limited, among those 13 resigned employees who provided a reason, six (54 percent) cited better opportunities or career advancement as their reason for leaving. More detailed reasons for resignation will be explored later in this chapter.
Where Employees Are Going
The agency’s data on where resigned employees went for their next employment opportunity is also limited; however, the available data does shed some light on new workplace trends.
Twenty-nine of the 113 WSDOT employees in the benchmark classifications who resigned between 2013 and 2015 provided information regarding their new workplace after leaving WSDOT employment. Nearly 40 percent of those employees went to local government within the State, while a little over 17 percent went to the private sector.
Table 41: New Workplace of Resigned Employees (Where Known)
Count Percentage Local Government 11 37.9% Private Sector 5 17.2% Other WA State Agency 4 13.8% Other Local Government Agency 3 10.3% Other State Government 3 10.3% Federal Government 2 6.9% Public Sector/Non-Profit Entity 1 3.4% Total 29 100.0%
0
20
40
60
80
100
120
0-5 YOS 6-10 YOS 11-15 YOS 16-20 YOS 21+ YOS
Figure 9: WSDOT Attrition by Tenure and Reason (1/1/2013 - 12/31/2015)
Resigned Retired Other
Note: Retirements before 20 YOS can be attributed to employees who had previous State service outside of DOT or who retired early.
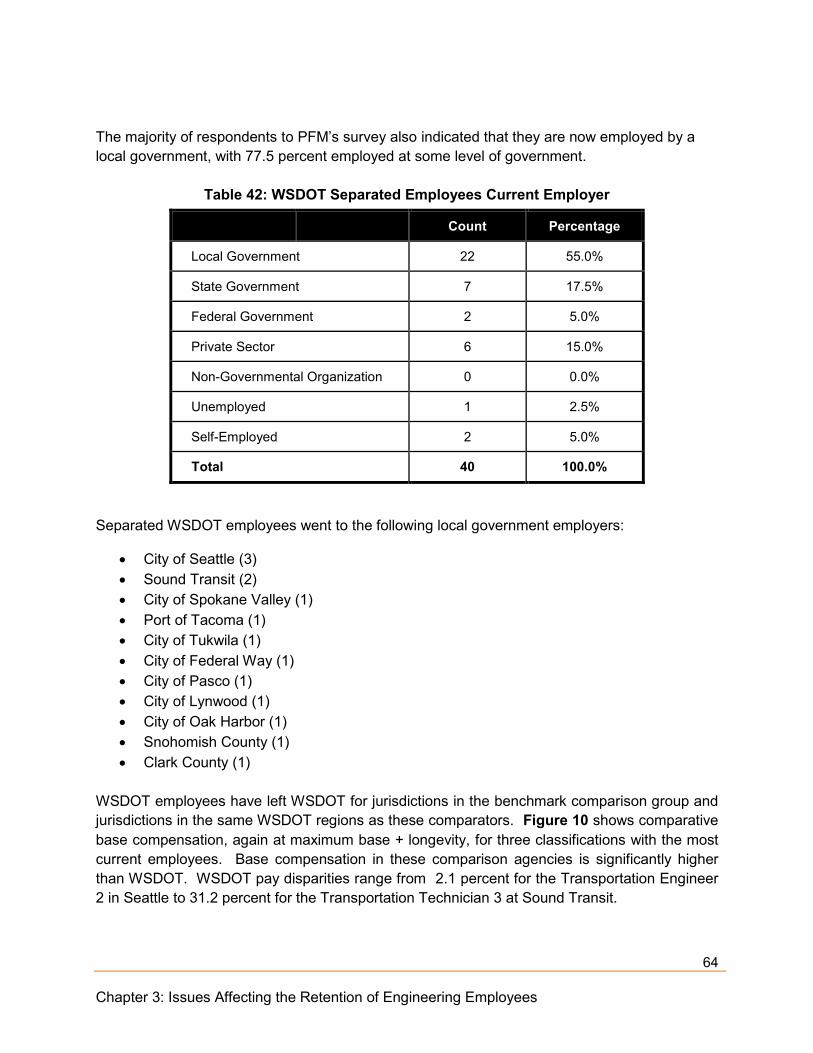
64 Chapter 3: Issues Affecting the Retention of Engineering Employees
The majority of respondents to PFM’s survey also indicated that they are now employed by a local government, with 77.5 percent employed at some level of government.
Table 42: WSDOT Separated Employees Current Employer
Count Percentage
Local Government 22 55.0%
State Government 7 17.5%
Federal Government 2 5.0%
Private Sector 6 15.0%
Non-Governmental Organization 0 0.0%
Unemployed 1 2.5%
Self-Employed 2 5.0%
Total 40 100.0%
Separated WSDOT employees went to the following local government employers:
City of Seattle (3) Sound Transit (2) City of Spokane Valley (1) Port of Tacoma (1) City of Tukwila (1) City of Federal Way (1) City of Pasco (1) City of Lynwood (1) City of Oak Harbor (1) Snohomish County (1) Clark County (1)
WSDOT employees have left WSDOT for jurisdictions in the benchmark comparison group and jurisdictions in the same WSDOT regions as these comparators. Figure 10 shows comparative base compensation, again at maximum base + longevity, for three classifications with the most current employees. Base compensation in these comparison agencies is significantly higher than WSDOT. WSDOT pay disparities range from 2.1 percent for the Transportation Engineer 2 in Seattle to 31.2 percent for the Transportation Technician 3 at Sound Transit.

65 Chapter 3: Issues Affecting the Retention of Engineering Employees
DRIVERS OF ATTRITION
External Factors
As discussed in Chapter 1, it is difficult to project the expected hiring of other local agencies and private sector employers. According to the Bureau of Labor Statistics Employment Projections (EP) program, employment in the local government sector is expected to grow by approximately 4.3 percent between 2014 and 2024, with 5.6 percent growth among civil engineers within local government. Similarly, employment in the engineering services sector is expected to grow by 10.7 percent over the same period, with slightly higher growth for civil engineers (11.7 percent).20 These figures can be taken as an indication of strong hiring among WSDOT’s competitors.
Internal Factors
Availability of opportunities elsewhere does not alone motivate an employee to leave their current position. Based on survey results, separated WSDOT employees identified two main components of their job dissatisfaction – better pay and benefits and not feeling valued by the Department—this also showed up as lack of promotional opportunities and dissatisfaction with
20 Bureau of Labor Statistics, Employment Projection (EP) Program, National Employment Matrix – Industry, 2014-2024 (most recent data available)
$66,684 $60,420
$71,844 $71,704 $63,917
$86,840 $75,566
$75,566
$119,989
$91,241
$81,140
$130,002
$93,184
$117,916
$0
$20,000
$40,000
$60,000
$80,000
$100,000
$120,000
$140,000
Transportation Engineer 2 Transportation Technician 3 Property & AcquisitionSpecialist 5
Figure 10: Pay at WSDOT vs. Comparable Agencies (Jurisdictions Where or Near Resigning Employees are Going)
WS
DO
T
Spokane C
ounty
Clark C
ounty
King C
ounty
Seattle
WS
DO
T
Spokane C
ounty
Clark C
ounty
Spokane C
ity
Sound Transit
WS
DO
T
Spokane C
ity
King C
ounty
Sound Transit
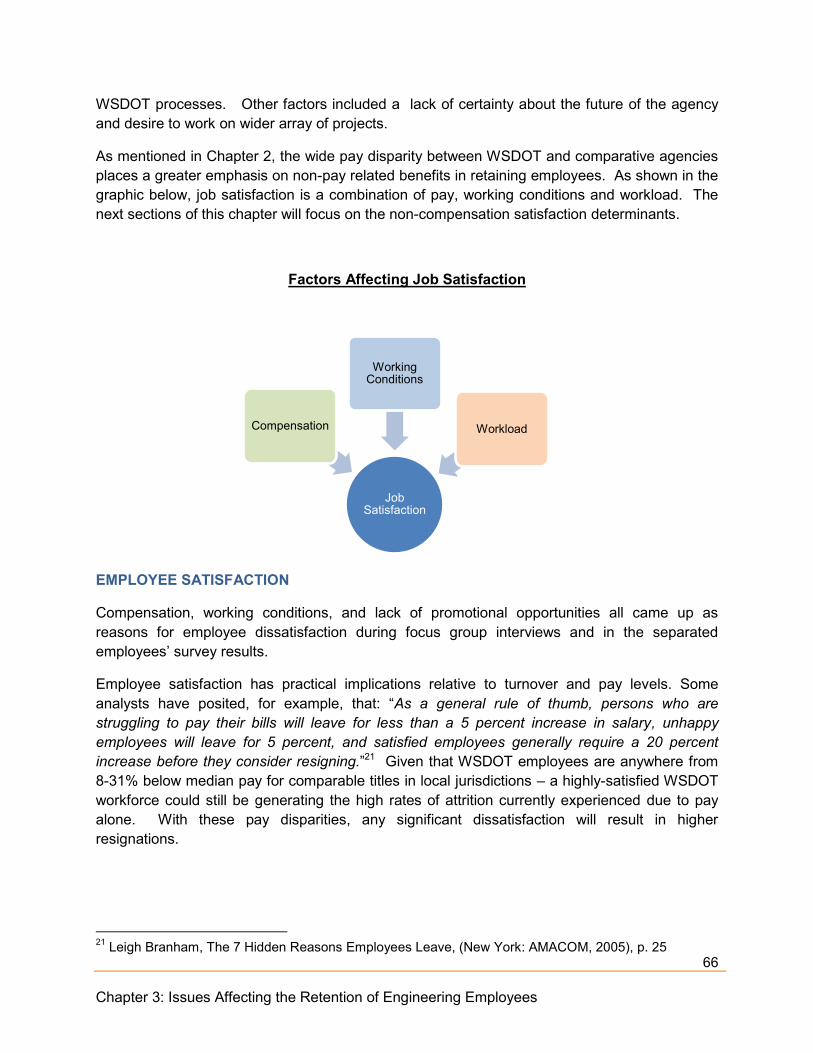
66 Chapter 3: Issues Affecting the Retention of Engineering Employees
WSDOT processes. Other factors included a lack of certainty about the future of the agency and desire to work on wider array of projects.
As mentioned in Chapter 2, the wide pay disparity between WSDOT and comparative agencies places a greater emphasis on non-pay related benefits in retaining employees. As shown in the graphic below, job satisfaction is a combination of pay, working conditions and workload. The next sections of this chapter will focus on the non-compensation satisfaction determinants.
Factors Affecting Job Satisfaction
EMPLOYEE SATISFACTION
Compensation, working conditions, and lack of promotional opportunities all came up as reasons for employee dissatisfaction during focus group interviews and in the separated employees’ survey results.
Employee satisfaction has practical implications relative to turnover and pay levels. Some analysts have posited, for example, that: “As a general rule of thumb, persons who are struggling to pay their bills will leave for less than a 5 percent increase in salary, unhappy employees will leave for 5 percent, and satisfied employees generally require a 20 percent increase before they consider resigning.”21 Given that WSDOT employees are anywhere from 8-31% below median pay for comparable titles in local jurisdictions – a highly-satisfied WSDOT workforce could still be generating the high rates of attrition currently experienced due to pay alone. With these pay disparities, any significant dissatisfaction will result in higher resignations.
21 Leigh Branham, The 7 Hidden Reasons Employees Leave, (New York: AMACOM, 2005), p. 25
Job Satisfaction
Compensation
Working Conditions
Workload
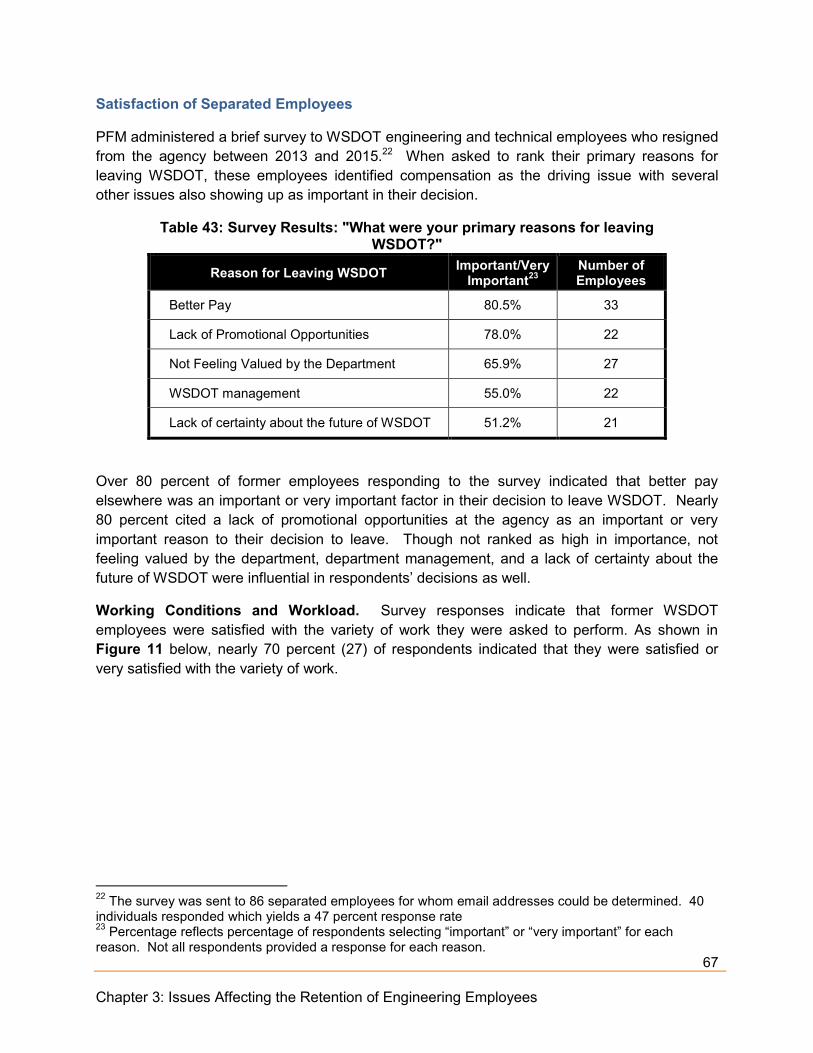
67 Chapter 3: Issues Affecting the Retention of Engineering Employees
Satisfaction of Separated Employees
PFM administered a brief survey to WSDOT engineering and technical employees who resigned from the agency between 2013 and 2015.22 When asked to rank their primary reasons for leaving WSDOT, these employees identified compensation as the driving issue with several other issues also showing up as important in their decision.
Table 43: Survey Results: "What were your primary reasons for leaving WSDOT?"
Reason for Leaving WSDOT Important/Very Important23
Number of Employees
Better Pay 80.5% 33
Lack of Promotional Opportunities 78.0% 22
Not Feeling Valued by the Department 65.9% 27
WSDOT management 55.0% 22
Lack of certainty about the future of WSDOT 51.2% 21
Over 80 percent of former employees responding to the survey indicated that better pay elsewhere was an important or very important factor in their decision to leave WSDOT. Nearly 80 percent cited a lack of promotional opportunities at the agency as an important or very important reason to their decision to leave. Though not ranked as high in importance, not feeling valued by the department, department management, and a lack of certainty about the future of WSDOT were influential in respondents’ decisions as well.
Working Conditions and Workload. Survey responses indicate that former WSDOT employees were satisfied with the variety of work they were asked to perform. As shown in Figure 11 below, nearly 70 percent (27) of respondents indicated that they were satisfied or very satisfied with the variety of work.
22 The survey was sent to 86 separated employees for whom email addresses could be determined. 40 individuals responded which yields a 47 percent response rate 23 Percentage reflects percentage of respondents selecting “important” or “very important” for each reason. Not all respondents provided a response for each reason.

68 Chapter 3: Issues Affecting the Retention of Engineering Employees
However, during the project team’s focus group discussions with several classification groups, some employees emphasized that they were concerned with how the variety of work may be impacted as the agency considered a change from a design-bid-build to a design-build process. This change will reduce the design-related work for WSDOT technical employees and could hamper retention efforts.
Under a design-bid-build process, the owner (in this case WSDOT) contracts with a designer and a contractor separately to design and build, respectively, the project under separate contracts. By contrast, under a design-build process, the owner contracts with a single entity to both design and build the project under a single contract. Design-build is considered more cost and time-efficient.
However with this potential change, WSDOT engineering employees indicated that much of their work will become contract management, rather than actual engineering work. Many engineers will only oversee the agency’s consultants and will not perform the hands-on engineering work they were trained to perform. Anecdotally, focus group participants indicated that this is a major reason employees are leaving.
Participants also indicated that recent turnover, especially among more experienced employees, increases workloads for remaining employees. This is especially detrimental when experienced employees leave; they take with them the knowledge needed to effectively perform the required engineering work and oversight needed in the design-build process. Separated employee
10.0%
57.5%
12.5% 10.0% 10.0%
0.0%
10.0%
20.0%
30.0%
40.0%
50.0%
60.0%
70.0%
Very Satisfied Satisfied Not Satisfied VeryUnsatisfied
Other (pleasespecify)
Figure 11: Survey Results: "While working for WSDOT I was ____ with the variety of work I was asked to perform "
Note: Four (4) respondents selected “Other.” These respondents provided specific comments about their satisfaction. Three of the four provided comments that indicated they were generally satisfied with the work variety.
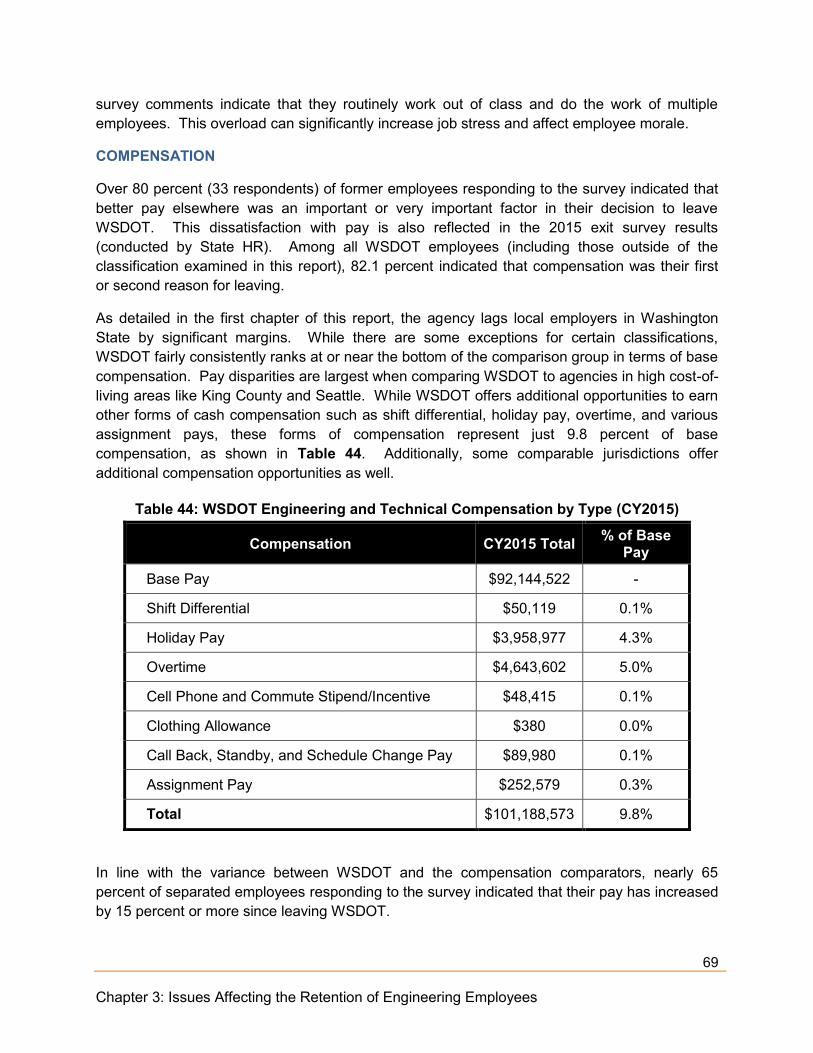
69 Chapter 3: Issues Affecting the Retention of Engineering Employees
survey comments indicate that they routinely work out of class and do the work of multiple employees. This overload can significantly increase job stress and affect employee morale.
COMPENSATION
Over 80 percent (33 respondents) of former employees responding to the survey indicated that better pay elsewhere was an important or very important factor in their decision to leave WSDOT. This dissatisfaction with pay is also reflected in the 2015 exit survey results (conducted by State HR). Among all WSDOT employees (including those outside of the classification examined in this report), 82.1 percent indicated that compensation was their first or second reason for leaving.
As detailed in the first chapter of this report, the agency lags local employers in Washington State by significant margins. While there are some exceptions for certain classifications, WSDOT fairly consistently ranks at or near the bottom of the comparison group in terms of base compensation. Pay disparities are largest when comparing WSDOT to agencies in high cost-of-living areas like King County and Seattle. While WSDOT offers additional opportunities to earn other forms of cash compensation such as shift differential, holiday pay, overtime, and various assignment pays, these forms of compensation represent just 9.8 percent of base compensation, as shown in Table 44. Additionally, some comparable jurisdictions offer additional compensation opportunities as well.
Table 44: WSDOT Engineering and Technical Compensation by Type (CY2015)
Compensation CY2015 Total % of Base Pay
Base Pay $92,144,522 -
Shift Differential $50,119 0.1%
Holiday Pay $3,958,977 4.3%
Overtime $4,643,602 5.0%
Cell Phone and Commute Stipend/Incentive $48,415 0.1%
Clothing Allowance $380 0.0%
Call Back, Standby, and Schedule Change Pay $89,980 0.1%
Assignment Pay $252,579 0.3%
Total $101,188,573 9.8%
In line with the variance between WSDOT and the compensation comparators, nearly 65 percent of separated employees responding to the survey indicated that their pay has increased by 15 percent or more since leaving WSDOT.

70 Chapter 3: Issues Affecting the Retention of Engineering Employees
A number of employees participating in the focus groups indicated that geographic pay would go a long way to correcting some of the pay inequities with specific labor markets in the State. As shown in the previous chapter, WSDOT offers geographic assignment pay ranging from 2.5 percent to 10percent for a select number of classifications (Property & Acquisition Specialists 1-6 and Transportation Engineer 3s working as Cadastral Surveyors).
Lack of Promotional Opportunities. Opportunities to promote provide additional incentive to remain with an employer, earn additional compensation, and build one’s skills. Seventy-eight percent of separated employees indicated that a lack of promotional opportunities was an important or very important factor in their decision to leave WSDOT. Similarly 79.6 percent of State exit survey respondents indicated that their first or second reason for leaving was related to non-monetary skill or career development. Representative comments regarding lack of promotional opportunity included:
“Lack of growth opportunities…it felt very dead-end: If you’re happy with where you’re at and have no desire to improve, great! If not, you won’t be happy here for long.”
“Easy to get stuck in a role and unable to branch out.”
“Talented employees are limited in utilizing their skillset. There is no motivation to improve or advance.”
Based on both focus group and survey responses, it appears that the promotional system for engineering and technical classifications at WSDOT varies according to office, manager, and classification. Staffing levels dictate the number of employees who can be in progressively higher classifications in certain offices. This is especially true in smaller offices and regions where authorized staffing positions are lower. Transportation Engineers in particular made note that most Transportation Engineer 4 and 5 positions are assigned to the WSDOT headquarters,
11.9%
16.7%
28.6%
35.7%
7.1%
Figure 12: Survey Results: "Since leaving WSDOT, my monthly take-home pay has..."
Increased by 0-5%
Increased by 6-14%
Increased by 15-24%
Increased by 25% or more
Decreased
71 Chapter 3: Issues Affecting the Retention of Engineering Employees
meaning that in order to promote, employees would need to move or obtain their Professional Engineering license.
Transportation Technical Engineers (TTE) and Transportation Technicians participating in the project team’s focus group indicated that a lack of promotional opportunity is especially evident in those classifications. Similarly for Transportation Technicians, employees can “top out” quickly when they reach the three level. While the employee could choose to enter the Transportation Engineer classifications, continued advancement might eventually require obtaining a professional engineering certification (though not all Transportation Engineer series positions require this licensure.
Additionally, survey and focus group responses indicated the process for promotion is not clearly stated. While promotion to some classifications was at one time automatic, the auto promotion procedure has since been discontinued. This change may be unclear to current employees. Focus group and survey group participants also indicated that in some offices, the promotional process is manager-specific, with some managers using a different promotional process than others. All of these factors create uncertainty about a long-term career at the agency.
FINDINGS AND RECOMMENDATIONS
Finding #7: Impact of Design-Build Contracting. Both current and former engineering employees report that because of a contemplated move from design-bid-build to design-build, engineers will become contract managers in charge of overseeing consultant engineers.
Recommendation 7.1. As WSDOT moves into the 2017-2019 biennium, the agency should carefully consider how use of the design-build model will impact the current WSDOT engineering and technical workforce. While design-build is more cost and time-effective, current employee opinion of this process is negative overall, as it takes away employees’ ability to do the engineering work they believe they were hired to do. Employee feedback on how best to use this process, and when, should be solicited. This can be addressed by having a portion of key projects designed by WSDOT engineering staff.
Finding #8: Broad Classification Specifications. While not reflected in survey or focus group responses, the project team found the current classification specifications for the benchmark classes to be very broad. Moreover, these classifications encompass a significant number of working titles. Focus group participants and WSDOT management both indicated that an employee in a class in one office might perform entirely different work than an employee in that same class in another office. Some working titles within a class might require additional specialized skills that are not recognized with a comparable adjustment in pay because the class is limited to a specific pay grade. This is the case for hydraulic and geotechnical engineers, but can also be present in other working titles as well.
Recommendation 8.1. While the project team acknowledges that a major shift in the way the State classifies employees is not likely, it recommends a comprehensive review
72 Chapter 3: Issues Affecting the Retention of Engineering Employees
of the engineering and technical class specifications. It would provide the opportunity to reevaluate if the duties and requirements of these specifications are in line with pay. Having broad classifications has the benefit of providing flexibility in the hiring process; therefore, alternative compensation options may need to be considered to address recruitment and retention concerns (e.g., expanded assignment pay or licensing pay).
Finding #9: As shown in Chapter 2, WSDOT compensation lags both public and private employers in various local labor markets across the state by significant margins. Additionally, many employees are at maximum base pay (reached after five and one-half years employment) and are thus wholly reliant on across-the-board increases or promotions to improve their compensation year-to-year.
Recommendation 9.1. Working with the Office of Financial Management, WSDOT should develop a long-term compensation strategy to address pay competitiveness within the State’s ability to pay. Such a plan will help address current employee dissatisfaction with pay levels and improve the agency’s ability to both recruit and retain valuable employees.
Recommendation 9.2. The State should strongly consider significant across-the-board pay increases for engineering and technical employees to remedy a portion of the current disparities with local government employers.
Finding #10: Geographic Pay. Geographic assignment pay is offered to a limited number of classifications and in varying amounts based on classification, as shown in Table 45.
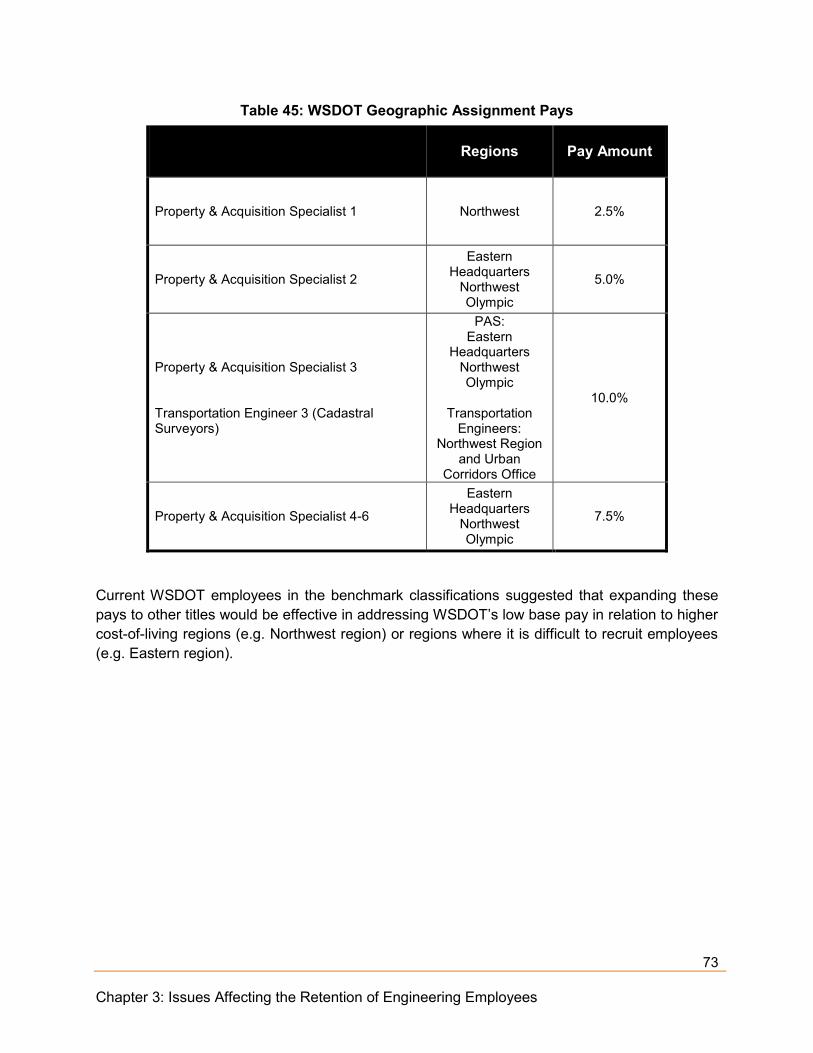
73 Chapter 3: Issues Affecting the Retention of Engineering Employees
Table 45: WSDOT Geographic Assignment Pays
Regions Pay Amount
Property & Acquisition Specialist 1 Northwest 2.5%
Property & Acquisition Specialist 2
Eastern Headquarters
Northwest Olympic
5.0%
Property & Acquisition Specialist 3 Transportation Engineer 3 (Cadastral Surveyors)
PAS: Eastern
Headquarters Northwest Olympic
Transportation
Engineers: Northwest Region
and Urban Corridors Office
10.0%
Property & Acquisition Specialist 4-6
Eastern Headquarters
Northwest Olympic
7.5%
Current WSDOT employees in the benchmark classifications suggested that expanding these pays to other titles would be effective in addressing WSDOT’s low base pay in relation to higher cost-of-living regions (e.g. Northwest region) or regions where it is difficult to recruit employees (e.g. Eastern region).

74 Chapter 3: Issues Affecting the Retention of Engineering Employees
Figure 13 shows the pay differences between WSDOT and several local government comparators for three classifications. Pay differences are greatest in the heavily-populated, high cost-of-living Northwest region.
Recommendation 10.1. Geographic assignment pay should be expanded to include all benchmark classifications. In addition, the agency should consider setting this pay not based on classification, but rather based on region. For example, employees in higher cost-of-living regions should receive higher geographic assignment pay.
Any new structure for assignment pay, especially if it is expanded for recruitment and retention purposes, should be based on the market. Table 46 shows WSDOT’s variance from the median compensation at maximum base24 in labor markets where the project team benchmarked local public sector employer compensation. Also included in this median calculation is private sector ERI data.25 More detailed tables are available in Appendix F.
24 Maximum base was used instead of maximum base + longevity as ERI data is only captured for maximum base pay. 25 ERI data was included for Seattle and Mount Vernon in the Northwest Region, Tacoma and Olympia in the Olympia Region, Spokane in the Eastern Region, and Vancouver in the Southwest Region. ERI data was only available for the Transportation Engineer 2, Transportation Technician 3, and Property & Acquisition Specialist 3 classifications.
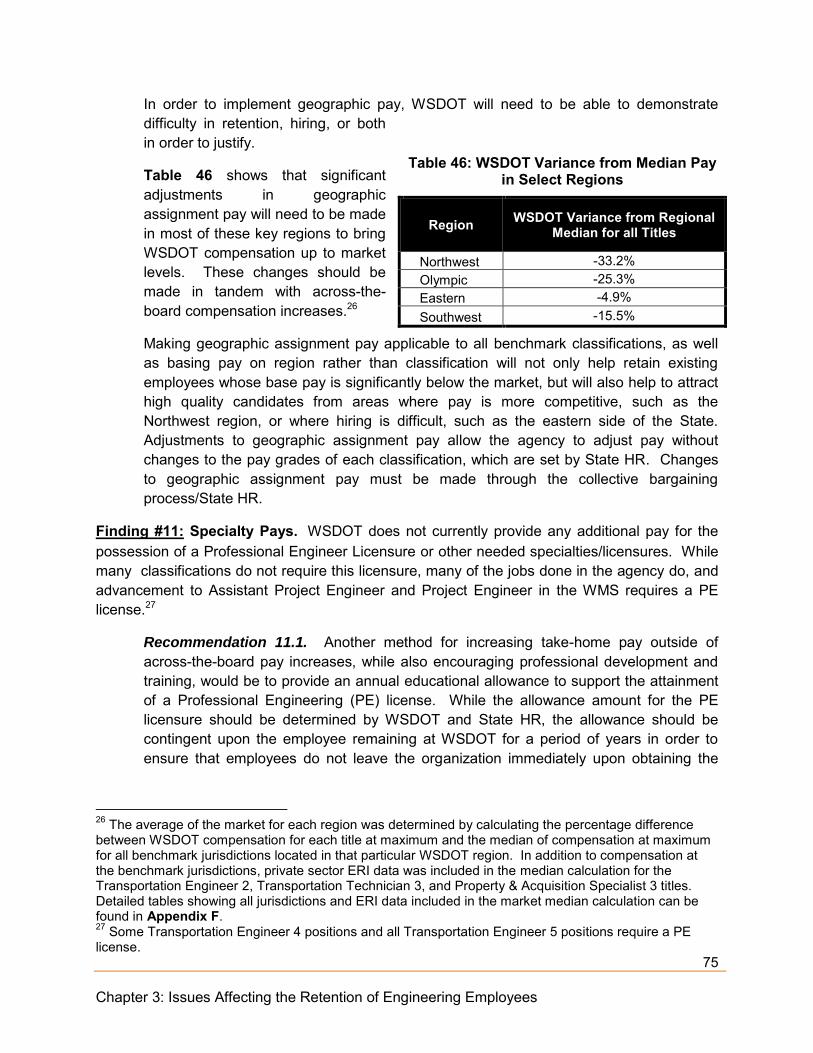
75 Chapter 3: Issues Affecting the Retention of Engineering Employees
In order to implement geographic pay, WSDOT will need to be able to demonstrate difficulty in retention, hiring, or both in order to justify.
Table 46 shows that significant adjustments in geographic assignment pay will need to be made in most of these key regions to bring WSDOT compensation up to market levels. These changes should be made in tandem with across-the-board compensation increases.26
Making geographic assignment pay applicable to all benchmark classifications, as well as basing pay on region rather than classification will not only help retain existing employees whose base pay is significantly below the market, but will also help to attract high quality candidates from areas where pay is more competitive, such as the Northwest region, or where hiring is difficult, such as the eastern side of the State. Adjustments to geographic assignment pay allow the agency to adjust pay without changes to the pay grades of each classification, which are set by State HR. Changes to geographic assignment pay must be made through the collective bargaining process/State HR.
Finding #11: Specialty Pays. WSDOT does not currently provide any additional pay for the possession of a Professional Engineer Licensure or other needed specialties/licensures. While many classifications do not require this licensure, many of the jobs done in the agency do, and advancement to Assistant Project Engineer and Project Engineer in the WMS requires a PE license.27
Recommendation 11.1. Another method for increasing take-home pay outside of across-the-board pay increases, while also encouraging professional development and training, would be to provide an annual educational allowance to support the attainment of a Professional Engineering (PE) license. While the allowance amount for the PE licensure should be determined by WSDOT and State HR, the allowance should be contingent upon the employee remaining at WSDOT for a period of years in order to ensure that employees do not leave the organization immediately upon obtaining the
26 The average of the market for each region was determined by calculating the percentage difference between WSDOT compensation for each title at maximum and the median of compensation at maximum for all benchmark jurisdictions located in that particular WSDOT region. In addition to compensation at the benchmark jurisdictions, private sector ERI data was included in the median calculation for the Transportation Engineer 2, Transportation Technician 3, and Property & Acquisition Specialist 3 titles. Detailed tables showing all jurisdictions and ERI data included in the market median calculation can be found in Appendix F. 27 Some Transportation Engineer 4 positions and all Transportation Engineer 5 positions require a PE license.
Table 46: WSDOT Variance from Median Pay in Select Regions
Region WSDOT Variance from Regional Median for all Titles
Northwest -33.2% Olympic -25.3% Eastern -4.9% Southwest -15.5%
76 Chapter 3: Issues Affecting the Retention of Engineering Employees
license. In addition to providing additional training, having a PE license will prepare more employees for promotion to TE4 and TE5 and to rise to the ranks of the WMS.
Subsidizing the attainment of a PE license would have the additional effect of improving the quality of engineering employees and making it possible for some current Transportation Technicians and Transportation Engineers 1-3 to move into or advance within the Transportation Engineer classifications, providing an incentive, and ability, to seek promotions to these classifications.
Finding #12: Promotion Process. The process for promotion at WSDOT varies by positon, manager, and office location. Uncertainty about the process and requirements for promotion creates uncertainty regarding a career path for employees in the benchmark classifications.
Recommendation 12.1. The agency should undertake a comprehensive review of the processes by which engineering and technical employees in all classifications are promoted to ensure that promotional processes are internally consistent and consistent with current staffing needs.
Finding #13: Employee Dissatisfaction. Feeling valued by the department, along with dissatisfaction with management, were key issues with separated employees. While some level of dissatisfaction lives in any organization, the low pay at WSDOT makes employee satisfaction with management a critical issue.
Recommendation 13.1. WSDOT should include in manager performance reviews a component for review by subordinates. This will allow upper management to understand where managers are doing well and where managers are in need of coaching to improve. Focusing on management performance is a critical issue as the agency works to retain qualified and trained employees. The agency has already begun efforts to improve management performance through individual performance plans and leadership training.
CONCLUSION
Improving the satisfaction of WSDOT engineering and technical employees is essential to halting the recent increase in voluntary resignations. To improve employee satisfaction, the agency will need to improve compensation, provide a clear path for career advancement, address management issues, and ensure that employees’ skills are fully utilized as the legislature considers a transition to a design-build service model. As service needs grow over the next biennium, and with a wave of projected retirements coming in five years, WSDOT will need to address these issues quickly and systematically to ensure that it is able to effectively meet its short-term goals of the 2017-2019 biennium and, longer-term, its broader mission of providing sustainable, integrated multimodal transportation systems.
Improving compensation competitiveness is critical to recruiting and retaining high-quality engineering and technical employees. The agency should focus on development of a comprehensive, long-term compensation plan based on some of the recommendations in this

77 Chapter 3: Issues Affecting the Retention of Engineering Employees
chapter. While implementation of such a strategy will inevitably result in some additional cost to the State, well-targeted compensation strategies will allow the agency to maximize return on the incremental dollars made available to it to address the market disparity.
Addressing other employee satisfaction issues such as discontent with management and work process is also critical. WSDOT management will need to be willing to address some difficult issues regarding the design-build process and what it means for the work of its employees.
A point of light in the survey responses is that 85 percent of respondents indicated that they would or would probably consider a return to WSDOT if their issues were addressed. This indicates that, if WSDOT takes the proper steps, it can vastly improve employee satisfaction and its ability to retain valuable employees. However, if no action is taken, the agency will likely see increasing vacancies and be unable to effectively fulfill its mission.

78 Chapter 4: Staffing Plan and Issues Affecting Recruitment of Engineering Employees
1,875 1,638 1,552 1,461 1,415 1,372
0
500
1,000
1,500
2,000
Dec.'10
Dec.'11
Dec.'12
Dec.'13
Dec.'14
Dec.'15
Figure 14: Historical FTE Count Benchmark Positions
Chapter 4: Staffing Plan and Issues Affecting Recruitment of Engineering Employees
INTRODUCTION
As demonstrated earlier in this report, the recruitment process will be critical to the proper functioning of WSDOT as it begins to implement the State’s $16.1 billion, 16-year construction program Connecting Washington. Over the last six years, WSDOT has been in the mode of position reduction as the project pipeline and reduced funding from the last recession limited the agency’s funding. Reductions were made as much as possible through attrition, but often the engineers who left the agency were early in their career. As these positions became vacant, there was no need to re-fill, leading to a small workforce in the entry-level positions. STAFFING PLAN
WSDOT has been through a great deal of change over the last five years. From undergoing an agency-wide reduction in allocated staff to the recent approval of a statewide $16.1 billion construction funding package, WSDOT is an agency in transition. As shown in Figure 14, WSDOT has seen a reduction of just over 500 benchmark positions between December 2010 and December 2015. This consistent reduction in benchmark classifications has had a significant impact on staffing distribution between classifications as well as ongoing recruitment activity. Based on a review of workforce needs by engineering managers, the staffing needs should remain constant over the next several years, but may need to increase the core staff at higher than current levels. The agency plans to staff construction projects funded over the next several years. This section will lay out the current staffing plan for the next three years that will feed into the recruitment needs of the agency. Additionally, this section discusses issues that need to be resolved over the next three years in order to allow the agency to develop and implement a staffing plan that addresses its emerging needs. Staffing Options At this time, WSDOT is taking a position that additional hiring needed to fulfill the 16-year construction program will be met through a combination of contracting and existing WSDOT
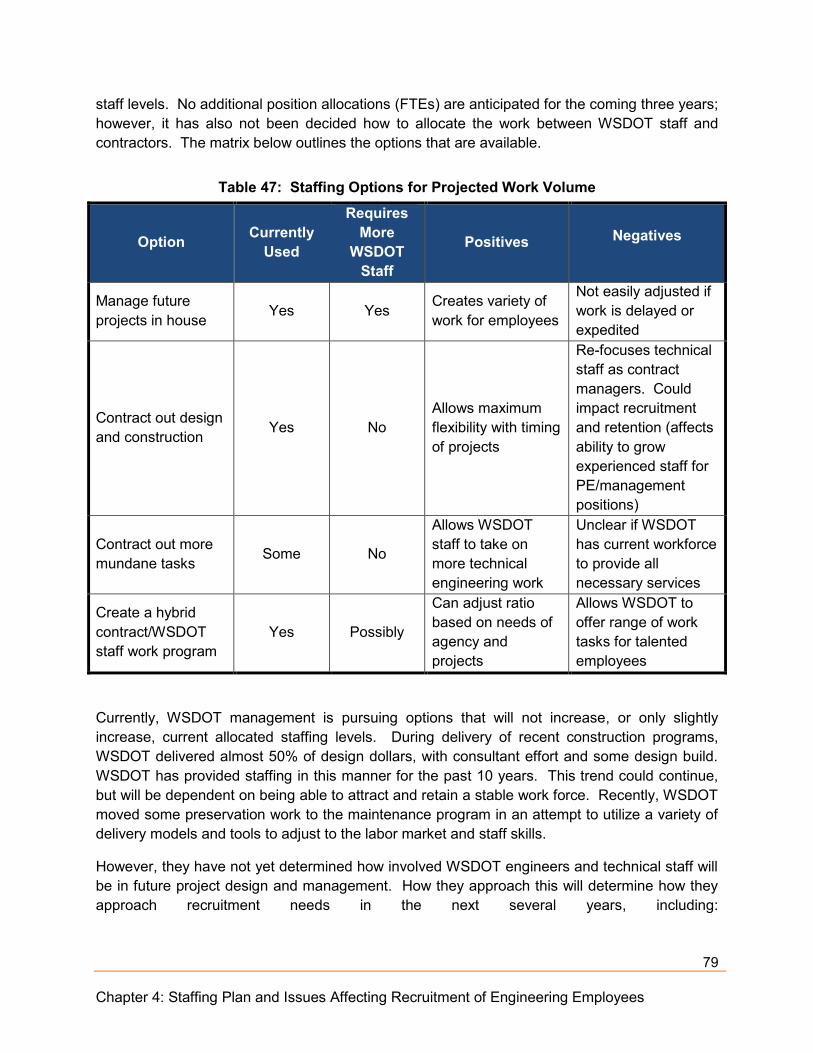
79 Chapter 4: Staffing Plan and Issues Affecting Recruitment of Engineering Employees
staff levels. No additional position allocations (FTEs) are anticipated for the coming three years; however, it has also not been decided how to allocate the work between WSDOT staff and contractors. The matrix below outlines the options that are available.
Table 47: Staffing Options for Projected Work Volume
Option Currently Used
Requires More
WSDOT Staff
Positives Negatives
Manage future projects in house Yes Yes Creates variety of
work for employees
Not easily adjusted if work is delayed or expedited
Contract out design and construction Yes No
Allows maximum flexibility with timing of projects
Re-focuses technical staff as contract managers. Could impact recruitment and retention (affects ability to grow experienced staff for PE/management positions)
Contract out more mundane tasks Some No
Allows WSDOT staff to take on more technical engineering work
Unclear if WSDOT has current workforce to provide all necessary services
Create a hybrid contract/WSDOT staff work program
Yes Possibly
Can adjust ratio based on needs of agency and projects
Allows WSDOT to offer range of work tasks for talented employees
Currently, WSDOT management is pursuing options that will not increase, or only slightly increase, current allocated staffing levels. During delivery of recent construction programs, WSDOT delivered almost 50% of design dollars, with consultant effort and some design build. WSDOT has provided staffing in this manner for the past 10 years. This trend could continue, but will be dependent on being able to attract and retain a stable work force. Recently, WSDOT moved some preservation work to the maintenance program in an attempt to utilize a variety of delivery models and tools to adjust to the labor market and staff skills.
However, they have not yet determined how involved WSDOT engineers and technical staff will be in future project design and management. How they approach this will determine how they approach recruitment needs in the next several years, including:

80 Chapter 4: Staffing Plan and Issues Affecting Recruitment of Engineering Employees
Increased attrition due to mid-career employees being unsatisfied with the work (this issue arose in both the survey as reasons people left and in focus groups as a concern for the future)
Difficulty for recruiters in marketing engineering jobs at WSDOT as most of the engineering work is contracted out
Expected Staffing Needs 2017-2019 As shown in Table 48 below, WSDOT will need to hire 450 employees in the engineer and technical classifications to first fill all vacant positions, and then to keep up with projected retirements and resignations through 2019. Beyond that, hiring needs will continue at a similar pace to keep up with expected attrition. This does not account for any additional hiring that might be needed if WSDOT takes on design and construction responsibilities for a portion of the programmed new projects.
Table 48: CY2016-2021 Hiring Needs (All Classifications)
2016 2017 2018 2019 2020 2021
Cumulative 227 298 377 450 538 619
Year-by-Year 227 71 79 73 88 81
Issues to Address
Contract vs. in-house design and construction. The agency should begin planning now for how it will apportion new work between in-house design and construction and outside contractors and consultants. This may be a multi-year strategy that changes over time, but such a strategy will send a clear message to the workforce about the direction management is headed.
Loss of lower-level employees. Since 2011, WSDOT has lost 270 Transportation Engineer 1, 2, and 3s while only losing 32 Transportation Engineer 4s and gaining 1.5 Transportation Engineer 5s. This reduction at the lower level classifications has several ramifications for future hiring:
1. Training Needs. Most hiring will be at the lower staffing levels resulting in a need for training, but the attrition will be at the higher staffing levels for both retirement and expected resignations. WSDOT needs to address this expected trainee-trainer gap.
2. Targeted Skill Levels. The employees hired in the next several years will provide the workforce to execute the WSDOT staffing plan. Is that plan to primarily contract out future work, do it in house, or a combination of those two? Setting a direction

81 Chapter 4: Staffing Plan and Issues Affecting Recruitment of Engineering Employees
prior to embarking on hiring new staff is important to hiring the right skill sets to execute that plan.
3. Experience Level. As longer-tenured staff retires, there may not be enough trained and experienced staff to fill the void that can be left by this attrition. Training new staff to be prepared to take over complex engineering tasks can take years. WSDOT may need to look to experienced personnel to hire into more senior positions. This may be difficult given the current pay structure, but it may also cause issues with lower-level employees who feel they are being passed over.
Source: WSDOT HR data
All of these issues point to a need for WSDOT management to develop a strategy to address the execution of the Connecting Washington transportation program along with all of the ongoing work of the agency. Developing this plan will lead to clear directions on hiring strategies and needs and will be invaluable to recruiters in developing their own strategy for addressing the agency’s hiring needs.
RECRUITMENT OVERVIEW
Recruitment Process
The recruitment process at this time is very straightforward, as demonstrated in the graphic below. This is the same process followed for all position recruitments.
-160.00
-140.00
-120.00
-100.00
-80.00
-60.00
-40.00
-20.00
0.00
20.00
TE1 TE2 TE3 TE4 TE5 TTE
Figure 15: Reduction in Select Positions 2011 - 2015
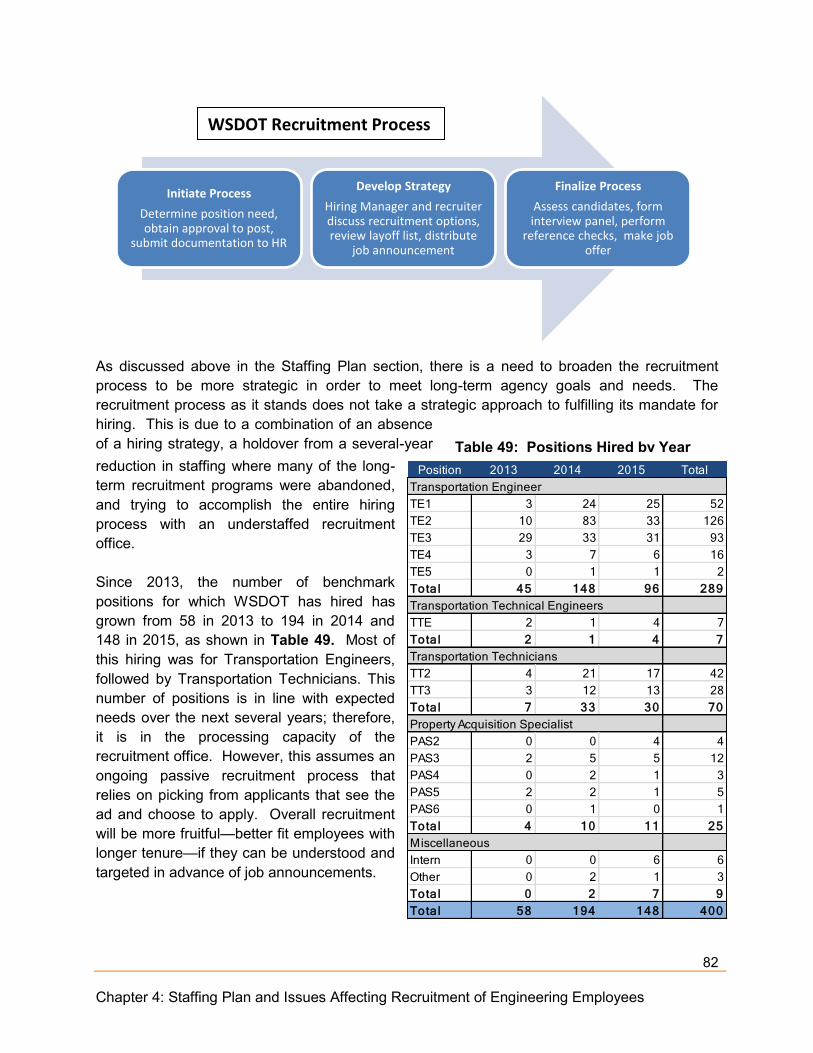
82 Chapter 4: Staffing Plan and Issues Affecting Recruitment of Engineering Employees
As discussed above in the Staffing Plan section, there is a need to broaden the recruitment process to be more strategic in order to meet long-term agency goals and needs. The recruitment process as it stands does not take a strategic approach to fulfilling its mandate for hiring. This is due to a combination of an absence of a hiring strategy, a holdover from a several-year reduction in staffing where many of the long-term recruitment programs were abandoned, and trying to accomplish the entire hiring process with an understaffed recruitment office. Since 2013, the number of benchmark positions for which WSDOT has hired has grown from 58 in 2013 to 194 in 2014 and 148 in 2015, as shown in Table 49. Most of this hiring was for Transportation Engineers, followed by Transportation Technicians. This number of positions is in line with expected needs over the next several years; therefore, it is in the processing capacity of the recruitment office. However, this assumes an ongoing passive recruitment process that relies on picking from applicants that see the ad and choose to apply. Overall recruitment will be more fruitful—better fit employees with longer tenure—if they can be understood and targeted in advance of job announcements.
Initiate Process
Determine position need, obtain approval to post,
submit documentation to HR
Develop Strategy
Hiring Manager and recruiter discuss recruitment options, review layoff list, distribute
job announcement
Finalize Process
Assess candidates, form interview panel, perform
reference checks, make job offer
WSDOT Recruitment Process
Table 49: Positions Hired by Year Position 2013 2014 2015 Total
Transportation Engineer
TE1 3 24 25 52
TE2 10 83 33 126
TE3 29 33 31 93
TE4 3 7 6 16
TE5 0 1 1 2
Tota l 45 148 96 289
Transportation Technical Engineers
TTE 2 1 4 7
Tota l 2 1 4 7
Transportation Technicians
TT2 4 21 17 42
TT3 3 12 13 28
Tota l 7 33 30 70
Property Acquisition Specialist
PAS2 0 0 4 4
PAS3 2 5 5 12
PAS4 0 2 1 3
PAS5 2 2 1 5
PAS6 0 1 0 1
Tota l 4 10 11 25
Miscellaneous
Intern 0 0 6 6
Other 0 2 1 3
Tota l 0 2 7 9
Tota l 58 194 148 400

83 Chapter 4: Staffing Plan and Issues Affecting Recruitment of Engineering Employees
Process Timing
Data from the past three years of recruitments shows a consistent average number of days from posting of a job to making a job offer for the position. On a consistent basis, the days to hire have been under two months for most positions in most years. This shows a level of efficiency in the hiring process that should be helpful in the overall recruitment process.
Table 50: Average Days to Hire by Year Position 2013 2014 2015 Average
Transportation Engineer TE1 64.3 50.9 52.7 52.5 TE2 45.0 54.1 48.1 51.8 TE3 44.0 42.6 43.6 43.4 TE4 38.0 46.3 119.7 72.3 TE5 - 36.0 72.0 54.0 Average 45.2 50.5 52.6 50.4 Transportation Technical Engineers TTE 26.5 42.0 52.8 43.7 Average 26.5 42.0 52.8 43.7 Transportation Technicians TT2 39.0 61.3 90.2 70.9 TT3 42.3 50.6 50.7 49.8 Average 40.4 57.4 73.1 62.4 Property Acquisition Specialist PAS2 - - 55.5 55.5 PAS3 71.0 45.0 52.0 52.3 PAS4 - 21.5 44.0 29.0 PAS5 44.0 56.0 96.0 59.2 PAS6 - 31.0 - 31.0 Average 57.5 41.1 56.5 50.5 Miscellaneous Intern - - - 129.0 Other - 55.0 38.0 49.3 Average 0.0 55.0 124.1 123.1
Budget for Recruitment
As staff and projects were being cut from the WSDOT budget over the last several years, one of the first items to go was the recruitment budget. As it stands, the budget for recruitment covers the recruitment staff, basic marketing materials, and general office needs. As shown in the graphic above, the recruitment process is primarily driven by department managers receiving authorization to post a position and the recruiting office supporting that hire through posting the job announcement on several job websites. This reflects the lack of budget for hiring, as well as the lack of importance the recruitment process has been given, and rightfully so, over the last several years.

84 Chapter 4: Staffing Plan and Issues Affecting Recruitment of Engineering Employees
Staffing
The recruitment office has six recruiters housed in different WSDOT districts in the State. The recruiters are responsible for guiding the hiring process and work closely with managers to provide the best fit for the job being sought. At the writing of this report, the recruitment office is down three recruiters, but is planning on hiring two in the next month and a third by the end of the year. This type of turnover makes it difficult to maintain a consistent recruitment program. The hiring of a manager for “Talent Acquisitions” earlier this year is helping to provide a focus for future recruitment efforts.
Recruitment Systems
Currently WSDOT uses NEOGOV to accept and track applications. Recruiters noted that this system is antiquated and makes for a less-than-ideal candidate experience and a less efficient recruitment process. The NEOGOV system does not provide a search function to allow for examination of key metrics regarding applicants – demographic characteristics, years of experience, etc. Recruiters cannot search past applicants who weren’t selected in one recruitment, for sourcing for other positions; these applicants might be better fits for new positions, but staff is unable to easily locate and reach out to them when a new position comes open.
If a position is not filled, recruiters have to repost the position and an applicant has to repeat the entire application process over again; this includes uploading their cover letter, submitting personal information, and answering qualifying questions. In total, recruiters report that this causes frustration for both recruitment staff and applicants and has the potential to turn off some highly-qualified applicants from WSDOT.
OUTREACH AND MARKETING
The current process used by WSDOT is more of a hiring process than a recruitment process. Recruiters post a job identified as needed and then hope that they get the right applicant(s) to fill the job. An element missing from the process is the early identification of need and the targeted recruitment of potential applicants long before the job is available. This is especially applicable with difficult-to-fill positions such as hydrologist. Typically, advertising for the engineering positions are posted on one or more of the following websites:
monster.com careerbuilder.com ACE SWE (Society of Women Engineers) engineering.com indeed.com State of Washington website

85 Chapter 4: Staffing Plan and Issues Affecting Recruitment of Engineering Employees
LinkedIn.com Facebook.com twitter.com other specific engineering sites
For difficult to fill positions WSDOT recruiters would prefer to conduct direct sourcing techniques—such as outreach to qualified potential personnel not actively in the job market, but due to limited resources they do not currently have the capability to actively source passive candidates at this time. Other marketing techniques used in the past that should be reconsidered include:
Recruiter relationships with civil engineering departments at colleges and universities. These relationships can lead to identifying an intern pool as well as entry-level employees just out of college. WSDOT actively recruited in colleges and universities before the recent recession, but did not maintain these relationships during the reduction in force that occurred between 2009 and 2013.
Employee referral programs are often used to identify potential applicants who may be well-suited for work in WSDOT and already have a connection in the agency. Leveraging existing employees to identify future employees expands the reach of the recruiters and adds a personal appeal to the marketing pitch for WSDOT employment.
TRAINING/MENTORING PROGRAMS
WSDOT reestablished an intern program in 2015. The program, which is reported to have been robust in the past, was abandoned during the period of FTE reductions. This program allows current college students an opportunity to work in WSDOT prior to graduating college. If they decide to join WSDOT after graduation, they come with some training and understanding of the agency. Additionally, intern programs allow managers to get to know a potential employee prior to full-time employment. This program also provides an opportunity to market the WSDOT to colleges and universities from where interns are likely to come.
A related program is a mentoring program. These programs allow new, or recent, hires an opportunity to rotate through several divisions and assignments throughout the agency to help build a well-rounded employee and an employee that understands the different components of the agency. This type of program would also allow newer employees to develop a relationship with a senior level mentor to help guide them during the course of their career at WSDOT. The ability to maintain these types of programs is dependent on the ability of the employee to complete discrete work within the time of the rotation—typically six to nine months. If the work load is unbalanced and the ability to provide training is limited, a mentoring program can be difficult to maintain. If they can be maintained they offer an invaluable opportunity to train future leaders within the agency.
86 Chapter 4: Staffing Plan and Issues Affecting Recruitment of Engineering Employees
FINDINGS AND RECOMMENDATIONS Finding #14: Staffing Plan. The staffing plan through 2019 is to maintain current levels of FTE allocations. Management is in the process of determining how to staff future projects, and is likely to utilize some mixture of WSDOT staff and consultants; however, that mix is not yet determined.
Recommendation 14.1. WSDOT management needs to develop a plan for how they are going to staff projects to be constructed under the new construction funding bill. Once a plan is in place, WSDOT can develop an implementation strategy that will help guide training and recruitment programs.
Recommendation 14.2. There should be regular and scheduled meetings between top WSDOT staff and recruitment staff to help identify staffing needs as early as possible. This provides the opportunity to be more proactive in the hiring process, identifying and marketing to potential applicants ahead of actual job openings. This cannot be done without a detailed staffing plan and direction for future hiring needs.
Finding #15: Recruitment Plan. An ongoing dialogue between WSDOT managers and the recruiting office has not been established. Currently, the recruitment office works on a reactive rather than proactive basis, as they don’t know future recruitment needs. WSDOT HR is working on establishing these connections and developing a detailed hiring plan for the engineering/technical positions.
Recommendation 15.1. WSDOT HR and other senior management should create a proactive recruitment plan in tandem with identification of staffing needs and a formal staffing plan. This recruitment plan should be revisited periodically to ensure that recruitment efforts are effective and meeting staffing needs.
Recommendation 15.2. WSDOT HR should evaluate its use of NEOGOV to ensure use of full functionality of the system to recruit, track, and provide statistics on applicants. WSDOT should work with the Department of Enterprise Services and Washington Technology Solutions to determine if enhancements can be made to NEOGOV to provide search methods effective for sourcing candidates.
Recommendation 15.3. WSDOT HR should consider developing a method to track candidates from previous recruitment and outreach efforts to allow for efficient sourcing of candidates for future vacancies. This would maximize sourcing efforts and provide an additional resource for recruiters and HR professionals to quickly identify potential candidates.
Finding #16: Training. There is a need for training of new employees that will be difficult to meet. The reduction in allocated positions over the last several years affected lower-tenured employees the most. WSDOT has fewer trained lower-level employees and a looming retirement bubble that will further drain experienced engineers out of the workforce.

87 Chapter 4: Staffing Plan and Issues Affecting Recruitment of Engineering Employees
Recommendation 16.1. Using existing vacant FTE positions to bring on new hires as early as possible for training from more experienced staff that is likely to be leaving the agency. This allows the agency to train new hires in an unrushed fashion.
Recommendation 16.2. As training needs intensify with increased new hires and decreased staff at the higher levels, WSDOT should recruit qualified retirees who can help provide training on an ad hoc basis as retired annuitants. This will allow training to occur on a focused basis by someone who understands the job but is not burdened by other project or administrative duties.
Finding #17: Proactive Recruitment. The current recruitment process is reactive to immediate needs identified by managers and approved for hiring. The technical nature of many of the WSDOT jobs requires the early identification of potential applicants with training and interest in civil engineering, transportation engineering, and related fields. A portion of each recruiter’s time should be spent being proactive in developing relationships for future hiring needs.
Recommendation 17.1. WSDOT recruiters should reestablish ties with college engineering programs throughout the State and in nearby states.
Recommendation 17.2. WSDOT should seek to build a robust internship program with the goal of this program feeding into entry-level engineering positions. This will provide the backfill needed for upper-level positions as retirements increase in the coming years.
Finding #18: Specialized Hiring. The WSDOT has had difficulty identifying and hiring specialized technical positions that are critical to the mission of the agency, such as hydrologists, geotechnical, and traffic engineers. This difficulty is largely due to the low pay associated with these positions in the broader job classifications utilized by WSDOT.
Recommendation 18.1. Provide compensation incentives for most difficult to hire positions, such as hydrologist or other specialized positions, that have far lower compensation than comparative agencies. In areas where the WSDOT is already significantly below market, it may be most cost effective for the agency to target specialty pay for critical positions that are difficult to hire. This is highlighted by the fact that the broad job classifications used by WSDOT most likely lead to disparities in comparative pay that do not show up in pay comparisons.
88 Conclusion
Conclusion WSDOT performs critical work throughout the State in providing safe and efficient transportation systems. These systems are designed, built, and maintained by the nearly 7,000 employees that work for WSDOT. A critical component of that workforce are the over 1,300 engineers and technical employees that perform or oversee the majority of technical duties required to carry out this mission.
As WSDOT moves from a mode of reducing staff and doing their best to maintain existing systems, to managing a $16 billion construction program over the next decade and a half, the engineer and technical jobs will become vital to carrying this out. WSDOT has moved from a forced reduction of 800 staff throughout the agency to a need to maintain current staffing allocations with quality employees. At the same time, the agency is responsible for implementing a $16 billion construction program through a combination of in-house and contract work.
As WSDOT moves forward in implementing the construction projects, they must decide how they plan to staff this work. Those decisions will drive issues related to who the agency needs to hire over the next three years and how the agency wants to position itself in the labor market for many years to come.
Under any circumstance, three changes are needed. Ideally, these changes would be made simultaneously:
1. Compensation for engineering and technical workers is significantly under market on most classifications. This disparity must be addressed in the near future. This can be done through a combination of across-the-board increases to base salary, targeted specialty pay for difficult-to-hire positions, geographic pay, or a combination of these types of compensation increases.
2. Management needs to develop a service-delivery plan for the recently-
approved construction program to determine how much of the upcoming design and construction management work will be done in-house and how much will be contracted out. This will drive hiring needs not so much in how many to hire, but more what skillset to hire
3. Recruitment processes need to utilize more proactive methods to find and
attract qualified candidates for essential engineering and technical positions. This could include re-establishing relationships with engineering departments in colleges and universities statewide and expanding the recently-revived internship program to provide necessary backfill for more senior employees who might depart the agency in coming years. These methods are likely to work better for entry-level employees. Experienced engineers are unlikely to come to WSDOT without adjustments in compensation first.

89 Appendices
Appendices Appendix A: PFM Survey Administered to Former WSDOT Employees in Benchmark Classes
1. How many years did you serve as a WSDOT Employee?
0-5 6-10 11-15 15+
2. Please select your current employer
Local Government State Government Federal Government Non-governmental organization Unemployed Self-Employed Private Sector
3. What were your primary reasons for leaving WSDOT? [Please rate the importance of each factor below]
Relocation out of state State work not conducive to family life Lack of promotional opportunities at WSDOT Wanted out of government sector work Better benefits Not feeling valued by the Department Lack of certainty about the future of WSDOT Not feeling respected by coworkers Wanted to work on a wider array of projects Personal issue Better pay WSDOT management Lack of sufficient training at WSDOT Other (please specify)

90 Appendices
4. Since leaving WSDOT, my monthly take-home pay has:
Increased by 0-5% Increased by 6-14% Increased by 15-24% Increased by 25% or more Decreased
5. While working for WSDOT I was ____ with the variety of work I was asked to perform (Please fill in the blank with the word that best fits)
Very Satisfied Satisfied Not Satisfied Very Unsatisfied Other (please specify)
6. While working for WSDOT I was ____ with the opportunities for promotion (Please fill in the blank with the word that best fits)
Very Satisfied Satisfied Not Satisfied Very Unsatisfied Other (please specify)
7. Since leaving WSDOT, I am:
Happier Less Happy No Change
8. Since leaving WSDOT my benefits are:
Better No Different Worse
9. What I miss most about WSDOT is (Please rank using 1 as what you miss the most and 5 as what you miss the least):
Government service Ability to control my workload Employment benefits of the WSDOT Co-Workers Salary Flexible Work Hours Other (please specify)

91 Appendices
10. What I like most about my new job is (Check all that apply):
Type of work Management structure Ability to do a variety of exciting projects Increased pay Improved benefits Ability to promote Other (please specify)
11. I encourage people to consider WSDOT as a career:
Yes No Other (please specify)
12. If you answered “No” to question 11, please describe why you would not encourage people to consider WSDOT as a career: 13. Would you consider returning to WSDOT if your reasons for leaving were resolved?
Yes No Maybe
14. (Optional) I would be willing to talk to someone from the PFM consulting team in confidence about my experience as a WSDOT employee (please list your name and contact information): 15. Please enter how many years of work experience you had when you joined WSDOT:
Less than 1 1-5 6-10 11-15 16-20 20-25 25+

92 Appendices
16. Please enter how many years of work experience you had when you left WSDOT: Less than 1 1-5 6-10 11-15 16-20 20-25 25+
17. Please select your gender: Male Female Other
18. Which race/ethnicity best describes you? (Please choose only one) American Indian or Alaskan Native Asian / Pacific Islander Black or African American Hispanic White Caucasian Multiple ethnicity / Other (please specify)
19. What was your highest level of educational attainment while working for WSDOT:
Graduated from high school 1 year of college 2 years of college 3 years of college Graduated from college Some graduate school Completed graduate school
20. Please provide your current job title: [open answer] 21. Please provide your last job title while working for WSDOT: [open answer]
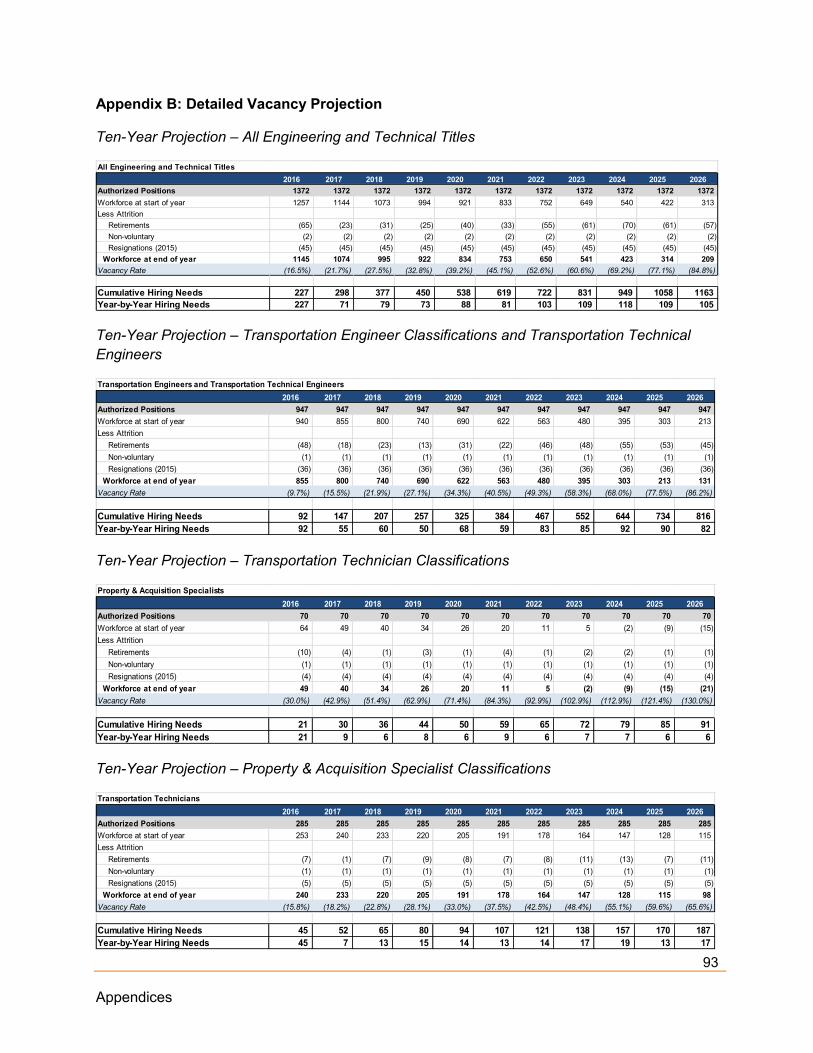
93 Appendices
Appendix B: Detailed Vacancy Projection
Ten-Year Projection – All Engineering and Technical Titles
Ten-Year Projection – Transportation Engineer Classifications and Transportation Technical Engineers
Ten-Year Projection – Transportation Technician Classifications
Ten-Year Projection – Property & Acquisition Specialist Classifications
2016 2017 2018 2019 2020 2021 2022 2023 2024 2025 2026Authorized Positions 1372 1372 1372 1372 1372 1372 1372 1372 1372 1372 1372Workforce at start of year 1257 1144 1073 994 921 833 752 649 540 422 313Less Attrition
Retirements (65) (23) (31) (25) (40) (33) (55) (61) (70) (61) (57)Non-voluntary (2) (2) (2) (2) (2) (2) (2) (2) (2) (2) (2)Resignations (2015) (45) (45) (45) (45) (45) (45) (45) (45) (45) (45) (45)
Workforce at end of year 1145 1074 995 922 834 753 650 541 423 314 209Vacancy Rate (16.5%) (21.7%) (27.5%) (32.8%) (39.2%) (45.1%) (52.6%) (60.6%) (69.2%) (77.1%) (84.8%)
Cumulative Hiring Needs 227 298 377 450 538 619 722 831 949 1058 1163Year-by-Year Hiring Needs 227 71 79 73 88 81 103 109 118 109 105
All Engineering and Technical Titles
2016 2017 2018 2019 2020 2021 2022 2023 2024 2025 2026Authorized Positions 947 947 947 947 947 947 947 947 947 947 947Workforce at start of year 940 855 800 740 690 622 563 480 395 303 213Less Attrition
Retirements (48) (18) (23) (13) (31) (22) (46) (48) (55) (53) (45)Non-voluntary (1) (1) (1) (1) (1) (1) (1) (1) (1) (1) (1)Resignations (2015) (36) (36) (36) (36) (36) (36) (36) (36) (36) (36) (36)
Workforce at end of year 855 800 740 690 622 563 480 395 303 213 131Vacancy Rate (9.7%) (15.5%) (21.9%) (27.1%) (34.3%) (40.5%) (49.3%) (58.3%) (68.0%) (77.5%) (86.2%)
Cumulative Hiring Needs 92 147 207 257 325 384 467 552 644 734 816Year-by-Year Hiring Needs 92 55 60 50 68 59 83 85 92 90 82
Transportation Engineers and Transportation Technical Engineers
2016 2017 2018 2019 2020 2021 2022 2023 2024 2025 2026Authorized Positions 70 70 70 70 70 70 70 70 70 70 70Workforce at start of year 64 49 40 34 26 20 11 5 (2) (9) (15)Less Attrition
Retirements (10) (4) (1) (3) (1) (4) (1) (2) (2) (1) (1)Non-voluntary (1) (1) (1) (1) (1) (1) (1) (1) (1) (1) (1)Resignations (2015) (4) (4) (4) (4) (4) (4) (4) (4) (4) (4) (4)
Workforce at end of year 49 40 34 26 20 11 5 (2) (9) (15) (21)Vacancy Rate (30.0%) (42.9%) (51.4%) (62.9%) (71.4%) (84.3%) (92.9%) (102.9%) (112.9%) (121.4%) (130.0%)
Cumulative Hiring Needs 21 30 36 44 50 59 65 72 79 85 91Year-by-Year Hiring Needs 21 9 6 8 6 9 6 7 7 6 6
Property & Acquisition Specialists
2016 2017 2018 2019 2020 2021 2022 2023 2024 2025 2026Authorized Positions 285 285 285 285 285 285 285 285 285 285 285Workforce at start of year 253 240 233 220 205 191 178 164 147 128 115Less Attrition
Retirements (7) (1) (7) (9) (8) (7) (8) (11) (13) (7) (11)Non-voluntary (1) (1) (1) (1) (1) (1) (1) (1) (1) (1) (1)Resignations (2015) (5) (5) (5) (5) (5) (5) (5) (5) (5) (5) (5)
Workforce at end of year 240 233 220 205 191 178 164 147 128 115 98Vacancy Rate (15.8%) (18.2%) (22.8%) (28.1%) (33.0%) (37.5%) (42.5%) (48.4%) (55.1%) (59.6%) (65.6%)
Cumulative Hiring Needs 45 52 65 80 94 107 121 138 157 170 187Year-by-Year Hiring Needs 45 7 13 15 14 13 14 17 19 13 17
Transportation Technicians
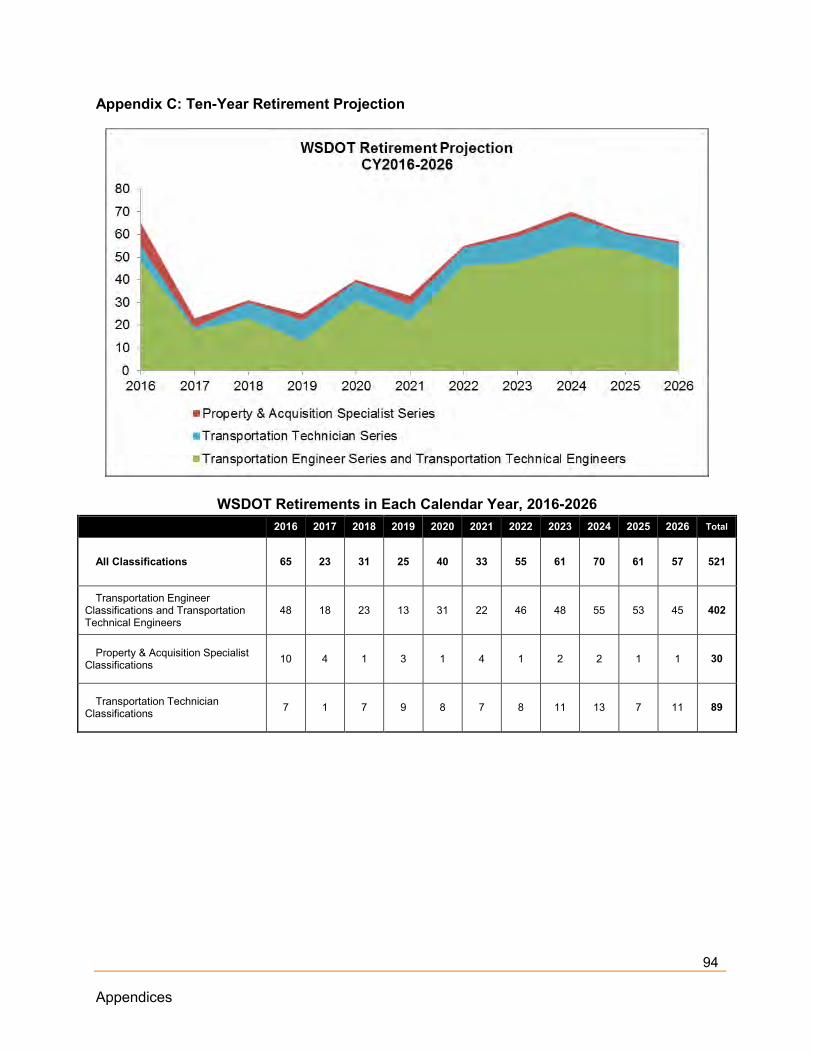
94 Appendices
Appendix C: Ten-Year Retirement Projection
WSDOT Retirements in Each Calendar Year, 2016-2026 2016 2017 2018 2019 2020 2021 2022 2023 2024 2025 2026 Total
All Classifications 65 23 31 25 40 33 55 61 70 61 57 521
Transportation Engineer Classifications and Transportation Technical Engineers
48 18 23 13 31 22 46 48 55 53 45 402
Property & Acquisition Specialist Classifications 10 4 1 3 1 4 1 2 2 1 1 30
Transportation Technician Classifications 7 1 7 9 8 7 8 11 13 7 11 89
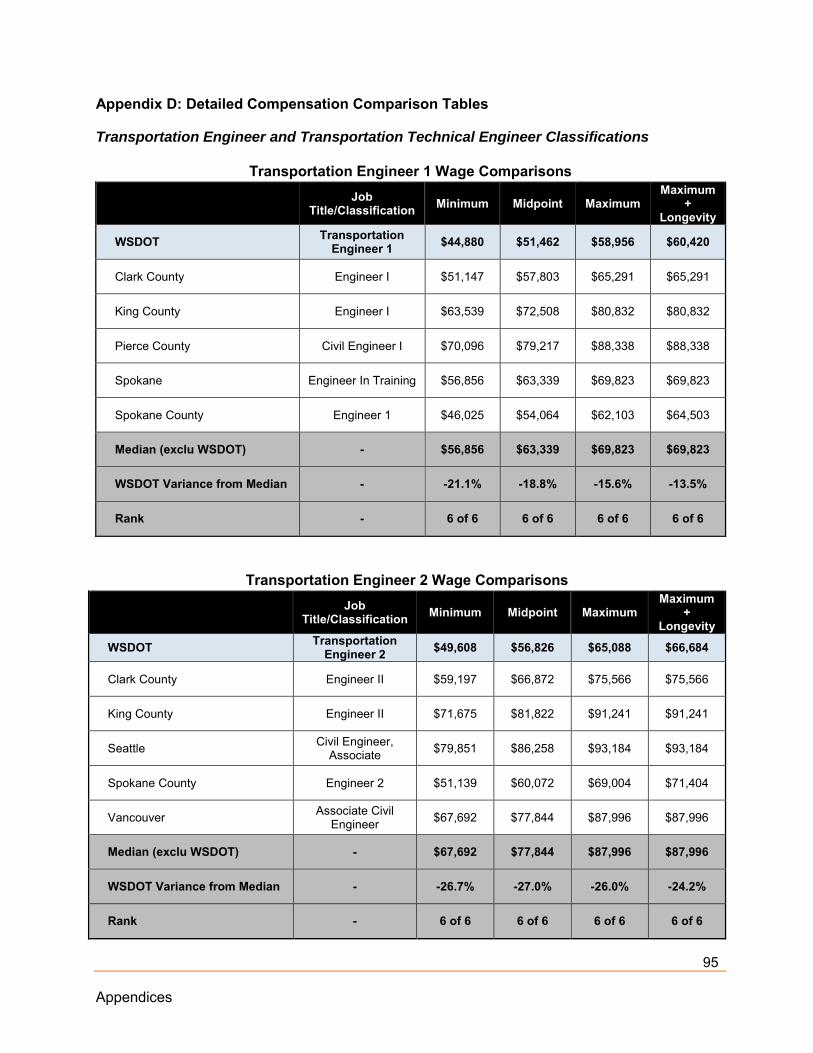
95 Appendices
Appendix D: Detailed Compensation Comparison Tables
Transportation Engineer and Transportation Technical Engineer Classifications
Transportation Engineer 1 Wage Comparisons
Job Title/Classification Minimum Midpoint Maximum
Maximum +
Longevity
WSDOT Transportation Engineer 1 $44,880 $51,462 $58,956 $60,420
Clark County Engineer I $51,147 $57,803 $65,291 $65,291
King County Engineer I $63,539 $72,508 $80,832 $80,832
Pierce County Civil Engineer I $70,096 $79,217 $88,338 $88,338
Spokane Engineer In Training $56,856 $63,339 $69,823 $69,823
Spokane County Engineer 1 $46,025 $54,064 $62,103 $64,503
Median (exclu WSDOT) - $56,856 $63,339 $69,823 $69,823
WSDOT Variance from Median - -21.1% -18.8% -15.6% -13.5%
Rank - 6 of 6 6 of 6 6 of 6 6 of 6
Transportation Engineer 2 Wage Comparisons
Job Title/Classification Minimum Midpoint Maximum
Maximum +
Longevity
WSDOT Transportation Engineer 2 $49,608 $56,826 $65,088 $66,684
Clark County Engineer II $59,197 $66,872 $75,566 $75,566
King County Engineer II $71,675 $81,822 $91,241 $91,241
Seattle Civil Engineer, Associate $79,851 $86,258 $93,184 $93,184
Spokane County Engineer 2 $51,139 $60,072 $69,004 $71,404
Vancouver Associate Civil Engineer $67,692 $77,844 $87,996 $87,996
Median (exclu WSDOT) - $67,692 $77,844 $87,996 $87,996
WSDOT Variance from Median - -26.7% -27.0% -26.0% -24.2%
Rank - 6 of 6 6 of 6 6 of 6 6 of 6

96 Appendices
Transportation Engineer 3 Wage Comparisons
Job Title/Classification Minimum Midpoint Maximum
Maximum +
Longevity
WSDOT Transportation Engineer 3 $54,744 $62,700 $71,844 $73,644
Clark County Engineer II $59,197 $66,872 $75,566 $75,566
King County Engineer III $80,881 $92,352 $102,289 $102,289
Pierce County Civil Engineer 2 $79,165 $89,690 $100,214 $100,214
Sound Transit Civil Engineer $68,784 $103,177 $123,812 $123,812
Spokane Associate Traffic Engineer $65,897 $73,518 $81,140 $81,140
Spokane County Engineer 3 $63,135 $74,164 $85,193 $87,593
Median (exclu WSDOT) - $67,341 $81,927 $92,703 $93,903
WSDOT Variance from Median - -18.7% -23.5% -22.5% -21.6%
Rank - 7 of 7 7 of 7 7 of 7 7 of 7
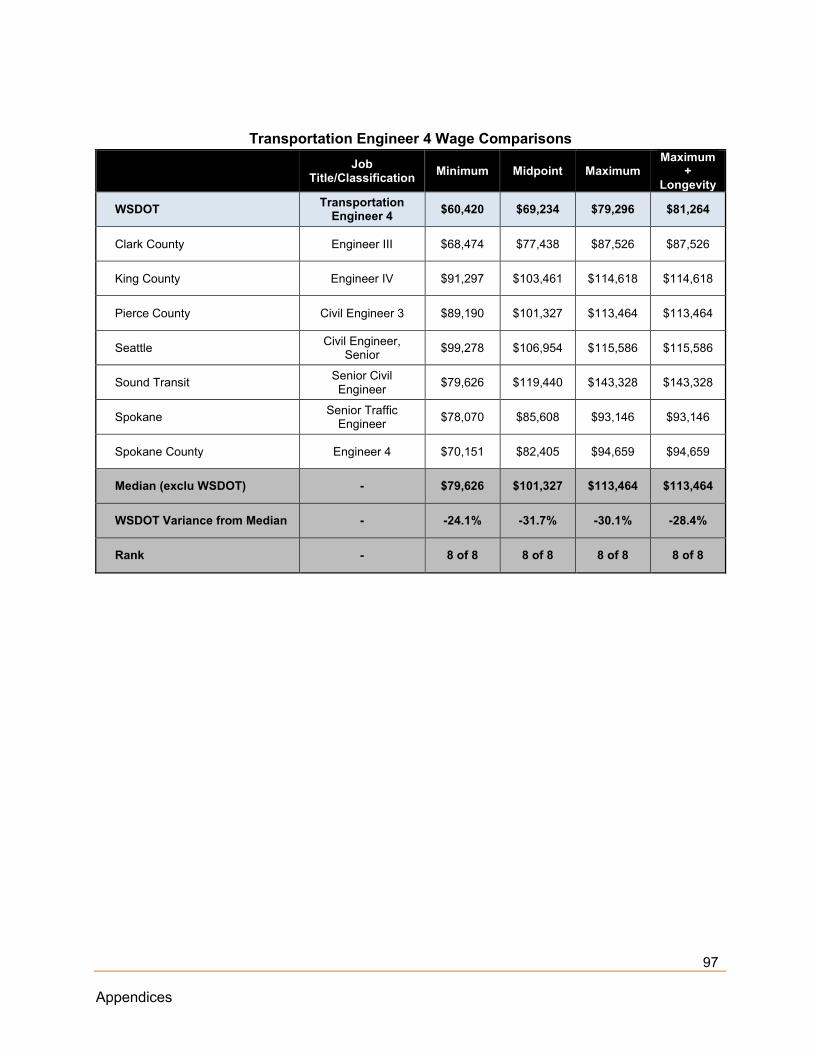
97 Appendices
Transportation Engineer 4 Wage Comparisons
Job Title/Classification Minimum Midpoint Maximum
Maximum +
Longevity
WSDOT Transportation Engineer 4 $60,420 $69,234 $79,296 $81,264
Clark County Engineer III $68,474 $77,438 $87,526 $87,526
King County Engineer IV $91,297 $103,461 $114,618 $114,618
Pierce County Civil Engineer 3 $89,190 $101,327 $113,464 $113,464
Seattle Civil Engineer, Senior $99,278 $106,954 $115,586 $115,586
Sound Transit Senior Civil Engineer $79,626 $119,440 $143,328 $143,328
Spokane Senior Traffic Engineer $78,070 $85,608 $93,146 $93,146
Spokane County Engineer 4 $70,151 $82,405 $94,659 $94,659
Median (exclu WSDOT) - $79,626 $101,327 $113,464 $113,464
WSDOT Variance from Median - -24.1% -31.7% -30.1% -28.4%
Rank - 8 of 8 8 of 8 8 of 8 8 of 8
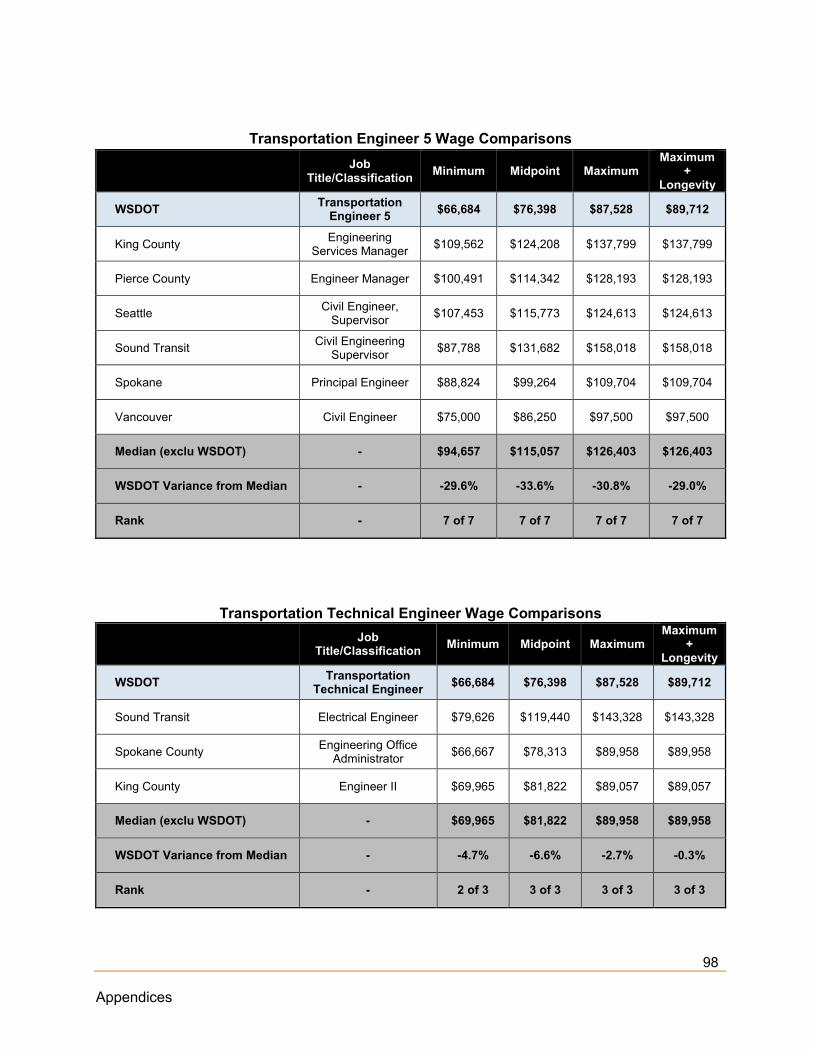
98 Appendices
Transportation Engineer 5 Wage Comparisons
Job Title/Classification Minimum Midpoint Maximum
Maximum +
Longevity
WSDOT Transportation Engineer 5 $66,684 $76,398 $87,528 $89,712
King County Engineering Services Manager $109,562 $124,208 $137,799 $137,799
Pierce County Engineer Manager $100,491 $114,342 $128,193 $128,193
Seattle Civil Engineer, Supervisor $107,453 $115,773 $124,613 $124,613
Sound Transit Civil Engineering Supervisor $87,788 $131,682 $158,018 $158,018
Spokane Principal Engineer $88,824 $99,264 $109,704 $109,704
Vancouver Civil Engineer $75,000 $86,250 $97,500 $97,500
Median (exclu WSDOT) - $94,657 $115,057 $126,403 $126,403
WSDOT Variance from Median - -29.6% -33.6% -30.8% -29.0%
Rank - 7 of 7 7 of 7 7 of 7 7 of 7
Transportation Technical Engineer Wage Comparisons
Job Title/Classification Minimum Midpoint Maximum
Maximum +
Longevity
WSDOT Transportation Technical Engineer $66,684 $76,398 $87,528 $89,712
Sound Transit Electrical Engineer $79,626 $119,440 $143,328 $143,328
Spokane County Engineering Office Administrator $66,667 $78,313 $89,958 $89,958
King County Engineer II $69,965 $81,822 $89,057 $89,057
Median (exclu WSDOT) - $69,965 $81,822 $89,958 $89,958
WSDOT Variance from Median - -4.7% -6.6% -2.7% -0.3%
Rank - 2 of 3 3 of 3 3 of 3 3 of 3

99 Appendices
Transportation Technician Classifications
Transportation Technician 1 Wage Comparisons
Job Title/Classification Minimum Midpoint Maximum
Maximum +
Longevity
WSDOT Transportation Technician 1 $34,476 $39,228 $44,880 $46,056
Clark County Engineering Technician Assistant
$44,221 $49,920 $56,410 $56,410
King County Engineering Technician I $48,811 $55,647 $61,993 $61,993
Pierce County Engineering Technician 1 $48,901 $51,927 $54,954 $54,954
Spokane [1] Engineering Technician 1 $34,870 $42,480 $50,091 $50,822
Spokane County Engineering Technician 1 $34,296 $40,287 $46,278 $48,678
Median (exclu WSDOT) - $44,221 $49,920 $54,954 $54,954
WSDOT Variance from Median - -22.0% -21.4% -18.3% -16.2%
Rank - 5 of 6 6 of 6 6 of 6 6 of 6
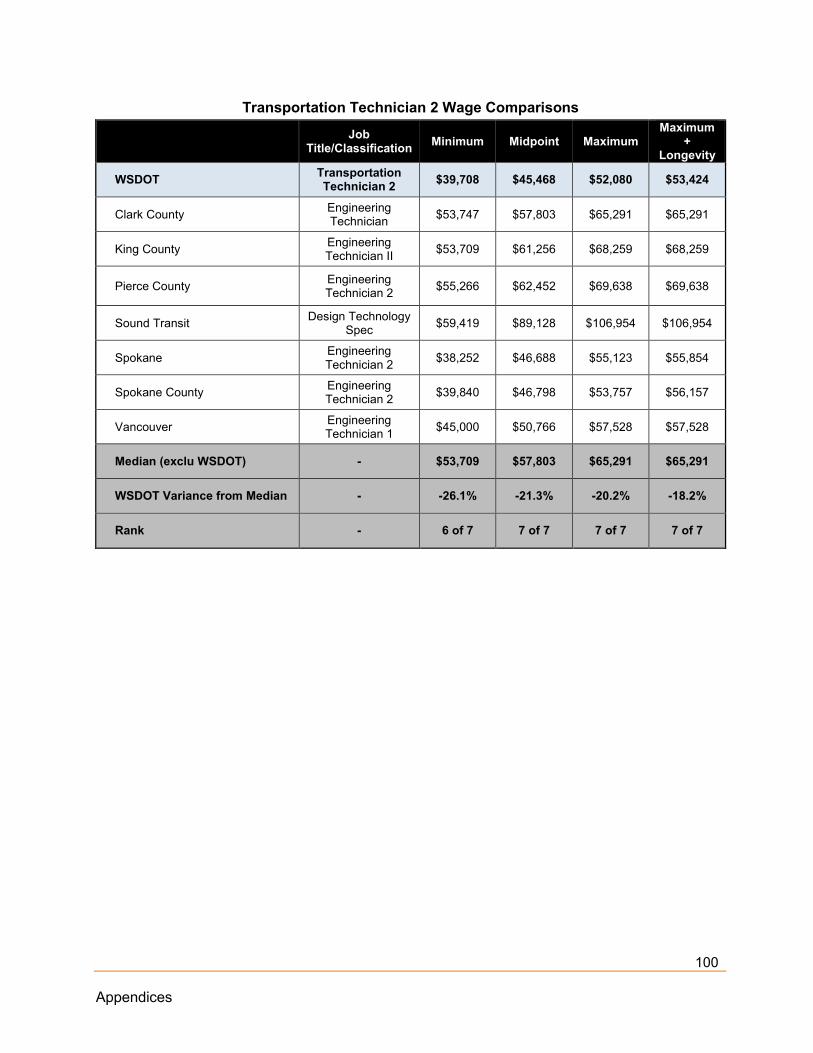
100 Appendices
Transportation Technician 2 Wage Comparisons
Job Title/Classification Minimum Midpoint Maximum
Maximum +
Longevity
WSDOT Transportation Technician 2 $39,708 $45,468 $52,080 $53,424
Clark County Engineering Technician $53,747 $57,803 $65,291 $65,291
King County Engineering Technician II $53,709 $61,256 $68,259 $68,259
Pierce County Engineering Technician 2 $55,266 $62,452 $69,638 $69,638
Sound Transit Design Technology Spec $59,419 $89,128 $106,954 $106,954
Spokane Engineering Technician 2 $38,252 $46,688 $55,123 $55,854
Spokane County Engineering Technician 2 $39,840 $46,798 $53,757 $56,157
Vancouver Engineering Technician 1 $45,000 $50,766 $57,528 $57,528
Median (exclu WSDOT) - $53,709 $57,803 $65,291 $65,291
WSDOT Variance from Median - -26.1% -21.3% -20.2% -18.2%
Rank - 6 of 7 7 of 7 7 of 7 7 of 7

101 Appendices
Transportation Technician 3 Wage Comparisons
Job Title/Classification Minimum Midpoint Maximum
Maximum +
Longevity
WSDOT Transportation Technician 3 $44,880 $51,462 $58,956 $60,420
Clark County Engineering Technician Senior $59,197 $66,872 $75,566 $75,566
Pierce County Engineering Technician 3 $66,123 $75,098 $84,074 $84,074
Sound Transit Senior Design
Technology Specialist
$65,509 $98,263 $117,916 $117,916
Spokane Field Engineer $65,897 $73,518 $81,140 $81,140
Spokane County Engineering Technician 3 $45,590 $53,553 $61,517 $63,917
Median (exclu WSDOT) - $65,509 $73,518 $81,140 $81,140
WSDOT Variance from Median - -31.5% -30.0% -27.3% -25.5%
Rank - 6 of 6 6 of 6 6 of 6 6 of 6

102 Appendices
Property & Acquisition Specialist Classifications
Property & Acquisition Specialist 1 Wage Comparisons
Job Title/Classification Minimum Midpoint Maximum
Maximum +
Longevity
WSDOT Property & Acquisition Specialist 1
$34,476 $39,228 $44,880 $46,056
Clark County Real Property Agent I $46,363 $52,416 $60,320 $60,320
King County Real Property Agent I $59,117 $67,446 $75,176 $75,176
Pierce County Right of Way Agent 1 $62,358 $70,699 $79,040 $79,040
Spokane County Residential Appraiser Trainee $25,290 $29,708 $34,125 $36,525
Median (exclu WSDOT) - $52,740 $59,931 $67,748 $67,748
WSDOT Variance from Median - -34.6% -34.5% -33.8% -32.0%
Rank - 4 of 5 4 of 5 4 of 5 4 of 5
Property & Acquisition Specialist 2 Wage Comparisons
Job Title/Classification Minimum Midpoint Maximum
Maximum +
Longevity
WSDOT Property & Acquisition Specialist 2
$40,704 $46,632 $53,424 $54,744
Clark County Real Property Agent II $53,747 $60,674 $68,474 $68,474
King County Real Property Agent II $65,087 $74,279 $82,813 $82,813
Pierce County Right of Way 2 $70,138 $79,882 $89,627 $89,627
Seattle Real Property Agent $72,010 $77,792 $84,198 $84,198
Spokane County Residential Appraiser $34,814 $40,895 $46,977 $49,377
Median (exclu WSDOT) - $65,087 $74,279 $82,813 $82,813
WSDOT Variance from Median - -37.5% -37.2% -35.5% -33.9%
Rank - 5 of 6 5 of 6 5 of 6 5 of 6

103 Appendices
Property & Acquisition Specialist 3 Wage Comparisons
Job Title/Classification Minimum Midpoint Maximum
Maximum +
Longevity
WSDOT Property & Acquisition Specialist 3
$46,056 $52,752 $60,420 $61,920
Clark County Real Property Agent III $59,197 $66,872 $75,566 $75,566
King County Real Property Agent III $75,220 $85,883 $95,590 $95,590
Pierce County Right of Way Agent 2 $70,138 $79,882 $89,627 $89,627
Seattle Real Property Agent, Senior $85,717 $92,685 $99,986 $99,986
Sound Transit Real Property Coordinator $51,328 $76,992 $92,390 $92,390
Spokane County Residential Property Appraiser Supervisor $38,471 $38,471 $51,911 $54,311
Median (exclu WSDOT) - $64,667 $78,437 $91,009 $91,009
WSDOT Variance from Median - -28.8% -32.7% -33.6% -32.0%
Rank - 6 of 7 6 of 7 6 of 7 6 of 7
Property & Acquisition Specialist 4 Wage Comparisons
Job Title/Classification Minimum Midpoint Maximum
Maximum +
Longevity
WSDOT Property & Acquisition Specialist 4
$49,608 $56,826 $65,088 $66,684
King County Real Property Agent IV $86,974 $98,884 $109,502 $109,502
Pierce County Appraiser 2 $61,069 $69,233 $77,397 $77,397
Pierce County Real Property Management Specialist 1
$62,358 $70,699 $79,040 $79,040
Sound Transit Real Property Agent $65,509 $98,263 $117,916 $117,916
Median (exclu WSDOT) - $63,934 $84,481 $94,271 $94,271
WSDOT Variance from Median - -22.4% -32.7% -31.0% -29.3%
Rank - 5 of 5 5 of 5 5 of 5 5 of 5
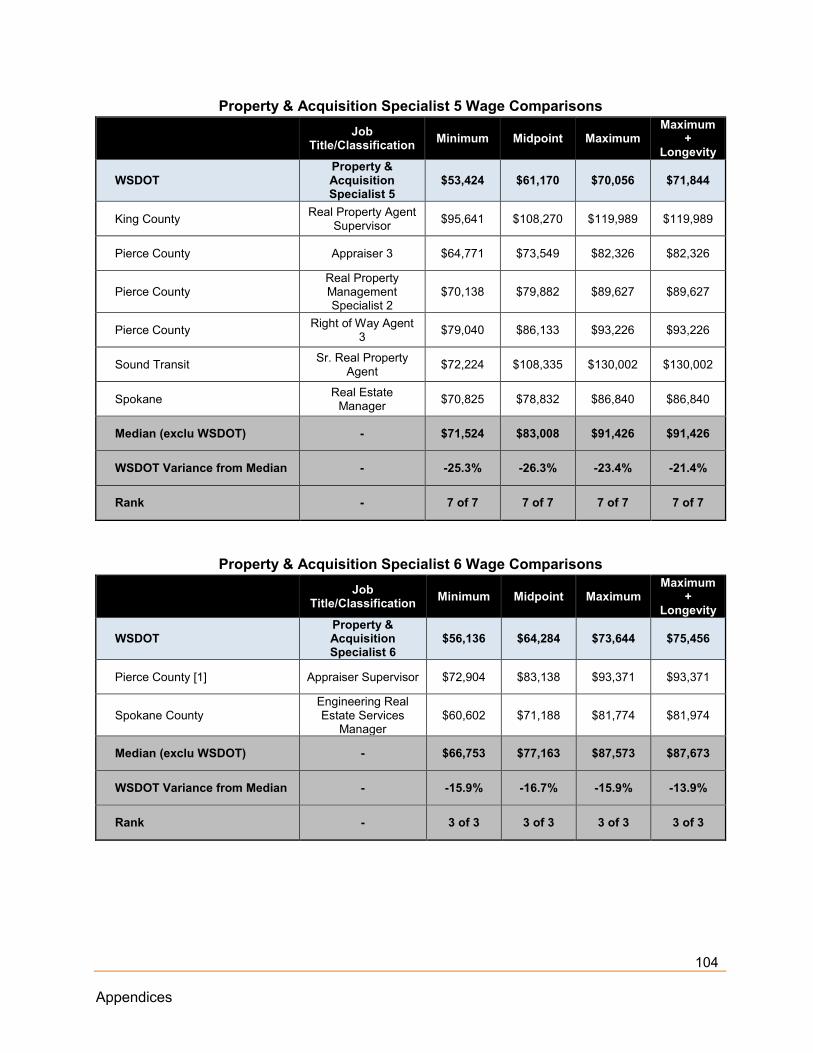
104 Appendices
Property & Acquisition Specialist 5 Wage Comparisons
Job Title/Classification Minimum Midpoint Maximum
Maximum +
Longevity
WSDOT Property & Acquisition Specialist 5
$53,424 $61,170 $70,056 $71,844
King County Real Property Agent Supervisor $95,641 $108,270 $119,989 $119,989
Pierce County Appraiser 3 $64,771 $73,549 $82,326 $82,326
Pierce County Real Property Management Specialist 2
$70,138 $79,882 $89,627 $89,627
Pierce County Right of Way Agent 3 $79,040 $86,133 $93,226 $93,226
Sound Transit Sr. Real Property Agent $72,224 $108,335 $130,002 $130,002
Spokane Real Estate Manager $70,825 $78,832 $86,840 $86,840
Median (exclu WSDOT) - $71,524 $83,008 $91,426 $91,426
WSDOT Variance from Median - -25.3% -26.3% -23.4% -21.4%
Rank - 7 of 7 7 of 7 7 of 7 7 of 7
Property & Acquisition Specialist 6 Wage Comparisons
Job Title/Classification Minimum Midpoint Maximum
Maximum +
Longevity
WSDOT Property & Acquisition Specialist 6
$56,136 $64,284 $73,644 $75,456
Pierce County [1] Appraiser Supervisor $72,904 $83,138 $93,371 $93,371
Spokane County Engineering Real Estate Services
Manager $60,602 $71,188 $81,774 $81,974
Median (exclu WSDOT) - $66,753 $77,163 $87,573 $87,673
WSDOT Variance from Median - -15.9% -16.7% -15.9% -13.9%
Rank - 3 of 3 3 of 3 3 of 3 3 of 3

105 Appendices
Appendix E: ERI Level Definitions
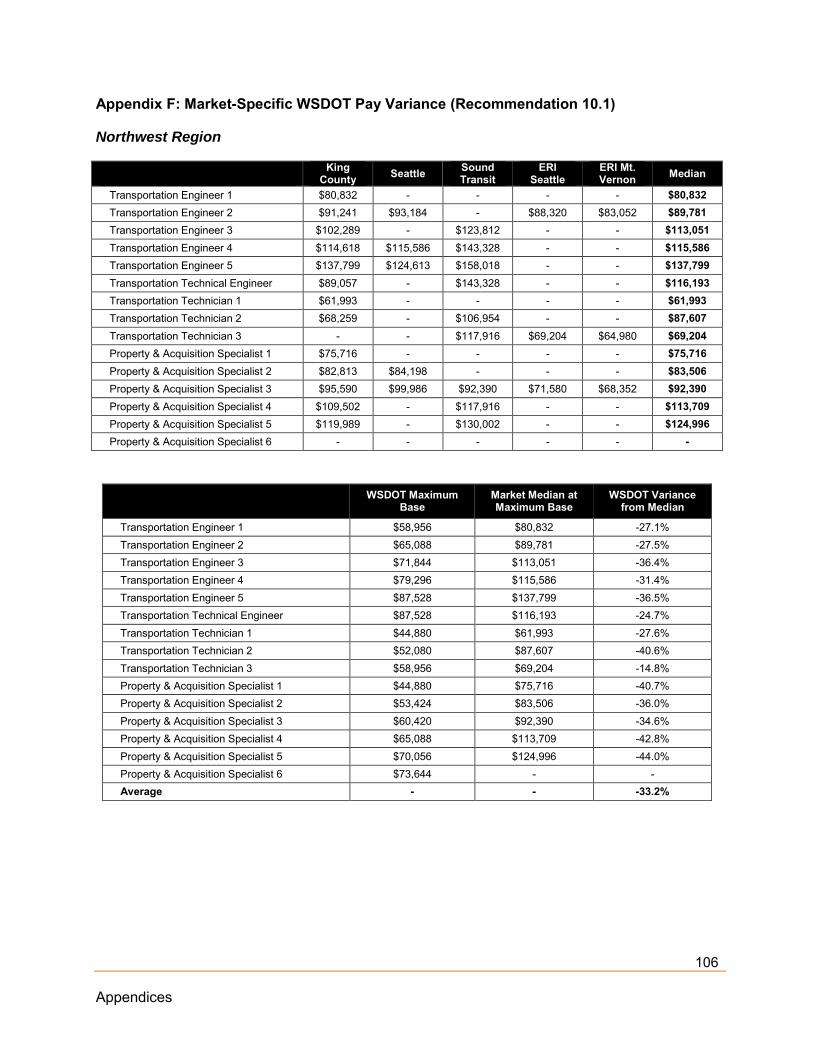
106 Appendices
Appendix F: Market-Specific WSDOT Pay Variance (Recommendation 10.1)
Northwest Region
King
County Seattle Sound Transit
ERI Seattle
ERI Mt. Vernon Median
Transportation Engineer 1 $80,832 - - - - $80,832 Transportation Engineer 2 $91,241 $93,184 - $88,320 $83,052 $89,781 Transportation Engineer 3 $102,289 - $123,812 - - $113,051 Transportation Engineer 4 $114,618 $115,586 $143,328 - - $115,586 Transportation Engineer 5 $137,799 $124,613 $158,018 - - $137,799 Transportation Technical Engineer $89,057 - $143,328 - - $116,193 Transportation Technician 1 $61,993 - - - - $61,993 Transportation Technician 2 $68,259 - $106,954 - - $87,607 Transportation Technician 3 - - $117,916 $69,204 $64,980 $69,204 Property & Acquisition Specialist 1 $75,716 - - - - $75,716 Property & Acquisition Specialist 2 $82,813 $84,198 - - - $83,506 Property & Acquisition Specialist 3 $95,590 $99,986 $92,390 $71,580 $68,352 $92,390 Property & Acquisition Specialist 4 $109,502 - $117,916 - - $113,709 Property & Acquisition Specialist 5 $119,989 - $130,002 - - $124,996 Property & Acquisition Specialist 6 - - - - - -
WSDOT Maximum
Base Market Median at Maximum Base
WSDOT Variance from Median
Transportation Engineer 1 $58,956 $80,832 -27.1% Transportation Engineer 2 $65,088 $89,781 -27.5% Transportation Engineer 3 $71,844 $113,051 -36.4% Transportation Engineer 4 $79,296 $115,586 -31.4% Transportation Engineer 5 $87,528 $137,799 -36.5% Transportation Technical Engineer $87,528 $116,193 -24.7% Transportation Technician 1 $44,880 $61,993 -27.6% Transportation Technician 2 $52,080 $87,607 -40.6% Transportation Technician 3 $58,956 $69,204 -14.8% Property & Acquisition Specialist 1 $44,880 $75,716 -40.7% Property & Acquisition Specialist 2 $53,424 $83,506 -36.0% Property & Acquisition Specialist 3 $60,420 $92,390 -34.6% Property & Acquisition Specialist 4 $65,088 $113,709 -42.8% Property & Acquisition Specialist 5 $70,056 $124,996 -44.0% Property & Acquisition Specialist 6 $73,644 - - Average - - -33.2%
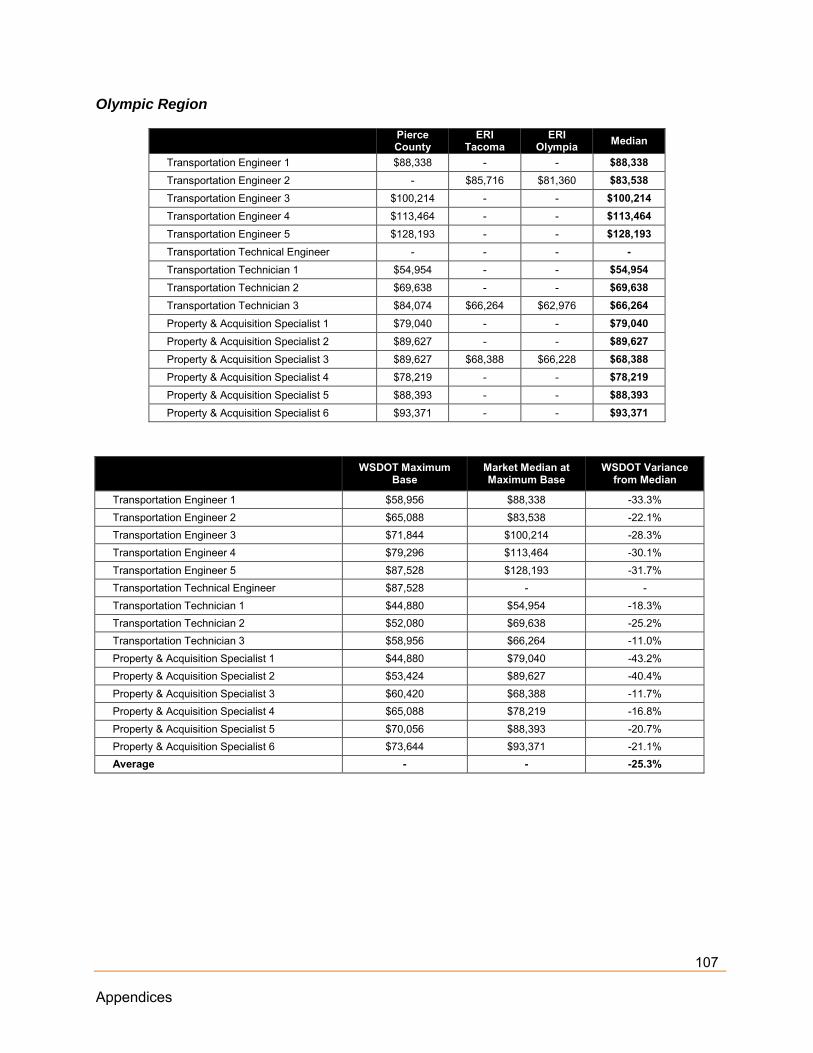
107 Appendices
Olympic Region
Pierce County
ERI Tacoma
ERI Olympia Median
Transportation Engineer 1 $88,338 - - $88,338 Transportation Engineer 2 - $85,716 $81,360 $83,538 Transportation Engineer 3 $100,214 - - $100,214 Transportation Engineer 4 $113,464 - - $113,464 Transportation Engineer 5 $128,193 - - $128,193 Transportation Technical Engineer - - - - Transportation Technician 1 $54,954 - - $54,954 Transportation Technician 2 $69,638 - - $69,638 Transportation Technician 3 $84,074 $66,264 $62,976 $66,264 Property & Acquisition Specialist 1 $79,040 - - $79,040 Property & Acquisition Specialist 2 $89,627 - - $89,627 Property & Acquisition Specialist 3 $89,627 $68,388 $66,228 $68,388 Property & Acquisition Specialist 4 $78,219 - - $78,219 Property & Acquisition Specialist 5 $88,393 - - $88,393 Property & Acquisition Specialist 6 $93,371 - - $93,371
WSDOT Maximum
Base Market Median at Maximum Base
WSDOT Variance from Median
Transportation Engineer 1 $58,956 $88,338 -33.3% Transportation Engineer 2 $65,088 $83,538 -22.1% Transportation Engineer 3 $71,844 $100,214 -28.3% Transportation Engineer 4 $79,296 $113,464 -30.1% Transportation Engineer 5 $87,528 $128,193 -31.7% Transportation Technical Engineer $87,528 - - Transportation Technician 1 $44,880 $54,954 -18.3% Transportation Technician 2 $52,080 $69,638 -25.2% Transportation Technician 3 $58,956 $66,264 -11.0% Property & Acquisition Specialist 1 $44,880 $79,040 -43.2% Property & Acquisition Specialist 2 $53,424 $89,627 -40.4% Property & Acquisition Specialist 3 $60,420 $68,388 -11.7% Property & Acquisition Specialist 4 $65,088 $78,219 -16.8% Property & Acquisition Specialist 5 $70,056 $88,393 -20.7% Property & Acquisition Specialist 6 $73,644 $93,371 -21.1% Average - - -25.3%

108 Appendices
Eastern Region
Spokane County Spokane ERI
Spokane Median
Transportation Engineer 1 $62,103 $69,823 - $65,963
Transportation Engineer 2 $69,004 - $77,712 $73,358
Transportation Engineer 3 $85,193 $81,140 - $83,167
Transportation Engineer 4 $94,659 $93,146 - $93,903
Transportation Engineer 5 - $109,704 - $109,704
Transportation Technical Engineer $89,958 - - $89,958
Transportation Technician 1 $46,278 $50,091 - $48,185
Transportation Technician 2 $53,757 $55,123 - $54,440
Transportation Technician 3 $61,517 $81,140 $59,784 $61,517
Property & Acquisition Specialist 1 $34,125 - - $34,125
Property & Acquisition Specialist 2 $46,977 - - $46,977
Property & Acquisition Specialist 3 $51,911 - $62,916 $57,414
Property & Acquisition Specialist 4 - - - -
Property & Acquisition Specialist 5 - $86,840 - $86,840
Property & Acquisition Specialist 6 $81,774 - - $81,774
WSDOT Maximum
Base Market Median at Maximum Base
WSDOT Variance from Median
Transportation Engineer 1 $58,956 $65,963 -10.6% Transportation Engineer 2 $65,088 $73,358 -11.3% Transportation Engineer 3 $71,844 $83,167 -13.6% Transportation Engineer 4 $79,296 $93,903 -15.6% Transportation Engineer 5 $87,528 $109,704 -20.2% Transportation Technical Engineer $87,528 $89,958 -2.7% Transportation Technician 1 $44,880 $48,185 -6.9% Transportation Technician 2 $52,080 $54,440 -4.3% Transportation Technician 3 $58,956 $61,517 -4.2% Property & Acquisition Specialist 1 $44,880 $34,125 31.5% Property & Acquisition Specialist 2 $53,424 $46,977 13.7% Property & Acquisition Specialist 3 $60,420 $57,414 5.2% Property & Acquisition Specialist 4 $65,088 - - Property & Acquisition Specialist 5 $70,056 $86,840 -19.3% Property & Acquisition Specialist 6 $73,644 $81,774 -9.9% Average - - -4.9%

109 Appendices
Southwest Region
Clark County Vancouver ERI
Vancouver Median
Transportation Engineer 1 $65,291 - - $65,291
Transportation Engineer 2 $75,566 $87,996 $84,000 $84,000
Transportation Engineer 3 $75,566 - - $75,566
Transportation Engineer 4 $87,526 - - $87,526
Transportation Engineer 5 - $97,500 - $97,500
Transportation Technical Engineer - - - -
Transportation Technician 1 $56,410 - - $56,410
Transportation Technician 2 $65,291 $57,528 - $61,410
Transportation Technician 3 $75,566 - $64,044 $69,805
Property & Acquisition Specialist 1 $60,320 - - $60,320
Property & Acquisition Specialist 2 $68,474 - - $68,474
Property & Acquisition Specialist 3 $75,566 - $67,404 $71,485
Property & Acquisition Specialist 4 - - - -
Property & Acquisition Specialist 5 - - - -
Property & Acquisition Specialist 6 - - - -
WSDOT Maximum
Base Market Median at Maximum Base
WSDOT Variance from Median
Transportation Engineer 1 $58,956 $65,291 -9.7% Transportation Engineer 2 $65,088 $84,000 -22.5% Transportation Engineer 3 $71,844 $75,566 -4.9% Transportation Engineer 4 $79,296 $87,526 -9.4% Transportation Engineer 5 $87,528 $97,500 -10.2% Transportation Technical Engineer $87,528 - - Transportation Technician 1 $44,880 $56,410 -20.4% Transportation Technician 2 $52,080 $61,410 -15.2% Transportation Technician 3 $58,956 $69,805 -15.5% Property & Acquisition Specialist 1 $44,880 $60,320 -25.6% Property & Acquisition Specialist 2 $53,424 $68,474 -22.0% Property & Acquisition Specialist 3 $60,420 $71,485 -15.5% Property & Acquisition Specialist 4 $65,088 - - Property & Acquisition Specialist 5 $70,056 - - Property & Acquisition Specialist 6 $73,644 - - Average - - -15.5%
Related Documents