Figure captions and tables

Welcome message from author
This document is posted to help you gain knowledge. Please leave a comment to let me know what you think about it! Share it to your friends and learn new things together.
Transcript

Figure captions and tables
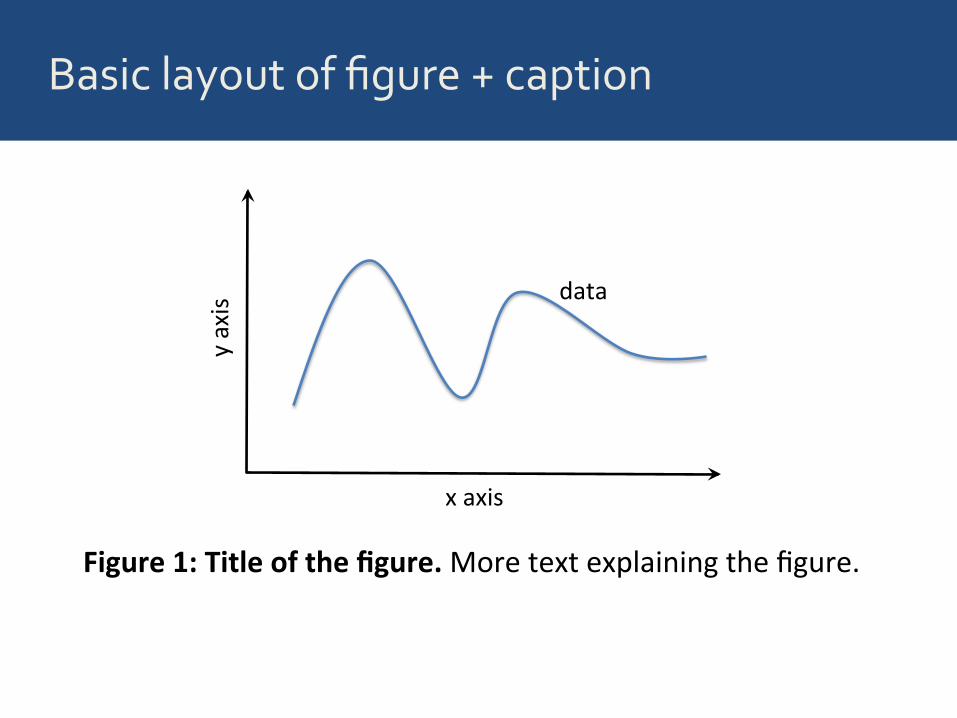
Basic layout of figure + caption
Figure 1: Title of the figure. More text explaining the figure.
x axis
y axis data
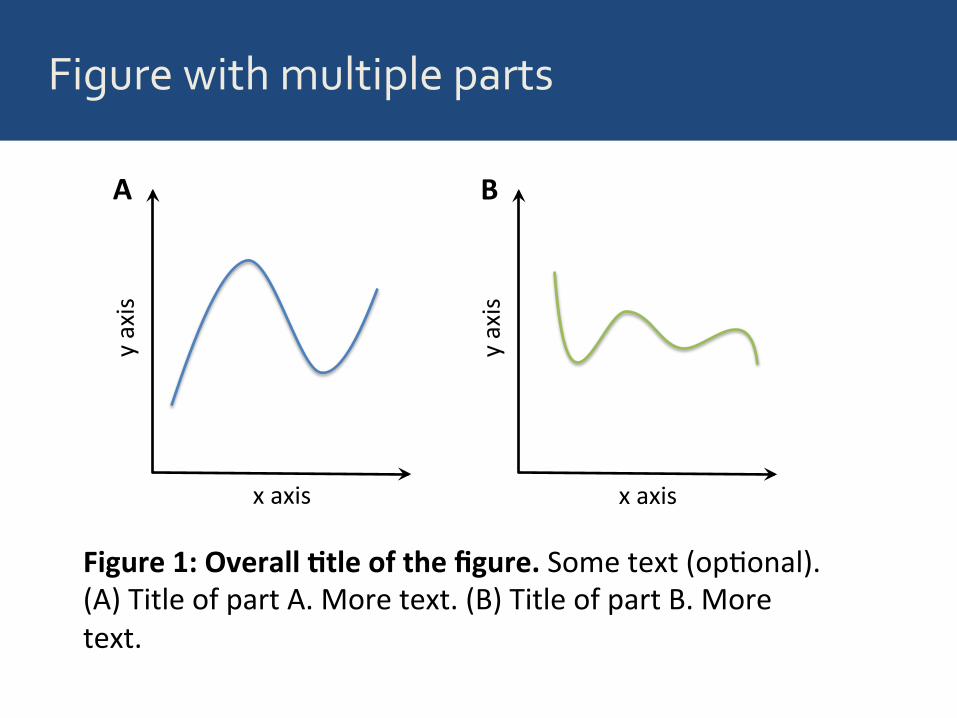
Figure with multiple parts
Figure 1: Overall 5tle of the figure. Some text (op8onal). (A) Title of part A. More text. (B) Title of part B. More text.
x axis
y axis
x axis y axis
A B

Examples
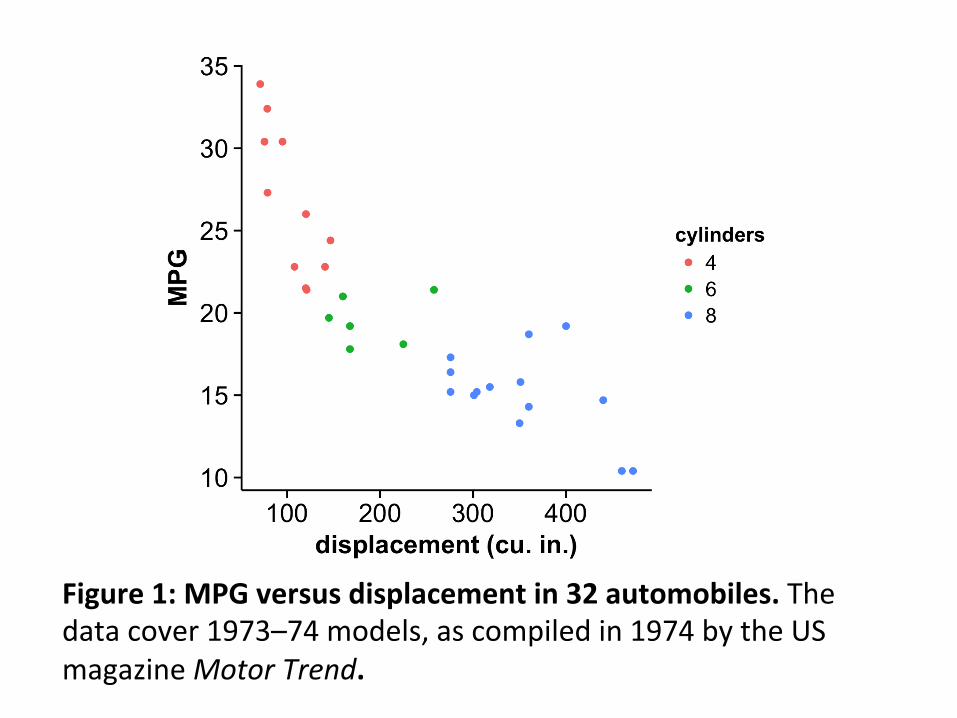
Figure 1: MPG versus displacement in 32 automobiles. The data cover 1973–74 models, as compiled in 1974 by the US magazine Motor Trend.
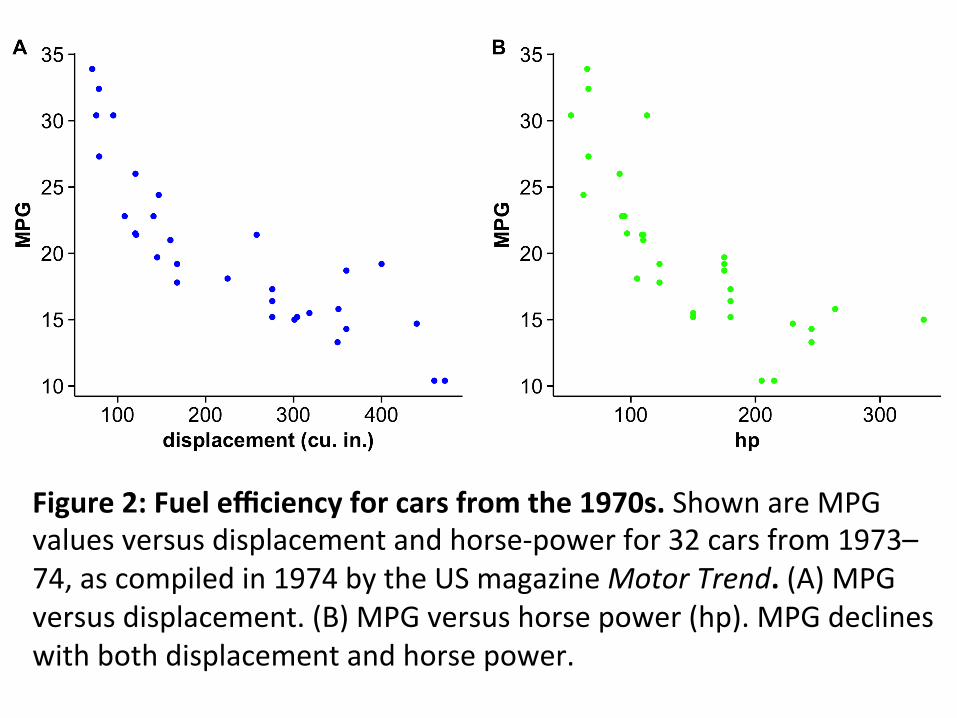
Figure 2: Fuel efficiency for cars from the 1970s. Shown are MPG values versus displacement and horse-‐power for 32 cars from 1973–74, as compiled in 1974 by the US magazine Motor Trend. (A) MPG versus displacement. (B) MPG versus horse power (hp). MPG declines with both displacement and horse power.
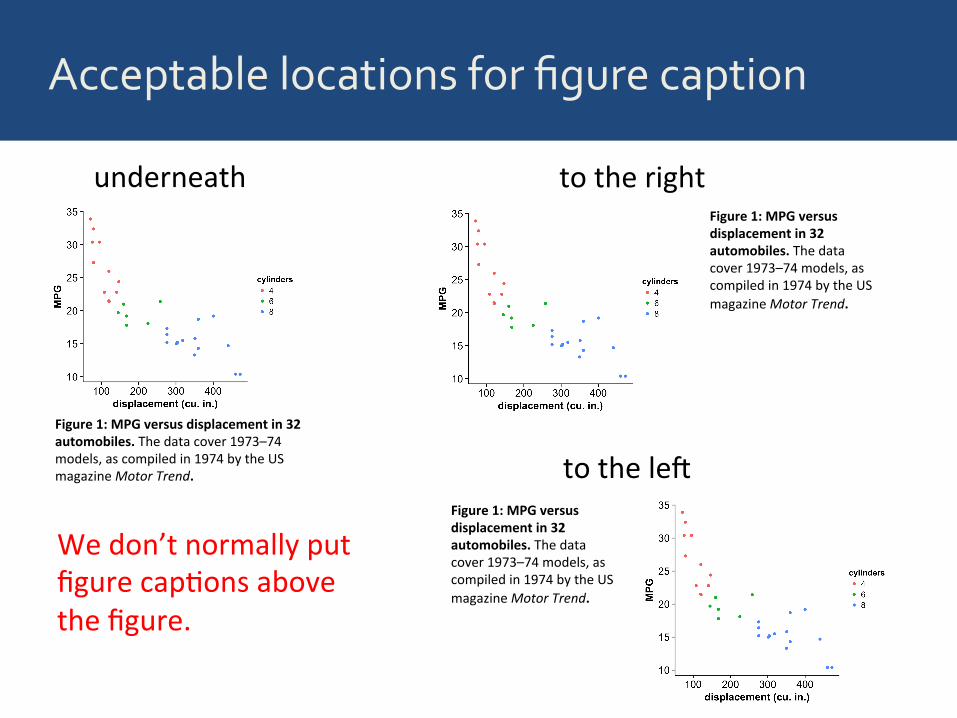
Acceptable locations for figure caption
Figure 1: MPG versus displacement in 32 automobiles. The data cover 1973–74 models, as compiled in 1974 by the US magazine Motor Trend.
underneath Figure 1: MPG versus displacement in 32 automobiles. The data cover 1973–74 models, as compiled in 1974 by the US magazine Motor Trend.
to the right
Figure 1: MPG versus displacement in 32 automobiles. The data cover 1973–74 models, as compiled in 1974 by the US magazine Motor Trend.
to the leO
We don’t normally put figure cap8ons above the figure.
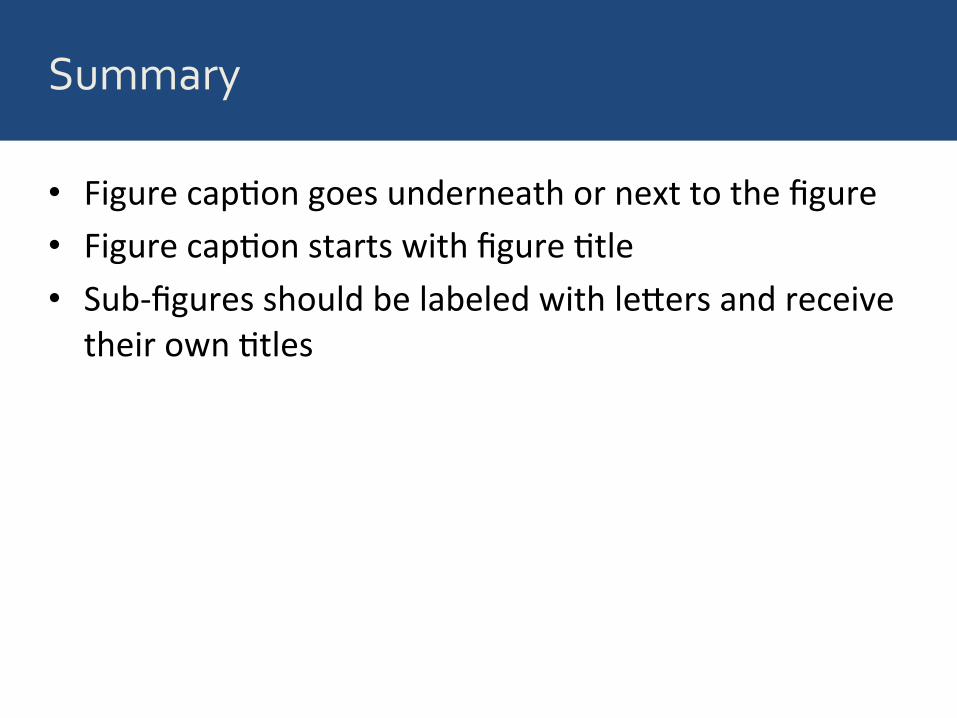
Summary
• Figure cap8on goes underneath or next to the figure • Figure cap8on starts with figure 8tle • Sub-‐figures should be labeled with leSers and receive their own 8tles
Proper formatting of tables
age (yrs) height (cm) weight (kg) sex
10 138 32 M
15 170 56 M
20 177 71 M
10 138 33 F
15 162 52 F
20 163 53 F
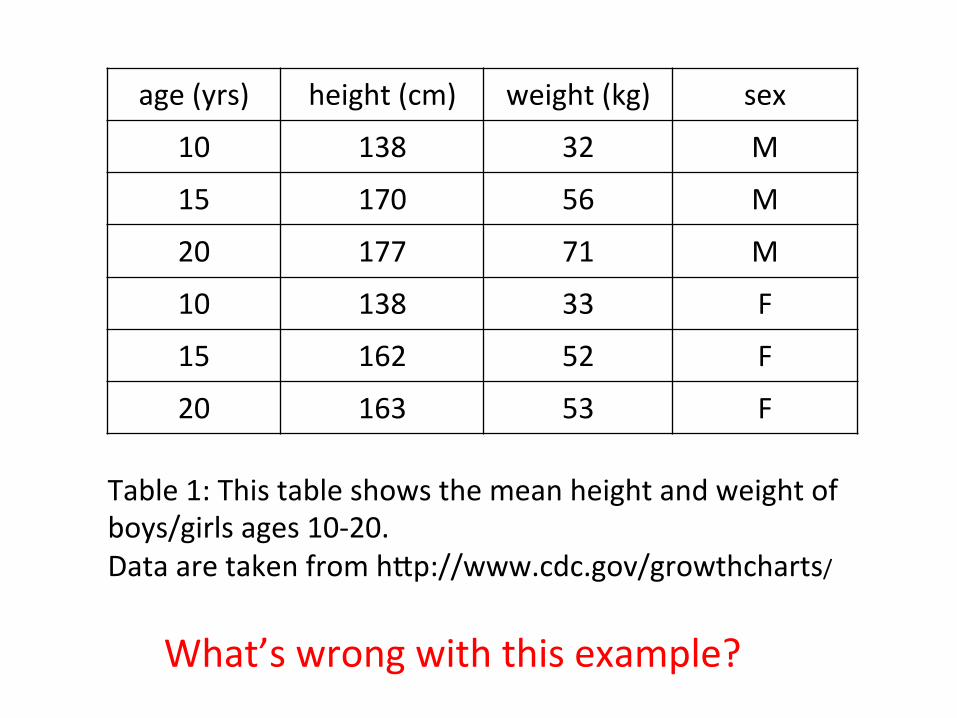
Table 1: This table shows the mean height and weight of boys/girls ages 10-‐20. Data are taken from hSp://www.cdc.gov/growthcharts/
What’s wrong with this example?
age (yrs) height (cm) weight (kg) sex
10 138 32 M
15 170 56 M
20 177 71 M
10 138 33 F
15 162 52 F
20 163 53 F
Table 1: This table shows the mean height and weight of boys/girls ages 10-‐20. Data are taken from hSp://www.cdc.gov/growthcharts/
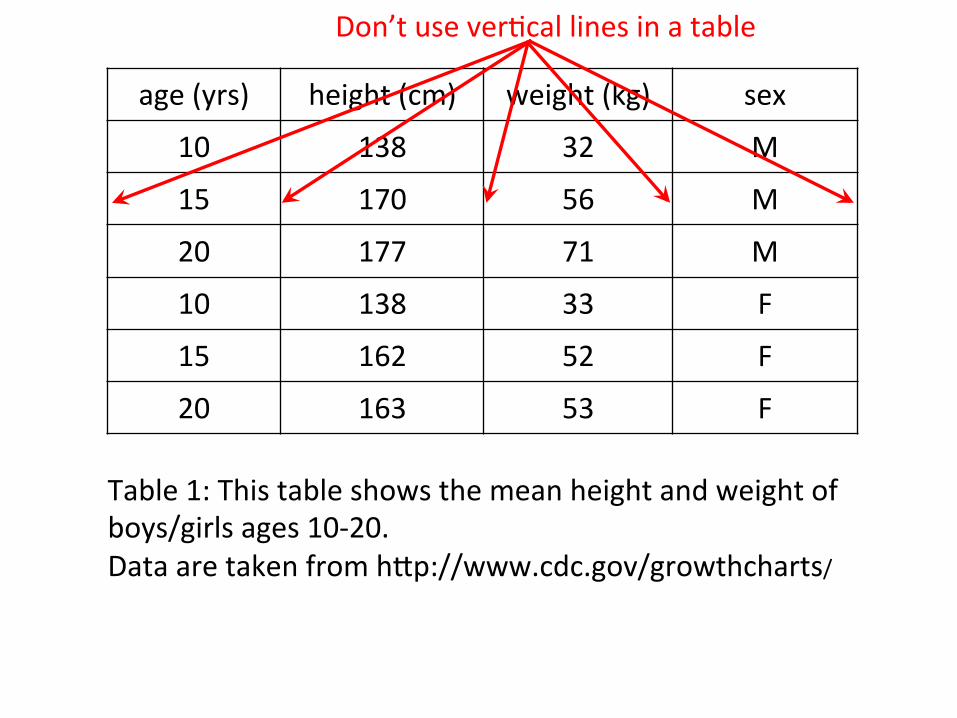
Don’t use ver8cal lines in a table

age (yrs) height (cm) weight (kg) sex
10 138 32 M
15 170 56 M
20 177 71 M
10 138 33 F
15 162 52 F
20 163 53 F
Table 1: This table shows the mean height and weight of boys/girls ages 10-‐20. Data are taken from hSp://www.cdc.gov/growthcharts/
age (yrs) height (cm) weight (kg) sex
10 138 32 M
15 170 56 M
20 177 71 M
10 138 33 F
15 162 52 F
20 163 53 F
Table 1: This table shows the mean height and weight of boys/girls ages 10-‐20. Data are taken from hSp://www.cdc.gov/growthcharts/
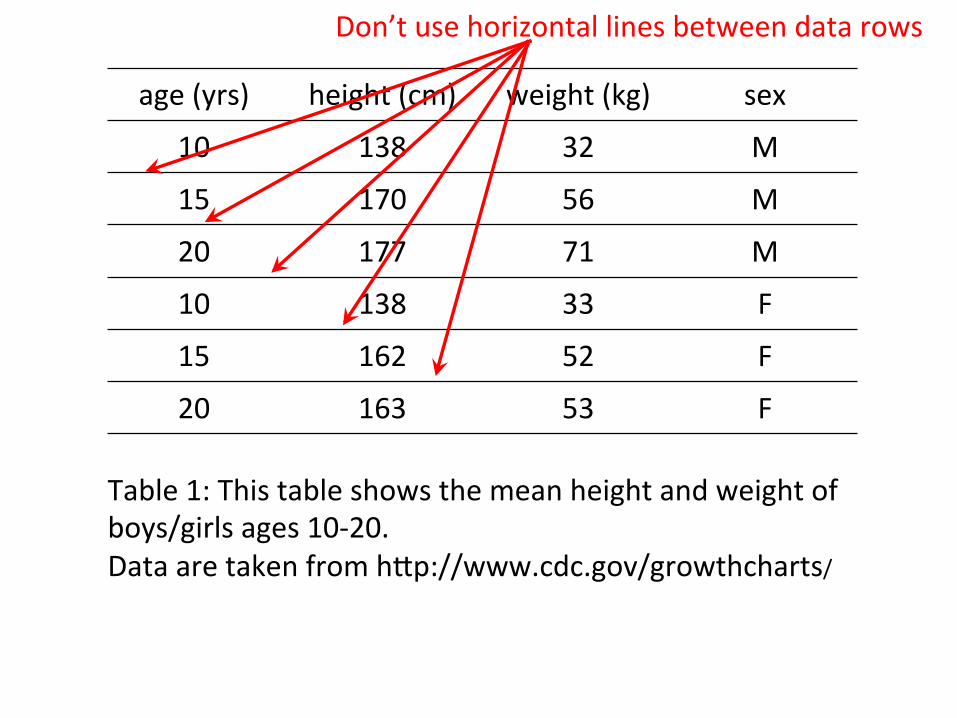
Don’t use horizontal lines between data rows
age (yrs) height (cm) weight (kg) sex
10 138 32 M
15 170 56 M
20 177 71 M
10 138 33 F
15 162 52 F
20 163 53 F
Table 1: This table shows the mean height and weight of boys/girls ages 10-‐20. Data are taken from hSp://www.cdc.gov/growthcharts/

age (yrs) height (cm) weight (kg) sex
10 138 32 M
15 170 56 M
20 177 71 M
10 138 33 F
15 162 52 F
20 163 53 F
Table 1: This table shows the mean height and weight of boys/girls ages 10-‐20. Data are taken from hSp://www.cdc.gov/growthcharts/
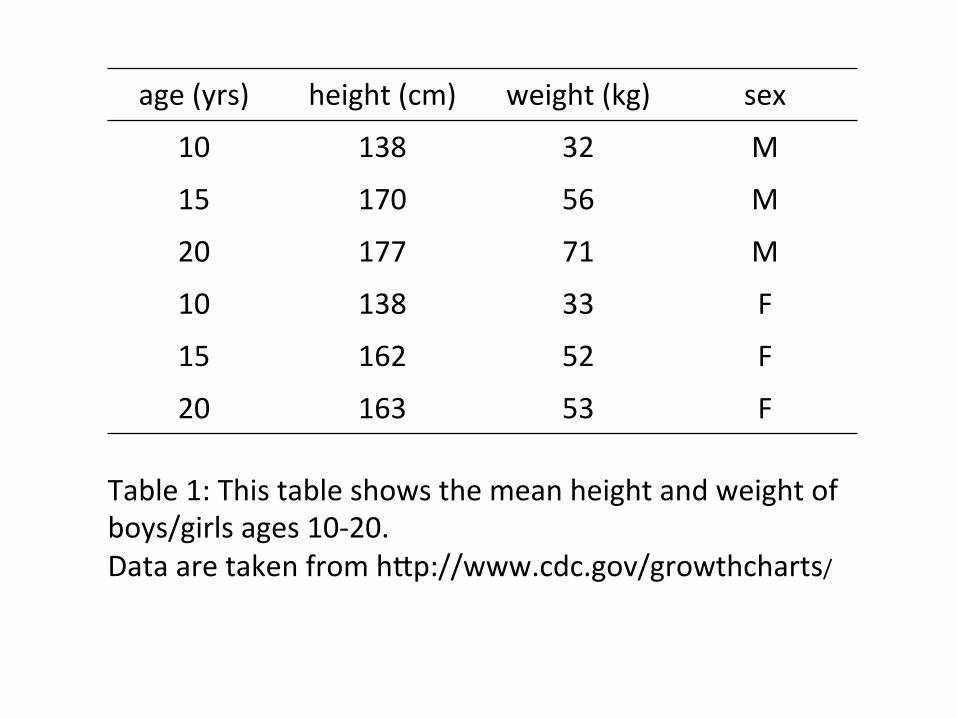
This is not a 8tle for the table
age (yrs) height (cm) weight (kg) sex
10 138 32 M
15 170 56 M
20 177 71 M
10 138 33 F
15 162 52 F
20 163 53 F
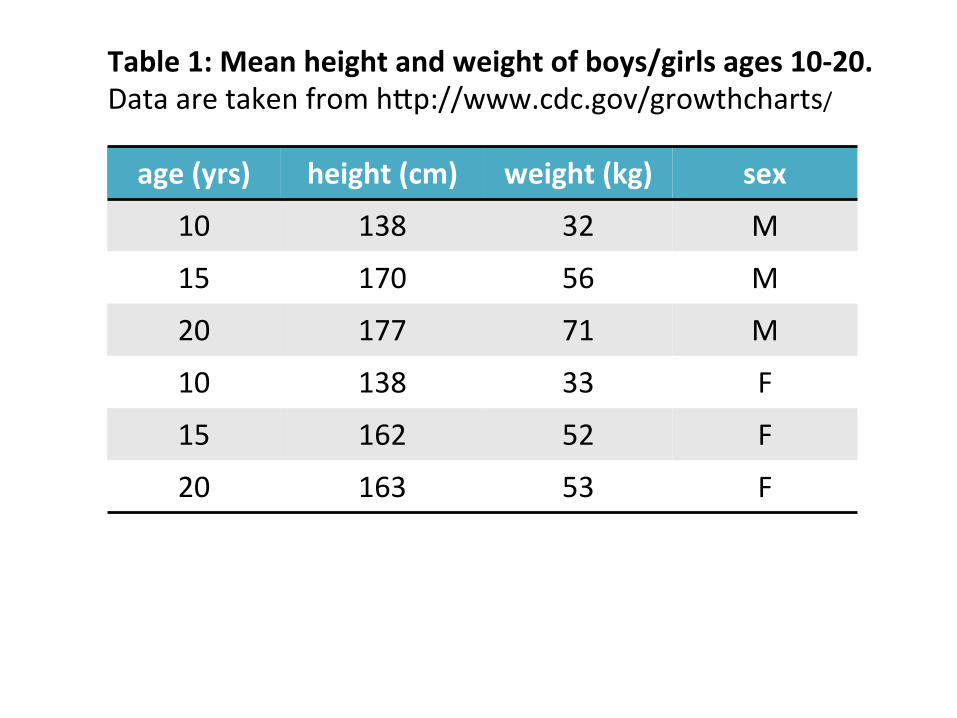
Table 1: Mean height and weight of boys/girls ages 10-‐20. Data are taken from hSp://www.cdc.gov/growthcharts/
age (yrs) height (cm) weight (kg) sex
10 138 32 M
15 170 56 M
20 177 71 M
10 138 33 F
15 162 52 F
20 163 53 F
Table 1: Mean height and weight of boys/girls ages 10-‐20. Data are taken from hSp://www.cdc.gov/growthcharts/
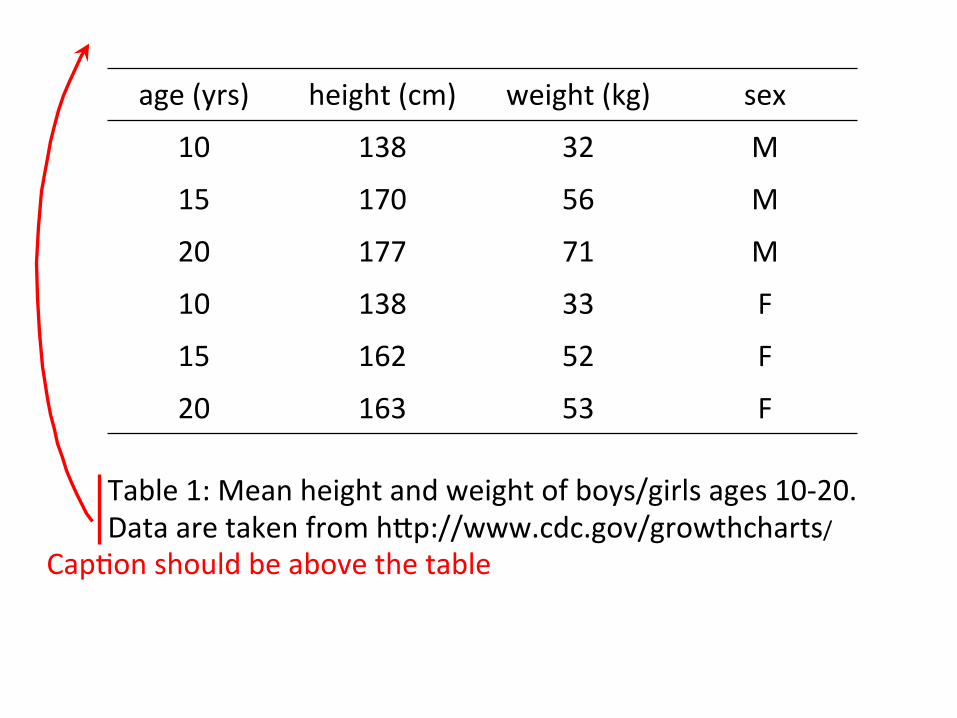
Cap8on should be above the table

age (yrs) height (cm) weight (kg) sex
10 138 32 M
15 170 56 M
20 177 71 M
10 138 33 F
15 162 52 F
20 163 53 F
Table 1: Mean height and weight of boys/girls ages 10-‐20. Data are taken from hSp://www.cdc.gov/growthcharts/
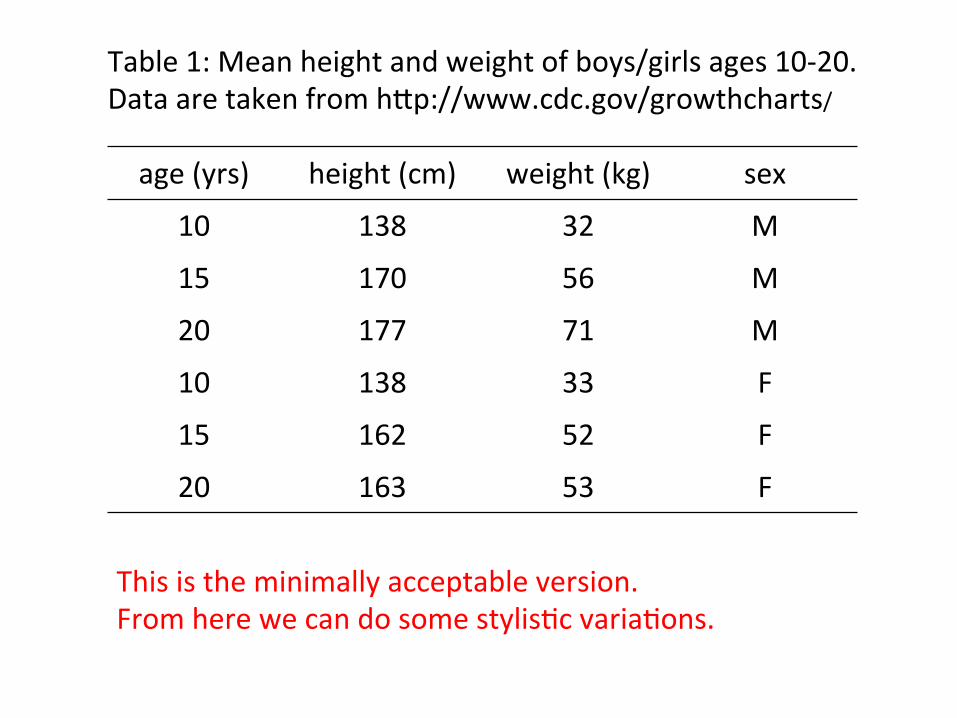
age (yrs) height (cm) weight (kg) sex
10 138 32 M
15 170 56 M
20 177 71 M
10 138 33 F
15 162 52 F
20 163 53 F
Table 1: Mean height and weight of boys/girls ages 10-‐20. Data are taken from hSp://www.cdc.gov/growthcharts/
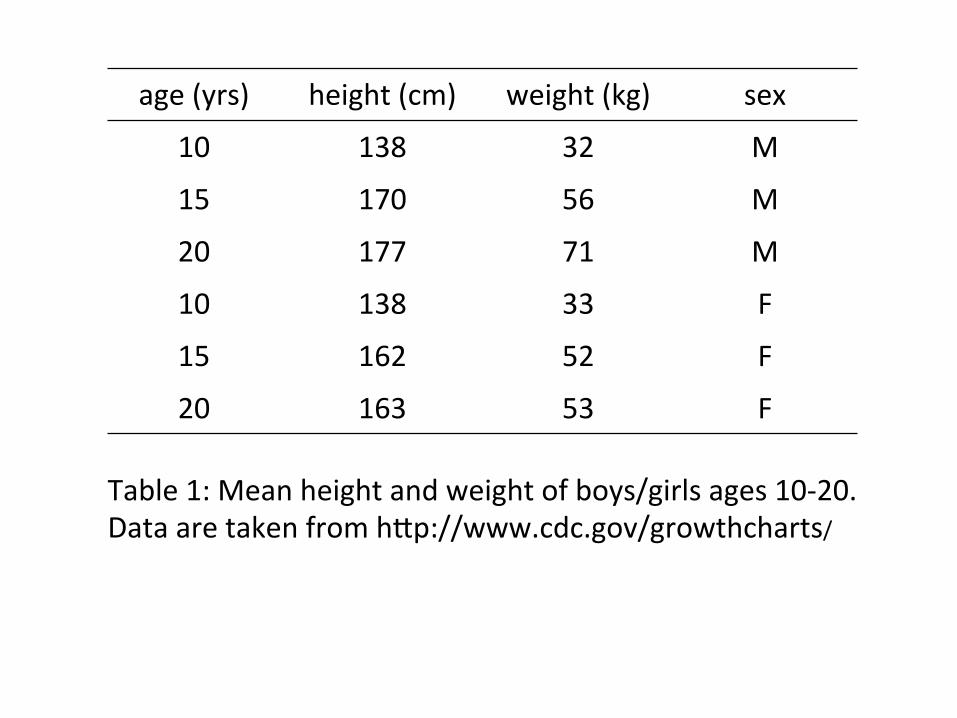
This is the minimally acceptable version. From here we can do some stylis8c varia8ons.
age (yrs) height (cm) weight (kg) sex
10 138 32 M
15 170 56 M
20 177 71 M
10 138 33 F
15 162 52 F
20 163 53 F
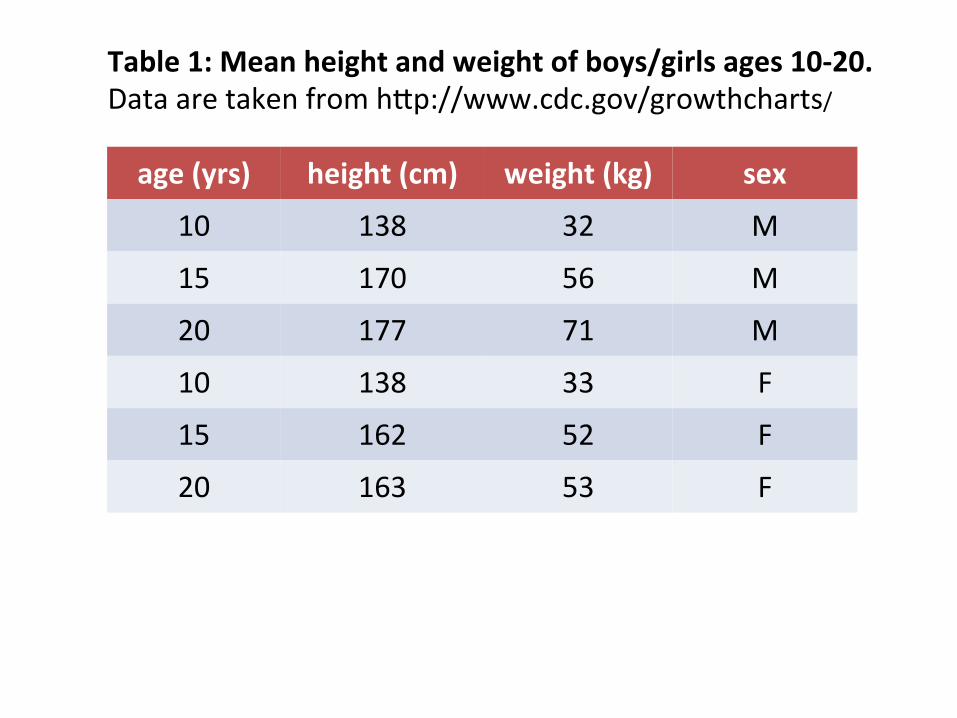
Table 1: Mean height and weight of boys/girls ages 10-‐20. Data are taken from hSp://www.cdc.gov/growthcharts/
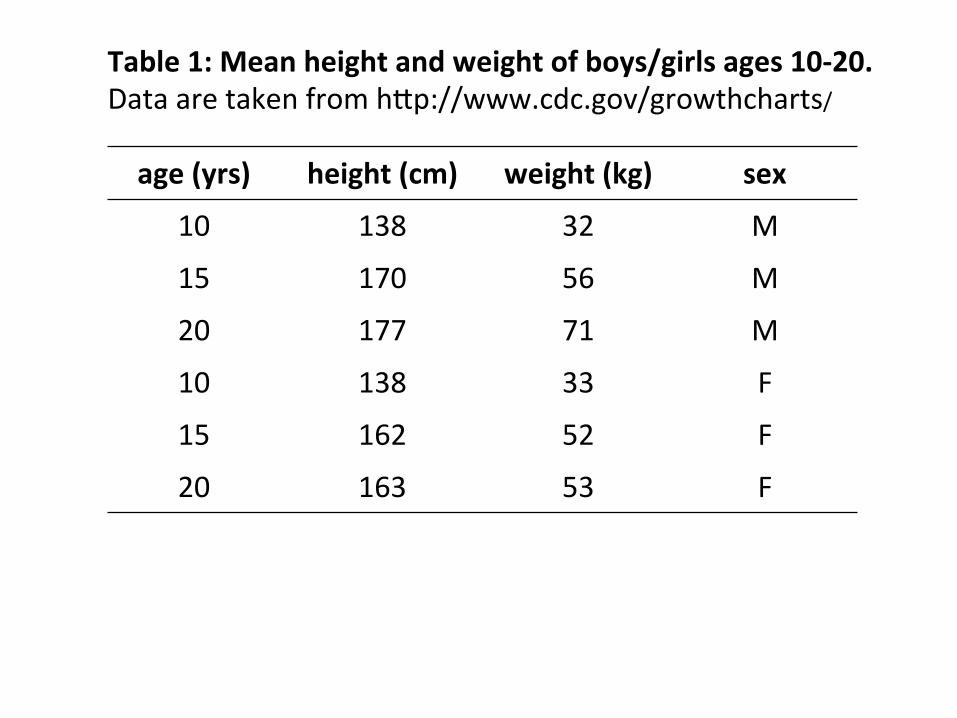
age (yrs) height (cm) weight (kg) sex
10 138 32 M
15 170 56 M
20 177 71 M
10 138 33 F
15 162 52 F
20 163 53 F
Table 1: Mean height and weight of boys/girls ages 10-‐20. Data are taken from hSp://www.cdc.gov/growthcharts/
age (yrs) height (cm) weight (kg) sex
10 138 32 M
15 170 56 M
20 177 71 M
10 138 33 F
15 162 52 F
20 163 53 F
Table 1: Mean height and weight of boys/girls ages 10-‐20. Data are taken from hSp://www.cdc.gov/growthcharts/
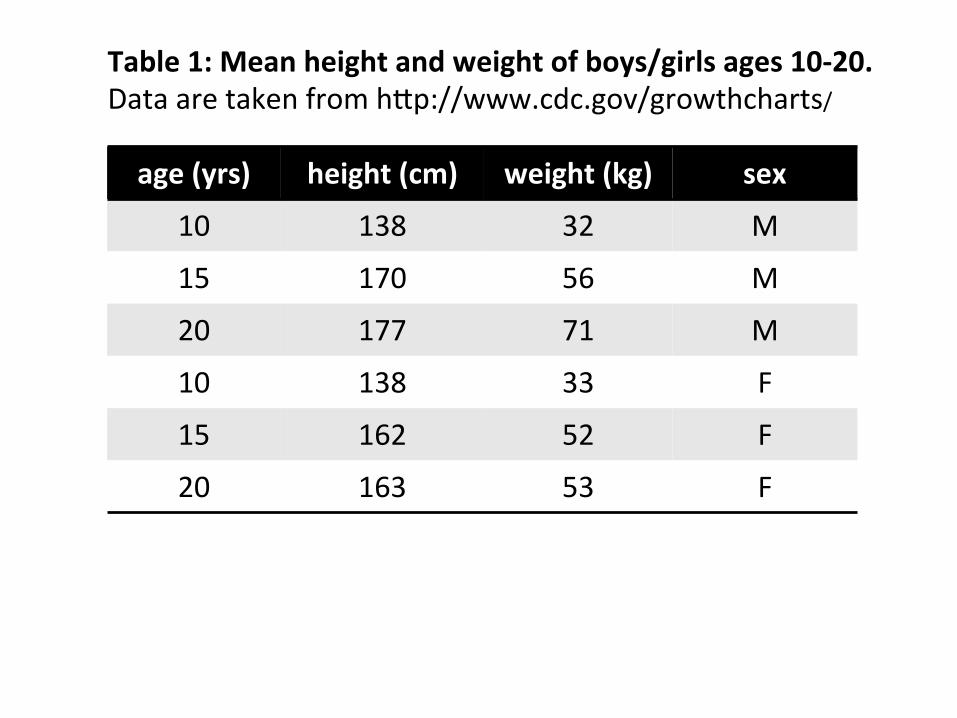
age (yrs) height (cm) weight (kg) sex
10 138 32 M
15 170 56 M
20 177 71 M
10 138 33 F
15 162 52 F
20 163 53 F
Table 1: Mean height and weight of boys/girls ages 10-‐20. Data are taken from hSp://www.cdc.gov/growthcharts/

Summary
• Table cap8on goes above the table • Table cap8on starts with table 8tle • No ver8cal lines • No horizontal lines between data rows
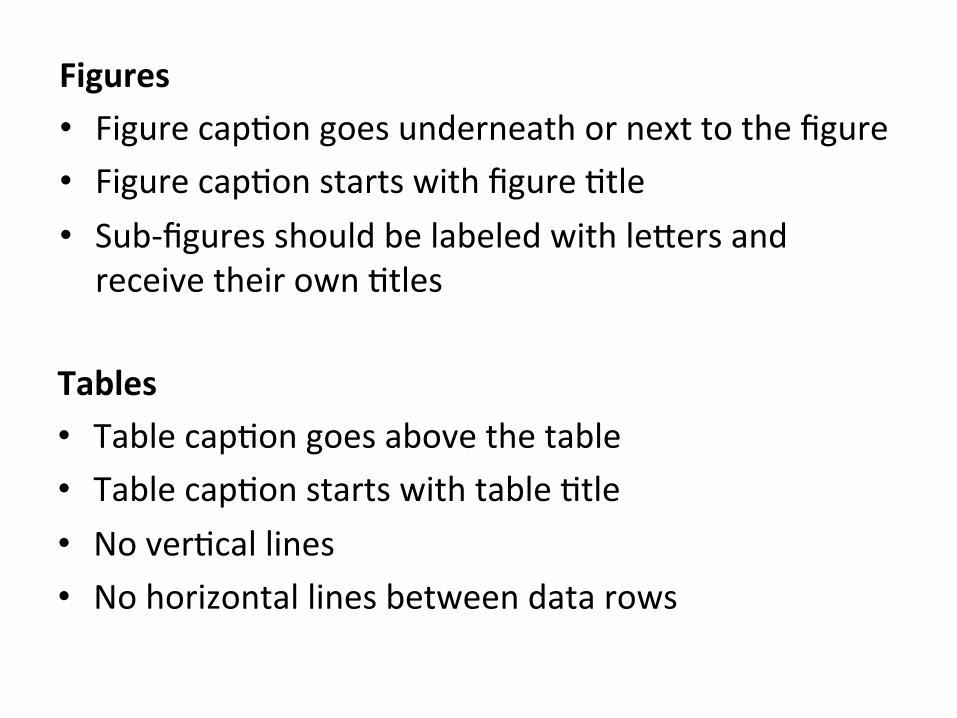
Figures • Figure cap8on goes underneath or next to the figure • Figure cap8on starts with figure 8tle • Sub-‐figures should be labeled with leSers and receive their own 8tles
Tables • Table cap8on goes above the table • Table cap8on starts with table 8tle • No ver8cal lines • No horizontal lines between data rows
Related Documents


