Response to Intervention RTI Lab: Creating District D i i R l f A l i Decision Rules for Analyzing RTI Data to Determine LD Eligibility Jim Wright it ti t l www.interventioncentral.org www.interventioncentral.org

Welcome message from author
This document is posted to help you gain knowledge. Please leave a comment to let me know what you think about it! Share it to your friends and learn new things together.
Transcript

Response to Intervention
RTI Lab: Creating District D i i R l f A l i Decision Rules for Analyzing RTI Data to Determine LD EligibilityJim Wright
i t ti t lwww.interventioncentral.org
www.interventioncentral.org

Response to Intervention
RTI Data & LD Determination: Agenda… 1. Learning Disabilities in the Age of RTI:
Introduction
2. Analyzing Student Academic Risk: Performance L l d R t f I tLevel and Rate of Improvement
3 Evaluating a Student’s ‘Non Responder’ Status: A 3. Evaluating a Student s Non-Responder Status: A Comprehensive Checklist
4. Developing Your District’s Decision Rules for Using RTI Data to Determine ‘Non-Response’
www.interventioncentral.org
g pStatus: First Steps

Response to Intervention
“ ”The process by which public schools identify students as learning disabled often appears to be
f i f i d l i ll i i t t I f t confusing, unfair, and logically inconsistent. In fact, G. Reid Lyon of the National Institute of Child Health and Human Development has suggested Health and Human Development has suggested that the field of learning disabilities is a sociological sponge whose purpose has been and is to clean p g p pup the spills of general education. (Gresham, 2001)
www.interventioncentral.org 3
Source: Gresham, F. M.. (2001). Responsiveness to intervention: An alternative approach to the identification of learning disabilities. Paper presented at the Learning Disabilities Summit, Washington DC.

Response to Intervention
RTI & Special Education RTI & Special Education Eligibility
www.interventioncentral.org

Response to Intervention
LD Eligibility: Random Concerns About CSE D i i M kiDecision-Making
• The CSE still relies almost entirely on the test-score ydiscrepancy formula in determining LD and does not give adequate weight to RTI information presented.Th CSE f il t fi d di bilit iti l k f id th t • The CSE fails to find a disability, citing a lack of evidence that the student failed to respond to instructional interventions. However, the CSE does not specify what RTI evidence it is , p ylooking for or the format in which that evidence should be presented. Th CSE i i i t t O d it i b t ti l • The CSE is inconsistent. On one day, it gives substantial weight to RTI information to make an LD eligibility decision. On the next day, the CSE focuses primarily on test score
www.interventioncentral.org 5
On the next day, the CSE focuses primarily on test score discrepancies and ‘processing deficits’.

Response to Intervention
Special Education Eligibility & RTI: E t bli hi C fid t E Li kEstablishing Confidence at Every Link
• Special Education Eligibility Teams review • Special Education Eligibility Teams review the CUMULATIVE RTI information collected in general education (‘intervention audit’)general education ( intervention audit ).
• If that Team lacks confidence in any one of the links i th RTI h i it ill b diffi lt t id tif th in the RTI chain, it will be difficult to identify the student as an RTI ‘non-responder’
• The goal of this workshop is to help schools to identify each link in the RTI chain and to know how
www.interventioncentral.org
to measure the quality of that link.6

Response to Intervention
RTI Assumption: Struggling Students Are ‘Typical’ U til P Oth iUntil Proven Otherwise…
RTI logic assumes that:A t d t h b i t t l i l d ti i t i l – A student who begins to struggle in general education is typical, and that
– It is general education’s responsibility to find the instructional It is general education s responsibility to find the instructional strategies that will unlock the student’s learning potential
Only when the student shows through well-documented interventions that he or she has ‘failed to respond to intervention’ does RTI begin to investigate the possibility th t th t d t h l i di bilit th that the student may have a learning disability or other special education condition.
www.interventioncentral.org 7

Response to Intervention
RTI ‘Pyramid of Tier 3: Intensive interventionsInterventions’ Tier 3: Intensive interventions.Students who are ‘non-responders’ to Tiers 1 & 2 are
Tier 3
referred to the RTI Team for more intensive interventions.
Tier 2 Individualized interventions. Subset of students receive interventions Tier 2
Tier 1: Universal interventions
students receive interventions targeting specific needs.
Tier 1Tier 1: Universal interventions.Available to all students in a classroom or school. Can consist
www.interventioncentral.org 8
of whole-group or individual strategies or supports.

Response to Intervention
What previous approach to diagnosing L i Di biliti d RTI l ?Learning Disabilities does RTI replace?
Prior to RTI, many states used a ‘Test-Score Discrepancy Model’ to identify Learning Disabilities. identify Learning Disabilities.
• A student with significant academic delays would be administered an battery of administered an battery of tests, including an intelligence test and academic achievement test(s) academic achievement test(s).
• If the student was found to have a substantial gap between a higher IQ score and lower
hi t f l d t d t i if th t achievement scores, a formula was used to determine if that gap was statistically significant and ‘severe’.
• If the student had a ‘severe discrepancy’ [gap] between IQ and
www.interventioncentral.org 9
p y [g p]achievement, he or she would be diagnosed with a Learning Disability.

Response to Intervention
Avg Classroom Academic Performance Level
Discrepancy 1: Skill Gap Discrepancy 1: Skill Gap (Current Performance Level)
Discrepancy 2:Gap in Rate of Learning (‘Slope
Target Student
‘Dual Discrepancy’: RTI Model
Learning ( Slope of Improvement’)
www.interventioncentral.org 10
Dual-Discrepancy : RTI Model of Learning Disability (Fuchs 2003)

Response to Intervention
Current NYS Definition of ‘Learning Disabled’Current NYS Definition of Learning Disabled
www.interventioncentral.org 11

Response to Intervention
RTI Information: What It Does and Doesn’t DoRTI Information: What It Does and Doesn t Do• The primary purpose for the special education eligibility
team to evaluate general education RTI information is team to evaluate general-education RTI information is to rule out instructional explanations for the struggling student’s academic concerns.student s academic concerns.
• RTI information does not in and of itself provide detailed information to allow schools to draw conclusions about a student’s possible neurological differences that make up the construct ‘learning disabilities’.
• Therefore, RTI information allows for a rule-out (the learning problem resides within the student, not the l ) b d i d f i lf id i i
www.interventioncentral.org
classroom) but does not in and of itself provide positive evidence of a learning disability.
12

Response to Intervention
Using RTI Information to Identify the ‘Non-g yResponding’ Student: Goodbye, Gate
• As a special education eligibility team adopts a process for As a special education eligibility team adopts a process for evaluating a student’s RTI information as a ‘non-responder’ to intervention as part of an evaluation for learning disabilities, the team will discover that there is no longer a single ‘actuarial number’ or gate to determine ‘risk’ of LD in the
f t t di l imanner of a test score discrepancy analysis.• Therefore, the special education eligibility team must have
confidence in the quality of the intervention and assessment confidence in the quality of the intervention and assessment programs available to the struggling student in the general education setting
www.interventioncentral.org
education setting. • Today’s workshop is about increasing that level of confidence.
13
Response to Intervention
Team Activity: What Are Your Major Challenges in Using RTI Data to Help to Determine Special Education Eligibility?
What are the major challenge(s) that your school or district faces as you your school or district faces as you make the transition to using RTI data to help to make special education help to make special education eligibility decisions?
www.interventioncentral.org 14

Response to Intervention
Student Academic Performance: Student Academic Performance: How to Determine ‘Discrepancy’
www.interventioncentral.org

Response to Intervention
Avg Classroom Academic Performance Level
Discrepancy 1: Skill Gap Discrepancy 1: Skill Gap (Current Performance Level)
Discrepancy 2:Gap in Rate of Learning (‘Slope
Target Student
‘Dual Discrepancy’: RTI Model
Learning ( Slope of Improvement’)
www.interventioncentral.org 16
Dual-Discrepancy : RTI Model of Learning Disability (Fuchs 2003)

Response to Intervention
Definition: ParallaxDefinition: Parallax“an apparent displacement or difference in the
t iti f bj t i d l t apparent position of an object viewed along two different lines of sight, and is measured by the
l i l f i li ti b t th angle or semi-angle of inclination between those two lines.”
www.interventioncentral.org 17
Source: Parallax. (2010, August 11). In Wikipedia, The Free Encyclopedia. Retrieved 09:33, August 13, 2010, from http://en.wikipedia.org/w/index.php?title=Parallax&oldid=378400891

Response to Intervention
Parallax and Academic NormsParallax and Academic Norms
Wh i h d i f f When comparing the academic performance of a struggling student to peers, schools should pay tt ti t b th t l ( h) d i attention to both external (research) academic norms
and local norms. This dual perspective can i lt l th t d t’ kill t simultaneously compare the student’s skills to
‘national’ norms as well as determine how discrepant th t d t’ kill h d t th the student’s skills are when compared to other children in his or her classroom.
www.interventioncentral.org 18
Source: Shapiro, E. S. (2008). Best practices in setting progress-monitoring monitoring goals for academic skill improvement. In A. Thomas & J. Grimes (Eds.), Best practices in school psychology V (pp. 141-157). Bethesda, MD: National Association of School Psychologists.

Response to InterventionDefining ‘Discrepant’ Academic Performance: Do
We Use External Norms or Local Norms?We Use External Norms or Local Norms?External (Research or Benchmark) Norms: Used to compare the performance of a student or instructional compare the performance of a student or instructional program to objective external/research/national norms. External norms can help to answer these questions:p q– Is the school’s core program successful (comparison of
local to research norms)?)– Is a child performing at a minimum level of competency
in the academic skill to allow us to predict future success?
– What objective academic performance cut-off should be
www.interventioncentral.org
set to determine student entry into and exit from Tier 2 and 3 intervention programs?
19

Response to Intervention
Defining ‘Discrepant’ Academic Performance: Do W U E t l N L l N ?We Use External Norms or Local Norms?
L l N R k d d il ti f f t d t Local Norms: Rank-ordered compilation of scores of students within a particular grade level/school. Local norms are used to help answer these questions:used to help answer these questions:– What is the typical range of student ability in the grade
level or school?level or school?– How is a particular student performing relative to other
children in the grade level or school?children in the grade level or school?– How much effort must a teacher exert to instruct this
student relative to other students in the class?
www.interventioncentral.org 20

Response to InterventionBaylor Elementary School : Grade Norms: Correctly Read Words Per Min : Sample Size: 23 Students
Group Norms: Correctly Read Words Per Min: Book 4-1: Raw DataGroup Norms: Correctly Read Words Per Min: Book 4-1: Raw Data31 34 34 39 41 43 52 55 59 61 68 71 74 75 85 89 102 108 112 115 118 118 131LOCAL NORMS EXAMPLE T t th 4th d t d tLOCAL NORMS EXAMPLE: Twenty-three 4th-grade students were administered oral reading fluency Curriculum-Based Measurement passages at the 4th-grade level in their school. p g g
In their current number form, these data are not easy to interpret.
So the school converts them into a visual display—a box-plot —to show the distribution of scores and to convert the
t til fscores to percentile form.
When Billy, a struggling reader, is screened in CBM reading fluency he shows a SIGNIFICANT skill gap when compared to
www.interventioncentral.org 21
fluency, he shows a SIGNIFICANT skill gap when compared to his grade peers.

Response to InterventionBaylor Elementary School : Grade Norms: Correctly Read Words Per Min : Sample Size: 23 Students January Benchmarking
Group Norms: Correctly Read Words Per Min: Book 4-1: Raw DataGroup Norms: Correctly Read Words Per Min: Book 4-1: Raw Data31 34 34 39 41 43 52 55 59 61 68 71 74 75 85 89 102 108 112 115 118 118 131G N C t d
National Reading Norms: 112 CRW
Median (2nd Quartile)=71
Group Norms: Converted to Box-Plot
Source: Tindal, G., Hasbrouck, J., &
Norms: 112 CRW Per Min
3rd Quartile=1081st Quartile=43
, ,Jones, C. (2005).Oral
reading fluency: 90 years of
measurement[Technical report
Billy=19[Technical report
#33]. Eugene, OR: University of Oregon.
Low Value=31 Hi Value=131
0 20 40 60 80 100 120 140 160
www.interventioncentral.org 22
0 20 40 60 80 100 120 140 160Correctly Read Words-Book 4-1

Response to Intervention
How Do We Define ‘Discrepant Academic P f ’ O f th RTI ‘D l Di i ’?Performance’ as One of the RTI ‘Dual Discrepancies’?
Using norms (benchmarks or local) the Special Using norms (benchmarks or local), the Special Education Eligibility Team can set a cut-point, below which a student is considered ‘severely discrepant’ from y ptheir peers in a specific academic skill.
www.interventioncentral.org 23

Response to Intervention
How Do We Define ‘Discrepant Academic Performance’ O f th RTI ‘D l Di i ’? as One of the RTI ‘Dual Discrepancies’? (Cont.)
Based on either external benchmarks or building-wide screening f fresults, schools need to quantify the lower and upper range of
academic performance that identifies a student as requiring Tier 2 or 3 supplemental intervention services. ppA student with screening results:– below the LOW cut-point is defined as having ‘severely
discrepant’ academic skills when compared with these local norms and would benefit from Tier 3 intervention services.
– between the LOW and HIGH values is at lesser academic between the LOW and HIGH values is at lesser academic risk and would benefit from Tier 2 intervention services.
– above the HIGH value does not require supplemental
www.interventioncentral.org
interventions.
24

Response to Intervention
Defining ‘Discrepant Academic Performance’: ExampleDefining Discrepant Academic Performance : ExampleBaylor Elementary School conducted a winter screening of its 3rd-grade students in Oral Reading Fluency (ORF).g g y ( )The school set the 10th percentile as being the low academic cut-point, defining the cross-over to Tier3 p gsupport and the 30th percentile as being the high cut-point, defining a student who would need no
l t l i t ti Th Ti 2 th supplemental intervention. The Tier 2 range, then, was 10th to 30th percentile.B l d it l l lt t Baylor compared its local norm results to research/external ORF norms (Tindal, Hasbrouck & Jones 2005)
www.interventioncentral.org
Jones, 2005).
25
Source: Tindal, G., Hasbrouck, J., & Jones, C. (2005).Oral reading fluency: 90 years of measurement [Technical report #33]. Eugene, OR: University of Oregon.

Response to InterventionExample: Baylor Elementary School/Smithtown School District
Grade 3: Winter Screening: Oral Reading Fluency: Word Correct Per Minute
External/Research Norms: 10-25 %ile36-69 WCPM = Tier 2 Range
Local (Building) Norms: 10-25 %ile31-60 WCPM = Tier 2 Range
0 20 40 60 80 100 120 140 160
www.interventioncentral.org 26
0 20 40 60 80 100 120 140 160Correct Words Per Minute

Response to InterventionUsing Screening Results to Define ‘Discrepant’ Academic
Performance: Local vs. External Fluency Norms
www.interventioncentral.org 27
Response to Intervention
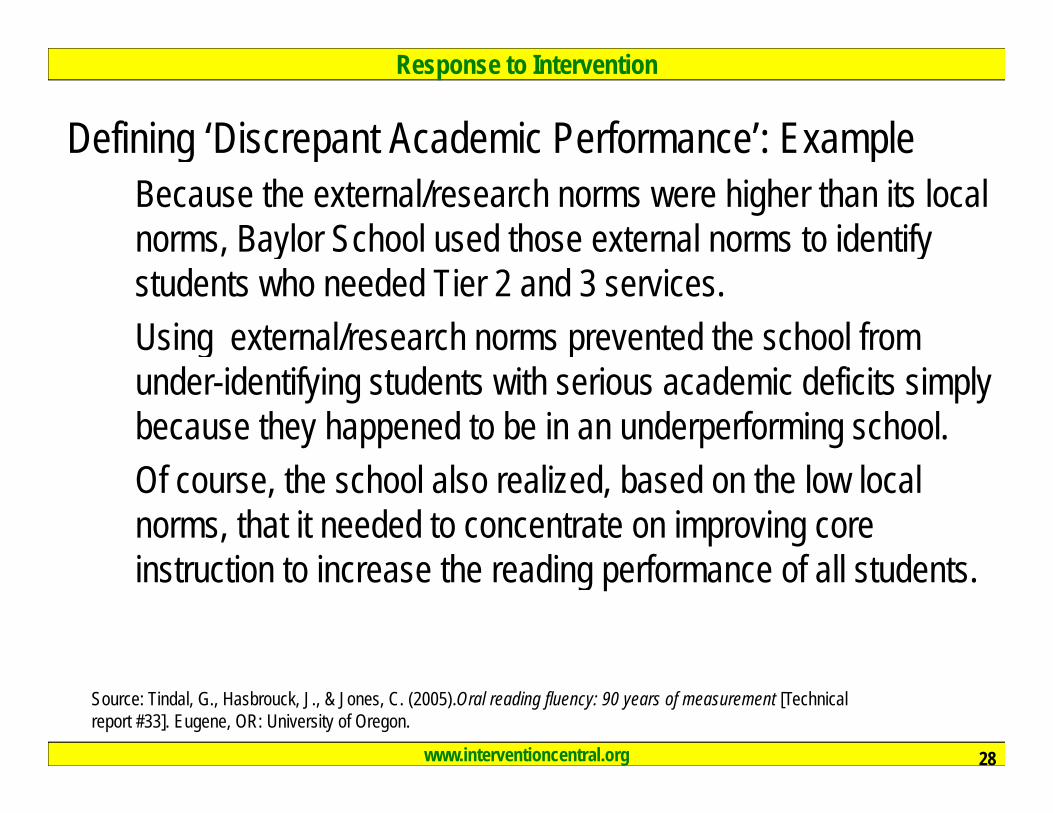
Defining ‘Discrepant Academic Performance’: ExampleDefining Discrepant Academic Performance : ExampleBecause the external/research norms were higher than its local norms, Baylor School used those external norms to identify , y ystudents who needed Tier 2 and 3 services.Using external/research norms prevented the school from g punder-identifying students with serious academic deficits simply because they happened to be in an underperforming school.Of course, the school also realized, based on the low local norms, that it needed to concentrate on improving core i t ti t i th di f f ll t d tinstruction to increase the reading performance of all students.
www.interventioncentral.org 28
Source: Tindal, G., Hasbrouck, J., & Jones, C. (2005).Oral reading fluency: 90 years of measurement [Technical report #33]. Eugene, OR: University of Oregon.

Response to Intervention
Team Activity: What is the ‘Reachable, Teachable’ Range?
• Assume that your school recently completed a gradewide screening for the 3rd grade using DIBELS gradewide screening for the 3 grade using DIBELS Oral Reading Fluency probes and that the results were compiled into local norms.
• What do you believe should be the percentile cut-off (5%?, 10?, 20%?) that your district might set that would demarcate the boundary between Tier 2 reading demarcate the boundary between Tier 2 reading services (the student can be maintained with strong core instruction and supplemental RTI support) and Tier 3 (th t d t d i t i t d 3 (the student needs intensive support and may eventually be a candidate for a special education referral)?
www.interventioncentral.org 29
)

Response to Intervention
Student ‘Rate of Improvement’ (Slope): How to Determine
‘Discrepancy’p y
www.interventioncentral.org

Response to Intervention
Estimating Student Rate of Improvement: What Are the R l ti Ad t f E t l L l G th N ?Relative Advantages of External vs. Local Growth Norms?
• External (Research-Derived) Growth Norms: Provide a general estimate of the expected academic growth of a ‘typical’ student that can be applied across many academic
tti H th t b t ti f settings. However, these norms may not be representative of student performance at a particular school. Local Growth Norms: Provide an estimate of typical growth • Local Growth Norms: Provide an estimate of typical growth for students within a particular school’s population. This provides insight into current levels of student achievement provides insight into current levels of student achievement and the effectiveness of instruction in that building. However, these results cannot easily be applied to other dissimilar
www.interventioncentral.org
yacademic settings.
31

Response to Intervention
Estimating Rates of Academic Growth/SlopeMethods for estimating student academic growth can include:
• Use of existing growth norms drawn from research
www.interventioncentral.org 32
Source: Shapiro, E. S. (2008). Best practices in setting progress-monitoring monitoring goals for academic skill improvement. In A. Thomas & J. Grimes (Eds.), Best practices in school psychology V (pp. 141-157). Bethesda, MD: National Association of School Psychologists.
Response to Intervention
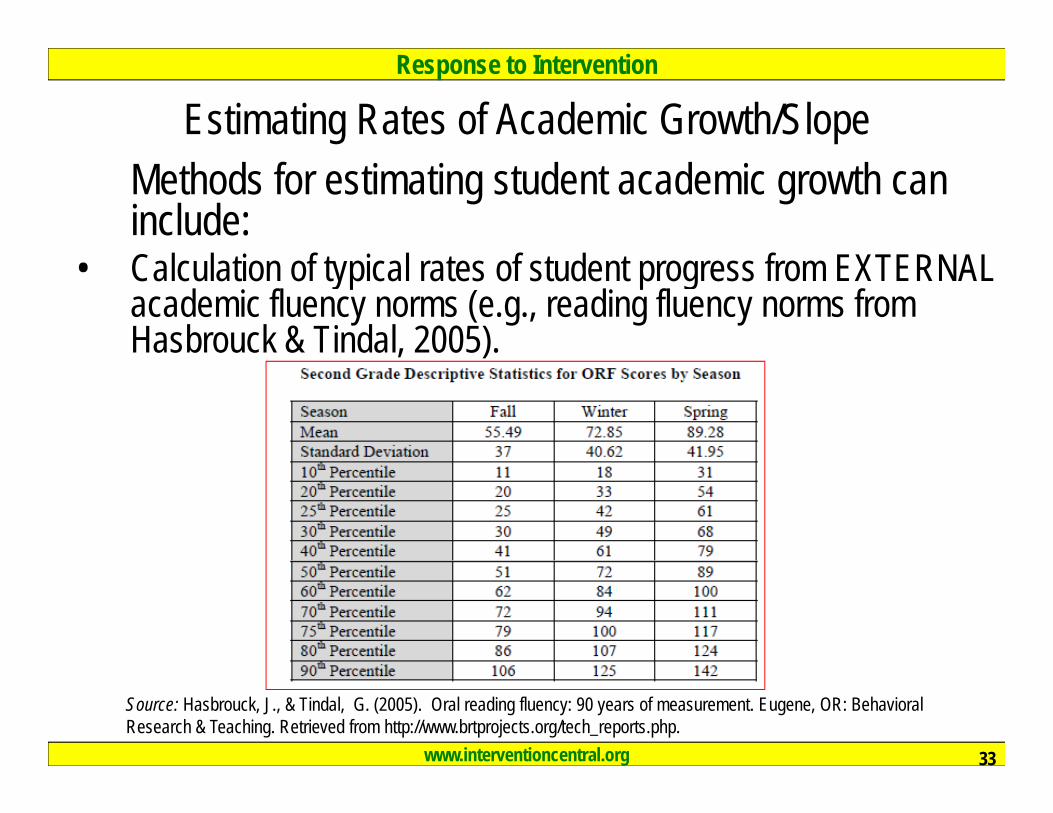
Estimating Rates of Academic Growth/SlopeMethods for estimating student academic growth can include:
• Calculation of typical rates of student progress from EXTERNAL academic fluency norms (e.g., reading fluency norms from Hasbrouck & Tindal, 2005). , )
www.interventioncentral.org 33
Source: Hasbrouck, J., & Tindal, G. (2005). Oral reading fluency: 90 years of measurement. Eugene, OR: Behavioral Research & Teaching. Retrieved from http://www.brtprojects.org/tech_reports.php.

Response to InterventionEstimating Rates of
Academic Growth/Slope Using Academic Growth/Slope Using External Academic Fluency Norms
Estimated student rate of Estimated student rate of improvement from research screening norms can be calculated by estimating calculated by estimating the number of weeks separating each of the fall, winter, and spring screening periods (typically 16 weeks) and using the ordinary least squares (typically 16 weeks) and using the ordinary least squares method in Excel to compute the slope.
• Example: Slope = 1.2 for these research norm screening data: Gr2: Fall: 51 wcpm in school week 3 Gr2: Fall: 72 wcpm in school week 19 G 2 F ll 89 i h l k 35
www.interventioncentral.org 34
Gr2: Fall: 89 wcpm in school week 35Source: Hasbrouck, J., & Tindal, G. (2005). Oral reading fluency: 90 years of measurement. Eugene, OR: Behavioral Research & Teaching. Retrieved from http://www.brtprojects.org/tech_reports.php.

Response to Intervention
Estimating Rates of Academic Growth/SlopeMethods for estimating student academic growth can include:
• Calculation of typical rates of student progress from LOCAL academic fluency norms (e.g., fall, winter, and spring oral reading fluency norms collected in a school).g y )
• All scores can be entered into Excel to generate individual student slopes (estimated rate of improvement) and mean/median slope for the groupmean/median slope for the group.
www.interventioncentral.org 35
Source: Hasbrouck, J., & Tindal, G. (2005). Oral reading fluency: 90 years of measurement. Eugene, OR: Behavioral Research & Teaching. Retrieved from http://www.brtprojects.org/tech_reports.php.

Response to Intervention
How Can a Student’s Rate of Improvement (Slope) Be A l d t S If It i ‘Di t’?Analyzed to See If It is ‘Discrepant’?
There is not yet consensus in the research literature about how to set specific criteria to judge whether a student’s actual rate of academic progress is discrepant from expectations.Two possible methods to determine slope discrepancy are 1. direct comparison of the student slope to the local or
external slope estimate—with a cut-off value to signal that the student is discrepant.
2 l l ti f th t d d d i ti f th l f 2. calculation of the standard deviation for the slopes of student’s in a local norming sample to determine whether a student falls at least one standard deviation below the
www.interventioncentral.org
a student falls at least one standard deviation below the mean slope of the group.
36

Response to InterventionHow Can a Student’s Rate of Improvement (Slope) Be
Analyzed to See If It is ‘Discrepant’? (cont )Analyzed to See If It is Discrepant ? (cont.)Direct Comparison With Research, Local Norms. The student slope can be divided by the local or external slope estimate—with a cut-off p y pvalue (e.g., 0.75 or below) selected to indicate when this comparison value (quotient) is discrepant. NOTE: Any slope comparison quotient <1.0 indicates that the student did not meet growth expectationsindicates that the student did not meet growth expectations.
www.interventioncentral.org 37

Response to InterventionHow Can a Student’s Rate of Improvement (Slope) Be
Analyzed to See If It is ‘Discrepant’? (cont )Analyzed to See If It is Discrepant ? (cont.)Comparison of the Student Slope to a Slope Derived from Local Norms. For schools that screen all students three times per Local Norms. For schools that screen all students three times per year on brief academic measures such as DIBELS Oral Reading Fluency, an individual slope can be computed for each student screened. The school can then use an Excel spreadsheet to enter the student screening data, and calculate slopes for each student based on the full year of screening data collected. Any individual student whose rate of improvement or slope is found to be at student whose rate of improvement, or slope, is found to be at least one standard deviation below that of the mean for the group would be considered ‘discrepant’ (Burns & Gibbons, 2008).
www.interventioncentral.org
would be considered discrepant (Burns & Gibbons, 2008).
38
Source: Burns, M. K., & Gibbons, K. A. (2008). Implementing response-to-intervention in elementary and secondary schools. Routledge: New York.

Response to Intervention
Team Activity: Student Slope Exercise
• View the slope comparisons below. What conclusions would you draw from them about the student?would you draw from them about the student?
www.interventioncentral.org 39

Response to Intervention
Team Activity: Student Slope Exercise
• View the slope comparisons below. What conclusions would you draw from them about the student?would you draw from them about the student?
www.interventioncentral.org 40

Response to Intervention
Evaluating a Student’s ‘Non-Responder’ Status: An RTI
Checklist
www.interventioncentral.org

Response to Intervention
www.interventioncentral.org

Response to Intervention
Special Education Eligibility Team & RTI I f ti R d tiInformation: Recommendations
• Create guidelines for general education to use to Create guidelines for general education to use to determine whether a student is a ‘non-responder’ under RTI. NOTE: Such guidelines responder under RTI. NOTE: Such guidelines are for the sole use of general education and should not be interpreted as RTI ‘special should not be interpreted as RTI special education eligibility criteria’.
• Create a checklist for schools to collect collate • Create a checklist for schools to collect, collate, and ‘package’ RTI information for presentation to the Special Education Eligibility Team
www.interventioncentral.org
the Special Education Eligibility Team.
43

Response to Intervention
Special Education Eligibility Team & RTI I f ti R d ti (C t )Information: Recommendations (Cont.)
• RTI information should be reviewed prior to the initial LD peligibility meeting. If there is questionable information, the Special Education Eligibility Team should contact the school to clarify questions.
• At the actual eligibility meeting, any concerns or questions b t th RTI i f ti h ld b f d i t l about the RTI information should be framed in neutral
terms and tied to the dual discrepancy RTI LD model. Whenever possible schools should not feel ‘blamed’ for Whenever possible, schools should not feel blamed for shortcomings of RTI information and should feel that the identification process is transparent.
www.interventioncentral.org
p p
44

Response to Intervention
Special Education Eligibility Team & RTI I f ti R d ti (C t )Information: Recommendations (Cont.)
It should be an expectation that at eligibility meetings:It should be an expectation that at eligibility meetings:• The Special Education Eligibility Team can ask for
clarification of any building RTI information clarification of any building RTI information presentedThe Team is able to artic late ho it interprets • The Team is able to articulate how it interprets information and why it reaches its decision.
www.interventioncentral.org 45

Response to InterventionEvaluating a Student’s ‘Non-Responder’
St t A RTI Ch kli tStatus: An RTI ChecklistInterventions: Evidence-Based & Implemented With e e o s de ce ased & p e e ed
Integrity• Tier 1: High-Quality Core InstructionTier 1: High Quality Core Instruction• Tier 1: Classroom Intervention• Tier 2 & 3 Interventions: Minimum Number & LengthTier 2 & 3 Interventions: Minimum Number & Length• Tier 2 & 3 Interventions: Essential Elements• Tier 1 2 & 3 Interventions: Intervention Integrity• Tier 1, 2, & 3 Interventions: Intervention Integrity
www.interventioncentral.org 46

Response to InterventionEvaluating a Student’s ‘Non-Responder’
Status: ActivityStatus: ActivityAt your table: Review these ‘RTI Non-Responder’ elements elements. • Tier 1: High-Quality Core Instruction• Tier 1: Classroom InterventionTier 1: Classroom Intervention• Tier 2 & 3 Interventions: Minimum Number &
Lengthg• Tier 2 & 3 Interventions: Essential Elements• Tier 1, 2, & 3 Interventions: Intervention Integrity
Select the element that you see as your school or district’s greatest challenge Brainstorm ideas to
www.interventioncentral.org 47
district s greatest challenge. Brainstorm ideas to positively address that challenge.

Response to Intervention
www.interventioncentral.org

Response to Intervention
www.interventioncentral.org

Response to Intervention
www.interventioncentral.org

Response to Intervention
www.interventioncentral.org

Response to Intervention
www.interventioncentral.org

Response to InterventionEvaluating a Student’s ‘Non-Responder’
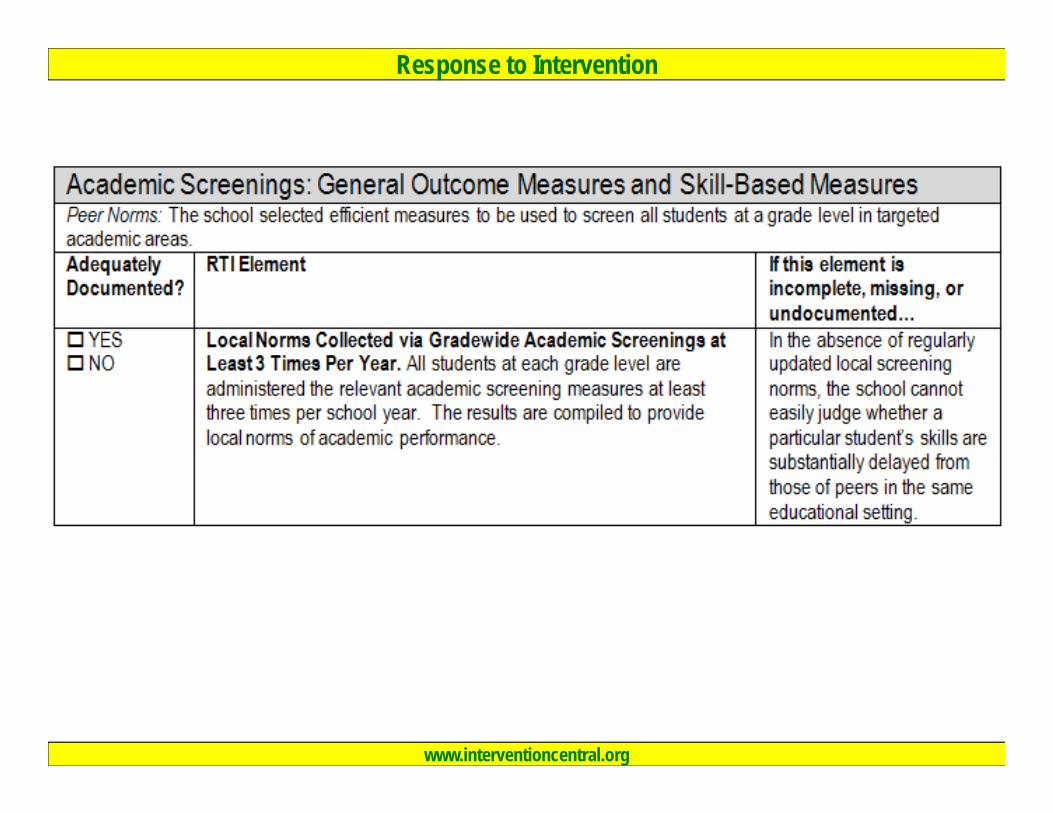
St t A RTI Ch kli tStatus: An RTI ChecklistAcademic Screenings: General Outcome Measures cade c Sc ee gs Ge e a Ou co e easu es
and Skill-Based Measures• Selection of Academic Screening MeasuresSelection of Academic Screening Measures• Local Norms Collected via Gradewide Academic
Screenings at Least 3 Times Per Yearg
www.interventioncentral.org 53

Response to Intervention
www.interventioncentral.org
Response to Intervention
www.interventioncentral.org

Response to InterventionEvaluating a Student’s ‘Non-Responder’
St t A RTI Ch kli tStatus: An RTI ChecklistDual Discrepancy Cut-Offs: Academic Skill Level and ua sc epa cy Cu O s cade c S e e a d
Student Rate of Improvement • Cut-point Established to Define ‘Severely Discrepant’ Cut point Established to Define Severely Discrepant
Academic Performance• Cut-Off Criterion Selected to Define Discrepant Slopep p
www.interventioncentral.org 56

Response to Intervention
www.interventioncentral.org

Response to Intervention
www.interventioncentral.org

Response to InterventionEvaluating a Student’s ‘Non-Responder’
St t A RTI Ch kli tStatus: An RTI ChecklistData Collectiona a Co ec o• Use of Both ‘Off-Level’ and Enrolled Grade-Level
Benchmarks & Progress-Monitoring Measures to g gAssess Student Skills and Growth
• Student Baseline Calculated• Student Goal Calculated• Regular Progress-Monitoring Conductedg g g
www.interventioncentral.org 59

Response to Intervention
www.interventioncentral.org

Response to Intervention
www.interventioncentral.org

Response to Intervention
www.interventioncentral.org

Response to Intervention
www.interventioncentral.org

Response to InterventionEvaluating a Student’s ‘Non-Responder’
St t A RTI Ch kli tStatus: An RTI ChecklistApplication of RTI Decision Rules to a Particular pp ca o o ec s o u es o a a cu a
Student Case • Despite the Tier 2/3 Interventions Attempted, the Despite the Tier 2/3 Interventions Attempted, the
Student’s Skills Continue to Fall Below the Boundary of ‘Severely Discrepant’ Academic Performance
• Despite the Tier 2/3 Interventions Attempted, the Student’s Rate of Improvement (Slope) Continues to Be Discrepant
www.interventioncentral.org 64

Response to Intervention
www.interventioncentral.org

Response to InterventionEvaluating a Student’s ‘Non-Responder’
Status: ActivityStatus: ActivityAt your table: Discuss how your school or district may use the document Evaluating a Student’s ‘Nonuse the document Evaluating a Student s Non-Responder’ Status: An RTI Checklist to:
• increase compliance at every link in the ‘RTI chain’• develop specific decision rules for determining p p g
whether a student referred for a possible Learning Disability is a ‘non-responder’ to intervention
Be prepared to share the main points of your discussion with the large group
www.interventioncentral.org 66
discussion with the large group.
Related Documents