In cooperation with the Texas Parks and Wildlife Department and the University of Texas Bureau of Economic Geology Indications and Potential Sources of Change in Sand Transport in the Brazos River, Texas Water-Resources Investigations Report 01–4057 U.S. Department of the Interior U.S. Geological Survey

Welcome message from author
This document is posted to help you gain knowledge. Please leave a comment to let me know what you think about it! Share it to your friends and learn new things together.
Transcript
In cooperation with the Texas Parks and Wildlife Departmentand the University of Texas Bureau of Economic Geology
Indications and Potential Sources of Change in Sand Transport in the Brazos River, Texas
Water-Resources Investigations Report 01–4057
U.S. Department of the InteriorU.S. Geological Survey

U.S. Department of the InteriorU.S. Geological Survey
Indications and Potential Sources of Change in Sand Transport in the Brazos River, Texas
By David D. Dunn and Timothy H. Raines
U.S. GEOLOGICAL SURVEYWater-Resources Investigations Report 01–4057
In cooperation with the Texas Parks and Wildlife Departmentand the University of Texas Bureau of Economic Geology
Austin, Texas2001

ii
U.S. DEPARTMENT OF THE INTERIOR
Gale A. Norton, Secretary
U.S. GEOLOGICAL SURVEY
Charles G. Groat, Director
Any use of trade, product, or firm names is for descriptive purposes only and does not imply endorsement by the U.S. Government.
For additional information write to
District ChiefU.S. Geological Survey8027 Exchange Dr.Austin, TX 78754–4733E-mail: [email protected]
Copies of this report can be purchased from
U.S. Geological SurveyBranch of Information ServicesBox 25286Denver, CO 80225–0286E-mail: [email protected]

CONTENTS iii
CONTENTS
Abstract ................................................................................................................................................................................ 1
Introduction .......................................................................................................................................................................... 1
Purpose and Scope .................................................................................................................................................... 3
Description of the Brazos River Basin ..................................................................................................................... 3
Suspended-Sediment Data-Collection Methods ....................................................................................................... 6
Previous Studies of Sediment Transport in the Brazos River ................................................................................... 8
Capacity of the Brazos River to Transport Sand ...................................................................................................... 9
Indications of Change in Sand Transport ............................................................................................................................. 12
Changes in Channel Geometry ................................................................................................................................. 12
Changes in Suspended-Sediment Characteristics ..................................................................................................... 15
Changes in Discharge ............................................................................................................................................... 21
Potential Sources of Change in Sand Transport ................................................................................................................... 25
Reservoir Construction ............................................................................................................................................. 25
Changes in Land Use ................................................................................................................................................ 26
Instream Sand and Gravel Mining ............................................................................................................................ 26
Summary .............................................................................................................................................................................. 30
References Cited .................................................................................................................................................................. 31
FIGURES
1. Map showing Texas Gulf of Mexico shoreline ..................................................................................................... 2
2. Map showing Brazos River Basin, Texas ............................................................................................................. 3
3. Photograph showing typical cut bank on the Brazos River, Texas ....................................................................... 4
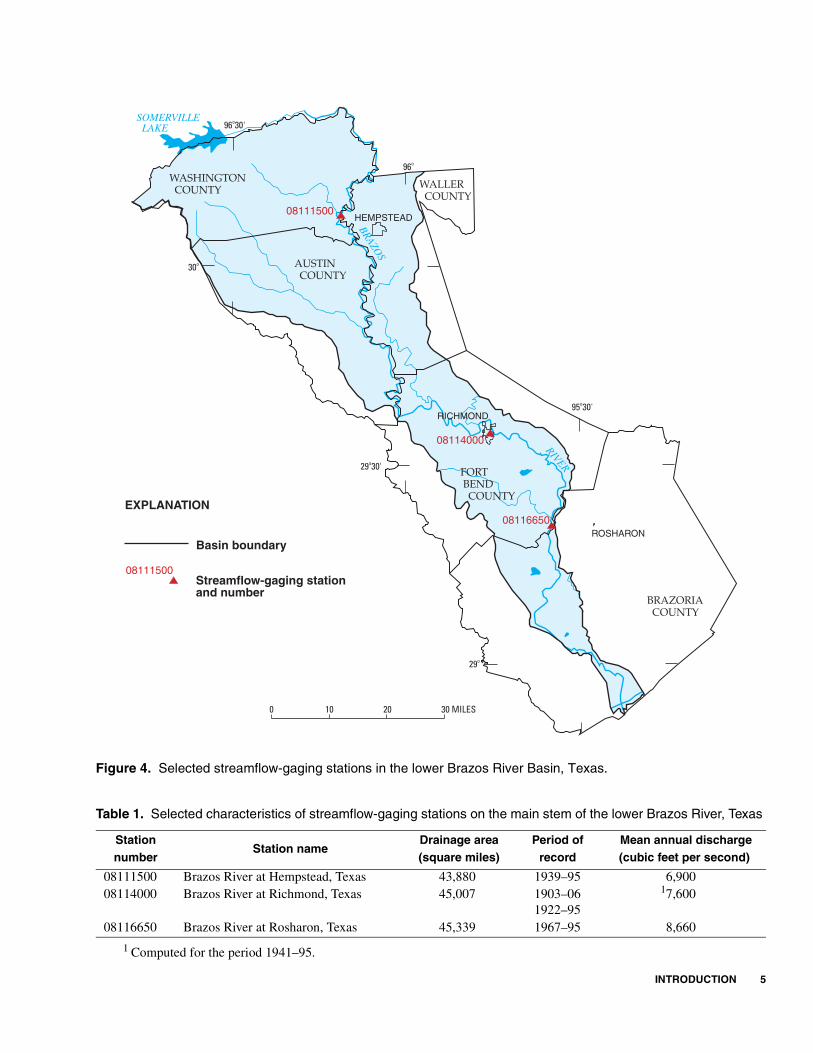
4. Map showing location of selected streamflow-gaging stations in the lower Brazos River Basin, Texas ............. 5
5–7. Graphs showing:
5. Historical development of reservoir conservation storage capacity in the Brazos River Basin,
Texas .......................................................................................................................................................... 6
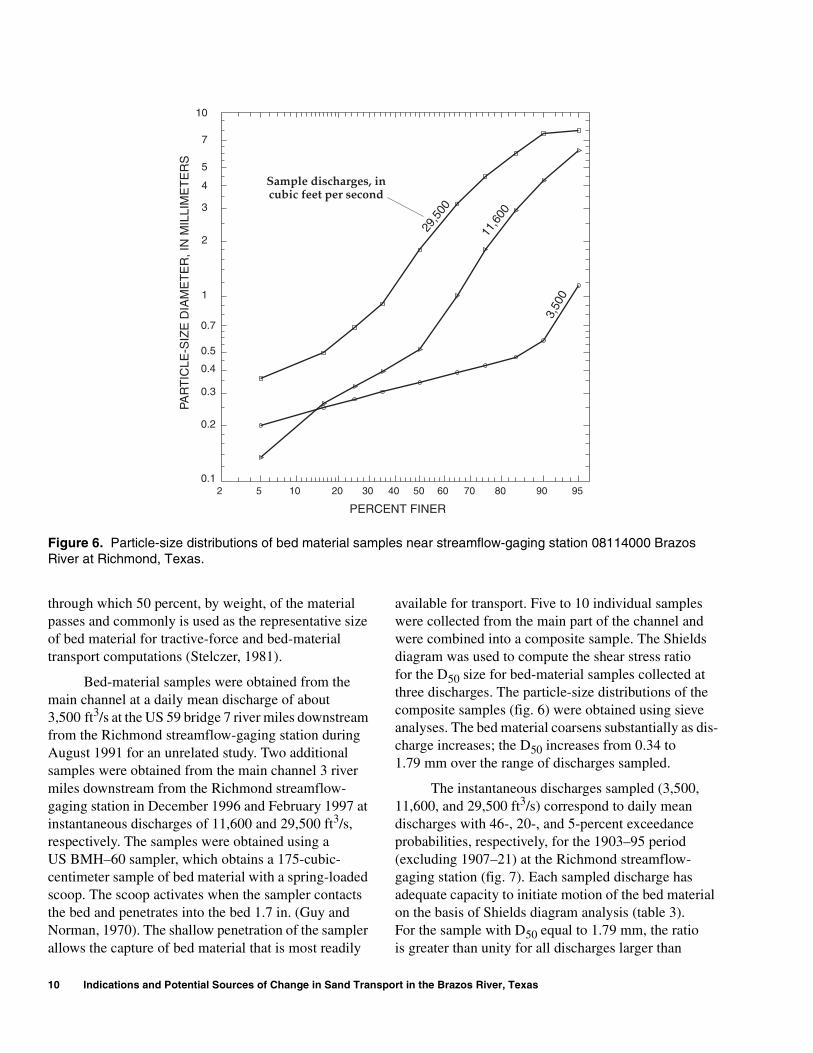
6. Particle-size distributions of bed material samples near streamflow-gaging station 08114000
Brazos River at Richmond, Texas .............................................................................................................. 10
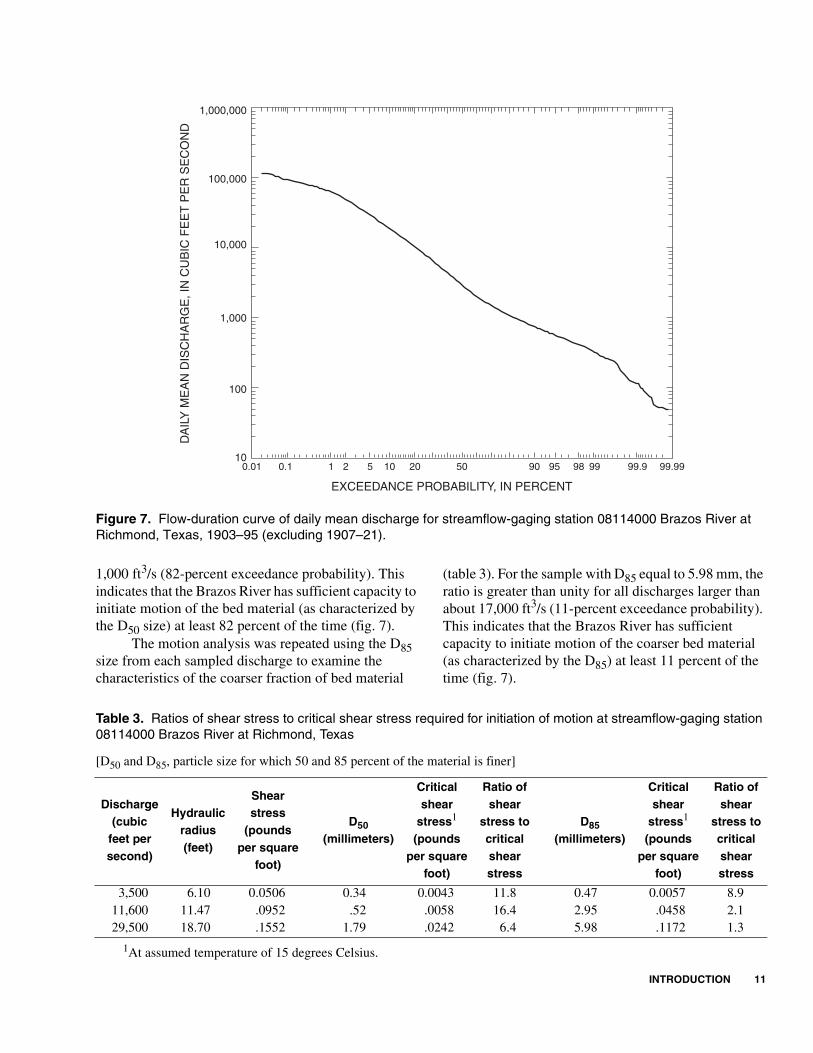
7. Flow-duration curve of daily mean discharge for streamflow-gaging station 08114000 Brazos
River at Richmond, Texas, 1903–95 (excluding 1907–21) ....................................................................... 11
8–10. Graphs showing stage-discharge relation at streamflow-gaging station:
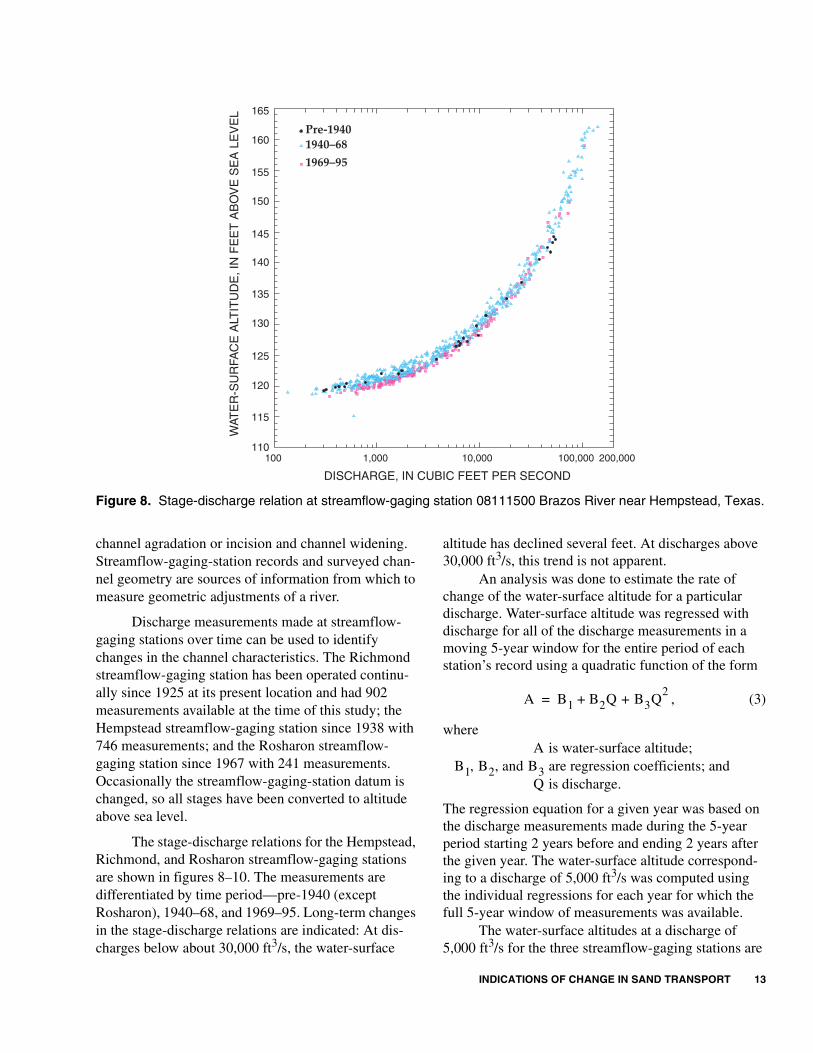
8. 08111500 Brazos River near Hempstead, Texas ....................................................................................... 13
9. 08114000 Brazos River at Richmond, Texas ............................................................................................. 14
10. 08116650 Brazos River near Rosharon, Texas .......................................................................................... 14
11–13. Graphs showing water-surface altitudes at a discharge of 5,000 cubic feet per second at streamflow-
gaging station:
11. 08111500 Brazos River near Hempstead, Texas ....................................................................................... 15
12. 08114000 Brazos River at Richmond, Texas ............................................................................................. 16
13. 08116650 Brazos River near Rosharon, Texas .......................................................................................... 16
iv
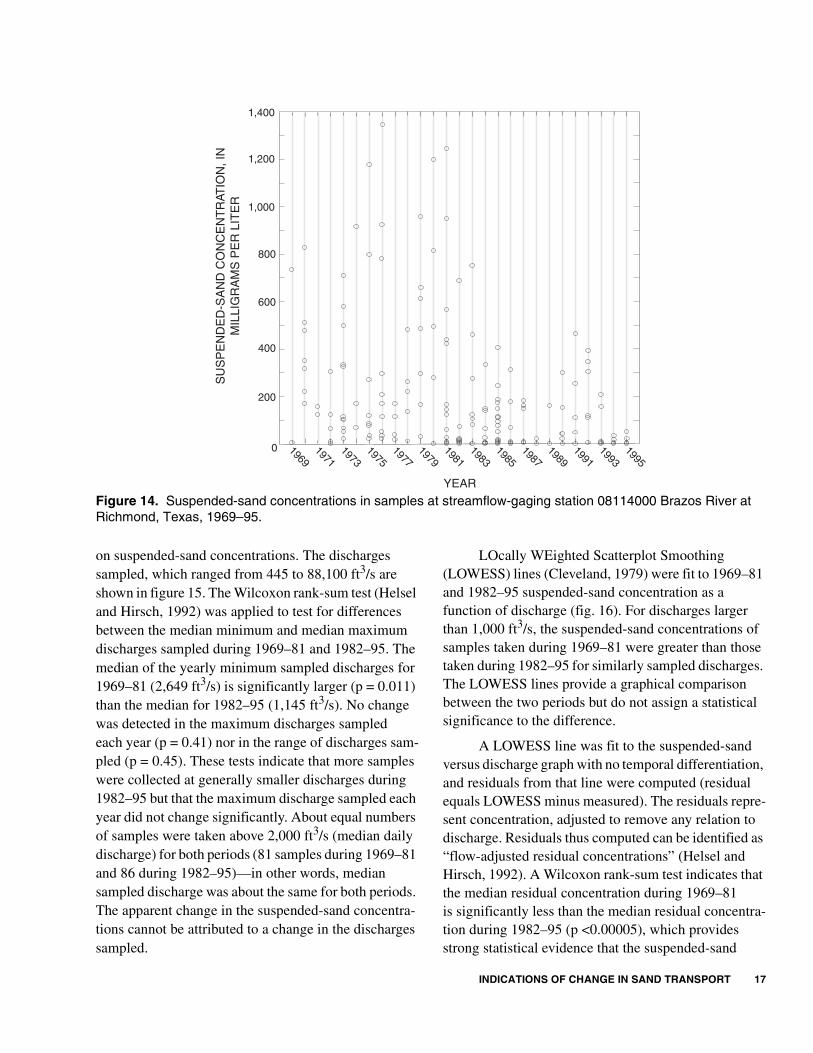
14–18. Graphs showing: 14. Suspended-sand concentrations in samples at streamflow-gaging station 08114000 Brazos River
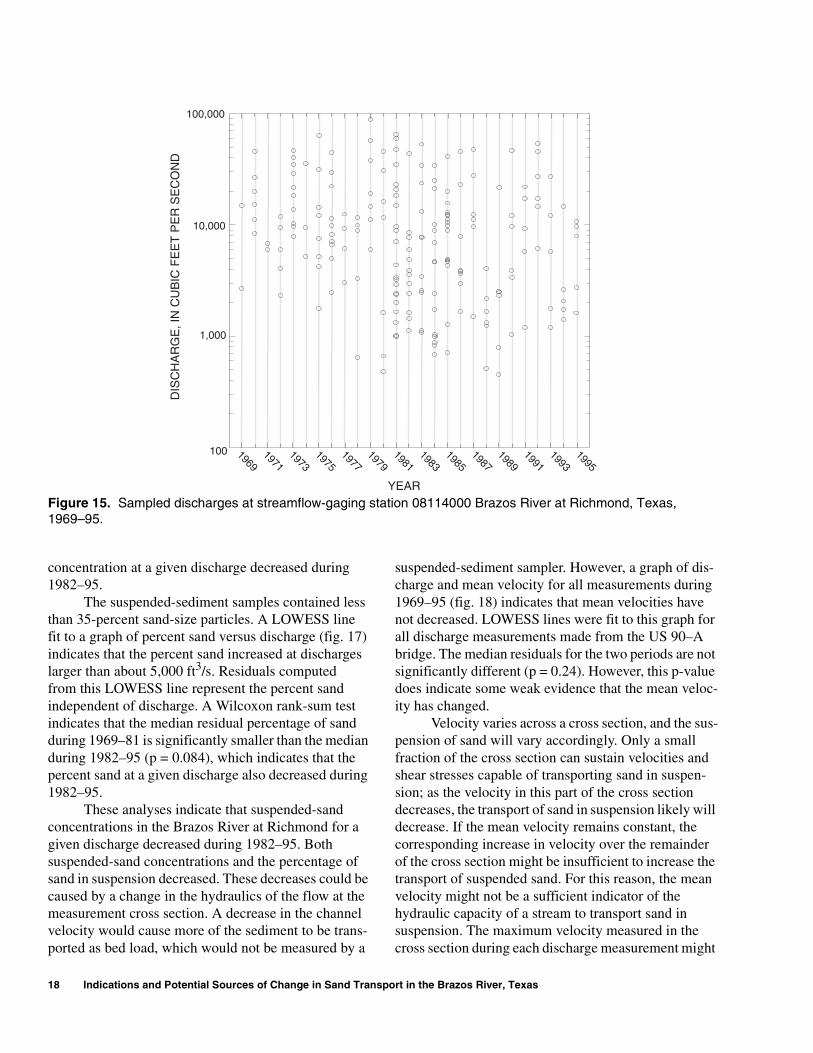
at Richmond, Texas, 1969–95 .................................................................................................................... 1715. Sampled discharges at streamflow-gaging station 08114000 Brazos River at Richmond, Texas,
1969–95 ...................................................................................................................................................... 1816. Relation of suspended-sand concentration to discharge at streamflow-gaging station 08114000
Brazos River at Richmond, Texas, 1969–95 .............................................................................................. 1917. Relation of percent sand in suspended-sediment samples to discharge at streamflow-gaging
station 08114000 Brazos River at Richmond, Texas, 1969–95 ................................................................. 1918. Relation of mean channel velocity to discharge at streamflow-gaging station 08114000 Brazos
River at Richmond, Texas, 1969–95 .......................................................................................................... 2019–20. Graphs showing flow-duration curves of daily mean discharge for streamflow-gaging station:
19. 08111500 Brazos River near Hempstead, Texas, 1940–68 and 1969–95 .................................................. 2120. 08114000 Brazos River at Richmond, Texas, pre-1940, 1940–68, and 1969–95 ...................................... 22
21–23. Graphs showing: 21. Suspended-sand transport curve for streamflow-gaging station 08114000 Brazos River at
Richmond, Texas ........................................................................................................................................ 2422. Annual suspended-sand loads at streamflow-gaging station 08114000 Brazos River at Richmond,
Texas .......................................................................................................................................................... 2423. Total acres harvested in the 27 counties in the lower Brazos River Basin, Texas ...................................... 27
24. Map showing location of selected sand and gravel production sites in the lower Brazos River Basin,
Texas ..................................................................................................................................................................... 28
25–26. Graphs showing: 25. Total annual weight of sand extracted and annual loads of suspended sand transported in the
Brazos River between Hempstead and Rosharon, Texas, 1979–95 ........................................................... 2926. Cumulative annual weight of sand extracted and annual loads of suspended sand transported in
the Brazos River between Hempstead and Rosharon, Texas, 1979–95 ..................................................... 29
TABLES
1. Selected characteristics of streamflow-gaging stations on the main stem of the lower Brazos River, Texas ....... 52. Selected characteristics of the 13 largest reservoirs in the Brazos River Basin, Texas ........................................ 73. Ratios of shear stress to critical shear stress required for initiation of motion at streamflow-gaging station
08114000 Brazos River at Richmond, Texas ........................................................................................................ 114. Summary of statistical tests for differences in annually computed daily flow percentiles between the
pre-1940 period and the 1969–95 period at streamflow-gaging station 08114000 Brazos River at Richmond, Texas ................................................................................................................................................... 23

Abstract 1
Indications and Potential Sources of Change in Sand Transport in the Brazos River, Texas
By David D. Dunn and Timothy H. Raines
Abstract
Changes in the capacity of the Brazos River to transport sand can be identified within the context of Lane’s relation through changes in channel geometry, changes in the characteristics of suspended loads, and changes in discharge. The Brazos River channel has been undergoing continual adjustment since the 1940s. For a dis-charge of 5,000 cubic feet per second, the water-surface altitude has decreased 2 to 4 feet at the Hempstead and Richmond streamflow-gaging stations between 1940 and 1995. The characteris-tics of suspended-sediment samples at the Richmond streamflow-gaging station have changed between the periods 1969–81 and 1982–95. The amount of sand-size sediment transported in suspension has decreased. The distribution of both daily and annual-peak discharges has changed. However, the computed annual loads of suspended sand indicate no statistically significant change in the median annual load.
The transport of sand in the Brazos River depends on a complex set of factors, most of which are continually changing. Potential sources of change in sand transport in the Brazos River include the effects of reservoir construction, changes in land use, and instream sand and gravel mining. Extensive reservoir construction in the Brazos River Basin has reduced sand transport by trapping sediment and by reducing the magnitude of peak discharges. However, reductions in sand transport associated with reservoir construction apparently are compensated for by increases asso-ciated with tributary sediment inflow and localized bank erosion. The total area of harvested acres of non-hay crops in the lower Brazos River Basin
during 1924–92 decreased more than 75 percent from about 32 percent to about 8 percent of the total area. Correspondingly, erosion potential has decreased substantially. Several sand and gravel mining sites are located on the Brazos River between Hempstead and Rosharon. The quantity of sediment extracted by instream sand and gravel mining operations could represent from 11 to 25 percent of the total sand transported by the Brazos River. The effects of mining on sand transport could not be quantified.
INTRODUCTION
The sand that constitutes much of the Texas shoreline along the Gulf of Mexico (fig. 1) is in contin-ual motion. Tides, storm surges, wave action, wind, river processes, and longshore (littoral) drift act upon the sand and transport it along the shoreline to form and erode beaches, barrier islands, and peninsulas. Some of the sand supplied to this process originates in upland areas and is transported to the Gulf of Mexico by rivers and streams. Most of these rivers and streams discharge into bays or estuaries, which eventually will fill with sediment. Three of the largest rivers in Texas, the Brazos River, the Colorado River, and the Rio Grande, have filled their respective estuaries and have propa-gated deltas seaward (McGowen and others, 1977).
Longshore drift transports sand from the river deltas to other locations along the coast. The longshore drift generally moves material in a southwesterly direc-tion along the coast from Port Arthur to south of Corpus Christi. An opposing current moves material in a north-erly direction from the Mexico coastline toward Corpus Christi. A zone of convergence, also called a zone of stagnation, occurs at a latitude of about 27 degrees north. The exact location varies with prevailing tidal and weather patterns.

2 Indications and Potential Sources of Change in Sand Transport in the Brazos River, Texas
The Brazos River, Colorado River, Rio Grande, and the smaller San Bernard River are the only sources of additional sand supplied to the Texas Gulf beaches from outside the coastal system (McGowen and others, 1977). Sargent Beach, located south of the Brazos River mouth, has undergone more than 1,500 feet (ft) of inland erosion since the mid 1800s, or an average of
about 12 feet per year (ft/yr). Short-term erosion rates of as much as 36 ft/yr have been documented by Morton and Pieper (1975) and Seelig and Sorenson (1973). Stauble and others (1994) state that Sargent Beach is eroding at a faster rate than any other Texas beach, and that the rate of erosion is due to a lack of sand-size material in the system. The lack of sand-size material in
LOCATION MAP
TEXAS
Longshore drift
Longshore drift
Sargent Beach
GULF OF M
EXICO
SAB
INE
MEXICO
UNITED STATES
CO
LORAD
O
RIV
ER
RIVER
BR
AZO
S
TR
INIT
Y
RIVER
RIO GRANDE
SAN
BERNARD
RIVER
GUADALUPE
RIVER
RIVER
RIVER
SAN ANTONIO
NUECES
RIV
ER
CORPUS CHRISTI
HOUSTON
BEAUMONT
PORT ARTHUR
98o 97o 96o 95o 94o
26o
27o
28o
29o
30o
0 20 40 60 MILES
Figure 1. Texas Gulf of Mexico shoreline.
INTRODUCTION 3
the system has been attributed to a decreased supply of sand from the Brazos River by several researchers (Mathewson and Minter, 1976; Seelig and Sorenson, 1973; Stauble and others, 1994).
In 1995, the U.S. Geological Survey (USGS), in cooperation with the Texas Parks and Wildlife Depart-ment (TPWD) and the University of Texas Bureau of Economic Geology, began a study of sand transport in the Brazos River.
Purpose and Scope
This report describes the transport of sand-size sediment in the Brazos River and describes apparent changes in this sand transport with several indicators. The apparent changes are compared to potential
causative sources, including reservoir construction, land-use changes, and instream sand and gravel mining. Sand-size sediment in this report refers to sediment particles having a sieve diameter larger than 0.062 millimeter (mm). Available stage, discharge, and suspended-sediment data collected at three Brazos River streamflow-gaging stations operated by the USGS, and bed-material data collected near Richmond, Tex., are analyzed for the period 1903–95 (excluding 1907–21).
Description of the Brazos River Basin
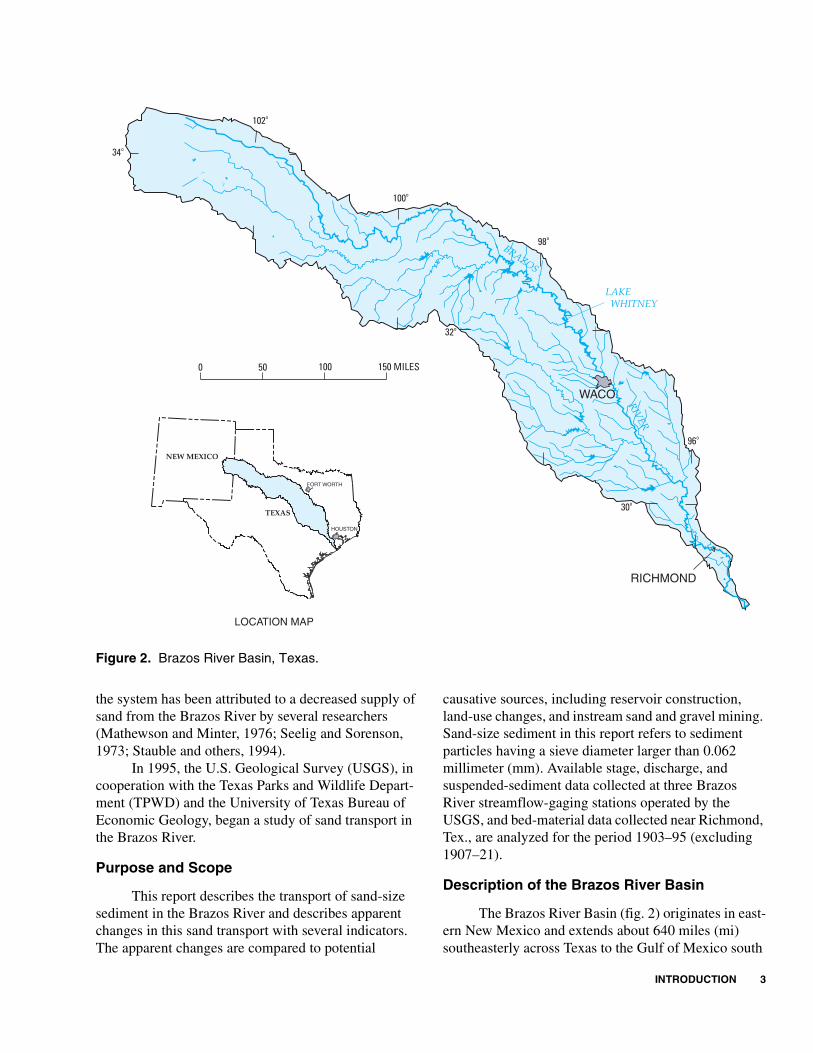
The Brazos River Basin (fig. 2) originates in east-ern New Mexico and extends about 640 miles (mi) southeasterly across Texas to the Gulf of Mexico south
RIVER
BRAZOS
LAKE WHITNEY
NEW MEXICO
TEXAS
LOCATION MAP
0 50 100 150 MILES
100o
98o
96o
102o
30o
32o
34o
RICHMOND
WACO
FORT WORTH
HOUSTON
Figure 2. Brazos River Basin, Texas.
4 Indications and Potential Sources of Change in Sand Transport in the Brazos River, Texas
of Houston. The upper basin is about 70 mi wide in the northwestern part of Texas, expands to a maximum width of 110 mi near Waco, and constricts to about 10 mi wide near Richmond in the lower basin. The Brazos River and its tributaries drain an area of about 45,600 square miles (mi2). About 9,570 mi2 of the upper part of the basin, including all of the area in New Mexico, does not contribute to downstream flows.
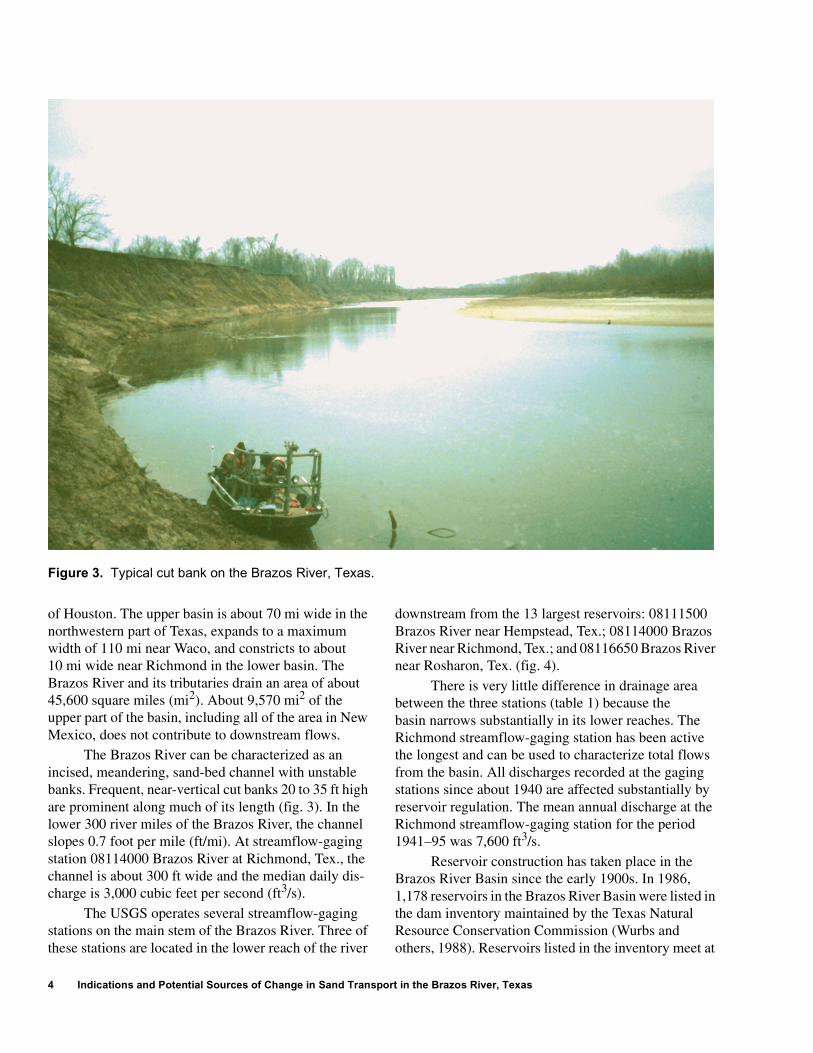
The Brazos River can be characterized as an incised, meandering, sand-bed channel with unstable banks. Frequent, near-vertical cut banks 20 to 35 ft high are prominent along much of its length (fig. 3). In the lower 300 river miles of the Brazos River, the channel slopes 0.7 foot per mile (ft/mi). At streamflow-gaging station 08114000 Brazos River at Richmond, Tex., the channel is about 300 ft wide and the median daily dis-charge is 3,000 cubic feet per second (ft3/s).
The USGS operates several streamflow-gaging stations on the main stem of the Brazos River. Three of these stations are located in the lower reach of the river
downstream from the 13 largest reservoirs: 08111500 Brazos River near Hempstead, Tex.; 08114000 Brazos River near Richmond, Tex.; and 08116650 Brazos River near Rosharon, Tex. (fig. 4).
There is very little difference in drainage area between the three stations (table 1) because the basin narrows substantially in its lower reaches. The Richmond streamflow-gaging station has been active the longest and can be used to characterize total flows from the basin. All discharges recorded at the gaging stations since about 1940 are affected substantially by reservoir regulation. The mean annual discharge at the Richmond streamflow-gaging station for the period 1941–95 was 7,600 ft3/s.
Reservoir construction has taken place in the Brazos River Basin since the early 1900s. In 1986, 1,178 reservoirs in the Brazos River Basin were listed in the dam inventory maintained by the Texas Natural Resource Conservation Commission (Wurbs and others, 1988). Reservoirs listed in the inventory meet at
Figure 3. Typical cut bank on the Brazos River, Texas.
INTRODUCTION 5
Table 1. Selected characteristics of streamflow-gaging stations on the main stem of the lower Brazos River, Texas
1 Computed for the period 1941–95.
Stationnumber
Station nameDrainage area(square miles)
Period ofrecord
Mean annual discharge(cubic feet per second)
08111500 Brazos River at Hempstead, Texas 43,880 1939–95 6,90008114000 Brazos River at Richmond, Texas 45,007 1903–06
1922–95
17,600
08116650 Brazos River at Rosharon, Texas 45,339 1967–95 8,660
BRAZOS
RIVER
SOMERVILLE LAKE
WASHINGTON COUNTY
AUSTIN COUNTY
WALLER COUNTY
FORT BEND COUNTY
BRAZORIA COUNTY
HEMPSTEAD
96o
96o30'
95o30'
30o
29o30'
29o
0 10 20 30 MILES
RICHMOND
ROSHARON
08111500
08114000
08116650
Streamflow-gaging stationand number
EXPLANATION
08111500
Basin boundary
Figure 4. Selected streamflow-gaging stations in the lower Brazos River Basin, Texas.

6 Indications and Potential Sources of Change in Sand Transport in the Brazos River, Texas
least one of the following two criteria: (1) storage capacity of 15 acre-feet (acre-ft) or greater and dam height of 25 ft or greater or (2) storage capacity of 50 acre-ft or greater and dam height of 6 ft or greater (Wurbs and others, 1988). Of 1,178 reservoirs, 13 con-tain 88 percent of the controlled storage in the Brazos River Basin. Nine of those 13 reservoirs are operated by the U.S. Army Corps of Engineers for flood control and contain all of the designated flood-control storage in the basin. Table 2 shows a summary of reservoir storage for the 13 largest reservoirs. Three of the reservoirs, includ-ing the largest, Lake Whitney, are located on the main stem of the Brazos River.
The rate of reservoir construction increased substantially during 1940–69 (fig. 5). Three periods can be identified: early (pre-1940), middle (1940–68), and late (1969–95). The early period reflects a time when relatively little reservoir construction occurred. The middle period reflects a time when reservoir conserva-tion storage in the basin increased from 258,675 to 3,589,014 acre-ft (more than 1,300 percent), and the late period reflects a time when reservoir conservation storage increased at a slower rate to 4,613,800 acre-ft (about 29 percent).
Land use in the Brazos River Basin is predomi-nantly agricultural and open rangeland. The dominant crops produced in the basin are cotton, corn, and sorghum (U.S. Department of Agriculture, 1997).
Suspended-Sediment Data-Collection Methods
The Texas Water Development Board (TWDB) and the USGS are the primary agencies that have collected sediment data from the Brazos River. The dif-ferent sampling methods used by the agencies make the comparison of data difficult, particularly when analyz-ing the transport of sand-size particles. Only data col-lected by the USGS were analyzed in this study. The rationale for this decision is presented in the following discussion.
The TWDB has collected periodic suspended-sediment samples from streams in Texas, including the Brazos River, since the early 1900s. These data have been published in several compilation reports such as that by Dougherty (1979). The samples were collected using a device known as the “Texas sampler.” The Texas sampler consists of a 15-inch (in.) hanger bar to which a sheet-metal bottle holder is fastened. Below the bottle
Figure 5. Historical development of reservoir conservation storage capacity in the Brazos River Basin, Texas (R.M. Slade, Jr., U.S. Geological Survey, written commun., 1999).
5,000,000
4,500,000
4,000,000
3,500,000
3,000,000
2,500,000
2,000,000
1,500,000
1,000,000
500,000
0
CU
MU
LAT
IVE
RE
SE
RV
OIR
STO
RA
GE
CA
PAC
ITY,
IN A
CR
E-F
EE
T
1900 1910 1920 1930 1940 1950 1960 1970 1980 1990
YEAR

INTRODUCTION 7
holder, a 15-pound current-meter weight is attached. An 8-ounce small-mouth bottle is placed vertically in the bottle holder. The bottle is lowered about 1 ft below the water surface and brought to the surface when air bub-bles cease emanating from the bottle. The mean sedi-ment concentration of the stream is computed as the average concentration of three samples taken at points one-fifth, one-half, and five-sixths of the distance across the river (Mathewson and Minter, 1976; Welborn, 1967), or from the concentration of a single sample taken at midstream (Dougherty, 1979).
The USGS has collected periodic and daily suspended-sediment data at the Brazos River at the Richmond gaging station since 1957. These data were collected using depth-integrating samplers as described by Edwards and Glysson (1999) and developed through the Federal Interagency Sedimentation project. The depth-integrating samplers consist of a streamlined body with a nozzle that leads to a sample bottle placed inside the sampler body. An exhaust port releases air as it is replaced with the water-sediment mixture. Vanes on the sampler body orient the nose of the sampler into the current. The sampler is lowered from the water surface to the streambed and returned at a constant rate. The sampler continuously collects the water-sediment
mixture over the entire vertical water column, except for the bottom 0.3 ft. The sampler nozzle and exhaust ports are designed so that samples are taken isokinetically—that is, the velocity of the water inside the sampler nozzle is the same as that of the surrounding water. This ensures that the sample is representative. Samples are obtained from multiple points across the stream by either the equal-width-increment (EWI) or the equal-discharge-increment (EDI) method (Edwards and Glysson, 1999). The mean sediment concentration of the stream is determined by the composite concentra-tion of EWI samples or by discharge-weighting the con-centrations of the individual EDI samples.
Suspended-sediment concentration varies with depth. Generally, silts and clays are uniformly distrib-uted with depth, but the larger sand-size particles are present in greater concentration near the streambed because greater turbulence and shear stress are required to suspend them. For this reason, a sample collected near the water surface will not be representative of the entire water column and will consist primarily of wash load. In many instances, particularly when sand is not a substantial part of the sediment load, the mean concen-tration can be adjusted satisfactorily with a coefficient. The TWDB has recognized this and thus multiplies the
Table 2. Selected characteristics of the 13 largest reservoirs in the Brazos River Basin, Texas (Wurbs and others, 1988)
ReservoirStream
impounded
Year of initialimpound-
ment
Drainagearea
(squaremiles)
Storage capacity(acre-feet)
Conservationpool
Floodcontrol
Total
Possum Kingdom Lake Brazos River 1941 23,596 570,240 154,460 724,700
Lake Whitney Brazos River 1951 27,189 627,100 1,372,400 1,999,500
Belton Lake Leon River 1954 3,531 457,600 633,720 1,091,320
Hubbard Creek Reservoir Hubbard Creek 1962 1,085 317,750. 198,050 515,800
Proctor Lake Leon River 1963 1,259 59,400 314,800 374,200
Lake Waco Bosque River 1965 1,652 152,500 573,900 726,400
Somerville Lake Yegua Creek 1967 1,007 160,100 347,400 507,500
Stillhouse Hollow Lake Lampasas River 1968 1,313 235,700 394,700 630,400
Lake Granbury Brazos River 1969 25,679 153,490 87,150 240,640
Lake Limestone Navasota River 1978 675 225,400 92,700 318,100
Lake Georgetown San Gabriel River 1980 247 37,100 93,700 130,800
Granger Lake San Gabriel River 1980 709 65,500 178,700 244,200
Aquilla Reservoir Aquilla Creek 1983 252 52,400 93,600 146,000
8 Indications and Potential Sources of Change in Sand Transport in the Brazos River, Texas
mean sample concentration by a coefficient of 1.102 to estimate the mean concentration in the stream from the Texas sampler. Welborn (1967) compared paired sediment concentrations obtained using the two sampling methods and found the ratio of concentrations of suspended-sediment samples taken with depth-integrating samplers to samples taken with the Texas sampler ranged from 0.96 to 3.41. Welborn (1967) found that the ratio was largest in streams containing larger percentages of sand in the suspended load and that neither a single coefficient nor a set of coefficients could be computed to adjust data collected with the Texas sampler. The ratios for the Brazos River at Richmond ranged from 0.98 to 1.50, and there is no relation between the coefficient and discharge.
Andrews (1989) presents mean monthly and annual suspended-sediment loads at the Brazos River at the Richmond gaging station for the 1966–86 water years (October 1–September 30). These loads were computed from daily suspended-sediment records collected by the USGS. The TWDB also operated a suspended-sediment sampling station at this location. Andrews (1989) compared 14 years of coincident data and found that mean annual loads computed from samples collected using the Texas sampler and depth-integrating samplers compared favorably. How-ever, the loads computed by the USGS generally were larger than those computed by the TWDB. The differ-ence in sampling methods used by the TWDB and the USGS could explain some of this difference. The USGS method is more likely to capture sand-size particles, which generally are found in greater concentration in the lower part of the water column than near the surface. This will tend to increase individual sample concentra-tions and, therefore, the loads computed using those concentrations.
Much of the analysis presented herein depends on analyses of individual sediment samples. Although the method used by the TWDB appears sufficient to com-pute total annual loads of suspended sediment (com-posed of both sand and silt sizes), the differences in data-collection methods become crucial when analyz-ing only the sand fraction of the suspended load.
Previous Studies of Sediment Transport in the Brazos River
Mathewson and Minter (1976) analyzed suspended-sediment data collected by the TWDB and streamflow data collected by the USGS to estimate the
effect of water-resource development (reservoir con-struction) on coastal erosion in the vicinity of the Brazos River. They found from an analysis of daily mean discharges during 1923–74 that construction of both Possum Kingdom Lake (east of Fort Worth) and Lake Whitney has slightly reduced the frequency of larger discharges at the Richmond streamflow-gaging station, but the mean annual discharge at Richmond has not been affected by reservoir construction. They also found from an analysis of TWDB data for 1924–70 that suspended-sediment loads at Richmond have decreased substantially because of reduced concentrations of suspended sediment. Mathewson and Minter (1976) found that reduced sediment transported from the Brazos River to the Gulf can be attributed to increased storage of sediment in actively building bar formations downstream from Waco. The frequency of these bar formations decreases with proximity to Richmond, and Mathewson and Minter postulate that the reduced frequency of large discharges has reduced the capacity of the river to transport sediment through Richmond to the Gulf. They also attribute much of the coastal erosion in the vicinity of Sargent Beach (fig. 1) to sediment trapped in reservoirs and indicate that sand transport throughout the Brazos River has been reduced enough to account for the entire amount of sand lost in the coastal zone since at least 1937.
Seelig and Sorenson (1973) investigated shoreline changes at Sargent Beach and state that beach erosion is further aggravated by decreased sand input to the coast from the Brazos River because of alterations to the river and its drainage basin since the 1940s. They analyzed sand loads computed from TWDB and USGS samples at the Richmond streamflow-gaging station for water years 1922–65. Using mean annual concentrations of sediment load, they identified three periods with distinctly different suspended-sediment concentrations: (1) 1922–40, concentrations averaged about 5,000 parts per million (ppm), (2) 1941–50, con-centrations declined steadily from 5,000 to 2,000 ppm, and (3) 1951–65, concentrations declined slightly but remained in the 1,000 to 3,000 ppm range. They used methods developed by Colby (1957) and modified by C.T. Welborn (U.S. Geological Survey, written commun., 1970) to compute total loads of sand trans-ported by the Brazos River to the coast. They identified a decline in sand transported to the coast and attributed this decline to the completion of a series of dams begin-ning with Possum Kingdom, improved soil conserva-tion, and widespread transition from cotton production
INTRODUCTION 9
to grains and grazing in the Brazos Valley during World War II. They estimated that the construction of the dams in the 1940s reduced the rate of sand input to the coast to one-third of the rate before the 1940s.
Gillespie and Giardino (1997) describe and explain causative factors for the Brazos River channel migration. They hypothesize that reservoir construction immediately upstream of three study reaches has reduced the frequency of channel-forming discharges and has reduced sediment loads in the Brazos River as measured at the Richmond streamflow-gaging station (08114000). They analyzed total monthly and maximum daily discharge statistics at three USGS streamflow-gaging stations on the Brazos River (Waco [08096500], Bryan [08109000], and Hempstead [08111500]) and suspended-sediment concentrations measured by the TWDB at the Richmond streamflow-gaging station. They divided the records into two parts: pre-1939 (pre-dam) and post-1939 (post-dam). Using Analysis of Variance (ANOVA), they found that pre-dam discharge and sediment-concentration statistics are significantly greater than the post-1939 statistics. Gillespie and Giardino state that the results are consis-tent with a slowed rate of channel migration exhibited by the Brazos River in the post-dam period.
Capacity of the Brazos River to Transport Sand
Sediment is transported in a river as suspended load, as bed load by rolling and sliding along the bed, or both. Movement of sediment as suspended or bed load depends on the nature of the sediment (size, specific gravity, and shape) and the hydraulic characteristics of the flow. Generally, smaller particles such as silts and clays will move in suspension and larger sand-size particles will move both in suspension and as bed load. High-gradient streams have the capacity to transport appreciable quantities of sand- and gravel-sized particles in suspension, whereas low-gradient streams, transport most sand- and gravel-sized particles as bed load.
Velocity, depth, turbulence, and energy slope are the hydraulic characteristics that define the capacity of a river to transport sand-size sediment. For a given river, these characteristics will vary with the magnitude of flow; larger discharges will have a larger velocity, depth, turbulence, and energy slope than smaller dis-charges. Generally, only larger discharges develop the hydraulic characteristics necessary to transport appre-
ciable quantities of sand-size or larger sediment in a river. The capacity of a river to transport sand depends on the frequency of discharges that develop the requisite hydraulic characteristics. As much as 90 percent of total sediment load in many streams is transported by flows that are equaled or exceeded about 10 percent of the time (Richardson and others, 1990).
The sediment load of a river can be divided into wash-load and bed-load fractions. The wash load is defined as those smaller particles, generally silt and clay, that remain in suspension over a wide range of dis-charges and are found in minimal quantities in the bed material. The wash load originates as wash-off from storm events within the watershed. The wash load depends primarily on the rate and source of supply; it is generally not correlated with the hydraulic characteris-tics of the channel. The bed load consists of particles in the bed material and is usually correlated strongly with hydraulic characteristics, and thus, discharge (Chang, 1988). The bed material of the Brazos River consists primarily of sand-size particles and gravel.
Incipient motion analysis can provide a rough indication of the capacity of a river to transport sand. When the hydraulic characteristics of a river are mini-mally sufficient to initiate movement of sand-size particles, the particles are moved along the streambed by the force of the flowing water. This force is charac-terized by the bed shear stress and can be computed for a given channel cross section as
, (1)
where is shear stress, in pounds per square foot; is unit weight of water, in pounds per cubic foot; is hydraulic depth (area divided by top width), in
feet; andis bed slope, in feet per foot.For a given sediment grain size, the critical shear
stress necessary to initiate motion can be determined using the Shields diagram (Vanoni, 1975). The shear stress, , resulting from a given discharge can be compared to the critical shear stress, , for incipient motion to determine if the given particle size will be transported. When the shear stress is less than the criti-cal shear stress, the flow does not have the capacity to transport sediment of the representative size; when the shear stress is greater than the critical shear stress, the given bed material will be transported. The median sed-iment size (D50) represents the mesh size of a sieve
τo γDS=
τoγ
D
S
τoτc
10 Indications and Potential Sources of Change in Sand Transport in the Brazos River, Texas
through which 50 percent, by weight, of the material passes and commonly is used as the representative size of bed material for tractive-force and bed-material transport computations (Stelczer, 1981).
Bed-material samples were obtained from the main channel at a daily mean discharge of about 3,500 ft3/s at the US 59 bridge 7 river miles downstream from the Richmond streamflow-gaging station during August 1991 for an unrelated study. Two additional samples were obtained from the main channel 3 river miles downstream from the Richmond streamflow-gaging station in December 1996 and February 1997 at instantaneous discharges of 11,600 and 29,500 ft3/s, respectively. The samples were obtained using a US BMH–60 sampler, which obtains a 175-cubic-centimeter sample of bed material with a spring-loaded scoop. The scoop activates when the sampler contacts the bed and penetrates into the bed 1.7 in. (Guy and Norman, 1970). The shallow penetration of the sampler allows the capture of bed material that is most readily
available for transport. Five to 10 individual samples were collected from the main part of the channel and were combined into a composite sample. The Shields diagram was used to compute the shear stress ratio for the D50 size for bed-material samples collected at three discharges. The particle-size distributions of the composite samples (fig. 6) were obtained using sieve analyses. The bed material coarsens substantially as dis-charge increases; the D50 increases from 0.34 to 1.79 mm over the range of discharges sampled.
The instantaneous discharges sampled (3,500, 11,600, and 29,500 ft3/s) correspond to daily mean discharges with 46-, 20-, and 5-percent exceedance probabilities, respectively, for the 1903–95 period (excluding 1907–21) at the Richmond streamflow-gaging station (fig. 7). Each sampled discharge has adequate capacity to initiate motion of the bed material on the basis of Shields diagram analysis (table 3). For the sample with D50 equal to 1.79 mm, the ratio is greater than unity for all discharges larger than
Figure 6. Particle-size distributions of bed material samples near streamflow-gaging station 08114000 Brazos River at Richmond, Texas.
20 30 40 50 60 70 80 90 951052
PERCENT FINER
0.1
0.2
0.3
0.4
0.5
0.7
1
2
3
4
5
7
10
PAR
TIC
LE-S
IZE
DIA
ME
TE
R, I
N M
ILLI
ME
TE
RS
Sample discharges, incubic feet per second
29,5
00
3,50
0
11,6
00
INTRODUCTION 11
1,000 ft3/s (82-percent exceedance probability). This indicates that the Brazos River has sufficient capacity to initiate motion of the bed material (as characterized by the D50 size) at least 82 percent of the time (fig. 7).
The motion analysis was repeated using the D85 size from each sampled discharge to examine the characteristics of the coarser fraction of bed material
(table 3). For the sample with D85 equal to 5.98 mm, the ratio is greater than unity for all discharges larger than about 17,000 ft3/s (11-percent exceedance probability). This indicates that the Brazos River has sufficient capacity to initiate motion of the coarser bed material (as characterized by the D85) at least 11 percent of the time (fig. 7).
1,000,000
100,000
10,000
1,000
100
10
DA
ILY
ME
AN
DIS
CH
AR
GE
, IN
CU
BIC
FE
ET
PE
R S
EC
ON
D
0.01 0.1 1 2 5 10 20 50 90 95 98 99 99.9 99.99
EXCEEDANCE PROBABILITY, IN PERCENT
Figure 7. Flow-duration curve of daily mean discharge for streamflow-gaging station 08114000 Brazos River at Richmond, Texas, 1903–95 (excluding 1907–21).
Table 3. Ratios of shear stress to critical shear stress required for initiation of motion at streamflow-gaging station 08114000 Brazos River at Richmond, Texas
[D50 and D85, particle size for which 50 and 85 percent of the material is finer]
1At assumed temperature of 15 degrees Celsius.
Discharge(cubic
feet persecond)
Hydraulicradius(feet)
Shearstress
(poundsper square
foot)
D50(millimeters)
Criticalshear
stress1
(poundsper square
foot)
Ratio ofshear
stress tocriticalshearstress
D85(millimeters)
Criticalshear
stress1 (pounds
per squarefoot)
Ratio ofshear
stress tocriticalshearstress
3,500 6.10 0.0506 0.34 0.0043 11.8 0.47 0.0057 8.911,600 11.47 .0952 .52 .0058 16.4 2.95 .0458 2.129,500 18.70 .1552 1.79 .0242 6.4 5.98 .1172 1.3

12 Indications and Potential Sources of Change in Sand Transport in the Brazos River, Texas
INDICATIONS OF CHANGE IN SAND TRANSPORT
The transport of sediment in most rivers is affected by multiple interdependent factors that include land-use changes in the basin, natural erosion processes along the main stem and tributaries, basin hydrology (particularly extreme events), water-resource development, and human activities in the main channel. River morphology and sediment transport change con-tinually as a river adjusts in response to changes in these and other factors.
River channels will adjust to minimize energy dissipation, and these adjustments affect the capacity to transport the available sediment with the available water discharge. Channel adjustment processes can be charac-terized by the qualitative relation set forth by Lane (1955),
, (2)
whereQ is river discharge;S is river slope;
is bed-sediment discharge; andD is a characteristic particle-size diameter.
Lane’s relation states that the product of river discharge and river slope is proportional to the product of the bed-sediment discharge and a characteristic particle-size diameter. The river slope can refer to either the channel slope or the slope of the energy-grade line of the river but is usually taken as the latter.
If one or more of these four variables are modi-fied, then one or more of the remaining variables will change to maintain the proportional relation. These changes can occur rather suddenly, as in response to abrupt disturbances such as channel shortening or straightening (Robbins and Simon, 1983); but often the changes will occur over long periods of time in response to more subtle disturbances such as land-use changes. Observed changes in channel characteristics might be remnant responses to disturbances that occurred decades earlier. Present-day channel responses usually cannot be attributed to one causative factor but to a combination of recent and historical factors.
Using the concepts described by Lanes’s relation, if the size of sediment available for transport and the dominant discharge (discharge with about a 1 to 2.5-year recurrence interval) remain constant, then con-struction of a dam will decrease the energy slope of the
river upstream from the dam. The sediment discharge also will decrease because of the reduced transport capacity of the river. The river will agrade (sediment will accumulate in the channel), and the size of the sediment transported likely will decrease. Downstream from the dam, if the dam traps the majority of the bed material and does not affect the dominant discharge, the channel would be expected to adjust the slope to maintain the proportional relation. The channel likely would erode downward (down-cut) to reduce the slope. In this case, the bed material eroded from down-cutting—and bank material from subsequent bank fail-ures—is made available for transport, and the sediment supply increases somewhat, at least temporarily. This illustrates the complexity of the river-adjustment phenomenon, which has been referred to by Thornes (1977) as having “indeterminacy” and “equifinality;” meaning, respectively, that a channel can respond to changes in many different ways, and a given response can be caused by several different factors. In actuality, all of the variables are changing at any given time, and a river remains in a state of continual adjustment toward dynamic equilibrium. If, however, one of the variables undergoes consistent long-term change, then the river can be expected to exhibit corresponding long-term change in accordance with Lanes’s relation.
Changes in the capacity of a river to transport sand can be identified within the context of Lane’s relation through changes in slope indicated by changes in channel geometry, changes in the characteristics of suspended loads, and changes in discharge. Total sediment-discharge data can be analyzed directly if available, but total sediment discharge rarely is measured because of the expense and difficulty of collecting the required bed-load data. However, suspended-sediment data are collected routinely by the USGS and other agencies and can be used as an indica-tor of changes in the sediment-transport characteristics of a river. Changes in suspended-sand load, if particle sizes of the suspended load have been determined, can be used to infer changes in the total sand load. All of these indicators, used conjunctively, provide evidence for concluding whether change in the sand-transport characteristics of a river has taken place.
Changes in Channel Geometry
Adjustment of river slope in response to changes in sediment supply and discharge often manifests as changes in channel geometry such as
QS QsD∼
Qs
INDICATIONS OF CHANGE IN SAND TRANSPORT 13
channel agradation or incision and channel widening. Streamflow-gaging-station records and surveyed chan-nel geometry are sources of information from which to measure geometric adjustments of a river.
Discharge measurements made at streamflow-gaging stations over time can be used to identify changes in the channel characteristics. The Richmond streamflow-gaging station has been operated continu-ally since 1925 at its present location and had 902 measurements available at the time of this study; the Hempstead streamflow-gaging station since 1938 with 746 measurements; and the Rosharon streamflow-gaging station since 1967 with 241 measurements. Occasionally the streamflow-gaging-station datum is changed, so all stages have been converted to altitude above sea level.
The stage-discharge relations for the Hempstead, Richmond, and Rosharon streamflow-gaging stations are shown in figures 8–10. The measurements are differentiated by time period—pre-1940 (except Rosharon), 1940–68, and 1969–95. Long-term changes in the stage-discharge relations are indicated: At dis-charges below about 30,000 ft3/s, the water-surface
altitude has declined several feet. At discharges above 30,000 ft3/s, this trend is not apparent.
An analysis was done to estimate the rate of change of the water-surface altitude for a particular discharge. Water-surface altitude was regressed with discharge for all of the discharge measurements in a moving 5-year window for the entire period of each station’s record using a quadratic function of the form
, (3)
whereA is water-surface altitude;
, , and are regression coefficients; andQ is discharge.
The regression equation for a given year was based on the discharge measurements made during the 5-year period starting 2 years before and ending 2 years after the given year. The water-surface altitude correspond-ing to a discharge of 5,000 ft3/s was computed using the individual regressions for each year for which the full 5-year window of measurements was available.
The water-surface altitudes at a discharge of 5,000 ft3/s for the three streamflow-gaging stations are
A B1 B2Q + B3Q2
+=
B1 B2 B3
165
160
155
150
145
140
135
130
125
120
115
110
WAT
ER
-SU
RFA
CE
ALT
ITU
DE
, IN
FE
ET
AB
OV
E S
EA
LE
VE
L
100 1,000 10,000
DISCHARGE, IN CUBIC FEET PER SECOND
100,000 200,000
Pre-19401940–68
1969–95
Figure 8. Stage-discharge relation at streamflow-gaging station 08111500 Brazos River near Hempstead, Texas.

14 Indications and Potential Sources of Change in Sand Transport in the Brazos River, Texas
55
50
45
40
35
30
25
20
15
10
5
0
WAT
ER
-SU
RFA
CE
ALT
ITU
DE
, IN
FE
ET
AB
OV
E S
EA
LE
VE
L
10 100 1,000 10,000 100,000 200,000
DISCHARGE, IN CUBIC FEET PER SECOND
1940–681969–95
Figure 10. Stage-discharge relation at streamflow-gaging station 08116650 Brazos River near Rosharon, Texas.
90
85
80
75
70
65
60
55
50
45
40
35
WAT
ER
-SU
RFA
CE
ALT
ITU
DE
, IN
FE
ET
AB
OV
E S
EA
LE
VE
L
10 100 1,000 10,000 100,000 200,000
DISCHARGE, IN CUBIC FEET PER SECOND
Pre-19401940–681969–95
Figure 9. Stage-discharge relation at streamflow-gaging station 08114000 Brazos River at Richmond, Texas.

INDICATIONS OF CHANGE IN SAND TRANSPORT 15
shown in figures 11–13. A non-parametric Kendall-Theil line (Helsel and Hirsch, 1992) was fit to the data to determine the long-term slope. The Kendall-Theil line defines the monotonic relation between two variables, in this case water-surface altitude and time. The analysis indicates that the long-term decline in water-surface altitude for a discharge of 5,000 ft3/s has been about 0.028 ft/yr for the Hempstead streamflow-gaging station, about 0.056 ft/yr for the Richmond streamflow-gaging station, and 0.066 ft/yr for the Rosharon streamflow-gaging station. The slopes of the lines are statistically significant (p <0.00003).
The data at the Hempstead and Richmond streamflow-gaging stations also demonstrate cyclical patterns in the monotonic trends that match very closely from 1940 to about 1965 (figs. 11, 12). The overall decreases in the water-surface altitude at the three streamflow-gaging stations indicate that the transport characteristics of the river changed, which is consistent with a decreased supply of sand-size sediment in the river.
Changes in Suspended-Sediment Characteristics
During 1969–95, 215 periodic samples for measurement of suspended-sediment concentration were taken at the Richmond streamflow-gaging station over a range of discharge from 445 to 88,100 ft3/s. The percent fines (generally silt and clay, with size less than 0.062 mm) was determined for 208 of the samples. The percent of sand in each sample was computed by subtracting the percent fines from 100 percent. Four samples seemed to have erroneous concentrations and were excluded from the analysis. The percent sand in each sample was multiplied by the suspended-sediment concentration to compute the suspended-sand concentration (fig. 14).
The suspended-sand concentrations apparently decreased, starting about 1982. Suspended-sand concentrations typically will decrease as discharge decreases, so decreases in suspended-sand concentra-tions could be attributed to systematically smaller sampled discharges. Such changes in sampled discharge over time could have a substantial temporal effect
127
126
125
124
123
122WAT
ER
-SU
RFA
CE
ALT
ITU
DE
, IN
FE
ET
AB
OV
E S
EA
LE
VE
L
19301935
19401945
19501955
19601965
19701975
19801985
19901995
YEAR
Water-surface altitudeKendall-Theil line
Figure 11. Water-surface altitudes at a discharge of 5,000 cubic feet per second at streamflow-gaging station 08111500 Brazos River near Hempstead, Texas.

16 Indications and Potential Sources of Change in Sand Transport in the Brazos River, Texas
19301935
19401945
19501955
19601965
19701975
19801985
19901995
YEAR
15
14
13
12
11
10WAT
ER
-SU
RFA
CE
ALT
ITU
DE
, IN
FE
ET
AB
OV
E S
EA
LE
VE
L
Water-surface altitude
Kendall-Theil line
Figure 13. Water-surface altitudes at a discharge of 5,000 cubic feet per second at streamflow-gaging station 08116650 Brazos River near Rosharon, Texas.
48.0
47.5
47.0
46.5
46.0
45.5
45.0
44.5
44.0
43.5
43.0WAT
ER
-SU
RFA
CE
ALT
ITU
DE
, IN
FE
ET
AB
OV
E S
EA
LE
VE
L
19301935
19401945
19501955
19601965
19701975
19801985
19901995
YEAR
Water-surface altitude
Kendall-Theil line
Figure 12. Water-surface altitudes at a discharge of 5,000 cubic feet per second at streamflow-gaging station 08114000 Brazos River at Richmond, Texas.
INDICATIONS OF CHANGE IN SAND TRANSPORT 17
on suspended-sand concentrations. The discharges sampled, which ranged from 445 to 88,100 ft3/s are shown in figure 15. The Wilcoxon rank-sum test (Helsel and Hirsch, 1992) was applied to test for differences between the median minimum and median maximum discharges sampled during 1969–81 and 1982–95. The median of the yearly minimum sampled discharges for 1969–81 (2,649 ft3/s) is significantly larger (p = 0.011) than the median for 1982–95 (1,145 ft3/s). No change was detected in the maximum discharges sampled each year (p = 0.41) nor in the range of discharges sam-pled (p = 0.45). These tests indicate that more samples were collected at generally smaller discharges during 1982–95 but that the maximum discharge sampled each year did not change significantly. About equal numbers of samples were taken above 2,000 ft3/s (median daily discharge) for both periods (81 samples during 1969–81 and 86 during 1982–95)—in other words, median sampled discharge was about the same for both periods. The apparent change in the suspended-sand concentra-tions cannot be attributed to a change in the discharges sampled.
LOcally WEighted Scatterplot Smoothing (LOWESS) lines (Cleveland, 1979) were fit to 1969–81 and 1982–95 suspended-sand concentration as a function of discharge (fig. 16). For discharges larger than 1,000 ft3/s, the suspended-sand concentrations of samples taken during 1969–81 were greater than those taken during 1982–95 for similarly sampled discharges. The LOWESS lines provide a graphical comparison between the two periods but do not assign a statistical significance to the difference.
A LOWESS line was fit to the suspended-sand versus discharge graph with no temporal differentiation, and residuals from that line were computed (residual equals LOWESS minus measured). The residuals repre-sent concentration, adjusted to remove any relation to discharge. Residuals thus computed can be identified as “flow-adjusted residual concentrations” (Helsel and Hirsch, 1992). A Wilcoxon rank-sum test indicates that the median residual concentration during 1969–81 is significantly less than the median residual concentra-tion during 1982–95 (p <0.00005), which provides strong statistical evidence that the suspended-sand
1,400
1,200
1,000
800
600
400
200
0
SU
SP
EN
DE
D-S
AN
D C
ON
CE
NT
RAT
ION
, IN
MIL
LIG
RA
MS
PE
R L
ITE
R
YEAR
19691971
19731975
19771979
19811983
19851987
19891991
19931995
Figure 14. Suspended-sand concentrations in samples at streamflow-gaging station 08114000 Brazos River at Richmond, Texas, 1969–95.
18 Indications and Potential Sources of Change in Sand Transport in the Brazos River, Texas
concentration at a given discharge decreased during 1982–95.
The suspended-sediment samples contained less than 35-percent sand-size particles. A LOWESS line fit to a graph of percent sand versus discharge (fig. 17) indicates that the percent sand increased at discharges larger than about 5,000 ft3/s. Residuals computed from this LOWESS line represent the percent sand independent of discharge. A Wilcoxon rank-sum test indicates that the median residual percentage of sand during 1969–81 is significantly smaller than the median during 1982–95 (p = 0.084), which indicates that the percent sand at a given discharge also decreased during 1982–95.
These analyses indicate that suspended-sand concentrations in the Brazos River at Richmond for a given discharge decreased during 1982–95. Both suspended-sand concentrations and the percentage of sand in suspension decreased. These decreases could be caused by a change in the hydraulics of the flow at the measurement cross section. A decrease in the channel velocity would cause more of the sediment to be trans-ported as bed load, which would not be measured by a
suspended-sediment sampler. However, a graph of dis-charge and mean velocity for all measurements during 1969–95 (fig. 18) indicates that mean velocities have not decreased. LOWESS lines were fit to this graph for all discharge measurements made from the US 90–A bridge. The median residuals for the two periods are not significantly different (p = 0.24). However, this p-value does indicate some weak evidence that the mean veloc-ity has changed.
Velocity varies across a cross section, and the sus-pension of sand will vary accordingly. Only a small fraction of the cross section can sustain velocities and shear stresses capable of transporting sand in suspen-sion; as the velocity in this part of the cross section decreases, the transport of sand in suspension likely will decrease. If the mean velocity remains constant, the corresponding increase in velocity over the remainder of the cross section might be insufficient to increase the transport of suspended sand. For this reason, the mean velocity might not be a sufficient indicator of the hydraulic capacity of a stream to transport sand in suspension. The maximum velocity measured in the cross section during each discharge measurement might
100,000
10,000
1,000
100
DIS
CH
AR
GE
, IN
CU
BIC
FE
ET
PE
R S
EC
ON
D
19691971
19731975
19771979
19811983
1985
YEAR
19871989
19911993
1995
Figure 15. Sampled discharges at streamflow-gaging station 08114000 Brazos River at Richmond, Texas, 1969–95.

INDICATIONS OF CHANGE IN SAND TRANSPORT 19
32
28
24
20
16
12
8
4
0
PE
RC
EN
T S
AN
D
100 1,000 10,000 100,000
DISCHARGE, IN CUBIC FEET PER SECOND
LOWESS
36
Figure 17. Relation of percent sand in suspended-sediment samples to discharge at streamflow-gaging station 08114000 Brazos River at Richmond, Texas, 1969–95.
10,000
1,000
100
10
0.1
SU
SP
EN
DE
D-S
AN
D C
ON
CE
NT
RAT
ION
, IN
MIL
LIG
RA
MS
PE
R L
ITE
R
100 1,000 10,000 100,000
DISCHARGE, IN CUBIC FEET PER SECOND
LOWESS, 1969–81LOWESS, 1982–951969–811982–95
1
Figure 16. Relation of suspended-sand concentration to discharge at streamflow-gaging station 08114000 Brazos River at Richmond, Texas, 1969–95.

20 Indications and Potential Sources of Change in Sand Transport in the Brazos River, Texas
provide a better indication of reduced transport capacity. A decrease in the maximum velocity in the cross section for a given discharge would provide some explanation for the decrease in suspended sand measured. A LOWESS line was fit to a graph of dis-charge versus the maximum velocity in the cross section for the measurements made during 1969–95. The resid-uals from that LOWESS line do not indicate that the maximum velocity in the cross section decreased for a given discharge during 1982–95 (p = 0.440).
The depth at the cross-section location at which the maximum velocity was measured was derived from the discharge measurements. A LOWESS line was fit to the graph of mean velocity versus this depth, which closely approximates the maximum depth in the cross section. The residuals from this LOWESS line indicate that for a given mean velocity, the depth of the cross-section location of maximum velocity was about 3.6 ft deeper during 1969–81 than during 1982–95 (p <0.00005). The mean channel depth and channel width were similarly analyzed, and the results indicate that the mean channel depth was greater and the channel
width was narrower during 1969–81 than during 1982–95 (p <0.00005). However, no change in the cross-sectional area of the channel was detected.
Although the maximum velocity in the cross section has not changed at a level near statistical signif-icance, the change in mean velocity could be considered weakly significant (p = 0.24). Coupled with changes in other characteristics known to affect the capacity of the channel to transport sediment, a subtle change in the mean velocity might affect a channel’s transport capacity.
Shear stress developed in a channel (eq. 1) is an indicator of the capacity of a channel to transport sediment. A change in shear stress can therefore reflect a change in the capacity of a channel to transport sediment. Assuming that the overall bed slope of the channel and the unit weight of water remain constant, a change in the hydraulic depth will signal a change in shear stress. A LOWESS line was fit to a hydraulic depth versus discharge graph. The residuals from the LOWESS line changed significantly over time (p <0.01), indicating that the channel has a reduced
6.0
DISCHARGE, IN CUBIC FEET PER SECOND
5.5
5.0
4.5
4.0
3.5
3.0
2.5
2.0
1.5
1.0
0.5
0
ME
AN
VE
LOC
ITY,
IN F
EE
T P
ER
SE
CO
ND
500 1,000 10,000 100,000
LOWESS, 1969–81LOWESS, 1982–951969–811982–95
Figure 18. Relation of mean channel velocity to discharge at streamflow-gaging station 08114000 Brazos River at Richmond, Texas, 1969–95.

INDICATIONS OF CHANGE IN SAND TRANSPORT 21
capacity to transport sand-size sediment because of a reduction in shear stress developed by the channel.
In summary, no statistically significant change was detected in the mean or maximum channel velocity, but some evidence exists that suggests the mean channel velocity decreased during 1982–95. The channel depth has decreased as the channel width has increased; the resulting water-surface altitude has decreased, and the hydraulic depth related to shear stress has decreased. These changes in channel geometry might be responsi-ble for the apparent changes in suspended-sand transport. The apparent changes in suspended-sediment transport cannot be attributed to changes in the sam-pling or laboratory methods, which have remained constant since the start of the sampling at the Richmond station. In the late 1980s, the bridge from which all measurements had been taken was removed, and a new bridge was constructed at the same location.
Changes in Discharge
Sand discharge in a river varies greatly with water discharge. Sand will not be transported in sub-stantial quantities until the channel develops sufficient
hydraulic characteristics, which usually occur during larger (above-average) flows. Changes in the magnitude and frequency of larger discharges can be caused by changes in land use, such as rapid urbanization; long-term climatic changes; diversion for flood control; and reservoir construction, both for flood control and water supply. Of these, the most likely to influence large flows in the Brazos River is reservoir construction, particu-larly those reservoirs constructed for flood control. Flows in the Brazos River are unlikely to be influenced by urbanization, simply because the size of the basin is large relative to the size of the urban areas within. The effects of long-term climatic changes will be more grad-ual than the effects of reservoir construction, consider-ing the extent of reservoir construction in the basin.
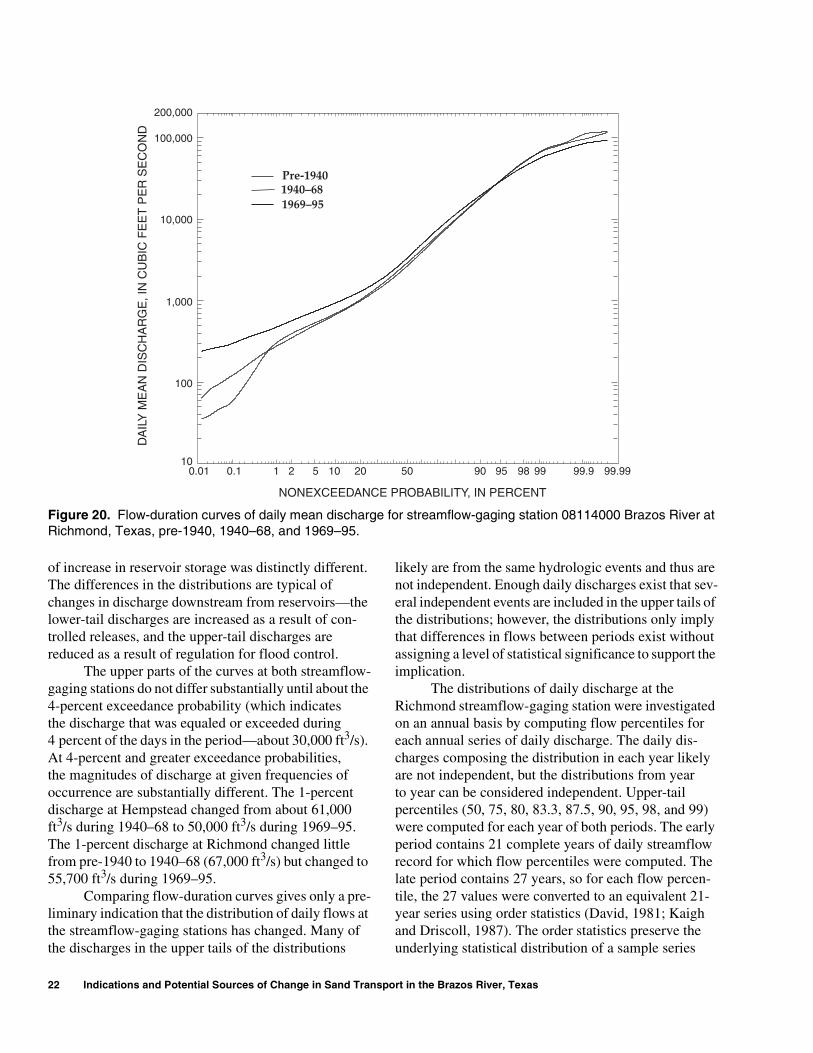
Reservoirs can affect the distribution of both daily and annual-peak discharges. Flow-duration curves of daily mean discharge at the Hempstead and Richmond streamflow-gaging stations are shown in figures 19 and 20. The records have been divided into two (for Hemp-stead) or three (for Richmond) periods: early (pre-1940), middle (1940–68), and late (1969–95). These periods roughly correspond to periods in which the rate
200,000
100,000
10,000
1,000
100
DA
ILY
ME
AN
DIS
CH
AR
GE
, IN
CU
BIC
FE
ET
PE
R S
EC
ON
D
0.01 0.1 1 2 5 10 20 50 90 95 98 99 99.9 99.99
NONEXCEEDANCE PROBABILITY, IN PERCENT
1940–681969–95
Figure 19. Flow-duration curves of daily mean discharge for streamflow-gaging station 08111500 Brazos River near Hempstead, Texas, 1940–68 and 1969–95.
22 Indications and Potential Sources of Change in Sand Transport in the Brazos River, Texas
of increase in reservoir storage was distinctly different. The differences in the distributions are typical of changes in discharge downstream from reservoirs—the lower-tail discharges are increased as a result of con-trolled releases, and the upper-tail discharges are reduced as a result of regulation for flood control.
The upper parts of the curves at both streamflow-gaging stations do not differ substantially until about the 4-percent exceedance probability (which indicates the discharge that was equaled or exceeded during 4 percent of the days in the period—about 30,000 ft3/s). At 4-percent and greater exceedance probabilities, the magnitudes of discharge at given frequencies of occurrence are substantially different. The 1-percent discharge at Hempstead changed from about 61,000 ft3/s during 1940–68 to 50,000 ft3/s during 1969–95. The 1-percent discharge at Richmond changed little from pre-1940 to 1940–68 (67,000 ft3/s) but changed to 55,700 ft3/s during 1969–95.
Comparing flow-duration curves gives only a pre-liminary indication that the distribution of daily flows at the streamflow-gaging stations has changed. Many of the discharges in the upper tails of the distributions
likely are from the same hydrologic events and thus are not independent. Enough daily discharges exist that sev-eral independent events are included in the upper tails of the distributions; however, the distributions only imply that differences in flows between periods exist without assigning a level of statistical significance to support the implication.
The distributions of daily discharge at the Richmond streamflow-gaging station were investigated on an annual basis by computing flow percentiles for each annual series of daily discharge. The daily dis-charges composing the distribution in each year likely are not independent, but the distributions from year to year can be considered independent. Upper-tail percentiles (50, 75, 80, 83.3, 87.5, 90, 95, 98, and 99) were computed for each year of both periods. The early period contains 21 complete years of daily streamflow record for which flow percentiles were computed. The late period contains 27 years, so for each flow percen-tile, the 27 values were converted to an equivalent 21-year series using order statistics (David, 1981; Kaigh and Driscoll, 1987). The order statistics preserve the underlying statistical distribution of a sample series
0.01 0.1 1 2 5 10 20 50 90 95 98 99 99.9 99.99
200,000
100,000
10,000
1,000
100
10
Pre-19401940–681969–95
DA
ILY
ME
AN
DIS
CH
AR
GE
, IN
CU
BIC
FE
ET
PE
R S
EC
ON
D
NONEXCEEDANCE PROBABILITY, IN PERCENT
Figure 20. Flow-duration curves of daily mean discharge for streamflow-gaging station 08114000 Brazos River at Richmond, Texas, pre-1940, 1940–68, and 1969–95.

INDICATIONS OF CHANGE IN SAND TRANSPORT 23
while compressing its size and are ideal for comparing the distributions of samples of unequal sizes.
For each flow percentile, two tests were done to identify differences between the periods. Wilcoxon rank-sum tests were done to test for differences in the medians of each of the percentiles computed. Then, the percentiles from each year in both periods were ranked, the differences between the ranked data were computed, and Student’s t-tests (Helsel and Hirsch, 1992) were done on the differences. The rank-sum tests indicate no statistically significant differences in the medians of any flow percentile; however, the p-values for discharges larger than the 83.3 percentile are all less than 0.20—evidence for differences, but not strong enough evidence to declare the differences “signifi-cant.” The tests on the differences in the ranked percen-tiles indicate that the daily discharges for the early and late periods are significantly different for the 75 percen-tile and larger flows. The p-values associated with these tests are summarized in table 4. Similar analyses were not done for the Hempstead streamflow-gaging station data because continuous daily discharge for the early period was not available; however, the distributions of daily flows are similar between the two sites.
The preceding analyses indicate that the magni-tude of discharges with larger recurrence intervals (90 percentile and larger daily flows) has decreased since the early 1940s. The reduction in the upper tails of the distributions of the daily discharges are consistent with what would be expected downstream from major reservoirs (Collier and others, 1996). The larger dis-
charges likely transport a large part of the Brazos River sand load.
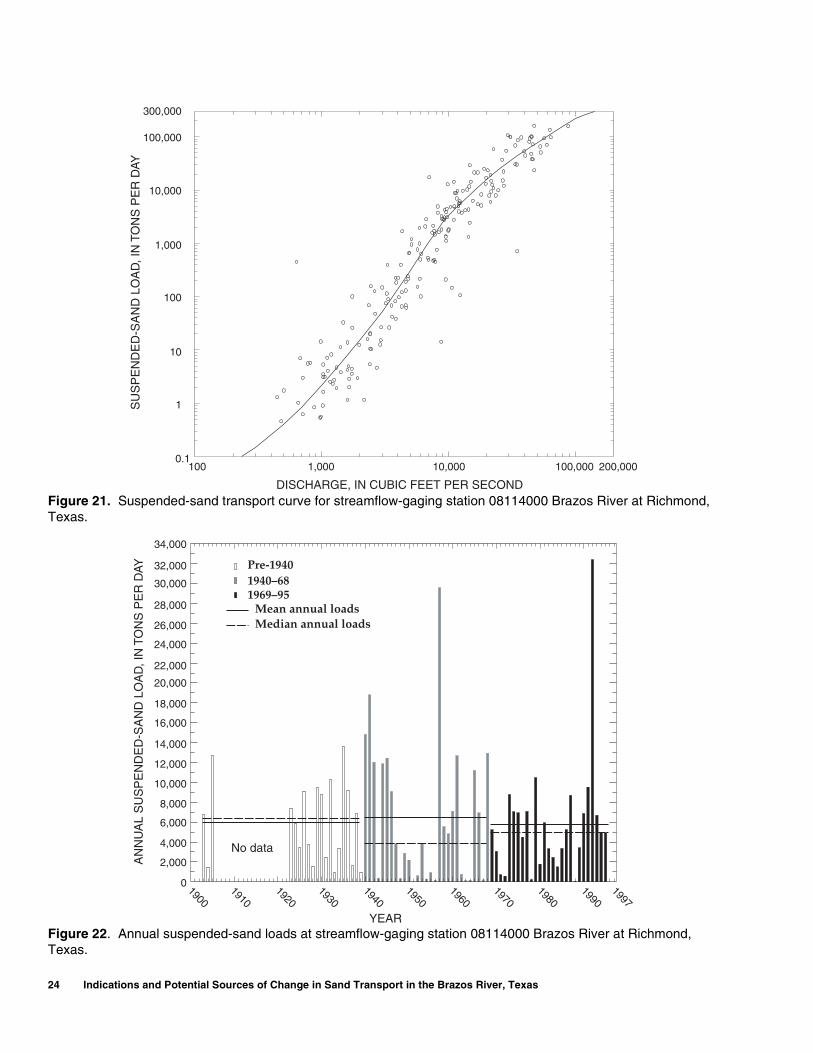
Changes in transport capacity because of reduc-tions in the frequency and magnitude of large discharges can be identified by estimating loads using the historical record of daily discharge and a functional relation between sand transport and discharge. This functional relation can be from a regression analysis relating measured transport rates with discharge, a sediment-transport curve relating transport rates with discharge, or one of the many sediment-transport equations pub-lished in the literature.
A sediment-transport curve was drawn relating suspended-sand load to water discharge at the Rich-mond streamflow-gaging station (fig. 21) to test whether the capacity of the Brazos River to transport sediment has been reduced significantly solely because of reductions in large discharges. The sediment samples taken before 1982 and after 1981 were not differentiated because the intent was to determine, given a representa-tive transport relation, whether reductions in the fre-quency and magnitude of large discharges could reduce the capacity of the Brazos River to transport sand-size sediment. Load-discharge pairs were read from the rating curve and used to build a rating table. The rating table was applied to the historical record of daily dis-charge at the Richmond streamflow-gaging station using log-log interpolation between the rating table values to compute daily values of suspended-sand load.
The daily values of suspended-sand load were then summed to annual values, as shown in figure 22.
Table 4. Summary of statistical tests for differences in annually computed daily flow percentiles between the pre-1940 period and the 1969–95 period at streamflow-gaging station 08114000 Brazos River at Richmond, Texas
Percentile
Median discharge(cubic feet per second)
p-value
Pre-1940 1969–95Test for difference
in median percentileTest for difference
in ranked percentile
50 8,583 7,594 0.450 0.332
75 17,427 15,190 .265 .013
80 20,615 17,717 .241 .039
83.3 23,212 19,811 .210 .039
87.5 26,836 23,284 .176 .013
90 29,650 26,105 .151 .004
95 38,465 34,439 .145 <.001
98 49,870 43,290 .134 <.001
99 57,923 48,679 .129 <.001
24 Indications and Potential Sources of Change in Sand Transport in the Brazos River, Texas
34,000
32,000
30,000
28,000
26,000
24,000
22,000
20,000
18,000
16,000
14,000
12,000
10,000
8,000
6,000
4,000
2,000
0
AN
NU
AL
SU
SP
EN
DE
D-S
AN
D L
OA
D, I
N T
ON
S P
ER
DAY
19001910
19201930
19401950
19601970
19801990
YEAR
1997
No data
Pre-19401940–681969–95
Mean annual loadsMedian annual loads
Figure 22. Annual suspended-sand loads at streamflow-gaging station 08114000 Brazos River at Richmond, Texas.
300,000
100,000
10,000
1,000
100
10
1
0.1
SU
SP
EN
DE
D-S
AN
D L
OA
D, I
N T
ON
S P
ER
DAY
100 1,000 10,000 100,000 200,000
DISCHARGE, IN CUBIC FEET PER SECONDFigure 21. Suspended-sand transport curve for streamflow-gaging station 08114000 Brazos River at Richmond, Texas.

POTENTIAL SOURCES OF CHANGE IN SAND TRANSPORT 25
There is no statistically significant difference in the median annual loads between the early, middle, and late periods. The median annual suspended-sand load was estimated to be 6,350 tons per day during the early period and 4,960 tons per day during the late period. Although the difference between the early and late periods seems appreciable, it is not statistically signifi-cant (p = 0.22), probably because of the large variance in the data and the relatively few datapoints available. The fact that the median annual suspended-sand loads were not significantly different between the early and late periods prevents a definitive conclusion that the frequency and magnitude of large discharges reduced the capacity of the Brazos River to transport sand-size sediment.
POTENTIAL SOURCES OF CHANGE IN SAND TRANSPORT
Several indicators of change in the transport of sand in the Brazos River have been identified, and all relate within the context of Lane’s relation (eq. 3). The Brazos River was shown to develop sufficient shear stress to mobilize its bed material at least 82 percent of the time, so the capacity of the river to transport bed material is not in question. The transport of sand in the Brazos River depends on a complex set of factors, most of which are continually changing. Identification of a single causative factor as the sole source of change gen-erally is impossible, unless that activity overwhelm-ingly influences the hydrology of the basin or the hydraulic characteristics of the river channel. All of the indicators of change identified provide only subtle inferences of change. They do not provide definitive evidence of a change in sand loads, but they do imply that sand loads are decreasing somewhat. Below, several possible sources of change are discussed in relation to the indicators previously identified.
Reservoir Construction
The extensive reservoir construction in the Brazos River Basin could substantially reduce sand transport to the Gulf by trapping sediment and by reducing the mag-nitude of upper-tail discharges. The entrapment of sand generally has the most critical effect immediately down-stream from a reservoir. Water released from the reser-voir contains little or no sand and removes material
from the stream channel to satisfy the transport capac-ity. Subsequent channel down-cutting as great as 30 or 40 ft has been observed in some rivers. Channel erosion continues downstream until instream sediment is resup-plied by erosion from the bed and banks of the channel or by tributaries.
The amount of sediment trapped in the Brazos River reservoirs is difficult to determine. Initial reservoir-capacity surveys made during the times when most reservoirs were constructed were of limited accu-racy. Relatively few updated surveys have been made in the Brazos River Basin, and until recently, those surveys also had accuracy limitations. The TWDB recently began using improved reservoir-capacity survey tech-niques that have been used for a few reservoirs in the Brazos River Basin. The accuracy of the new surveys is greatly improved over those made using traditional methods. However, the increase in accuracy limits the ability to make meaningful comparisons between the new surveys and the original surveys to determine res-ervoir sedimentation rates. One cannot make a compar-ison between the two with any degree of confidence (Scott Sullivan, Texas Water Development Board, oral commun., 1996). Any change in reservoir capacity could be attributed simply to differences in survey tech-niques. Several of the recent reservoir-capacity surveys made by the TWDB have shown larger reservoir capac-ities than those obtained during the original surveys.
Regardless, reservoir entrapment of sand proba-bly has little effect on sand transport to the lower reaches of the Brazos River. About 350 river miles separate the farthest downstream main-channel reser-voir (Lake Whitney) and the Richmond streamflow-gaging station. The City of Waco operates a water-supply diversion dam on the main stem of the Brazos River, about 309 river miles upstream of the Richmond gaging station, which also has the potential to trap sand. About 40 tributaries drain to the Brazos River between Lake Whitney and Waco. Childress Creek is the largest unregulated tributary between Lake Whitney and Waco, with a drainage area of 87 mi2. Allen and others (1989) documented about 4 to 5 ft of local channel agradation in this reach since construction of Lake Whitney in 1951 and stated that the reduction of peak flows from Lake Whitney reduced the ability of the Brazos River to transport sediment discharged from tributaries,

26 Indications and Potential Sources of Change in Sand Transport in the Brazos River, Texas
facilitating the growth of tributary delta systems down-stream of Lake Whitney. Bank loss in this reach has ranged from 5 to 14 ft/yr, indicating that substantial quantities of sand are being introduced to the main channel. Apparently, sand trapped by the upstream reservoir is compensated for within a short distance downstream by the introduction of tributary sediment and localized bank erosion.
Reservoirs have reduced the magnitude of upper-tail discharges in the lower Brazos River and reduced the capacity of the Brazos River to transport sand to the Gulf. However, during extended, severely dry periods such as occurred during the drought of the 1950s, regu-lated peak flows were smaller than natural peaks under drought conditions to maintain reservoir conservation storage. Seelig and Sorenson (1973) analyzed flows and sediment loads from the Brazos River to the Gulf from about 1930 to about 1965. They identify a substantial decrease (about 60 percent) in the transport of sand to the Gulf beginning about 1941 and attribute much of the decrease to reservoir construction. However, data col-lected since 1965 indicate that sand transport has not decreased as much as reported by Seelig and Sorenson (1973). The decreases identified by Seelig and Sorenson (1973) likely were caused more by the extended drought of the 1950s than by upstream reservoir construction. However, the presence of the reservoirs during this severe drought did reduce peak flows and, conse-quently, sediment transport.
Changes in Land Use
Changes in land use in a river basin will alter the amount of sediment delivered to a stream by erosion processes. During the 19th and early parts of the 20th centuries, the amount of land in the Brazos River Basin under agricultural production increased substantially. This land, originally rangeland or forested woodland, was cleared of vegetation to grow crops such as cotton, corn, and sorghum. Modern soil-conservation practices in agriculture were not available, and the erosion poten-tial of the cleared land greatly increased when the natural vegetation was removed. Although no records are available, it is recognized generally that substantial quantities of topsoil were lost. The topsoil was trans-ported to the tributaries and main channel of the Brazos River by hillslope erosion processes.
Although accurate determination of the quantity of soil transported to the Brazos River attributable to agricultural practices is not possible, documented his-
torical amounts of land under agricultural production can be used to estimate qualitatively the erosion poten-tial in the watershed at various times. The U.S. Depart-ment of Agriculture publishes by county the number of acres harvested every 5 years. The county figures are aggregated by individual crop types. The data for 1924–92 were retrieved for total crops harvested and for total acres of hay for the 27 counties that are partly or completely within the lower one-third of the Brazos River Basin. The total area in these counties is about 15,000,000 acres. Acres of hay were subtracted from the total acres harvested to estimate the amount of land under non-hay crop production. Land under production of non-hay crops generally has more erosion potential than land under hay production.
As shown in figure 23, the total area of harvested acres of non-hay crops in the lower basin during 1924–92 decreased from about 32 percent to about 8 percent of the total area. Without consideration of improved soil-conservation practices, the erosion potential in the Brazos River Basin has decreased substantially since 1924, simply on the basis of total acreage removed from agricultural production. Most of this land has been transformed to open rangeland for which the erosion potential is small. Substantial decreases in the erosion potential of a river basin generally are followed by a decrease in the quantity of sediment reaching the main-stem channel; the decrease generally is not immediate but will occur gradually as the supply from watershed erosion diminishes. Any decrease in the quantity of sed-iment transported by the Brazos River can be attributed partly to a decrease in the supply of sediment from the watershed, manifested first in a decrease in wash load, which tends to have a rapid response to changes in watershed erosion potential.
Instream Sand and Gravel Mining
Sand and gravel have been mined from the lower Brazos River channel for many years. The loca-tions of sand and gravel mining operations, as permitted by the TPWD in 1995, in the reach between the Hempstead and Rosharon streamflow-gaging stations are shown in figure 24. The operations in this area account for 2 to 3 percent of the total statewide sand and gravel production (Gustavson and Bullen, 1996). Annual weight of sand extracted by the operators in the area as reported to the TPWD for 1979–95 is shown in figure 25. The total suspended sand transported past the

POTENTIAL SOURCES OF CHANGE IN SAND TRANSPORT 27
Richmond streamflow-gaging station computed using the sediment-transport curve described previously also is shown in figure 25.
Cumulative weight of sand extracted and cumula-tive sand transported for 1979–95 are shown in figure 26. During that period, sand extracted from the Brazos River channel totaled about 28 percent of the suspended sand transported past the Richmond streamflow-gaging station. The amount of sand extracted through instream mining represents a fraction of the total sediment trans-ported by the Brazos River.
Depending on the configuration and size of oper-ation, the dredged (excavated) part of the main channel has the potential to refill rather quickly by trapping sed-iment transported from upstream. Most dredged areas can be substantially refilled during a single, prolonged rise of the Brazos River (David Kurz, Sand Supply Corp., oral commun., 1996). Bed load is trapped, and larger particles in suspension also can settle out when velocities in the dredged area generally are slower than those in the undisturbed channel immediately adjacent.
A sudden decrease in the supply of sediment (such as potentially would occur downstream from a
mining operation that traps substantial quantities of sed-iment) could cause bank erosion and general channel instability downstream. In Lane’s relation (eq. 3), a decrease in sediment supply, assuming no change in the dominant discharge or the characteristic size of the transported sediment, will result in a decrease in the energy slope. A decrease in the energy slope will result in either channel down-cutting, an increased rate of channel migration (meandering), or a combination of both.
Gustavson and Bullen (1996) investigated the wavelength and amplitude of meander bends in the Brazos River in the same area as this study and found no temporal changes in the general morphology of individual meander loops. They did find that the lateral migration of meander bends decreases through the study area and that the channel becomes progressively more incised in the downstream direction. However, Gustavson and Bullen (1996) attribute these findings more to variation in valley slope and lithology than to sand and gravel mining.
5,000,000
4,500,000
4,000,000
3,500,000
3,000,000
2,500,000
2,000,000
1,500,000
1,000,000
500,000
HA
RV
ES
TE
D A
CR
ES
1924
1929
1934
1940
1945
1950
1954
1959
1964
1969
1974
1978
1982
1987
1992
YEAR
HayNon-hay
Figure 23. Total acres harvested in the 27 counties in the lower Brazos River Basin, Texas.

28 Indications and Potential Sources of Change in Sand Transport in the Brazos River, Texas
The quantity of sediment extracted by instream sand and gravel mining operations represents about 28 percent of the suspended sand transported by the Brazos River at Richmond. However, it represents a potentially smaller percentage of the total sand transported by the river in suspension and bed load. The bed load can range from 10 to 150 percent of the suspended load of a stream (Simons and Senturk, 1992). On the basis of these per-
centages, the quantity of sand extracted from the Brazos River could represent from 11 to 25 percent of the total sand transported. This extraction occurs over a distance of about 100 river miles, which probably lessens the overall effects. Consequently, the overall long-term effects of instream sand and gravel mining on sand transported from the Brazos River to the Gulf of Mexico could not be quantified.
BRAZOS
RIVER
SOMERVILLE LAKE
WASHINGTON COUNTY
AUSTIN COUNTY
WALLER COUNTY
FORT BEND COUNTY
BRAZORIA COUNTY
HEMPSTEAD
96o
96o30'
95o30'
30o
29o30'
29o
0 10 20 30 MILES
RICHMOND
ROSHARON
08111500
08114000
08116650
Sand and gravel productionsite
Streamflow-gaging stationand number
EXPLANATION
08111500
Basin boundary
Figure 24. Location of selected sand and gravel production sites in the lower Brazos River Basin, Texas.
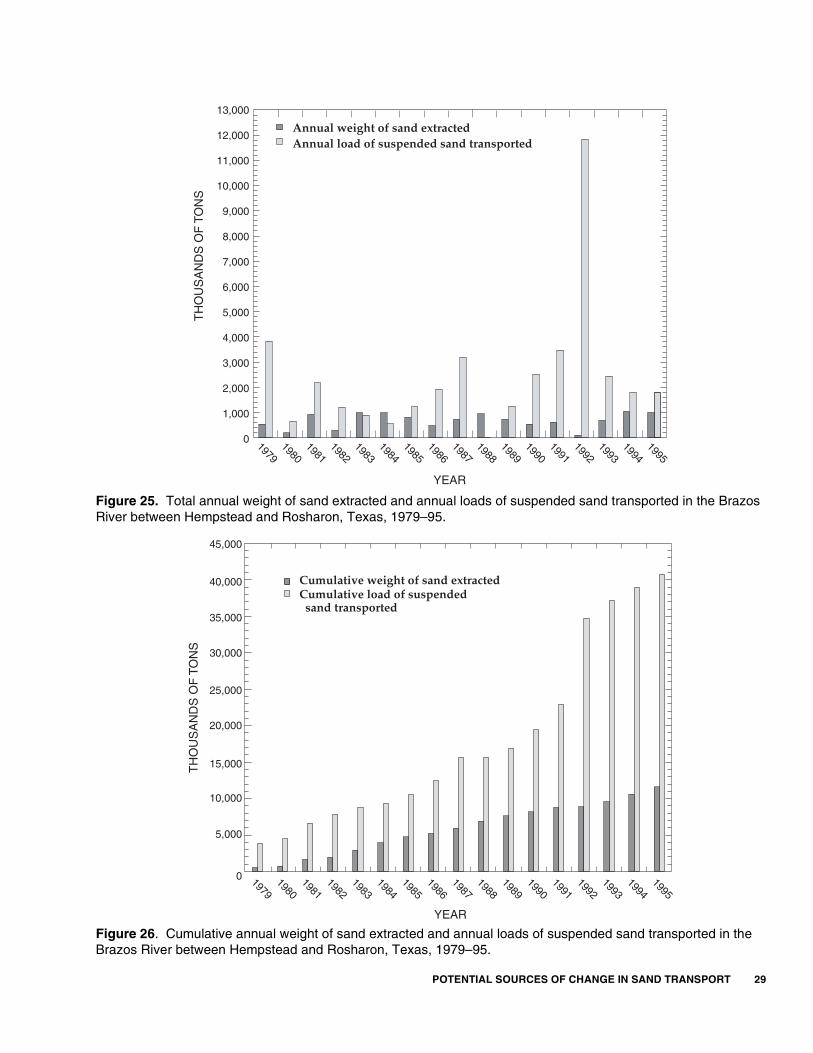
POTENTIAL SOURCES OF CHANGE IN SAND TRANSPORT 29
45,000
40,000
35,000
30,000
25,000
20,000
15,000
10,000
5,000
0 19791980
19811982
19831984
19851986
19871988
19891990
19911992
19931994
1995
YEAR
TH
OU
SA
ND
S O
F T
ON
S
Cumulative weight of sand extractedCumulative load of suspended sand transported
Figure 26. Cumulative annual weight of sand extracted and annual loads of suspended sand transported in the Brazos River between Hempstead and Rosharon, Texas, 1979–95.
13,000
12,000
11,000
10,000
9,000
8,000
7,000
6,000
5,000
4,000
3,000
2,000
1,000
0
TH
OU
SA
ND
S O
F T
ON
S
19791980
19811982
19831984
19851986
19871988
19891990
19911992
19931994
1995
YEAR
Annual weight of sand extractedAnnual load of suspended sand transported
Figure 25. Total annual weight of sand extracted and annual loads of suspended sand transported in the Brazos River between Hempstead and Rosharon, Texas, 1979–95.
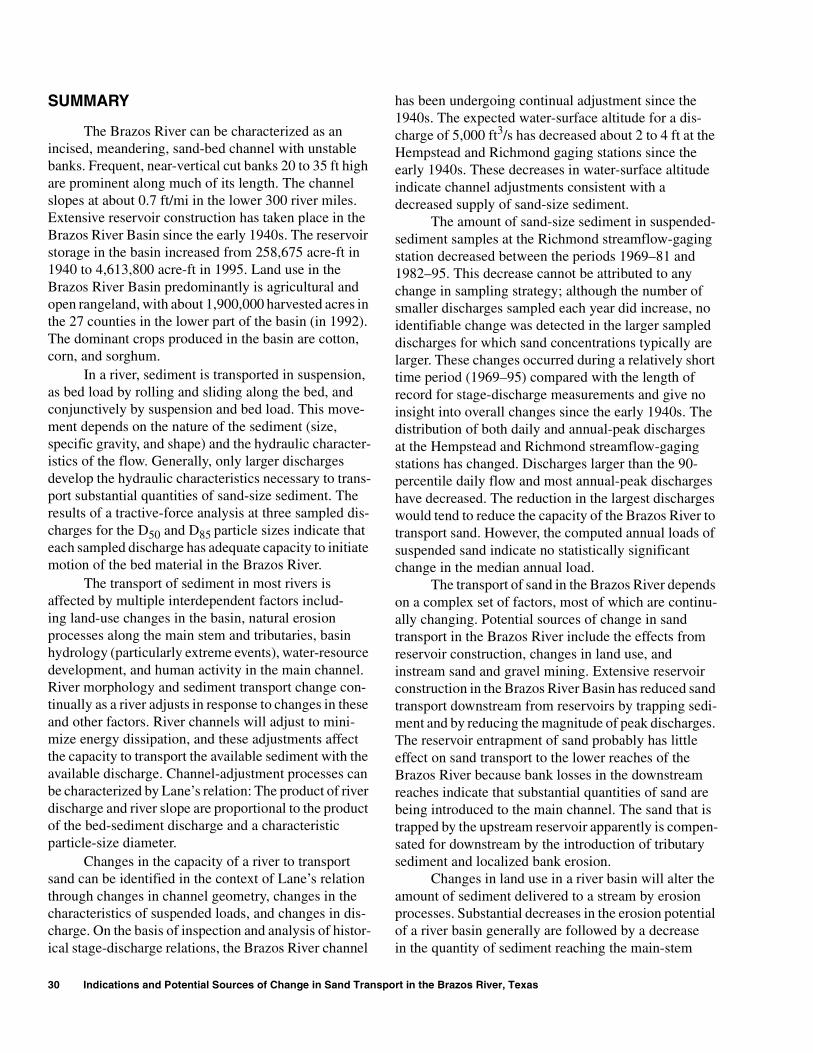
30 Indications and Potential Sources of Change in Sand Transport in the Brazos River, Texas
SUMMARY
The Brazos River can be characterized as an incised, meandering, sand-bed channel with unstable banks. Frequent, near-vertical cut banks 20 to 35 ft high are prominent along much of its length. The channel slopes at about 0.7 ft/mi in the lower 300 river miles. Extensive reservoir construction has taken place in the Brazos River Basin since the early 1940s. The reservoir storage in the basin increased from 258,675 acre-ft in 1940 to 4,613,800 acre-ft in 1995. Land use in the Brazos River Basin predominantly is agricultural and open rangeland, with about 1,900,000 harvested acres in the 27 counties in the lower part of the basin (in 1992). The dominant crops produced in the basin are cotton, corn, and sorghum.
In a river, sediment is transported in suspension, as bed load by rolling and sliding along the bed, and conjunctively by suspension and bed load. This move-ment depends on the nature of the sediment (size, specific gravity, and shape) and the hydraulic character-istics of the flow. Generally, only larger discharges develop the hydraulic characteristics necessary to trans-port substantial quantities of sand-size sediment. The results of a tractive-force analysis at three sampled dis-charges for the D50 and D85 particle sizes indicate that each sampled discharge has adequate capacity to initiate motion of the bed material in the Brazos River.
The transport of sediment in most rivers is affected by multiple interdependent factors includ-ing land-use changes in the basin, natural erosion processes along the main stem and tributaries, basin hydrology (particularly extreme events), water-resource development, and human activity in the main channel. River morphology and sediment transport change con-tinually as a river adjusts in response to changes in these and other factors. River channels will adjust to mini-mize energy dissipation, and these adjustments affect the capacity to transport the available sediment with the available discharge. Channel-adjustment processes can be characterized by Lane’s relation: The product of river discharge and river slope are proportional to the product of the bed-sediment discharge and a characteristic particle-size diameter.
Changes in the capacity of a river to transport sand can be identified in the context of Lane’s relation through changes in channel geometry, changes in the characteristics of suspended loads, and changes in dis-charge. On the basis of inspection and analysis of histor-ical stage-discharge relations, the Brazos River channel
has been undergoing continual adjustment since the 1940s. The expected water-surface altitude for a dis-charge of 5,000 ft3/s has decreased about 2 to 4 ft at the Hempstead and Richmond gaging stations since the early 1940s. These decreases in water-surface altitude indicate channel adjustments consistent with a decreased supply of sand-size sediment.
The amount of sand-size sediment in suspended-sediment samples at the Richmond streamflow-gaging station decreased between the periods 1969–81 and 1982–95. This decrease cannot be attributed to any change in sampling strategy; although the number of smaller discharges sampled each year did increase, no identifiable change was detected in the larger sampled discharges for which sand concentrations typically are larger. These changes occurred during a relatively short time period (1969–95) compared with the length of record for stage-discharge measurements and give no insight into overall changes since the early 1940s. The distribution of both daily and annual-peak discharges at the Hempstead and Richmond streamflow-gaging stations has changed. Discharges larger than the 90-percentile daily flow and most annual-peak discharges have decreased. The reduction in the largest discharges would tend to reduce the capacity of the Brazos River to transport sand. However, the computed annual loads of suspended sand indicate no statistically significant change in the median annual load.
The transport of sand in the Brazos River depends on a complex set of factors, most of which are continu-ally changing. Potential sources of change in sand transport in the Brazos River include the effects from reservoir construction, changes in land use, and instream sand and gravel mining. Extensive reservoir construction in the Brazos River Basin has reduced sand transport downstream from reservoirs by trapping sedi-ment and by reducing the magnitude of peak discharges. The reservoir entrapment of sand probably has little effect on sand transport to the lower reaches of the Brazos River because bank losses in the downstream reaches indicate that substantial quantities of sand are being introduced to the main channel. The sand that is trapped by the upstream reservoir apparently is compen-sated for downstream by the introduction of tributary sediment and localized bank erosion.
Changes in land use in a river basin will alter the amount of sediment delivered to a stream by erosion processes. Substantial decreases in the erosion potential of a river basin generally are followed by a decrease in the quantity of sediment reaching the main-stem
REFERENCES CITED 31
channel. The total area of harvested acres of non-hay crops in the lower Brazos River Basin during 1924–92 decreased more than 75 percent from about 32 percent to about 8 percent of the total area. The removal of major acreage from agricultural production has substan-tially reduced erosion potential.
Several sand and gravel mining sites are located on the Brazos River between Hempstead and Rosharon. The quantity of sediment extracted by instream sand and gravel mining operations could represent from 11 to 25 percent of the total sand transported by the Brazos River. However, the extraction occurs over a distance of about 100 river miles, which probably lessons the over-all effects. The effects of mining on sand transport could not be quantified.
REFERENCES CITED
Allen, P.M., Hobbs, R., and Maier, N.D., 1989, Downstream impacts of a dam on a bedrock fluvial system, Brazos River, Central Texas: Bulletin of the Association of Engineering Geologists, v. XXVI, no. 2, p. 165–189.
Andrews, F.L., 1989, Monthly and annual suspended-sediment loads in the Brazos River at Richmond, Texas, 1966–86 water years: U.S. Geological Survey Water-Resources Investigations Report 88–4216, 20 p.
Chang, H.H., 1988, Fluvial processes in river engineering: New York, John Wiley, 432 p.
Cleveland, W.S., 1979, Robust locally weighted regression and smoothing scatterplots: Journal of the American Statistical Association, v. 74, p. 829–836.
Colby, B.R., 1957, Relationship of unmeasured sediment dis-charge to mean velocity: American Geophysical Union Transactions, v. 35, no. 5, p. 708–717.
Collier, M., Webb, R.H., and Schmidt, J.C., 1996, Dams and reservoirs, a primer on the downstream effects of dams: U.S. Geological Survey Circular 1126, 94 p.
David, H.A., 1981, Order statistics: New York, John Wiley, 360 p.
Dougherty, J.P., 1979, Suspended-sediment load of Texas streams, compilation report, October 1971–September 1975: Texas Department of Water Resources Report 233, 83 p.
Edwards, T.K., and Glysson, G.D., 1999, Field methods for measurement of fluvial sediment: U.S. Geological Survey Techniques of Water-Resources Investigations, book 3, chap. C2, 89 p.
Gillespie, B.M., and Giardino, J.R., 1997, The nature of channel planform change—Brazos River, Texas: Texas Journal of Science, v. 49, no. 2, p. 108–142.
Gustavson, T.C., and Bullen, G.R., 1996, Sand and gravel mining in the Brazos River—An assessment of erosion
potential and economic impact: University of Texas Bureau of Economic Geology, 28 p.
Guy, H.P., and Norman, V.W., 1970, Field methods for measurement of fluvial sediment: U.S. Geological Survey Techniques of Water-Resources Investigations, book 3, chap. C2, 59 p.
Helsel, D.R., and Hirsch, R.M., 1992, Studies in environmen-tal science 49—Statistical methods in water resources: New York, Elsevier, 522 p.
Kaigh, W.D., and Driscoll, M.F., 1987, Numerical and graph-ical data summary using o-statistics: The American Statistician, v. 41, no. 1, p. 25–32.
Lane, E.W., 1955, The importance of fluvial geomorphology in hydraulic engineering: American Society of Civil Engineers Proceedings, v. 81, no. 745, p. 1–17.
Mathewson, C.C., and Minter, L.L., 1976, Impact of water resource development on coastal erosion, Brazos River, Texas: Texas Water Resources Institute, Texas A&M University, Technical Report 77, 85 p.
McGowen, J.H., Garner, L.E., and Wilkinson, B.H., 1977, The Gulf Shoreline of Texas—Processes, characteris-tics, and factors of use: University of Texas Bureau of Economic Geology, Geological Circular 77–3, 27 p.
Morton, R.A., and Pieper, M.J., 1975, Shoreline changes in the vicinity of the Brazos River Delta (San Luis Pass to Brown Cedar Cut), an analysis of historical changes of the Texas Gulf Shoreline: University of Texas Bureau of Economic Geology, Geological Circular 75–4, 47 p.
Richardson, E.V., Simons, D.B., and Julien, P.Y., 1990, Highways in the river environment: Participant Note-book, Federal Highway Administration, Publication FHWA–HI–90–016.
Robbins, C.H., and Simon, A., 1983, Man-induced channel adjustment in Tennessee streams: U.S. Geological Survey Open-File Report 83–043, 95 p.
Seelig, W.N., and Sorenson, R.M., 1973, Investigation of shoreline changes at Sargent Beach, Texas: Texas A&M University, C.O.E. Report 169, 153 p.
Simons, D.B., and Senturk, F., 1992, Sediment transport tech-nology, water and sediment dynamics: Littleton, Colo., Water Resources Publications, 897 p.
Stauble, D.K., Hubertz, J.M., Hoban, R.J., Livingston, C.R., Pollock, C.E., and Levine, D.R., 1994, Coastal studies in support of the Sargent Beach, Texas, erosion control project: Coastal Engineering Research Center, U.S. Army Corps of Engineers Waterways Experiment Station, Miscellaneous Paper CERC–94–3, 94 p.
Stelczer, K., 1981, Bed-load transport, theory and transport: Littleton, Colo., Water Resources Publications, 295 p.
Thornes, J.B., 1977, Hydraulic geometry and channel changes, in Gregory, K.J., ed., River channel changes: New York, John Wiley, p. 91–100.
32 Indications and Potential Sources of Change in Sand Transport in the Brazos River, Texas
U.S. Department of Agriculture, 1997, Texas’ 1992 census of agriculture state and county highlights: National Agricultural Statistics Service, accessed November 27, 2000, at URLhttp://www.nass.usda.gov:80/census/census92/atlas92/html/tx.htm
Vanoni, V.A., ed., 1975, Sedimentation engineering—Manuals and reports on engineering practice, no. 54: New York, American Society of Civil Engineers, 745 p.
Welborn, C.T., 1967, Comparative results of sediment sam-pling with the Texas sampler and the depth-integrating samplers: Texas Water Development Board Report 36, 109 p.
Wurbs, R.A., Bergman, C.E., Carriere, P.E., and Walls, B.W., 1988, Hydrologic and institutional water availability in the Brazos River Basin: Texas Water Resources Institute, Texas A&M University, Technical Report 144, 238 p.

Dunn and Raines— Indications and Potential Sources of Change in Sand Transport in the Brazos River, Texas —USGS WRIR 01–4057
District Chief U.S. Geological Survey 8027 Exchange Dr.Austin, TX 78754–4733
Related Documents