Full Terms & Conditions of access and use can be found at http://www.tandfonline.com/action/journalInformation?journalCode=khvi20 Human Vaccines & Immunotherapeutics ISSN: 2164-5515 (Print) 2164-554X (Online) Journal homepage: http://www.tandfonline.com/loi/khvi20 Decomposing the gap in missed opportunities for vaccination between poor and non-poor in sub- Saharan Africa: A Multicountry Analyses Duduzile Ndwandwe, Olalekan A. Uthman, Abdu A. Adamu, Evanson Z. Sambala, Alison B. Wiyeh, Tawa Olukade, Ghose Bishwajit, Sanni Yaya, Jean- Marie Okwo-Bele & Charles S. Wiysonge To cite this article: Duduzile Ndwandwe, Olalekan A. Uthman, Abdu A. Adamu, Evanson Z. Sambala, Alison B. Wiyeh, Tawa Olukade, Ghose Bishwajit, Sanni Yaya, Jean-Marie Okwo-Bele & Charles S. Wiysonge (2018): Decomposing the gap in missed opportunities for vaccination between poor and non-poor in sub-Saharan Africa: A Multicountry Analyses, Human Vaccines & Immunotherapeutics, DOI: 10.1080/21645515.2018.1467685 To link to this article: https://doi.org/10.1080/21645515.2018.1467685 © 2018 The Author(s). Published with license by Taylor & Francis View supplementary material Accepted author version posted online: 24 Apr 2018. Published online: 01 Jun 2018. Submit your article to this journal Article views: 220 View Crossmark data Citing articles: 1 View citing articles

Welcome message from author
This document is posted to help you gain knowledge. Please leave a comment to let me know what you think about it! Share it to your friends and learn new things together.
Transcript
Full Terms & Conditions of access and use can be found athttp://www.tandfonline.com/action/journalInformation?journalCode=khvi20
Human Vaccines & Immunotherapeutics
ISSN: 2164-5515 (Print) 2164-554X (Online) Journal homepage: http://www.tandfonline.com/loi/khvi20
Decomposing the gap in missed opportunities forvaccination between poor and non-poor in sub-Saharan Africa: A Multicountry Analyses
Duduzile Ndwandwe, Olalekan A. Uthman, Abdu A. Adamu, Evanson Z.Sambala, Alison B. Wiyeh, Tawa Olukade, Ghose Bishwajit, Sanni Yaya, Jean-Marie Okwo-Bele & Charles S. Wiysonge
To cite this article: Duduzile Ndwandwe, Olalekan A. Uthman, Abdu A. Adamu, Evanson Z.Sambala, Alison B. Wiyeh, Tawa Olukade, Ghose Bishwajit, Sanni Yaya, Jean-Marie Okwo-Bele& Charles S. Wiysonge (2018): Decomposing the gap in missed opportunities for vaccinationbetween poor and non-poor in sub-Saharan Africa: A Multicountry Analyses, Human Vaccines &Immunotherapeutics, DOI: 10.1080/21645515.2018.1467685
To link to this article: https://doi.org/10.1080/21645515.2018.1467685
© 2018 The Author(s). Published withlicense by Taylor & Francis
View supplementary material
Accepted author version posted online: 24Apr 2018.Published online: 01 Jun 2018.
Submit your article to this journal
Article views: 220 View Crossmark data
Citing articles: 1 View citing articles
RESEARCH PAPER
Decomposing the gap in missed opportunities for vaccination between poorand non-poor in sub-Saharan Africa: A Multicountry Analyses
Duduzile Ndwandwe a,†, Olalekan A. Uthman b,c,†, Abdu A. Adamu a,c, Evanson Z. Sambalaa, Alison B. Wiyeha,Tawa Olukade d, Ghose Bishwajite, Sanni Yaya e, Jean-Marie Okwo-Belef, and Charles S. Wiysonge a,c,g
aCochrane South Africa, South African Medical Research Council, Cape Town, South Africa; bWarwick-Centre for Applied Health Research and Delivery(WCAHRD), Division of Health Sciences, University of Warwick Medical School, Coventry, United Kingdom; cCentre for Evidence-based Health Care,Division of Epidemiology and Biostatistics, Department of Global Health, Faculty of Medicine and Health Sciences, Stellenbosch University, Cape Town,South Africa; dDepartment of Research and Development, Center for Evidence Based Global Health, Minna, Nigeria; eSchool of InternationalDevelopment and Global Studies, University of Ottawa, Ontario, Canada; fIndependent Consultant, Geneva, Switzerland; gDivision of Epidemiology andBiostatistics, School of Public Health and Family Medicine, University of Cape Town, Cape Town, South Africa
ARTICLE HISTORYReceived 6 February 2018Revised 26 March 2018Accepted 5 April 2018
ABSTRACTUnderstanding the gaps in missed opportunities for vaccination (MOV) in sub-Saharan Africa would informinterventions for improving immunisation coverage to achieving universal childhood immunisation. Weaimed to conduct a multicountry analyses to decompose the gap in MOV between poor and non-poor inSSA. We used cross-sectional data from 35 Demographic and Health Surveys in SSA conducted between2007 and 2016. Descriptive statistics used to understand the gap in MOV between the urban poor andnon-poor, and across the selected covariates. Out of the 35 countries included in this analysis, 19 countriesshowed pro-poor inequality, 5 showed pro-non-poor inequality and remaining 11 countries showed nostatistically significant inequality. Among the countries with statistically significant pro-illiterate inequality,the risk difference ranged from 4.2% in DR Congo to 20.1% in Kenya. Important factors responsible for theinequality varied across countries. In Madagascar, the largest contributors to inequality in MOV weremedia access, number of under-five children, and maternal education. However, in Liberia media accessnarrowed inequality in MOV between poor and non-poor households. The findings indicate that in mostSSA countries, children belonging to poor households are most likely to have MOV and that socio-economic inequality in is determined not only by health system functions, but also by factors beyond thescope of health authorities and care delivery system. The findings suggest the need for addressing socialdeterminants of health.
KEYWORDSMissed opportunities forvaccination; inequality inmissed opportunities forvaccination; immunisationcoverage; DHS survey data;Decomposition analysis; sub-Saharan Africa
Introduction
Global immunisation coverage data for 2016 indicate that morethan 60% of the 19.5 million children worldwide that did notreceive the full primary series of three doses of diphtheria-teta-nus-pertussis containing vaccines (DTP3) live in low and mid-dle-income countries.1 This suggests that there are missedopportunities for vaccination (MOV) in these countries. MOVrefers to any contact with health services by an individual whois eligible for vaccination (e.g. unvaccinated or partially vacci-nated and free of contraindications to vaccination), which doesnot result in the person receiving one or more of the vaccinedoses for which he or she is eligible.2 Missed opportunities forvaccination occur in two major settings: (1) during visits forimmunisation and other preventive services (e.g., growth moni-toring, nutrition assessments, and oral rehydration training ses-sions), and (2) during visits for curative services. In bothsettings, eliminating missed opportunities will raise the overall
immunisation coverage in a population, particularly when theavailability and use of health services are high. When the avail-ability and use of health services are low, immunising at everyhealth care contact is extremely important because the risk forvaccine-preventable diseases is likely to be high in these areas.
Strategies to reduce missed opportunities for vaccinationare recommended, many of which emphasize the usefulness ofperiodic systematic monitoring of vaccine uptake to evaluatethe quality of immunisation programme performance at thehealth service level as well as progress towards reducingmissed opportunities.3 A systematic review published in 2014found the prevalence of MOVs in low- and middle-incomecountries was high, but the large number of identified reasonsprecludes standardized solutions. The authors emphasised theimportance of the assessement of temporal and geographicvariations4
CONTACT Duduzile Ndwandwe [email protected] Cochrane South Africa, South African Medical Research Council, Francie van Zijl Drive, ParowValley, 7501, South Africa.yDuduzile Ndwandwe and Olalekan A Uthman contributed equally to this manuscript and are joint first authors.
Supplemental data for this article can be accessed on the publisher’s website.© 2018 The Author(s). Published with license by Taylor & FrancisThis is an Open Access article distributed under the terms of the Creative Commons Attribution-NonCommercial-NoDerivatives License (http://creativecommons.org/licenses/by-nc-nd/4.0/),which permits non-commercial re-use, distribution, and reproduction in any medium, provided the original work is properly cited, and is not altered, transformed, or built upon in any way.
HUMAN VACCINES & IMMUNOTHERAPEUTICS2018, VOL. 0, NO. 0, 1–7https://doi.org/10.1080/21645515.2018.1467685
Understanding the gaps in MOV in sub-Saharan Africa wouldinform interventions for improving immunisation coverage toachieving universal childhood immunisation. We aimed to con-duct a multicountry analyses with efforts to decompose the gap inMOVbetween poor and non-poor in sub-Saharan Africa.
Results
Survey and sample characteristics
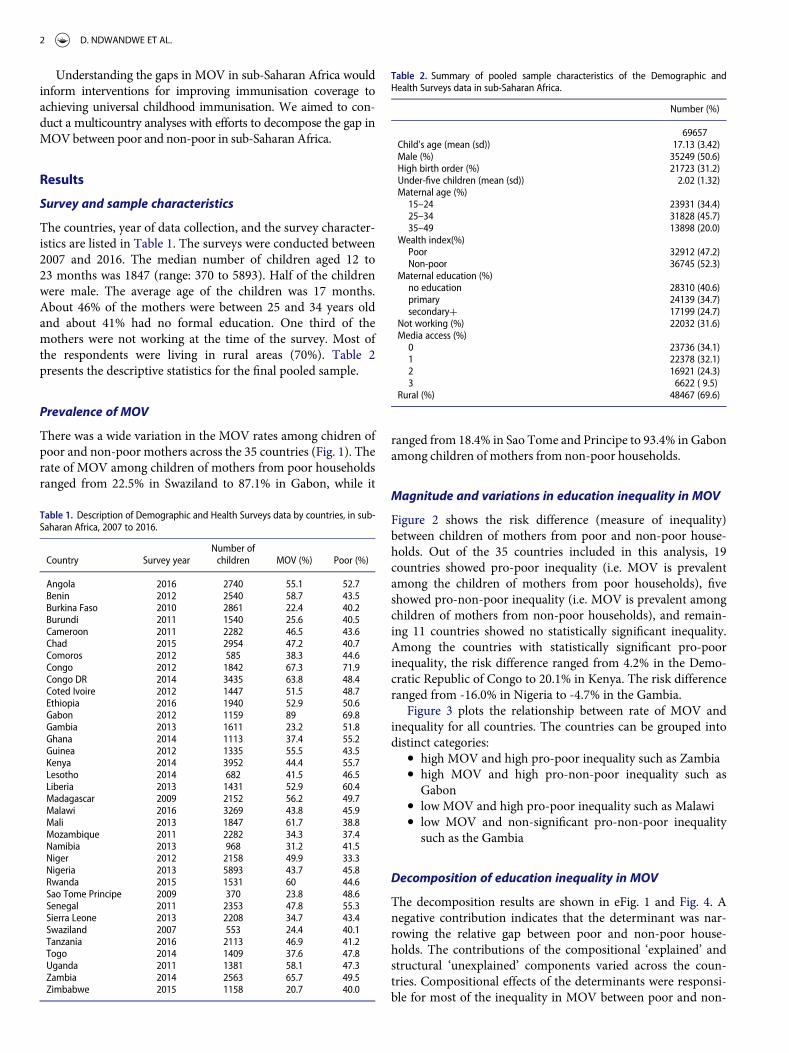
The countries, year of data collection, and the survey character-istics are listed in Table 1. The surveys were conducted between2007 and 2016. The median number of children aged 12 to23 months was 1847 (range: 370 to 5893). Half of the childrenwere male. The average age of the children was 17 months.About 46% of the mothers were between 25 and 34 years oldand about 41% had no formal education. One third of themothers were not working at the time of the survey. Most ofthe respondents were living in rural areas (70%). Table 2presents the descriptive statistics for the final pooled sample.
Prevalence of MOV
There was a wide variation in the MOV rates among chidren ofpoor and non-poor mothers across the 35 countries (Fig. 1). Therate of MOV among children of mothers from poor householdsranged from 22.5% in Swaziland to 87.1% in Gabon, while it
ranged from 18.4% in Sao Tome and Principe to 93.4% in Gabonamong children of mothers from non-poor households.
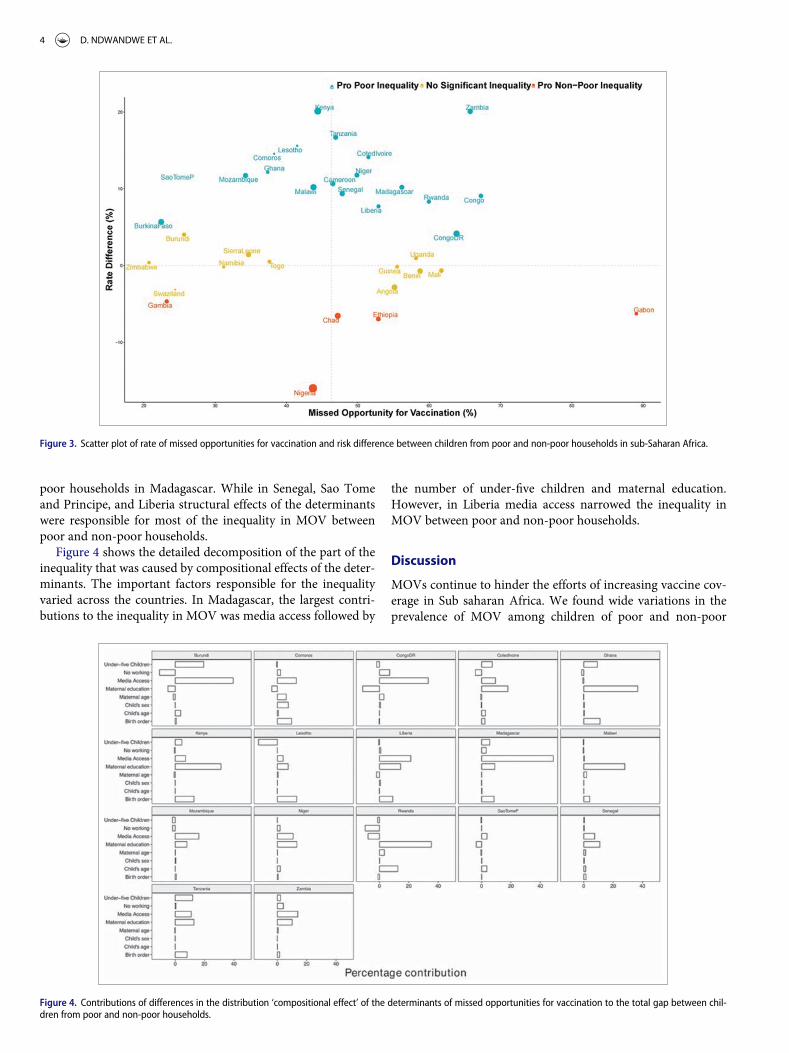
Magnitude and variations in education inequality in MOV
Figure 2 shows the risk difference (measure of inequality)between children of mothers from poor and non-poor house-holds. Out of the 35 countries included in this analysis, 19countries showed pro-poor inequality (i.e. MOV is prevalentamong the children of mothers from poor households), fiveshowed pro-non-poor inequality (i.e. MOV is prevalent amongchildren of mothers from non-poor households), and remain-ing 11 countries showed no statistically significant inequality.Among the countries with statistically significant pro-poorinequality, the risk difference ranged from 4.2% in the Demo-cratic Republic of Congo to 20.1% in Kenya. The risk differenceranged from -16.0% in Nigeria to -4.7% in the Gambia.
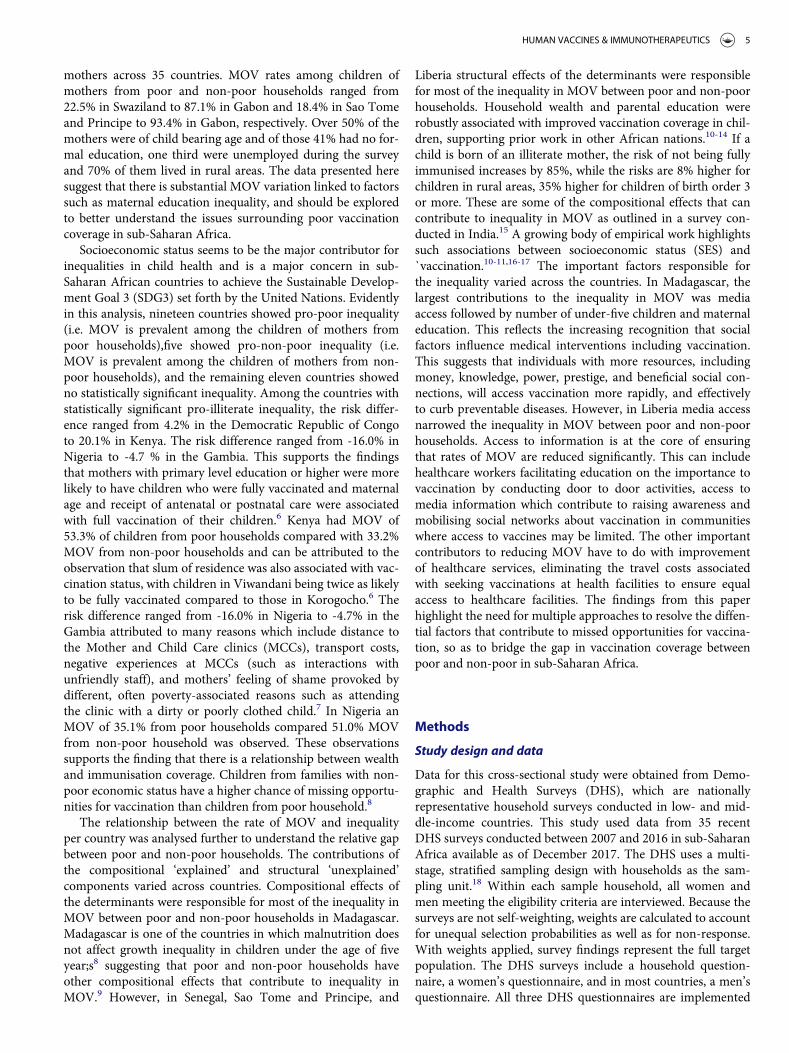
Figure 3 plots the relationship between rate of MOV andinequality for all countries. The countries can be grouped intodistinct categories:
� high MOV and high pro-poor inequality such as Zambia� high MOV and high pro-non-poor inequality such as
Gabon� low MOV and high pro-poor inequality such as Malawi� low MOV and non-significant pro-non-poor inequality
such as the Gambia
Decomposition of education inequality in MOV
The decomposition results are shown in eFig. 1 and Fig. 4. Anegative contribution indicates that the determinant was nar-rowing the relative gap between poor and non-poor house-holds. The contributions of the compositional ‘explained’ andstructural ‘unexplained’ components varied across the coun-tries. Compositional effects of the determinants were responsi-ble for most of the inequality in MOV between poor and non-
Table 1. Description of Demographic and Health Surveys data by countries, in sub-Saharan Africa, 2007 to 2016.
Country Survey yearNumber ofchildren MOV (%) Poor (%)
Angola 2016 2740 55.1 52.7Benin 2012 2540 58.7 43.5Burkina Faso 2010 2861 22.4 40.2Burundi 2011 1540 25.6 40.5Cameroon 2011 2282 46.5 43.6Chad 2015 2954 47.2 40.7Comoros 2012 585 38.3 44.6Congo 2012 1842 67.3 71.9Congo DR 2014 3435 63.8 48.4Coted Ivoire 2012 1447 51.5 48.7Ethiopia 2016 1940 52.9 50.6Gabon 2012 1159 89 69.8Gambia 2013 1611 23.2 51.8Ghana 2014 1113 37.4 55.2Guinea 2012 1335 55.5 43.5Kenya 2014 3952 44.4 55.7Lesotho 2014 682 41.5 46.5Liberia 2013 1431 52.9 60.4Madagascar 2009 2152 56.2 49.7Malawi 2016 3269 43.8 45.9Mali 2013 1847 61.7 38.8Mozambique 2011 2282 34.3 37.4Namibia 2013 968 31.2 41.5Niger 2012 2158 49.9 33.3Nigeria 2013 5893 43.7 45.8Rwanda 2015 1531 60 44.6Sao Tome Principe 2009 370 23.8 48.6Senegal 2011 2353 47.8 55.3Sierra Leone 2013 2208 34.7 43.4Swaziland 2007 553 24.4 40.1Tanzania 2016 2113 46.9 41.2Togo 2014 1409 37.6 47.8Uganda 2011 1381 58.1 47.3Zambia 2014 2563 65.7 49.5Zimbabwe 2015 1158 20.7 40.0
Table 2. Summary of pooled sample characteristics of the Demographic andHealth Surveys data in sub-Saharan Africa.
Number (%)
69657Child’s age (mean (sd)) 17.13 (3.42)Male (%) 35249 (50.6)High birth order (%) 21723 (31.2)Under-five children (mean (sd)) 2.02 (1.32)Maternal age (%)
15–24 23931 (34.4)25–34 31828 (45.7)35–49 13898 (20.0)
Wealth index(%)Poor 32912 (47.2)Non-poor 36745 (52.3)
Maternal education (%)no education 28310 (40.6)primary 24139 (34.7)secondaryC 17199 (24.7)
Not working (%) 22032 (31.6)Media access (%)
0 23736 (34.1)1 22378 (32.1)2 16921 (24.3)3 6622 ( 9.5)
Rural (%) 48467 (69.6)
2 D. NDWANDWE ET AL.
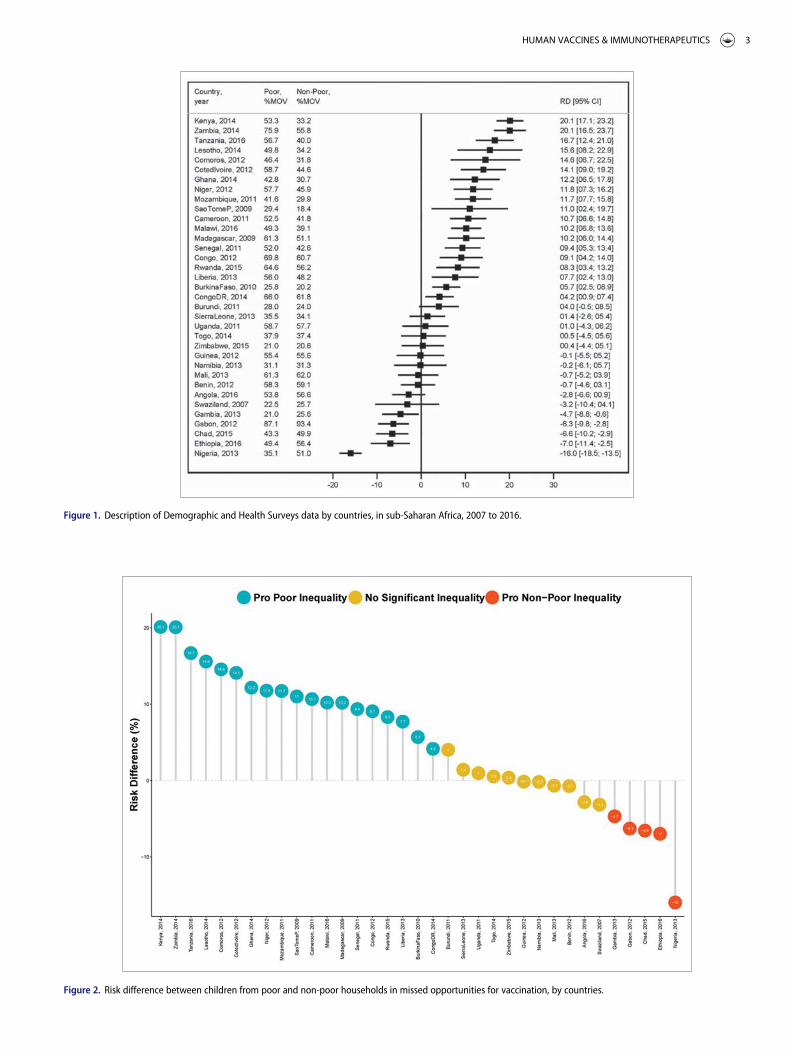
Figure 1. Description of Demographic and Health Surveys data by countries, in sub-Saharan Africa, 2007 to 2016.
Figure 2. Risk difference between children from poor and non-poor households in missed opportunities for vaccination, by countries.
HUMAN VACCINES & IMMUNOTHERAPEUTICS 3
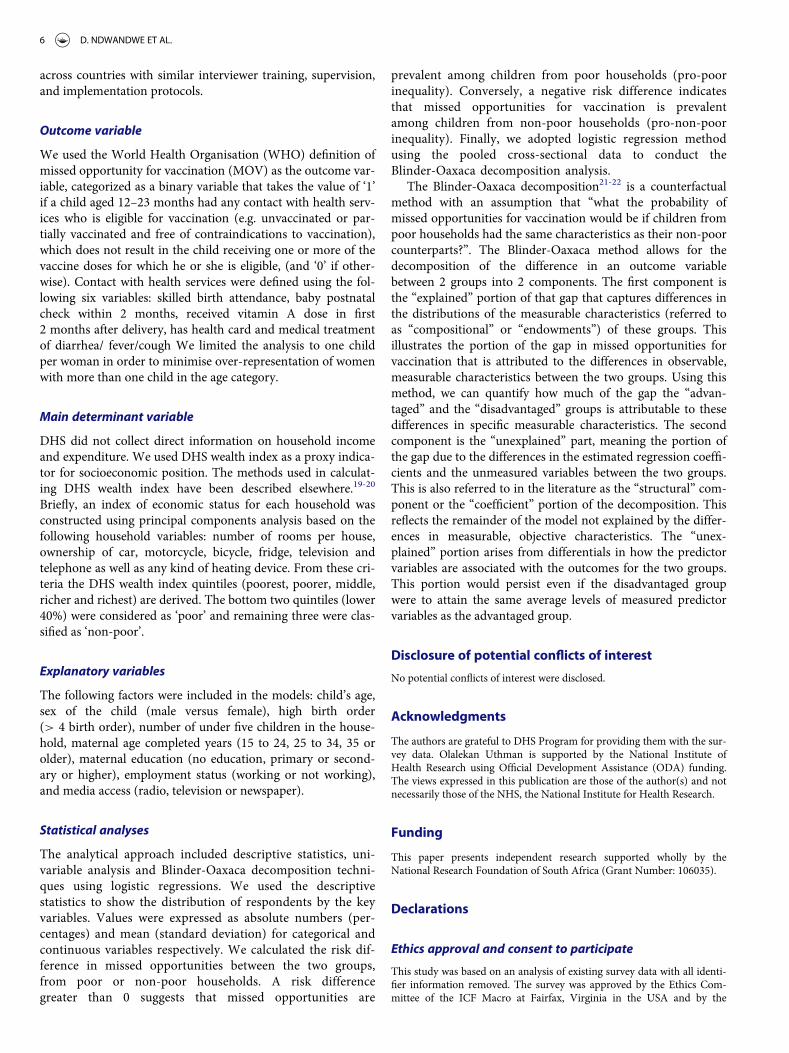
poor households in Madagascar. While in Senegal, Sao Tomeand Principe, and Liberia structural effects of the determinantswere responsible for most of the inequality in MOV betweenpoor and non-poor households.
Figure 4 shows the detailed decomposition of the part of theinequality that was caused by compositional effects of the deter-minants. The important factors responsible for the inequalityvaried across the countries. In Madagascar, the largest contri-butions to the inequality in MOV was media access followed by
the number of under-five children and maternal education.However, in Liberia media access narrowed the inequality inMOV between poor and non-poor households.
Discussion
MOVs continue to hinder the efforts of increasing vaccine cov-erage in Sub saharan Africa. We found wide variations in theprevalence of MOV among children of poor and non-poor
Figure 3. Scatter plot of rate of missed opportunities for vaccination and risk difference between children from poor and non-poor households in sub-Saharan Africa.
Figure 4. Contributions of differences in the distribution ‘compositional effect’ of the determinants of missed opportunities for vaccination to the total gap between chil-dren from poor and non-poor households.
4 D. NDWANDWE ET AL.
mothers across 35 countries. MOV rates among children ofmothers from poor and non-poor households ranged from22.5% in Swaziland to 87.1% in Gabon and 18.4% in Sao Tomeand Principe to 93.4% in Gabon, respectively. Over 50% of themothers were of child bearing age and of those 41% had no for-mal education, one third were unemployed during the surveyand 70% of them lived in rural areas. The data presented heresuggest that there is substantial MOV variation linked to factorssuch as maternal education inequality, and should be exploredto better understand the issues surrounding poor vaccinationcoverage in sub-Saharan Africa.
Socioeconomic status seems to be the major contributor forinequalities in child health and is a major concern in sub-Saharan African countries to achieve the Sustainable Develop-ment Goal 3 (SDG3) set forth by the United Nations. Evidentlyin this analysis, nineteen countries showed pro-poor inequality(i.e. MOV is prevalent among the children of mothers frompoor households),five showed pro-non-poor inequality (i.e.MOV is prevalent among the children of mothers from non-poor households), and the remaining eleven countries showedno statistically significant inequality. Among the countries withstatistically significant pro-illiterate inequality, the risk differ-ence ranged from 4.2% in the Democratic Republic of Congoto 20.1% in Kenya. The risk difference ranged from -16.0% inNigeria to -4.7 % in the Gambia. This supports the findingsthat mothers with primary level education or higher were morelikely to have children who were fully vaccinated and maternalage and receipt of antenatal or postnatal care were associatedwith full vaccination of their children.6 Kenya had MOV of53.3% of children from poor households compared with 33.2%MOV from non-poor households and can be attributed to theobservation that slum of residence was also associated with vac-cination status, with children in Viwandani being twice as likelyto be fully vaccinated compared to those in Korogocho.6 Therisk difference ranged from -16.0% in Nigeria to -4.7% in theGambia attributed to many reasons which include distance tothe Mother and Child Care clinics (MCCs), transport costs,negative experiences at MCCs (such as interactions withunfriendly staff), and mothers’ feeling of shame provoked bydifferent, often poverty-associated reasons such as attendingthe clinic with a dirty or poorly clothed child.7 In Nigeria anMOV of 35.1% from poor households compared 51.0% MOVfrom non-poor household was observed. These observationssupports the finding that there is a relationship between wealthand immunisation coverage. Children from families with non-poor economic status have a higher chance of missing opportu-nities for vaccination than children from poor household.8
The relationship between the rate of MOV and inequalityper country was analysed further to understand the relative gapbetween poor and non-poor households. The contributions ofthe compositional ‘explained’ and structural ‘unexplained’components varied across countries. Compositional effects ofthe determinants were responsible for most of the inequality inMOV between poor and non-poor households in Madagascar.Madagascar is one of the countries in which malnutrition doesnot affect growth inequality in children under the age of fiveyear;s8 suggesting that poor and non-poor households haveother compositional effects that contribute to inequality inMOV.9 However, in Senegal, Sao Tome and Principe, and
Liberia structural effects of the determinants were responsiblefor most of the inequality in MOV between poor and non-poorhouseholds. Household wealth and parental education wererobustly associated with improved vaccination coverage in chil-dren, supporting prior work in other African nations.10-14 If achild is born of an illiterate mother, the risk of not being fullyimmunised increases by 85%, while the risks are 8% higher forchildren in rural areas, 35% higher for children of birth order 3or more. These are some of the compositional effects that cancontribute to inequality in MOV as outlined in a survey con-ducted in India.15 A growing body of empirical work highlightssuch associations between socioeconomic status (SES) and`vaccination.10-11,16-17 The important factors responsible forthe inequality varied across the countries. In Madagascar, thelargest contributions to the inequality in MOV was mediaaccess followed by number of under-five children and maternaleducation. This reflects the increasing recognition that socialfactors influence medical interventions including vaccination.This suggests that individuals with more resources, includingmoney, knowledge, power, prestige, and beneficial social con-nections, will access vaccination more rapidly, and effectivelyto curb preventable diseases. However, in Liberia media accessnarrowed the inequality in MOV between poor and non-poorhouseholds. Access to information is at the core of ensuringthat rates of MOV are reduced significantly. This can includehealthcare workers facilitating education on the importance tovaccination by conducting door to door activities, access tomedia information which contribute to raising awareness andmobilising social networks about vaccination in communitieswhere access to vaccines may be limited. The other importantcontributors to reducing MOV have to do with improvementof healthcare services, eliminating the travel costs associatedwith seeking vaccinations at health facilities to ensure equalaccess to healthcare facilities. The findings from this paperhighlight the need for multiple approaches to resolve the diffen-tial factors that contribute to missed opportunities for vaccina-tion, so as to bridge the gap in vaccination coverage betweenpoor and non-poor in sub-Saharan Africa.
Methods
Study design and data
Data for this cross-sectional study were obtained from Demo-graphic and Health Surveys (DHS), which are nationallyrepresentative household surveys conducted in low- and mid-dle-income countries. This study used data from 35 recentDHS surveys conducted between 2007 and 2016 in sub-SaharanAfrica available as of December 2017. The DHS uses a multi-stage, stratified sampling design with households as the sam-pling unit.18 Within each sample household, all women andmen meeting the eligibility criteria are interviewed. Because thesurveys are not self-weighting, weights are calculated to accountfor unequal selection probabilities as well as for non-response.With weights applied, survey findings represent the full targetpopulation. The DHS surveys include a household question-naire, a women’s questionnaire, and in most countries, a men’squestionnaire. All three DHS questionnaires are implemented
HUMAN VACCINES & IMMUNOTHERAPEUTICS 5
across countries with similar interviewer training, supervision,and implementation protocols.
Outcome variable
We used the World Health Organisation (WHO) definition ofmissed opportunity for vaccination (MOV) as the outcome var-iable, categorized as a binary variable that takes the value of ‘1’if a child aged 12–23 months had any contact with health serv-ices who is eligible for vaccination (e.g. unvaccinated or par-tially vaccinated and free of contraindications to vaccination),which does not result in the child receiving one or more of thevaccine doses for which he or she is eligible, (and ‘0’ if other-wise). Contact with health services were defined using the fol-lowing six variables: skilled birth attendance, baby postnatalcheck within 2 months, received vitamin A dose in first2 months after delivery, has health card and medical treatmentof diarrhea/ fever/cough We limited the analysis to one childper woman in order to minimise over-representation of womenwith more than one child in the age category.
Main determinant variable
DHS did not collect direct information on household incomeand expenditure. We used DHS wealth index as a proxy indica-tor for socioeconomic position. The methods used in calculat-ing DHS wealth index have been described elsewhere.19-20
Briefly, an index of economic status for each household wasconstructed using principal components analysis based on thefollowing household variables: number of rooms per house,ownership of car, motorcycle, bicycle, fridge, television andtelephone as well as any kind of heating device. From these cri-teria the DHS wealth index quintiles (poorest, poorer, middle,richer and richest) are derived. The bottom two quintiles (lower40%) were considered as ‘poor’ and remaining three were clas-sified as ‘non-poor’.
Explanatory variables
The following factors were included in the models: child’s age,sex of the child (male versus female), high birth order(> 4 birth order), number of under five children in the house-hold, maternal age completed years (15 to 24, 25 to 34, 35 orolder), maternal education (no education, primary or second-ary or higher), employment status (working or not working),and media access (radio, television or newspaper).
Statistical analyses
The analytical approach included descriptive statistics, uni-variable analysis and Blinder-Oaxaca decomposition techni-ques using logistic regressions. We used the descriptivestatistics to show the distribution of respondents by the keyvariables. Values were expressed as absolute numbers (per-centages) and mean (standard deviation) for categorical andcontinuous variables respectively. We calculated the risk dif-ference in missed opportunities between the two groups,from poor or non-poor households. A risk differencegreater than 0 suggests that missed opportunities are
prevalent among children from poor households (pro-poorinequality). Conversely, a negative risk difference indicatesthat missed opportunities for vaccination is prevalentamong children from non-poor households (pro-non-poorinequality). Finally, we adopted logistic regression methodusing the pooled cross-sectional data to conduct theBlinder-Oaxaca decomposition analysis.
The Blinder-Oaxaca decomposition21-22 is a counterfactualmethod with an assumption that “what the probability ofmissed opportunities for vaccination would be if children frompoor households had the same characteristics as their non-poorcounterparts?”. The Blinder-Oaxaca method allows for thedecomposition of the difference in an outcome variablebetween 2 groups into 2 components. The first component isthe “explained” portion of that gap that captures differences inthe distributions of the measurable characteristics (referred toas “compositional” or “endowments”) of these groups. Thisillustrates the portion of the gap in missed opportunities forvaccination that is attributed to the differences in observable,measurable characteristics between the two groups. Using thismethod, we can quantify how much of the gap the “advan-taged” and the “disadvantaged” groups is attributable to thesedifferences in specific measurable characteristics. The secondcomponent is the “unexplained” part, meaning the portion ofthe gap due to the differences in the estimated regression coeffi-cients and the unmeasured variables between the two groups.This is also referred to in the literature as the “structural” com-ponent or the “coefficient” portion of the decomposition. Thisreflects the remainder of the model not explained by the differ-ences in measurable, objective characteristics. The “unex-plained” portion arises from differentials in how the predictorvariables are associated with the outcomes for the two groups.This portion would persist even if the disadvantaged groupwere to attain the same average levels of measured predictorvariables as the advantaged group.
Disclosure of potential conflicts of interest
No potential conflicts of interest were disclosed.
Acknowledgments
The authors are grateful to DHS Program for providing them with the sur-vey data. Olalekan Uthman is supported by the National Institute ofHealth Research using Official Development Assistance (ODA) funding.The views expressed in this publication are those of the author(s) and notnecessarily those of the NHS, the National Institute for Health Research.
Funding
This paper presents independent research supported wholly by theNational Research Foundation of South Africa (Grant Number: 106035).
Declarations
Ethics approval and consent to participate
This study was based on an analysis of existing survey data with all identi-fier information removed. The survey was approved by the Ethics Com-mittee of the ICF Macro at Fairfax, Virginia in the USA and by the
6 D. NDWANDWE ET AL.
National Ethics Committees in their respective countries. All study partici-pants gave informed consent before participation and all information wascollected confidentially.
Consent for publication
Not applicable.
Authors’ contribution
OAU and CSY conceived the study. OAU and CSY obtained funding forthe study. OAU collected and analysed initial data. AA, ABW, CSY, DN,EZS, ABW and OAU participated contributed in refining the data analysis.OAU and DN wrote the first manuscript. AA, ABW, CSY, DN, EZS, GB,JO, OAU, TO and SY contributed to further analysis, interpreting andshaping of the argument of the manuscript and participated in writing thefinal draft of the manuscript. All the authors read and approved the finalmanuscript.
ORCID
Duduzile Ndwandwe http://orcid.org/0000-0001-7129-3865Olalekan A. Uthman http://orcid.org/0000-0002-8567-3081Abdu A. Adamu http://orcid.org/0000-0003-3317-1319Tawa Olukade http://orcid.org/0000-0002-2103-5355Sanni Yaya http://orcid.org/0000-0002-4876-6043Charles S. Wiysonge http://orcid.org/0000-0002-1273-4779
References
1. World Health Organization Immunization coverage. http://www.who.int/mediacentre/factsheets/fs378/en/.
2. Magadzire BP, Joao G, Shendale S, Ogbuanu IU. Reducing missedopportunities for vaccination in selected provinces of Mozambique: Astudy protocol. Gates Open Res. 2017;1:5. doi:10.12688/gatesopenres.12761.1. PMID:29528041.
3. Hutchins SS, Jansen HA, Robertson SE, Evans P, Kim-Farley RJ. Stud-ies of missed opportunities for immunization in developing andindustrialized countries. Bull World Health Organ. 1993;71(5):549–60. PMID:8261558.
4. Sridhar S, Maleq N, Guillermet E, Colombini A, Gessner BD. A sys-tematic literature review of missed opportunities for immunization inlow- and middle-income countries. Vaccine 2014;32(51):6870–9.doi:10.1016/j.vaccine.2014.10.063. PMID:25444813.
5. Kruk ME, Prescott MR, de Pinho H, Galea S. Equity and the childhealth Millennium Development Goal: the role of pro-poor healthpolicies. J Epidemiol Community Health. 2011;65(4):327–33.doi:10.1136/jech.2009.096081. PMID:20724284.
6. Mutua MK, Kimani-Murage E, Ettarh RR. Childhood vaccination ininformal urban settlements in Nairobi, Kenya: who gets vaccinated?BMC Public Health 2011;11(1):6. doi:10.1186/1471-2458-11-6.PMID:21205306.
7. Schwarz NG, Gysels M, Pell C, Gabor J, Schlie M, Issifou S, Lell B,Kremsner PG, Grobusch MP, Pool R. Reasons for non-adherence to
vaccination at mother and child care clinics (MCCs) in Lambarene,Gabon. Vaccine. 2009;27(39):5371–5. doi:10.1016/j.vaccine.2009.06.100.PMID:19616497.
8. Restrepo-Mendez MC, Barros AJ, Wong KL, Johnson HL, Pariyo G,Franca GV, Wehrmeister FC, Victora CG. Inequalities in full immu-nization coverage: trends in low- and middle-income countries. BullWorld Health Organ. 2016;94(11):794–805B. doi:10.2471/BLT.15.162172. PMID:27821882.
9. Van de Poel E, Hosseinpoor AR, Speybroeck N, Van Ourti T, Vega J.Socioeconomic inequality in malnutrition in developing countries.Bull World Health Organ. 2008;86(4):282–91. doi:10.2471/BLT.07.044800. PMID:18438517.
10. Ndirangu J, Barnighausen T, Tanser F, Tint K, Newell ML. Levels ofchildhood vaccination coverage and the impact of maternal HIV sta-tus on child vaccination status in rural KwaZulu-Natal, South Africa�.Trop Med Int Health. 2009;14(11):1383–93. doi:10.1111/j.1365-3156.2009.02382.x. PMID:19737375.
11. Wado YD, Afework MF, Hindin MJ. Childhood vaccination inrural southwestern Ethiopia: the nexus with demographic factorsand women’s autonomy. Pan Afr Med J. 2014;17 Suppl 1:9.PMID:24624243.
12. Nankabirwa V, Tylleskar T, Tumwine JK, Sommerfelt H, Promise-ebfStudy G. Maternal education is associated with vaccination status ofinfants less than 6 months in Eastern Uganda: a cohort study. BMCPediatr. 2010;10:92. doi:10.1186/1471-2431-10-92. PMID:21159193.
13. Mekonnen Y, Tensou B, Telake DS, Degefie T, Bekele A.Neonatal mortality in Ethiopia: trends and determinants. BMCPublic Health. 2013;13:483. doi:10.1186/1471-2458-13-483.PMID:23683315.
14. Bawah AA, Phillips JF, Adjuik M, Vaughan-Smith M, MacleodB, Binka FN. The impact of immunization on the associationbetween poverty and child survival: evidence from Kassena-Nankana District of northern Ghana. Scand J Public Health2010;38(1):95–103. doi:10.1177/1403494809352532. PMID:19884162.
15. Lauridsen J, Pradhan J. Socio-economic inequality of immunizationcoverage in India. Health Econ Rev. 2011;1(1):11. doi:10.1186/2191-1991-1-11. PMID:22828353.
16. Polonijo AN, Carpiano RM. Social inequalities in adolescent humanpapillomavirus (HPV) vaccination: a test of fundamental cause theory.Soc Sci Med. 2013;82:115–25. doi:10.1016/j.socscimed.2012.12.020.PMID:23337830.
17. Hatzenbuehler ML, Phelan JC, Link BG. Stigma as a fundamental causeof population health inequalities. Am J Public Health. 2013;103(5):813–21. doi:10.2105/AJPH.2012.301069. PMID:23488505.
18. Rutstein SO, Rojas G. Guide to DHS Statistics: Demographic and HealthSurveys Methodology. Calverton, Maryland: ORC Macro; 2006.
19. Montgomery MR, Gragnolati M, Burke KA, Paredes E. Measuring liv-ing standards with proxy variables. Demography. 2000;37(2):155–74.doi:10.2307/2648118. PMID:10836174.
20. Vyas S, Kumaranayake L. Constructing socio-economic status indices:how to use principal components analysis. Health Policy Plan.2006;21(6):459–68. doi:10.1093/heapol/czl029. PMID:17030551.
21. Blinder AS. Wage Discrimination: Reduced Form and Structural Vari-ables. J Human Res. 1973;8(4):436–455. doi:10.2307/144855
22. Oaxaca R. Male-Female Wage Differentials in Urban Labor Markets.Int Econ Rev. 1973;14:693–709. doi:10.2307/2525981.
HUMAN VACCINES & IMMUNOTHERAPEUTICS 7
Related Documents