Lucas Lockhart University of Minnesota-Department of Political Science, PhD Candidate Loving the Rules but Hating the Rule Maker: Exploring the Divergence between Expert and Industry Assessments of Regulatory Quality 1 Abstract: Disagreement remains regarding the best way to evaluate the quality of regulatory institutions. This task is made especially difficult when the assessments of legal experts diverge from the assessments of industry actors. Using survey data from annual World Economic Forum executive surveys and the World Bank's Doing Business Project, this paper explores the sources of this divergence with regard to a key determinate of capital market development: minority shareholder protection (MSP). The political independence of regulatory organizations emerges as a key factor in explaining the divergence between expert and executive opinion. Senior managers downgrade their evaluations of MPS strength as regulatory agencies gain greater insulation from political interference and this downgrading is more pronounced in countries were executives express greater confidence in MSP than do experts. More negative executive assessments likely result from independent regulators’ more consistent and impartial implementation of MSP. However, the importance of regulatory independence in shaping managerial opinion diminishes as stock markets become more developed suggesting that financial market discipline can be at least a partial substitute for public enforcement of MSP. Minority shareholder rights and protections (MSP) stand at the center of the financial politics literature. Regardless of 1 Paper presented at Western Political Science Association Annual Conference on Saturday, March 26 in San Diego, CA 1

Welcome message from author
This document is posted to help you gain knowledge. Please leave a comment to let me know what you think about it! Share it to your friends and learn new things together.
Transcript

Lucas Lockhart University of Minnesota-Department of Political Science, PhD Candidate
Loving the Rules but Hating the Rule Maker: Exploring the Divergence between Expert and Industry Assessments of Regulatory Quality1
Abstract: Disagreement remains regarding the best way to evaluate the quality of regulatory institutions. This task is made especially difficult when the assessments of legal experts diverge from the assessments of industry actors. Using survey data from annual World Economic Forum executive surveys and the World Bank's Doing Business Project, this paper explores the sources of this divergence with regard to a key determinate of capital market development: minority shareholder protection (MSP). The political independence of regulatory organizations emerges as a key factor in explaining the divergence between expert and executive opinion. Senior managers downgrade their evaluations of MPS strength as regulatory agencies gain greater insulation from political interference and this downgrading is more pronounced in countries were executives express greater confidence in MSP than do experts. More negative executive assessments likely result from independent regulators’ more consistent and impartial implementation of MSP. However, the importance of regulatory independence in shaping managerial opinion diminishes as stock markets become more developed suggesting that financial market discipline can be at least a partial substitute for public enforcement of MSP.
Minority shareholder rights and protections (MSP) stand at the center of the financial
politics literature. Regardless of discipline or methodological approach, scholars agree that the
effectiveness of investor protections is a key determinate of stock market development both
overtime and across countries. Where minority shareholders (i.e. non-controlling) and retail
investors (i.e. small) are confident that they will be protected from the greed, incompetence, and
malfeasance of corporate managers and controlling shareholders, stock markets will be larger
and more liquid. Both academics and practitioners have developed numerous formal measures
and indices of MSP. Well known examples include La Porta et. al (1997,1998, 1999), Djankov
et. al (2005), and Gourevitch and Shinn (2005). Nearly all include information about
1 Paper presented at Western Political Science Association Annual Conference on Saturday, March 26 in San Diego, CA
1

transparency issues such as accounting, auditing, and the disclosure of related party transactions;
rules that shape the acquisition and loss of corporate control such as shareholder voting rights
and antitakeover devices; and legal standards regarding director and executive liability. While
invaluable, most measures are constructed by actors who are nominally neutral experts (legal
academics) or are predisposed to favor greater over lesser MSP (institutional investors).2
However, there is a notable exception to this trend: the World Economic Forum’s (WEF) Annual
Executive Survey. As part of their Global Competitiveness Reports, the WEF asks senior
executives to rate on a scale of one to seven the degree to which the interests of minority
shareholders are protected in their country. This approach is distinct in that it asks the potential
losers of MSP to rate the strength of investor rights rather than academic experts or those who
stand to benefit. Unsurprisingly, there are noticeable differences between executive and expert
assessments. The goal of this paper is to explore these differences.
I argue that the key to understanding the differences between executives’ and experts’
views of MSP lies is the political independence of those who do the actual protecting (i.e.
regulatory organizations). I assume that MSP is largely a valence issue among business elites.
Even though stronger MSP can create costs for senior managers and blockholders, they may also
create benefits in the form of a greater supply of equity capital. Therefore, they will often join
minority shareholders and express a general support for investor protection. However, much of
this executive support may be dependent upon MSPs remaining abstract rather than realized.
Stated differently, corporate elites’ support of investor protections will be strongest when
investor protections are implemented in ways that do not directly interfere with their financial
interests or freedom of decision making. I argue that this will most often be the case when
2 For example, one of the most widely cited MSP measures features an “Anti-Director” index (La Porta et. al (1997,1998).
2

financial regulators enjoy less rather than more political independence. Since corporate insiders
enjoy considerable advantages in political mobilization vis-à-vis minority shareholders,
politicized regulators will be more likely to implement MSPs in ways that go largely unopposed
by corporate insiders. In contrast, political independence gives regulatory actors wider latitude to
consistently and impartially enforce MSPs in ways that are sure to grab the attention (both
negative and positive) of business elites. As senior managers and blockholders become more
aware of minority investor protections and the ways in which particular rules impinge upon their
interests, their evaluations of MSP will become less abstract and less likely to be overly
optimistic relative to expert evaluations.
Results indicate that regulatory independence is associated with lower average executive
assessments of MSP and this association is not equally strong in all countries. Findings suggest it
is primarily associated with countries where executives express overconfidence in investor
protection relative to the experts and in countries where stock markets are not highly developed
in terms of size or liquidity. When stock markets are highly developed or where executive
assessments of MSP are more pessimistic than the experts, regulatory independence has small to
negligible effects. These results hold across a variety of estimators and survive the inclusion of a
numerous alternative political economic controls.
The remainder of this paper will proceed as follows. First, I will briefly review the
literature on financial development with a special focus upon the preferences of corporate
insiders and minority shareholders. Then I will outline how regulatory independence may change
MSP implementation in ways that lead to lower executive ratings of MSP that are also closer to
the experts. After presenting my hypotheses, I will describe my variables including my original
measure of regulatory independence. I will outline my methodological approach, present my
3
findings, and describe their overall robustness. The final discussion and conclusion will
summarize my findings and their implications for future research.
Conflicting Interests and Biased Mobilization
Previous theoretical approaches almost universally identify larger and more liquid stock
markets with the interests of minority shareholders (La Porta et. al 1997,1998, 1999; Roe 2003;
Gourevitch and Shinn 2005; Pagano and Volpin 2005). They are characterized by their
diversified rather than concentrated holdings in companies, their lack of control over
management, and their willingness to rapidly alter their investment portfolios in hopes of
capturing the largest financial returns. While diversification requires large stock markets with a
plethora of listed companies, actually realizing and protecting capital gains over time depends
upon a sufficient level of MSPs. If minority shareholders lack protection from the fraud,
mismanagement, insider dealing, and market manipulations of senior managers and controlling
shareholders, potential investors will sell their shares in offending companies or shun stock
markets altogether.
Minority shareholders have another quality: a lack of power both within the firm and in
the political arena. Their large numbers and small and diverse financial holdings create
significant collective action problems with regards to monitoring and sanctioning poorly
performing board directors and senior managers. Coordination costs are significant; the potential
benefits of monitoring are small; and freeriding on the efforts of other shareholders is always a
temptation. There are ways to alter corporate governance regulations and financial law so that
the costs of monitoring and sanctioning management is less prohibitive, but similar collective
action problems emerge within the political and regulatory arena as well. Furthermore, most
retail investors lack the legal sophistication and lobbying resources to become full participants in
4

politically charged yet highly technical debates over corporate governance. When they do, it is
most likely in the aftermath of crisis or scandal and involves angry calls for politicians or
regulators to “do something.” This outrage at corporate elites is rarely sustained and collective
action problems reassert themselves as the economy recovers or the memory of scandal fades
(McDonnell 2013). At least in normal times, politicians’ regulatory agenda will rarely be driven
by the concerns of everyday retail investors.
Unlike these small investors, institutional investors and investment intermediaries have
the wealth and the incentives to be consistently influential actors in private interactions with
corporate executives and in regulatory debates. Their sophistication, smaller number, and larger
but still minority shareholdings all boost their capacity and propensity to mobilize around issues
of MSP. However, the interests of institutional investors and investment intermediaries are
highly diverse and this diversity often prevents them from speaking with one unified voice over
many regulatory issues.3 Competitive pressures may also push them to look out primarily for
their own particularistic interests rather than the broader long-term interests of the investing
public. The managers of investment funds often depend upon the good will of corporate insiders
in order to grow their assets under management and in turn their fees. As a result, they may
lobby on behalf of certain investor protections, but not those that could erode their earnings,
alienate potential customers among the corporate elite, or place them under greater shareholder
scrutiny. In short, retail investors have potential elite allies in their struggle to influence
politicians, but these allies share only some of their interests.
3 The diversity of institutional shareholders includes banks, insurance companies, private equity, hedge, mutual, and pension funds. They vary considerably in terms of the concentration of their ownership stakes in individual companies, their investment time-horizons, and their greater or lesser willingness to confront rather than cooperate with executive managers over social issues and business decisions. It must be reiterated, the managers of institutional investment firms are themselves corporate insiders.
5
In contrast to minority shareholders, corporate executives and block shareholders often
benefit from weaker or partially implemented MSPs. The former are primarily management
professionals who view themselves as highly paid executive employees. While they often own
stock in the companies they manage as part of their compensation package, this creates
incentives to increase the stock price of their individual firm rather than boost the integrity of the
market as a whole. Blockholders are investors, but differ from minority shareholders due to their
concentrated and often controlling stake in individual companies.4 Despite being small in
number, both executives and blockholders wield outsized political influence due to their wealth,
expertise, social connections, and large political contributions (Windolf 2002; Culpepper 2011:
Burris & Staples 2012). In contrast to the division and collective inaction of pro-MSP
constituencies, managers and blockholders share an essential value around which they
consistently mobilize: their managerial autonomy within the firm. Concentrated owners and
executives are hostile to any attempt by minority shareholders or the state to interfere with their
decision making authority. This may not make them opposed to stock market development per se
and they generally support basic investor protections. However, they remain deeply skeptical of
any minority shareholder right or accounting practice that could even potentially erode the
private benefits (both fraudulent and legal) they derive from their position atop the business
hierarchy (Dyck and Zingales 2004). When managers and/or blockholders enjoy the rents
associated with less than competitive industries, their opposition to MSPs may intensify since
equity markets serve as important sources of financing for market entrants (Morck et. al 2003;
Pinto et. al. 2010). To the degree that they also facilitate hostile takeovers and active markets for
4 In some countries, blockholders can also be the state. As the large literature of SOEs makes clear, minority shareholders are particularly vulnerable to state blockholders due to their privileged access to other government officials (Cheung et. al. 2005; Berkman et. al 2010, 2014).In addition to fraud and wealth expropriation, minority shareholders in partially state owned companies face the risk that business decisions will be made with the goal of maximizing political payoffs rather than shareholder value.
6

corporate control, stock markets can directly threaten what is most important to many senior
managers: their lucrative executive employment. If forced to choose between the full and
consistent implementation of MSP on the one hand, and their own autonomy and economic
privilege on the other, managers and blockholders in many countries choose the latter.5
In summation, corporate insiders and the financial industry enjoy formidable
lobbying advantages over minority shareholders and retail investors. As a result, politicians face
asymmetrical pressure to lessen rather than strengthen MSP and to prefer inaction to action in the
face of financial innovation. Politicians may make public commitments to protect investors and
strengthen market integrity in the aftermath of crisis or scandal, but these commitments may fade
as regulatory issues lose their political salience, corporate insiders reassert their lobbying and
political contribution advantages, or anti-MSP parties assume political office. If this pessimistic
account is viewed only in isolation, there would be little reason to believe that MSP would ever
be diligently enforced. However, these interest group struggles do not occur in an institutional
vacuum: political and regulatory institutions may go some way toward mitigating these
inequalities.
Political and Regulatory Institutions
One of the most prominent institutions cited in the financial literature is legal family. La
Porta et al.(1998) argue that in comparison to civil law systems, common law’s less formalized
and more adaptable nature make securities contracts more enforceable, investor rights more
5 It is important not to completely discount the divisions between managers and controlling owners because the control that controlling owners exercise is largely over management. Managements’ ideal situation would be one in which there are enough MSPs to weaken blockholders influence over their autonomy, but not so much MSPs that blockholders dilute their ownership stake for the benefits of diversification. This could expose management to the threat of hostile takeover and the costly nuisance of minority shareholder activism.
7

secure, and private remedies more potent. While acknowledging the importance of common law,
Keefer (2008) forcefully argues in favor of the primacy of both formal and informal political
institutions in explaining financial development. Other scholars have followed suit. Checks and
balances, competitive elections, press freedom, legislative veto players, degrees of economic
coordination, and the proportionality of electoral institutions are all highlighted as factors that
may increase politicians responsiveness to minority shareholders and retail investors (Pagano
and Volpin 2005; Gourevitch and Shinn 2007; Keefer 2007). Many of these are undoubtedly
important, but this literature begins with political institutions and ends with regulations that
protect various financial interests to greater or lesser degrees. Unfortunately, many of these
approaches bypass a key actor that in many countries plays an indispensable role in protecting
minority shareholders even after politicians have lost interest in doing so: regulatory
organizations.
The Sobering Influence of Regulatory Independence
Given the asymmetries in mobilizations outlined above and the short-termism created by
electoral cycles, politicians may find it difficult to make the sorts of technically sound corporate
governance policies that could ensure MSP and market integrity over the long run. This tension
between short-term political expediency and long-term policy consistency is similar to the
tensions that emerge with regard to central bank autonomy, monetary policy stability, and the
governance of public utilities (Kydland and Prescott 1977; Rogoff 1985; Spiller and Tommasi
2005). While ordinary political institutions may go some way toward relieving these tensions,
politicians’ commitments to MSP may still lack credibility. In light of this credibility problem
and what has become international best practice, politicians increasingly delegate at least some
power over financial regulation to nominally apolitical regulatory organizations that they can
8

only partially control (Majone1996b; Levy-Spiller 1997; Bendor et. al 2001). This trend can be
found across countries and economic sectors and its implications have been extensively
discussed under the conceptual framework of the regulatory state (Majone 1994; Moran 2010)
and more broadly regulatory capitalism (Levi-Faur 2005; Braithwaite 2008;). The broad
expectation of this research is that policy becomes more consistent, stable, and impartial when it
made and implemented by unelected experts rather than politicians. When these experts are
insulated from the day-to-day din of partisan politics, regulatory consistency and impartiality
should increase even further. Obviously, this does not make regulators immune from industry
pressure, but it at least makes them more immune to industry pressures as exercised through
politicians.
If regulators lack protection from political interference, they also lack protection from the
asymmetries in campaign contributions and lobbying pressures experienced by politicians. The
indirect nature of this form of capture does not make it any less insidious. It is politicians who
nominate and initiate the dismissal of regulatory officials, conduct oversight hearings, and decide
agency budgets. If their hostility is sufficiently strong and broadly shared, they may override,
reorganize, or eliminate regulators through legislative change. When politicians can easily
influence regulators, their rulemaking and enforcement may become consumed with preempting
industry criticism and forestalling political interference. Greater political independence should
reduce this strategic behavior and allow securities market agencies to more effectively
implement MSP in spite of industry interests’ capture of politicians. To the degree that this more
effective policy implementation brings executives and blockholders face to face with the realities
of investor protection, it may reduce their valence based approval of investor protection in the
abstract. Forced to confront the costs of more stringently enforced corporate governance
9

regulation, executives’ assessment of MSP may be less optimistic and more likely to fall in line
with the views of the legal experts.
This leads me to my first two hypotheses:
H1: As regulatory independence increases, average executive evaluations of the strength of
minority shareholder protection will decrease.
H2: As regulatory independence increases, the difference between expert and executive
evaluations should decrease.
However, direct regulatory intervention by public actors is not the only way that
executives can become more aware of the true nature of shareholder power. Large and liquid
stock markets can embolden shareholders by lowering the costs of exit from firm ownership (i.e.
selling) and by providing easy to understand and up-to-date information on corporate insiders
managerial performance. More developed stock markets also increase the credibility of hostile
takeover threats, diffuse pro-investor business norms, and encourage equity based executive
compensation schemes that can align the preferences of senior executives with those of short-
term investors. If stock market development does in fact produce these results, the role of
regulatory interventions in reducing differences between executive and expert opinion may be
reduced. Rather than regulators, financial markets themselves may educate business elites with
regards to the true level of shareholder power in their countries. This leads to my third
hypothesis:
H3: The effects of regulatory independence on the difference between expert and executive
assessments should be smaller in countries with more highly developed stock markets.
10

MSP Assessments
In order to test these hypotheses, I need accurate measures of both expert and executive
assessments of minority shareholder rights. For my expert measure, I draw upon the World Bank
Doing Business Project’s Strength of Minority Investor Protection Index. According to the Doing
Business project’s website, the index is constructed from a “questionnaire administered to
corporate and securities lawyers and are based on securities regulations, company laws, civil
procedure codes and court rules of evidence.” The index itself is actually a composite of several
others and is constructed in the following way:
The indicator measures the protection of minority investors from conflicts of interest through one set of indices (combined in the extent of conflict of interest regulation index) and shareholders’ rights in corporate governance through another (combined in the extent of shareholder governance index).The extent of conflict of interest regulation index focuses on one of the most serious breaches of good corporate governance around the world: the related-party transaction. The index measures the protection of shareholders against directors’ misuse of corporate assets for personal gain by distinguishing 3 dimensions of regulation that address conflicts of interest: transparency of related-party transactions (captured by the extent of disclosure index), shareholders’ ability to sue and hold directors liable for self-dealing (extent of director liability index) and access to evidence and allocation of legal expenses in shareholder litigation (ease of shareholder suits index).
The extent of shareholder governance index measures shareholders’ rights in corporate governance by distinguishing 3 dimensions of good governance: shareholders’ rights and role in major corporate decisions (captured by the extent of shareholder rights index), governance safeguards protecting shareholders from undue board control and entrenchment (extent of ownership and control index) and corporate transparency on ownership stakes, compensation, audits and financial prospects (extent of corporate transparency index). (Doing Business Project)
The resulting composite Strength of Investor Protection Index takes on values between 0
to 10 with 0 indicating the complete absence of investor protection and 10 indicating maximum
investor protection.
11

My measure of executive opinion is taken from The World Economic Forum’s
Executive Opinion Survey which began a systematic survey of corporate governance issues in
2005. Although there is variation year to year, the survey typically collects the opinions of well
over 12,000 senior managers with the average number of respondents per country being over 90.
A majority of survey respondents are randomly selected, but the World Economic Forum insists
that their country partners include some repeat respondents in order to aid in comparability
overtime. Once the data is cleaned of outliers and missing responses, individual answers are
aggregated at the country level and weighted by economic sector. Each yearly country average is
actually a weighted average of the most recent year’s survey results combined with a discounted
average of the previous year.6 This step is performed in order to make country averages less
sensitive to the specific point in time in which survey responses were collected and to increase
sample size. Given my dependence upon these WEF surveys, empirical analyses will utilize
annual data from 2005 to 2012 and include just over 100 countries.
The question formats are identical for all indicators and loosely resemble Likert
scales. They consist of a 1 to 7 scale with 1 corresponding to “you agree completely with the
answer on the left-hand side; 3 corresponding to “your opinion is indifferent between the two
answers;” and 7 corresponding to “you agree completely with the answer on the right-hand side.”
The most important indicator for my purposes is the “protection of minority shareholders’
interests” with 7 corresponding to the strongest protection (see Global Competitiveness Report
2013-2014 pgs 83-92 for more detail of survey methodology and score construction). Obviously
this is a far more crude measure than the index created by the Doing Business project, but this is 6 Care must be taken to match yearly control variables with the correct yearly average. For example, the dependent variables for 2012 are a combination of assessments collected in the first quarter of 2012 and the first quarter of 2013 with greater weight placed on 2013 assessments. These observations are then matched to controls from 2012. This approach had to be taken in order to ensure that independent variables in 2012 were not explaining variation 2011-2012 assessments. Instead, independent variables in 2012 explain variation in the combined weighted average of 2012 and 2013 assessments.
12

precisely the point. The latter expert measure is specifically designed to be objective assessment
of the legal environment. In contrast, the simplicity of the executive survey question leaves room
for more affective components of policy evaluations. Rather than a purely disinterested
assessment of what executives consider to be the “objective” level of MSP, the Likert-styled
WEF measure provides executives’ with ample opportunity to draw upon any feelings of
contentment or frustration that their personal experiences of MSP engender.
Overall, the Pearson product-moment pairwise correlation between the two MSP
evaluations is positive and weakly moderate at ρ≈.35 (see appendix I). Both measures of MSP
were max-min normalized onto a [0,1] interval to ease interpretation and cross-measure
comparison. In order to measure the divergence between executive and expert assessments, the
normalized WEF executive assessments were subtracted from the Doing Business Project’s
normalized shareholder index score. I label this difference “Executive Bias” (Executive Bias =
Expert Assessment - Average Executive Opinion) and it describes the differences in how experts
and executives place their country on two MSP scales relative to other countries. Executive bias
ranges from [-.59, .59] with a mean of zero and an overall standard deviation of .22. When
executive bias takes on negative values, this means that the executive assessments of MSP where
more optimistic than expert assessments. When it takes on positive values, it suggests that expert
assessments are more sanguine with regard to MSP than executives. An executive bias of zero
means both executives and experts placed their countries’ regulatory regime in identical
positions relative to other countries on their respective MSP scales. According to my framework,
executive bias should become more negative (i.e. executives more optimistic as compared to
experts) as executives’ face less confrontational implementation of MSP by less than fully
independent regulators. Correlations provide some support for my theoretical intuitions:
13

regulatory independence has a weak negative pairwise correlation with executive assessments
(ρ≈-.26) and an even weaker positive correlation with expert assessments of MSP (ρ≈0.13).
Figure 1
Regulatory Independence
In order to test the connection between regulatory independence and executive bias, I
constructed a new dataset of securities market regulatory organizations in over 120 countries
from 1988 until 2012.7 Drawing from financial legislation, agency statutes, and executive orders
and decrees, the dataset features 25 indicators of political independence. Indicator selection was
guided by a close review of the central banking literature as well as previous studies of
regulatory agency formal independence (Cukierman et. al. 1992; Elgie, R. and McMenamin
7 Countries that lacked a public securities market were excluded from the sample.
14
Executive > Expert Executive < Expert
Regulatory Independence
0 Bias
Executive Bias = Expert Assessment - Average Executive Opinion
Optimistic countries: Switzerland, Sweden, Qatar, Germany, Jordan, Greece, Tunisia,
Austria, Netherlands, Luxembourg, Finland, Iceland
Pessimistic Countries: Bangladesh, Mongolia, Columbia, Kyrgyzstan, Bulgaria, Slovenia, Italy, Serbia,
Trinidad, Israel, USAe.g. Croatia, South Africa, New
Zealand, Mexico, Kuwait, Ecuador
2005; Gilardi 2005). Typically, independence indicators are ordinal with the lowest scores
corresponding to political dependence upon ministries of finance and/or executive cabinets;
middling scores indicating independence from the executive, but not legislatures; and the highest
scores reserved for instances in which the regulator is independent of both executive and
legislative actors. In other instances, higher scores reflect requirements that multiple veto players
must agree before a particular action can be taken vis-à-vis a regulatory agency or its personnel
(e.g. legislative confirmation of executive nominees to an agency board). A complete list and
coding for all independence indicators can be found in the appendix.
De jure independence indicators include but are not limited to appointment and dismissal
procedures of regulators’ supervisory boards and executives; restrictions on appointment
renewal; term lengths and the staggering of board terms; the presence of political officials and
other regulators as ex-officio members of agency boards; agencies’ budgetary and organizational
autonomy; the ability of political officials to issue binding instructions to agency personnel; the
rights of political actors to veto agency rules and regulations; and the ability of political actors to
issue rules and regulations independent of agencies. Functional, institutional, financial, and
organizational independence were all represented by indicators. Of these “secondary-level”
features of independence, personnel and functional independence were particularly emphasized.
Countries where the ministry of finance or executive cabinet is in charge of regulation almost
always received the lowest scores possible for each item indicator.8
8 In most instances, regulatory organizations which remained within the Ministry of Finance were not treated as regulatory agencies. Instead they are treated as administrative sub-divisions of the Finance Ministry and receive minimum scores. However, I do not treat institutional independence from government ministries as a necessary condition. When a regulatory organization remained within a government ministry, but its personnel enjoyed finite term limits, protections from dismissal, and/or explicit statutory guarantees of operational autonomy in certain areas, that ministerial subdivision received non-minimum scores on personnel and functional indicators (see appendix).
15

I assume a “family resemblance” approach to the concept of independence. As a result,
my coding scheme does not attempt to express necessary and sufficient conditions for
independence (Goertz 2006). Instead, I treat independence as a quality that a regulator can
possess to a greater or lesser degree. However, my measure does not arbitrarily assume that all
indicators are equally important for independence. Rather than rely solely upon theoretical
assertion to weigh some indicators more than others, I follow Hanretty and Koop (2012) and
look to a group of measurement models associated with Item Response Theory (IRT). These
measurement models assume that the trait being measured is latent rather than directly observed.
Given the structure of my indicators, I estimated a two parameter unidimensional graded
response model using the Expectation-Maximization approach outlined by Bock and Aitkin
(1981). This produced a unique “factor score” that represents regulators’ latent political
independence. This modelling approach was particularly useful in maintaining concept-measure
consistency because it specifically estimates the ability of particular indicators to discriminate
between regulators with higher and lower levels of independence. If an indicator is especially
discriminatory, it receives greater “weight” when latent independence scores are estimated. For
ease of interpretation, latent independence scores were normalized onto a [0,1] scale with 0
indicating regulation conducted completely by political actors and 1 indicating the maximum
level of formal independence found in the sample. Overall, the independence measure is rarely
changing and strongly trended; 84% of all changes were in the direction of greater independence
and independence granted was rarely taken away. Descriptive statistics and a more detailed
discussion of my scaling procedure can be found in appendix III.
In addition to my original measure of regulatory independence, I will also include a series
of alternative political and institutional controls. Main models will feature three variables derived
16

from Beck and Keefer’s Database of Political Institutions (DPI): electoral competitiveness,
electoral proportionality, and a measure of partisanship. Electoral competitiveness is additive
combination of the Legislative and Executive Indices of Electoral Competitiveness rescaled onto
a [0,12] interval with 12 indicating a maximum level of electoral competition.9 I follow Pagano
and Volpin (2005) and use Beck et. al.’s PR, Plurality, and Housesys variables to make a zero to
three proportionality scale where three corresponds to maximum proportionality.10 The
partisanship measure is a dummy variable of center-right government that takes on a value of
one if the chief executive in a presidential system or the largest governing party in a
parliamentary system is centrist or right-wing. In order to account for the legal environment, I
also include a dummy variable control for common law legal family and Freedom House’s Rule
of Law measure. The latter ranges from [0,16] with 16 corresponding to maximum levels of
judicial independence, procedural fairness in criminal and civil trials, and equal rights under the
law. For added robustness, I utilize Witold Henisz’s Political Constraints III index (polcon3) to
measure the presence of veto players in policy making and the World Banks’ Worldwide
Governance Indicators’ Regulatory Quality measure in supplemental models. The Regulatory
Quality indicator takes on values between [-2.21, 2.25] and is a broad measures of the
“incidence of market-unfriendly policies such as price controls or inadequate bank supervision,
as well as perceptions of the burdens imposed by excessive regulation in areas such as foreign
9 The index of executive competitiveness takes on the following values: 1,2--no executive or executive is unelected; 3—elected executive but there is only 1 candidate; 4—single party multiple candidates;5—Multiple legal political parties but only 1 candidate received votes in executive elections; 6—Multiple candidates and legal parties but winning candidate received more than 75% of the vote; 7—winning executive candidate received less than 75% of the vote. The legislative index is same as the executive index, but coded for legislatures. The two indices were added together and then anchored at 0.
10Electoral proportionality is calculated in the following way: PR-Pluralty-Housesys+2 = Electoral Proportionality. PR=1 if any government officials are elected using PR. Plurality =1 if any officials are elected under majoritarian rules. Housesys =1 if the majority of house seats are assigned by a non-PR rule and .5 if there is a bicameral legislature and majority of house seats are assigned by a non-PR rule in one house, but not the other.
17

trade and business development” (World Bank). Higher score indicate a more “market-friendly”
and less burdensome regulatory environment.
Featured macroeconomic controls include GDP per Capita in current US. Dollars (ln),
GDP annual percentage growth, industry value added as a percentage of GDP, services valued
added as a percentage of GDP, Chinn-Ito’s index of capital account openness (normalized), trade
(sum of exports and imports of goods and services) as a percentage of GDP (ln), and value of
stock traded as a percentage of GDP (ln) as a measure of stock market liquidity and
development.11 In supplementary models, a dummy variable for banking crises, stock index price
volatility, and inflation (ln) are also included. All macroeconomic variables, with the exception
of the Chin-Ito index, come from the World Banks’ Development Indicators or their Database on
Financial Development and Structure.
Methods:
The short nature of the panel (2005-2012) and the slow moving nature of both my
independent and dependent variables create important modelling challenges. “Within” fixed
effects estimators are increasingly seen as the standard for cross-national panel data and an
effective way to limit concerns regarding time invariant omitted variable bias. Despite it appeal,
this solution would involve throwing away cross-national variation and depending primarily
upon within country variation for hypothesis testing. Given the limited amount of within country
variation in my key variables, this is unlikely to yield informative results.
11 The inclusion of value traded raises concerns with reverse causality. It will not be included as a control in models where the dependent variable is the level measure of executive confidence in MSP, but will be included in models evaluating the gap between expert and executive assessments. Although this may introduce some endogeniety bias, the exclusion of value traded does not substantively alter the results in Table 2.0. The analysis of the interaction effect between independence and value traded is not meant to definitively establish the direction of causality. Instead it is included in order to find out if the effects of regulatory independence are the same in countries which have greater or lesser degrees of stock market development.
18
The most straightforward alternative is to estimate multi-level models, but this would
involve making the dubious assumption that idiosyncratic error terms are uncorrelated with the
explanatory variables. Haussmann specification tests suggest that this correlation does indeed
significantly alter results between fixed and random effects models (Baltagi 2008). As a result, I
face the following dilemma: fully utilize cross-national variation but suffer the biases caused by
correlations between errors and independent variables, or correct this bias with country fixed
effects and throw away potentially revealing cross-national variation. I choose the former path
with full awareness of its costs. Main models utilize random effects estimations supplemented by
pooled Prais-Winsten models with panel corrected standard errors.
The slow moving nature of the key dependent and independent variable raises
another issue, serial correlation. With this in mind, random effects estimations will be estimated
with Huber-White standard errors clustered by country (Stock and Watson 2008).12 But to further
assure that inferences are not biased by autocorrelation, alternative Cochrane-Orcutt and Prais-
Winsten estimators will also be utilized.13 Despite the many caveats just discussed, main models
will utilize a random effects estimator with Huber/White “cluster-robust” standard errors. As a
result, most models will take the following form:
Yit = α+ βXit + uit + εit
Yit represents either normalized executive assessments of MSP in country i. in year t, or the
executive bias measure in country i. year t. Xit represents regulatory independence and the full
battery of political economic controls in country i. year t. uit represents between-country errors
12 Following King and Roberts (2014), I directly compared the conventional and robust standard errors for my models. They appear nearly identical. At no point did they alter my substantive findings.13 Another common solution to serial correlation is the inclusion of lagged dependent variables. I avoid this approach for 2 reasons: 1) coefficients for LDVs were .88 or higher absorbing much of the effects of the independent variables, and 2) the briefness of the panel (T ≤ 8) means the combination of random effects and an LDV would result in considerable short panel bias.
19
and εit represents within country errors. β is a vector of coefficients for my explanatory variables
and controls. A third set of models will feature an interaction term between regulatory
independence and value traded as a percentage of GDP. These models will be nearly identical to
the model above with the exception of the interaction effect:
Yit = α+ β1Xit +β2(Independenceit x ValueTradedit) + uit + εit
Analysis
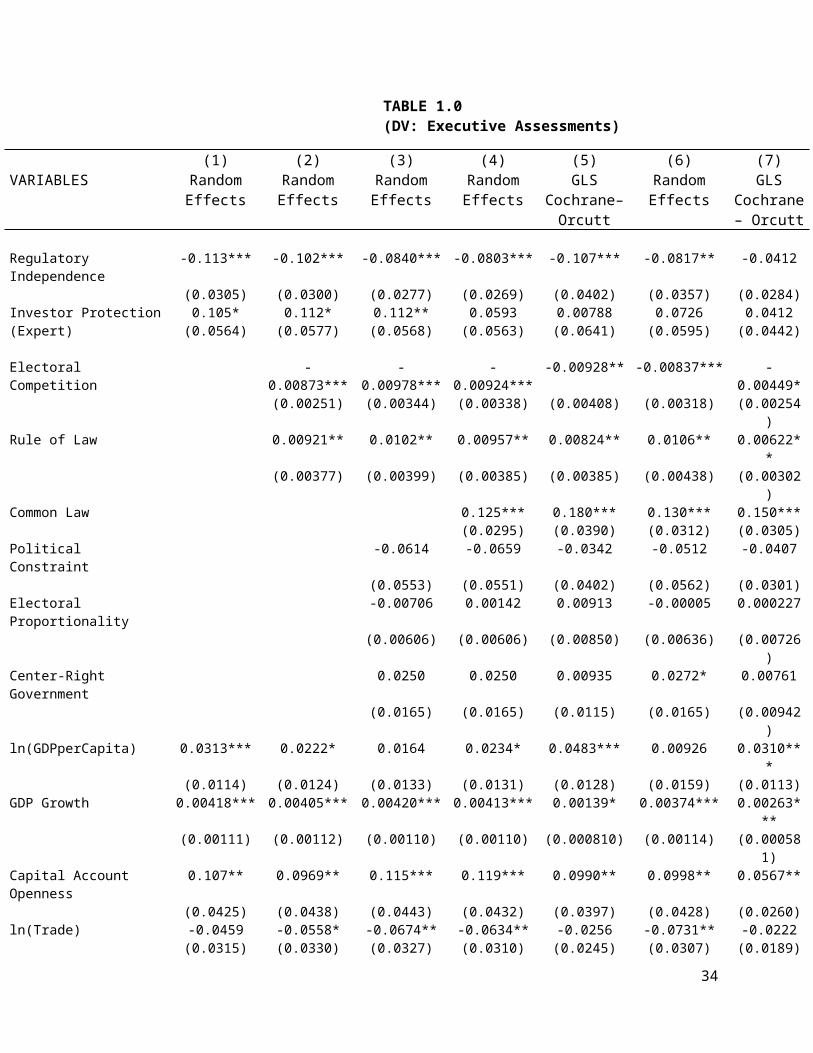
Results largely support H1. Regulatory independence has a negative association with
executive assessments of investor protection. In contrast, stronger formal MSP (as measured by
World Bank expert surveys) has a positive association (see below). The effects of independence
and expert MSP are almost identical in size. A maximum zero to one increase in either variable
is associated with a half overall standard deviation (≈.20) and at least a full within standard
deviation (≈.07) change in executive assessments. This suggests that a simultaneous and equally
sized increase in formal MSP and formal independence could have largely offsetting effects in
terms of executive opinion. Of the two variables, regulatory independence was far more robust to
the inclusion of a dummy for common law legal origin while the expert MSP measure shrank in
terms of both magnitude and significance.
TABLE 1.0 (DV: Executive Assessments)
(1) (2) (3) (4) (5) (6) (7)VARIABLES Random
EffectsRandom Effects
Random Effects
Random Effects
GLS Cochrane–
Random Effects
GLS Cochrane–
20

Orcutt Orcutt
Regulatory Independence -0.113*** -0.102*** -0.0840*** -0.0803*** -0.107*** -0.0817** -0.0412(0.0305) (0.0300) (0.0277) (0.0269) (0.0402) (0.0357) (0.0284)
Investor Protection (Expert) 0.105*(0.0564)
0.112*(0.0577)
0.112**(0.0568)
0.0593(0.0563)
0.00788(0.0641)
0.0726(0.0595)
0.0412(0.0442)
Electoral Competition -0.00873*** -0.00978*** -0.00924*** -0.00928** -0.00837*** -0.00449*(0.00251) (0.00344) (0.00338) (0.00408) (0.00318) (0.00254)
Rule of Law 0.00921** 0.0102** 0.00957** 0.00824** 0.0106** 0.00622**(0.00377) (0.00399) (0.00385) (0.00385) (0.00438) (0.00302)
Common Law 0.125*** 0.180*** 0.130*** 0.150***(0.0295) (0.0390) (0.0312) (0.0305)
Political Constraint -0.0614 -0.0659 -0.0342 -0.0512 -0.0407(0.0553) (0.0551) (0.0402) (0.0562) (0.0301)
Electoral Proportionality -0.00706 0.00142 0.00913 -0.00005 0.000227(0.00606) (0.00606) (0.00850) (0.00636) (0.00726)
Center-Right Government 0.0250 0.0250 0.00935 0.0272* 0.00761(0.0165) (0.0165) (0.0115) (0.0165) (0.00942)
ln(GDPperCapita) 0.0313*** 0.0222* 0.0164 0.0234* 0.0483*** 0.00926 0.0310***(0.0114) (0.0124) (0.0133) (0.0131) (0.0128) (0.0159) (0.0113)
GDP Growth 0.00418*** 0.00405*** 0.00420*** 0.00413*** 0.00139* 0.00374*** 0.00263***(0.00111) (0.00112) (0.00110) (0.00110) (0.000810) (0.00114) (0.000581)
Capital Account Openness 0.107** 0.0969** 0.115*** 0.119*** 0.0990** 0.0998** 0.0567**(0.0425) (0.0438) (0.0443) (0.0432) (0.0397) (0.0428) (0.0260)
ln(Trade) -0.0459 -0.0558* -0.0674** -0.0634** -0.0256 -0.0731** -0.0222(0.0315) (0.0330) (0.0327) (0.0310) (0.0245) (0.0307) (0.0189)
ln(Inflation) 0.000198(0.00475)
Bank Crisis -0.0950***(0.0127)
Stock Index Volatility -0.000988**(0.000437)
Industry (%GDP) 0.00477** 0.00264*(0.00187) (0.00156)
Services (%GDP) 0.00322* 0.00331**(0.00183) (0.00152)
Constant 0.352** 0.480*** 0.581*** 0.471*** 0.182 0.285 -0.0588(0.145) (0.158) (0.159) (0.154) (0.157) (0.180) (0.131)
Observations 860 848 796 796 455 766 766Overall R2 0.0384 0.0479 0.079 0.078 0.312 0.094 0.038Within R2 0.320 0.339 0.317 0.396 0.487 0.367 0.416Number of countries 121 119 114 114 73 112 112
Huber/White Robust standard errors clustered by country in parentheses (*** p<0.01, ** p<0.05, * p<0.1)
This is unsurprising given the non-negligible positive correlation between the two variables
(ρ≈.34) and the work of La Porta et. al. (1998) who suggest that legal tradition fundamentally
shapes the strength of MSP.
21

Like independence and expert MSP, rule of law and electoral competition have opposite
effects on executive assessments. This mirrors the findings of Li and Resnick (2003) who
suggest that distinctions must be made between the property rights enhancing aspects of
democracy (e.g. rule of law) versus those aspects that could frighten investors (open electoral
competition that could empower anti-investor interests). Political constraint, electoral
proportionality, and government partisanship all lacked meaningful relationships to executive
opinion. Economic growth and economic development (GDP per capita, service and industry
value added) all improved executive evaluations while instability in stock markets and the
banking sector had opposite effects. Effects for my two measures of globalization (capital
account openness and trade) were mixed though consistently significant at conventional levels.
Overall, hypothesis I is supported, regulators’ formal insulation from politics does appear to
depress executive assessments of investor protection even after controlling for the formal level of
MSP as measured by experts. Executives may like the rules, but they seem to have less
appreciation for politically independent rule makers and enforcers.
Executive Bias
The previous section demonstrated that countries with more independent regulators have
lower average executive assessments of investor protection. But given that executives are not
neutral players in struggles over corporate governance and may benefit from less stringent
investor protections, how should this lower level of confidence be understood? Is it simply the
losers of regulatory independence expressing their frustration or does it represent a genuine
reappraisal of MSP in light of its more consistent and impartial implementation? By analyzing
executive opinions alongside those of the experts and isolating the role of regulatory institutions
22

in explaining gaps between the two (i.e. executive bias), we should have a better idea of the
answer. Results in Table 2.0 suggest that regulatory independence is in fact a strongly associated
with executive bias (see next page).
Table 2.0 (DV: Executive Bias)
23

(1) (2) (3) (4)VARIABLES Random Effects
GLSRandom Effects
GLSCochrane-
Orcutt(AR1)Prais-Winsten
w/PCSE
Regulatory Independence 0.127*** 0.0819** 0.0757** 0.116**(0.0428) (0.0402) (0.0383) (0.0459)
Electoral Competition 0.00840** 0.00257 0.00679** 0.00859***(0.00394) (0.00309) (0.00275) (0.00318)
Rule of Law -0.00795 0.00602 -0.00356 -0.00337(0.00610) (0.00591) (0.00374) (0.00310)
Common Law 0.0698 0.00636 0.0474 0.0397(0.0478) (0.0474) (0.0405) (0.0294)
Center-Right Partisanship -0.0207 -0.0115 -0.00529 -0.00205(0.0186) (0.0159) (0.0115) (0.00975)
ln(GDPperCapita) 0.0411** -0.0667*** 0.0124 -0.00553(0.0164) (0.0203) (0.0117) (0.0107)
GDP growth (annual %) -0.00477*** -0.00162 -0.00279*** -0.00222*(0.00109) (0.00124) (0.000696) (0.00127)
Capital Account Openness -0.105* -0.0505 -0.0682* -0.0329(0.0575) (0.0597) (0.0348) (0.0335)
ln(Trade) 0.0790** 0.0571 0.0266 -0.00193(0.0387) (0.0420) (0.0248) (0.0238)
ln(Stocks Traded) -0.0381*** -0.000514 -0.0336*** -0.0271***(0.00944) (0.0118) (0.00617) (0.00849)
Constant -0.688*** 0.147 -0.228 -0.0329(0.226) (0.236) (0.145) (0.147)
Observations 733 733 733 733Within R2 0.21 0.378 0.183 --Overall R2 0.08 0.128 0.136 0.10Year FE NO YES NO NONumber of countries 101 101 101 101Huber/White Robust standard errors clustered by country in parentheses (*** p<0.01, ** p<0.05, * p<0.1)
Although the magnitude of the association shrinks by almost half with the inclusion of
year dummies or the use of a Cochrane Orcutt AR(1) transformation, regulatory independence is
statistically significant at conventional levels in all models. This positive coefficient is in line
with hypothesis II; as regulatory independence increases, executive bias becomes more positive
(or less negative) suggesting a decrease in executive optimism relative to the experts. In the
random effects models, a maximum zero to one change in regulatory independence should
24

produce positive changes that range from a third to a half of the overall standard deviation of
executive bias. Prais-Winsten models with a common AR(1) disturbance suggest effects would
equal roughly a half of an overall standard deviation in executive bias (.12).
Figure 2
Expert > Executive
Expert < Executive
-.2-.1
5-.1
-.05
0.0
5P
redi
cted
Exe
cutiv
e B
ias
0 .05 .1 .15 .2 .25 .3 .35 .4 .45 .5 .55 .6 .65 .7 .75 .8 .85 .9 .95 1Regulatory Independence
Predicted Bias Across Regulatory Independence (95% CIs)
Model 1 Table 2.0 Controls at Means
To reiterate, the positive coefficient on regulatory independence variable should not be
interpreted as an increase in the absolute size of the gap between expert and executive
assessments. Instead, it can be described as a move away from negative levels of executive bias
(expert < executive) and a reduction in executives’ valence based overconfidence in MSP. Figure
2 features a linear prediction of bias across regulatory independence and should clarify the
meaning of the positive coefficients. The red reference line on the y axis designates the point at
which experts and executives’ relative ratings of MSP are identical. Since all controls are held at
their mean, the predictions above represent the effects of regulatory independence on the average
country in an average year. When predictions are generated with actual values, results are nearly
identical. Despite differences in slope, all models suggest that regulatory organizations with
below average formal independence (<.71) should be associated with executive assessments of
25

MSP that are more optimistic than the experts (i.e. negative executive bias). Beyond mean levels
independence, differences are not distinguishable from zero at 95% level of confidence. When
financial regulation is conducted within the executive bureaucracy (independence =0), executive
bias becomes the most negative and reflects the highest levels of executive satisfaction and/or
overconfidence relative to the experts. More exactly, expert assessments of MSP are between 12
to 20 percent lower than the assessments of their executive counterparts.
Of the political control variables, only electoral competition produced consistent
results in terms of both sign and significance. Interestingly, electoral competition has very
similar effects to regulatory independence. As electoral competition increases, executives’
opinions become less optimistic relative to the experts and the executive bias variable
approaches zero. In short, electoral competition and executives MSP realism appear to go hand
in hand. Of the macroeconomic controls, only economic growth, capital account openness, and
stock market liquidity maintain consistent signs. All three are negative and their linear
predictions suggest that brisk economic growth, greater capital account openness, and increased
stock market development, can all increase executive evaluations of MSP beyond those of the
experts. Although further research would be required, the higher MSP ratings (relative to
experts) created by economic growth may be a reflection of a more general optimism
experienced by executives during periods of high economic growth. Similarly, the over optimism
in MSP that results from higher levels of capital account openness may be due to the added
financial activity that emerges in the wake of financial liberalization.14
A similar logic may explain the highly significant and
largely negative effect of stock market liquidity on executive bias. Executives, even in privately
14 Fortunately, Chinn and Ito’s measure of capital account openness has a pairwise correlation of 0.60 with Abiad Detragiache, and Tressel’s index of banking sector and credit market liberalization.
26

held companies, may see greater stock market activity and then infer that this must be due, at
least in part, to formal investor protection. They may also be conflating formal investor
protections with the added economic power that flows to shareholders as a result of market
liquidity. As stock markets become more developed, minority shareholders gain added leverage
over corporate insiders: markets for corporate control become more active; information about
managerial performance is more readily available; and shareholders can more easily divest
themselves of poorly performing companies. Furthermore, as trading activity becomes a larger
part of the economy, executives are more often exposed to pro-investor norms and may even
internalize these norms through equity based compensation. Any or all of these factors may lead
executives to over-estimate minority shareholder protection relative to the experts. Figure 4
based upon Model 1 of Table 2.0 provide perspective on the magnitude of the association.
Figure 4Stock Market Effects on Executive Bias
Expert < Executive
Expert > Executive
-.3-.2
-.10
.1P
redi
cted
Exe
cutiv
e B
ias
0 .5 1 1.5 2 2.5 3 3.5 4 4.5 5 5.5 6
ln(Value Traded (%GDP))
Predicted Bias Across Stock Market Depth (95% CIs)
Controls at MeansModel 1 Table 2.0
When stock markets are at below average levels of development as measured by value
traded (<2.3), differences between executive and expert evaluations are statistically
indistinguishable at conventional levels of significance (p<.05). However, as value traded levels
exceed post-2004 median levels (>2.5), executives become overconfident in the strength of
27

minority shareholder protection as compared to the experts.
Overall, regulatory independence, electoral competition, economic growth, capital
account openness and stock market development have a statistically significant association with
executive bias. Higher levels of the first two reduce executives’ overconfidence in MSP relative
to the experts while higher levels of growth, capital account openness, and stock market
development may do the opposite. Given the profound role that stock markets can have of
business culture and therefore executive’s preferences and behavior, the question arises as to
whether the sobering effects of regulatory independence remain the same as economies transition
from bank based to market based corporate governance. As the findings below indicate, the
answer is clearly no.
Table 2.1 Regulatory Independence-Market Depth Interaction on Executive Bias
(1) (2) (3) (4)VARIABLES Random
EffectsRandom Effects
GLS Cochrane-
Orcutt
Prais-Winsten w/PCSE
Regulatory Independence 0.297*** 0.204*** 0.204*** 0.262***(0.0717) (0.0587) (0.0648) (0.0756)
28

ln(StockTraded) 0.00697 0.0312** 0.00173 0.0149(0.0151) (0.0133) (0.0157) (0.0177)
Regulatory Independence x ln(StockTraded)
-0.0651***(0.0213)
-0.0464**(0.0182)
-0.0516**(0.0212)
-0.0597***(0.0227)
Electoral Competition 0.00806** 0.00239 0.00666** 0.00863***(0.00405) (0.00319) (0.00274) (0.00324)
Rule of Law -0.00746 0.00612 -0.00347 -0.00339(0.00608) (0.00589) (0.00372) (0.00298)
Common Law 0.0809* 0.0153 0.0568 0.0516*(0.0477) (0.0474) (0.0403) (0.0296)
Center Right Government -0.0200 -0.0113 -0.00507 -0.00131(0.0188) (0.0160) (0.0115) (0.00992)
ln(GDPperCapita) 0.0405** -0.0654*** 0.0129 -0.00484(0.0164) (0.0204) (0.0116) (0.0102)
GDP Growth -0.00448*** -0.00146 -0.00267*** -0.00211*(0.00110) (0.00126) (0.000697) (0.00128)
Capital Account Openness -0.111* -0.0560 -0.0694** -0.0344(0.0572) (0.0596) (0.0347) (0.0323)
ln(Trade) 0.0750* 0.0551 0.0246 -0.00535(0.0388) (0.0417) (0.0247) (0.0224)
Constant -0.788*** 0.0606 -0.315** -0.133(0.223) (0.236) (0.149) (0.153)
Observations 733 733 733 733Overall R2 0.101 0.145 0.152 0.110Within R2 0.216 0.381 0.192 --Year FE NO YES NO NONumber of countries 101 101 101 101Huber/White Robust standard errors clustered by country in parentheses (*** p<0.01, ** p<0.05, * p<0.1)
The marginal effects of regulatory independence diminish as stock market trading
activity becomes a larger portion of the economy. This result is clearly robust to the inclusion of
year fixed effects and alternative Cochrane-Orcutt and Prais-Winsten estimations. As figure 5
demonstrates, increases in regulatory independence diminish levels of executive overconfidence
in MSP in a most countries. Only once value traded exceeds the 75 percentile of the sample (3.5)
do the sobering effects of regulatory independence become indistinguishable from 0. At the
highest levels of stock market development, the marginal effects of regulatory institutions may
29
even switch direction: greater independence would then be associated with increases rather than
decreases in executive overconfidence.
Figure 5 (Independence-Market Depth Interaction on Bias)
-.20
.2.4
Effe
cts
of R
egul
ator
y In
depe
nden
ce
0 .5 1 1.5 2 2.5 3 3.5 4 4.5 5 5.5 6 6.5ln(StockTraded %GDP)
Effects of Independence Across Stock Market Development (95% CIs)
Controls at MeansModel 1 Table 3.0
To summarize, higher levels of regulatory independence reduce executive assessments of
investor protection. When executive and expert assessments are placed on similar relative [0,1]
scales, findings reveal that this reduction also corresponds to lower levels of executive
overconfidence relative to formal expert measures of MSP. While regulatory independence has
these effects on executive bias in most countries, countries with the most highly developed stock
markets seem largely unaffected. The section below will investigate the robustness of these
results.
Robustness and Sensitivity
In terms of the relationship between regulatory independence and formal (expert) MSP
on the one hand and executive assessments on the other, neither are robust to the inclusion of
country fixed effects (not shown) and only the expert measure is robust to the inclusion of year
30

fixed effects. In contrast, when the same relationship is evaluated with a pooled Prais-Winsten
estimator and panel corrected standard errors, results resemble those in Table 1.0: both expert
MSP and regulatory independence are statistically significant, oppositely signed, and have
associations with executive assessments of roughly equal magnitude (see Table 3.1). Regardless
of estimator type, the inclusion of controls for financial instability does not diminish the strength
of regulatory independence’s coefficient. The opposite is true of controls for industry and
services value added (see Tables 3.0 and 3.1)
The relationship between regulatory independence and executive bias found in Table 2.1
is also fairly robust. A statistically meaningful association survives the inclusion of a further set
of controls including overall regulatory quality (Table 3.2), political constraint, and financial
instability (Table 3.3). It also survives the exclusion of value traded (results nearly identical to
table 2.1). Furthermore, findings weaken but typically remain significant with the inclusion of
country and year fixed effects both together and separately (Table 3.3 and Table 3.4). Table 3.5
demonstrates that reduced differences between experts and executive assessments is in fact
driven by the independence of regulators and not their mere existence. When the regulatory
independence variable is replaced with a dummy variable that takes on a value of one if a
specialized regulatory organization separate from the executive bureaucracy merely exists,
coefficients are cut in half and fail to reach conventional levels of significance.
Robustness tests also provide further support for the assertion that the effects of
regulatory independence on executive bias are smaller as stock markets become better
developed. The interaction effect is left largely unaffected by the inclusion of country fixed
effects, year fixed effects, or both (Table 3.6). Furthermore, it survives the addition of controls
for political constraint and financial instability (Table 3.7) and substantially weakens when the
31

independence measure is replaced by the “regulator in existence” dummy(Table 3.8). If the size
of stock markets is substituted for liquidity, results remain largely unchanged across all model
types (not shown).
Conclusion
The strength of minority shareholder protection is widely believed to be an essential
contributor to financial development. As a result, scholars continue to focus upon developing
accurate measures of how various rules and regulations protect non-controlling shareholders
from the fraud, greed, incompetence, and self-dealing of corporate insiders. While most
measures attempt to develop an objective account of MSP strength, other measures, like the
survey evidence provided by the World Economic Forum, allow for more subjective evaluations.
Unsurprisingly, the differences between the “objective” legal expert based approaches and those
that utilize the opinions of the potential losers of MSP (i.e. corporate insiders) are substantial in
many countries. Findings indicate that regulatory independence is a key driver of the size and
nature of these differences.
In countries where regulators are freed of the most blatant forms of political interference,
average executive assessments of MSP are actually lower than countries with more politicized
regulators. While it is possible that regulatory independence systematically weakens investor
protection, this is likely not the case. Not only would such a conclusion be contrary to the
expectations of nearly all the past literature on the regulatory politics and the regulatory state, it
also ignores the fact that executives’ pay costs as well as enjoy benefits from MSP. What seems
more likely is that the added policy consistency that accompanies independence may raise
executives’ awareness of formal MSP including how current levels of MSP fall short or impinge
upon their interests. Rather than a genuine sign of weaker investor protection, the inverse
32

relationship between independence and executive confidence likely reflects a higher level of
realism among latter. Furthermore, these results provide clear guidance as to where independent
regulatory organizations may generate the most opposition from corporate elites: countries where
corporate insiders are overconfident (relative to the experts) in the current regime of investor
protection and are relatively isolated from the financial pressures that come from having larger
and more liquid equity markets. In these contexts, the consistent and impartial implementation of
formal MSP may come as a rude awakening for corporate insiders unaccustomed to the
discipline of financial markets or the effective enforcement of corporate governance regulation.
These findings have several implications. First, these results suggest that
regulatory organizations cannot be subsumed under the broader concept of regulation. The
strength and content of the latter may be highly dependent upon the political independence of the
former. As a result, developing accurate measures of regulatory organization may be just as
important as measuring regulations themselves. Second, independent regulators play an
important part in spreading pro-shareholder norms among business elites. Their consistent
implementation of MSP may help to shift executive assessments of investor protection away
from being naïve, abstract, and valence based toward something more concrete, meaningful, and
possibly pessimistic. Third, these findings highlight the importance of preventing capture that
operates indirectly through politicians via processes of appointment, appropriation, and
oversight. Had findings indicated that formal political independence is unrelated to executive
assessments of MSP, it would suggest that the indirect pressure corporate insiders exercise
through the political process plays a mostly minor role in shaping regulatory practice. This
study’s results suggest the opposite. Political independence matters and may be essential to
33
transforming formal investor protections from empty words upon which everyone can agree into
something that inspires considerable conflict among powerful economic elites.
Works Cited
Baltagi, Badi. 2008. Econometric analysis of panel data. New Jersey: John Wiley & Sons.
Beck, Thorsten., Clarke, G., Groff, A., Keefer, Philip. and Walsh, Paul. 2001. ‘New Tools in Comparative Political Economy: The Database of Political Institutions. World Bank Economic’. World Bank Economic Review, 15(1): 165–76.
Beck, Thorsten, Aslı Demirgüç-Kunt and Ross Levine. 2000, "A New Database on Financial Development and Structure," World Bank Economic Review 14, 597-605.
Bendor, J., Glazer, A., & Hammond, T. 2001. Theories of delegation. Annual review of political science, 4(1), 235-269.
Berkman, H., Rebel Cole, and Lawrence Fu, .2011. Political connections and minority-shareholder protection: Evidence from securities-market regulation in China.
Berkman, Henk, Rebel A. Cole, and Lawrence J. Fu. 2014. "Improving corporate governance where the State is the controlling block holder: evidence from China." The European Journal of Finance 20(7-9): 752-777.
Bock R. Darrel and Murray Aitkin .1981. “Marginal Maximum Likelihood Estimation of Item Parameters: Application of an EM Algorithm." Psychometrika 46(4): 443-459.
Braithwaite, John. 2008. Regulatory Capitalism: How it Works, Ideas for Making it Work Better. Cheltenham, UK: Edward Elgar Press
Burris, Val and Clifford L Staples. 2012. “In search of a transnational capitalist class: Alternative methods for comparing director interlocks within and between nations and regions.” International Journal of Comparative Sociology . 53.4: 323– 342
Cheung, Yan-Leung, Lihua Jing, P. Raghavendra Rau, and Aris Stouraitis. 2005. "Guanxi, political connections, and expropriation: The dark side of state ownership in Chinese listed companies." City University of Hong Kong working paper
Chinn, Menzie. and Hiro Ito. 2006. "What Matters for Financial Development? Capital Controls, Institutions, and Interactions," Journal of Development Economics. 81(1): 163-192
Cukierman, Alex, Steven Webb, and Bilin Neyapti. 1992. “Measuring the independence of central banks and its effect on policy outcomes.” World Bank Economic Review, 6(3):353–398.
34

Culpepper, Pepper. 2011. Quiet Politics and Business Power: Corporate Control in Europe and Japan. New York: Cambridge University Press.
Djankov, S., La Porta, R., Lopez-de-Silanes, F., & Shleifer, A. (2008). The law and economics of self- dealing. Journal of financial economics, 88(3), 430-465.
Doing Business, The World Bank (http://www.doingbusiness.org). Accessed on 1/15/2016.
Dyck, Alexander, and Luigi Zingales. 2004. “Private Benefits of Control: An International Comparison.” The Journal of Finance 59(2): 537-600
Gilardi, Fabrizio. 2005. “The Formal Independence of Regulators: A Comparison of17 Countries and 7 Sectors .” Swiss Political Science Review 11(4): 139-167
Goertz, Gary. Social Scientific Concepts: A User’s Guide. 2006. Princeton, New Jersey: Princeton University Press, 95-128.
Henisz, Witold J. 2002. “The Institutional Environment for Infrastructure Investment.”Industrial and Corporate Change 11(2): 355-389.
Keefer, Philip. 2008. "Beyond legal origin and checks and balances: Political credibility, citizen information, and financial sector development." In. Political institutions and financial development. Stephen Haber, Douglass North, and Barry R. Weingast (eds).. Stanford University Press.
King, Gary, and Margaret E. Roberts. “How Robust Standard Errors Expose Methodological Problems They Do Not Fix, and What to Do About It”. Political Analysis 23. (2015):159–179
Kydland, Finn E., and Edward C. Prescott. "Rules rather than discretion: The inconsistency of optimal plans." The journal of political Economy (1977): 473-491.
Levi-Faur, David. 2005. “The Global Diffusion of Regulatory Capitalism.” The Annals of the American Academy of Political and Social Sciences 598:12-32
Levy, Brian. and Pablo Spiller. 1996. “A framework for resolving the regulatory problem.” In Brian Levy and Pablo Spiller, eds., Regulations, Institutions, and Commitment: Comparative Studies of Telecommunications. Cambridge: Cambridge University Press, 1-35
Majone, Giandomenico. 1994. “The Rise of the Regulatory State in Europe.” West European Politics. 17(3): 77–101.
Gourevitch, P.A. and Shinn, J. (2005) Political Power and Corporate Control, Princeton, NJ: Princeton University Press.
La Porta, R., Lopez-de-Silanes, F. and Shleifer, A. (1999) ‘Corporate Ownershiparound the World’, Journal of Finance, 54(6): 471–517.
La Porta, R., Lopez-de Silanes, F., Shleifer, A. and Vishny, R. W. (1997) ‘Legal
35

Determinants of External Finance’, Journal of Finance, 52(2): 1131–50.
La Porta, R., Lopez-de Silanes, F., Shleifer, A. and Vishny, R. W. (1998) ‘Law andFinance’, Journal of Political Economy, 106(3): 1113–55.
La Porta, R., Lopez-de-Silanes, F. and Shleifer, A. (2008) ‘The EconomicConsequences of Legal Origins’, Journal of Economic Literature, 46(2):285–332.
McDonnell, Brett. 2013. “Dampening Financial Regulatory Cycles.” Florida Law Review. 65: 1597-1651
Morck Randall, Daniel Wolfenzon and Bernard Yeung. 2003. “Corporate Governance, Economic Entrenchment, and Growth.” Journal of Economic Literature. 43(3): 655-720
Pagano, Marco and Paolo F. Volpin. 2005. “The Political Economy of Corporate Governance.” The American Economic Review. 95(4): 1005-1030
Pinto, Pablo M., Stephen Weymouth, and Peter Gourevitch. 2010. “The Politics of Stock Market Development.” Review of International Political Economy 17(2): 378-409
Rogoff, K. (1985). The optimal degree of commitment to an intermediate monetary target. The quarterly journal of economics, 1169-1189.
Schwab, Klaus, and Michael Porter, eds. (2005). “The global competitiveness report 2005-2006.” Geneva: World Economic Forum.
Schwab, Klaus, and Michael Porter, eds. (2007). “The global competitiveness report 2007-2008.” Geneva: World Economic Forum.
Schwab, Klaus, and Michael Porter. (2008). "The global competitiveness report 2008–2009." Geneva: World Economic Forum.
Schwab, Klaus, and Xavier Sala-i-Martin, eds. (2009). “The global competitiveness report 2009-2010.” Geneva: World Economic Forum.
Schwab, Klaus, and Xavier Sala-i-Martin, eds. (2010). “The global competitiveness report 2010-2011.” Geneva: World Economic Forum.
Schwab, Klaus, and Xavier Sala-i-Martin, eds. (2011) "The global competitiveness report 2011-2012." Geneva: World Economic Forum.
Schwab, Klaus, and X. Sala-i-Martin, eds. (2012) "The global competitiveness report 2012–2013." Geneva: World Economic Forum.
Schwab, Klaus, ed. (2014). “The Global Competitiveness Report 2013-2014.” Geneva: World Economic Forum.
36

Spiller, Pablo T., and Mariano Tommasi. 2005 "The institutions of regulation: An application to public utilities." In Handbook of new institutional economics. New York: Springer: 515-543.
Stock, James., and Watson, Mark (2008). Heteroskedasticity‐robust standard errors for fixed effects panel data regression. Econometrica, 76(1), 155-174.
World Bank Group (Ed.). (2012). World Development Indicators . World Bank Publications.
Windolf, Paul. Corporate Networks in Europe and the United States. Oxford: Oxford University Press, 2002
Appendix I
Variable Summary
37

Variable Mean Std. Dev. Min Max ObservationsExecutive Bias overall -0.01 0.22 -0.59 0.59 N = 924
between 0.21 -0.47 0.46 n = 126within 0.09 -0.39 0.40 µT = 7.33333
Protection of minority shareholders’ interests (WEF) overall 0.480706 0.20 0.00 1.00 N = 819between 0.19 0.08 0.91 n = 124within 0.07 0.26 0.72 µT = 6.60484
Strength of Minority Investor Protection (World Bank) overall 0.448975 0.19 0.00 1.00 N = 1049between 0.18 0.00 1.00 n = 134within 0.05 0.09 0.67 µT = 7.82836
Regulatory Independence overall 0.71 0.20 0.00 1.00 N = 925between 0.17 0.00 0.99 n = 133within 0.09 0.04 1.36 µT = 6.95
Regulatory Quality overall 0.21 0.90 -2.21 1.93 N = 922between 0.90 -1.82 1.92 n = 132within 0.12 -0.57 0.78 µT = 6.98
Electoral Competition overall 10.61 2.84 0.00 12.00 N = 1038between 2.64 1.00 12.00 n = 130within 1.05 0.11 18.86 µT = 7.98
Rule of Law overall 8.92 4.53 0.00 16.00 N = 1061between 4.51 0.00 16.00 n = 133within 0.55 5.29 12.79 µT = 7.97744
Political Constraint overall 0.31 0.19 0.00 0.71 N = 1057between 0.17 0.00 0.70 n = 133within 0.08 -0.10 0.63 µT= 7.9
Center-Right Government overall 0.30 0.46 0.00 1.00 N = 1072between 0.39 0.00 1.00 n = 134within 0.25 -0.58 1.17 µT = 8
ln(GDP per Capita) overall 8.73 1.45 5.36 11.63 N = 1059between 1.44 5.36 11.51 n = 133within 0.22 7.72 9.37 µT = 7.96
GDP Growth overall 4.12 4.49 -17.95 34.50 N = 1057between 2.62 -1.38 14.42 n = 133within 3.65 -16.40 24.47 µT = 7.95
Capital Account Openness overall 0.63 0.37 0.00 1.00 N = 1031between 0.36 0.00 1.00 n = 130within 0.08 0.06 1.01 µT =7.99
ln(Trade%ofGDP) overall 4.43 0.48 3.10 6.11 N = 1026between 0.48 3.22 6.00 n = 133within 0.09 4.07 5.02 µT = 7.77
ln(Inflation) overall 1.71 0.79 -2.92 7.00 N = 1011between 0.75 -0.12 6.36 n = 131within 0.88 -2.13 3.56 µT = 7.71
Bank Crisis overall 0.11 0.31 0.00 1.00 N = 934between 0.23 0.00 0.71 n = 133within 0.22 -0.61 0.97 µT = 7.02
Stock Price Volatility (Std.Dev Index Price/µIndexPrice) overall 22.51 11.40 2.39 141.58 N = 548between 7.90 6.23 58.83 n = 82within 8.52 -16.47 105.27 µT = 6.68293
ln(Stocks Value Traded%GDP) overall 2.25 1.74 0.00 6.61 N = 854between 1.69 0.00 6.10 n = 110within 0.49 -0.16 4.53 µT = 7.76364
Correlation Matrix
38
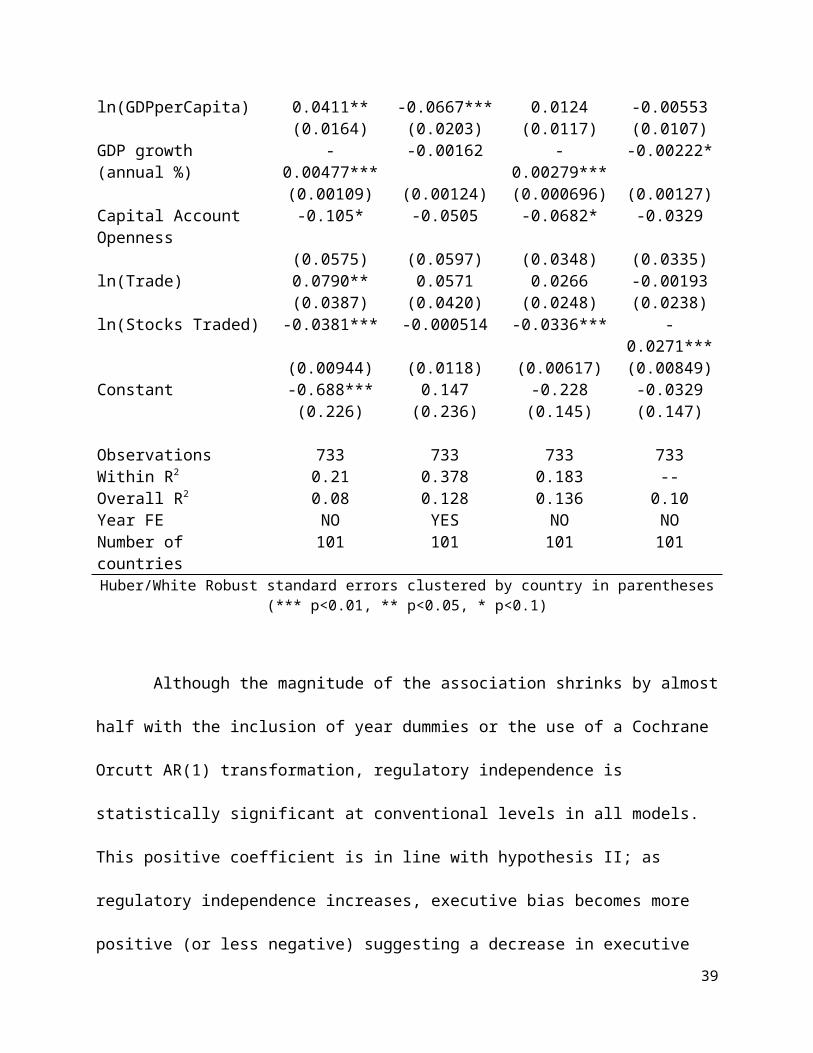
Executive Bias MSP(Expert) MSP(Executive) ln(ValueTraded) ln(MarketCap) Regulatory Independence Regulatory QualityExecutive Bias 1***MSP(Expert) .5271*** 1MSP(Executive) -.6096*** .35*** 1ln(ValueTraded) -.2418*** .3251** .5522*** 1ln(MarketCap) -.2654*** .2752** .5463*** .7089*** 1Regulatory Independence .23*** .1337** -.2592*** -.1232*** -.1422*** 1Regulatory Quality -.2192*** 0.4485*** .6135*** 0.5026*** .3926*** .2140*** 1ln(GDPperCap) -.2357*** 0.3039*** .5135*** .5249*** .4108*** .1611*** .8027***Electoral Competition .2171*** .2378*** -.0767* -0.0716* -0.0663 .3622*** .2636***Rule of Law -.10*** .3470*** .3776*** .24*** .1678*** .2820*** .7985***Common Law .07* .3320*** 0.0109 0.0109 .1362*** -.1658 -.02Political Constraint 0.06 .2150*** 0.092 .0920** .1061** .3117*** .4709***
Correlation Matrix Continued
Expert and Executive Assessments Compared (2012)
dashed lines indicates 0 Executive Bias
39
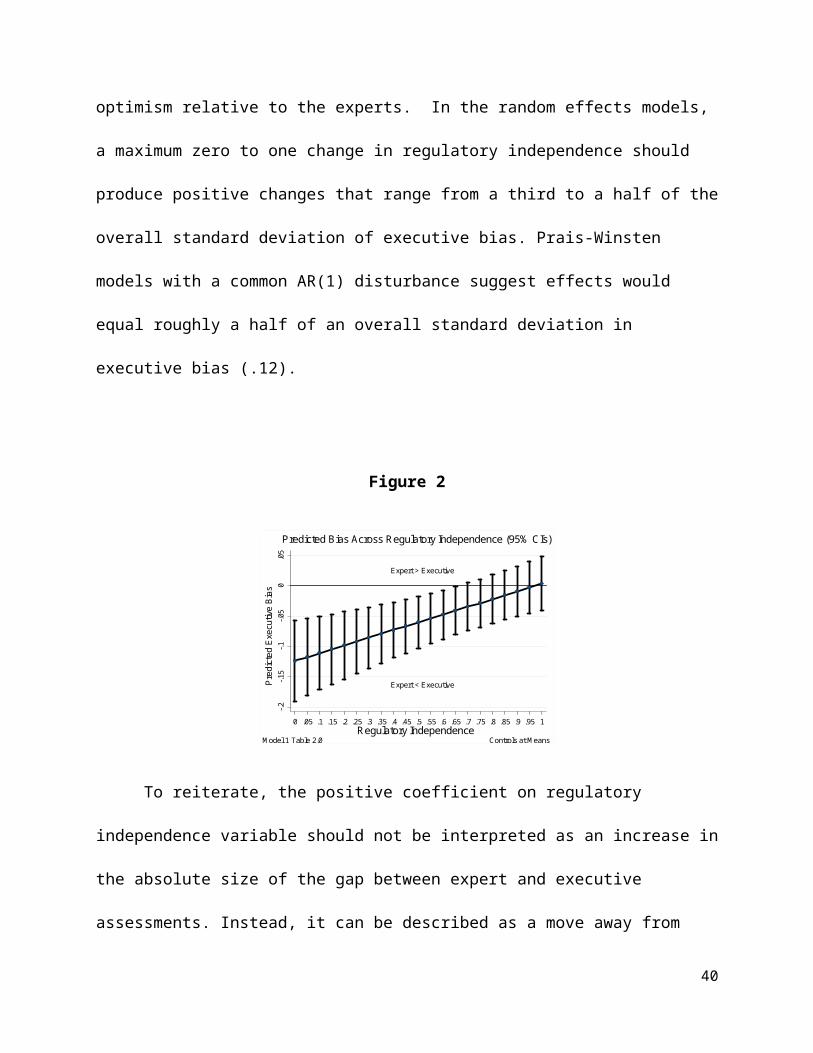
AUS
AUT
BEL
CAN
CYPDNK
FINFRA
DEUGRC
ISL
IRL
ITA
LUXNLD
NZL
NOR
PRT
ESP
SWE
CHE
GBRUSA
Expert > Executive
Expert < Executive
.2.4
.6.8
1
MS
P (E
xper
t)
.2 .4 .6 .8 1
MSP (Executive)
North America and Western Europe
ALB
ARG
ARMAZE
BRB
BOL
BIH
BRA
BGRCHL
COL
CRIHRV
CZE DOM
ECU
SLV
EST
GTMHND
HUN
JAM
KAZKGZ
LVALTU
MKD
MEXMDA
MNE
NIC
PAN
PRY
PER
POLROU
RUS
SRB
SVK
SVN
TTO
UKR
URY
VEN
GEO
GUY
Expert < Executive
Expert > Executive
0.2
.4.6
.8M
SP
(Exp
ert)
0 .2 .4 .6 .8MSP (Executive)
Latin America and Former Soviet States
BGD
BTN
KHMCHN
INDIDN
JPN
LAO
MYS
MNG
NPL
PAK
PHL
KOR
SGP
LKATWN
THA
TUR
VNM
Expert > Executive
Expert < Executive
0.2
.4.6
.81
MS
P (E
xper
t)
0 .2 .4 .6 .8 1
MSP (Executive)
Asia and Pacific
DZABHR
BWA
CMRCPV
CIVEGY
GHA
IRN
ISR
JOR
KEN KWTLBNMWI
MUS
MAR
MOZ
NAMNGA
QAT
RWASAU
SYC
ZAF
SWZ
TZA
ARE
UGA
ZMB
ZWE
SLE
Expert > Executive
Expert < Executive0
.2.4
.6.8
1M
SP
(Exp
ert)
0 .2 .4 .6 .8 1
MSP (Executive)
Middle East and Africa
Executive Bias and Market Development
Liquidity Size
40

ARG
ARM
AUS
AUT
BHR
BGD
BRB
BEL
BOL
BWA
BRA
BGRCAN
CHLCHN
COL
CRI
CIV
HRV
CYP CZE DNK
ECU EGY
SLV EST
FIN
FRA
DEU
GHA
GRCHUN
ISL INDIDN
IRN
IRLISR
ITA
JAMJPN
JOR
KAZ
KEN
KWT
KGZ
LVALBN
LTU
LUX
MKD
MWI
MYS
MUSMEX
MNG
MNE
MARNAM
NPL
NLD
NZLNGA
NOR
PAK
PAN
PRY PER
PHL
POL
PRT
QAT
ROU
RUS
KOR
SAU
SRB
SGP
SVK
SVN
ZAF
ESP
LKA
SWE
CHE
TZATHA
TTO
TUR
ARE
GBR
USA
UGA
UKR
URYVENVNM
ZMBZWE
GEOExpert > Executive
Expert < Executive
-.6-.4
-.20
.2.4
.6E
xecu
tive
Bia
s
0 1 2 3 4 5 6
ln(Value Traded %GDP)
ARG
ARM
AUS
AUT
BHR
BGD
BRB
BEL
BOL
BWA
BRA
BGRCAN
CHLCHN
COL
CRI
CIV
HRV
CYP CZE DNK
ECU EGY
SLVEST
FIN
FRA
DEU
GHA
GRCHUN
ISL INDIDN
IRN
IRLISR
ITA
JAMJPN
JOR
KAZ
KEN
KWT
KGZ
LVALBN
LTU
LUX
MKD
MWI
MYS
MUSMEX
MNG
MNE
MARNAM
NPL
NLD
NZLNGA
NOR
PAK
PAN
PRY PER
PHL
POL
PRT
QAT
ROU
RUS
KOR
SAU
SRB
SGP
SVK
SVN
ZAF
ESP
LKA
SWE
CHE
TZATHA
TTO
TUR
ARE
GBR
USA
UGA
UKR
URY VENVNM
ZMBZWE
GEO
GUY
Expert < Executive
Expert > Executive
-.6-.4
-.20
.2.4
.6
Exe
cutiv
e B
ias
0 2 4 6
ln(Market Capitalization %GDP)
Executive Bias and Regulatory Independence (2012)
ALB
DZA
ARG
ARM
AUS
AUT
AZE
BHR
BGD
BRB
BEL
BTN
BOL
BIH
BWA
BRA
BGR
CMR
CAN
CPV
CHLCHN
COL
CRI
CIV
HRV
CYP CZEDNKDOM
ECUEGY
EST
FIN
FRA
DEU
GHA
GRC
GTM HND
HUN
ISLINDIDN
IRN
IRLISR
ITA
JAMJPN
JOR
KAZ
KEN
KWT
KGZ
LAO
LVALBN
LTU
LUX
MKD
MWI
MYS
MUSMEX
MDA
MNG
MNE
MAR
MOZ
NAM
NPL
NLD
NZL
NIC
NGA
NOR
PAK
PAN
PRY PER
PHL
POL
PRT
QAT
ROU
RUS
RWA
KOR
SAU
SRB
SYC
SGP
SVK
SVN
ZAF
ESP
LKA SWZ
SWE
CHE
TWN
THA
TTO
TUR
ARE
GBR
USA
UGA
UKR
URYVEN ZMBZWE
GEO
GUY
SLE
Expert < Executive
Expert > Executive
-.6-.4
-.20
.2.4
.6
Exe
cutiv
e B
ias
.6 .7 .8 .9 1
Regulatory Independence
Appendix II
41
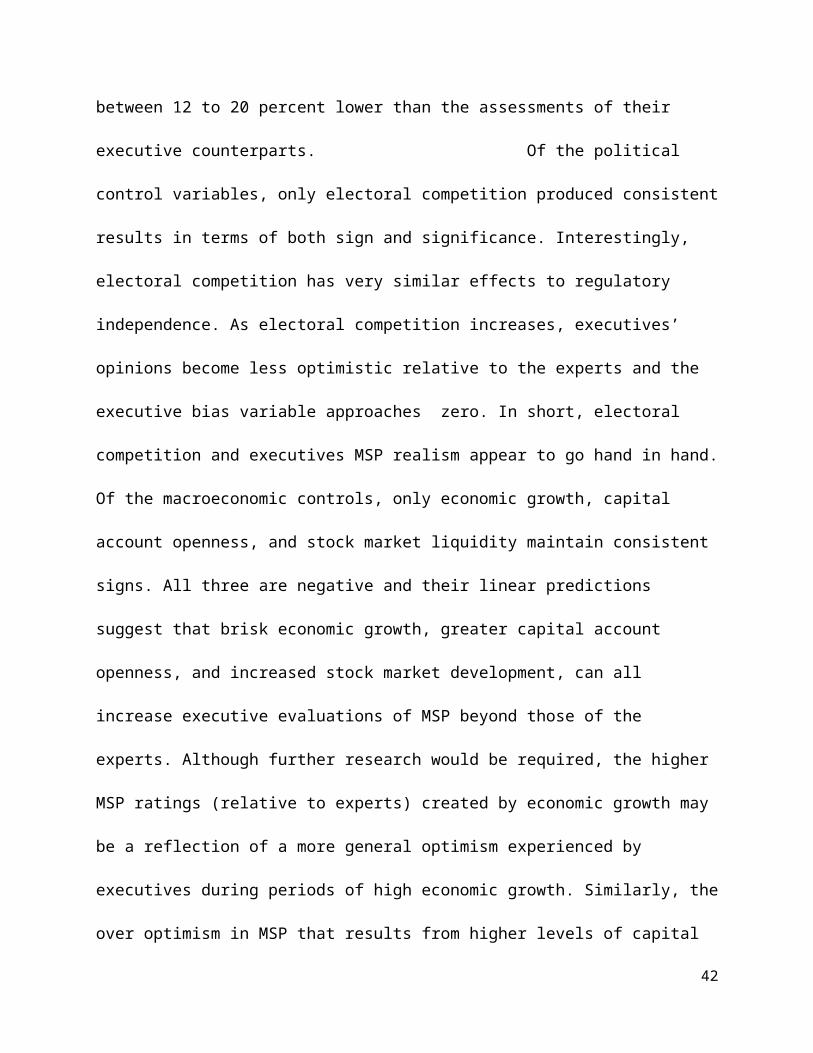
Table 3.0 (DV: Executive Assessments w/year fixed effects)
(1) (2) (3) (4) (5)VARIABLES Random Effects
GLSRandom Effects
GLSRandom Effects
GLSRandom Effects
GLSRandom Effects
GLS
Regulatory Independence -0.0546 -0.0505 -0.0236 -0.100*** -0.0409(0.0344) (0.0346) (0.0329) (0.0370) (0.0419)
Investor Protection (Expert) 0.198*** 0.204*** 0.161*** 0.0132 0.159***(0.0509) (0.0499) (0.0513) (0.0645) (0.0507)
Electoral Competition -0.00296 -0.00489* -0.00844 -0.00538*(0.00193) (0.00260) (0.00620) (0.00284)
Rule of Law -0.00292 -0.00454 0.000459 -0.00454(0.00391) (0.00412) (0.00533) (0.00460)
Common Law 0.141*** 0.175*** 0.140***(0.0311) (0.0350) (0.0329)
Political Constraint -0.0431 -0.0944** -0.0466(0.0490) (0.0445) (0.0493)
Electoral Proportionality 0.00178 0.00493 0.00197(0.00892) (0.00987) (0.00898)
Center-Right Government 0.0140 0.0218 0.0126(0.0133) (0.0137) (0.0139)
ln(GDPperCapita) 0.0736*** 0.0773*** 0.0863*** 0.0904*** 0.0953***(0.0123) (0.0144) (0.0150) (0.0205) (0.0184)
GDP Growth 0.000487 0.000541 0.000525 -0.000183 0.000705(0.00102) (0.00102) (0.000969) (0.00118) (0.00101)
Capital Account Openness 0.0245 0.0306 0.0459 0.0417 0.0432(0.0440) (0.0441) (0.0439) (0.0605) (0.0441)
ln(Trade) -0.0380 -0.0389 -0.0405 -0.0173 -0.0340(0.0315) (0.0323) (0.0319) (0.0373) (0.0303)
ln(Inflation) -0.00208(0.00823)
Bank Crisis -0.0679***(0.0180)
Stock Index Volatility -0.00136**(0.000636)
Industry(%GDP) -0.00226(0.00190)
Services(%GDP) -0.00109(0.00202)
Constant -0.0242 -0.00133 -0.0754 -0.0680 -0.0236(0.155) (0.165) (0.175) (0.229) (0.187)
Observations 860 848 796 455 766Overall R2 0.364 0.356 0.434 0.488 0.444Within R2 0.253 0.262 0.333 0.490 0.325Year FE YES YES YES YES YESNumber of countries 121 119 114 73 112
Huber/White Robust standard errors clustered by country in parentheses (*** p<0.01, ** p<0.05, * p<0.1)
42

Table 3.1 (DV: Executive Assessments)
VARIABLES Prais-Winsten Prais-Winsten Prais-Winsten Prais-Winsten Prais-Winsten Prais-WinstenCommon AR(1) Common AR(1) Common AR(1) Common AR(1) Common AR(1) Common AR(1)
Regulatory Independence -0.123*** -0.118*** -0.109*** -0.0925*** -0.173*** -0.111***(0.0357) (0.0361) (0.0350) (0.0331) (0.0568) (0.0398)
Investor Protection (Expert) 0.175*** 0.176*** 0.177*** 0.0715** 0.0421 0.0774***(0.0414) (0.0401) (0.0385) (0.0282) (0.0342) (0.0283)
Electoral Competition -0.00693*** -0.00600** -0.00516* -0.00880*** -0.00540*(0.00225) (0.00240) (0.00271) (0.00285) (0.00293)
Rule of Law 0.00724*** 0.00940*** 0.00786*** 0.0103*** 0.00678**(0.00276) (0.00248) (0.00247) (0.00371) (0.00292)
Common Law 0.146*** 0.172*** 0.145***(0.0138) (0.0227) (0.0144)
Political Constraints -0.0427 -0.0481 -0.0498 -0.0474(0.0333) (0.0329) (0.0592) (0.0315)
Electoral Proportionality -0.0163*** 0.000347 0.00962* -0.000286(0.00608) (0.00516) (0.00560) (0.00579)
Center-Right 0.00295 0.00263 0.00363 0.000826(0.00849) (0.00811) (0.0100) (0.00879)
ln(GDPperCapita) 0.0626*** 0.0513*** 0.0483*** 0.0573*** 0.0586*** 0.0508***(0.00813) (0.00793) (0.00890) (0.00969) (0.0106) (0.0150)
GDP growth 0.00194 0.00198 0.00211 0.00213* 0.00113 0.00241*(0.00143) (0.00139) (0.00133) (0.00127) (0.00159) (0.00127)
Capital Account Openness 0.0204(0.0236)
0.0161(0.0243)
0.0190(0.0256)
0.0318(0.0259)
0.0697*(0.0364)
0.0267(0.0261)
ln(Trade) -0.00276 -0.00770 -0.0145 -0.0149 -0.0209 -0.0134(0.0181) (0.0186) (0.0192) (0.0197) (0.0165) (0.0201)
ln(1+Inflation) -0.00452(0.00829)
Banking crisis -0.0891***(0.0154)
Stock price volatility -0.00125*(0.000690)
Industry (%GDP) 0.000554(0.00174)
Services (%GDP) 0.00210*(0.00127)
Constant -0.0776 0.0497 0.104 -0.00772 0.112 -0.0699(0.0962) (0.108) (0.101) (0.0979) (0.110) (0.100)
Observations 860 848 796 796 455 766R-squared 0.566 0.570 0.589 0.613 0.699 0.612Number of countries 121 119 114 114 73 112
Panel Corrected Standard errors in parentheses (*** p<0.01, ** p<0.05, * p<0.1)
43
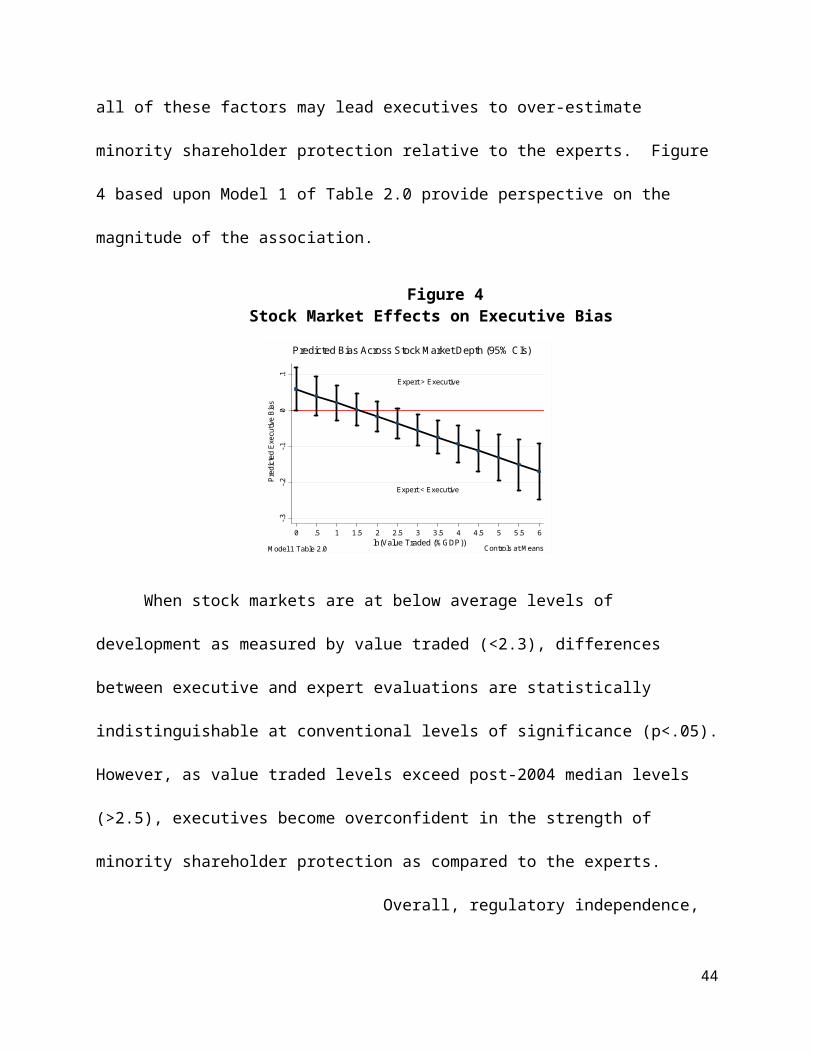
Table 3.2 (DV: Executive Bias w/Control for Regulatory Quality)
(1) (2) (3) (1)VARIABLES Random Effects
GLSRandom Effects
GLSCochrane-Orcutt Random Effects
GLS
Prais-Winsten w/PCSE
Regulator Independence 0.142*** 0.0841** 0.0784** 0.117**(0.0371) (0.0373) (0.0388) (0.0496)
Regulatory Quality -0.0380 -0.00512 -0.0151 0.0133(0.0452) (0.0429) (0.0263) (0.0239)
Electoral Competition 0.00797* 0.00291 0.00700** 0.00867***(0.00425) (0.00344) (0.00280) (0.00334)
Rule of Law -0.00594 0.00650 -0.00264 -0.00425(0.00725) (0.00696) (0.00425) (0.00317)
Common Law 0.0701 0.00614 0.0452 0.0340(0.0501) (0.0495) (0.0413) (0.0337)
Center-Right Government -0.0180 -0.00780 -0.00530 -0.00581(0.0175) (0.0150) (0.0122) (0.00996)
ln(GDPperCapita) 0.0551*** -0.0591*** 0.0220 -0.00674(0.0209) (0.0229) (0.0140) (0.0151)
GDP growth (annual %) -0.00475*** -0.00136 -0.00299*** -0.00213(0.00109) (0.00115) (0.000740) (0.00144)
Capital Account Openness -0.131** -0.0842 -0.105*** -0.0563(0.0578) (0.0567) (0.0390) (0.0377)
ln(Trade) 0.0737* 0.0668 0.0335 -0.000813(0.0389) (0.0439) (0.0261) (0.0258)
ln(Stock Traded) -0.0342*** -0.000018 -0.0315*** -0.0273***(0.0103) (0.0120) (0.00646) (0.00884)
Constant -0.793*** 0.0523 -0.331** -0.00867(0.291) (0.296) (0.169) (0.208)
Observations 640 640 640 640Within R2 0.217 0.405 0.194 --Overall R2 0.088 0.117 0.128 0.105Year FE NO YES NO NONumber of countries 100 100 100 100
Huber/White Robust standard errors clustered by country in parentheses (*** p<0.01, ** p<0.05, * p<0.1)
44

Table 3.3(DV: Executive Bias w/Additional Controls and Country Fixed Effects)
(1) (2) (3) (4) (5) (6) (7)VARIABLES Random
Effects GLSRandom
Effects GLSGLS
Cochrane- Orcutt
Prais- Winsten w/PCSE
FixedEffects
Fixed Effects
Fixed Effects Cochrane-
Orcutt
Regulatory Independence 0.144*** 0.124** 0.102** 0.129** 0.125*** 0.106** 0.0478(0.0485) (0.0562) (0.0492) (0.0612) (0.0380) (0.0469) (0.0528)
Regulatory Quality -0.0977 -0.0658 -0.0677** -0.0602** -0.0727 -0.0542 -0.0600(0.0635) (0.0573) (0.0325) (0.0279) (0.0732) (0.0694) (0.0452)
Electoral Competition 0.0221*** 0.0155*** 0.0156*** 0.0171*** 0.0189*** 0.0134*** 0.0114***(0.00469) (0.00349) (0.00428) (0.00421) (0.00580) (0.00502) (0.00438)
Rule of Law -0.000119 0.00857 0.00372 0.00406 0.00413 0.00997 0.0137(0.00915) (0.00872) (0.00521) (0.00416) (0.0132) (0.0119) (0.00869)
Political Constraints 0.106 0.105* 0.0432 0.0353 0.111 0.119* 0.0543(0.0705) (0.0628) (0.0485) (0.0588) (0.0730) (0.0671) (0.0507)
Common Law 0.121** 0.0800 0.0960** 0.0973***(0.0497) (0.0498) (0.0461) (0.0366)
Center-Right Government -0.0129 -0.0155 -0.00103 0.00007 -0.0110 -0.0182 -0.00998(0.0166) (0.0170) (0.0140) (0.0129) (0.0178) (0.0175) (0.0161)
ln(GDPperCapita) 0.0465 -0.0440 0.0239 0.00946 0.0813* -0.0944 0.00823(0.0306) (0.0316) (0.0175) (0.0119) (0.0427) (0.0640) (0.0259)
GDP growth (annual %) -0.00112 -0.000529 -0.00154 -0.000747 -0.00207 -0.000775 -0.00160*(0.00134) (0.00134) (0.000954) (0.00149) (0.00151) (0.00139) (0.000946)
Capital Account Openness -0.0914 -0.0344 -0.0989** -0.0789 -0.106 -0.0501 -0.0342(0.0755) (0.0725) (0.0488) (0.0483) (0.114) (0.0931) (0.0647)
log(Trade) 0.0605 0.0577 0.0385 0.0173 0.133* 0.0460 -0.00355(0.0422) (0.0471) (0.0312) (0.0254) (0.0709) (0.0945) (0.0393)
ln(Inflation) -0.00949 -0.00495 -0.00397 -0.00229 -0.0157** -0.00532 -0.00216(0.00626) (0.00763) (0.00529) (0.00645) (0.00671) (0.00776) (0.00509)
Banking Crisis 0.0950*** 0.0615*** 0.0766*** 0.0658*** 0.0902*** 0.0608*** 0.0529***(0.0165) (0.0207) (0.0156) (0.0208) (0.0190) (0.0227) (0.0175)
Stock Index volatility 0.00148** 0.000910 0.00102** 0.00130* 0.00130* 0.000492 0.000230(0.000748) (0.000955) (0.000507) (0.000667) (0.000758) (0.00105) (0.000520)
ln(Stock Traded) -0.0218** 0.0117 -0.0242*** -0.0257*** -0.0196 0.0194 -0.0375***(0.0104) (0.0130) (0.00755) (0.00865) (0.0128) (0.0156) (0.00934)
Constant -0.991** -0.314 -0.596*** -0.424** -1.588*** 0.225 -0.217**(0.397) (0.389) (0.222) (0.207) (0.570) (0.842) (0.0843)
Observations 480 480 480 480 480 480 404Overall R2 0.217 0.184 0.218 0.209 0.032 0.114 0.105Within R2 0.312 0.442 0.299 -- 0.321 0.446 0.187Year FE NO YES NO NO NO YES NONumber of countries 76 76 76 76 76 76 76
Huber/White Robust standard errors clustered by country in parentheses (*** p<0.01, ** p<0.05, * p<0.1)
45

Table 3.4 (DV: Executive Bias w/ County Fixed Effects)
(1) (2) (3) (4) (5) (6)VARIABLES Fixed
EffectsFixed
EffectsFixed Effects
Cochrane- Orcutt(AR1)
Fixed Effects
Fixed Effects
Fixed Effects Cochrane-
Orcutt(AR1)
Regulatory Independence 0.0866** 0.0640* -0.00832 0.104*** 0.0630* -0.00439(0.0383) (0.0381) (0.0413) (0.0326) (0.0333) (0.0417)
Regulatory Quality -0.0218 -0.0118 -0.0497(0.0458) (0.0485) (0.0364)
Electoral Competition 0.00408 0.00134 0.00637** 0.00466 0.00182 0.00685**(0.00381) (0.00327) (0.00264) (0.00407) (0.00348) (0.00268)
Rule of Law -0.000852 0.00359 0.00191 0.00122 0.00566 0.00538(0.0100) (0.00888) (0.00552) (0.00961) (0.00878) (0.00618)
Center-Right Government -0.0142 -0.0114 -0.00491 -0.00869 -0.00558 -0.00284(0.0191) (0.0160) (0.0121) (0.0178) (0.0151) (0.0133)
ln(GDPperCapita) 0.0875*** -0.118** -0.0135 0.101*** -0.108** -0.00831(0.0277) (0.0492) (0.0180) (0.0296) (0.0485) (0.0185)
GDP growth (annual %) -0.00544*** -0.00100 -0.00170*** -0.00553*** -0.000833 -0.00183***(0.00128) (0.00130) (0.000651) (0.00125) (0.00110) (0.000689)
Capital Account Openness -0.100 -0.0843 -0.0359 -0.157** -0.134** -0.0975*(0.0764) (0.0675) (0.0421) (0.0739) (0.0615) (0.0504)
ln(Trade) 0.171*** 0.0638 -0.0159 0.164*** 0.0818 -0.0119(0.0583) (0.0693) (0.0288) (0.0563) (0.0673) (0.0308)
ln(Stocks Traded) -0.0383*** 0.00124 -0.0460*** -0.0353*** 0.00291 -0.0441***(0.0114) (0.0132) (0.00695) (0.0118) (0.0134) (0.00742)
Constant -1.469*** 0.643 0.280*** -1.561*** 0.487 0.232***(0.413) (0.616) (0.0464) (0.407) (0.573) (0.0504)
Observations 733 733 632 640 640 540Overall R2 0.0013 0.101 0.120 0.001 0.092 0.117Within-R2 0.229 0.384 0.128 0.237 0.412 0.151Year FE NO YES NO NO YES NONumber of countries 101 101 99 100 100 97
Huber/White Robust standard errors clustered by country in parentheses(*** p<0.01, ** p<0.05, * p<0.1)
46
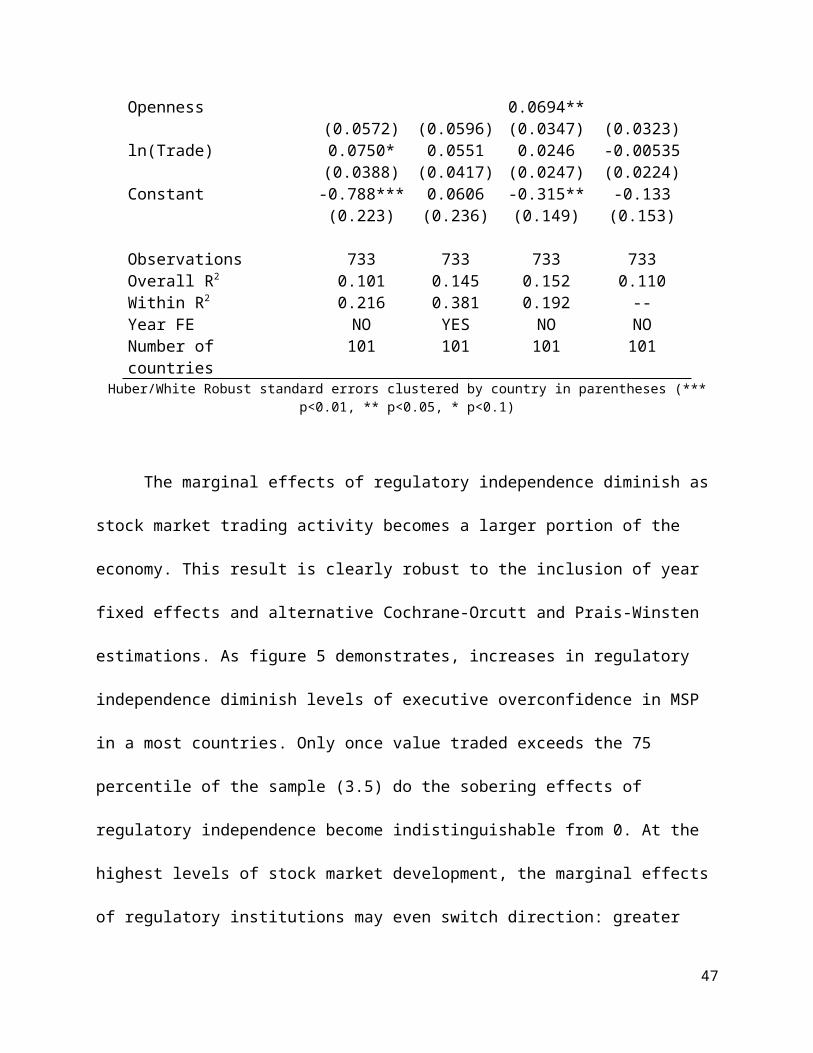
Table 3.5 (DV: Executive Bias/ Regulator Established Dummy)
(1) (2) (3) (1)VARIABLES Random GLS Random GLS Cochrane-
Orcutt(AR1)Prais-Winsten
w/PCSE
Regulator Established 0.0465 0.0274 0.0150 0.0251(0.0403) (0.0303) (0.0293) (0.0362)
Electoral Competition 0.00867** 0.00268 0.00687** 0.00850***(0.00400) (0.00312) (0.00275) (0.00316)
Rule of Law -0.00730 0.00676 -0.00283 -0.00236(0.00620) (0.00589) (0.00377) (0.00320)
Common Law 0.0614 -0.000143 0.0415 0.0309(0.0494) (0.0480) (0.0415) (0.0273)
Center-Right Government -0.0241 -0.0129 -0.00652 -0.00337(0.0184) (0.0154) (0.0114) (0.0102)
ln(GDPperCapita) 0.0448** -0.0673*** 0.0145 -0.00397(0.0174) (0.0208) (0.0118) (0.0112)
GDP growth (annual %) -0.00463*** -0.00145 -0.00278*** -0.00223*(0.00109) (0.00122) (0.000697) (0.00127)
Capital Account Openness -0.110* -0.0512 -0.0759** -0.0410(0.0592) (0.0600) (0.0349) (0.0351)
ln(Trade) 0.0805** 0.0551 0.0259 -0.000909(0.0392) (0.0421) (0.0250) (0.0249)
ln(Stocks Traded) -0.0399*** -0.000719 -0.0346*** -0.0285***(0.00938) (0.0117) (0.00621) (0.00867)
Constant -0.679*** 0.187 -0.201 0.00985(0.227) (0.237) (0.147) (0.150)
Observations 739 739 739 739Overall R2 0.204 0.377 0.176 0.083Within R2 0.052 0.111 0.109 --Year FE NO YES NO NONumber of countries 101 101 101 101Huber/White Robust standard errors clustered by country in parentheses (*** p<0.01, ** p<0.05, * p<0.1)
47

Table 3.6 (DV: Executive Bias/ Independence-Market Depth Interaction)
(1) (2) (3) (4) (5) (6)VARIABLES Country FE Country FE Country FE w/
Cochrane– Orcutt
Country FE Country FE Country FE w/ Cochrane–
Orcutt
Regulatory Independence 0.227*** 0.171*** 0.0287 0.369*** 0.323*** 0.241**(0.0722) (0.0605) (0.0752) (0.112) (0.108) (0.120)
ln(StockTraded) -0.00272 0.0282** -0.0369** 0.0278 0.0611*** -7.31e-05(0.0153) (0.0135) (0.0170) (0.0172) (0.0164) (0.0229)
Regulatory Independence x ln(StockTraded)
-0.0525**(0.0214)
-0.0400**(0.0180)
-0.0134(0.0229)
-0.0703**(0.0291)
-0.0624**(0.0279)
-0.0563*(0.0316)
Electoral Competition 0.00398 0.00126 0.00634** 0.0190*** 0.0134*** 0.0110**(0.00394) (0.00335) (0.00264) (0.00579) (0.00494) (0.00437)
Rule of Law -0.000863 0.00354 0.00172 0.00390 0.00988 0.0135(0.0100) (0.00887) (0.00553) (0.0134) (0.0120) (0.00866)
Center-Right Government -0.0140 -0.0113 -0.00496 -0.0114 -0.0186 -0.00963(0.0192) (0.0161) (0.0121) (0.0180) (0.0176) (0.0160)
Regulatory Quality -0.0766 -0.0581 -0.0610(0.0729) (0.0690) (0.0451)
Political Constraint 0.114 0.121* 0.0554(0.0729) (0.0669) (0.0505)
ln(GDPperCapita) 0.0843*** -0.119** -0.0151 0.0719* -0.108 0.00175(0.0272) (0.0489) (0.0182) (0.0420) (0.0650) (0.0261)
GDP Growth -0.00517*** -0.000837 -0.00165** -0.00181 -0.000469 -0.00160*(0.00129) (0.00131) (0.000658) (0.00153) (0.00142) (0.000943)
Capital Account Openness -0.107 -0.0901 -0.0340 -0.111 -0.0544 -0.0173(0.0760) (0.0675) (0.0422) (0.113) (0.0924) (0.0651)
ln(Trade) 0.168*** 0.0625 -0.0167 0.131* 0.0384 -0.0114(0.0581) (0.0688) (0.0288) (0.0708) (0.0947) (0.0394)
ln(Inflation) -0.0149** -0.00503 -0.000977(0.00662) (0.00765) (0.00511)
Bank Crisis 0.0905*** 0.0605*** 0.0504***(0.0192) (0.0225) (0.0175)
Stock Index Volatility 0.00121 0.000370 0.0001(0.000765) (0.00106) (0.000523)
Constant -1.520*** 0.585 0.273*** -1.656*** 0.237 -0.258***(0.407) (0.612) (0.0466) (0.545) (0.827) (0.0845)
Observations 733 733 632 480 480 404Overall R2 0 0.108 0.124 0.0615 0.1307 0.123Within R2 0.224 .373 0.129 .307 .4273 0.196Year FE NO YES NO NO YES NONumber of countries 101 101 99 76 76 76
Huber/White Robust standard errors clustered by country in parentheses (*** p<0.01, ** p<0.05, * p<0.1)
48
Table 3.7(DV: Executive Bias: Independence-Market Interaction with Volatility Control)
(1) (2) (3) (4)VARIABLES Random Effects Random Effects GLS Cochrane–
OrcuttPrais-Winsten w/
PCSE
Regulatory Independence 0.419*** 0.354*** 0.327*** 0.395***(0.0912) (0.0826) (0.0964) (0.0987)
ln(StockTraded) 0.0365** 0.0589*** 0.0251 0.0394**(0.0161) (0.0146) (0.0198) (0.0187)
Regulatory Independence x Stock Traded
-0.0839***(0.0242)
-0.0693***(0.0228)
-0.0722***(0.0268)
-0.0926***(0.0257)
Electoral Competition 0.0215*** 0.0153*** 0.0152*** 0.0167***(0.00462) (0.00343) (0.00425) (0.00430)
Regulatory Quality -0.0969 -0.0667 -0.0683** -0.0597**(0.0619) (0.0567) (0.0323) (0.0289)
Rule of Law -8.66e-05 0.00841 0.00341 0.00332(0.00916) (0.00865) (0.00516) (0.00417)
Political Constraint 0.106 0.105* 0.0424 0.0285(0.0705) (0.0625) (0.0482) (0.0587)
Common Law 0.130*** 0.0892* 0.105** 0.107***(0.0492) (0.0493) (0.0455) (0.0349)
Center0Right Government -0.0128 -0.0153 -0.000561 0.00167(0.0170) (0.0172) (0.0139) (0.0130)
ln(GDPperCapita) 0.0413 -0.0458 0.0217 0.00832(0.0296) (0.0311) (0.0174) (0.0115)
GDP Growth -0.000818 -0.000263 -0.00141 -0.000555(0.00136) (0.00136) (0.000950) (0.00148)
Capital Account Openness -0.0931 -0.0367 -0.0936* -0.0752(0.0738) (0.0711) (0.0484) (0.0476)
ln(Trade) 0.0559 0.0542 0.0344 0.0101(0.0423) (0.0470) (0.0309) (0.0237)
ln(Inflation) -0.00942 -0.00512 -0.00365 -0.00189(0.00616) (0.00749) (0.00526) (0.00657)
Bank Crisis 0.0955*** 0.0621*** 0.0755*** 0.0656***(0.0167) (0.0206) (0.0155) (0.0199)
Stock Index Volatility 0.00135* 0.000829 0.000899* 0.00117*(0.000750) (0.000960) (0.000507) (0.000656)
Constant -1.112*** -0.436 -0.709*** -0.563***(0.374) (0.371) (0.224) (0.214)
Observations 480 480 480 480Overall R2 0.321 0.218 0.248 0.232Within R2 0.249 0.447 0.308 --Year FE NO YES NO NONumber of countries 76 76 76 76
Huber/White Robust standard errors clustered by country in parentheses (*** p<0.01, ** p<0.05, * p<0.1)
49
Table 3.8
(1) (2) (3) (4) (5) (6)VARIABLES Random
EffectsCountry FE Random
EffectsCountry FE GLS Cochrane–
OrcuttPrais-Winsten
w/ PCSE
Regulator Established 0.122* 0.104 0.0690 0.0506 0.0653 0.0745(0.0647) (0.0652) (0.0518) (0.0612) (0.0470) (0.0627)
ln(Stock Traded) -0.0111 -0.0121 0.0149 0.0127 -0.0131 -0.00696(0.0127) (0.0135) (0.0136) (0.0152) (0.0169) (0.0213)
Regulator Established x ln(Stock Traded)
-0.0305**(0.0135)
-0.0290**(0.0142)
-0.0168(0.0139)
-0.0122(0.0151)
-0.0233(0.0170)
-0.0229(0.0217)
Electoral Competition 0.00859** 0.00404 0.00265 0.00128 0.00682** 0.00866***(0.00401) (0.00385) (0.00313) (0.00328) (0.00275) (0.00322)
Rule of Law -0.00703 0.00103 0.00682 0.00466 -0.00273 -0.00236(0.00620) (0.0101) (0.00589) (0.00884) (0.00377) (0.00315)
Common Law 0.0627 0.00108 0.0432 0.0328(0.0495) (0.0479) (0.0414) (0.0268)
Center-Right Government -0.0238 -0.0171 -0.0128 -0.0124 -0.00641 -0.00326(0.0184) (0.0187) (0.0154) (0.0155) (0.0113) (0.0103)
logGDPcapCur 0.0452**(0.0176)
0.0916***(0.0284)
-0.0662***(0.0208)
-0.117**(0.0488)
0.0154(0.0118)
-0.00323(0.0111)
GDP Growth -0.00452*** -0.0053*** -0.00141 -0.000836 -0.00273*** -0.00220*(0.00109) (0.00128) (0.00122) (0.00129) (0.000697) (0.00128)
Capital Account Openness -0.111*(0.0593)
-0.110(0.0768)
-0.0519(0.0602)
-0.0873(0.0680)
-0.0758**(0.0349)
-0.0406(0.0347)
ln (Trade) 0.0789** 0.170*** 0.0545 0.0615 0.0252 -0.00161(0.0391) (0.0588) (0.0419) (0.0692) (0.0250) (0.0242)
Constant -0.749*** -1.546*** 0.141 0.636 -0.254* -0.0429(0.227) (0.409) (0.240) (0.601) (0.152) (0.161)
Observations 739 739 739 739 739 708Overall R2 0.056 0.003 0.1139 0.0944 0.1103 0.086Within R2 0.207 0.227 0.378 0.360 0.178 --Year FE NO NO YES YES NO NONumber of countries 101 101 101 101 101 100
Huber/White Robust standard errors in parentheses clustered by country (*** p<0.01, ** p<0.05, * p<0.1)
50

Appendix III
II. Independence Variable Measurement Model
Item-response models are analogous to factor analysis models with item-discrimination
parameters resembling factor loadings. However, factor analysis models do a poor job with
ordinal data since they assume that conditional on the latent scores the indicators have a
multivariate normal distribution (Jackman and Treier 2008). This is not true of my ordinal and
categorical indicators. The IRT toolkit is substantial and offers a variety of models fit for
different kinds of question and response formats. My data collection involved gauging whether
financial legislation did or did not confer particular powers or structures upon regulatory
organizations as well as whether they gave RAs greater or lesser formal protection from political
interference. Using the terminology of IRT, my statutory “tests” of formal independence
contained both dichotomous (yes/no) and polytomous (>2 ordered categories) response items. A
graded response model was selected for several reasons. First, it can accept both polytomous
items with differing numbers of response options (unlike a rating scale model) and dichotomous
items making it preferable to a standard latent trait model, Rasch Model, or a Mokken scaling
procedures. Second, unlike a partial credit model, it does not assume that the difference between
response options is identical for different items. Finally, a graded response model is a two
parameter model that produces values that are analogous to item difficulties (extremity
parameters) as well as discrimination parameters for each item. The latter indicate the degree to
which a particular indicator discriminates between regulatory organizations with greater or lesser
51

independence. As a result, my measure of independence is “weighted” with more discriminatory
item indicators having a larger impact on the final latent independence “factor” score.
Using the R package mirt, I fit an unconditional maximum likelihood factor analysis
model for graded responses using both the Expectation-Maximization and Metropolis-Hastings
Robbins-Monro algorithms (results nearly identical). Since I am analyzing only one concept,
independence, I selected a two parameter unidimensional model and estimate parameters using
the Expectation-Maximization approach outlined by Bock and Aitkin (1981). All indicators were
highly discriminatory on the 1 dimension. Once country level latent independence scores were
produced, I normalized them onto a [0,1] scale for ease of interpretation. 0 indicates regulation
conducted completely by political actors and 1 indicates the maximum level of independence
found in the sample. All of my independence indicators and their discrimination parameters can
be found below:
Regulatory Independence Item Indicators w/Discrimination Parameters
1) Agency Head Term Length
Discrimination Parameter: 5.120
0 – No fixed term or term length at discretion of appointer
1 -- < 4 year term
2-- 4 or 5 year term
3-- 6 years or greater
2) Board Term Length
52
Discrimination Parameter: 4.924
0 -- No fixed term or term length at discretion of appointer
1-- < 4 year term
2 -- 4 or 5 year term
3 -- 6 years or greater
3) Board Appointments Staggered
Discrimination Parameter: 2.079
0—No
1 – Yes
4) Agency Head Appointment Procedure
Discrimination Parameter: 5.272
0 -- Executive Officials alone or executive official with non-binding consultation with
actors outside of the executive
1 -- Parliament/Legislative Body Alone
2 -- More than one veto player must agree or more than one actor has
appointment power (e.g. nominated by executive branch and confirmed by legislative branch,
majority decision of agency board which must then be approved by another actor, executive must
select from a list provided by outside group and cannot ignore or demand a new list)
2—Selection by another regulator that is separate from the
executive bureaucracy or selection by Central Bank
53

3- Board selects agency head and the selection was
not subject to prior approval by a political actor
5) Board Appointment Procedure
Discrimination Parameter: 3.638
0 -- Executive Officials alone or executive official with non-binding consultation with
actors outside of the executive
1 -- Parliament/Legislative Body Alone
2 -- More than one veto player must agree or more than one actor has
appointment power (e.g. nominated by executive branch and confirmed by legislative branch,
majority decision of agency board which must then be approved by another actor, executive must
select from a list provided by outside group and cannot ignore or demand a new list)
2—Selection by another regulator that is separate from the
executive bureaucracy or selection by Central Bank
3—Agency Head selects board and the selection
was not subject to prior approval by a political actor
6) Agency Head Removal
Discrimination Parameter: 5.827
0 -- Executive Officials alone or executive official with non-binding consultation with
actors outside of the executive
1 -- Parliament/Legislative Body Alone
54

2 -- More than one veto player must agree
2—Removal by another regulator that is separate from the
executive bureaucracy or removal by Central Bank
3 – Decision of the Agency Board or Judiciary
Alone
7) Board Member Removal Procedure
Discrimination Parameter: 3.780
0 -- Executive Officials alone or executive official with non-binding consultation with
actors outside of the executive
1 -- Parliament/Legislative Body Alone
2 -- More than one veto player must agree
2—Removal another regulator that is separate from the executive
bureaucracy or removal by Central Bank
3 – Decision of the Agency Board or Judiciary Alone
8) Chief Executive or Management Board Appointment Procedure
Discrimination Parameter: 4.862
0 -- Executive Officials alone or executive official with non-binding consultation with
actors outside of the executive
1 -- Parliament/Legislative Body Alone
2 -- More than one veto player must agree or more than one actor has
appointment power (e.g. nominated by executive branch and confirmed by legislative branch,
55

nominated by agency and confirmed by executive or legislative branch, selection from a list
provided by outside group and political appointer cannot ignore or demand a new list)
2—Selection by another regulator that is separate from the
executive bureaucracy or selection by Central Bank
3 – Agency Alone
9) Chief Executive/Management Board Removal Procedure
Discrimination Parameter: 5.001
0 – Executive or Legislative Officials alone or executive/legislature with non-binding
consultation with actors outside of the executive
1 -- More than one veto player must agree
1—Removal by another regulator that is separate from the executive bureaucracy or removal by
Central Bank
2 --Decision of the Agency Board or Judiciary Alone
10) Chief Executive or Management Board Term Length
Discrimination Parameter: 4.964
If appointed by actors outside of agency
0 – <3 years or no term length.
1 – 3 or 4 years
2—4 or 5 years years
3-- ≥6 years
If appointed by agency
56

3 -- At agency’s discretion alone
11) Government Ex-Officio Membership
Discrimination Parameter: 4.930
0 – More than 1 elected/government officials are ex-officio members of agency
supervisory/executive board
1 – 1 elected/government official sits on agency supervisory/executive board
2 – No elected/government officials are ex-officio members of agency
supervisory/executive board
Note: Observers are not considered Ex-Officio Members, only those with voting, that ability to
require second deliberations, or formal agenda setting power are counted as Ex-Officio members
12) Outside Regulator Ex-Officio Membership
Discrimination Parameter: 5.293
0 – More than 1 outside regulatory official is ex-officio member of agency
supervisory/executive board (includes central bankers)
1 – 1 outside regulatory official sits on agency supervisory/executive board
2 – No outside regulatory officials are ex-officio members of agency
supervisory/executive board
Note: Observers are not considered Ex-Officio Members, only those with voting, that ability to
require second deliberations, or formal agenda setting power are counted as Ex-Officio members
57

13) Budgetary Independence
Discrimination Parameter: 2.108
0 – Agency is partially or completely dependent upon government
1 – Agency has complete budgetary independence from government and (%>90) of
funding comes from industry fees, levies, tariffs, penalties, and grants from NGOs.
14) Budget Allocation Approval
Discrimination Parameter: 2.006
0 – Planned agency budget expenditures and/or allocations must be approved by elected
officials 1 – Planned agency budget expenditure and allocations are not subject to ex ante
approval of elected officials
15) Rule Approval
Discrimination Parameter: 3.552
0 – Ministers/executive/legislative officials are the dominant issuers of regulations or write a
majority of rules.
1 – Regulatory agency makes rules and issues regulations, but all regulations and rules
must be approved or can be vetoed by executive officials, ministers of finance, or legislative
committees
2-- Regulatory agency is a significant rule maker, but executive officials retain rulemaking
power over select areas of substantive importance
58

3 – Regulatory agency is the dominant regulatory rule maker; executive officials do NOT have
veto power over issued regulations and retain a minor to nonexistent role in rulemaking.
16) Government Directions
Discrimination Parameter: 5.675
0 – Government can issue binding directions to agency about SPECIFIC policies, rules, and
cases of enforcement
1 – Government can issue binding directions to agency about GENERAL policy issues
and priorities
2 – Government CANNOT issue binding directions of any form to agency
17) Statement of Independence
Discrimination Parameter: 3.413
0 -- No explicit statement of agency independence or autonomy from government
officials/ministries within agency statute
1 – Explicit statement of agency independence or autonomy from government
officials/ministries within agency statute
18) Ban on Political/Partisan Officials
Discrimination Parameter: 3.015
0 -- No explicit ban on agency officials holding other positions/membership within
government, political, or partisan organizations
59

1 – Explicit ban on agency officials holding other positions/membership
within government, political, or partisan organizations
19) Agency Head Term Renewal
Discrimination Parameter: 2.439
0 – No limits on term renewal
1 – Agency head term can only be renewed once
2 – Agency head can serve for only one term
20) Board Member Term Renewal
Discrimination Parameter: 2.504
0 – No limits on term renewal
1 – Board member term can only be renewed once
2 – Board member can serve for only one term
21) Chief Executive/Management Board Term Renewal
Discrimination Parameter: 1.707
0 – No limits on term renewal
1 – Management member term can only be renewed once
2 – Management member can serve for only one term
22) Political Dismissal Language
60

Discrimination Parameter: 3.037
0—Serve at will of appointer or no policy specified
1—Language is broader and does NOT indicate that dismissal involves
ONLY gross incompetence, criminal guilt, or financial insolvency; language does not rule out
dismissal on grounds of policy disagreement
2 – Language indicates dismissal can ONLY be based upon gross
incompetence or negligence, criminal guilt, or financial insolvency
23) Annual Report Reception
Discrimination Parameter: 3.270
0 – Report sent to minister or executive branch alone
1 – Report sent to both minister/executive branch AND a legislative body
2 – Report sent to parliament/legislature only
3 -- Report sent to a specialized government auditing body,
comptroller, Central Bank, or no specific requirement
24) Fee Approval
Discrimination Parameter: 2.342
0 – Fees and levies of agency are either decided or must be approved by an executive official
1 – Fees and levies of agency determined by legislative statute or must be approved by
legislative committees
61

2 – Agency can has full autonomy to decide its own fee schedule, tariff levels, and
penalties
25) Organizational Approval
Discrimination Parameter: 2.634
0 – Organizational structure of agency is either decided or must be approved by an executive
official
1 – Organizational structure of agency determined by legislative statute or must be
approved by legislative committee
2 – Agency can has full formal autonomy to decide its own
organizational structure
Transformed Item Parameters*
62

Indicator Factor Loading h2 (Communality)Agency Head Term 0.949 0.901Board Term 0.945 0.893Board Apt. Staggered 0.774 0.599Agency Head Apt. 0.952 0.906Board Apt. 0.906 0.820Agency Head Removal 0.960 0.921Board Remocal 0.912 0.831Executive Manager/Board Apt. 0.944 0.891Executive Manager/Board Removal 0.947 0.896Executive Manager/Board Term 0.946 0.895Government Official Ex-Officio 0.945 0.894Regulator Ex-Officio 0.952 0.906Budget Source 0.778 0.605Ex-Ante Budget Allocation Approval 0.762 0.581Rulemaking 0.902 0.813Government Directions 0.958 0.917Explicit Statement of Independence or Autonomy 0.895 0.801Ban on Political Officials or Activities 0.871 0.758
Agency Head Appointement Renewal 0.820 0.672Board Appointement Renewal 0.827 0.684Executive Manager/Board Apt. Removal 0.708 0.501Dismissal Language 0.872 0.761Annual Report Reception 0.887 0.787Fee/Tariff Approval 0.809 0.654Organization Approval 0.840 0.706
*transformed into traditional factor analysis loadings metric according to procedure outlined by Bock et al. 1988.
Coding Notes:
63

General Rules: If a regulatory organization is headed by only one individual such as a
superintendent, s/he is coded as both the agency head and board unless that organization remains
within the executive bureaucracy (see Guatemala). Assistant and/or deputy superintendents are
coded as executive managers/non-supervisory management boards. If a particular regulatory
organization was a part of a larger regulatory organization, they were coded together if their
structures of governance overlapped AND the larger umbrella organization has substantive day-
to-day regulatory responsibilities over industry actors. Umbrella organizations whose only
responsibilities are overseeing other regulators, coordinating regulatory policy, deciding appeals,
or adjudicating jurisdictional disputes are not coded as stock market regulators.
Austria: Securities Supervision Law (Wertpapieraufsichtsgesetz) No 753 of 1996 established the
Austrian Securities Authority (Bundes-Wertpapieraufsicht). The Authority was headed by a
director and the director can then select a senior deputy. Their selection had to be approved by
the finance minister. The director was coded as the agency head and board, but the deputy is
treated as an executive manager. There is a financial advisory board to which the Authority must
submit financial information due to the Authority’s dependence upon funding from the financial
industry. However, I do not code them as an agency board due to their “advisory” capacity
regarding only Authority finances and their lack of participation in substantive regulatory issues.
Bahrain: Central Bank becomes regulator in 2006. (Monetary Authority had limited regulatory
authority as of 2002). Governor is treated as executive board, because the supervisory board has
a chairman with tie breaking power. Language explicitly states that the governor is accountable
to the board and the board decides his remuneration. Coding the regulator as of 2006 instead of
2002 does not alter the results.
64

Bolivia: The original Securities Commission was integrated into the Financial Regulation
System (SIREFI) in 1996. SIREFI was overseen by a head Superintendent (appointed for 10
years) who played a coordinating, judicial (appeal), and oversight role over several sector based
financial regulatory organizations. The securities commission retained its powers over stock
markets so it was coded separately from SIREFI just like any other regulator. A Superintedency
of Pensions, Securities and Insurance (SPVS) is established in 1998 and is a melding of three
previous sectoral regulators and replaces the Securities Commission. The head superintendent is
appointed by the president for a term of 6 years. The superintendent then appoints section heads
of insurance, securities, and pensions and they enjoy no fixed terms. I treat these section heads as
executive/management board members. The SPVS became a part of a larger Superintendencia de
Recursos Jerárquicos (SERESI) in 1998, but this organization served only as a final venue of
administrative repeal. In 2002, the Bonsol act was passed. This restored the SIREFI’s
supervisory power particularly over the budget of the SPVS and created a Superintendent of
Companies in charge company registration, competition, and corporate governance. Despite their
partially overlapping jurisdiction, both the Superintendent of Companies and the SPVS enjoy
identical levels of independence. In 2005, there was a slight amendment that altered reporting
requirements for both Superintendents. In all cases the Superintendencies were coded as separate
from both SIREFI and SERESI because neither of the latter have day to day responsibilities over
securities regulation.
Chile: Only one Superintendent.
China: The Regulator is coded from 1999 on, because they didn’t receive the mandate to act as a
regulator until December 28th 1998. They existed in 1992, but shared regulatory authority with
the executive and were considered the executive arm of the Securities Committee of the State
65

Council. Quote “the securities operators at that time were still under the management of People’s
Bank of China and the stock exchange in Shanghai and Shenzhen still administratively belonged
to the regional government, while its operations were still under the management of CSRC.
These two governing bodies frequently contradicted each other. Moreover, there were some
offices under the Securities Committee which did almost the same job as the CSRC. The
supervisory rights of the People's Bank of China in this area were handed over to CSRC in 1997.
In 1998, the Securities Committee merged with the CSRC, and the Stock Exchanges in both
Shanghai and Shenzhen both fell under the regulation of the CSRC. After six years of changes
and adjustments, the new securities regulation structure was officially established in October
1998” (ASLI Working Paper No. 005, pg 5-6). Securities Law 1999 was adopted at the 6th
Session of the Standing Committee of the 9th National People's Congress in December 29th
1998, and was brought into force in July 1st 1999
Colombia: Only one superintendent. There is a presidentially appointed advisory board.
However, their opinions are not binding upon the superintendent. Due to their lack of power,
they are not coded as a board.
Costa Rica: I code CONASIFF as the regulator and treat the board and chairman as the
supervisory board and agency head respectively. The Superintendent of Securities is coded as the
executive manager/executive board because of their operation role, the fact that they have only a
voice rather than a formal vote in CONASIFF deliberations, and his/her subordination to
CONASIFF and the Central Bank of Costa Rica.
66

Cyprus:: Securities and Cyprus Stock Exchange Law No 14(I) of 1993 established a Securities
Commission, but it remained a body of the Ministry of Finance, was operationally subordinated
to the MoF, and it was headed by a senior official of the MoF
Dominican Republic. According to the 2000 Securities Law, there is both a Superintendency of
Securities and a National Council on Securities. Given the close administrative connection
between the two organizations, I treat them as one organization. The Superintendent and senior
director of the Superintendency (mayor) are coded as the executive management board because
they are subordinated to the National Council of Securities and the Superintendent is on the
board of the NCS. The National Council of securities is treated as the board. The NCS is
presided over by an Executive (Governor or Lieutenant Governor) of the Central Bank so s/he is
treated as the agency head. The Dominican Republic has no data on the dependent variable, so
separate coding of the organizations does not affect the results.
Ecuador: Ecuador had both a Superintendent of Companies with authority over stock markets as
well as a National Council of Securities made up of both public and private members. Since the
Superintendent Presides over the council, I treated the Council as the regulatory body with the
Superintendent treated as the agency head and the other members of the council as the board.
El Salvador: Has a Superintendent with a board. The Superintendent is treated as the agency
head because s/he presides over board meetings and is the legal representative of the regulator.
France: From 1988 until 2002, the coded regulator is the Commission des Opérations de Bourse
(COB). For robustness, I substituted the Conseil des marchés financiers (CMF) for the COB
from 1996 until 2002. Although the COB remained a regulator of stock exchanges, the CMF had
a wider mandate regulating all financial service providers (with the exception of collective
67

investment funds). The COB and CMF had very similar independence scores ( .737 vs. .728) and
replacing the COB with the CMF did not alter the results.
Guatemala: Although apart of the Ministry of Economic Affairs, the Securities and
Commodities Markets Registry (Registro del Mercado de Valores y Mercancías) was given non-
0 minimum scores because it was explicitly granted technical and functional autonomy (“gozará
de plena autonomía técnica y functional”). Its president is appointed by multiple veto players,
serves a six year term, and enjoys some protection from policy based dismissal. See articles 8-17
Decreto 34-96 (Ley Del Mercado de Valores Y Mercancias). However, it received all minimum
scores for categories regarding the board and chief executive personnel, because only the head of
the registrar enjoys any protections from dismissal and the registry remains within an executive
ministry. For robustness, I reran the analyses in which the Securities Registrar was treated as
simply another part of the Ministry of finance (i.e. all minimum scores). This did not alter the
results.
Kazakstan:: As of 2003 (with Amendments in 2005) I coded Financial Market and Financial
Organizations of the Republic of Kazakhstan on Regulation and Supervision Agency until 2010.
The authority was subordinated to the Central Bank of Kazakstan. However, in 2007 a new
Agency that had jurisdiction over the Regional Financial Centre 0f Almaty was established.
Since the KASE was reregistered within the Financial Centre in 2007, both regulatory
organizations had regulatory jurisdiction over the exchange. For instance, the statute states that
the Centre regulator should “determine the conditions and procedure of listing and de-listing of
financial instruments with the trade organizer of the special trading floor of the Financial Center
by agreement with the Agency for Regulation and Supervision of the Financial Market and
Financial Organizations.” Coding the Almaty Financial authority does not alter the results.
68

Papua New Guinea: The Securities Commission consists of only 1 individual (i.e. chairman)
and staff. The Commission is housed within the Papua New Guinea Investment Promotion
Authority (IPA). I code the IPA as the main regulatory body and the Securities Commissioner as
the Chief Executive (and not the agency head) of the Authority with regard to the securities
markets.
Venezuela: In 2010 a new securities law was passed and it reorganized the National Securities
Superintendency under the direction of the National Superintendent of Securities who is
appointed by the president. The Superintendent could then select a deputy superintendent to
whom they could delegate power and this deputy does not face a formal approval procedure. The
deputy is coded as the executive manager and the Superintendent is coded as both the agency
head and board. The Superintendency is under the direct supervision of and under subordination
to Órgano Superior del Sistema Financiero Nacional (OSFIN). OSFIN is a part of the executive
bureaucracy although it has members with finite terms and some protection from dismissal.
Since the Superintendency plays no part in the governance of OSFIN and has no say over OSFIN
policies, OSFIN and the Superintendency are not coded together. For robustness, I reran the
analyses with OSFIN as the coded regulator and results remained virtually identical.
69
Related Documents


