© Product Development Institute Inc. 2000-2013 Product Development Institute Inc. and Stage-Gate are registered trademarks. Logo for Product Development Institute Inc. used under license by Stage-Gate International Logo for Stage-Gate used under license where appropriate. Product Innovation Best Practices Series Best Practices in the Idea-to-Launch Process and Its Governance Reference Paper #45 Robert G. Cooper and Scott J. Edgett Compliments of: Stage-Gate International and Product Development Institute Inc. This article appeared in Research Technology Management March-April, pp 43-54 For information call +1-905-304-8797 www.stage-gate.com © Copyright 2000-2013 Product Development Institute Inc. www.stage-gate.com

wp_45
Nov 28, 2015
Best Practices in the Idea-to-Launch
Process and Its Governance
Process and Its Governance
Welcome message from author
This document is posted to help you gain knowledge. Please leave a comment to let me know what you think about it! Share it to your friends and learn new things together.
Transcript

© Product Development Institute Inc. 2000-2013 Product Development Institute Inc. and Stage-Gate are registered trademarks.
Logo for Product Development Institute Inc. used under license by Stage-Gate International Logo for Stage-Gate used under license where appropriate.
Product Innovation Best Practices Series
Best Practices in the Idea-to-Launch
Process and Its Governance
Reference Paper #45 Robert G. Cooper and Scott J. Edgett
Compliments of: Stage-Gate International and Product Development Institute Inc. This article appeared in Research Technology Management March-April, pp 43-54
For information call +1-905-304-8797 www.stage-gate.com
© Copyright 2000-2013 Product Development Institute Inc. www.stage-gate.com
Research-Technology Management • March—April 2012 | 43
Numerous studies have probed why some new products are great successes while others fail commercially. These investi-gations have identifi ed a myriad of success drivers, including developing a differentiated product with a compelling value proposition; building in the voice-of-the-customer input; un-dertaking the front-end homework; seeking sharp, early product defi nition; providing adequate resourcing; and rely-ing on an effective cross-functional development team. (For a review of these studies, see Cooper, in press ). A number of
organizations have built these success drivers into their de-velopment methodologies in the form of a structured idea-to-launch process or system, such as Stage-Gate® ( Koen 2003 ; Grőlund, Rőnneberg, and Frishammar 2010 ; Adams and Hubilkar 2010 ; DOE 2007 ; Cooper 2011 ). 1
Similarly, other studies have probed why some businesses are so successful at new-product development, while others are not (see, for instance, Cooper, Edgett, and Kleinschmidt 2003 , 2004a , 2004b , 2005 ; Adams 2004 ; Jaruzelski, Dehoff, and Bordia 2005 ). Many success factors have been uncov-ered in these benchmarking studies, including having a prod-uct innovation and technology strategy to guide development efforts, fostering the right climate and culture for innovation, implementing effective ideation practices, putting the neces-sary resources in place and investing in the right projects (portfolio management), and having an effi cient idea-to-launch system ( Jaruzelski, Dehoff, and Bordia 2005 ; Cooper and Mills 2005 ; Cooper, in press ).
A recurring best-practice theme is the use of some form of gating process. For example, a global study of 1,000 fi rms revealed that “it’s the process, not the pocketbook. Superior results seem to be a function of the quality of an organiza-tion’s innovation process—the bets it makes and how it pur-sues them—rather than the magnitude of its innovation
Robert G. Cooper is president of the Product Development Institute. He is a professor emeritus in McMaster University’s DeGroote School of Business, ISBM Distinguished Research Fellow at Penn State University’s Smeal Col-lege of Business Administration, and a Crawford Fellow of the Product De-velopment and Management Association. A thought leader in the fi eld of product innovation management and developer of the Stage-Gate® new-product development process, he has won two IRI Maurice Holland awards and has published over 120 articles and ten books. He received his PhD in business administration from the University of Western Ontario and Bache-lors and Masters degrees in chemical engineering from McGill University. [email protected]
Scott J. Edgett is CEO and co-founder of the Product Development Insti-tute and Stage-Gate, International. He is also a faculty scholar with ISBM at Penn State University’s Smeal College of Business Administration. A special-ist in new-product development and portfolio management, he received his PhD in marketing from Bradford University. He has consulted and written extensively in the fi eld, with over 60 published articles and seven books. His latest book (co-authored with Robert Cooper) is Product Innovation and Technology Strategy (BookSurge, 2009). [email protected]
DOI: 10.5437/08956308X5502022
Best Practices in the Idea-to-Launch Process and Its Governance A study of new-product development practices at 211 businesses provides insights into best practices in both the idea-to-launch process and its governance.
Robert G. Cooper and Scott J. Edgett
OVERVIEW: Most fi rms now use some form of idea-to-launch process such as a Stage-Gate® system. The question is: Do these processes really work? And what are the elements of a best-in-class idea-to-launch system that really make a differ-ence? A second and related question concerns the governance of the idea-to-launch model. Sadly there is a lack of hard evi-dence as to what governance structure works best and just what its impact is, if any. This article reports the results of an American Productivity & Quality Center (APQC) and Product Development Institute (PDI) study of 211 businesses with a focus on performance metrics and practices. Top performing businesses are identifi ed, and those practices that distinguish these businesses from the rest are probed. The article provides insights into best practices in both the idea-to-launch process and its governance that are strongly connected to positive innovation performance.
KEYWORDS: Idea-to-launch process , New-product development , Metrics , Stage-Gate®
1 Stage-Gate® is a registered trademark of the Product Development Institute Inc.
© Copyright 2000-2012 Product Development Institute Inc. www.stage-gate.com© Copyright 2000-2013 Product Development Institute Inc. www.stage-gate.com

44 | Research-Technology Management Best Practices in Idea-to-Launch
spending” ( Jaruzelski, Dehoff, and Bordia 2005 , 11). Another more recent and large-scale study notes that “effective inno-vators tightly manage the innovation process. As they execute the four principal elements of innovation—ideation, project selection, product development, and commercialization—every company Booz Allen Hamilton talked to had a disci-plined Stage-Gate process combined with regular measurement of everything from time and money spent in product de-velopment to the success of new products in the market” ( Booz Allen Hamilton 2007 ). Other studies also note the wide reliance on some form of idea-to-launch process such as a Stage-Gate system ( Griffi n 1997 ; APQC 2002 ; Cooper, Edgett, and Kleinschmidt 2003 , 2005 ; Koen 2003 ; Adams 2004 ; Mills 2007 ; Grőlund, Rőnneberg, and Frishammar 2010 ).
The question is, do these processes really work? And what elements of a best-in-class idea-to-launch system really make a difference? For example, there is some debate about the optimal level of fl exibility in such a system, or whether there should be different versions of the process to accommodate different types of development projects versus a one-size-fi ts-all model. A second and related question concerns the gover-nance of the idea-to-launch model. A study by A.C. Nielsen revealed that for consumer products, a system consisting of “rigorous gates, scorecards and a governance body” works much better than looser gates with heavy executive involve-ment, achieving a remarkable six times the performance in terms of annual sales from new products ( Agan 2010 ). Ad-ditional anecdotal evidence also suggests that the governance system is critical. Sadly there is a lack of hard evidence to sug-gest what governance structure works best and just what the impact of governance is, if any.
The Study In 2011, the American Productivity & Quality Center (APQC) and the Product Development Institute (PDI) undertook a study to explore these questions, among others. 2 The pur-pose of the study was to identify best practices as they pertain to the idea-to-launch model; in particular, the research sought to answer two key questions: 1. Do Stage-Gate processes really work, and what facets of
these systems really make a difference? 2. What type of governance structure works best for such
processes? Via a two-step data collection process that included both de-tailed questionnaires and in-depth site visits (see “How the Study Was Done,” above), the study sought information about the idea-to-launch practices of 211 best-performing business units in a range of industries ( Table 1 ). Business units in the study population have median sales of $1 billion and a median workforce of 2,500 employees. Median R&D spending for participating businesses is 4.0 percent of sales.
Identifying Best Performers Identifying best and worst performers is the basis of a valid benchmarking study. Comparing the practices used by best versus worst performers allows researchers to zero in on drivers of performance and identify best practices. There are many metrics that measure a business’s performance at new-product development, and some of these were considered in this study, including popular but problematic ones.
TABLE 1 . Industry representation of participating businesses.
Industry/Sector% of Respondent Businesses
Consumer goods 18.5
Healthcare products, supplies, equipment 6.6
Industrial, equipment, mechanical (B2B) 20.4
Chemical, including polymers 7.1
Telecommunications equipment 5.7
Electronics/computers 4.3
Software 4.3
Other business-to-business 7.1
Services 15.6
Other 10.4
How the Study Was Done
In the fi rst part of the study, researchers distributed a de-tailed, lengthy quantitative questionnaire asking about companies’ idea-to-launch processes to AQPC member companies indicating an interest in product innovation and to the PDI membership mailing list. In total, 257 compa-nies responded to the e-mail solicitation. Refi nement of the data sample plus the removal of small organizations led to a useable sample of 211 respondents. Question-naire respondents included a mix of people ranging from executives to process managers.
Best-performing businesses were identifi ed from an analysis of three performance metrics, namely overall new-product productivity, the degree to which new products met the business’s profi t objectives, and the degree to which new products met sales objectives. The practices as-sociated with these best-performing businesses were iden-tifi ed as best practices and their impact on performance quantifi ed.
The second part of the study involved in-depth site vis-its at a select set of businesses identifi ed as having superb practices. These fi rms were selected by an expert panel based upon a detailed screening questionnaire. Site vis-its were conducted at fi ve companies: Air Products and Chemicals; EXFO Inc.; Becton, Dickinson & Company; Electro Scientifi c Industries, Inc.; and Ashland, Inc. The site visits provided further insights into the details of these fi rms’ idea-to-launch processes and specifi c best practices within them.
A detailed discussion of the study methodology and population may be found in Edgett 2011 .
2 The full study was published as Edgett 2011 ; this article offers a new analysis of the data with a more narrow focus on the effectiveness of Stage–Gate systems and their governance.
© Copyright 2000-2012 Product Development Institute Inc. www.stage-gate.com© Copyright 2000-2013 Product Development Institute Inc. www.stage-gate.com

Best Practices in Idea-to-Launch March—April 2012 | 45
Revenue and profi t from new products. The most popular metrics for new-product performance are the per-centage of sales (revenue) and the percentage of profi ts de-rived from new products. Businesses participating in the study averaged 27.3 percent of annual revenue and 25.2 percent of profi ts from products launched within the previ-ous three years ( Figure 1 ). Overall, these average percent-ages are very positive. But most impressive are the results from top 25 percent performers on these two metrics: 36.3 percent of sales and 30.5 percent of profits from new products.
However, although these are popular metrics, they may not be the right metrics to gauge new-product performance; study participants identifi ed many problems with their use. For instance, the use of these metrics can motivate the wrong behaviors; a CTO of a major engineered-products fi rm told us, “We introduced percentage of revenue as a metric to gauge new product performance of our business units. But then business units managed to redefi ne what counted as a new product. One business unit went as far as counting ‘any-thing requiring an engineering drawing,’ which included just about everything they shipped!” A new-products executive in a large, innovative consumer and industrial products fi rm noted another undesirable behavior, “unnecessary churn in
the product line,” caused by divisions replacing old but still successful products with new products just to get the vitality metric up.
These metrics may also not refl ect the true value of the new-product activity. An R&D director in a well-known food company told us, “A lot of our new products simply canni-balize the sales of our old products, and do not really add very much. So now we measure the ‘net sales value’ of new products—the increase in sales as a result of the new product.”
An additional problem with these popular metrics is the huge variability across industries. A food company that achieves 30 percent sales from new products is a stunning success, but that same 30 percent refl ects a mediocre perfor-mance in the computer or software business, where product lives are quite short, often even less than the three-year win-dow used to defi ne “new products” in this study.
Proportion of projects hitting their targets. The por-tion of new product projects that meet their objectives is yet another popular performance metric. The performance on this metric for businesses participating in the study are both mediocre and provocative ( Figure 2 ). The fact that the mean values are about 50 percent for all three measures—projects meeting profi t, sales, and market-share targets—means that
FIGURE 1 . Revenue and profi t from new products (launched within the last three years) for participating businesses.
© Copyright 2000-2012 Product Development Institute Inc. www.stage-gate.com© Copyright 2000-2013 Product Development Institute Inc. www.stage-gate.com

46 | Research-Technology Management Best Practices in Idea-to-Launch
almost half of development projects fail to meet objec-tives. This result should be unacceptable to most senior man-agement teams. But the distribution of results offers hope: the top 25 percent of businesses achieve almost 2.5 times the performance of the bottom 25 percent, demonstrating that better results are possible.
Respondents offered a variety of reasons for these medi-ocre results. Overly ambitious sales targets and poor fore-casting were two suggestions offered. One respondent from a major consumer products fi rm told us, “Often the sales targets are too ambitious, the result of project teams want-ing to ‘showcase their projects’ in order to secure needed funding approval, or being pushed by management into more aggressive, perhaps unrealistic targets.” A new-products executive in another consumer products fi rm said that fail-ing to meet targets is “often the result of a poor sales forecast—for example, the sales force providing an expected sales number based more on hunch than fact-fi nding, or the project team pulling a number out of the air.” Many respondents indicated that projects sometimes failed to hit sales and profi t targets simply because they were poorly executed and badly launched; that is, the product or its launch did not perform as desired as a result of quality-of-execution issues.
Creating a Meaningful Metric Although all of these metrics can be useful, all have their drawbacks and none are suffi cient performance measures in themselves. However, there are other ways to measure a business’s performance in product innovation. Two key indi-cators are the overall profi tability of the business’s total new-product effort relative to R&D spending (a productivity metric) and the business’s overall performance against sales or profi t objectives for new-product development over the last three years.
To capture these indicators, we asked participants to rate their businesses on three measures—productivity (profi t-ability versus R&D spending), performance against sales ob-jectives, and performance against profi t objectives—on a scale of 0 to 10 ( Figure 3 ). A minority of respondents re-ported seeing their businesses as highly productive, with only 19.2 percent rating their new-product efforts as very productive relative to R&D spending. The ability to meet sales objectives was even more weakly rated, with only 13 percent of businesses reporting having met their annual sales objectives for new products. Respondents reported even worse performance against profi t objectives: only 12.9 percent said that their new product efforts met the busi-ness’s profi t objectives.
FIGURE 2 . Percentage of new-product projects meeting profi t, sales, and market-share goals for participating businesses.
© Copyright 2000-2012 Product Development Institute Inc. www.stage-gate.com© Copyright 2000-2013 Product Development Institute Inc. www.stage-gate.com

Best Practices in Idea-to-Launch March—April 2012 | 47
These scales were used to identify best, middle, and worst performers in the study. Best performers were defi ned as those who scored high (7–10) on at least two out of the three scales and at least medium (4–6) on the third. Similarly, worst performers scored low (0–3) on at least two out of the three scales. By this measure, 12.9 percent of participating companies were identifi ed as best performers, and 17.4 percent of the sample fell into the worst performer range. The remaining 69.7 percent constituted middle performers—neither exceptionally good nor very poor.
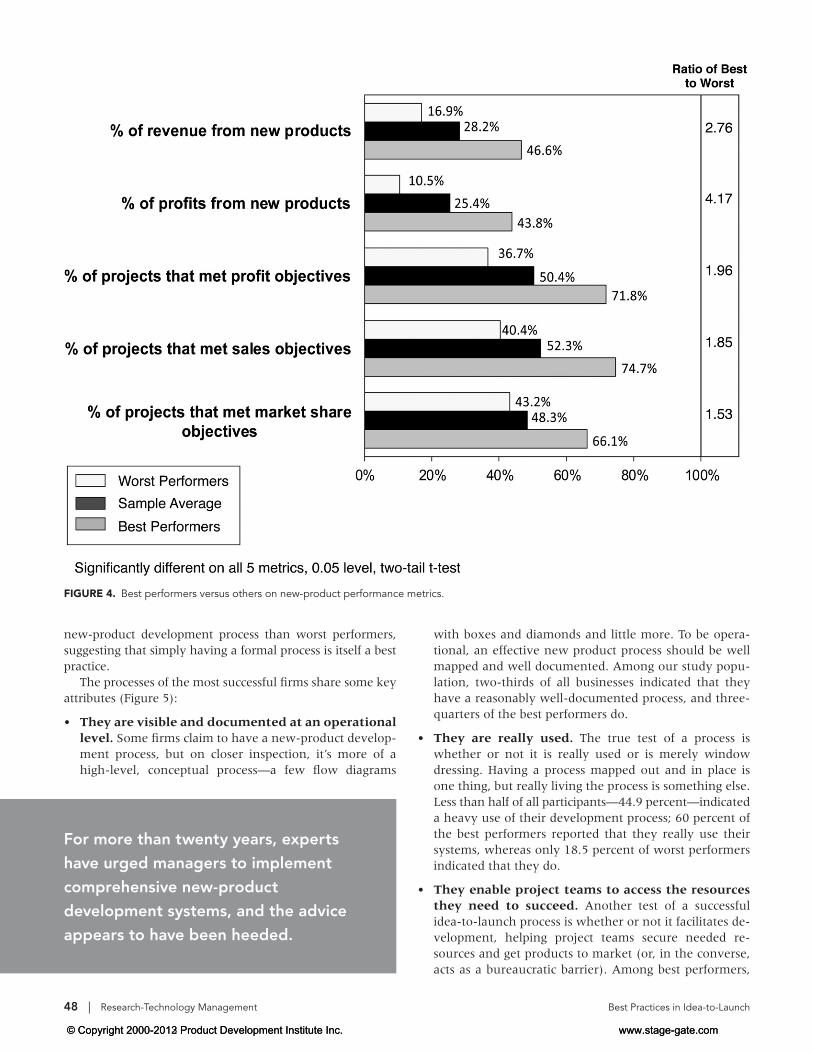
A comparison of other metrics for best performers versus worst performers confi rms the validity of the composite met-ric. The results demonstrate how consistently strong best per-forming businesses are, with almost three times the revenue and almost twice the proportion of projects hitting sales and profi t targets as worst performers ( Figure 4 ). The best per-formers in our study are a truly remarkable group of busi-nesses, with idea-to-launch processes and practices that clearly deliver.
These best performers share a number of key idea-to-launch practices that drive their successes. For all of the best practices we report, the frequency of use among best per-formers was signifi cantly higher at the 0.05 level or above (on a two-tail t-test: best versus rest and best versus worst performers). That is, the best performing businesses tend to employ the practices we have identifi ed much more
consistently than worst performing businesses do, marking these key behaviors as “best practices.”
Idea-to-Launch Practices of Best Performers For more than twenty years, experts have urged managers to implement comprehensive new-product development sys-tems, and the advice appears to have been heeded, as nearly three-quarters of participants in our study report having some kind of formal process in place. Nearly all of our best performers (90 percent, compared to only 44.4 percent of worst performers) have a clear, defi ned new-product develop-ment process —a game plan, playbook, or Stage-Gate system that guides new-product development projects from idea to launch. In fact, best performers are between two and three times more likely to have implemented a successful
FIGURE 3 . Performance of participating businesses on R&D productivity, sales objectives, and profi t objectives.
The best performers in our study are a
truly remarkable group of businesses,
with idea-to-launch processes and
practices that clearly deliver.
© Copyright 2000-2012 Product Development Institute Inc. www.stage-gate.com© Copyright 2000-2013 Product Development Institute Inc. www.stage-gate.com
48 | Research-Technology Management Best Practices in Idea-to-Launch
new-product development process than worst performers, suggesting that simply having a formal process is itself a best practice.
The processes of the most successful fi rms share some key attributes ( Figure 5 ): • They are visible and documented at an operational
level. Some fi rms claim to have a new-product develop-ment process, but on closer inspection, it’s more of a high-level, conceptual process—a few fl ow diagrams
with boxes and diamonds and little more. To be opera-tional, an effective new product process should be well mapped and well documented. Among our study popu-lation, two-thirds of all businesses indicated that they have a reasonably well-documented process, and three-quarters of the best performers do.
• They are really used. The true test of a process is whether or not it is really used or is merely window dressing. Having a process mapped out and in place is one thing, but really living the process is something else. Less than half of all participants—44.9 percent—indicated a heavy use of their development process; 60 percent of the best performers reported that they really use their systems, whereas only 18.5 percent of worst performers indicated that they do.
• They enable project teams to access the resources they need to succeed. Another test of a successful idea-to-launch process is whether or not it facilitates de-velopment, helping project teams secure needed re-sources and get products to market (or, in the converse, acts as a bureaucratic barrier). Among best performers,
FIGURE 4 . Best performers versus others on new-product performance metrics.
For more than twenty years, experts
have urged managers to implement
comprehensive new-product
development systems, and the advice
appears to have been heeded.
© Copyright 2000-2012 Product Development Institute Inc. www.stage-gate.com© Copyright 2000-2013 Product Development Institute Inc. www.stage-gate.com

Best Practices in Idea-to-Launch March—April 2012 | 49
70 percent reported having a facilitating process com-pared to a population average of only 45.8 percent. Among worst performers, only 23.1 percent indicated that their process is a facilitator and enabler, marking this as another best practice.
• They incorporate compliance checks to ensure that the process is followed. Monitoring to see how well the process is followed is a good way to determine if the system is truly deployed. Overall this is a fairly weak area, with only 39.1 percent of participants reporting the use of such compliance checks and only half of best performers.
• They are adaptable and scalable. Is the process fl exi-ble, able to adapt to the needs, size, and risk of the proj-ect? Or is it a rigid, one-size-fi ts-all process that does not recognize differences between high- and low-risk proj-ects, or between large and small projects? The process should be fl exible and scalable, having different versions—for instance, a full fi ve-stage, fi ve-gate process for major
projects and a shorter, three-stage process for lower risk projects, such as enhancements, modifi cations, and ex-tensions. Some fi rms have also evolved a three-stage process for more innovative projects and technology developments, where the criteria for “go” decisions are more qualitative and nonfi nancial and where the stages are more fl exible and iterative ( Cohen, Kamienski, and Espino 1998 ; Koen 2003 ; Cooper 2006 ). New products are routed into different versions of the business’s pro-cess based on a number of criteria, such as project type; technical, market, and regulatory risk levels; the projected investment; and time to market.
Almost two-thirds of participating businesses (62.3 per-cent) boasted of a fl exible, adaptable, and scalable pro-cess; 75 percent of the best performers have fl exible processes, twice the proportion of worst performers.
Most fi rms (72.2 percent) had also appointed a Stage-Gate process manager to guide and oversee their gating system. This person’s job is to ensure that the process works, coach
FIGURE 5 . Percentage of participating businesses with idea-to-launch processes meeting key criteria for success.
© Copyright 2000-2012 Product Development Institute Inc. www.stage-gate.com© Copyright 2000-2013 Product Development Institute Inc. www.stage-gate.com

50 | Research-Technology Management Best Practices in Idea-to-Launch
teams, facilitate gate meetings, maintain the project database, provide for training, and maintain the system and its docu-mentation and IT support.
Another common practice was continuous improvement: internal learnings are leveraged and the process is improved over time. There is a need to be constantly on the alert for non-valued work or outdated methods, eliminating bureau-cracy or waste that may creep into the process over time. The system should be designed to help project teams get their products to market, secure resources and senior manage-ment commitment, and remove roadblocks. Instead, too many processes, implemented with the best of intentions, appear to create bureaucracy and include much non-value-added work. One way to prevent this from occurring is to periodically review the process to make needed improve-ments; most companies in the study had revamped their pro-cesses recently, 73.2 percent within the past three years and 83.8 percent within the past fi ve years.
All of the companies that were visited had in place a well-designed product development process. Each of these supe-rior performers indicated that a solid, well-defi ned process with clearly defi ned activities in each stage and a well-defi ned decision framework for the gates (decision points) was a critical best practice ( Table 2 ). The process yields a number of benefi ts; one business unit manager offered a central example—the process “allows us to fail fast and move on—cut one’s losses early—rather than carrying on with a bad and risky project too long.” As the former global process manager at Procter & Gamble (commenting on his current fi rm’s process), told us, “Stage-Gate is not optional. [It’s] es-sential to succeed in today’s environment.”
Gatekeeping Practices In a well-defi ned idea-to-launch system, the gates are the go/kill decision points at which the latest information on a proj-ect is reviewed and decisions are made to move the right projects forward. Thus, gates are the quality control check-points in the system; gates ensure that the right projects are
done and that they are done right. Effective gates are central to the success of a fast-paced, product innovation process. Gatekeeping best practices, then, must be a central driver of idea-to-launch performance.
The Gatekeepers In best performing businesses, gatekeepers play a vital role. Gatekeepers are clearly designated as the management team members responsible for the go/kill decisions at each gate. Gatekeepers may change from gate to gate depending on the evolving risk profi le of the project. Gatekeepers are disci-plined about scheduling and attending gate meetings, and they make high-quality, substantive contributions to the decision-making process ( Figure 6 ). • Designated gatekeepers are assigned. Sometimes it
is unclear just who should undertake project reviews and whose authorizations are needed for a project to proceed. Defi ning the locus of decision making—the management team that makes the vital go/kill decisions at gates—is an important feature of many fi rms’ idea-to-launch processes. Most companies, 70.8 percent, have clearly designated gatekeepers. This is especially true for best performing businesses, with 85 percent having de-fi ned gatekeepers.
• Gatekeepers may change based on the risk associ-ated with the decision. In some businesses, the gate decision makers remain the same from gate to gate, throughout the entire project and regardless of project type. But in other fi rms, especially the best performers, the gatekeeper may change depending on the risk associ-ated with the decision. For example, best performers frequently use an abbreviated Stage-Gate system for lower-risk projects, such as line extensions or modifi ca-tions. Lower-level personnel may serve as gatekeepers at all gates for such low-risk projects, with more senior people—such as the leadership team of the business—being the gatekeepers for higher-risk projects. Forty-fi ve
TABLE 2 . Example respondent comments regarding the value of their idea-to-launch process.
Company/Industry Comment
Air Products and Chemicals, Inc. The organization uses a consistent, organization-wide process called “Offering Development and Introduction” (ODI) that is modeled on the Stage-Gate process. This process, a company-wide Stage-Gate framework, has become institutionalized and is ingrained in the language and culture of the company.
Chemicals
EXFO, Inc. We have a well-defi ned Stage-Gate process that over the years has evolved as we have adapted to changing market needs. Our process is considered an asset.
Telecommunications equipment
Becton, Dickinson & Company BD’s global new-product development system serves as an effective baseline for planning and managing NPD projects and provides a basis for functional transparency and accountability.
Healthcare equipment
Electro Scientifi c Industries, Inc. The improved consistency of the process is helping to improve the quality of content, accelerate learning for new participants, and enable objective status reporting.
Industrial, equipment, mechanical
Ashland, Inc. We have been able to successfully combine our product development process [Stage-Gate] with our Six Sigma program. This combined approach allows us to produce high-quality products in a disciplined manner.
Chemicals
© Copyright 2000-2012 Product Development Institute Inc. www.stage-gate.com© Copyright 2000-2013 Product Development Institute Inc. www.stage-gate.com

Best Practices in Idea-to-Launch March—April 2012 | 51
percent of best performers employ this practice, which is far less prevalent among worst performers.
• Gatekeepers may also change from gate to gate, even in larger or more risky projects. For example, more senior people may be the gatekeepers at points where signifi -cant commitments are required, such as at the “go to development” and “go to launch” decisions. By contrast, lower-level personnel staff the earlier gates—for exam-ple, the idea screen—where commitments and hence risks are lower. In 35 percent of the businesses we stud-ied, gatekeepers change from gate to gate; in 26.2 per-cent, the gatekeeping group is totally static, with no change at all from gate to gate.
• Some businesses also considered geography in assigning gatekeepers. When probed about global gatekeeping, the results were split: 46.9 percent of businesses indicated that gatekeepers have oversight for projects spanning multiple geographic locations, while a slight majority of 53.1 percent have not opted for globalized gatekeeping. There was no signifi cant difference between best and worst performers in this regard.
• Gatekeepers schedule and attend meetings. A number of respondents noted that compliance with the
process is always an issue, especially for the gatekeepers. The fact is that in about half of the businesses studied, gatekeeper “no shows” and gate-meeting cancellations were common. By contrast, among best performers, there is more discipline: all of the key decision makers invited to participate as gatekeepers attend the gate meetings; gate-meeting cancellations are not acceptable; and when a gatekeeper cannot attend, the meeting still goes ahead (gatekeeper substitutes are often allowed, with full voting authority).
• Gatekeepers contribute to the decision-making process. Anecdotal evidence suggests that in some busi-nesses, gatekeepers frequently arrive at gate meetings poorly prepared and not informed enough to make a good decision. Indeed, almost two-thirds of our respondents
FIGURE 6 . Percentage of participating businesses implementing best practices for gatekeeping.
Gatekeeping best practices must
be a central driver of idea-to-launch
performance.
© Copyright 2000-2012 Product Development Institute Inc. www.stage-gate.com© Copyright 2000-2013 Product Development Institute Inc. www.stage-gate.com
52 | Research-Technology Management Best Practices in Idea-to-Launch
indicated that the quality of the gatekeepers’ contribu-tions is not high, with only 37.3 percent reporting high-quality contributions from gatekeepers as a rule. In best performing businesses, on the other hand, gatekeepers consistently make high-quality contributions. That is, each gatekeeper comes prepared for the meeting, has read the project materials, and asks insightful questions to understand the risk associated with the project. For example, at J&J Ethicon Endo-Surgery, “Gatekeepers are expected to know the project.” In this fi rm’s “lean gate reviews,” the documentation has been reduced from 90-page reports to less than 5 pages, and gate meetings are not information meetings, but decision meetings, where gatekeepers must arrive prepared ( Belair 2007 , 14–15). This is the weakest area for the worst performers, less than 15 percent of whom report high-quality participa-tion from gatekeepers.
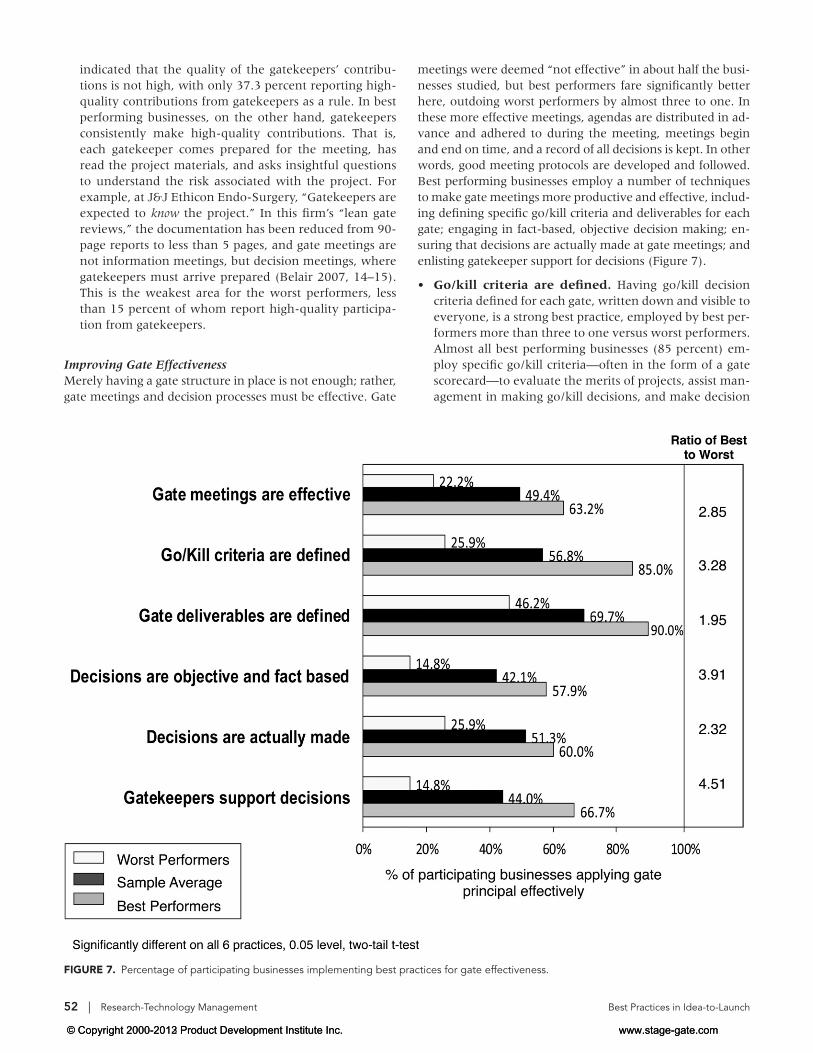
Improving Gate Effectiveness Merely having a gate structure in place is not enough; rather, gate meetings and decision processes must be effective. Gate
meetings were deemed “not effective” in about half the busi-nesses studied, but best performers fare signifi cantly better here, outdoing worst performers by almost three to one. In these more effective meetings, agendas are distributed in ad-vance and adhered to during the meeting, meetings begin and end on time, and a record of all decisions is kept. In other words, good meeting protocols are developed and followed. Best performing businesses employ a number of techniques to make gate meetings more productive and effective, includ-ing defi ning specifi c go/kill criteria and deliverables for each gate; engaging in fact-based, objective decision making; en-suring that decisions are actually made at gate meetings; and enlisting gatekeeper support for decisions ( Figure 7 ). • Go/kill criteria are defi ned. Having go/kill decision
criteria defi ned for each gate, written down and visible to everyone, is a strong best practice, employed by best per-formers more than three to one versus worst performers. Almost all best performing businesses (85 percent) em-ploy specifi c go/kill criteria—often in the form of a gate scorecard—to evaluate the merits of projects, assist man-agement in making go/kill decisions, and make decision
FIGURE 7 . Percentage of participating businesses implementing best practices for gate effectiveness.
© Copyright 2000-2012 Product Development Institute Inc. www.stage-gate.com© Copyright 2000-2013 Product Development Institute Inc. www.stage-gate.com
Best Practices in Idea-to-Launch March—April 2012 | 53
making more objective and less emotional. In spite of the logic of having gate criteria spelled out in this way, the lack of such criteria is fairly widespread, especially among poorer performing businesses, with only one-quarter of worst performers having specifi ed go/kill criteria.
• Gate deliverables are defi ned. To make good deci-sions, gatekeepers must have the right information avail-able. Defi ned deliverables specify what information the project team must provide to enable decision making and provide a guide for the gatekeepers in approaching the decision. Having defi ned deliverables for each gate is a clear best practice: 90 percent of best performers set clear expectations, generally via a standard list of items that the project team is expected to deliver at each gate in the process, often in the form of a template.
• Decisions are objective and fact based. The majority of businesses in the study indicated that a high-quality approach to decision making, in which decisions are fact-based and objective, is lacking at their gates. Even the best performers are somewhat defi cient here, with just more than half claiming high-quality and objective deci-sion making; even at that rate, the best performers still do much better than the worst performers, only 14.8 percent of whom indicate confi dence in the quality and objectivity of their gate decisions.
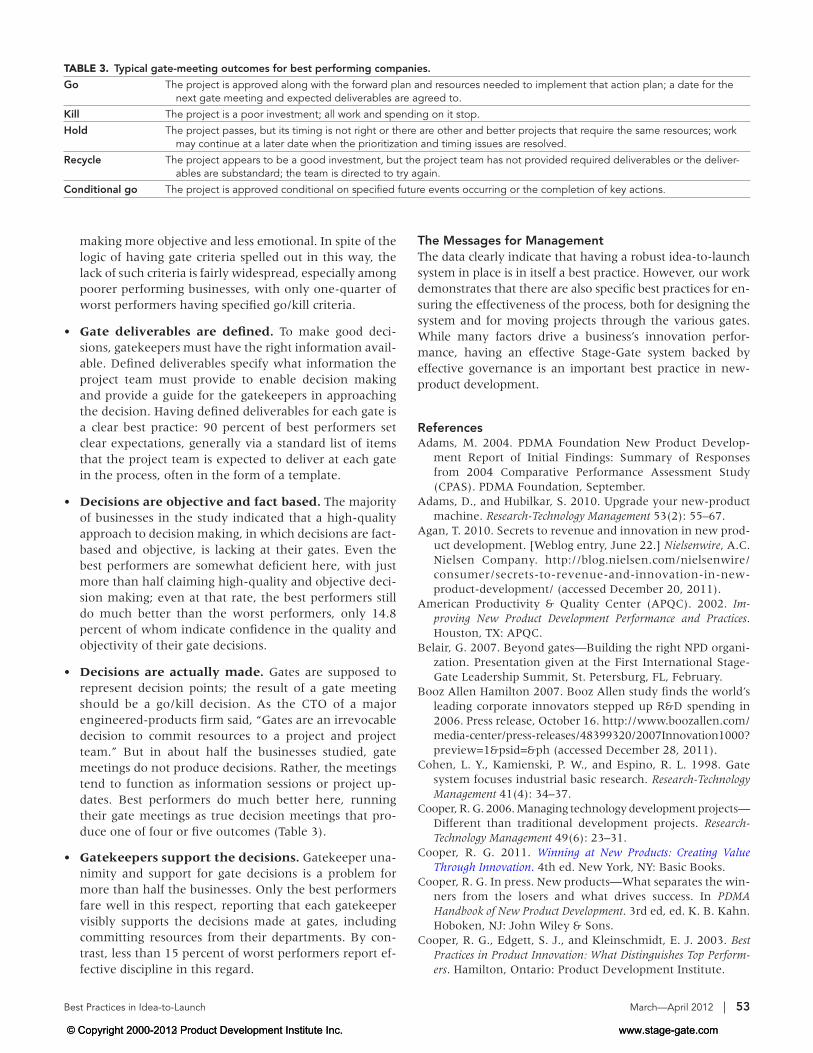
• Decisions are actually made. Gates are supposed to represent decision points; the result of a gate meeting should be a go/kill decision. As the CTO of a major engineered-products fi rm said, “Gates are an irrevocable decision to commit resources to a project and project team.” But in about half the businesses studied, gate meetings do not produce decisions. Rather, the meetings tend to function as information sessions or project up-dates. Best performers do much better here, running their gate meetings as true decision meetings that pro-duce one of four or fi ve outcomes ( Table 3 ).
• Gatekeepers support the decisions. Gatekeeper una-nimity and support for gate decisions is a problem for more than half the businesses. Only the best performers fare well in this respect, reporting that each gatekeeper visibly supports the decisions made at gates, including committing resources from their departments. By con-trast, less than 15 percent of worst performers report ef-fective discipline in this regard.
The Messages for Management The data clearly indicate that having a robust idea-to-launch system in place is in itself a best practice. However, our work demonstrates that there are also specifi c best practices for en-suring the effectiveness of the process, both for designing the system and for moving projects through the various gates. While many factors drive a business’s innovation perfor-mance, having an effective Stage-Gate system backed by effective governance is an important best practice in new-product development.
References Adams , M. 2004 . PDMA Foundation New Product Develop-
ment Report of Initial Findings: Summary of Responses from 2004 Comparative Performance Assessment Study (CPAS). PDMA Foundation, September .
Adams , D. , and Hubilkar , S. 2010 . Upgrade your new-product machine . Research-Technology Management 53 ( 2 ): 55 – 67 .
Agan , T. 2010 . Secrets to revenue and innovation in new prod-uct development. [Weblog entry, June 22.] Nielsenwire , A.C. Nielsen Company . http://blog.nielsen.com/nielsenwire/consumer/secrets-to-revenue-and-innovation-in-new-product-development/ (accessed December 20, 2011) .
American Productivity & Quality Center (APQC) . 2002 . Im-proving New Product Development Performance and Practices . Houston, TX : APQC .
Belair , G. 2007 . Beyond gates—Building the right NPD organi-zation. Presentation given at the First International Stage-Gate Leadership Summit, St. Petersburg, FL, February .
Booz Allen Hamilton 2007 . Booz Allen study fi nds the world’s leading corporate innovators stepped up R&D spending in 2006 . Press release, October 16. http://www.boozallen.com/media-center/press-releases/48399320/2007Innovation1000?preview=1&psid=&ph (accessed December 28, 2011) .
Cohen , L. Y. , Kamienski , P. W. , and Espino , R. L. 1998 . Gate system focuses industrial basic research . Research-Technology Management 41 ( 4 ): 34 – 37 .
Cooper , R. G. 2006 . Managing technology development projects—Different than traditional development projects . Research-Technology Management 49 ( 6 ): 23 – 31 .
Cooper , R. G. 2011 . Winning at New Products: Creating Value Through Innovation . 4th ed . New York, NY : Basic Books .
Cooper , R. G. In press. New products—What separates the win-ners from the losers and what drives success . In PDMA Handbook of New Product Development . 3rd ed , ed. K. B. Kahn . Hoboken, NJ : John Wiley & Sons .
Cooper , R. G. , Edgett , S. J. , and Kleinschmidt , E. J. 2003 . Best Practices in Product Innovation: What Distinguishes Top Perform-ers . Hamilton, Ontario : Product Development Institute .
TABLE 3 . Typical gate-meeting outcomes for best performing companies.
Go The project is approved along with the forward plan and resources needed to implement that action plan; a date for the next gate meeting and expected deliverables are agreed to.
Kill The project is a poor investment; all work and spending on it stop.
Hold The project passes, but its timing is not right or there are other and better projects that require the same resources; work may continue at a later date when the prioritization and timing issues are resolved.
Recycle The project appears to be a good investment, but the project team has not provided required deliverables or the deliver-ables are substandard; the team is directed to try again.
Conditional go The project is approved conditional on specifi ed future events occurring or the completion of key actions.
© Copyright 2000-2012 Product Development Institute Inc. www.stage-gate.com© Copyright 2000-2013 Product Development Institute Inc. www.stage-gate.com
54 | Research-Technology Management Best Practices in Idea-to-Launch
Cooper , R. G. , Edgett , S. J. , and Kleinschmidt , E. J. 2004a . Benchmarking best NPD practices—Part 1: Culture, climate, teams and senior management’s role . Research-Technology Management 47 ( 1 ): 31 – 43 .
Cooper , R. G. , Edgett , S. J. , and Kleinschmidt , E. J. 2004b . Benchmarking best NPD practices—Part 2: Strategy, re-sources and portfolio management practices . Research-Technology Management 47 ( 3 ): 50 – 60 .
Cooper , R. G. , Edgett , S. J. , and Kleinschmidt , E. J. 2005 . Benchmarking best NPD practices—Part 3: The NPD process & decisive idea-to-launch activities . Research-Technology Man-agement 47 ( 6 ): 43 – 55 .
Cooper , R. G. , and Mills , M. 2005 . Succeeding at new products the P&G way: A key element is using the ‘Innovation Dia-mond.’” . PDMA Visions 29 ( 4 ): 9 – 13 .
Edgett , S. 2011 . New Product Development: Process Benchmarks and Performance Metrics . Houston, TX: American Productivity and Quality Center and Hamilton, Ontario : The Product Devel-opment Institute .
Griffi n , A. 1997 . Drivers of NPD Success: The 1997 PDMA Re-port . Product Development & Management Association .
Grőlund , J. , Rőnneberg , D. , and Frishammar , J. 2010 . Open innovation and the stage-gate process: A revised model for new product development . California Management Review 5 ( 3 ): 106 – 131 .
Jaruzelski , B. , Dehoff , K. , and Bordia , R. 2005 . The Booz Allen Hamilton Global 1000: Money isn’t everything . Strategy + Business 41 : 3 – 15 .
Koen , P. 2003 . Tools and techniques for managing the front end of innovation: Highlights from the May 2003 Cam-bridge Conference . PDMA Visions 27 ( 4 ): 16 – 19 .
Mills , M. 2007 . Implementing a stage-gate process at P&G . Pro-ceedings, First International Stage-Gate Conference, 27–38 . St. Petersburg Beach, FL : Management Roundtable Inc. and Stage-Gate Inc .
U.S. Department of Energy (DOE) . 2007 . Stage-Gate Innova-tion Management Guidelines: Managing Risk Through Structured Project Decision-Making. US DOE Energy Effi -ciency and Renewable Energy Industrial Technologies Pro-gram, February . http://www1.eere.energy.gov/industry/fi nancial/pdfs/itp_stage_gate_overview/pdf (accessed De-cember 28, 2011) .
© Copyright 2000-2012 Product Development Institute Inc. www.stage-gate.com© Copyright 2000-2013 Product Development Institute Inc. www.stage-gate.com
Stage-Gate International is the world's leading full-service provider of solutions which enable
organizations to improve their Product Innovation and Portfolio Management capabilities and
performance. Our clients include 5000+ organizations of all sizes across all industries.
Visit our website and subscribe to receive the latest research, information and complimentary articles to keep you current in product innovation!
+1-905-304-8797
www.stage-gate.com
© Copyright 2000-2013 Product Development Institute Inc. www.stage-gate.com