Employment Sector Employment Working Paper No. 63 2010 Growth, Economic Policies and Employment Linkages in Mediterranean Countries The cases of Egypt, Israel, Morocco and Turkey Gouda Abdel-Khalek Employment Policy Department

Welcome message from author
This document is posted to help you gain knowledge. Please leave a comment to let me know what you think about it! Share it to your friends and learn new things together.
Transcript

Employment Sector Employment Working Paper No. 63 2010
Growth, Economic Policies and Employment Linkages in Mediterranean Countries
The cases of Egypt, Israel, Morocco and Turkey
Gouda Abdel-Khalek
Employment Policy Department
Copyright © International Labour Organization 2010 First published 2011 Publications of the International Labour Office enjoy copyright under Protocol 2 of the Universal Copyright Convention. Nevertheless, short excerpts from them may be reproduced without authorization, on condition that the source is indicated. For rights of reproduction or translation, application should be made to ILO Publications (Rights and Permissions), International Labour Office, CH-1211 Geneva 22, Switzerland, or by email: [email protected]. The International Labour Office welcomes such applications.
Libraries, institutions and other users registered with reproduction rights organizations may make copies in accordance with the licences issued to them for this purpose. Visit http://www.ifrro.org to find the reproduction rights organization in your country.
ILO Cataloguing in Publication Data Abdel-Khalek, Gouda Growth, economic policies and employment linkages in Mediterranean countries: the case of Egypt, Israel, Morocco and Turkey / Gouda Abdel-Khalek ; International Labour Office, Employment Policy Department. - Geneva: ILO, 2010 1 v. (Employment working paper ; No.63) ISBN 978-92-2-123779-2 (print); 978-92-2-123780-8 (web pdf) ISSN 1999-2939 (print); ISSN 1999-2947 (web pdf) International Labour Office; Employment Policy Dept economic growth / economic policy / employment / poverty / economic recession / Egypt / Israel / Morocco / Turkey 03.02.3
The designations employed in ILO publications, which are in conformity with United Nations practice, and the presentation of material therein do not imply the expression of any opinion whatsoever on the part of the International Labour Office concerning the legal status of any country, area or territory or of its authorities, or concerning the delimitation of its frontiers.
The responsibility for opinions expressed in signed articles, studies and other contributions rests solely with their authors, and publication does not constitute an endorsement by the International Labour Office of the opinions expressed in them.
Reference to names of firms and commercial products and processes does not imply their endorsement by the International Labour Office, and any failure to mention a particular firm, commercial product or process is not a sign of disapproval.
ILO publications and electronic products can be obtained through major booksellers or ILO local offices in many countries, or direct from ILO Publications, International Labour Office, CH-1211 Geneva 22, Switzerland. Catalogues or lists of new publications are available free of charge from the above address, or by email: [email protected]
Visit our website: http://www.ilo.org/publns
Printed in Switzerland document2

iii
Preface
The primary goal of the ILO is to contribute, with member States, to achieve full and productive employment and decent work for all, including women and young people, a goal embedded in the ILO Declaration 2008 on Social Justice for a Fair Globalization, and1 which has now been widely adopted by the international community.
In order to support member States and the social partners to reach the goal, the ILO pursues a Decent Work Agenda which comprises four interrelated areas: Respect for fundamental worker’s rights and international labour standards, employment promotion, social protection and social dialogue. Explanations of this integrated approach and related challenges are contained in a number of key documents: in those explaining and elaborating the concept of decent work2, in the Employment Policy Convention, 1964 (No. 122), and in the Global Employment Agenda.
The Global Employment Agenda was developed by the ILO through tripartite consensus of its Governing Body’s Employment and Social Policy Committee. Since its adoption in 2003 it has been further articulated and made more operational and today it constitutes the basic framework through which the ILO pursues the objective of placing employment at the centre of economic and social policies.3
The Employment Sector is fully engaged in the implementation of the Global Employment Agenda, and is doing so through a large range of technical support and capacity building activities, advisory services and policy research. As part of its research and publications programme, the Employment Sector promotes knowledge-generation around key policy issues and topics conforming to the core elements of the Global Employment Agenda and the Decent Work Agenda. The Sector’s publications consist of books, monographs, working papers, employment reports and policy briefs.4
The Employment Working Papers series is designed to disseminate the main findings of research initiatives undertaken by the various departments and programmes of the Sector. The working papers are intended to encourage exchange of ideas and to stimulate debate. The views expressed are the responsibility of the author(s) and do not necessarily represent those of the ILO.
1 See http://www.ilo.org/public/english/bureau/dgo/download/dg_announce_en.pdf 2 See the successive Reports of the Director-General to the International Labour Conference: Decent work (1999); Reducing the decent work deficit: A global challenge (2001); Working out of poverty (2003). 3 See http://www.ilo.org/gea. And in particular: Implementing the Global Employment Agenda: Employment strategies in support of decent work, “Vision” document, ILO, 2006. 4 See http://www.ilo.org/employment.
José Manuel Salazar-Xirinachs Executive Director Employment Sector


v
Foreword
Despite relatively positive economic performance in the years prior to the global economic and financial crisis, countries in the Mediterranean basin face important employment and labour market challenges. The unemployment rate especially amongst youth is one of the highest in the world and their labour markets are characterized by high incidence of underemployment, employment in the informal economy and poor working conditions. The gender gap, particularly the low labour force participation of women, is a major challenge. Limited opportunities for productive employment together with more demand for labour in European countries have resulted in labour migration from East and South Mediterranean countries towards the Northern shore of the Mediterranean. The recent global economic and financial crisis led to economic downturn at varying degree in different countries, however, it shed light on the structural challenges of unemployment, poverty and inequality.
In the current political, economic and social context giving effect to the ILO Global Jobs Pact adopted in the 98th Session of the International Labour Conference (June 2009) is of paramount in order to promote productive employment and decent work in these countries. The promotion of productive employment and decent work is high on the agenda of the Euro-Mediterranean Partnership and is an utmost priority in the countries of the region. At the first Euro-Mediterranean Employment and Labour Ministers Conference in 2008 Ministers highlighted the urgency of challenges relating to employment, investment in human capital, and decent work for all and committed themselves to a Framework of Actions which would “contribute to developing a genuine social dimension within the Euro-Med agenda”.
The European Union has long actively supported the uptake of decent work as a global goal. As part of the Renewed Social Agenda the European Commission has “reaffirmed its commitment to promoting the internationally-agreed Decent Work Agenda, including through cooperation with the ILO and other partners, and the mobilisation of all relevant policies”. Furthermore, cooperation to enhance the response to the economic crisis has been recently intensified between both institutions.
Against this backdrop, the International Labour Office (ILO) and the European Commission (EC Directorate-General for Employment, Social Affairs and Equal Opportunities) developed a joint action oriented research project on “Expanding the knowledge base on decent work in Mediterranean countries.” The research undertaken focused on three main themes: 1) economic growth and employment; 2) labour market policies and 3) labour migration. The findings from the research are of great interest for policymakers as well as researchers and are reproduced in a series of working papers. They open up new avenues for research under future programmes.
This synthesis report, written by Gouda Abdel-Khalek, Professor of Economics of the Faculty of Economics of Cairo University, analyzes the nature of growth, economic policies and employment as well as its linkages in four Middle East and North African countries: Egypt, Israel, Morocco and Turkey taking into account the pervasive effects of the global economic and financial crisis. The first part of the report describes the overall trends in growth and employment and the main macroeconomic frameworks of the four countries. The second section provides an overview of the main employment and labour market outcomes. The third section is devoted to the growth employment and poverty nexus. It includes an analysis of the productivity-growth nexus as well as the growth-
vi
employment elasticities in the four countries. Section five reviews the impact of the global financial and economic crisis in the economies and labour markets of the four countries. The last section is devoted to policy recommendations that can contribute to enhance the employment content of economic growth.
The report largely draws on the findings of five “country reports”, namely:
� Heba Nassar (2010), Growth, Economic Policies and Employment Linkages in Mediterranean countries. The case of Egypt, ILO;
� Omar Aloui (2010), Growth, Economic Policies and Employment Linkages in Mediterranean countries. The case of Morocco, ILO;
� Erinç Yeldan and Hakan Ercan (2010), Growth, Economic Policies and Employment Linkages in Mediterranean countries. The case of Turkey, ILO;
� Roby Nathanson (2010), Growth, Economic Policies and Employment Linkages in Mediterranean countries. The case of Israel, ILO.
Azita Berar Awad Director, Employment Policy Department ILO, Geneva
vii
Contents
Page
Preface ...................................................................................................................................................... iii
Foreword ................................................................................................................................................... v
1. Introduction ..................................................................................................................................... 1
Context and purpose of the research ............................................................................................... 1
Main findings .................................................................................................................................. 2
Structure of the report ..................................................................................................................... 3
2. Macroeconomic developments and policies ................................................................................... 4
2.1 Overall trends of growth and employment ........................................................................... 4
2.2 The economic policy framework: Egypt............................................................................... 8
2.3 The economic policy framework: Israel ............................................................................... 9
2.4 The economic policy framework: Morocco ........................................................................ 10
2.5 The economic policy framework: Turkey........................................................................... 12
3. Labour market and employment challenges.................................................................................. 14
3.1 Egypt ................................................................................................................................... 15
3.2. Israel ................................................................................................................................... 17
3.3 Morocco .............................................................................................................................. 19
3.4 Turkey ................................................................................................................................. 20
3.5 Labour market outcomes and labour demand ..................................................................... 23
4. Growth-employment-poverty nexus ............................................................................................. 24
4.1 Source of growth and structural changes ............................................................................ 24
4.2 Growth and employment: elasticities, productivity and sectoral growth ........................... 25
4.3 Growth and Poverty ............................................................................................................ 30
5. Impact of the global financial crisis .............................................................................................. 32
6. Strategies and policies to enhance job creation and job quality .................................................... 34
References ............................................................................................................................................... 37
Annexes ................................................................................................................................................... 41
viii
List of tables
Table 1. Foreign trade indicator and short term projections (millions US$) ............................................. 5
Table 2. Annual rate of growth of gross fixed investment ....................................................................... 6
Table 3. Net current transfers per capita (current dollars) ........................................................................ 6
Table 4. Planned Sectoral Composition in Egypt’s Sixth Five Year Plan ................................................ 9
Table 5. The Distribution of Public and Private Employees by Education in EGYPT (percent) ........... 15
Table 6. Employment and unemployment structure by education level in Turkey ................................ 22
Table 7. Distribution of Employment and Unemployment by Education (%) ....................................... 23
Table 8. Estimates of TFP Growth in Mediterranean Countries, 1960-2000 ......................................... 24
Table 9. Employment Elasticities in Mediterranean Countries .............................................................. 25
Table 10. Growth composition from 2003 to 2007 - Average annual growth rate (Egypt) ................... 26
Table 11. Poverty and Income Indicators – comparative data................................................................ 30
Table 12. Israel- Poverty Incidence of Families by Family Group (percentages), 2006 and 2007 ........ 31
Table 13. Morocco- Evolution of poverty in rural and urban areas ....................................................... 32
Table 14. Annual rate of growth of real GDP ........................................................................................ 32
List of figures
Figure 1. Growth indicators ........... ………………………………………………………………………4
Figure 2. Trade indicators............... ………………………………………………………………………5
Figure 3. Employment structure ………………………..……………………………………………….7
Figure 4. Employment distribution by sector in Israel (2008) ........ …………………………………...18
Figure 5. Informal employment and productivity trends in Morocco .......... …………………………..28
List of boxes
Box 1-Evolution of rural population shares .............................................................................................. 7
1
1. Introduction
Context and purpose of the research
In 2003, the ILO adopted "The Global Employment Agenda" (GEA) which placed employment at the centre of economic and social policy-making. Consistent with the Millennium Development Goals, the GEA strives to improve the lot of those who are either unemployed or whose compensation from work is insufficient to lift them out of poverty. The GEA is based on seven principles (or core elements): (i) decent work as a productive factor; (ii) a pro-employment macro-economic framework; (iii) entrepreneurship and private investment; (iv) enhancing the opportunities and productivity of the working poor; (v) ending discrimination in the labour market; (vi) environmentally and socially sustainable growth; and (vii) employability and adaptability (ILO, 2003). The broader framework within which the GEA is cast is the "Decent Work Agenda", which stresses freely chosen productive employment simultaneously with fundamental rights at work, adequate income from work, and the security of social protection.
In 2008, the International Labour Conference highlighted the outcomes and risks of economic growth in the midst of globalization. Globalization, characterized by the diffusion of new technologies, the flow of ideas, the exchange of goods and services, the increase in capital and financial flows, the internationalization of business and business processes and dialogue as well as the movement of persons, especially working women and men, is reshaping the world of work in profound ways.
On the one hand, the process of economic cooperation and integration has helped a number of countries to benefit from high rates of economic growth and employment creation, to absorb many of the rural poor into the modern urban economy, to advance their developmental goals, and to foster innovation in product development and the circulation of ideas.
On the other hand, global economic integration has caused many countries and sectors to face major challenges of income inequality, continuing high levels of unemployment and poverty, vulnerability of economies to external shocks, and the growth of both unprotected work and the informal economy, which impact on the employment relationship and the protections it can offer.
Against the backdrop of heavy job losses due to the global economic crisis which erupted in 2008, the 2009 International labour Conference adopted a Global Jobs Pact. The Pact highlights five areas for meeting the global employment challenge:
1. A supervisory and regulatory financial framework serving the real economy; 2. Sustainable enterprises and decent work; 3. Efficient and well-regulated trade and markets working for all, without protectionism
but with due regard to the situation of lower-income countries; 4. Shifting to a low-carbon environment-friendly economy; and 5. A development path that enables all to place employment and social protection at the
centre of their economic, social and poverty reduction policies, supported internationally.
The promotion of productive employment and decent work are among the most pressing challenges facing the Euro-Mediterranean partner countries. According to the ILO Global Employment Trends 2009 report, the south and eastern Mediterranean countries suffer the highest unemployment rate compared to all other regions in the world; the rate was 10.3 per cent for North Africa and 9.4 per cent for the Middle East. In addition to high
2
unemployment rates, the employment challenge for the region manifests itself in decent work deficits due to rising underemployment, poor working conditions for large numbers, and relatively high informal employment.
The European Neighbourhood Policy (ENP) has the objective of avoiding the emergence of new dividing lines between the EU and its immediate neighbours by strengthening the prosperity, stability and security of all. The core element of ENP is the bilateral Action Plans which set out an agenda of political and economic reforms. The ENP will help to promote decent work, through the implementation of clear reforms concerning labour standards, employment, social affairs, and equal opportunities set out in the Action Plans.
The purpose of this research is to analyse the nature of growth, economic policies, and employment challenges in the four selected Mediterranean countries: Egypt, Israel, Morocco and Turkey. It also seeks to take into account the current global financial and economic crisis. The research draws on evidence from country level data and analyses in an attempt to highlight the nature of the employment challenge in those four countries, and to suggest relevant growth strategies and economic policies for meeting that challenge in relation to ENP.5
Main findings
The four countries, Egypt, Israel, Morocco and Turkey, have different sizes and development levels. They are involved in development trajectories which have similarities and differences. During the last three decades, they all introduced significant reforms in several areas (trade policy, fiscal and monetary policies, privatization and public sector, business environment, labour market policies). They all had policies geared towards the key sectors of agriculture, industry and services. These reforms brought relatively positive outcomes on the economic side, but the structural problems insufficiently productive employment and poverty remained.
Like other developed countries, Israel suffers from the problem of unemployment and poverty of low-skilled workers. Its growth model, encouraging high tech export5 oriented sectors, induced a more intensive demand for skilled workers and an evolution of wages benefiting employers and skilled workers. The higher unemployment of unskilled workers worsened due to competition introduced from foreign workers. Additional factors aggravate the situation of low-skilled workers in Israel: weak law enforcement; the development of temporary work agencies; a limited amount of collective bargaining agreements, and a social and political context that nurtures the discrimination of workers, migrants and minorities.6
Recent policy measures emphasized tax cuts and reductions in social benefits. These changes are still continuing today and, together with weak enforcement of labour laws have compounded the vulnerability of workers.
5 ENP action plans were agreed with Israel and Morocco in 2005 and with Egypt in 2007. 6 Nathanson (2009): “The cultural attitude in Israel is difficult to compare with, for example, northern European countries, which have a different ethical code regarding labour relations. Therefore in Israel’s case there is a greater necessity for legal intervention (which is not always effective) in order to improve fair industrial relations even in fields anchored by law, like minimum wages.” page 85.
3
Egypt, Morocco and Turkey face a low rate of labour force participation, due particularly to the low involvement of women in the market economy, a significant informal economy and a high unemployment of the educated labour force, particularly educated women. After 2004, Egypt and Morocco witnessed better macroeconomic performances. Surveys showed a reduction of unemployment and poverty rates but unemployment for the highly educated remained high. Those with secondary education were particularly afflicted and large-scale informal employment continued.
Turkey experienced jobless growth. Even with notable performances, the Turkish industrial and services sectors could not absorb the surplus labour. The productivity gains were not matched with the enlargement of its industrial base. This was due to the difficulty of competing in traditional export markets. Turkey tried to find new export niches and to create more jobs for its qualified labour force, but its international competitiveness encountered limits because of the presence of lower wage competitors. Therefore, unemployment grew. The informal economy, however, remained large even if its size stabilized, and perhaps decreased moderately.7
The three economies, of Egypt, Morocco and Turkey, face relatively similar employment problems. Productivity gains reduce the employment needs of existing activities and enterprises. The export oriented strategies adopted by these countries brought a positive contribution to GDP growth but, even with outstanding performances, seem unable to provide enough good quality jobs for a burgeoning labour force.
Macroeconomic indicators, and also some microeconomic surveys, suggest that, in Egypt, Morocco and Turkey, some economic activities, classified as informal, witnessed productivity gains and are capable of improving the quality of jobs, enhancing the incomes of workers and broadening the coverage of social protection. Some sectoral policies, particularly in services and agriculture, stand out as success stories.
The selected countries launched active labour market policies, as well as social policies and programmes with the aim of reducing poverty. These experiences show that the economic and social upgrading of very small enterprises should be prioritized as a pivot of local development and as a pillar of a poverty reduction strategy. This recommendation concerns all the countries and should be an essential complement to labour legislation, freedom of association and social dialogue, and fair sharing of benefits of between employers and employees. To achieve the objective of alleviating decent work deficits, the growth policies of these countries have to rely on the creation of new jobs responding to the social needs at the local and national levels. Opportunities exist in the protection of health and environment (forest protection, coastal cleaning, training and education against the use of chemicals in agriculture and livestock breeding etc.), sanitation and waste sector management, social proximity services and the development of products and services quality.
Structure of the report
The report is structured as follows. An overview of macroeconomic developments and economic policies of the selected countries is presented in Part 2. After an overview of growth trends and employment, it details recent macroeconomic performance, the nature of economic reforms and the trade and sectoral policies of each country. In Part 3, the report analyses labour market performance and highlights the employment challenges. The growth-employment-poverty nexus is examined in Part 4. It tackles the productivity-growth
7 Charmes, Jacques (2009).
4
nexus, presents the elasticity of employment, and the underlying sectoral evolution. Part 5 is devoted to the analysis of the impact of the global financial and economic crisis. Part 6 summarizes the findings and suggests policies to meet the employment challenge.
2. Macroeconomic developments and policies
2.1 Overall trends of growth and employment
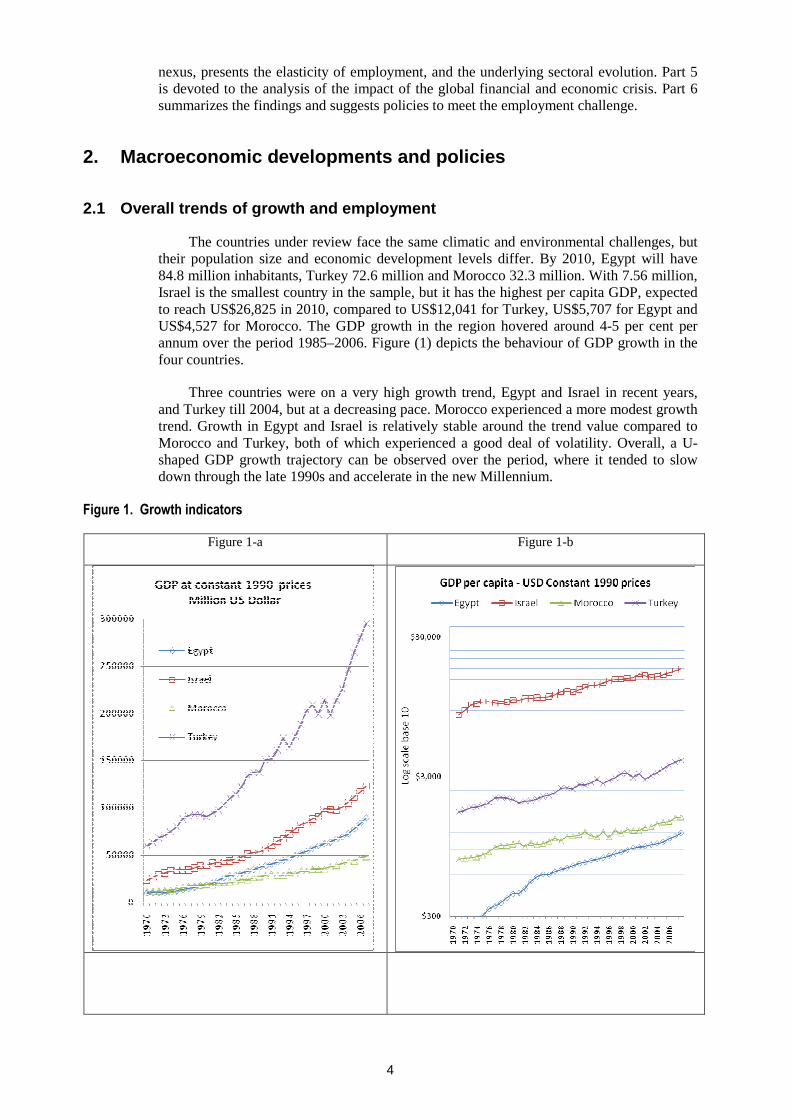
The countries under review face the same climatic and environmental challenges, but their population size and economic development levels differ. By 2010, Egypt will have 84.8 million inhabitants, Turkey 72.6 million and Morocco 32.3 million. With 7.56 million, Israel is the smallest country in the sample, but it has the highest per capita GDP, expected to reach US$26,825 in 2010, compared to US$12,041 for Turkey, US$5,707 for Egypt and US$4,527 for Morocco. The GDP growth in the region hovered around 4-5 per cent per annum over the period 1985–2006. Figure (1) depicts the behaviour of GDP growth in the four countries.
Three countries were on a very high growth trend, Egypt and Israel in recent years, and Turkey till 2004, but at a decreasing pace. Morocco experienced a more modest growth trend. Growth in Egypt and Israel is relatively stable around the trend value compared to Morocco and Turkey, both of which experienced a good deal of volatility. Overall, a U-shaped GDP growth trajectory can be observed over the period, where it tended to slow down through the late 1990s and accelerate in the new Millennium.
Figure 1. Growth indicators
Figure 1-a
Figure 1-b

5
Figure 1-c
Figure 1-d
Source : United-Nations Statistics (UN– Stat).
Table 1. Foreign trade indicator and short term projections (millions US$)
2004 2005 2006 2007 2008 2009 2010 Trade balance Egypt -9,312 -11,127 -12,558 -20,494 -26,774 -21,554 -23,696
Israel -3,149 -4,120 -3,837 -5,684 -7,239 -5,122 -5,499
Morocco -6,486 -8,204 -9,757 -14,170 -19,141 -15,353 -15,653
Turkey -22,736 -32,988 -40,941 -46,669 -53,183 -14,518 -22,525
Goods: exports fob Egypt 12,274 16,073 20,546 24,455 29,849 21,633 22,584
Israel 36,358 39,768 43,319 50,286 57,161 45,687 47,671
Morocco 9,922 10,690 11,926 15,146 19,935 14,716 16,372
Turkey 68,535 78,365 93,611 115,356 140,739 101,312 102,735
Goods: imports fob Egypt -21,586 -27,200 -33,104 -44,949 -56,623 -43,187 -46,280
Israel -39,507 -43,888 -47,156 -55,970 -64,400 -50,809 -53,170
Morocco -16,408 -18,894 -21,683 -29,316 -39,076 -30,069 -32,025
Turkey -91,271 -111,353 -134,552 -162,025 -193,922 -115,830 -125,260
Source: Economist Intelligence Unit.
All the countries’ economies are experiencing a growing openness, but their trade balances remain negative, except for a few years over the past three decades. The ratio of trade balance to GDP improved until the beginning of the 2000s. Since 2004, the trade deficit has been rising.

6
Figure 2. Trade indicators
Figure 2-a Figure 2-b
Source: UN – Stat
All were able to sustain their investment rates until 2007. Egypt stands out in maintaining a high pace of the growth of its gross fixed investment.
Table 2. Annual rate of growth of gross fixed investment
2004 2005 2006 2007 2008 2009 2010 Egypt 6.3 14.2 13.8 23.7 15.5 7.5 7
Israel 0.9 3.0 9.9 15.3 5.2 -3.8 1.2
Morocco 8.4 7.4 9.7 14.3 11.7 6 4.2
Turkey 28.4 17.4 13.3 5.4 -4.6 -17 2.5
Source: Economist Intelligence Unit.
The countries sustained their growth trend because they benefit from foreign resources. These are generated through positive services trade balances, particularly for Turkey (US$17.4 billion in 2008) and Egypt (US$14.3 billion in 2008) and from current transfers, particularly for Israel (US$8.6 billion in 2008) and Morocco (US$8.1 billion in 2008.
Table 3. Net current transfers per capita (current dollars)
2004 2005 2006 2007 2008 2009 2010
Egypt 60.33 74.46 73.41 103.90 119.73 79.34 73.60
Israel 922.79 870.14 1050.42 1007.50 1174.66 1116.22 1035.39
Morocco 159.60 173.21 201.72 243.62 256.55 230.28 234.64
Turkey 16.21 20.86 27.10 31.40 27.97 22.87 24.41
Source: Economist Intelligence Unit.
On one hand, Israel and Turkey are more heavily indebted than Morocco and Egypt, but on the other, Turkey depends more on manufacturing exports. They are thus vulnerable and may face significant growth shocks unleashed by the global economic crisis. Morocco and Egypt are not insulated. Morocco’s exports began to regress in 2008 and migrants’ remittances declined in 2009. Egypt’s exports and remittances have turned out, so far at least, to be more resilient.

7
The discussion now turns to an examination of the salient features of structural change in the countries under review. Detailed figures are presented in Annex 2. Egypt exhibits a long-term decrease in the share of agriculture in value added. But, since 2004, this trend reversed. In Morocco, the contribution of agriculture was highly unstable and followed a descending trend. In Turkey, there was a sustained reduction of agriculture’s share in value added (from 38 in 1970 to about 10 per cent in 2007). The shares of services and industry have been growing continuously, while industry’s share grew at a slower pace. In Israel, the mining and industry sectors witnessed decreasing trends, while services grew rapidly.
The numbers of employed workers in Turkey and Egypt were, respectively, about 24.5 and 20.5 million in recent years, while they were about 10 million for Morocco and 2.7 million for Israel.
Figure 3. Employment structure
Egypt – 2006 Employment (000): 20,443.6
Israel - 2006 Employment (000): 2,682.0
Morocco - 2006 Employment (000): 9,927.7
Turkey - 2007 Employment (000): 24,565.6
Source : ILO – KILM 2009.
Industry’s share of employment is relatively similar in the four countries. It is the highest in Turkey with 25.7 per cent, and the lowest in Morocco with 20.3 per cent. The numbers are very close for Egypt and Israel but, as will be seen, the technical content of the industry sector in the four countries, and the degree of education of the workers, are rather different.
Employment in services accounts for 75 per cent in Israel, 48.1 per cent in Turkey, 46.6 per cent in Egypt and 36.3 per cent in Morocco. In Israel, employment in agriculture represents only 1.6 per cent of the employed labour force. This share is much higher in Turkey, with 26.2 per cent, in Egypt 31.2 per cent, and in Morocco 43.3 per cent
The employment structure results from the long-term changes of the production structures of the four countries. For all of them, the share of agriculture in value added reduced, while those of the services grew.
The share of agriculture in total employment decreased in the 1960s and 70s. The figure in Box 1 shows the sustained decrease in the share of rural population in all the countries during the 1960s and 70s. This decrease was particularly sharp in Turkey during the 1980s. For Egypt, the share of rural population stabilized after 1981 and is still higher than 58 per cent. The activities in the Egyptian rural area are more diversified, because the rural
population inhabits areas under irrigation, and is more concentrated than in Turkey and in Morocco where rain-fed agriculture is more important.
Box 1-Evolution of rural population shares
8
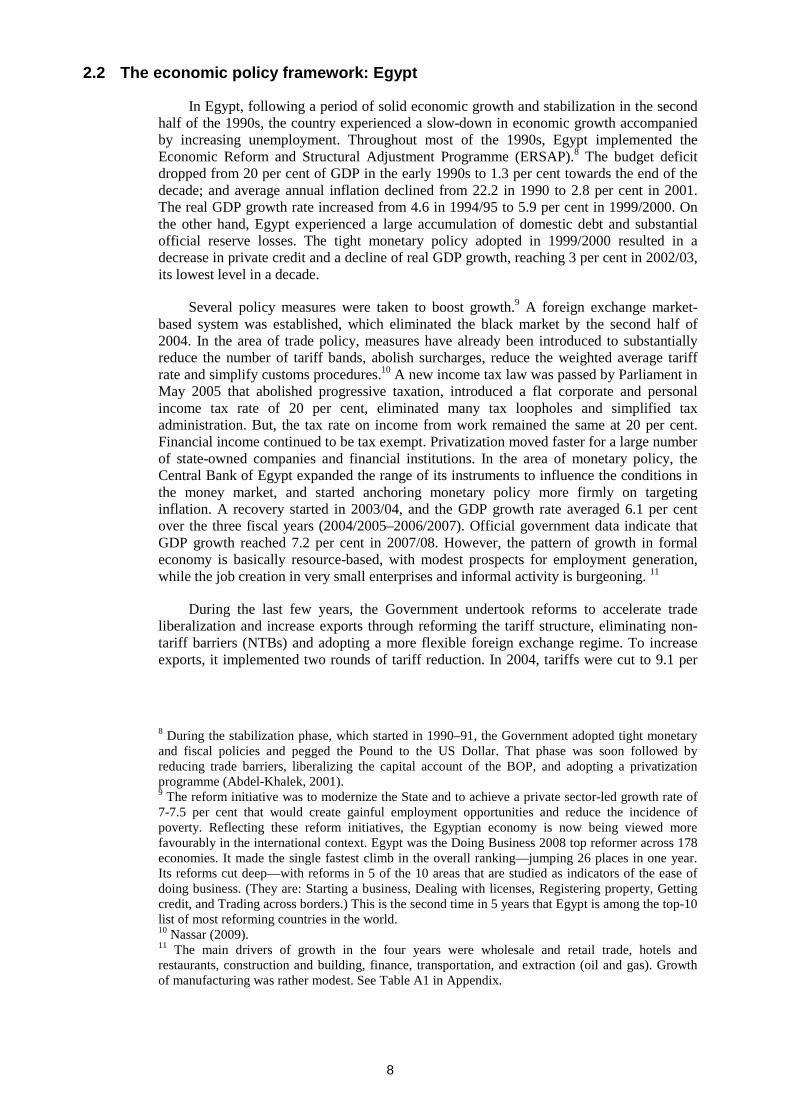
2.2 The economic policy framework: Egypt
In Egypt, following a period of solid economic growth and stabilization in the second half of the 1990s, the country experienced a slow-down in economic growth accompanied by increasing unemployment. Throughout most of the 1990s, Egypt implemented the Economic Reform and Structural Adjustment Programme (ERSAP).8 The budget deficit dropped from 20 per cent of GDP in the early 1990s to 1.3 per cent towards the end of the decade; and average annual inflation declined from 22.2 in 1990 to 2.8 per cent in 2001. The real GDP growth rate increased from 4.6 in 1994/95 to 5.9 per cent in 1999/2000. On the other hand, Egypt experienced a large accumulation of domestic debt and substantial official reserve losses. The tight monetary policy adopted in 1999/2000 resulted in a decrease in private credit and a decline of real GDP growth, reaching 3 per cent in 2002/03, its lowest level in a decade.
Several policy measures were taken to boost growth.9 A foreign exchange market-based system was established, which eliminated the black market by the second half of 2004. In the area of trade policy, measures have already been introduced to substantially reduce the number of tariff bands, abolish surcharges, reduce the weighted average tariff rate and simplify customs procedures.10 A new income tax law was passed by Parliament in May 2005 that abolished progressive taxation, introduced a flat corporate and personal income tax rate of 20 per cent, eliminated many tax loopholes and simplified tax administration. But, the tax rate on income from work remained the same at 20 per cent. Financial income continued to be tax exempt. Privatization moved faster for a large number of state-owned companies and financial institutions. In the area of monetary policy, the Central Bank of Egypt expanded the range of its instruments to influence the conditions in the money market, and started anchoring monetary policy more firmly on targeting inflation. A recovery started in 2003/04, and the GDP growth rate averaged 6.1 per cent over the three fiscal years (2004/2005–2006/2007). Official government data indicate that GDP growth reached 7.2 per cent in 2007/08. However, the pattern of growth in formal economy is basically resource-based, with modest prospects for employment generation, while the job creation in very small enterprises and informal activity is burgeoning. 11
During the last few years, the Government undertook reforms to accelerate trade liberalization and increase exports through reforming the tariff structure, eliminating non-tariff barriers (NTBs) and adopting a more flexible foreign exchange regime. To increase exports, it implemented two rounds of tariff reduction. In 2004, tariffs were cut to 9.1 per
8 During the stabilization phase, which started in 1990–91, the Government adopted tight monetary and fiscal policies and pegged the Pound to the US Dollar. That phase was soon followed by reducing trade barriers, liberalizing the capital account of the BOP, and adopting a privatization programme (Abdel-Khalek, 2001). 9 The reform initiative was to modernize the State and to achieve a private sector-led growth rate of 7-7.5 per cent that would create gainful employment opportunities and reduce the incidence of poverty. Reflecting these reform initiatives, the Egyptian economy is now being viewed more favourably in the international context. Egypt was the Doing Business 2008 top reformer across 178 economies. It made the single fastest climb in the overall ranking—jumping 26 places in one year. Its reforms cut deep—with reforms in 5 of the 10 areas that are studied as indicators of the ease of doing business. (They are: Starting a business, Dealing with licenses, Registering property, Getting credit, and Trading across borders.) This is the second time in 5 years that Egypt is among the top-10 list of most reforming countries in the world. 10 Nassar (2009). 11 The main drivers of growth in the four years were wholesale and retail trade, hotels and restaurants, construction and building, finance, transportation, and extraction (oil and gas). Growth of manufacturing was rather modest. See Table A1 in Appendix.

9
cent on average, and the number of ad valorem tariff bands was reduced. In addition, service fees and import surcharges were removed. In February 2007, customs tariffs were reduced on 1,114 articles, including raw materials, and intermediate and consumer goods. The new modifications reduced the average tariffs by almost 25 per cent. Moreover, Egypt concluded a number of trade agreements with its main trading partners, namely the EU, the US and Arab countries. It was expected that the dynamic effects of these agreements would stimulate growth, trade, competition, investment and employment.
Available evidence shows that public investment fell sharply while the increase of private investment was not sufficient to compensate for the fall in public investment. The result was a lower rate of capital accumulation.
The sixth five year plan (2007–2011) is very ambitious and relies heavily on manufacturing industries to lead growth. They are expected to grow at a higher annual rate than the economy as a whole (8.8 as opposed to 8.4 per cent by 2011), and at a much higher rate than agriculture (target annual rate of growth in agriculture by 2011 being 3.9 as opposed to 8.8 per cent in industry). The plan also puts a lot of weight on the participation of the private sector. Its contribution to investment in manufacturing wasexpected to account for 89 percent in 2007 and increase to 96 percent by 2011 and total contribution to employment throughout the five year plan is estimated at 3 million jobs.12
Table 4. Planned Sectoral Composition in Egypt’s Sixth Five Year Plan
Sector Target 2007/2008 (LE Target 2011/2012 Relative importance Planned (%) rate of growth Textiles & clothing 39.0 79.6 30.9 104
Chemicals 33.0 67.2 26.1 103.6
Engineering 20.6 41.7 16.2 102.4
Food 19.1 39.0 15.1 104.2
Metals 14.8 30.1 11.7 103.3
Total 126.5 257.7 100 103.7
Source: Ministry of Economic Development 2006 (Plan documents, chapter five).
Liberalization was followed by a resilient trade gap; wide, since the 1980s, it increased sharply during the first years of the current decade.
2.3 The economic policy framework: Israel
Since the turn of the century, Israel’s economy has grown significantly. However, the economic climate changed abruptly in late 2000 due to the burst of the dot-com bubble and the commencement of the second Intifada (Palestinian uprising). These events generated a severe recession that had severe effects on the labour market. The unemployment rate increased to 10.7 per cent in 2003 and the Government deficit climbed. Measures were taken to accelerate economic reforms. There were major cuts in social benefits and in government spending, as well as reforming capital and pensions markets and the tax system.
The GDP of Israel has evolved concurrently with the economic cycle, experiencing a boom since the turn of the century, followed by a sharp decline with the burst of the dot-com bubble.13 Subsequently, a period of stable economic growth can be observed beginning
12 Abla Abdel-Latif, “The potential impact of recent industrial policy changes in Egypt on the environment ``, ECES, Working Paper No. 137, September 2008. 13 In the year 2000, which witnessed rapid growth particularly in high technology, being one of the stronger sectors of Israel's economy, the annual growth rate was 8.9 per cent. After the economic

10
from 2003,14 partly as a result of the policy changes put into effect in 2002–2003, as the Ministry of Finance enacted extensive economic reforms in the taxation and social security system. It lowered the tax rates on income from work, and cut social benefits concurrently. The tax reforms have also introduced taxation on financial income in Israel for the first time. The reforms of the social security system introduced significant cuts in welfare budgets and social security benefits (Nathanson, 2009). Monetary policy focused on targeting inflation, using interest-rate changes; the historical “crawling band” used to maintain a certain level for the US$/NIS in currency markets had been expanded in the 1990s. It is gradually being replaced by a policy of no intervention in the foreign exchange market.15
Additional long-term policy plans include a scheme to enhance economic activity in the areas outside of the technologically developed centre. These long-term measures to develop the “periphery” are intended to increase the population in the north and south of the country until 2020 by 370,000 and 336,000, respectively. It also aims to increase the number of employed persons in the north and south of the country until 2020 by 220,000 and 136,000, respectively.
These goals will be met by providing support to the peripheral areas. Measures include supporting the education system, including budgetary preference and financial backing for municipalities in these areas. In addition, the Government aims to provide enhancement and development of industries and develop infrastructure and mass transportation. Army bases will be transferred from the centre of the country to the periphery. Various budgets and funds are being channelled towards the north and south of the country. Managers of local municipalities will receive additional training, and vocational training for youngsters will be extended. The tourism infrastructure will be supported and developed. These measures, and more, are planned as part of the long-term plan for growth in the periphery.
2.4 The economic policy framework: Morocco
Economic growth in Morocco has been on an improving trend since the mid-1990s. From 1990–2008 the annual growth rate averaged 3.8 per cent. During 2000–2008, it increased to 5.1 per cent, while exhibiting less volatility over this period as shown in Figure 1 above. Dependence on internal demand as an ‘’engine’’ of growth has increased during the period. On average, consumption growth explains more than 60 per cent of overall growth (Aloui, 2009). In most recent years, investment has been the real source of growth, while net foreign demand (measured by net exports) has been deteriorating. This suggests that imports are increasingly eating into the market for domestic production.
The sectoral composition of growth has been biased in favour of the non- tradable sectors (construction and services) and against the shares of the main tradable sectors
downturn of 2001–2002, the economy stabilized to the annual growth rate of close to 5 per cent, including 2008. 14 Nathanson (2009) argues that most of the short-term fluctuations in GDP are the result of changes in demand. However, an overall view of the cycle clearly shows that supply factors, such as technological improvements, the increase in the quality of the labour force and the increased efficiency of firms in the economy during recessions, have a decisive influence on Israel’s GDP. 15 However, this has recently changed due to the recent economic crisis and the strengthening of Israel Shekel, which has had a negative effect on exports. The Governor of the Bank of Israel has instituted an active policy to prevent the Dollar from declining against the Shekel, thereby enabling an exchange rate which maintains export profitability.

11
(agriculture and manufacturing) exhibiting ‘Dutch Disease’ symptoms.16 One tentative explanation of this allocation outcome may be found in Morocco's commitment to a progressive trade-opening policy starting in the mid 1990s, thanks to the EU-Moroccan Association Agreement and its free-trade provisions. Various measures and policies aiming to maximize the advantages of a closer relationship between Morocco and the EU were implemented.
Trade liberalization in Morocco started in the 1980s, but the tariff rate for agricultural products remains very high. Non-agricultural products tariff reforms in 1983 and 1993 involved reducing tariffs, simplifying customs policy by reducing the number of taxes and lines. At the same time most quantitative restrictions, were removed and customs procedures simplified.
This trade liberalization reduced relative prices in the tradable sector (tariff reduction plus strong currency), thereby increasing the purchasing power of informal incomes in the non-tradable sector,17 and attracting the inactive or unemployed labour force to those relatively underproductive sectors, thus fuelling economic growth at the expense of the overall productivity of the economy (Aloui, 2009)
Moroccan industrial policies are based on a value chain approach in which value creation is dependent, more or less, on a successful integration into global ‘’networks’’, where some leading firms have a commanding position. Attracting foreign direct investment (FDI) and other mobile factors of production implies reducing ‘’transactions costs’’ and adapting sectoral ‘’regulations’’ to global norms.
Since 2000, Morocco has adopted a series of ambitious plans to boost its economy within this framework. In 2001, Moroccan officials initiated Vision 2010, which aims to accommodate 10 million visitors, and create the capacity for an additional 160,000 beds by 2010. The plan was expected to raise the share of tourism in GDP from 8.5 in 2001 to 20 per cent in 2010, attract about 9 billion euros (€) of investment, and create 600,000 jobs. The core part of this is Plan Azur, which is basically a FDI attraction plan based on public investments in infrastructure and long-term public land leasing to global leaders.
In 2005, the Government introduced Plan Emergence dedicated to renewing the manufacturing base in seven key sectors with strong export potential. As for Plan Azur, initial objectives were very ambitious. The plan aimed to increase GDP growth by 1.6 percentage points over 10 years and create 500,000 jobs by boosting productivity. The seven sectors are: autos, aeronautics, electronics, textiles, off-shoring, food-processing and fisheries. In early 2008, this was complemented by the Plan Envol, which added three new sectors: biotechnology, microelectronics and nanotechnology. In the application of this plan, the Government has created zones to attract foreign investment, to delocalize services (Casanearshore, Technopolis, Feshore etc), is negotiating a huge delocalization project with Renault Nissan and is launching other dedicated zones for agriculture and fisheries. Between 2005 and 2009, other sectors concerned with similar plans were handicrafts, retail, agriculture and fisheries.
16 The Dutch Disease thesis maintains that an increase in revenues from natural resources or foreign transfers would de-industrialise a nation’s economy by raising the real exchange rate and jeopardizing the competitiveness of the tradable activities. 17 The prices of manufactured goods, locally produced or imported, decreased because of tariff reductions, non tariff barriers alleviation and the resulting competition enhancement. Naturally protected activity, mainly wholesale and real estate which gather the bulk of informal employment and very small enterprises, witnessed higher demand, value-added rise and per capita income improvement.
12
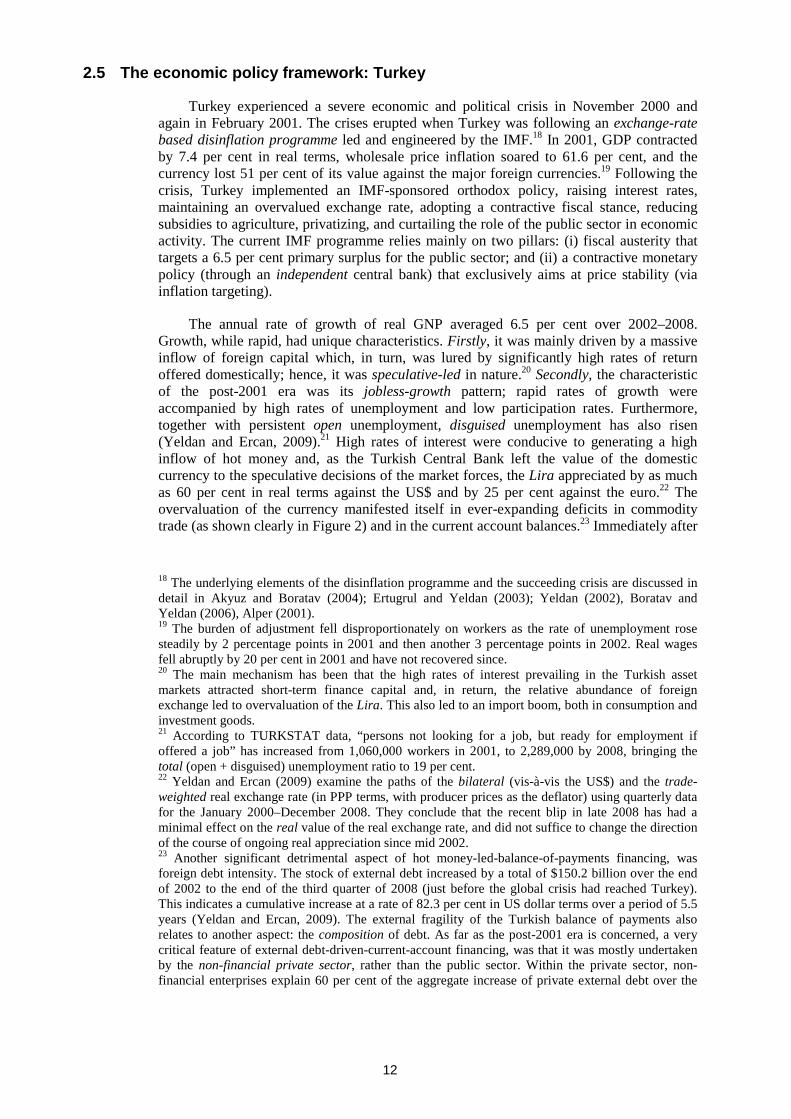
2.5 The economic policy framework: Turkey
Turkey experienced a severe economic and political crisis in November 2000 and again in February 2001. The crises erupted when Turkey was following an exchange-rate based disinflation programme led and engineered by the IMF.18 In 2001, GDP contracted by 7.4 per cent in real terms, wholesale price inflation soared to 61.6 per cent, and the currency lost 51 per cent of its value against the major foreign currencies.19 Following the crisis, Turkey implemented an IMF-sponsored orthodox policy, raising interest rates, maintaining an overvalued exchange rate, adopting a contractive fiscal stance, reducing subsidies to agriculture, privatizing, and curtailing the role of the public sector in economic activity. The current IMF programme relies mainly on two pillars: (i) fiscal austerity that targets a 6.5 per cent primary surplus for the public sector; and (ii) a contractive monetary policy (through an independent central bank) that exclusively aims at price stability (via inflation targeting).
The annual rate of growth of real GNP averaged 6.5 per cent over 2002–2008. Growth, while rapid, had unique characteristics. Firstly, it was mainly driven by a massive inflow of foreign capital which, in turn, was lured by significantly high rates of return offered domestically; hence, it was speculative-led in nature.20 Secondly, the characteristic of the post-2001 era was its jobless-growth pattern; rapid rates of growth were accompanied by high rates of unemployment and low participation rates. Furthermore, together with persistent open unemployment, disguised unemployment has also risen (Yeldan and Ercan, 2009).21 High rates of interest were conducive to generating a high inflow of hot money and, as the Turkish Central Bank left the value of the domestic currency to the speculative decisions of the market forces, the Lira appreciated by as much as 60 per cent in real terms against the US$ and by 25 per cent against the euro.22 The overvaluation of the currency manifested itself in ever-expanding deficits in commodity trade (as shown clearly in Figure 2) and in the current account balances.23 Immediately after
18 The underlying elements of the disinflation programme and the succeeding crisis are discussed in detail in Akyuz and Boratav (2004); Ertugrul and Yeldan (2003); Yeldan (2002), Boratav and Yeldan (2006), Alper (2001). 19 The burden of adjustment fell disproportionately on workers as the rate of unemployment rose steadily by 2 percentage points in 2001 and then another 3 percentage points in 2002. Real wages fell abruptly by 20 per cent in 2001 and have not recovered since. 20 The main mechanism has been that the high rates of interest prevailing in the Turkish asset markets attracted short-term finance capital and, in return, the relative abundance of foreign exchange led to overvaluation of the Lira. This also led to an import boom, both in consumption and investment goods. 21 According to TURKSTAT data, “persons not looking for a job, but ready for employment if offered a job” has increased from 1,060,000 workers in 2001, to 2,289,000 by 2008, bringing the total (open + disguised) unemployment ratio to 19 per cent. 22 Yeldan and Ercan (2009) examine the paths of the bilateral (vis-à-vis the US$) and the trade-weighted real exchange rate (in PPP terms, with producer prices as the deflator) using quarterly data for the January 2000–December 2008. They conclude that the recent blip in late 2008 has had a minimal effect on the real value of the real exchange rate, and did not suffice to change the direction of the course of ongoing real appreciation since mid 2002. 23 Another significant detrimental aspect of hot money-led-balance-of-payments financing, was foreign debt intensity. The stock of external debt increased by a total of $150.2 billion over the end of 2002 to the end of the third quarter of 2008 (just before the global crisis had reached Turkey). This indicates a cumulative increase at a rate of 82.3 per cent in US dollar terms over a period of 5.5 years (Yeldan and Ercan, 2009). The external fragility of the Turkish balance of payments also relates to another aspect: the composition of debt. As far as the post-2001 era is concerned, a very critical feature of external debt-driven-current-account financing, was that it was mostly undertaken by the non-financial private sector, rather than the public sector. Within the private sector, non-financial enterprises explain 60 per cent of the aggregate increase of private external debt over the

13
the completion of the Uruguay Round, Turkey established a Customs Union with the European Community (EC) in 1995. Enforced in 1996, it is the cornerstone of Turkey’s trade policies. Turkey entered into the globalization process, opening its markets to imports and getting better access for its exports on the markets of the WTO members and other free-trade agreement partners.24
On the side of non-agricultural products, Turkey began to apply the Community’s Common Customs Tariff (CCT) on the imports of industrial goods from third countries. Turkey’s simple average protection rate for the third countries declined from approximately 15 to 4.2 per cent in 2007. Since 1996, this rate is zero for the EU and EFTA countries. Hence, despite its developing country status in the WTO, Turkey has embarked on one of the most comprehensive tariff reductions among member countries. Regarding agricultural products, Turkey reduced all its tariffs and reached an average customs duty for agricultural products of 59.2 per cent by 2006.
Since 2004, the agricultural policy supports farmers with a social and economic safety net and put in place a set of measures to increase productivity in the sector.25 Agriculture is one of the dominant sectors in the Turkish economy with its 27 per cent share of total employment. However, in comparison to the other sectors, with respect to employment, the income of those employed in the agricultural sector remains extremely low.
Manufacturing is a major beneficiary of State aid. It is also the main beneficiary of various incentive schemes (duty and tax concessions in particular), as well as export credits and guarantees. Most-favoured nation’ (MFN) customs tariffs on manufactured goods (Major Division 3 of ISIC Revision 2) average 10.9 per cent (down from 11.1 per cent in 2003) and relatively high rates (ranging up to 225 per cent) continue to apply to some processed food products. The tariff structure does not encourage investment in certain manufacturing activities, such as the chemical and plastic industries where the tariff displays negative escalation.
To conclude the discussion of macroeconomic developments, it is interesting to compare Turkey's experience with respect to capital flows, to that of the other countries covered in this study. In the case of Egypt, the inflow was mainly of the hot-money variety attracted by interest rate arbitrage, leading to an exchange-rate appreciation with all the
post-2001 period and accounts for 70.9 per cent of the total stock of private debt by 2008. This persistent external fragility is actually one of the main reasons why Turkey was hardest hit among the emerging market economies in the post 2008 global crisis. Turkish GDP fell by 6.8 per cent in the last quarter of 2008, and by 13.8 per cent in the first quarter of 2009. The unemployment rate jumped from 9.9 per cent in September 2008 to 14.9 per cent in April 2009. 24 The most recent changes in the import regime were introduced with the Import Regime Decree for the year 2007, which was published in the Official Journal (No: 26392 bis) on 30 December 2006. The Import Regime Decree of 2007 has been prepared by taking into consideration the Agreement Establishing the WTO, the Customs Union Decision (CUD), the free trade agreements with various countries, the preferential treatments granted under the Generalized System of Preferences (GSP) to developing, least developed and special incentive arrangement countries, and also the needs and demands of the agricultural and industrial sectors in accordance with the objectives determined by the development plans and annual programs. 25 The set of measures includes (a) withdrawing the State from direct involvement in production, processing and marketing of crops; (b) reducing output intervention purchases financed from the budget leading to price cuts; (c) phasing out price support and credit subsidies, and their replacement by a less distorting direct income support (DIS) system to farmers based on a uniform per hectare payment of about US$90/ha and making available one-time transition grants to farmers, switching out of crops and suffering excess supply, such as hazelnuts and tobacco, to assist them covering their transitional costs; and, (d) facilitating the transition to efficient production patterns.

14
consequences of widening the trade gap and generating a pattern of GDP growth with clear Dutch Disease symptoms. In Israel, the inflow was more of the FDI variety, attracted by very high expenditure on Research and Development (R&D) and a highly skilled work force. The result was increased capital and enhanced productivity and competitiveness. In Morocco, it was remittances on a large scale coupled with trade liberalization that produced Dutch Disease symptoms.
3. Labour market and employment challenges
Labour supply is a function of demographic, as well as socio-economic variables, such as fertility rates, migration and participation rates. Each of these variables depends on other sets of variables, in particular labour market policies, education policies and retirement regulations.
One of the salient characteristics of the labour market in developing countries is structural duality of which there are two distinct segments: the formal segment and the non-formal segment. According to Ghose et al., employment in the formal segment is the sum of wage employment in the public sector and wage employment in private sector establishments employing at least ten workers. By contrast, employment in the non-formal segment is the sum total of self-employment and casual/irregular wage employment. The gap in output per worker between these two segments of the labour market is rather wide; in the most developed countries output per worker in the non-formal segment is less than 25 per cent of that in the formal segment (Ghose et al., 2008, pp. 71-72).26
It should be stressed that migration is an important factor in understanding the nature of the relation between growth and labour market outcomes in the Mediterranean countries. Emigration comes as a last instance solution of the diverse skill demand and supply mismatches in the labour market. Egypt, Morocco, and Turkey are labour exporting countries, whereas the labour force growth of Israel is heavily influenced by successive immigration waves.
In most developing countries, employment is concentrated in the non-formal segment of the economy where capital is scarce, resulting in serious underemployment and low productivity. At the other end, capital and skills are concentrated in the formal segment. As in developed countries, minimum wages, mandatory benefits and severance pay raise labour costs and create a wedge between the covered and uncovered sector. But, in developing countries the gap in labour costs and job protection between sectors is generally rather wide. Moreover, the high wages, or at least the high-skilled worker, is found in a large government sector and, generally, a smaller formal private sector.27 The analysis in this section shows that the employment situation in Egypt, Morocco and Turkey follows this pattern, while the labour market in Israel presents an includes a growing share of low paid and informally employed workers coming from minorities: native Arabs and non-Jewish migrants.
26 The authors’ report estimates of this ratio for Egypt 23.3 per cent in 2002 and Turkey 16.1 per cent in 2003. 27 Hamermesh, D. S. 1996. Labor Demand, Princeton Paperbacks (Princeton New Jersey), p. 366.

15
3.1 Egypt
In Egypt, the overall labour force participation rate was estimated to be 45 per cent in 2008. While labour supply grew at an average annual rate of 2.2% between 1996 and 2006, employment increased during the same period by an average annual rate of 2.4 per cent and reached a figure of 20.7 million. The average growth rates were higher for rural than urban areas, and for males than females (Nassar, 2009).
On one hand, the pattern of development in the 1960s reflected a strong urban bias as it emphasized growth in a few sectors (industry) and a few geographical regions (Alexandria and Cairo). On the other hand, various aspects of agricultural policy (viz., strict quota system, fixed prices of input and output, land tenure arrangements, and a biased investment policy) led to the decline in relative real per capita income of rural workers.28 As a result, labour absorption capacity in the agriculture sector declined from 52.8 per cent over the periods 1959/60–1965/66 to 28 per cent over the period 1986–2006 (Nassar, 2009).
The sectoral distribution of employment indicates that currently 27 per cent of the labour force in 2006/2007 was working in agriculture and fisheries characterized by low value-added and productivity. The manufacturing sector, characterized by its forward and backward linkages, employs only 13.2 per cent of total workers. Trade and finance is absorbing 10.2 per cent of the total employment, the construction sector 7.9 per cent and the general government administration (public utilities) 23.5 per cent. The trend in the distribution of the labour force by economic sectors is the growing importance of the service sector and the declining importance of the agriculture sector in employment absorption over the period 1990/91–2006/2007.
The distribution of employees by education reveals, for the period 1998–2006, a decreasing share of illiterate and low educated (reading/writing and primary education levels) respectively from 34.9 to 24 per cent.
Table 5. The Distribution of Public and Private Employees by Education in EGYPT (percent)
Education level
1988 1998 2006
Private Public Total
Private
Public Total
Private
Public Total
Illiterate 31.0 9.9 17.6 18.4 4.9 11.0 13.0 4.1 9.1
Read & Write 19.3 14.8 16.5 10.9 6.3 8.4 6.2 3.4 5.0
Primary 9.1 7.0 7.8 15.8 8.0 11.5 13.3 5.5 9.9
Lower secondary 6.5 6.2 6.3 8.5 5.5 6.8 6.5 4.4 5.6
Upper secondary 2.0 2.8 2.5 1.2 1.2 1.2 1.1 0.7 0.9
Vocational high school 15.9 22.7 20.2 25.7 27.6 26.8 35.7 33.9 34.9
Post secondary 4.2 7.8 6.5 5.2 12.9 9.4 5.5 9.8 7.4
Tertiary 11.9 28.8 22.6 14.4 33.5 24.9 18.8 38.1 27.2
Total 100.0 100.0 100.0 100.0 100.0 100.0 100.0 100.0 100.0
Source: Djavad Salehi-Isfahani, “Education and Earnings in the Middle East: a comparative study of returns to schooling in Egypt, Iran, and Turkey”, ERF, Working Paper 504, September 2009
The proportion of workers, who achieved the secondary or the vocational high school levels, increased from 29 per cent in 1998 to 41.4 per cent in 2006. During the same period, the share of tertiary educated employees progressed from 22.6 to 27.2 per cent. The public sector employs a higher proportion of the more educated, but the private sector has also
28 Compared to urban workers, the real wage of rural workers declined from 37.1 per cent in 1975 to 22.5 per cent in 2004.
16
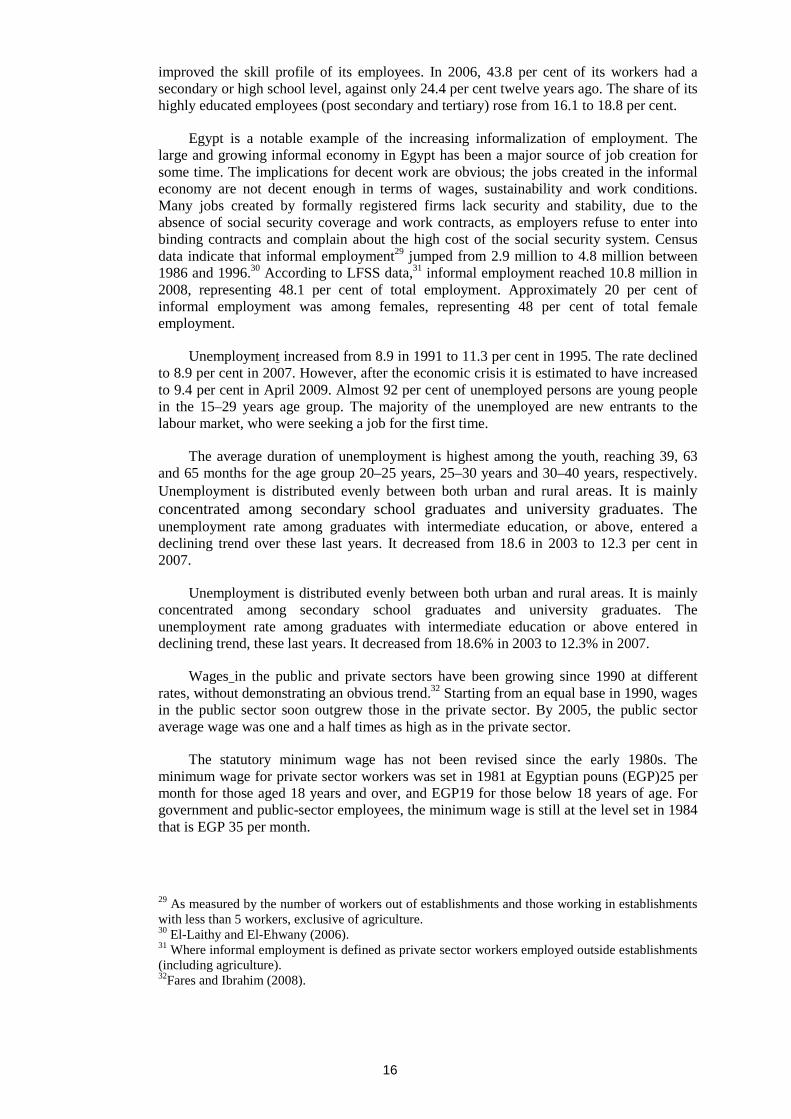
improved the skill profile of its employees. In 2006, 43.8 per cent of its workers had a secondary or high school level, against only 24.4 per cent twelve years ago. The share of its highly educated employees (post secondary and tertiary) rose from 16.1 to 18.8 per cent.
Egypt is a notable example of the increasing informalization of employment. The large and growing informal economy in Egypt has been a major source of job creation for some time. The implications for decent work are obvious; the jobs created in the informal economy are not decent enough in terms of wages, sustainability and work conditions. Many jobs created by formally registered firms lack security and stability, due to the absence of social security coverage and work contracts, as employers refuse to enter into binding contracts and complain about the high cost of the social security system. Census data indicate that informal employment29 jumped from 2.9 million to 4.8 million between 1986 and 1996.30 According to LFSS data,31 informal employment reached 10.8 million in 2008, representing 48.1 per cent of total employment. Approximately 20 per cent of informal employment was among females, representing 48 per cent of total female employment.
Unemployment increased from 8.9 in 1991 to 11.3 per cent in 1995. The rate declined to 8.9 per cent in 2007. However, after the economic crisis it is estimated to have increased to 9.4 per cent in April 2009. Almost 92 per cent of unemployed persons are young people in the 15–29 years age group. The majority of the unemployed are new entrants to the labour market, who were seeking a job for the first time.
The average duration of unemployment is highest among the youth, reaching 39, 63 and 65 months for the age group 20–25 years, 25–30 years and 30–40 years, respectively. Unemployment is distributed evenly between both urban and rural areas. It is mainly concentrated among secondary school graduates and university graduates. The unemployment rate among graduates with intermediate education, or above, entered a declining trend over these last years. It decreased from 18.6 in 2003 to 12.3 per cent in 2007.
Unemployment is distributed evenly between both urban and rural areas. It is mainly concentrated among secondary school graduates and university graduates. The unemployment rate among graduates with intermediate education or above entered in declining trend, these last years. It decreased from 18.6% in 2003 to 12.3% in 2007.
Wages in the public and private sectors have been growing since 1990 at different rates, without demonstrating an obvious trend.32 Starting from an equal base in 1990, wages in the public sector soon outgrew those in the private sector. By 2005, the public sector average wage was one and a half times as high as in the private sector.
The statutory minimum wage has not been revised since the early 1980s. The minimum wage for private sector workers was set in 1981 at Egyptian pouns (EGP)25 per month for those aged 18 years and over, and EGP19 for those below 18 years of age. For government and public-sector employees, the minimum wage is still at the level set in 1984 that is EGP 35 per month.
29 As measured by the number of workers out of establishments and those working in establishments with less than 5 workers, exclusive of agriculture. 30 El-Laithy and El-Ehwany (2006). 31 Where informal employment is defined as private sector workers employed outside establishments (including agriculture). 32Fares and Ibrahim (2008).

17
The growth in wages in both the public and private sectors is not due to growth in labour productivity. The latter has been stagnant, if not declining, over the last two decades (especially in the industrial sector). The stagnation of labour productivity in the public sector could be explained by the growing numbers of labour employed to an almost fixed level of capital (with investments in the public sector declining throughout the last decade). The rate of growth of productivity in the private sector has been higher than that in the public sector since the 1990s, but not high enough when compared with the growth in capital employed by the private sector.
3.2. Israel
In Israel, the main trend of the participation rate for the overall population33 has been a steady upward climb (from 54.3% in 2000 to 56.8% in 2009).
Male participation rates (and employment rates) changed little over the last 20 years, except for the shake-out of older male workers around the millennium. Female labour force participation and employment increased strongly over the past two decades from 47 to almost 60 per cent in 2008. Female labour force behaviour has changed with gains in educational attainment among women, and as facilitated by childcare and part-time employment opportunities.34
About one-third of total employment in Israel is in the public sector. Workers in the education sector (40 per cent) and health and welfare service workers (30 per cent) constitute the largest groups of public sector employees. Public sector employment peaked in 2002 at 34 per cent of all employment. The Government put restrictions on new hiring to curb public spending. At the same time, indirect employment through sub-contracting and Temporary Work Agencies (TWAs) increased.
The share of employed workers in the manufacturing sector fell from 20 in 1995 to 16 per cent in 2008. Over the same period, commercial services accounted for about 14 per cent of employment, while the employment share of business services increased from 9 in 1995 to 14 per cent in 2008. In the financial services sector, employment fluctuated around 4 per cent over the period 1995-2008. About 5 per cent of employment is in the construction sector and in the accommodation services sector. Agriculture accounts for less than 2 per cent of employment.
33 The Israeli population has grown from almost 4 million in 1980 to 7.4 million by the end of 2008. Between 1948 and 2007, the migration balance accounted for almost 40 per cent of overall population growth. Migration to Israel continues, and includes a substantial share of foreign workers with temporary permits. On 31 December 2007, the official Israeli population statistics (which cover East Jerusalem) considered the following population groups: Jews (75.7 per cent of the population), Arabs (20 per cent of the population), Christian non-Arabs (0.4 per cent), and those not classified by
religion (3.9 per cent of the population). 34 The 2003 reforms in Israel social security and taxation scheme have focused on cutting social benefits and direct income taxation. These structural changes were done in an attempt to increase the participation rate in the civilian labour force, and indeed have boosted participation rates to new levels.

18
Figure 4. Employment distribution by sector in Israel (2008)
Agriculture, 2%
Manufacturing, 16%
Construction, 5%
Commerce and repairs
services , 14%
Accomodation services
and restaurants, 5%
Banking, insurance and
finance, 4%
Business services, 14%
Public sector, 32%
Other, 10%
0% 10% 20% 30% 40% 50% 60% 70% 80% 90% 100%
Note: For technical reasons, this figure uses Israel’s official statistics, which include data relating to the Golan Heights, East Jerusalem and
Israeli settlements in the West Bank.
Source: Bank of Israel, OECD “Labour Market and Social Policy review of Israel”, 2009, cited in OECD (2009).
Construction and agriculture are two sectors which employ large numbers of both cross-border and foreign workers (the home-care sector also employs a large number of workers from overseas).35 Overall, cross-border workers (2 per cent) and foreign workers (7 per cent) constitute less than 10 per cent of the workforce in Israel. Jewish and Arab workers each account for just over one-third of the workforce in the construction sector, with cross-border workers and foreign workers together making up the other third. By contrast, among unskilled agricultural workers, Jewish and Arab workers make up only 20 per cent of the workforce; another 20 per cent are Palestinian cross-border workers, while 60 per cent of agricultural workers are from overseas. Many of these workers are employed under precarious employment conditions, a situation that the labour inspectorate has been unable to police effectively, while the foreign labour migration system allows exploitation of foreign workers to continue.36
Unemployment levels in Israel have been relatively high in comparison with other developed countries. But, in recent years, most likely in relation to the effect of the economic reforms instigated in 2003, the unemployment rate has decreased significantly. Since 2004, work stability and work safety laws exerted a positive effect on employment duration that implies permanent workers enjoy high job security. In 2008, Israel’s workers still faced an unemployment rate of 6 per cent. The level of unemployment in Israel depends strongly on the business cycle of the global economy. In the first quarter of 2009, the unemployment rate in Israel was 7.6 per cent. Unemployment is the main cause of poverty and seems related to education and ethnicity.37
The unemployment rate in the Arab sector is also higher than in the Jewish sector. For instance, in 2007 it was 8.9 per cent for the Arab-Israelis while the national average was 7.3 per cent. One of the main reasons for higher unemployment rates among Arab-Israelis is educational attainment. On a broader scale, in terms of overall development of the labour market, the demand for graduates of academic establishments has expanded while the
35 OECD. 2009. Labour Market and social policy review of Israel. Following this OECD report, “Reliable estimates on the number of cross-border workers engaged in home-care service employment are not available”. 36 OECD. 2009. op.cit., p. 33. 37 “Minorities in Israel face both cultural and social barriers upon entering the labour market. The most significant minority group in Israel labour force, comprising about 20% of the population, is Israel Arabs.” Nathanson, 2009, p. 37.

19
demand for unskilled labour has gradually declined. Thus the Arab population finds it hard to cope with a reduced demand for their skills.
The reason for the low educational attainment of this minority is mainly due to the inferior State-funded public education system: in 2006, bagrut (high-school diploma) attainment rates in the Arab sector were 49.4 per cent, whereas the corresponding rate in the Jewish sector was 64.3 per cent.
Wages are characterized by a high degree of inequality. Wage inequality, as measured by the Gini coefficient, increased from 0.25 in 1975 to 0.33 in 2003, and with strong growth since then until 2009, wage inequality is likely to have increased further.38
The minimum wage is set by the Government annually, at no less that 47.5 per cent of the average wage. In 2008, the monthly minimum wage was New Israeli Sheqel (NIS)3,850. In general, public sector employees and employees of large corporations are not exposed to minimum wage violations, which are more prevalent in small businesses.
The gradual decline in the wages of unskilled workers relative to those of skilled workers results from rising wages in the fast growing (high-tech) sectors of the economy, while at the same time wage growth of low-skilled workers is also limited because of the presence of low-wage cross-border and foreign workers in the Israeli labour market.39
Wages are particularly low for employees in the unskilled or low-skilled sectors of the economy, where they are frequently below the official minimum wage. In 2007, about 3 per cent of full-time employees (and almost 10 per cent of all employees) earned less than half the minimum wage and 10 per cent of full-time employees (and 16 per cent of all employees) earned between 50 and 100 per cent of the minimum wage.
3.3 Morocco
Labour supply in 2008 is estimated at 11.46 million persons according to the Annual Employment Survey, of which 72.8 per cent are males and 51.4 per cent are urban residents. Between 1960 and 2004, labour supply increased 3.6 times, corresponding to an annual growth rate of 2.9 per cent. Labour supply has grown at a higher rate than total population (2.2 per cent), as a consequence of a modification of the population age structure and of female participation rates.40 There has also been an improvement in the general educational profile, since the share of those who have more than a primary level of education reached 50.7 per cent in 2004 as against 31.1 per cent in 1985. In this group, those with a vocational training level increased their share from 21.2 in 1985 to 31.4 per cent in 2008. Employed people with tertiary level education in urban areas have doubled their number in total employment from 10 to 20 per cent (Aloui, 2009).
38 OECD. “Labour market and social policy review of Israel”, draft report from the Secretariat, 21–23 October 2009. 39 OECD (2009), ibidem. 40 In Morocco, the census tabulations are different from the Employment Survey tabulaitons. The census covers the whole population, while Employments surveys are limited theto adult population. For 1994 and 2004, the labour force participation rates (LFPR) from the census were respectively 32.0 percent and 35.9 percent. Based on the employment surveys, the labour force participation rates, for the 15 years old or more population, reached in 2003 were 52.4 percent and began a decreasing trend in 2004 with 52.2 percent in 2004 and 50.6 percent in 2008. and 49.8 percent in the third trimester of 2009. The last decade trend of the LFPR reverse the long term trend observed through the Census data (1960 to 2004). The recent trends reflect mainly a discouragement effect due to the unemployment duration.

20
Between 1982 and 2007, the occupied active population jumped from 6.58 million to 9.8 million. The agriculture share declined steadily from 57.8 to 45.4 per cent. The industry sector share went from 12.4 in 1982 to 16.2 per cent in 1990, and after decreased sharply to 12.8 per cent. The building and public works share, after a decline from 5.8 in 1982 to 4.9 per cent in 1990, increased to 8.6 per cent in 2007. The share of services increased steadily from 16.5 in 1982 to 20.3 per cent in 2008. The volume of job creation was, on average, 150,000 between 1982 and 1990. This average declined to 98.000 between 1990 and 2000. The average annual job creation recovered to a level of 146,000 jobs after 2000.
According to social security statistics, informal employment decreased from 80 per cent in 1990 to 75.8 per cent in 2000 and seems to have been rather stagnant since then (with a level of 74.3 per cent in 2007). In this regard, labour force surveys show that informal employment reached higher levels, but also that it is on a more positive trend towards formalization: the indicator dropped from 87.6 per cent in 2000 to 83 per cent in 2008.
Between the late 1970s and 2000, urban unemployment doubled from 10 to nearly 20 per cent. From 2000 to 2008, unemployment was reduced by nearly 8.5 percentage points, from 22 per cent in 1999 to 14.5 per cent in 2008. The employment growth rate averaged 1.9 per cent between 2000 and 2007. Labour participation rates gained 4 points between 1994 and 2004, a higher rate than in the previous decades. Job creation was concentrated within the non-tradable sectors, where labour demand is highly geared towards low and high skills.
The legal minimum wage is fixed by the Government to take into account price evolution and enable the workers to have decent living conditions.41 The legal minimum wage followed the rise of the consumer price index during the 1990s, but lost purchasing power during the new Millennium. In 2007, the legal minimum wage was Dirhams (Dh)1,777.7 in the urban sector and Dh1,150.2 in the rural sector. The minimum wage is supposed to be tailored to enable an average household to cover its basic needs following the officially assessed poverty thresholds in rural and urban areas. However, this seems to apply only to trade and industry minimum wages, which only works for urban areas. For the rural areas, earning the agricultural minimum wage does not enable a household with one income provider to cover its basic needs. The agricultural minimum wage has improved progressively, but it remains far from achieving the objective of the minimum wage policy to protect the workers and their families.
3.4 Turkey
In Turkey, the participation rate declined to less than the 50 per cent threshold during the implementation of the 2000 exchange rate-based disinflation programme. It continued its secular decline over the rest of the decade in relation to increasing unemployment.42
41 The legal base is the Labour Code (Articles 356 to 361). Till 2004, when the new labour code was adopted, the legal minimum wage for young workers depended on their age. In trade and industry activities, the legal minimum wage was respectively 50 per cent of the seniors’ for the workers under 15 years old, 60 per cent for 15 to 16, 70 per cent for 16 to 17 and 80 per cent for 17 and 18 years old. In agriculture, the legal minimum wage for the young is 50 per cent of the seniors’ for workers under 15 and 70 per cent for workers from 15 to 18 years old. The recent revision suppressed this discrimination, following the Labour Code (Article 358). 42 For Turkey, two definitions of unemployment are used: open unemployment and extended unemployment. The latter includes the “discouraged” workers identified as “persons not looking for a job yet are ready to work if offered a job”.

21
Extended unemployment had been consistently rising from 1997 (8.1 per cent) to 2008, reaching 19 per cent, while the participation rate had been decreasing from about 52.5 per cent in the period 1997–1999 to 47.5 per cent in 2007. A large proportion of the labour force, primarily women, is staying out of the labour market. According to survey data, of a total labour force of 24 million in 2008, only 6.5 million were women.43
Turkey experienced a massive depopulation of the rural economy, as agricultural employment decreased substantially from 2001 to 2008.44 One of the consequences of this mass exodus out of agriculture was a sharp decline in the contribution of agriculture to GDP. Within the duration of only one decade (1997–2006), the share of agricultural value added to GDP in Turkey was almost halved from 18 to less than 10 per cent. This change in the agriculture of Turkey is much more pronounced than in comparable Mediterranean countries.
Against this fall, there had been a total increase of employment in the services sector by 1,944,000 and by only 667,000 in industry. However, agriculture remains an important sector, employing close to 30 per cent of the workforce. While manufacturing employment is slowly rising, it is not keeping pace with the rise in manufacturing value added. Over the long-term, from 1988 to 2008, formal jobs in private manufacturing industries fell until 1994, a crisis year, then recovered until 1998, another crisis year, but kept falling until they reached a new lower plateau in the 2000s.
The structure of the work force has thus been changing with the population moving out of rural areas into urban areas, and yet this shift out of agriculture has not been converted into an expansion of the industrial labour force. The move was translated into “marginalized / informal labour” in the services sector (Yelden and Ercan, 2009).45 This change has tremendous implications for the issue of decent work.
One key feature of the post-2001 growth path has been its “jobless” nature. The rate of open unemployment has jumped from 6.5 per cent in 2000 to 10.3 per cent in 2002, and remained on a plateau despite the rapid surges in GDP and exports. Open unemployment is a severe problem, in particular, among the young urban labour force, reaching 26 per cent.46
43 This has been the subject of much discussion in Turkey (see, e.g., Tunali, 2003). What may be happening is that, as Turkey urbanizes, women in urban areas find there are not many wage earning opportunities, particularly for those with low education. Another possibility is that labour market regulations may be limiting the possibilities for part time and other flexible working arrangements that would permit women to participate in the workplace. Other potential contributing factors might include discouraged male workers dropping out of the labour force and undercounting of workers as a result of a growing informal sector. 44 Agriculture remains an important sector, employing 35–40 per cent of the workforce. Although this percentage has been falling, Ercan (1998) notes that this is still a relatively high number compared to other middle-income countries. 45 Over a very long time horizon, from 1988.I quarter to 2008.III, formal jobs in private manufacturing industries have fallen till the early 1990s to recover somewhat only until 2000. Since then the net addition to private manufacturing employment had been meager at best (Yeldan and Ercan, 2009). 46 Along with the slow pace of job creation, workers in Turkey have been subject to considerable insecurity – a relatively high percentage are outside the formal labour market and real wages have fluctuated, as has employment in the private sector over the 2000s (Yeldan and Ercan, 2009). A significant proportion of Turkey’s adult population, particularly women, are not listing themselves in surveys as looking for work and, therefore, are not counted as unemployed. This also means that comparing unemployment rates across countries does not convey the full sense of the labour market slack in Turkey. In addition, about half of the Turkish workforce is not registered with any social security institution and thus do not have access to formal social protection mechanisms (World

22
In April 2009,47 the open unemployment rate was 14.9 per cent of the civilian labour force. If added to open unemployment, disguised unemployment,48 the excess of labour supply (openly unemployed + disguised), reached 19 per cent of the labour force in 2008. According to Yeldan and Ercan (2009), the unemployment rate would have been higher, had the participation rate not declined (from almost 53 per cent in 1999 to less than 48 per cent after 2002).
Table 6. Employment and unemployment structure by education level in Turkey
2003 2004 2005 2006 2007 2008
E. U. E. U. E. U. E. U. E. U. E. U.
No schooling 3.0 4.5 10.5 2.3 10.8 2.4 10.5 2.2 10.1 2.3 4.8 2.5
Primary 54.3 44.6 49.4 38.9 48.1 37.9 44.4 36.8 43.0 33.8 40.6 33.4
Lower secondary 11.9 13.3 11.2 14.6 11.8 16.4 13.3 17.0 13.9 17.8 14.4 19.2 Upper Secondary and post-secondary 19.8 23.3 18.0 29.2 18.9 28.1 20.4 28.1 20.8 28.4 22.0 26.0
Tertiary education 10.9 11.6 10.9 12.7 10.4 11.4 11.4 12.0 12.2 13.1 13.8 13.9
Not Classified 2.6 2.4 3.9 3.9 4.6 4.4 5.1
Total 100.0 100.0 100.0 100.0 100.0 100.0 100.0 100.0 100.0 100.0 100.0 100.0
Source: ILO Laborsta.
The educational attainment of the Turkish workforce has increased significantly. Unemployment is mainly concentrated among the upper secondary and post secondary workers. The share of those with less than primary education is decreasing, but remains important as it accounts for nearly 45.4 per cent of the employed and 35.7 per cent of the unemployed. The upper secondary and post secondary category represented, in 2008, 22 per cent of the employed against 26 per cent of the unemployed. Jobseekers with tertiary education were nearly 14 per cent of the unemployed population in 2008. This ratio has been growing since 2003, while the economy is using more of this most skilled category of workers. The open unemployment rate of this last category decreased from 2003 (12.5 per cent) till 2008 (11.3 per cent). The female unemployment rate is generally higher than the male rate, but the discrepancy is particularly high for the female workers with an upper secondary and post secondary education level.
The monthly nominal minimum wage in Turkey was TL114.3 (€191.68) in 2000. In 2008, it reached TL638 (€333). In Turkey, the minimum wage is largely enforced and plays an important role for the protection of the workers’ income. It impacts through several channels: the diverse types of income; the wages and firms’ profits; and, also the employment level.49 The changes to the minimum wage are assessed by an ad hoc committee consisting of five Government representatives, five from the TISK, the employers’ confederation, and five from Turk-Is (the confederation of workers’ trade unions). The committee considers the evolution of prices and living costs and determines, through a majority vote, the legal minimum wage change to apply. The change in the
Bank, 2003, cited in Yeldan and Ercan, 2009). Table A1 in the Appendix presents more detailed data on the Turkish labour market. 47 Turkish labour statistics follow moving-three-month averages on a monthly basis. Thus, “April” data covers the average of March-April-May. 48 As distinguished in the TURKSTAT annals this group is identified as: “Persons not looking for a job yet ready to work if offered a job: (i) Seeking employment and ready to work within 15 days, and yet did not use any of the job search channels in the last 3 months; plus (ii) discouraged workers”. This group of people is not counted as part of the civilian labour force and is regarded as out of the openly unemployed. This number had been consistently rising over the course of 2000s and, according to the Survey results in 2008, had reached 2.3 million. 49 Aslan (2008).
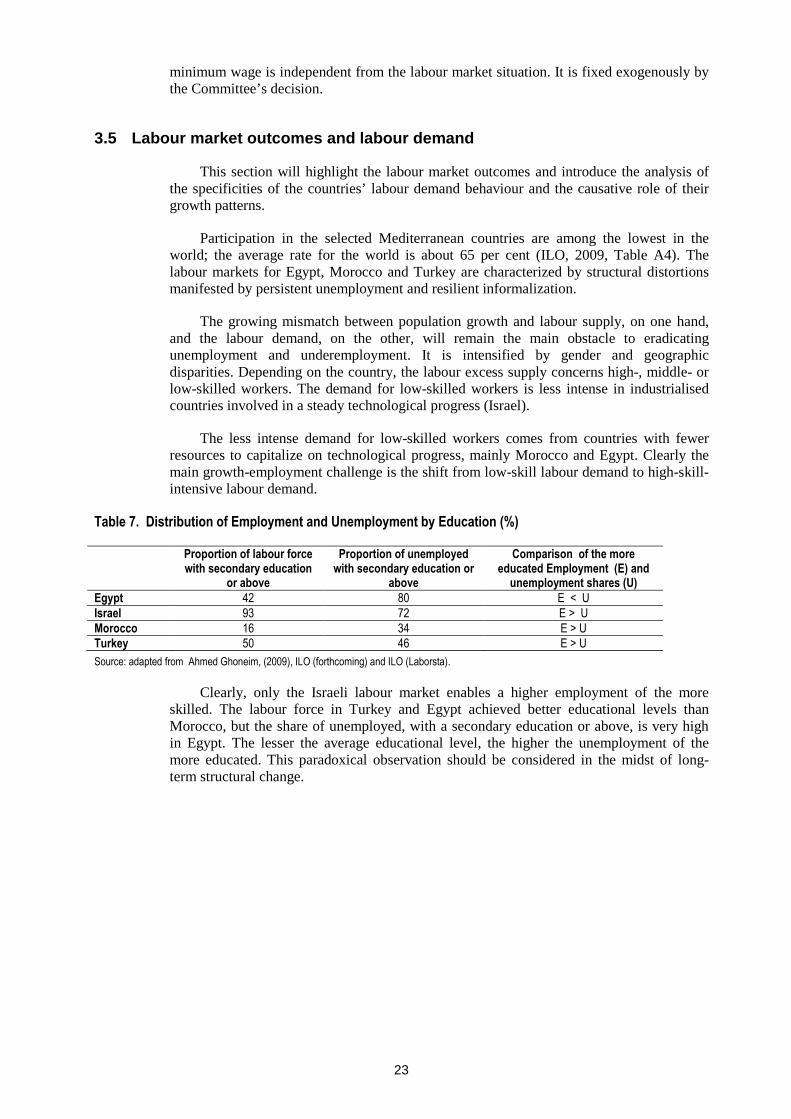
23
minimum wage is independent from the labour market situation. It is fixed exogenously by the Committee’s decision.
3.5 Labour market outcomes and labour demand
This section will highlight the labour market outcomes and introduce the analysis of the specificities of the countries’ labour demand behaviour and the causative role of their growth patterns.
Participation in the selected Mediterranean countries are among the lowest in the world; the average rate for the world is about 65 per cent (ILO, 2009, Table A4). The labour markets for Egypt, Morocco and Turkey are characterized by structural distortions manifested by persistent unemployment and resilient informalization.
The growing mismatch between population growth and labour supply, on one hand, and the labour demand, on the other, will remain the main obstacle to eradicating unemployment and underemployment. It is intensified by gender and geographic disparities. Depending on the country, the labour excess supply concerns high-, middle- or low-skilled workers. The demand for low-skilled workers is less intense in industrialised countries involved in a steady technological progress (Israel).
The less intense demand for low-skilled workers comes from countries with fewer resources to capitalize on technological progress, mainly Morocco and Egypt. Clearly the main growth-employment challenge is the shift from low-skill labour demand to high-skill-intensive labour demand.
Table 7. Distribution of Employment and Unemployment by Education (%)
Proportion of labour force with secondary education
or above
Proportion of unemployed with secondary education or
above
Comparison of the more educated Employment (E) and
unemployment shares (U) Egypt 42 80 E < U
Israel 93 72 E > U
Morocco 16 34 E > U
Turkey 50 46 E > U
Source: adapted from Ahmed Ghoneim, (2009), ILO (forthcoming) and ILO (Laborsta).
Clearly, only the Israeli labour market enables a higher employment of the more skilled. The labour force in Turkey and Egypt achieved better educational levels than Morocco, but the share of unemployed, with a secondary education or above, is very high in Egypt. The lesser the average educational level, the higher the unemployment of the more educated. This paradoxical observation should be considered in the midst of long-term structural change.

24
4. Growth-employment-poverty nexus
4.1 Source of growth and structural changes
Growth accounting exercises decompose the growth of output into growth due to capital, employment, and total factor productivity (TFP). Table 8 reproduces the results of a simple World Bank growth-accounting exercise covering the last four decades of the twentieth century. The exercise covers a large number of individual countries, in addition to various regions.50 According to these estimates, the MENA region has outperformed all other regions, except ECA, during the 1960s, but fell behind after that.
Of the four countries in the sample, Israel was the only country to maintain TFP growth throughout the period 1960–2000. Compared to Morocco and Turkey, Egypt performed better. Egypt only experienced TFP decline during the 1980s,51 while Morocco and Turkey showed negative TFP change during the 1970s and 1990s.52
The sources of growth analysis at the macroeconomic level show how the use of production factors improved between two periods and enabled an assessment of the performance at the economy-wide level. But, this indicator is rather approximate as it is not able to catch the productive heterogeneity of the country and does not reveal progress at the microeconomic and industrial levels.
Table 8. Estimates of TFP Growth in Mediterranean Countries, 1960-2000
Country/ Region
Total Factor Productivity (α=0.4)* 1960s 1970s 1980s 1990s
Egypt 1.52 1.51 -0.31 0.73 Israel 3.06 0.49 0.98 0.21
Morocco 1.84 -0.32 0.21 -1.15
Turkey -- -0.49 1.21 -0.95
MENA 1.96 -0.96 -1.44 -0.03
AFRICA -0.49 -0.31 -0.70 -0.11
ECA 3.07 0.08 0.89 -0.55
OECD 1.67 -0.39 0.71 0.28
WORLD 1.01 0.22 1.34 1.51
* Assumes that the elasticity of output with respect to the value of physical capital (α) is equal to 0.4. The source gives TFP estimates based on two alternative assumptions about the value of α: 0.3 and 0.5. α is the elasticity of output with respect to capital.
Source: Keller and Nabli, 2007, Annex Table 1.
50 As per the World Bank regional grouping, both Egypt and Morocco belong to the Middle East and North Africa (MENA), Turkey belongs to the Europe and Central Asia (ECA), and Israel is part of OECD. 51 Another World Bank study covering the period 1975–2008 shows that TFP growth was positive only during 1975–1980, but negative or close to zero for the remainder of the period (World Bank, 2001, referred to in El-Issawy, 2007, p.299). Another study estimated that while TFP growth during 1977–1989 was a modest 0.89 per cent, but was a remarkable 4.5 per cent during 1990–1998 as a result of the implementation of ERSAP in 1991 (Kheir-El-Din and Moursi, 2002). El-Issawy argues that throughout most of the period 1975–2000, Egypt's GDP growth was mainly driven by accumulating physical capital followed by human capital. 52 Referring to a UNIDO study for Morocco covering the same period 1960–2000, Aloui argues that during 1960–1981 factor accumulation was intense and accounted for most of GDP growth. But, during the 1990s, TFP contribution to GDP growth was negative (Aloui, 2009). In the case of Turkey, Yeldan and Ercan (2009) reported that there have been no recent and reliable studies of TFP growth for them to be confident enough to cite.
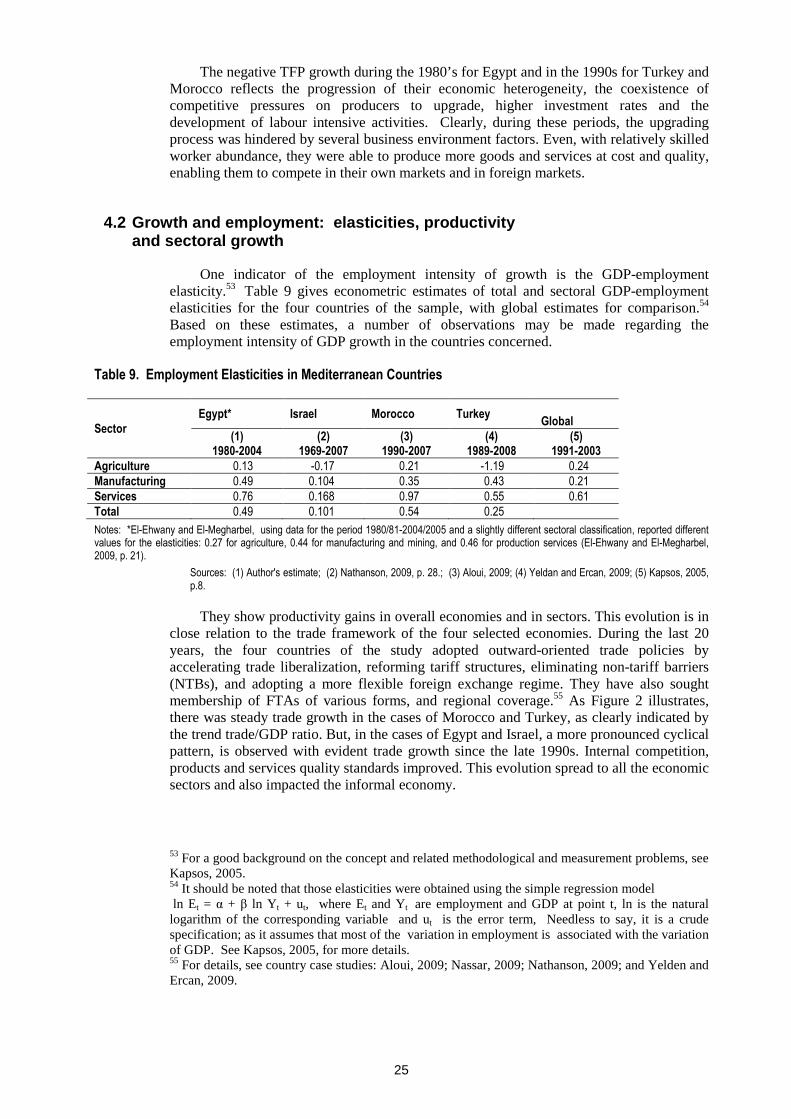
25
The negative TFP growth during the 1980’s for Egypt and in the 1990s for Turkey and Morocco reflects the progression of their economic heterogeneity, the coexistence of competitive pressures on producers to upgrade, higher investment rates and the development of labour intensive activities. Clearly, during these periods, the upgrading process was hindered by several business environment factors. Even, with relatively skilled worker abundance, they were able to produce more goods and services at cost and quality, enabling them to compete in their own markets and in foreign markets.
4.2 Growth and employment: elasticities, productivity and sectoral growth
One indicator of the employment intensity of growth is the GDP-employment elasticity.53 Table 9 gives econometric estimates of total and sectoral GDP-employment elasticities for the four countries of the sample, with global estimates for comparison.54 Based on these estimates, a number of observations may be made regarding the employment intensity of GDP growth in the countries concerned.
Table 9. Employment Elasticities in Mediterranean Countries
Sector Egypt* Israel Morocco Turkey
Global
(1) 1980-2004
(2) 1969-2007
(3) 1990-2007
(4) 1989-2008
(5) 1991-2003
Agriculture 0.13 -0.17 0.21 -1.19 0.24
Manufacturing 0.49 0.104 0.35 0.43 0.21
Services 0.76 0.168 0.97 0.55 0.61
Total 0.49 0.101 0.54 0.25
Notes: *El-Ehwany and El-Megharbel, using data for the period 1980/81-2004/2005 and a slightly different sectoral classification, reported different values for the elasticities: 0.27 for agriculture, 0.44 for manufacturing and mining, and 0.46 for production services (El-Ehwany and El-Megharbel, 2009, p. 21).
Sources: (1) Author's estimate; (2) Nathanson, 2009, p. 28.; (3) Aloui, 2009; (4) Yeldan and Ercan, 2009; (5) Kapsos, 2005, p.8.
They show productivity gains in overall economies and in sectors. This evolution is in close relation to the trade framework of the four selected economies. During the last 20 years, the four countries of the study adopted outward-oriented trade policies by accelerating trade liberalization, reforming tariff structures, eliminating non-tariff barriers (NTBs), and adopting a more flexible foreign exchange regime. They have also sought membership of FTAs of various forms, and regional coverage.55 As Figure 2 illustrates, there was steady trade growth in the cases of Morocco and Turkey, as clearly indicated by the trend trade/GDP ratio. But, in the cases of Egypt and Israel, a more pronounced cyclical pattern, is observed with evident trade growth since the late 1990s. Internal competition, products and services quality standards improved. This evolution spread to all the economic sectors and also impacted the informal economy.
53 For a good background on the concept and related methodological and measurement problems, see Kapsos, 2005. 54 It should be noted that those elasticities were obtained using the simple regression model ln Et = α + β ln Yt + ut, where Et and Yt are employment and GDP at point t, ln is the natural logarithm of the corresponding variable and ut is the error term, Needless to say, it is a crude specification; as it assumes that most of the variation in employment is associated with the variation of GDP. See Kapsos, 2005, for more details. 55 For details, see country case studies: Aloui, 2009; Nassar, 2009; Nathanson, 2009; and Yelden and Ercan, 2009.

26
As is the case at the global level, agriculture has the lowest GDP-employment elasticity. Services have the highest elasticity, and manufacturing falls in-between. The employment elasticity in agriculture is much lower in the four countries of the study than the global level. The employment elasticity in agriculture is negative in the cases of Israel and Turkey, which means that employment in agriculture declines with growth.
The service sector appears to be the most promising in terms of employment generation. But, caution is needed against undue optimism, since the service sector is largely informal with low productivity, less security and low remuneration. In the cases of Egypt, Morocco and Turkey, the higher elasticity in the service sector reflects a complex and newly observed dynamic of the labour market where, in the course of economic growth, labour is being reallocated to informal, low-productivity jobs for lack of better alternatives through formal employment. This dynamic is the beginning of an upgrading process in the informal economy. This process mainly concerns the productivity and economic dimensions and not all dimensions of employment. But, it affords new opportunities inside the informal economy for poverty alleviation.
In Egypt, the engines of growth are resource-based industries such as petroleum and natural gas, and also construction, finance and business services. The agricultural sector was a negative employment-absorbing sector over the decade 1990-2000, while the rate of growth of employment in the manufacturing sector was very low, estimated at 0.5 per cent.
Over the period 1990–2008, there was about a 53 per cent increase in employment. This results from increases in the informal (outside enterprise), the private sector (340.7 per cent), the investment sector (303.2 per cent)56 and the government sector (63.8 per cent), against the decreases of employment in the formal private (inside enterprise) sector (-30.7 per cent) and public sector (-45.6 per cent).
Moreover, Egypt concluded a number of trade agreements with its main trading partners, namely the EU and the Arab countries. Despite trade liberalization efforts, which resulted in increased non-oil exports, Egypt’s export structure remains heavily dominated by resource-based and low-tech exports that account for nearly 90 per cent of manufactured exports. Such products are rather capital-intensive, and hence trade opening had negative implications for employment and poverty. The impact of Egypt's trade agreements on employment is so far negligible.
Table 10. Growth composition from 2003 to 2007 - Average annual growth rate (Egypt)
Sectors GDP Employment Apparent labour productivity
Agriculture 3.2% 1.6% 1.6%
Manufacturing 5.2% 4.1% 1.0%
Oil and products 6.1% 15.5% -8.1%
Electricity 6.8% 2.2% 4.6%
Construction 9.7% 3.0% 6.5%
Trans. and storage 1 9.6% 3.7% 5.7%
Trade and finance 2 5.0% 3.7% 1.2%
Hotels and restaurants 20.3% 9.6% 9.7%
56 This refers to entreprises established under the "Investment Code", Law 8 for 1997.
27
Housing and real estate GDP 2.9% 3.0% -0.1%
Social services3 4.0% 2.1% 1.8%
Total 5.8% 2.7% 2.9% Source: Based on data from the Ministry of State for Economic Development (2008, pp. 16-20). 1- Including communications and Suez Canal. 2- Including insurance. 3- Including public utilities; social insurance; and government, personal and social services. * GDP at fixed prices, base year 1981/82 in LE million. ** Number of workers: 1000 employees
In almost all sector, except oil and products and housing and real estate which account both for 1 per cent of employment, productivity gains were achieved. The productivity gains were small in manufacturing, in social services and in trade and finance. For the agricultural sector which accounts for 27 per cent of employment, the productivity growth is significant at 1.6 per cent.
In Israel , the general trend of the growth rate over the past few decades does not present a clear relationship between economic growth and employment rate. During spells of consistent GDP growth, unemployment rose. Despite high growth in the early 1990s, peaks of worst unemployment coincided with the influx of new immigrants. In Israel, the services sector, particularly ICT or Hi-Tech, has contributed to GDP growth since the 1990s. The origins of Israel's high tech industry are to be found in the local defence industry, and in the extensive migration from the former Soviet Union during the early 1990s. Over the years, the Israel Defence Force's leading R&D departments have served as breeding grounds for thousands of top-notch high-tech personnel, many of whom have applied what they learned, with respect to military technology, in a commercial environment. In 2007, the product of the ICT industries sector was 17 per cent of the business product in Israel, and employed 202,600 people. A significant inverse relationship between trade openness and the rate of unemployment is also observed, suggesting that rising trade reduces unemployment (Nathanson, 2009).
In Morocco, job creation has been driven by low productivity/high elasticity sectors, while the contribution of higher productivity tradable sectors to job creation has been decreasing. The large majority of jobs created from 2000 are occupied by unskilled and low productivity workers; 90 per cent of jobs are occupied by workers with less than a secondary degree. In the informal sector, which represents 40 per cent of non agricultural jobs, 77 per cent of workers are not educated at all. In 80 per cent of informal units, total sales are less than a wage bill based on the minimum wage. Non-protected jobs represent the largest share of job creation.
The non-tradable sectors have absorbed much of the increase in the labour force. Such sectors include a diverse range of activities, from high-productivity and high-return activities, such as banking, insurance and finance at one extreme, to very low-productivity and low-return street vendors at the other.
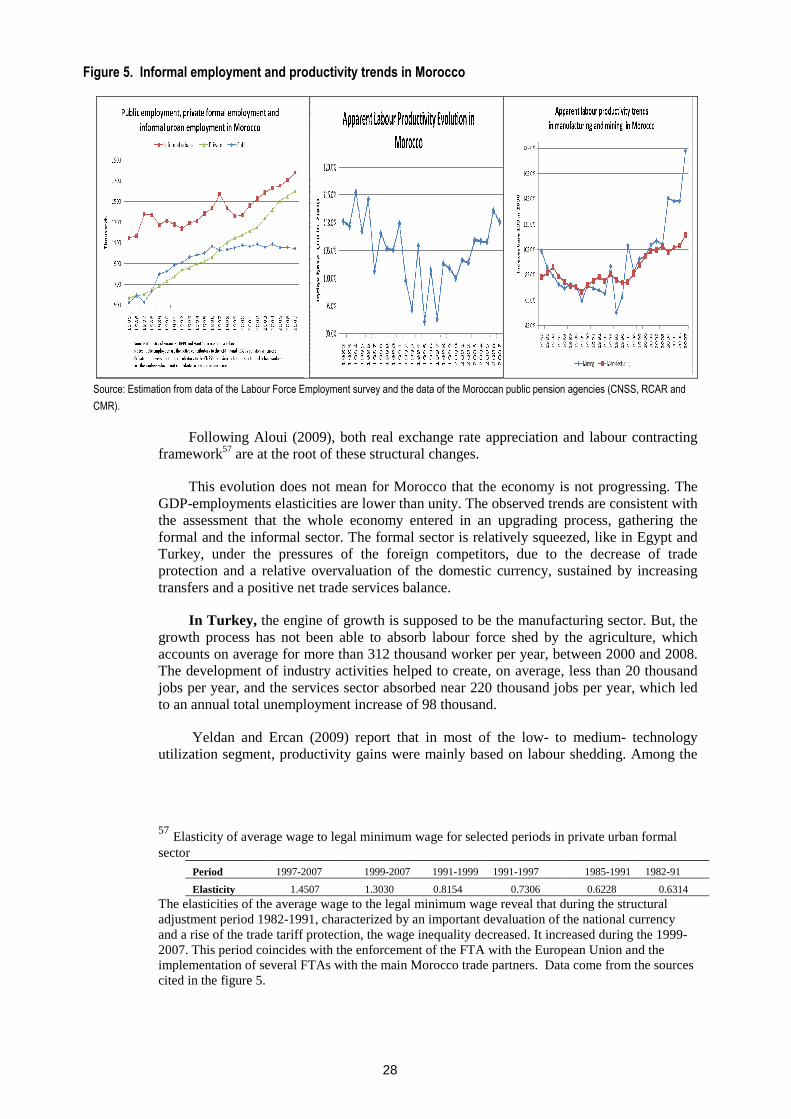
28
Figure 5. Informal employment and productivity trends in Morocco
Source: Estimation from data of the Labour Force Employment survey and the data of the Moroccan public pension agencies (CNSS, RCAR and
CMR).
Following Aloui (2009), both real exchange rate appreciation and labour contracting framework57 are at the root of these structural changes.
This evolution does not mean for Morocco that the economy is not progressing. The GDP-employments elasticities are lower than unity. The observed trends are consistent with the assessment that the whole economy entered in an upgrading process, gathering the formal and the informal sector. The formal sector is relatively squeezed, like in Egypt and Turkey, under the pressures of the foreign competitors, due to the decrease of trade protection and a relative overvaluation of the domestic currency, sustained by increasing transfers and a positive net trade services balance.
In Turkey, the engine of growth is supposed to be the manufacturing sector. But, the growth process has not been able to absorb labour force shed by the agriculture, which accounts on average for more than 312 thousand worker per year, between 2000 and 2008. The development of industry activities helped to create, on average, less than 20 thousand jobs per year, and the services sector absorbed near 220 thousand jobs per year, which led to an annual total unemployment increase of 98 thousand.
Yeldan and Ercan (2009) report that in most of the low- to medium- technology utilization segment, productivity gains were mainly based on labour shedding. Among the
57 Elasticity of average wage to legal minimum wage for selected periods in private urban formal sector
1982-91 1985-1991 1991-1997 1991-1999 1999-20071997-2007 Period
0.6314 0.6228 0.7306 0.8154 1.3030 1.4507 Elasticity The elasticities of the average wage to the legal minimum wage reveal that during the structural adjustment period 1982-1991, characterized by an important devaluation of the national currency and a rise of the trade tariff protection, the wage inequality decreased. It increased during the 1999-2007. This period coincides with the enforcement of the FTA with the European Union and the implementation of several FTAs with the main Morocco trade partners. Data come from the sources cited in the figure 5.

29
high technology adopting sectors, chemicals, machinery and automobiles display a positive association between gains in productivity and employment, simultaneously.
Yilmaz and Gonenç (2008) demonstrate that pressures arose from both growing trade competition from low-cost countries, which have similar trade specialization patterns to Turkey’s, and from sustained real currency appreciation that Turkey experienced during this period. In response, Turkish manufacturers increased their productivity, differentiated products, moderated wage growth and drew on declining capital and imported input costs.
While the structurally strong sectors of the economy made successful use of these avenues, the less sophisticated and lower-technology activities, using low-skilled labour and low-price local inputs, could not fully cope, and lost ground. The latter sectors’ still large weight in total manufacturing output and employment makes their adjustment a persisting challenge for the Turkish economy. The more capital-intensive, higher technology, sophisticated activities succeeded in improving their margins during the entire period. In contrast, lower technology activities, relying on low-skilled labour and low-cost local inputs, were generally squeezed. There is also a large intermediary group of sectors that continue to try out various strategies to preserve their competitiveness. 58
Aydin et al (2007) confirmed this analysis.59 Post 2001 period witnessed a change in export commodity composition in favour of more capital and technology intensive commodities. In general fast growing sectors are relatively new commodities that are not considered as the traditional Turkish export commodities. However, it is shown that even though there is a process of transformation in the Turkish export after the crises period, Turkey is still short of building any comparative advantage in these new commodities. They conclude that, even if Turkish Lira appreciated in real terms during the period 2002–2006, nevertheless, the same trend was also the case in most of the other countries. The decline in real wages in Turkey was much more evident compared with other trade partners. The positive effect of the decline in real wages compensated for the negative effect of real appreciation of the Turkish Lira on competitiveness of Turkish exports.
The wage cycle follows closely the expansion phases of the economy, cut short, alas, at almost regular intervals by the crises of 1994 and 2001, and more recently of 2008. After a brief surge over 1990–1993, real wages plummeted during the 1994 financial crisis and, in a sense, endured most of the adjustment of the crisis then. During 1995–2000, private manufacturing real wages kept their momentum in general, although they could not recover their pre-1994 crisis levels. However, after the 2000/2001 wave of crises, real wages in private manufacturing faced a second cycle of contraction. This contraction was especially pronounced in US dollar terms. In the meantime, productivity gains in private manufacturing accelerated especially after the first quarter of 2002. It is probable that this productivity surge is due mostly to labour shedding, rather than increased labour efficiency originating from advances in technology, although the machinery-equipment investment item of the national accounts did show a rise in 2002 and 2003. As of the third quarter of 2008, the index of labour productivity was 2.77 times higher than real wages in Turkish Lira, and 2.05 times higher than the unit wage costs in US dollars.60
For all the selected countries, the effect of trade openness depends on whether growth is associated with a higher rate of capital accumulation (and hence faster GDP growth). In this case, it may be expected to reduce poverty (for any given level of inequality). The
58 Gökhan Y. and Gonenc, R. (2008). 59 Aydin, F.; Saygili, H.; Saygili, M. (2007). 60 Yeldan and Ercan (2009).

30
experience of East Asian countries is an example of the positive effects of trade opening on employment and poverty. Latin American countries' experience with trade opening is the opposite (Ghosi et al., 2007) ِ
This issue is crucial within the context of ENP, where trade growth for Mediterranean countries (except perhaps Israel) is largely the result of liberalizing trade vis-à-vis the more advanced economies of the EU. Figure 2 indicates the extent of trade growth in the four Mediterranean countries covered in this project.
4.3 Growth and Poverty
In 2000, the UN declared its Millennium Development Goals, the first one of which was half by 2015, the 1990 poverty level. Table 11 gives a comparative picture of the poverty situation of Mediterranean countries and comparators.
Table 11. Poverty and Income Indicators – comparative data
Countries Morocco Egypt Turkey Israel Years 1991 2007 1991 2005 1994 2005 2001 GINI Index 39.20 40.88 32.00 32 .14 41.53 43.23 39.20
Income share held by highest 10% 31.24 33 .22 26.73 27.62 32.26 33.19 28.80
Income share held by lowest 20% 6.56 6.52 8.71 8.96 5.80 5.18 5.71
Poverty headcount ratio (% of population)
at $1.25 a day (PPP) 2.45 2.5 4.46 2.00 2.10 2.72 NA
at $2 a day (PPP) 15.88 13.95 27.61 18.42 9.83 9.04 NA Source: World Development Indicators – www.worldbank.org
Economic growth is often viewed as a pathway to poverty reduction. Such a view assumes, however, that growth is at least distribution-neutral that is, it is not associated with rising inequality. If growth involves an increase in income inequality, then it is not certain that growth by itself will reduce poverty.
In Egypt, a recent World Bank Policy Note (World Bank, 2009) based on the Household Income and Consumption Survey (HIECS) 2005–2008,61 suggests that, thanks to rapid economic growth, Egypt has achieved impressive poverty reduction, reversing the trend of worsening poverty outcomes over 2000–2005. In the light of the strong duality of the Egyptian economy, the conclusions based on the HIECS 2005–2008, should be viewed with great caution. In fact, the Note observes that agriculture was the main engine of poverty reduction, despite its lower than average growth rate (only slightly above 3 per cent per annum). However, it also observed that occasional and seasonal jobs created in the agricultural sector in Egypt generate a volatile stream of income for households, which makes them more exposed to changes in the economy, and, therefore, more vulnerable to poverty. The same survey data suggest that there was a deterioration in the quality of the jobs over 2005–2008, according to the definition of “decent work” with sufficiently high productivity and regularity of income (World Bank, 2009). These properties can be called “quality of jobs”. The survey indicated that the percentage of the poor with permanent jobs declined from 79.6 per cent in 2005 to 69.8 per cent in 2008, while the share of the poor
61 Which is a new HICES panel survey conducted by CAPMAS to trace household consumption and living standards over 2005–2008.

31
with temporary jobs increased from 2.4 to 4.8 per cent over the same period. Working in sporadic jobs also implies a high exposure to the risk of falling welfare.62
The case of Israel offers a different relationship between employment and poverty, because poverty is estimated using an income approach.63 In 2007 the extent of poverty among households which are part of the working population before transfer payments is 18.2 per cent, compared to 91.2 per cent for the population in the working age which are not working. The extent of poverty in Israel is strongly correlated with the education level of the head of the household: the higher the education level, the less is the family likely to reach the poverty level. (Nathanson, 2009).64
Table 12. Israel- Poverty Incidence of Families by Family Group (percentages), 2006 and 2007
Population group
Income before transfer payments
and taxes
Income after transfer payments
and taxes
Rate of decrease of poverty incidence after transfer payments and taxes (%)
2006 2007 2006 2007 2006 2007 Total 32.9 32.3 20.0 19.9 39.3 38.3
Jews 28.8 28.3 14.7 15.0 48.9 46.8
Arabs 59.5 58.3 54.0 51.4 9.2 11.8
Elderly* 56.1 55.9 21.5 22.6 61.7 59.5
New immigrants 39.9 40.2 18.1 18.8 54.7 53.2
Not working, of working age 88.9 91.2 66.6 69.8 25.1 23.5
Source: National Insurance Institute Survey (2007)
From 1995 to 2005, average real income grew by only a little more than 1 per cent and was distributed unequally: by 2 per cent per year on average among the richest quintile; by 1 per cent among the middle classes; while incomes for the bottom quintile declined by 1 per cent. This trend is closely related to the wage determination mechanism, to the non-enforcement of the minimum wage and to under-resourced active labour market policies. Within Israel, the differences in employment participation among different employment groups play a key role in explaining the very different poverty outcomes for Jews in general, and the Arab and Haredi minority populations. Because Arab families and Haredi families are frequently jobless or one-earner families (in low-paid employment), poverty rates are around 50% for Arabs, and close to 60% for Haredim, but only just over 10% for the rest of the Jewish population, where both adults in couple families are often in paid employment. As a result, Arabs and Haredim who together constitute less than 30% of the population make up more than 60% of the poor population.65
Morocco is an interesting case regarding the growth-employment-poverty nexus. The data in Table 13 indicate a steady and significant decline of poverty incidence throughout the period from the mid-1980s to 2007. During this period, Morocco apparently managed to
62 The survey showed that only 21 per cent of those employed in seasonal jobs and 15 per cent of those in sporadic jobs managed to escape poverty between 2005 and 2008 (World Bank, 2009). 63 A family is defined as poor if its standard of living, as reflected in its income, is significantly lower relative to the society and, specifically, its net income per standard person is less than half the median for that income. Net income is income after the payment of direct taxes which is disposable for consumption and savings as decided by the family. The concept of the standard person relates to the need to determine a scale of equivalence comparing households of different sizes or compositions. 64 The extent of poverty among households is lower the larger the number of supporters per household: with one supporter is 35.2 per cent respectively. 65 OECD (2009).
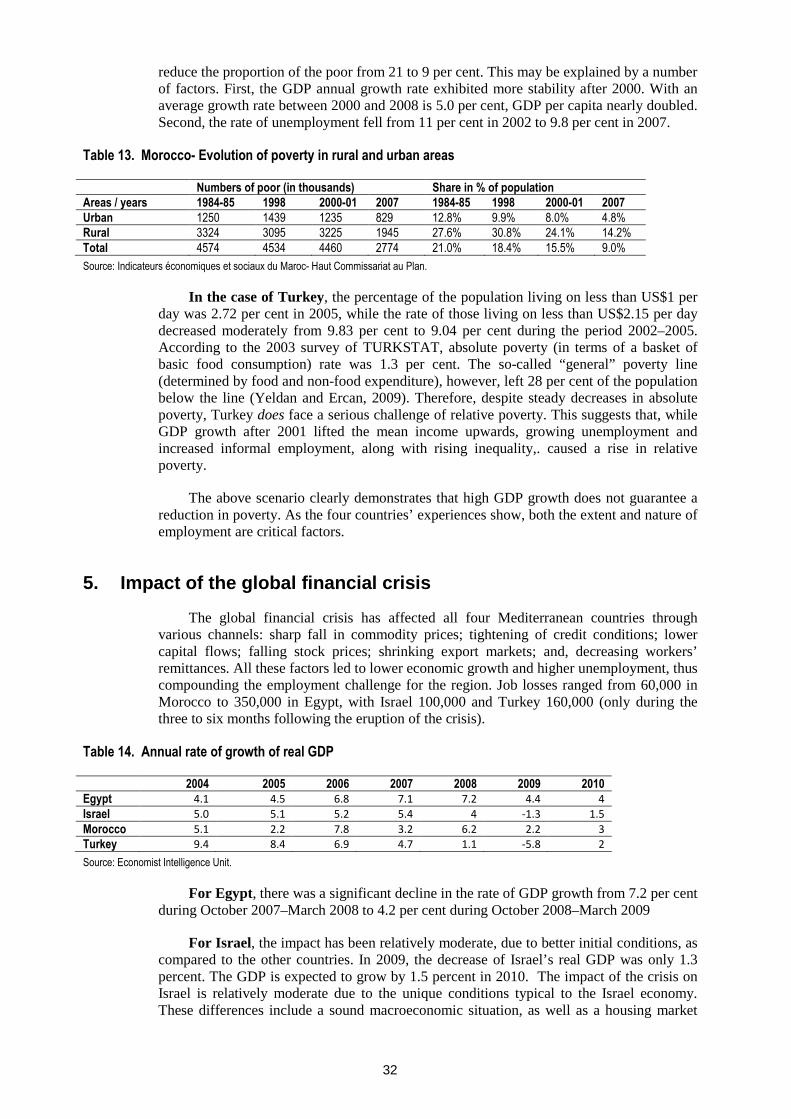
32
reduce the proportion of the poor from 21 to 9 per cent. This may be explained by a number of factors. First, the GDP annual growth rate exhibited more stability after 2000. With an average growth rate between 2000 and 2008 is 5.0 per cent, GDP per capita nearly doubled. Second, the rate of unemployment fell from 11 per cent in 2002 to 9.8 per cent in 2007.
Table 13. Morocco- Evolution of poverty in rural and urban areas
Numbers of poor (in thousands) Share in % of population Areas / years 1984-85 1998 2000-01 2007 1984-85 1998 2000-01 2007 Urban 1250 1439 1235 829 12.8% 9.9% 8.0% 4.8%
Rural 3324 3095 3225 1945 27.6% 30.8% 24.1% 14.2%
Total 4574 4534 4460 2774 21.0% 18.4% 15.5% 9.0%
Source: Indicateurs économiques et sociaux du Maroc- Haut Commissariat au Plan.
In the case of Turkey, the percentage of the population living on less than US$1 per day was 2.72 per cent in 2005, while the rate of those living on less than US$2.15 per day decreased moderately from 9.83 per cent to 9.04 per cent during the period 2002–2005. According to the 2003 survey of TURKSTAT, absolute poverty (in terms of a basket of basic food consumption) rate was 1.3 per cent. The so-called “general” poverty line (determined by food and non-food expenditure), however, left 28 per cent of the population below the line (Yeldan and Ercan, 2009). Therefore, despite steady decreases in absolute poverty, Turkey does face a serious challenge of relative poverty. This suggests that, while GDP growth after 2001 lifted the mean income upwards, growing unemployment and increased informal employment, along with rising inequality,. caused a rise in relative poverty.
The above scenario clearly demonstrates that high GDP growth does not guarantee a reduction in poverty. As the four countries’ experiences show, both the extent and nature of employment are critical factors.
5. Impact of the global financial crisis
The global financial crisis has affected all four Mediterranean countries through various channels: sharp fall in commodity prices; tightening of credit conditions; lower capital flows; falling stock prices; shrinking export markets; and, decreasing workers’ remittances. All these factors led to lower economic growth and higher unemployment, thus compounding the employment challenge for the region. Job losses ranged from 60,000 in Morocco to 350,000 in Egypt, with Israel 100,000 and Turkey 160,000 (only during the three to six months following the eruption of the crisis).
Table 14. Annual rate of growth of real GDP
2004 2005 2006 2007 2008 2009 2010 Egypt 4.1 4.5 6.8 7.1 7.2 4.4 4
Israel 5.0 5.1 5.2 5.4 4 -1.3 1.5
Morocco 5.1 2.2 7.8 3.2 6.2 2.2 3
Turkey 9.4 8.4 6.9 4.7 1.1 -5.8 2
Source: Economist Intelligence Unit.
For Egypt, there was a significant decline in the rate of GDP growth from 7.2 per cent during October 2007–March 2008 to 4.2 per cent during October 2008–March 2009
For Israel, the impact has been relatively moderate, due to better initial conditions, as compared to the other countries. In 2009, the decrease of Israel’s real GDP was only 1.3 percent. The GDP is expected to grow by 1.5 percent in 2010. The impact of the crisis on Israel is relatively moderate due to the unique conditions typical to the Israel economy. These differences include a sound macroeconomic situation, as well as a housing market
33
that did not suffer from an artificial bubble because the ratio of finance to the value of properties provided in mortgages is low. The Israel capital market has not reached the level of complexity of its American counterpart, or that of other countries, and the level of leverage in the Israel economy is relatively low. Following five years of rapid growth, Israel has reached the global crisis well prepared with low unemployment. In addition, the stability of the economy has strengthened considerably, and this assists in softening the impact of external shocks.66
For Morocco, data for the second quarter of 2009 show that real GDP grew by 5.4 per cent on a year-on-year basis relative to the second quarter of 2008, compared with growth of 7.2 per cent during the same period of 2008. Industrial output fell by 1 per cent as opposed to a 5.3 per cent rise in the first quarter of 2008, mainly as a result of deteriorating demand for electronic and chemical products from export markets (EIU Country Report, 2009).
In the case of Turkey, the global crisis had started to take its toll on the Turkish economy beginning in the third quarter of 2008. After contracting by 6.8 per cent in the fourth quarter of that year, Turkey entered 2009 with a new record of contraction of 13.8 per cent in its gross domestic product. As export markets contracted, and both consumption and investment expenditure dwindled, aggregate expenditure fell sharply (Yeldan and Ercan, 2009). The unemployment rate jumped from 9.4 per cent during 2008 to 13 per cent during 2009. In 2010, Turkey growth is expected to recover with 2 per cent real GDP growth rate.
In light of the preceding survey regarding the impact of the global crisis, the implications for job creation, decent work and unemployment, is quite clear. The crisis worsens the employment situation in Mediterranean countries: it increases unemployment; lowers job quality; reduces wage rates; and, accentuates the informalization of the labour market. In a nutshell, labour bears the burden of adjusting to the global financial and economic crisis. In the face of this bad news, the good news is that inflation will subside as the world prices of energy, materials and food go down during the course of the crisis.67
As is the case at the international level, country responses to the crisis varied within the four countries, but generally, governments took various measures to stabilize interbank markets, ease liquidity conditions, support commercial banks and implement stimulus packages.
The Egyptian government Egyptian Government designated in November 2008, a stimulus package of LE15 billion representing 1.7 per cent of GDP, to be financed through the issuance of a public debt. In the hotel, catering and tourism sector, the Government introduced a new formula for take-off and landing fees for new operators and encouraged the reduction of those fees for existing operators to and from all airports in Egypt. For the textiles, the Ministry of Trade and Industry offered a cash subsidy on cotton and its Customs Council has begun a review of import duties on raw materials for exported goods.
In Israel , the Ministry of Industry, Trade and Labour has prepared an Emergency Plan for Unemployment, intended to defeat the rising rates of unemployment caused by the economic crisis. These measures are meant to enhance business activity, thereby reducing unemployment. Some of these measures are: initiating a fund dedicated to assisting
66 Nathanson (2009). 67 The IMF’s latest projections for the MENA region estimate consumer prices to fall from 15.6 per cent in 2008 to 10.0 per cent in 2009 for oil exporters, and from 14.4 per cent to 9.7 per cent for oil importers (IMF Survey Magazine, IMF Survey online, May 10, 2009).

34
factories experiencing temporary difficulties due to the economic crisis; increasing investment in R&D by NIS1.3 billion; and, vocational training programmes for jobseekers through the employment agency. The newly elected Government has passed budget for the years 2009-2010 in July 2009, together with a “Package Deal” signed by the representatives of the Government, the Histadrut Labour Union and the Manufacturers’ Association (representing the economic organizations and employers).68
For Morocco, the Government created a committee to follow the crisis. The Government and the employers’ association have signed a training agreement to retrain workers, using State aid while at the same time investing in training for productivity and creativity of companies. The Government has spent nearly US$100 million on a support package, whose measures include cancelling some payroll taxes and offering government guarantees to companies seeking bank loans. Around 130 companies from the textile and clothing sector and from the automotive branch, have received State aid intended to keep the economy stable and save jobs.
For Turkey , the Government did provide some mini packages before the March municipal elections. One of the well-received measures was short-time work compensation, which the Government calls the third package (it is not known what the previous two were about), to firms, by the Turkish Employment Agency, for up to six months. Neither the measure nor the impact aspects were anywhere near adequate, given the extent of the labour market impact of the global crisis in Turkey.
6. Strategies and policies to enhance job creation and job quality
The analysis in the previous section revealed that there a growing employment challenge facing the Mediterranean countries covered in this study, despite some individual variations. It has been demonstrated that economic growth was explicitly jobless for Turkey.
The growth in Egypt seems strong enough to lead to employment reductions due to productivity growth witnessed after 2004, even with a substantial progression of informal employment. Morocco is experiencing a lower growth rate, but with productivity improvement and a stabilization of the share of informal employment.
Policy makers in these economies are driven by the core objective of achieving an open competitive economy, but they have particular challenges and opportunities to face in terms of discovering new export niches. Turkey is the most advanced in this regard, while Morocco and Egypt are at a nascent stage.
The three economies have improved the skill composition of their labour force. This improvement is consistent with the observed productivity growth. However, they face an insufficient use of the youth labour force and educated workers. Due to labour market dynamics, the private sector has increased its demand for educated workers, but the unemployment of the middle educated and highest educated is still high, although its progression has stabilized. The unemployment of educated female workers is particularly high.
68 Nathanson, 2009.

35
Relatively to these economies, Israel performs better, but wage and income inequalities have increased. The demand for low-skilled workers is less intense because of the growth strategy orientation. The development of high-tech exporting industries requires more knowledge resources. The low-skilled jobs are left to foreign workers or to Israeli minorities. These categories endure job precariousness and a weak enforcement of the legal minimum wage.
The crisis increased the macroeconomic risks related to the diverse countries. The more related their export structure to the global value chain was, the more they were hit. The employment in Israel and Turkey relies more on foreign demand. Even if the countries had adequate foreign reserves, and a sound banking system, they faced a decrease of growth and a rise of unemployment. Morocco witnessed a reduction of its exports in 2008 and a decrease of its remittances in 2009. To face these shocks, the Government adopted diverse packages, mainly to protect employment and afford facilities to alleviate workers’ dismissal and enable them to wait for the economic recovery.
A significant proportion of the jobs created in the four countries were in the informal economy. Particularly, in Morocco and Egypt, an important number of their workers face low productivity and earnings, with an almost total absence of social protection. This does not imply that the micro and very small firms and self employed are not willing to adopt innovations and to perform productivity gains. The macroeconomic data, and some microeconomic surveys, provide evidence that a substantial component of the very small firms upgrade economically, enabling them to achieve better decent job conditions for their employees.
For Israel, the challenge is to deal with its labour market segmentation, to increase the relatively low participation rate in the labour force of specific ethnic and social categories and to improve the livelihood of vulnerable workers.
The programs launched by the Israeli Government to reduce the work discouragement of the potential low paid employees may have a positive effect on the economy. The Israeli Government afforded incentives and credit facility to high tech industries as well as to various other industries, including corporations and factories in need. This orientation would facilitate preventing deterioration in low-skill workers unemployment caused by the crisis. However, as Nathanson (2009) notes, these policy initiatives might note be adequate enough in dealing with poverty and inequality.
The main challenges for Turkey, Morocco and Egypt are to achieve higher employment creation and to find the way to an optimal mobilization of their accumulated human capital
The growth strategies and economic policies adopted in these countries need to be adapted to respond to these challenges.
A growth strategy that aims at reducing poverty should focus on the creation of productive jobs. That can only be achieved in a growth trajectory that augments capital accumulation, raises labour productivity, and pays due attention to the more employment-intensive activities or sectors.
On the basis of the above, the main contours of growth strategy and economic policies to meet the employment challenge are highlighted:
1. putting relatively greater emphasis on the internal market as opposed to the current emphasis on the external market and export promotion;
36
2. emphasis on raising the level of investment so as to boost domestic demand, which will also increase productive employment and hence increase supply.
Turkey, Morocco and Egypt have to find ways to enhance their competitiveness in their internal market and the export market. They have no room to raise tariffs. They should find a solution to decrease their real exchange rate and prepare their civil society to accept more expensive imported products against more jobs in their countries, less exclusion of their youth, a better mobilization of their knowledge capital and a reduction of poverty.
The development strategies need to rely on the development of new sectors and activities. Developing new export niches requires more financial resources and training. One way to optimize the mobilization of scarce development resources is to address the activities where the potential productivity gains are the highest. These activities are in both the formal and the informal economy. This implies a need to address, explicitly, the very small enterprises and households as development partners. The aim is to improve their productivity and ensure that they are protected against diverse economic and social risks.

37
References
Abdelkhalek, Gouda, (2009), Growth, Economic policies and Employment Linkages. Synthesis paper, ILO, Research Background paper (forth coming).
Abdel-Latif, Abla (2008), The Potential Impact of Recent Industrial Policy Changes in Egypt on Environment, Working Paper No. 137, September
Agenor,Pierre-Richard, Mustapha K. Nabli, Tarek Yousef, and Henning Tarp Jensen (2007), Labor Market Reforms, Growth and Unemployment in Labour-Exporting Countries in the Middle East and North Africa, in Nabli, Mustapha Kamel, Breaking the barriers to higher economic growth: better governance and deeper reforms in the Middle East and North Africa. Washington D.C., USA : World Bank Publications, 2008, pp. 39-61..
Akarçay-Gürbüz, Ayça, and Ulus, Mustafa (2008), Economic Welfare of Informal Labor and Unemployed in Turkey, Colloque GDRI, 2009, Galatasaray, http://gdri.dreem.free.fr/
Akyüz, Yilmaz, and Korkut Boratav (2003). “The Making of the Turkish Crisis”. World Development, 31 (9): 1549-1566.
Aloui, Omar, (2009), Growth, Economic policies and Employment Linkages. The Case of Morocco, ILO, Research Background paper (forth coming).
Alper, Emre (2001). “The Turkish Liquidity Crisis of 2000: What Went Wrong?” Russian and East European Finance and Trade, 10 (37): 51-71.
Amsden, A. (1989). Asia's Next Giant: South Korea and late industrialization. Oxford U. Press.
Aslan, Gurdal (2008), Salaire minimum et inégalités des revenus en Turquie », Université de Paris I, colloque GDRI, Galatasaray University, in http://gdri.dreem.free.fr/
Aydin, Faruk, Saygili, Hülya, and Saygili, Mesut (2007), Empirical Analysis of Structural Change in Turkish Exports, The Central Bank of the Republic of Turkey Research and Monetary Policy Department Working Paper No:07/08, October.
Boratav, Korkut, and Erinç Yeldan (2006). “Turkey, 1980-2000: Financial Liberalization, Macroeconomic (In)-Stability, And Patterns of Distribution”. In Lance Taylor (ed.) External Liberalization in Asia, Post-Socialist Europe and Brazil. New York: Oxford University Press: 417-455.
Burgess, R, and A. Venables (2004). "Towards a microeconomics of growth", World Bank Policy Research Working Paper, No. 3257. April.
Chang, H-J (2002). Kicking Away the Ladder : Development Strategies in historical perspective. London : Anthem Press.
Charmes, Jacques (2009), Informal Economy and Labour Market Policies and Institutions in selected Mediterranean Countries: Turkey, Syria, Jordan, Algeria and Morocco, ILO, Research Background paper (forthcoming).
Dasgupta, Dipac, Mustapha Kamel Nabli, Christopher Pissarides and Aristomene Varoudakis (2002). "Making Trade Work for Jobs", book section in Nabli, Mustapha Kamel, Breaking the barriers to higher economic growth: better governance and deeper reforms in the Middle East and North Africa. Washington D.C., USA : World Bank Publications, 2008, pp. 39-61.
38
Dollar, D. and A. Art (2001). "Trade, Growth and Poverty". World Bank Policy Research Paper No. 2615. March.
El Ehwany, Naglaa (2009), The Construction and Related Engineering Services in Egypt: Challenges and Policies, ECES, Working Paper No. 146, April
El-Ehwany, Naglaa and Nihal El-Megharbel (2009). " Employment Intensity of Growth in Egypt with a focus on Manufacturing Indsutries", ECES Working Paper Series No. 130. August
El-Issawy, Ibrahim (2007) The Egyptian Economy in Thirty Years Cairo: Academic Bookshop.
El-Laithy, Heba and Naglaa El-Ehwany (2006). " Employment – Poverty linkages: towards a pro-poor employment policy framework in Egypt" Unpublished presented to the ILO, Cairo. June.
Ercan, Hakan, (1998). "Non-Wage Labor Costs in the Turkish Manufacturing Industry: An International Comparison," in Tuncer Bulutay, ed., Impositions and Policies Related to the Turkish Labour Market, pp. 113-30. Ankara: State Institute of Statistics publication. ISBN: 975-19-2251-8.
Ertugrul, Ahmet, and Yeldan, Erinc (2003). “On The Structural Weaknesses Of The Post-1999 Turkish DisInflation Program”. Turkish Studies Quarterly, 4 (2), Summer: 53-66.
Fares , Hala and Ibrahim, Alaa (2008), Wage-price causality in Egyptian Economy (1990-2005), ECES,
Galal, Ahmed (2004), The economics of formalization: Potential winners and losers from formalization in Egypt. ECES, Working Paper, no. 95.
Ghoneim, Ahmed (2009), Egypt’s Prerequisites to Ensure Effective and Fruitful Reform of Services, ECES, Working Paper No. 149, June.
Ghose, A.K. (2003). Jobs and Income in a Globalizing World . Geneva: ILO.
Ghose, Ajit K., Nomaan Majid, and Christoph Ernst (2008) The Global Employment Challenge. Geneva: ILO.
Gökhan YILMAZ, Rauf GÖNENÇ ( 2008), How did the Turkish Industry Respond to Increased Competitive Pressures, 1998-2007?, The central Bank of The Central Bank of the Republic of Turkey, Research and Monetary Policy Department, Working Paper No:08/0, July.
ILO (2003). Global Employment Agenda 2003. Geneva: ILO.
ILO (2004). A Fair Globalization: Creating opportunities for all. Report of the World Commission on the Social Dimension of Globalization. Geneva.
ILO (2009). Global Employment Trends 2009. Geneva: ILO.
Ipek Đlkkaracan Ajas, Umut Gündüz (2009), Time-use, the Value of Non-Market Production and its Interactions with the Market Sector: The Case of Turkey, , Istanbul Technical University, Faculty of Management, Macka, Istanbul 34367, Turkey.
Jansen, M. and E.Lee (2007). Trade and Employment: Challenges for policy research. Geneva: ILO & WTO.
39
Kapsos, S. (2005). 'The employment intensity of growth: Trends and macroeconomic determinants', Employment Strategy Papers, ILO, December 2005.
Keller, Jennifer and Mustapha K. Nabli (2007). " The Macroeconomics of Labor Market Outcomes in MENA", The World Bank.
Kheir -El-Din, Hanaa and Tarek Abdelfattah Moursi (2002). "Sources of Economic Growth and Technical Progress in Egypt: An Aggregate Perspective." Discussion Paper, FEPS, Cairo University, May.
Kheir-El-Din, Hanaa and El-Laithy, Heba (2008), Agricultural Productivity Growth, Employment and Poverty in Egypt, ECES, Working Paper No. 129 , February.
Mazumdar, D. (2003). "Trends in employment and the employer elasticity of manufacturing, 1971 – 1992: an international comparison”. Cambridge J. of Economics, (27) : 563 – 82.
Ministry of Economic Development (MED) (2008). Egypt: Achieving the Millennium Development Goals. A Mid-Point Assessment. Cairo: MED.
Nabli, Mustapha Kamel (2007) Breaking the Barriers to Higher Economic Growth. Washington, D.C: The World Bank.
Nassar, Heba (2009), Growth, Economic policies and Employment Linkages. The Case of Egypt, ILO, Research Background paper (forth coming).
Nathanson, Roby, (2009), Growth, Economic policies and Employment Linkages. The Case of Israel, ILO, Research Background paper (forth coming).
Nihal El-Megharbel (2007), The Impact of Recent Macro and Labor Market Policies on Job Creation in Egypt, ECES, Working Paper No. 123, May
Rizk, Soaad Kamel and Nihal El-Megharbel (2006). 'The Impact of the EUROMED Partnership Agreement on Employment". Unpublished.
Robalino, David A (2007) : Créer des emplois en améliorant la réglementation du travail, la protection sociale et les systèmes de formation des travailleurs. Banque Mondiale
Rodrik, D. (1999). The new global economy and developing countries: Making openness work. Washington, D C. Overseas Development Council.
Rodrik, Dani (2003). In Search of Prosperity, Analytic Narrative on Economic Growth. Princeton: Princeton U. Press.
Sakr, Mohamed, Massoud, Nada and Sakr, Hala (2009), Tourism in Egypt: An unfinished Business, ECES, Working Paper No. 147, May
Tunalı, Đ. (2003) “Background Study on the Labor Market and Employment in Turkey”, prepared for the European Training Foundation.
Wade, R. (1990) Governing the Market: Economic theory and the role of the government in East Asian industrialization, Princeton U. Press, Working Paper No. 136, July.
World Bank (2001). Egypt: Social and Structural Review, Report No 22397-EGT. June 30.
World Bank (2003). Unlocking the Employment Potential in the Middle East and North Africa: Towards a New Social Contact. MENA Development Report. Washington, D.C: World Bank.
40
World Bank (2009) Arab Republic of Egypt. Economic Growth, Inequality and Poverty: Social Mobility in Egypt between 2005 and 2008. March 15.
World Trade Organisation (2005), “Egypt: Trade Policy Review- revision”, Report by the Secretariat, WT/TPR/S/150/Rev.1.
World Trade Organisation (2006), “Israel: Trade Policy Review- revision”, Report by the Secretariat, WT/TPR/S/157/Rev.1.
World Trade Organisation (2008), Kingdom of Turkey: Trade Policy Review- revision”, Report by the Secretariat,WT/TPR/S/192/rev.1.
World Trade Organisation (2009), “Kingdom of Morocco: Trade Policy Review- revision”, Report by the Secretariat,WT/TPR/S/217/rev.1.
Yeldan, Erinc (2002). “On the IMF-Directed Disinflation Program in Turkey: A Program for Stabilization and Austerity or a Recipe for Impoverishment and Financial Chaos?”
Yeldan, Erinç and Ercan, Hacan (2009), Growth, Economic policies and Employment Linkages. The Case of Turkey, ILO, Research Background paper (forth coming).

41
Annexes
Annex 1. Box: Trade outcomes in the selected countries
Egypt Israel Morocco Turkey
Source: World Bank Trade Indicators
Annex 2. Box - Evolution of the production structure of the four countries
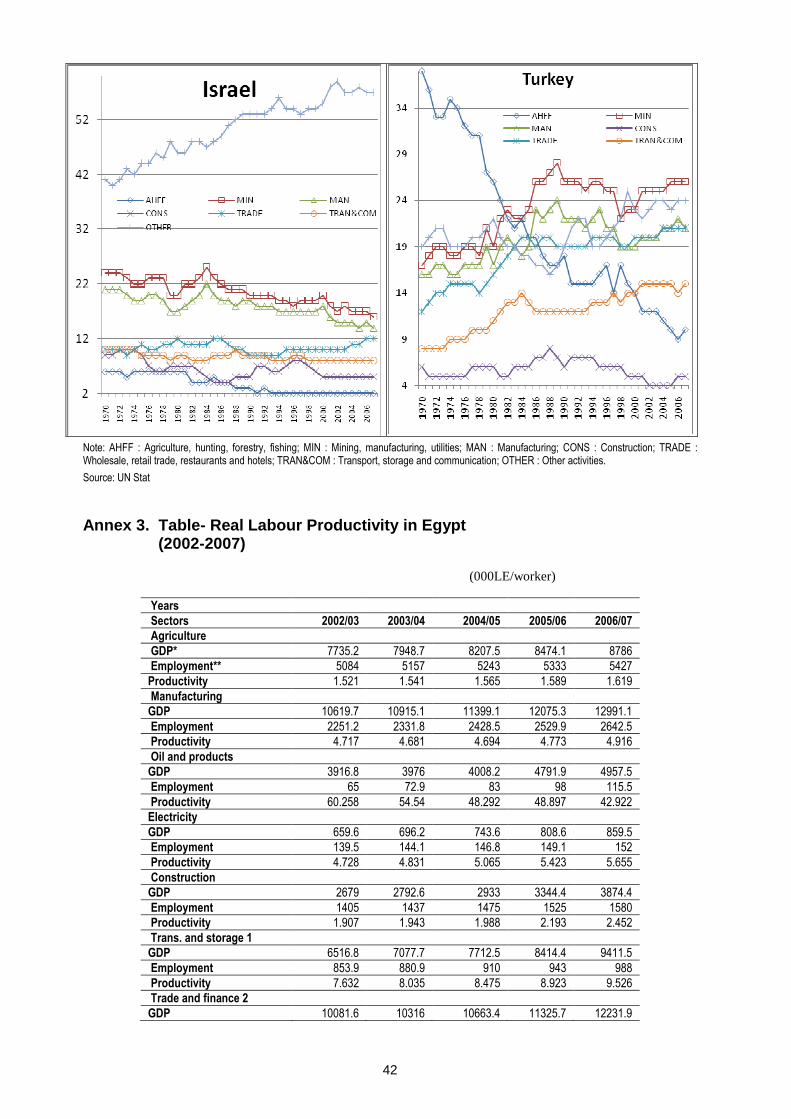
42
Note: AHFF : Agriculture, hunting, forestry, fishing; MIN : Mining, manufacturing, utilities; MAN : Manufacturing; CONS : Construction; TRADE : Wholesale, retail trade, restaurants and hotels; TRAN&COM : Transport, storage and communication; OTHER : Other activities.
Source: UN Stat
Annex 3. Table- Real Labour Productivity in Egypt (2002-2007)
(000LE/worker)
Years Sectors 2002/03 2003/04 2004/05 2005/06 2006/07 Agriculture GDP* 7735.2 7948.7 8207.5 8474.1 8786
Employment** 5084 5157 5243 5333 5427
Productivity 1.521 1.541 1.565 1.589 1.619
Manufacturing
GDP 10619.7 10915.1 11399.1 12075.3 12991.1
Employment 2251.2 2331.8 2428.5 2529.9 2642.5
Productivity 4.717 4.681 4.694 4.773 4.916
Oil and products
GDP 3916.8 3976 4008.2 4791.9 4957.5
Employment 65 72.9 83 98 115.5
Productivity 60.258 54.54 48.292 48.897 42.922
Electricity
GDP 659.6 696.2 743.6 808.6 859.5
Employment 139.5 144.1 146.8 149.1 152
Productivity 4.728 4.831 5.065 5.423 5.655
Construction
GDP 2679 2792.6 2933 3344.4 3874.4
Employment 1405 1437 1475 1525 1580
Productivity 1.907 1.943 1.988 2.193 2.452
Trans. and storage 1
GDP 6516.8 7077.7 7712.5 8414.4 9411.5
Employment 853.9 880.9 910 943 988
Productivity 7.632 8.035 8.475 8.923 9.526
Trade and finance 2
GDP 10081.6 10316 10663.4 11325.7 12231.9

43
Employment 1732.5 1793.1 1857.4 1930 2007
Productivity 5.819 5.753 5.741 5.868 6.095
Hotels and restaurants
GDP 1014 1482.5 1794.6 1872.5 2120.6
Employment 239 260 285 315 345
Productivity 4.243 5.702 6.297 5.944 6.147
Housing and real estate
GDP 2637.9 2682.7 2737.7 2839.9 2957.5
Employment 248 254 262 270 279
Productivity 10.637 10.562 10.449 10.518 10.6
Social services3
GDP 9965.5 10306 10659.2 11099.3 11637.1
Employment 6060.9 6177.2 6312.3 6447 6584
Productivity 1.644 1.668 1.689 1.722 1.767
Total
GDP 55826.1 58193.5 60858.8 65046.1 69827.1
Employment 18079 18508 19003 19540 20120
Productivity 3.09 3.14 3.2 3.33 3.47
Source: Based on data from the Ministry of State for Economic Development, in Abdel-Latif, Abla (2008).
1- Including communications and Suez Canal.
2- Including insurance.
3- Including public utilities; social insurance; and government, personal and social services.
* GDP at fixed prices, base year 1981/82 in LE million.
** Number of workers: 1000 employees
Annex 4. An overview of the main economic sectors in the selected countries
This short view is extracted from the sector chapters of the WTO trade policy review reports.
Egypt
Agriculture
The contribution of agriculture to GDP declined from 17.3 in 1998/99 to 15.8 per cent in 2003/04. However, the sector retains a significant role in employment, accounting for about 34 per cent of the active labour force. On a per capita basis, Egypt’s area of cultivated land at 0.05 ha per capita is among the lowest in the world. Farms are small, with an estimated 70 per cent of holdings less than 0.42 hectares. Reclaimed new land, which was owned and operated by the Government through public enterprises, has gradually been sold. Around 80 per cent of this new land is now operated by the private sector.
Due to low rainfall, agriculture is strongly dependent on irrigation from the Nile River. The agricultural land-base amounts to about 3.3 million hectares, consisting of 3.0 million hectares lying within the Nile basin and delta, and about 80,000 hectares of oasis and rain-fed land. Of the total area in the Nile basin and delta, some 2.5 million hectares are "old" lands, and the remaining 0.72 million hectares are new reclaimed lands. An elaborate crop rotation system is followed on the old lands. Most agricultural land is used for the cultivation of wheat, rice and maize. In terms of employment and export value, cotton is the most important crop in Egypt. It is estimated that cotton production employs up to one million farm workers.
Petroleum and Gas
Petroleum and natural gas contribute only around 11.6 per cent to GDP, but account for almost 40 per cent of the value of commodity exports. While Egypt's production levels

44
of crude oil have declined, the natural gas sector has been expanding rapidly in recent years. Foreign companies may engage in the exploration of petroleum and natural gas only through joint ventures with the State-owned Egyptian General Petroleum Corporation.
Manufacturing
The manufacturing sector comprises a broad range of activities. The most important are metallurgy and metallurgical products, food processing and chemical products. The contribution of this sector to GDP has fluctuated around 19 per cent.
Services
The services sector remains the backbone of Egypt's economy, with a share of about 49 per cent of GDP. State participation remains important in various service subsectors, including financial services, telecommunication and air transport. The tourism industry and fees for using the Suez Canal remain Egypt's most important sources of foreign exchange. A Telecommunications Law established the divesture of Telecom Egypt to the private sector in 2006.
Tourism is by far Egypt's most important source of foreign exchange and an important generator of employment. Egypt offers a wide variety of attractions. Its historical heritage spans several millennia. Landmarks and monuments of Pharaonic, Nubian, Greek, Roman, Christian and Islamic civilizations are easily accessible. In addition, beach and leisure tourism on the coasts of the Red Sea and South Sinai have shown strong growth in recent years. The majority of tourists come from western and southern Europe (56 per cent), followed by Eastern Europe (18 per cent), countries in the Middle East (15 per cent) and Asia (5 per cent). In view of terrorist attacks in early 2005, the future development of Egypt's tourism industry may also depend on how international visitors perceive security. Since 1999, Egypt's tourism industry has continued to perform well.
Israel
Agriculture
The contribution of agriculture to Israel's NDP and employment remains limited. However, the sector features advanced and performing production systems based on high agri-technology. As a result, in spite of severe constraints, such as restricted access to water and the predominance of desert areas, Israel still maintains a certain level of agricultural production. The share of agriculture in total merchandise exports has declined steadily during the last decade. While the sector accounted for nearly 16 per cent of merchandise exports in 1980, this proportion fell to 3.9 per cent in 2004. The main export products include vegetables, fruits (e.g. citrus), flowers and ornamental plants. Livestock production, heavily dependent on imported grains, is destined for the domestic market; it accounted for only 1.5 per cent of agricultural exports in 2004. Agricultural products have also declined as a share of total imports, from about 13 per cent in 1980 to 6.2 per cent in 2004. The sector is largely supported through various government interventions, including subsidies and tariff protection, mainly in favour of products such as dairy, fruit and vegetables.
Manufacturing
In 2004, the manufacturing sector accounted for about 14 per cent of NDP and about a fifth of production by the business sector (i.e. all activities excluding public and housing services and non-profit organizations). The main subsectors are electronics (electrical motors, components communication equipment, industrial, medical and scientific equipment), chemicals, rubber and plastics, food and beverages, basic metal and metal products, and machinery and equipment.

45
The share of manufacturing in total employment has decreased steadily during the last few decades, from about 22 per cent in 1970 to around 16 per cent in 2004. Traditional industries (textiles, clothing, wood, non-metallic minerals and metals) have shown the largest decline in employment, with their overall share falling by 50 per cent in the last 30 years. The manufacturing sector has contracted in recent years. However, the sector is marked more than ever by asymmetric developments between high-tech (including electronics, communications and medical equipment) and traditional industries. The high-tech industry has largely grown in importance, in particular with regard to export capacity. On the contrary, traditional industries have declined sharply due to increased competition from countries with abundant, cheap labour. This has contributed to a shift towards the production of goods intensive in high technology and skilled labour, two main assets of the Israeli economy.
The manufacturing sector is the main beneficiary of State aid. Both local and foreign investment can benefit from a wide range of incentives. Special attention is given to high-tech companies, small and medium-sized enterprises, and R&D activities.
Tourism
Tourism is an important subsector of the Israeli economy; the major attractions include significant religious sites, the Dead Sea and the Mediterranean coast. Receipts from foreign tourism (excluding expenditure of foreign workers in Israel) reached US$1.5 billion in 2004 (1.3 per cent of GDP). This is still low compared with 2000 (2.8 per cent of GDP), but the industry is recovering progressively from the profound slowdown in 2001 and 2002 due to the deterioration of the security situation in Israel and the war in Iraq. The evolution also reflects a decrease of 65 per cent in the number of tourists visiting Israel between 2000 and 2002. Accordingly, during the same period, receipts from foreign tourism and the share of hotel nights spent by tourists declined by 70 and 72 per cent, respectively.
In 2004, tourism contributed to about 1.9 per cent of GDP, much lower than its contribution in 1995 (almost 3 per cent), but higher than in 2002 when the share dropped to 1.7 per cent (Table IV.13). The sector employed some 70,000 persons. The economic importance of tourism, as an export sector, also lies in its contribution to the balance of payments. It accounted for almost 16 per cent of services exports in 2004 and constitutes the only item of the Israeli balance of services that is not systematically in deficit.
Morocco
Agriculture
Morocco has almost 1.5 million agricultural holdings, of which nearly 1 million raise livestock. Small units predominate: 70 per cent of holdings have less than 5 ha; 17 per cent, between 5 and 10 ha; 12 per cent, between 10 and 50 ha; and only 1 per cent more than 50 hectares.
Agriculture plays a key role, especially in terms of employment. Common wheat marketing is subject to a specific regime, the details of which are established at the beginning of each season. Agricultural policy continues to be influenced by the need to combat the effects of recurrent drought. In addition to public investment, the sector benefits from numerous incentives in the form of financial assistance (subsidies and premiums), tax concessions and loans.
At present, 16 per cent (as compared with 12 per cent in 2002) of the cultivable area is irrigated, i.e. 1.46 million hectares (including 682,600 ha in large-scale irrigation areas, 334,100 ha in small and medium-scale irrigation areas, and the rest in privately irrigated areas). On average, the irrigated areas account for 45 per cent of agricultural value added
46
(and more than 70 per cent during drought years), as well as 75 per cent of exports. Consequently, it is the traditional sectors that are more severely affected by drought, the export sectors (nursery and market garden sectors) being for the most part located in irrigated areas. Moreover, it is these areas that attract most investment. The Plan Maroc Vert provides for the implementation of a programme for saving and making better use of water consumed in irrigation schemes by converting the less efficient irrigation systems (particularly surface irrigation) to localized irrigation techniques over an area of 550,000 ha.
Fisheries
Morocco has a 3,500 km-long coastline and a marine area of 1.1 million km2, with an annual fishing potential estimated at 1.5 million tonnes renewable. The contribution of fishing to GDP is now about 2.5 per cent. In 2007, the value of national production amounted to Dh6.5 billion and earnings from marine product exports (including processed products) reached Dh11.8 billion. The fishery product processing industry accounts for about 47 per cent of agri-food exports.
This sector employed 111,146 active sailors and 25,900 boatmen. The active sailors are engaged in inshore fishing (51 per cent), small-scale fishing (40 per cent) and deep-sea fishing (8 per cent); foreigners worked both in inshore fishing (0.27 per cent of the workforce) and in deep-sea fishing (4.5 per cent). The processing industry employs about 70,000 people.
The aim of the fisheries policy is to conserve resources, in particular by introducing selective fishing and reducing the level of informal activity. In 2005, a new fisheries agreement, marking the resumption of fishing relations between the two partners, was concluded with the EC. At present, there are two other agreements in force, with Japan and Russia.
Manufacturing
The industrial fabric of Morocco consists of 7,734 units (including 2,475 with foreign shareholdings). Foreigners provide 20.54 per cent of the total registered capital of industrial enterprises. The chemicals and parachemicals subsector alone, drains off about 42 per cent of foreign capital. The processing industries employ about 500,000 people. The clothing industry (including furs) remains the most labour-intensive, with 30 per cent of the total industrial labour force. Small and medium-sized industry (SMI) continues to make an important contribution, particularly in terms of employment, accounting for 45 per cent of jobs in the sector; the textiles and clothing industry comes first, followed by chemicals, parachemicals, agri-foodstuffs, mechanical engineering, metallurgy and electrical electronics.
The contribution of the manufacturing sector (excluding oil refining and mining and quarrying) has declined slightly since 2006 when the most important subsectors, in terms of their contribution to sector value added, were agri-foodstuffs (36 per cent), chemicals-parachemicals (33 per cent), textiles-clothing-leather (15 per cent), and mechanical engineering and metallurgy (11 per cent).
The Programme Émergence now forms the basis for the Government's industrial strategy. It is aimed at revitalizing Morocco’s industrial fabric and is targeted at six subsectors: automotive equipment; aviation equipment; specialty electronics; agri-foodstuffs; textiles; and, offshoring. Subcontracting is being promoted in connection with three subsectors: automotive; electronics; and, aviation (in particular through the creation of integrated industrial hubs). These hubs offer industrialists various advantages, including fiscal and specific, simplified administration, and the availability of infrastructure.

47
Services
Tourism
Tourism plays a key role in Morocco's economy. Tourism generates 420,000 direct jobs (3.8 per cent of the labour force). In 2007, revenue from tourism was around Dh58.8 billion (9.6 per cent of GDP), i.e. an increase of 100 per cent as compared with 2001. It has become the largest source of foreign currency, exceeding the transfers made by Moroccans resident abroad (Dh55.1 billion in 2007). In 2007, some 7.4 million tourists visited Morocco, as against 4.4 million in 2001. Among foreign tourists, the French make up the largest group, followed by the Spanish. FDI in tourism has increased considerably, rising from Dh332.4 million in 2001 (1 per cent of overall FDI) to Dh7,925.5 million in 2006 (31 per cent of overall FDI). Tourist arrivals are up, whereas hotel beds are down. This is due to the development of new types of accommodation, such as apartment hotels, riads and guesthouses and the purchase, by tourists, of their own holiday homes.
The main outlines of the tourism policy were laid down in 2001 in the so-called Vision 2010 strategy that aims to achieve the objective of 10 million visitors in 2010. To this end, it is intended to provide for Dh80 to 90 billion of hotel investment and to build 80,000 additional rooms
ICT
The mobile telephone market is booming. The number of mobile phone subscribers reached 22.8 million in 2008, representing a penetration rate of 74.0 per cent. Prepayment schemes accounted for 96 per cent of all subscriber contracts. The Internet market is also growing strongly, and here Morocco has focused on improving connection quality. The country had a total of 757,453 Internet subscribers in 2008. The dominant ADSL access mode had 482,791 subscribers in that year.
Call centre (CC) activity has also developed strongly in Morocco, with the number of CCs registered with the ANRT rising from 31 in 2001 to 244 in 2008 (Table IV.10). The Government views this as one of the economy's most buoyant activities in terms of employment and investment. In 2006, 49 per cent of all CCs had foreign capital (often majority ownership).
Turkey
Agriculture remains a key sector in the Turkish economy. The average farm has around 6 ha, and arable land in each farm is generally divided into a large number of parcels. Despite the recent emergence of more commercial farms, the bulk of farming has remained small and family-owned, highly fragmented and capital-low. It continues to use only elementary technologies. The majority of the sector is informal. Although participation in the self-employed social security scheme is mandatory, 91 per cent of farmers do not participate, and only a small minority pay income taxes
According to the OECD, the total support to agriculture (TSE), as a percentage of GDP, increased from 4 per cent during 1986–88 to 4.2 per cent in 2003–05; after peaking at 5.1 per cent in 2003, it decreased to 3.8 per cent in 2005. This aid (market price support, payments based on output, and input subsidies), benefited mainly larger farms, and increased the pressure on the use of natural resources (such as water). This support fell in 2003–05 thus increasing the exposure of farmers to world market signals.
Fisheries production, including aquaculture, averaged 640,000 tonnes over 2000–06. It is composed largely of marine fish (about 70 per cent of the total in 2006), aquaculture (15 per cent), freshwater fish (8 per cent), and other sea products (7 per cent). The Black
48
Sea is the main production area, followed by the Mediterranean Sea. High-seas fishing has diminished considerably due to pollution, ecological changes and unsustainable use of resources
Forests cover 20.7 million hectares or 26.9 per cent of the total area of Turkey. The main problems in the subsector include incomplete cadastral works, deficiency in specialized technical staff and workers, limited number of national parks and similar protected areas, low levels of annual reforestation to avoid erosion and ensure long-term balance in wood supply and demand, uncertainties in management targets, delays in regeneration works, and inadequate financing.
Manufacturing
Private investors have gradually moved into more sophisticated areas, such as consumer electronics and the automotive industry. Some of the main problems facing the sector are: lack of qualified labour and technology; limited production capability in high value-added products; and insufficient investment in emerging subsectors.
Structure of the manufacturing sector, 2002 and 2005(% share)
Production Exports Technology intensity a 2002 2005b 2002 2005
High 5.1 6.3 6.2 6.0
Mid-high 18.2 25.3 24.3 28.5
Mid-low 26.7 27.0 22.8 26.9
Low 50.0 41.4 46.8 38.7
Total 100.0 100.0 100.0 100.0 a. OECD science, technology and industry scoreboard classification is taken as reference. b. Forecasts at 2002 prices. Source: State Planning Organization (2006), Ninth Development Plan 2007-13, Ankara.
Almost one third of Turkey's manufacturing value added is in the textiles and clothing, leather, food and beverages, and tobacco industries. Manufacturing exports account for about 80 per cent of total merchandise exports. The EC and the Middle East are the main markets. Imports of manufactured products represent over 60 per cent of total merchandise imports, and are concentrated in capital-intensive industries, such as machinery and transport equipment and chemicals.
Over the last few years, various State-owned manufacturing companies have been privatized. The manufacturing sector received FDI inflows, mostly allocated to the chemical, beverages and tobacco, electrical machinery, automotive, and textile industries.
Tourism
In 2007, Turkey ranked ninth in the world as a tourism earner (against eleventh in 2002), with US$18.1 billion of tourism receipts in 2006, up from US$11.9 billion in 2002; this is expected to increase to US$36.4 billion by 2013. Tourism activities have continued to expand rapidly during the last few years, especially in Istanbul and on the western and southern coasts. Large numbers of hotels, guest houses and holiday apartments have been built. There are also important historical sites, and eco-tourism activities are being introduced. The number of licensed tourist beds rose from 619,024 in 2002 to 783,319 in 2006. In 2006, 28.3 per cent of visitors came from Europe and 59.1 per cent from OECD countries (mainly Germany, 19 per cent of the total). The hotel occupancy rate was about 47.3 per cent.
Turkey's tourism policy has three main goals: creating an efficient and internationally competitive subsector with a view to making it more profitable; meeting the requirements of foreign and domestic tourists in terms of overall facilities; and, ensuring the continuity of

49
its natural and cultural assets. The Government remains active in the tourism subsector. It grants incentives for tourism investments in accordance with the Tourism Encouragement Law; provides infrastructure and public services for tourism; defines zones with high tourism potential; promulgates designated tourism centres or areas by decree; elaborates and approves land-use plans; conducts environmental controls; promotes the country abroad; carries out research and collects statistics; and provides vocational training. Local administrations are responsible for similar matters at the local level. Investors in tourism also have access to incentives granted under the Investment Encouragement Programme.
Foreign companies have increased their role in tourism since the mid-1980s; there is no limitation on foreign investment. Foreign and domestic companies set their own maximum prices. However, the prices must be cleared annually by the MCT. Enterprises are not required to charge uniform prices, but cannot exceed their maximum approved prices. The MCT and local administrations are in charge of classification and certification of hotels and restaurants. According to the authorities, the number of beds certified by the MCT and the municipalities is expected to reach 550,000 and 420,000, respectively.


51
Employment Working Papers
A complete list of previous working papers can be found on: http://www.ilo.org/employment
2008
1 Challenging the myths about learning and training in small and medium-sized enterprises: Implications for public policy; ISBN 92-2-120555-5 (print); 92-2-120556-2 (web pdf) David Ashton, Johnny Sung, Arwen Raddon and Trevor Riordan
2 Integrating mass media in small enterprise development. Current knowledge and good practices; ISBN 92-2-121142-6 (print); 92-2-121143-3 (web pdf) Gavin Anderson. Edited by Karl-Oskar Olming and Nicolas MacFarquhar
3 Recognizing ability: The skills and productivity of persons with disabilities. A literature review; ISBN 978-92-2-121271-3 (print); 978-92-2-121272-0 (web pdf) Tony Powers
4 Offshoring and employment in the developing world: The case of Costa Rica; ISBN 978-92-2-121259-1 (print); 978-92-2-121260-7 (web pdf) Christoph Ernst and Diego Sanchez-Ancochea
5 Skills and productivity in the informal economy; ISBN 978-92-2-121273-7 (print); 978-92-2-121274-4 (web pdf) Robert Palmer
6 Challenges and approaches to connect skills development to productivity and employment growth: India; unpublished C. S. Venkata Ratnam and Arvind Chaturvedi
7 Improving skills and productivity of disadvantaged youth; ISBN 978-92-2-121277-5 (print); 978-92-2-121278-2 (web pdf) David H. Freedman
8 Skills development for industrial clusters: A preliminary review; ISBN 978-92-2-121279-9 (print); 978-92-2-121280-5 (web pdf) Marco Marchese and Akiko Sakamoto
52
9 The impact of globalization and macroeconomic change on employment in Mauritius: What next in the post-MFA era?; ISBN 978-92-2-120235-6 (print); 978-92-2-120236-3 (web pdf) Naoko Otobe
10 School-to-work transition: Evidence from Nepal; ISBN 978-92-2-121354-3 (print); 978-92-2-121355-0 (web pdf) New Era
11 A perspective from the MNE Declaration to the present: Mistakes, surprises and newly important policy implications; ISBN 978-92-2-120606-4 (print); 978-92-2-120607-1 (web pdf) Theodore H. Moran
12 Gobiernos locales, turismo comunitario y sus redes Memoria: V Encuentro consultivo regional (REDTURS); ISBN 978-92-2-321430-2 (print); 978-92-2-321431-9 (web pdf)
13 Assessing vulnerable employment: The role of status and sector indicators in Pakistan, Namibia and Brazil; ISBN 978-92-2-121283-6 (print); 978-92-2-121284-3 (web pdf) Theo Sparreboom and Michael P.F. de Gier
14 School-to-work transitions in Mongolia; ISBN 978-92-2-121524-0 (print); 978-92-2-121525-7 (web pdf) Francesco Pastore
15 Are there optimal global configurations of labour market flexibility and security? Tackling the “flexicurity” oxymoron; ISBN 978-92-2-121536-3 (print); 978-92-2-121537-0 (web pdf) Miriam Abu Sharkh
16 The impact of macroeconomic change on employment in the retail sector in India: Policy implications for growth, sectoral change and employment; ISBN 978-92-2-120736-8 (print); 978-92-2-120727-6 (web pdf) Jayati Ghosh, Amitayu Sengupta and Anamitra Roychoudhury
17 From corporate-centred security to flexicurity in Japan; ISBN 978-92-2-121776-3 (print); 978-92-2-121777-0 (web pdf)
Kazutoshi Chatani
18 A view on international labour standards, labour law and MSEs; ISBN 978-92-2-121753-4 (print);978-92-2-121754-1(web pdf) Julio Faundez
53
19 Economic growth, employment and poverty in the Middle East and North Africa; ISBN 978-92-2-121782-4 (print); 978-92-2-121783-1 (web pdf)
Mahmood Messkoub
20 Employment and social issues in fresh fruit and vegetables; ISBN 978-92-2-1219415(print); 978-92-2-1219422 (web pdf)
Sarah Best, Ivanka Mamic
21 Trade agreements and employment: Chile 1996-2003;
ISBN 978-2-1211962-0 (print); 978-2-121963-7 (web pdf)
22 The employment effects of North-South trade and technological change; ISBN 978-92-2-121964-4 (print); 978-92-2-121965-1 (web pdf)
Nomaan Majid
23 Voluntary social initiatives in fresh fruit and vegetables value chains; ISBN 978-92-2-122007-7 (print); 978-92-2-122008-4 (web pdf)
Sarah Best and Ivanka Mamic
24 Crecimiento Económico y Empleo de Jóvenes en Chile. Análisis sectorial y proyecciones; ISBN 978-92-2-321599-6 (print); 978-92-2-321600-9 (web pdf)
Mario D. Velásquez Pinto
25 The impact of codes and standards on investment flows to developing countries; ISBN 978-92-2-122114-2 (print); 978-92.2.122115-9 (web pdf)
Dirk Willem te Velde
26 The promotion of respect for workers’ rights in the banking sector: Current practice and future prospects; ISBN 978-92-2-122116-6 (print); 978-2-122117-3 (web pdf)
Emily Sims
2009
27 Labour Market information and analysis for skills development; ISBN 978-92-2-122151-7 (print); 978-92-2-122152-4 (web pdf) Theo Sparreboom and Marcus Powell
28 Global reach - Local relationships : Corporate social responsibility, worker’s rights and local development; ISBN 978-92-2-122222-4 (print); 978-92-2-122212-5 (web pdf) Anne Posthuma, Emily Sims
54
29 The use of ILS in equity markets: Investing in the work force social investors and international labour standards; ISBN 978-92-2-122288-0 (print); 978-92-2-122289-7 (web pdf) Elizabeth Umlas
30 Rising food prices and their implications for employment, decent work and poverty reduction; ISBN 978-92-2-122331-3 (print); 978-92-2-122332-0 (web pdf)
Rizwanul Islam and Graeme Buckley
31 Economic implications of labour and labour-related laws on MSEs: A quick review of the Latin American experience; ISBN 978-92-2-122368-9 (print); 978-92-2-122369-6 (web pdf)
Juan Chacaltana
32 Understanding informal apprenticeship – Findings from empirical research in Tanzania; ISBN 978-2-122351-1 (print); 978-92-2-122352-8 (web pdf)
Irmgard Nübler, Christine Hofmann, Clemens Greiner
33 Partnerships for youth employment. A review of selected community-based initiatives; ISBN 978-92-2-122468-6 (print); 978-92-2-122469-3 (web pdf)
Peter Kenyon
34 The effects of fiscal stimulus packages on employment; ISBN 978-92-2-122489-1 (print); 978-92-2-122490-7 (web pdf) Veena Jha
35 Labour market policies in times of crisis; ISBN 978-92-2-122510-2 (print); 978-92-2-122511-9 (web pdf) Sandrine Cazes, Sher Verick
36 The global economic crisis and developing countries: Transmission channels, fiscal and policy space and the design of national responses;
ISBN 978-92-2-122544-7 (print); 978-92-2-122545-4 (web pdf)
Iyanatul Islam
37 Rethinking monetary and financial policy:
Practical suggestions for monitoring financial stability while generating employment and poverty reduction
ISBN 978-92-2-122514-0 (print); 978-92-2-122515-7 (web pdf)
Gerald Epstein
55
38 Promoting employment-intensive growth in Bangladesh: Policy analysis of the manufacturing and service sectors;
ISBN 978-92-2-122540-9 (print); 978-92-2-122541-6 (web pdf)
Nazneen Ahmed, Mohammad Yunus, Harunur Rashid Bhuyan
39 The well-being of labour in contemporary Indian economy;
ISBN 978-92-2-122622-2 (print); 978-92-2-122623-9 (web pdf)
Praveen Jha
40 The global recession and developing countries;
ISBN 978-92-2-122847-9 (print); 978-92-2-122848-6 (web pdf)
Nomaan Majid
41 Offshoring and employment in the developing world: Business process outsourcing in the Philippines;
ISBN 978-92-2-122845-5 (print); 978-92-2-122846-2 (web pdf)
Miriam Bird, Christoph Ernst
42 A survey of the Great Depression, as recorded in the International Labour Review, 1931-1939;
ISBN 978-92-2-122843-1 (print); 978-92-2-122844-8 (web pdf)
Rod Mamudi
43 The price of exclusion:
The economic consequences of excluding people with disabilities from the world or work
ISBN 978-92-2-122921-6 (print); 978-92-2-122922-3 (web pdf)
Sebastian Buckup
44 Researching NQFs:
Some conceptual issues
ISBN 978-92-2-123066-3 (print), 978-92-2-123067-0 (web pdf)
Stephanie Allais, David Raffe, Michael Young
45 Learning from the first qualifications frameworks
ISBN 978-92-2-123068-7 (print), 978-92-2-123069-4 (web pdf)
Stepahnie Allais, David Raffe, Rob Strathdee, leesa Wheelahan, Michael Young
46 International framework agreements and global social dialogue: Lessons from the Daimler case ISBN 978-92-2-122353-5 (print); 978-92-2-122354-2 (web pdf)
Dimitris Stevis

56
2010
47 International framework agreements and global social dialogue: Parameters and prospects ISBN 978-92-2-123298-8 (print); 978-92-2-122299-5 (web pdf)
Dimitris Stevis
48 Unravelling the impact of the global financial crisis on the South African labour market
ISBN 978-92-2-123296-4 (print; 978-92-2-123297-1 (web pdf)
Sher Verick
49 Guiding structural change
The role of government in development
ISBN 978-92-2-123340-4 (print); 978-92-2-123341-1 (web pdf)
Matthew Carson
50 Les politiques du marché du travail et de l'emploi au Burkina Faso
ISBN 978-92-2-223394-6 (print); 978-92-2-223395-3 (web pdf)
Lassané Ouedraogo et Adama Zerbo
51 Characterizing the school-to-work transitions of young men and women
Evidence from the ILO school-to-work transition surveys
ISBN 978-92-2-123396-1 (print); 978-92-2-123397-8 (web pdf)
Makiko Matsumoto and Sara Elder
52 Exploring the linkages between investment and employment in Moldova - A time-series analysis ISBN 978-92-2-122990-2 (print); 978-92-2-122991-9 (web pdf)
Stefania Villa
53 The crisis of orthodox macroeconomic policy
The case for a renewed commitment to full employment
ISBN 978-92-2-123512 (print); 978-92-2-123513 (web pdf) Mohammed Muqtada
54 Trade contraction in the post-2007 crisis
Employment and inequality effects in India and South Africa Forthcoming
Marion Jansen, Leanne Roncolato and Erik von Uexkull

57
55 The impact of crisis-related changes in trade flows on employment,
Incomes, regional and sectoral development in Brazil Forthcoming
Scott McDonald, Marion Jansen and Erik von Uexkull
56 Envejecimiento y Empleo en América Latina y el Caribe
ISBN 978-92-2-323631-1 (print); 978-92-2-323632-8 (web pdf)
Jorge A. Paz
57 Demographic ageing and employment in China
ISBN 978-92-2-123580-4 (print); 978-92-2-123581-1 (web pdf)
Du Yang and Wrang Meiyan
58 Employment, poverty and economic development in Madagascar: A macroeconomic framework
ISBN 978-92-2-123398-5 (print); 978-92-2-123399-2 (web pdf)
Gerald Epstein, James Heintz, Léonce Ndikumana and Grace Chang
59 The Korean labour market: Some historical macroeconomic perspectives
ISBN 978-92-2-123675-7 (print); 978-92-2-123676-4 (web pdf)
Anne Zooyob
60 Economic Partnership Agreements and decent work: the stakes for West and Central Africa
ISBN 978-92-2-123727-3 (print); 978-92-2-123728-0 (web pdf)
Eléonore d’Achon and Nicolas Gérard
61 The great recession of 2008-2009: Causes, consequences and policy responses
ISBN 978-92-2-123729-7 (print); 978-92-2-123730-3 (web pdf)
Iyanatul Islam and Sher Verick
62 Rwanda forging ahead: The challenge of getting everybody on board
ISBN 978-92-2-123771-6 (print); 978-92-2-123772-3 (web pdf)
Per Ronnas, Elina Scheja, Karl Backeus

58
Employment Sector
For more information visit our site: http://www.ilo.org/employment
International Labour Office Employment Sector 4, route des Morillons CH-1211 Geneva 22 Email: [email protected]
Related Documents