Worldwide Distribution of the MYH9 Kidney Disease Susceptibility Alleles and Haplotypes: Evidence of Historical Selection in Africa Taras K. Oleksyk 1 , George W. Nelson 2 , Ping An 2 , Jeffrey B. Kopp 3 , Cheryl A. Winkler 2 * 1 Department of Biology, University of Puerto Rico at Mayagu ¨ ez, Mayagu ¨ ez, Puerto Rico, 2 Laboratory of Genomic Diversity, SAIC-Frederick, Frederick, Maryland, United States of America, 3 Kidney Disease Section, National Institute of Diabetes and Digestive and Kidney Diseases, National Institutes of Health, Bethesda, Maryland, United States of America Abstract MYH9 was recently identified as renal susceptibility gene (OR 3–8, p,10 28 ) for major forms of kidney disease disproportionately affecting individuals of African descent. The risk haplotype (E-1) occurs at much higher frequencies in African Americans ($60%) than in European Americans (,4%), revealing a genetic basis for a major health disparity. The population distributions of MYH9 risk alleles and the E-1 risk haplotype and the demographic and selective forces acting on the MYH9 region are not well explored. We reconstructed MYH9 haplotypes from 4 tagging single nucleotide polymorphisms (SNPs) spanning introns 12–23 using available data from HapMap Phase II, and by genotyping 938 DNAs from the Human Genome Diversity Panel (HGDP). The E-1 risk haplotype followed a cline, being most frequent within sub- Saharan African populations (range 50–80%), less frequent in populations from the Middle East (9–27%) and Europe (0–9%), and rare or absent in Asia, the Americas, and Oceania. The fixation indexes (F ST ) for pairwise comparisons between the risk haplotypes for continental populations were calculated for MYH9 haplotypes; F ST ranged from 0.27–0.40 for Africa compared to other continental populations, possibly due to selection. Uniquely in Africa, the Yoruba population showed high frequency extended haplotype length around the core risk allele (C) compared to the alternative allele (T) at the same locus (rs4821481, iHs = 2.67), as well as high population differentiation (F ST(CEU vs. YRI) = 0.51) in HapMap Phase II data, also observable only in the Yoruba population from HGDP (F ST = 0.49), pointing to an instance of recent selection in the genomic region. The population-specific divergence in MYH9 risk allele frequencies among the world’s populations may prove important in risk assessment and public health policies to mitigate the burden of kidney disease in vulnerable populations. Citation: Oleksyk TK, Nelson GW, An P, Kopp JB, Winkler CA (2010) Worldwide Distribution of the MYH9 Kidney Disease Susceptibility Alleles and Haplotypes: Evidence of Historical Selection in Africa. PLoS ONE 5(7): e11474. doi:10.1371/journal.pone.0011474 Editor: Henry Harpending, University of Utah, United States of America Received February 11, 2010; Accepted June 14, 2010; Published July 9, 2010 This is an open-access article distributed under the terms of the Creative Commons Public Domain declaration which stipulates that, once placed in the public domain, this work may be freely reproduced, distributed, transmitted, modified, built upon, or otherwise used by anyone for any lawful purpose. Funding: This project has been funded in whole or in part with federal funds from the National Cancer Institute, National Institutes of Health, under contract HHSN261200800001E, the Intramural Research Programs of the National Institute for Diabetes, Digestive, and Kidney Diseases (ZO-1 DK043308), and by a grant from the NIH (RO1 DK 070941 (BIF)) and (RO1 RFA-CA-09-003 (CAW)). The funders had no role in study design, data collection and analysis, decision to publish, or preparation of the manuscript. Competing Interests: The NCI, NIH has a pending patent pending for genetic screening of MYH9 risk alleles for renal disease. Drs. Winkler, Kopp, and Nelson are listed as co-discovers on the application. This does not alter the author’s adherence to all the PLoS ONE policies on sharing data and materials. * E-mail: [email protected] Introduction A genome wide admixture linkage scan followed by fine mapping recently identified MYH9, encoding non-muscle myosin heavy chain IIA, as a major susceptibility locus for focal segmental glomerulosclerosis (FSGS), HIV-associated collapsing glomerulo- sclerosis, also called HIV-associated nephropathy (HIVAN), and end stage kidney disease (ESKD) attributed to hypertension [1,2]. A series of subsequent studies have confirmed and extended the initial findings for non-diabetic ESKD to a possible role in diabetic ESKD —the leading cause of kidney failure [3]. It has long been noted that African ancestry populations (e.g., African Americans) are more likely to develop kidney disease and have a poorer prognosis than their European descent counterparts. Family clustering of disparate etiologies of kidney diseases has also been reported in African American families [4]. In the United States, African Americans have approximately 3–4-fold higher rates of ESKD compared to European Americans [5]. The risk of HIVAN is 18-fold or greater in African Americans compared to non- African descent populations and it is estimated that the life-time risk of HIVAN among African Americans with HIV-1 disease, in the absence of anti-retroviral therapy, is 10% [6]. MYH9 provides a plausible genetic explanation for much of this disparity as the MYH9 alleles and the haplotype most strongly associated with kidney disease are highly frequent in African Americans (allele frequencies <60%) and infrequent in European Americans (#4%)[1]. These studies did not address global distribution of MYH9 risk alleles, and the historical reasons for this health disparity remained elusive. Although many MYH9 SNPs were found to significantly associate with HIVAN and FSGS, any of the three highly correlated SNPs, rs4821480, rs2032487, and rs4821481 in intron 23 plus rs3752462 in intron 13, defined an extended (E) haplotype that was more informative than any single SNP for association with kidney disease [1,7]. The MYH9 E-1 haplotype was associated with HIVAN, FSGS, and non-diabetic ESKD PLoS ONE | www.plosone.org 1 July 2010 | Volume 5 | Issue 7 | e11474

Welcome message from author
This document is posted to help you gain knowledge. Please leave a comment to let me know what you think about it! Share it to your friends and learn new things together.
Transcript
Worldwide Distribution of the MYH9 Kidney DiseaseSusceptibility Alleles and Haplotypes: Evidence ofHistorical Selection in AfricaTaras K. Oleksyk1, George W. Nelson2, Ping An2, Jeffrey B. Kopp3, Cheryl A. Winkler2*
1 Department of Biology, University of Puerto Rico at Mayaguez, Mayaguez, Puerto Rico, 2 Laboratory of Genomic Diversity, SAIC-Frederick, Frederick, Maryland, United
States of America, 3 Kidney Disease Section, National Institute of Diabetes and Digestive and Kidney Diseases, National Institutes of Health, Bethesda, Maryland, United
States of America
Abstract
MYH9 was recently identified as renal susceptibility gene (OR 3–8, p,1028) for major forms of kidney diseasedisproportionately affecting individuals of African descent. The risk haplotype (E-1) occurs at much higher frequencies inAfrican Americans ($60%) than in European Americans (,4%), revealing a genetic basis for a major health disparity. Thepopulation distributions of MYH9 risk alleles and the E-1 risk haplotype and the demographic and selective forces acting onthe MYH9 region are not well explored. We reconstructed MYH9 haplotypes from 4 tagging single nucleotidepolymorphisms (SNPs) spanning introns 12–23 using available data from HapMap Phase II, and by genotyping 938 DNAsfrom the Human Genome Diversity Panel (HGDP). The E-1 risk haplotype followed a cline, being most frequent within sub-Saharan African populations (range 50–80%), less frequent in populations from the Middle East (9–27%) and Europe (0–9%),and rare or absent in Asia, the Americas, and Oceania. The fixation indexes (FST) for pairwise comparisons between the riskhaplotypes for continental populations were calculated for MYH9 haplotypes; FST ranged from 0.27–0.40 for Africacompared to other continental populations, possibly due to selection. Uniquely in Africa, the Yoruba population showedhigh frequency extended haplotype length around the core risk allele (C) compared to the alternative allele (T) at the samelocus (rs4821481, iHs = 2.67), as well as high population differentiation (FST(CEU vs. YRI) = 0.51) in HapMap Phase II data, alsoobservable only in the Yoruba population from HGDP (FST = 0.49), pointing to an instance of recent selection in the genomicregion. The population-specific divergence in MYH9 risk allele frequencies among the world’s populations may proveimportant in risk assessment and public health policies to mitigate the burden of kidney disease in vulnerable populations.
Citation: Oleksyk TK, Nelson GW, An P, Kopp JB, Winkler CA (2010) Worldwide Distribution of the MYH9 Kidney Disease Susceptibility Alleles and Haplotypes:Evidence of Historical Selection in Africa. PLoS ONE 5(7): e11474. doi:10.1371/journal.pone.0011474
Editor: Henry Harpending, University of Utah, United States of America
Received February 11, 2010; Accepted June 14, 2010; Published July 9, 2010
This is an open-access article distributed under the terms of the Creative Commons Public Domain declaration which stipulates that, once placed in the publicdomain, this work may be freely reproduced, distributed, transmitted, modified, built upon, or otherwise used by anyone for any lawful purpose.
Funding: This project has been funded in whole or in part with federal funds from the National Cancer Institute, National Institutes of Health, under contractHHSN261200800001E, the Intramural Research Programs of the National Institute for Diabetes, Digestive, and Kidney Diseases (ZO-1 DK043308), and by a grantfrom the NIH (RO1 DK 070941 (BIF)) and (RO1 RFA-CA-09-003 (CAW)). The funders had no role in study design, data collection and analysis, decision to publish, orpreparation of the manuscript.
Competing Interests: The NCI, NIH has a pending patent pending for genetic screening of MYH9 risk alleles for renal disease. Drs. Winkler, Kopp, and Nelson arelisted as co-discovers on the application. This does not alter the author’s adherence to all the PLoS ONE policies on sharing data and materials.
* E-mail: [email protected]
Introduction
A genome wide admixture linkage scan followed by fine
mapping recently identified MYH9, encoding non-muscle myosin
heavy chain IIA, as a major susceptibility locus for focal segmental
glomerulosclerosis (FSGS), HIV-associated collapsing glomerulo-
sclerosis, also called HIV-associated nephropathy (HIVAN), and
end stage kidney disease (ESKD) attributed to hypertension [1,2].
A series of subsequent studies have confirmed and extended the
initial findings for non-diabetic ESKD to a possible role in diabetic
ESKD —the leading cause of kidney failure [3]. It has long been
noted that African ancestry populations (e.g., African Americans)
are more likely to develop kidney disease and have a poorer
prognosis than their European descent counterparts. Family
clustering of disparate etiologies of kidney diseases has also been
reported in African American families [4]. In the United States,
African Americans have approximately 3–4-fold higher rates of
ESKD compared to European Americans [5]. The risk of HIVAN
is 18-fold or greater in African Americans compared to non-
African descent populations and it is estimated that the life-time
risk of HIVAN among African Americans with HIV-1 disease, in
the absence of anti-retroviral therapy, is 10% [6]. MYH9 provides
a plausible genetic explanation for much of this disparity as the
MYH9 alleles and the haplotype most strongly associated with
kidney disease are highly frequent in African Americans (allele
frequencies <60%) and infrequent in European Americans
(#4%)[1]. These studies did not address global distribution of
MYH9 risk alleles, and the historical reasons for this health
disparity remained elusive.
Although many MYH9 SNPs were found to significantly
associate with HIVAN and FSGS, any of the three highly
correlated SNPs, rs4821480, rs2032487, and rs4821481 in intron
23 plus rs3752462 in intron 13, defined an extended (E) haplotype
that was more informative than any single SNP for association
with kidney disease [1,7]. The MYH9 E-1 haplotype was
associated with HIVAN, FSGS, and non-diabetic ESKD
PLoS ONE | www.plosone.org 1 July 2010 | Volume 5 | Issue 7 | e11474
(OR = 2.8, 5, 7, p,1028) [1]. The extended haplotype spans
14.9 kb, extending across two haplotype blocks that encompass
introns 12–23. All of the MYH9 single nucleotide polymorphisms
(SNPs) most strongly associated with kidney disease fall within this
extended block [1]. The MYH9 E-1 haplotype explains nearly all
of the excess burden of major forms of kidney disease in African
Americans; for example, the attributable risks are 100% and 70%
for HIVAN and FSGS, respectively. The association of MYH9 risk
alleles with HIVAN is particularly worrisome for sub-Sahara
Africa where risk alleles are predicted to be at high frequency and
more than 22 million adults and children are infected with HIV-1.
In this study, we present an analysis of the E haplotype block
and tagging SNPs in a worldwide population survey of major
continental populations using a compilation of data from the
International HapMap Project and the Human Genome Diversity
Panel (HGDP). We analyzed SNPs using data available from
HapMap Phase II [8] and HGDP population [9,10], and
genotyped additional SNPs in the HGDP. We used the combined
information to reconstruct E haplotypes associated with kidney
disease to determine the worldwide distribution and frequencies of
risk and protective haplotypes to assess public health implications,
especially in settings of high HIV prevalence. A secondary goal
was to determine if highly divergent allele frequencies were
generated by selection on MYH9 or by neutral mechanisms. We
discussed the observed diversity in the context of local adaptation
and population histories.
Results and Discussion
To determine the worldwide distribution and evolutionary
history of non-muscle myosin IIA heavy chain gene (MYH9) alleles
and the E haplotypes associated with kidney disease in the African
American population [1,2], we obtained genotypes for the Human
Genome Diversity Panel comprising DNA from 938 individuals
representing 51 unique populations for the three SNPs defining
the E haplotype block: SNP rs4821481 (T/c) was available from
the CEPH database [8,9], and SNPs rs4821480 (T/g), and
rs3752462 (C/t) were genotyped in-house. SNP rs2032487 which
is in near absolute LD with both rs482180 and rs48321481 was
not included. To reconstruct the worldwide distribution of the E
haplotypes, the haplotypes were inferred using three E haplotype-
defining SNPs separately in the 51 distinct ethnic groups from
HGDP with 95–100% accuracy.
As shown in Table 1, African populations display the highest
heterozygosity compared to all other worldwide populations. Of
the three SNPs, rs3752462 is the most variable, particularly in
populations outside of Africa that showed the widest range in
heterozygosity. The two other SNPs are variable among African
populations, and are often fixed in populations east from the
Fertile Crescent: Central and East Asia, Oceania, and the
Americas (Table 1). The populations in Europe and the Middle
East also show high variation at these loci (heterozygosity between
0.1–0.4). These populations show divergence from other African
populations for many genetic markers in HGDP [11]. Low
heterozygosity values in Yoruba compared to other African
populations may be a consequence of selection, but should only
be interpreted in conjunction with other indicators of selective
sweep [12].
We found substantial differentiation in the frequencies of
rs4821481, as indicated by the increased FST in the HapMap
samples (FST(CEU vs. YRI) = 0.51)[13], and the HGDP (FST =
0.49)[11](Figure 1, Table S1, Table S2, Table S3). This single
allele can serve as a proxy for the risk haplotype (E-1), since the C
allele is present in over 99% of the risk E-1 haplotype (Table 2);
the only other haplotype carrying the C allele at rs4821481 is the
rare E-5, which was observed in only two of the HGDP
populations, with frequencies of 0.02 (Mandenka) amd 0.01
(Palestinian). The reported value of divergence for this allele is
considered highly significant and lays within the top 5% of FST
among all SNPs genotyped in the HapMap project [8,14–16]. For
instance, the pairwise continental FSTs range from CEU vs.
CHB+JPT, with the lowest level of differentiation (average
FST = 0.07), to YRI vs. CHB+JPT with the highest (average
FST = 0.12)[17], while the differences in the where pair-wise
comparisons between France, Palestine, Han and Yoruba in the
Human Diversity Panel all show FST ,0.15 [11,18].
Although the divergence between the two groups is suggestive of
selection, FST values alone are insufficient for determining if a
locus is the target of selection, because high individual values of
FST could also result from genetic drift or demographic events
[12]. We expanded the comparison to the inferred E haplotypes
for pairwise FST scores between continental populations (Table 3).
Most of these calculations yield statistically significant values
.0.25 (except Europe vs. South-Central Asia), but FST values for
haplotypes are markedly lower than those calculated from
individual SNPs. The largest population differences were observed
between African population and non-African populations
(FST = 0.27–0.4, Table 3); the difference in frequencies between
European and East Asian populations was also elevated
(FST = 0.23, Table 3). Within continents, most population
comparisons do not yield large differentiation estimates (Table
S1, Table S2, Table S3). Indeed, only one of these comparisons
was noteworthy (Yoruba vs. Bantu from South Africa (BANTU-
SA), FST = 0.37)(Table S1). MYH9 harbors SNPs with some of the
highest FST values on chromosome 22: FST (CEU vs. YRI) = 0.5–
0.65 in MYH9 (expected chromosome-wide FST = 0.29)[13]. The
existence of high values for multilocus or haplotype Fst values
across regions can still be considered as a starting point in
identifying selective targets [1,19].
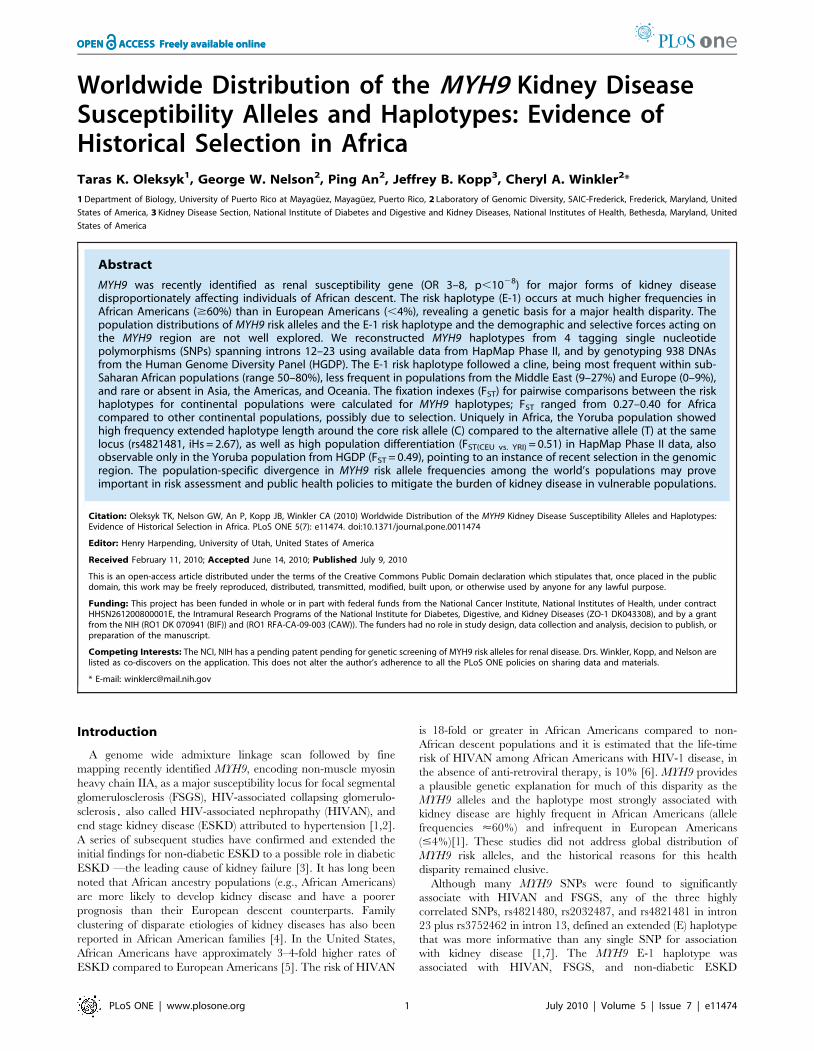
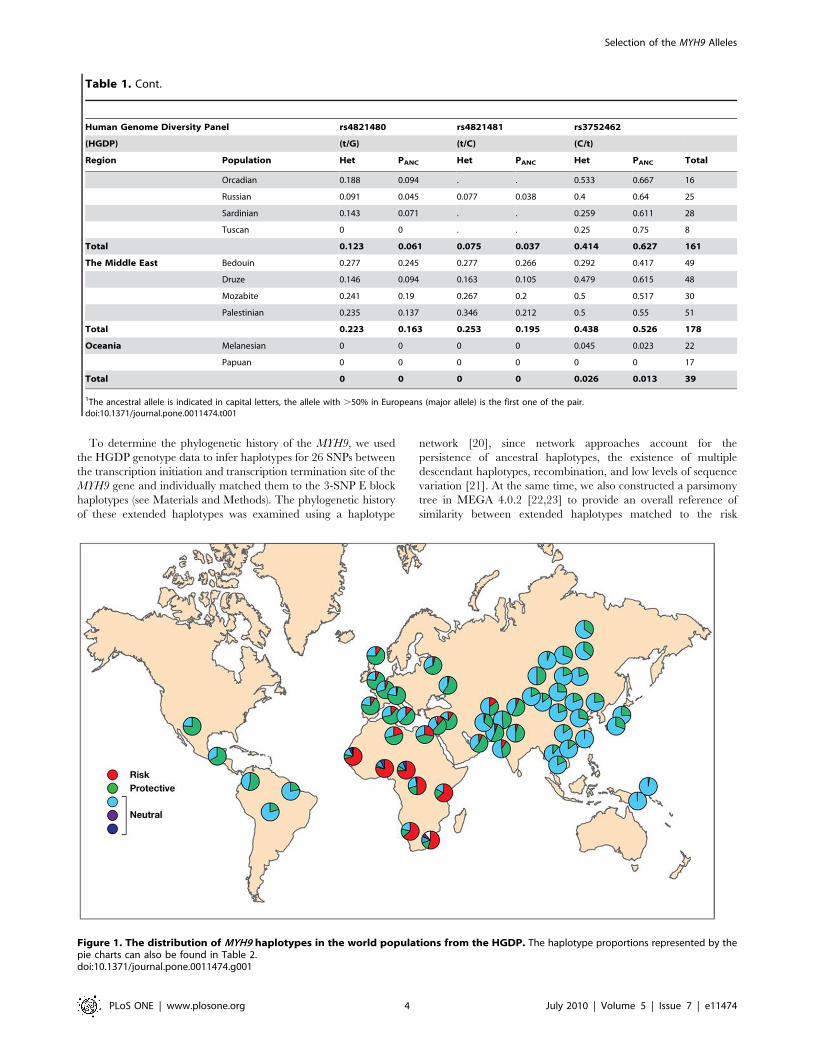
As shown in Figure 1, the E-1 risk haplotype is prominent in
Sub-Saharan Africa, especially in Yoruba, while the majority of
individuals from Europe and the Middle Eastern populations
feature the E-2 haplotype (Figure 1) previously reported to be
protective against kidney disease (Kopp et al. 2008). The same
shift can be observed in the major populations from the
International HapMap Project (Figure 2) as well as in the HGDP
(Figure 1). The E-2 haplotype remains frequent in South and
Central Asia, but the populations in South and East Asia as well as
Oceania are dominated by neutral haplotypes (E-3). In Amer-
indian populations, especially in Central America, the E-2
haplotype has frequencies similar to those in South and Central
Asia (Figure 1). There is a decreasing north/south cline in eastern
and central Asia, with higher frequencies of the protective alleles in
the north compared to the south, and this may explain in part the
relatively high frequencies of the protective alleles among
Amerindian populations who derive from north Asian populations.
The risk E-1 haplotype decreases in frequency in a cline away
from Africa and is apparently extinct in East Asia, Oceania, and
the Americas. It is the most common haplotype in sub-Saharan
Africa; for example, estimates from HapMap or the HGDS panel
indicate E-1 haplotype frequencies in the range of 69 to 80%,
where the highest value is found in Yoruba. However, the
prevalence of E-1 among populations in Africa is not uniformly
high, with the lowest prevalence in the Mbuti and Sun populations
(50%–64%). We also found substantial differentiation in frequen-
cies of risk and protective haplotypes among human populations,
as indicated by the elevated FST values between Africa and the rest
of the world (FST = 0.27–0.4, Table 3 and Figure 1).
Selection of the MYH9 Alleles
PLoS ONE | www.plosone.org 2 July 2010 | Volume 5 | Issue 7 | e11474
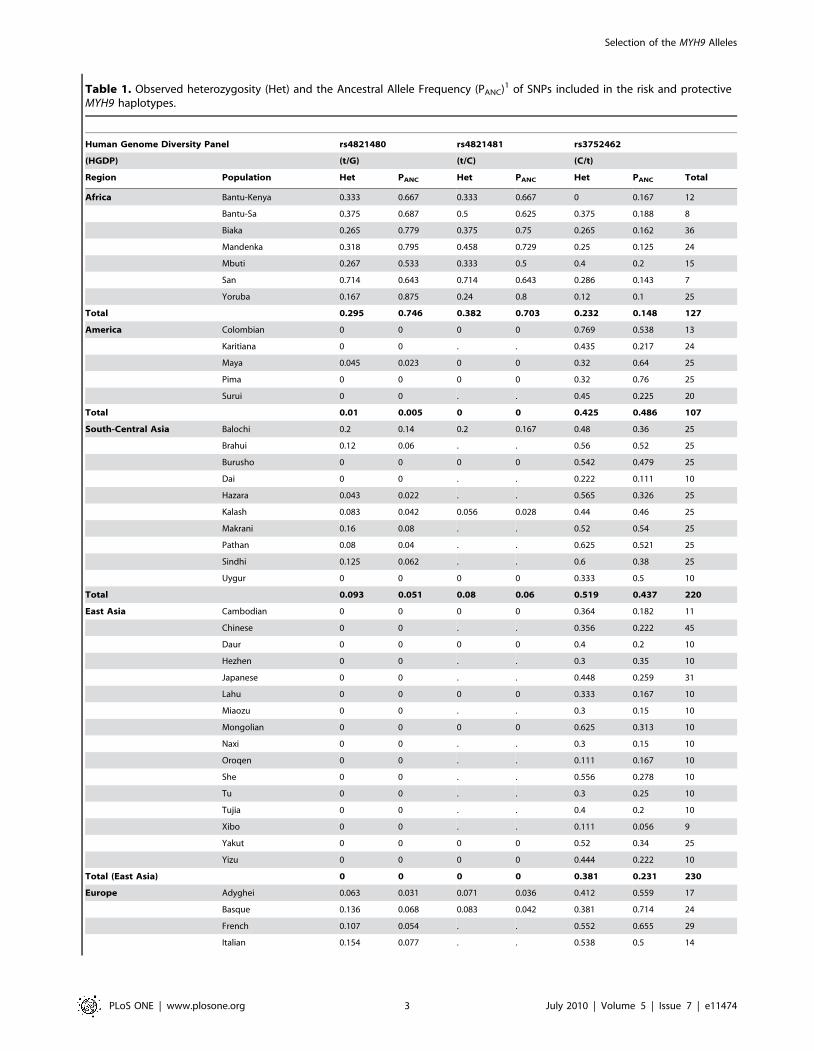
Table 1. Observed heterozygosity (Het) and the Ancestral Allele Frequency (PANC)1 of SNPs included in the risk and protectiveMYH9 haplotypes.
Human Genome Diversity Panel rs4821480 rs4821481 rs3752462
(HGDP) (t/G) (t/C) (C/t)
Region Population Het PANC Het PANC Het PANC Total
Africa Bantu-Kenya 0.333 0.667 0.333 0.667 0 0.167 12
Bantu-Sa 0.375 0.687 0.5 0.625 0.375 0.188 8
Biaka 0.265 0.779 0.375 0.75 0.265 0.162 36
Mandenka 0.318 0.795 0.458 0.729 0.25 0.125 24
Mbuti 0.267 0.533 0.333 0.5 0.4 0.2 15
San 0.714 0.643 0.714 0.643 0.286 0.143 7
Yoruba 0.167 0.875 0.24 0.8 0.12 0.1 25
Total 0.295 0.746 0.382 0.703 0.232 0.148 127
America Colombian 0 0 0 0 0.769 0.538 13
Karitiana 0 0 . . 0.435 0.217 24
Maya 0.045 0.023 0 0 0.32 0.64 25
Pima 0 0 0 0 0.32 0.76 25
Surui 0 0 . . 0.45 0.225 20
Total 0.01 0.005 0 0 0.425 0.486 107
South-Central Asia Balochi 0.2 0.14 0.2 0.167 0.48 0.36 25
Brahui 0.12 0.06 . . 0.56 0.52 25
Burusho 0 0 0 0 0.542 0.479 25
Dai 0 0 . . 0.222 0.111 10
Hazara 0.043 0.022 . . 0.565 0.326 25
Kalash 0.083 0.042 0.056 0.028 0.44 0.46 25
Makrani 0.16 0.08 . . 0.52 0.54 25
Pathan 0.08 0.04 . . 0.625 0.521 25
Sindhi 0.125 0.062 . . 0.6 0.38 25
Uygur 0 0 0 0 0.333 0.5 10
Total 0.093 0.051 0.08 0.06 0.519 0.437 220
East Asia Cambodian 0 0 0 0 0.364 0.182 11
Chinese 0 0 . . 0.356 0.222 45
Daur 0 0 0 0 0.4 0.2 10
Hezhen 0 0 . . 0.3 0.35 10
Japanese 0 0 . . 0.448 0.259 31
Lahu 0 0 0 0 0.333 0.167 10
Miaozu 0 0 . . 0.3 0.15 10
Mongolian 0 0 0 0 0.625 0.313 10
Naxi 0 0 . . 0.3 0.15 10
Oroqen 0 0 . . 0.111 0.167 10
She 0 0 . . 0.556 0.278 10
Tu 0 0 . . 0.3 0.25 10
Tujia 0 0 . . 0.4 0.2 10
Xibo 0 0 . . 0.111 0.056 9
Yakut 0 0 0 0 0.52 0.34 25
Yizu 0 0 0 0 0.444 0.222 10
Total (East Asia) 0 0 0 0 0.381 0.231 230
Europe Adyghei 0.063 0.031 0.071 0.036 0.412 0.559 17
Basque 0.136 0.068 0.083 0.042 0.381 0.714 24
French 0.107 0.054 . . 0.552 0.655 29
Italian 0.154 0.077 . . 0.538 0.5 14
Selection of the MYH9 Alleles
PLoS ONE | www.plosone.org 3 July 2010 | Volume 5 | Issue 7 | e11474
To determine the phylogenetic history of the MYH9, we used
the HGDP genotype data to infer haplotypes for 26 SNPs between
the transcription initiation and transcription termination site of the
MYH9 gene and individually matched them to the 3-SNP E block
haplotypes (see Materials and Methods). The phylogenetic history
of these extended haplotypes was examined using a haplotype
network [20], since network approaches account for the
persistence of ancestral haplotypes, the existence of multiple
descendant haplotypes, recombination, and low levels of sequence
variation [21]. At the same time, we also constructed a parsimony
tree in MEGA 4.0.2 [22,23] to provide an overall reference of
similarity between extended haplotypes matched to the risk
Figure 1. The distribution of MYH9 haplotypes in the world populations from the HGDP. The haplotype proportions represented by thepie charts can also be found in Table 2.doi:10.1371/journal.pone.0011474.g001
Human Genome Diversity Panel rs4821480 rs4821481 rs3752462
(HGDP) (t/G) (t/C) (C/t)
Region Population Het PANC Het PANC Het PANC Total
Orcadian 0.188 0.094 . . 0.533 0.667 16
Russian 0.091 0.045 0.077 0.038 0.4 0.64 25
Sardinian 0.143 0.071 . . 0.259 0.611 28
Tuscan 0 0 . . 0.25 0.75 8
Total 0.123 0.061 0.075 0.037 0.414 0.627 161
The Middle East Bedouin 0.277 0.245 0.277 0.266 0.292 0.417 49
Druze 0.146 0.094 0.163 0.105 0.479 0.615 48
Mozabite 0.241 0.19 0.267 0.2 0.5 0.517 30
Palestinian 0.235 0.137 0.346 0.212 0.5 0.55 51
Total 0.223 0.163 0.253 0.195 0.438 0.526 178
Oceania Melanesian 0 0 0 0 0.045 0.023 22
Papuan 0 0 0 0 0 0 17
Total 0 0 0 0 0.026 0.013 39
1The ancestral allele is indicated in capital letters, the allele with .50% in Europeans (major allele) is the first one of the pair.doi:10.1371/journal.pone.0011474.t001
Table 1. Cont.
Selection of the MYH9 Alleles
PLoS ONE | www.plosone.org 4 July 2010 | Volume 5 | Issue 7 | e11474
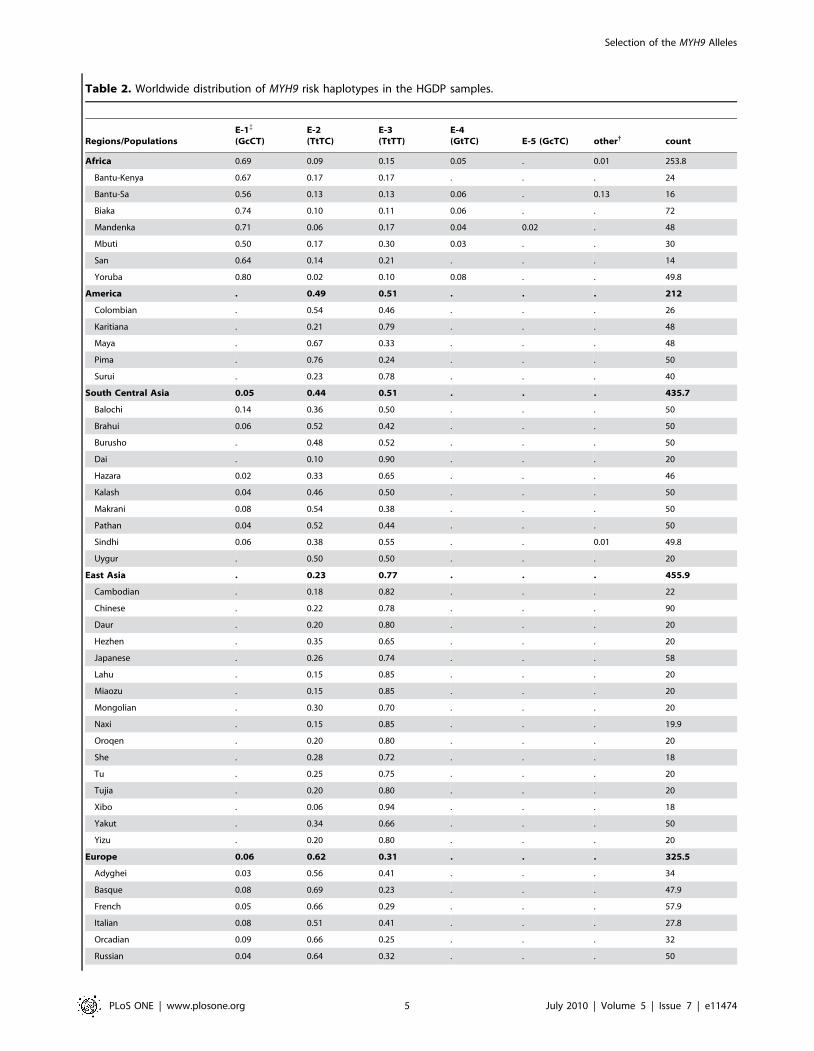
Table 2. Worldwide distribution of MYH9 risk haplotypes in the HGDP samples.
Regions/PopulationsE-1{
(GcCT)E-2(TtTC)
E-3(TtTT)
E-4(GtTC) E-5 (GcTC) other{ count
Africa 0.69 0.09 0.15 0.05 . 0.01 253.8
Bantu-Kenya 0.67 0.17 0.17 . . . 24
Bantu-Sa 0.56 0.13 0.13 0.06 . 0.13 16
Biaka 0.74 0.10 0.11 0.06 . . 72
Mandenka 0.71 0.06 0.17 0.04 0.02 . 48
Mbuti 0.50 0.17 0.30 0.03 . . 30
San 0.64 0.14 0.21 . . . 14
Yoruba 0.80 0.02 0.10 0.08 . . 49.8
America . 0.49 0.51 . . . 212
Colombian . 0.54 0.46 . . . 26
Karitiana . 0.21 0.79 . . . 48
Maya . 0.67 0.33 . . . 48
Pima . 0.76 0.24 . . . 50
Surui . 0.23 0.78 . . . 40
South Central Asia 0.05 0.44 0.51 . . . 435.7
Balochi 0.14 0.36 0.50 . . . 50
Brahui 0.06 0.52 0.42 . . . 50
Burusho . 0.48 0.52 . . . 50
Dai . 0.10 0.90 . . . 20
Hazara 0.02 0.33 0.65 . . . 46
Kalash 0.04 0.46 0.50 . . . 50
Makrani 0.08 0.54 0.38 . . . 50
Pathan 0.04 0.52 0.44 . . . 50
Sindhi 0.06 0.38 0.55 . . 0.01 49.8
Uygur . 0.50 0.50 . . . 20
East Asia . 0.23 0.77 . . . 455.9
Cambodian . 0.18 0.82 . . . 22
Chinese . 0.22 0.78 . . . 90
Daur . 0.20 0.80 . . . 20
Hezhen . 0.35 0.65 . . . 20
Japanese . 0.26 0.74 . . . 58
Lahu . 0.15 0.85 . . . 20
Miaozu . 0.15 0.85 . . . 20
Mongolian . 0.30 0.70 . . . 20
Naxi . 0.15 0.85 . . . 19.9
Oroqen . 0.20 0.80 . . . 20
She . 0.28 0.72 . . . 18
Tu . 0.25 0.75 . . . 20
Tujia . 0.20 0.80 . . . 20
Xibo . 0.06 0.94 . . . 18
Yakut . 0.34 0.66 . . . 50
Yizu . 0.20 0.80 . . . 20
Europe 0.06 0.62 0.31 . . . 325.5
Adyghei 0.03 0.56 0.41 . . . 34
Basque 0.08 0.69 0.23 . . . 47.9
French 0.05 0.66 0.29 . . . 57.9
Italian 0.08 0.51 0.41 . . . 27.8
Orcadian 0.09 0.66 0.25 . . . 32
Russian 0.04 0.64 0.32 . . . 50
Selection of the MYH9 Alleles
PLoS ONE | www.plosone.org 5 July 2010 | Volume 5 | Issue 7 | e11474
categories. The tree and two major continental haplotype
networks (Europe+Middle East and Africa) are shown side by
side in Figure 3.
The shapes of phylogenetic trees and networks suggest that the
protective E-2 haplotypes (Figure 3 and Table S4, green)
originated only once: they group on a single branch of the tree.
This branch is scarcely represented in Africa, but diversified
outside of Africa, especially in Europe and the Middle East. On
the other hand, the majority of neutral E-3 haplotypes are found in
Asia (Table S4), where they are often more common than E-2.
However, E-3 haplotypes never cluster together (Figure 3.A and
Table S4, blue): they occur on several terminal branches, always
distal from the basal E-1 haplotypes (Figure 3.A and Table S4,
red). This is a likely consequence of past recombination between
different E-1 sequences. If risk E-1 haplotypes have an adaptive
advantage in certain Sub-Saharan populations, recombination
could be a quick and efficient way to provide novel and neutral
genetic variation to replace previously selected sequences in
populations moving to new environments. Since E-1 carries or is
linked to one or more causal disease allele responsible for renal
disease, when its benefits are lost outside of Africa, neutral variants
generated by recombination would rise in frequency replacing the
costly haplotype, as may be the case in Asian populations. This
would be a likely explanation for the existence of two recombina-
tion hotspots within the gene described earlier [1].
The pattern of LD across MYH9 (Figure S1) reflects a general
decrease in diversity with African populations exhibiting the most
haplotype diversity, intermediate levels in Europe and Asia, and
the least in Oceania and the Americas. The gray areas in the LD
plots, most extensive in the African groups, represent SNP
comparisons where haplotypes could not be inferred robustly
due to high recombination rates. The evolutionary history of
MYH9 is complex. Several recent whole-genome scans indicate
that MYH9 has been the subject of natural selection during
different periods of human evolution, starting from the time of
human-primate divergence, and extending to the more recent
local adaptations in modern populations. MYH9 exhibits a paucity
of amino acid divergence between humans and Pan troglodytes, yet
human MYH9 has moderate to high levels of amino acid
polymorphism. Bustamante et al., [24] suggests that this may
indicate an excess of mildly deleterious variation possibly due to
balancing selection. Among Yoruba samples included in Hap-
map, haplotypes centered on rs4821481 can be observed in the
Happlotter browser [13] to exhibit extended haplotype homo-
zygosity compared to the protective allele (iHs = 2.67), indicating a
possible selection signature (Figure 4.B, red). The same can be
observed in the HGDP selection browser: in Yoruba, the pattern
of extended haplotype homozygosity is markedly different from
that in other African populations such as Mandenka and Biaka,
also from west Africa (Figure 4.C). The most frequent extended
haplotype in this population in CA2 (Figure 2A and C, Table S4)
indicating that this haplotype is under selection. Other related
haplotypes may also be involved (CA3, CA5, CA6 and CA8,
Figure 2.C, Table S4). If confirmed, such evolutionary scenario for
the MYH9 region will be reminiscent of that described for the
candidate genes in the thrifty gene hypothesis where the ‘thrifty’
genotype would have been historically advantageous for the local
Table 3. Geographic differentiation between continentalpopulations estimated by pairwise FST-s with loci representingrisk and protective MYH9 haplotypes{.
Continent 1 2 3 4 5 6 7
1. Africa + + + + + +
2. Middle East 0.27 + + + + +
3. Europe 0.37 0.01 + + + +
4. East Asia 0.38 0.19 0.23 + + +
5. South-CentralAsia
0.32 0.04 0.05 0.07 — +
6. America 0.39 0.06 0.07 0.08 0.01 +
7. Oceania 0.40 0.29 0.37 0.04 0.18 0.23
{Conventional pairwise FST values were computed directly from haplotypefrequencies in Arlequin [39]. The top triangle in the matrix shows significanceof the given comparison (p,0.05).
doi:10.1371/journal.pone.0011474.t003
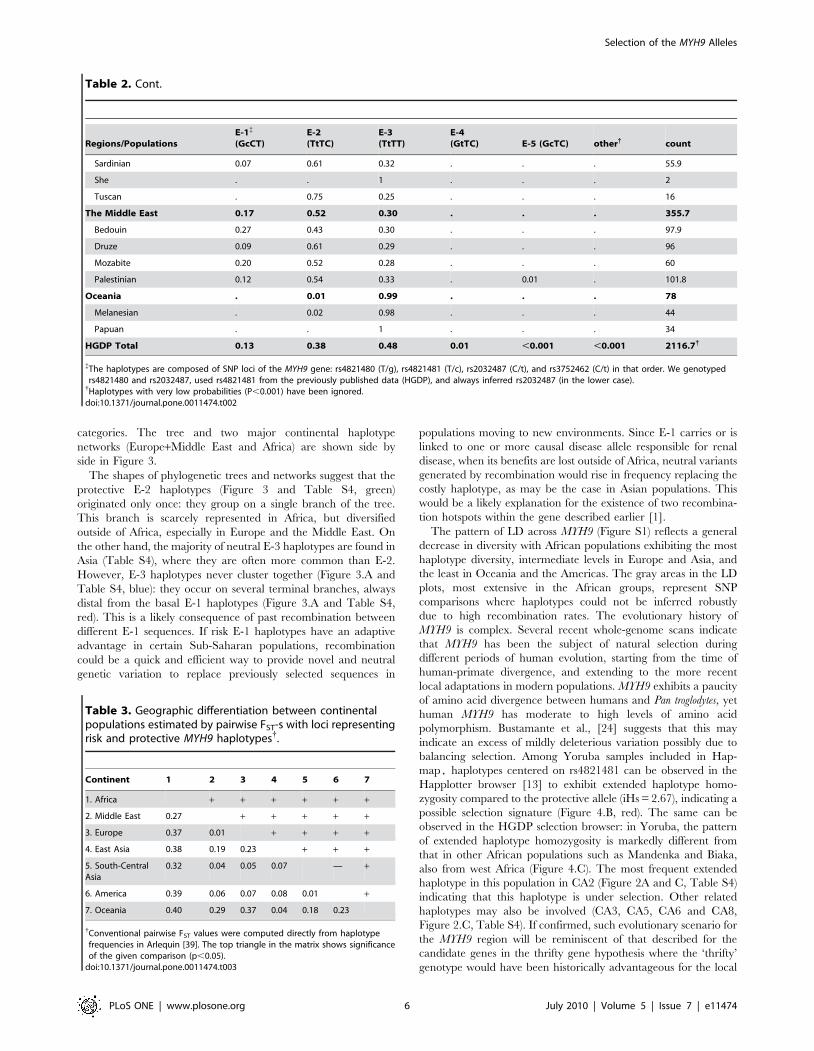
Regions/PopulationsE-1{
(GcCT)E-2(TtTC)
E-3(TtTT)
E-4(GtTC) E-5 (GcTC) other{ count
Sardinian 0.07 0.61 0.32 . . . 55.9
She . . 1 . . . 2
Tuscan . 0.75 0.25 . . . 16
The Middle East 0.17 0.52 0.30 . . . 355.7
Bedouin 0.27 0.43 0.30 . . . 97.9
Druze 0.09 0.61 0.29 . . . 96
Mozabite 0.20 0.52 0.28 . . . 60
Palestinian 0.12 0.54 0.33 . 0.01 . 101.8
Oceania . 0.01 0.99 . . . 78
Melanesian . 0.02 0.98 . . . 44
Papuan . . 1 . . . 34
HGDP Total 0.13 0.38 0.48 0.01 ,0.001 ,0.001 2116.7{
{The haplotypes are composed of SNP loci of the MYH9 gene: rs4821480 (T/g), rs4821481 (T/c), rs2032487 (C/t), and rs3752462 (C/t) in that order. We genotypedrs4821480 and rs2032487, used rs4821481 from the previously published data (HGDP), and always inferred rs2032487 (in the lower case).{Haplotypes with very low probabilities (P,0.001) have been ignored.doi:10.1371/journal.pone.0011474.t002
Table 2. Cont.
Selection of the MYH9 Alleles
PLoS ONE | www.plosone.org 6 July 2010 | Volume 5 | Issue 7 | e11474
population, because it offered protection from disease, or some
other environmental factor, while in the modern times, when the
protective effect is no longer needed, phenotypic effects persist as
health conditions [25,26].
The combination of high frequency extended haplotypes and
high FST values is a possible signal of recent positive selection for
the kidney risk haplotype in the Yoruba. This raises the possibility
that the MYH9 risk haplotype in Africa has hitchhiked along with
a different allele in MYH9 or in one of the neighboring genes, such
as APOL1, encoding apolipoprotein L-I, located only 14 kb away
on chromosome 22, at 34,979,070–34,993,484. Since APOL1 is
involved in the resistance to infection by Trypanosoma brucei, the
cause of African trypanosomiasis or sleeping sickness in sub-
Saharan Africa [27,28], there is a tantalizing possibility that a
MYH9 risk haplotype in Africa has risen in frequency hitchhiking
on the selective sweep of the nearby APOL1 gene. Specifically, we
suggest that there may be a heterozygote advantage to carrying a
single risk chromosome that confers protection against a pathogen
such as malaria or sleeping sickness, and a homozygous
disadvantage that predisposes to kidney disease in carriers of a
single risk allele. This possibility can be addressed by the future
studies involving extended haplotypes around the resistance locus
in APOL1 in the relevant populations in West Africa.
There is also a possibility that MYH9 has been selected by
Plasmodium falciparum, since MYH9 is a negative regulator of platelet
biogenesis [29], and platelets are involved in cerebral malaria and
pathogenesis. The Yoruba MYH9 haplotypes seem to be unique
among other African populations, since the extent of haplotype
homozygosity in this population is greater than in the neighboring
populations from Africa (Figure 4.C)[11]. In the European
population the derived allele (T) tagging the protective haplotypes
features extended LD with the neighboring haplotypes relative to
the alternative allele, but the difference is too small to suggest
recent selection of the E-2 haplotype (iHs = 21.48, Figure 4.B, in
green)[13]. This, however, does not rule out the presence of
selection signature in the recent past, since iHs is sensitive to the
occurrence of multiple equally long adaptive haplotypes, or a more
ancient one that may be detected by other methods [12].
Importantly, while E-1 haplotype is a good approximation, the
causative SNP for the renal disease has not been identified [1,2].
The extended LD in the MYH9 region and the extended
haplotype homozygosity noted in Yoruba confound the identity
of the true causal variation predisposing to increased risk of kidney
disease identified in African Americans who share ancestry with
west Africans represented here by the Yoruba [30].
The public health impact of MYH9 risk haplotypes in sub-
Saharan Africa may be considerable, given the substantial burden
of HIV-1 disease throughout Africa and the high frequency of
MYH9 risk alleles in African populations. Surveys of HIV-
associated kidney disease and chronic kidney disease across sub-
Saharan are sporadic and inconsistent in diagnostic criteria.
However recent estimates of chronic kidney disease among
individuals with HIV-1 disease range from an estimated
prevalence of 6% in South Africa blacks, 38% in Nigeria, and
48% in Uganda [31]. Notably, HIVAN is not reported in East
African Ethiopian Jews with African ancestry [32]. Chronic kidney
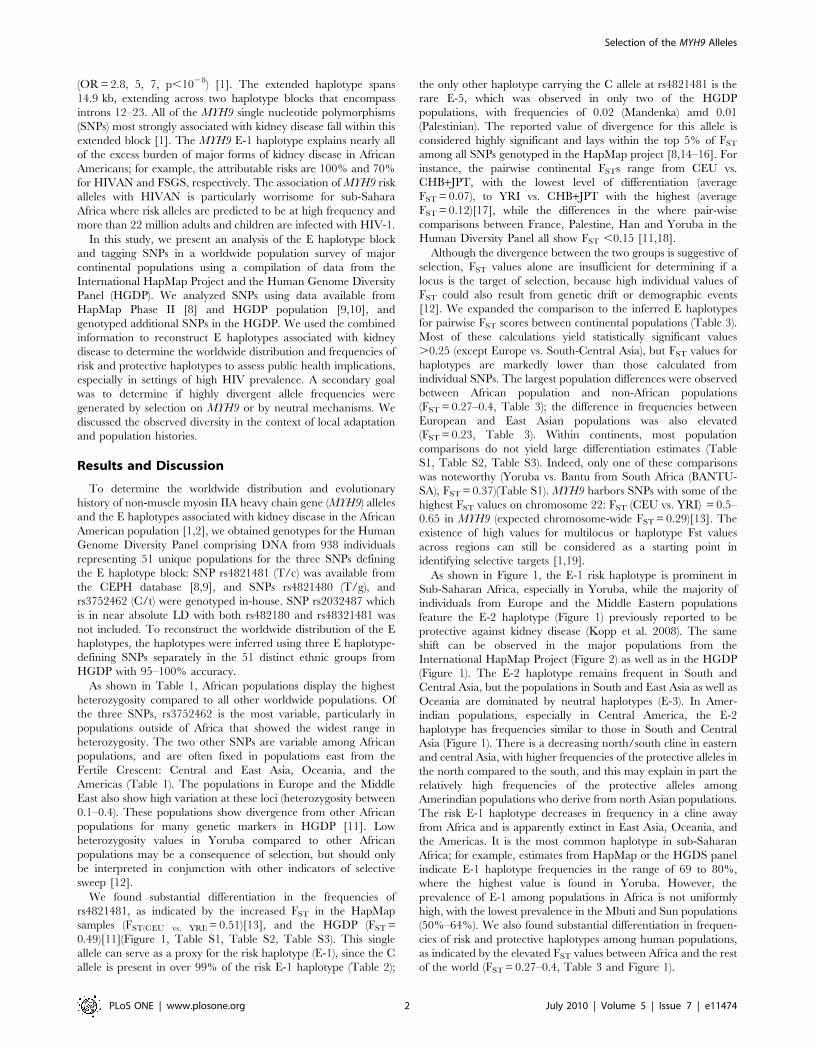
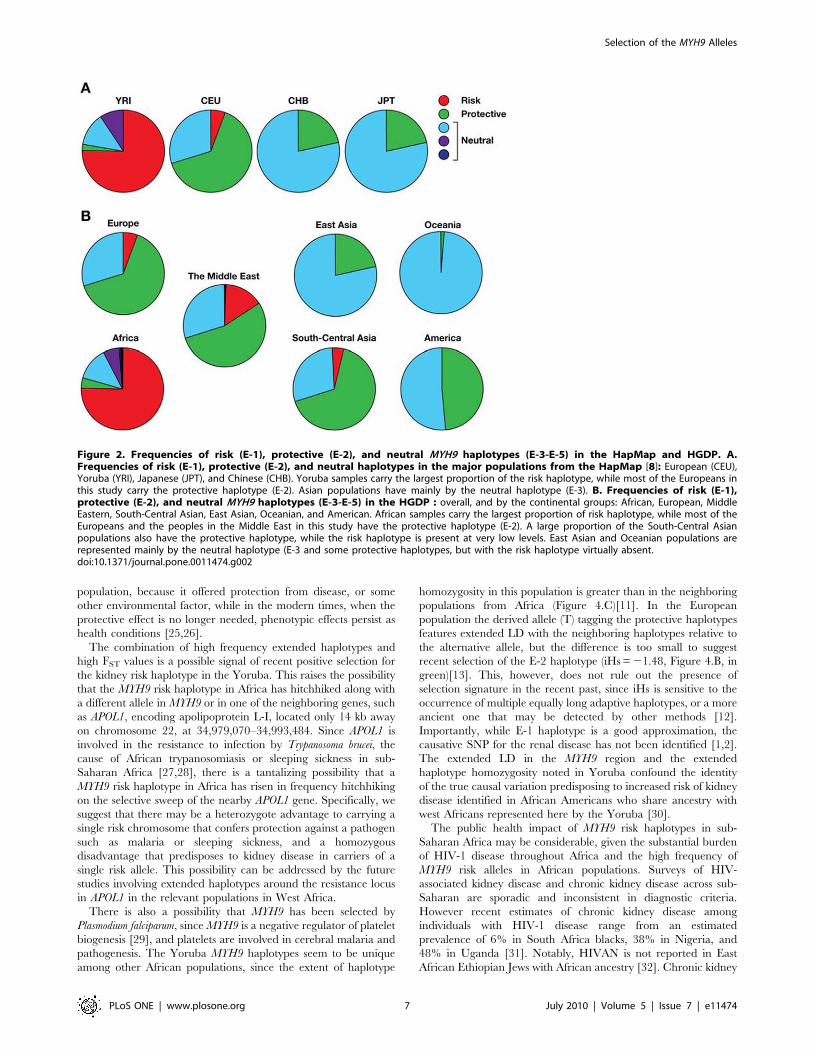
Figure 2. Frequencies of risk (E-1), protective (E-2), and neutral MYH9 haplotypes (E-3-E-5) in the HapMap and HGDP. A.Frequencies of risk (E-1), protective (E-2), and neutral haplotypes in the major populations from the HapMap [8]: European (CEU),Yoruba (YRI), Japanese (JPT), and Chinese (CHB). Yoruba samples carry the largest proportion of the risk haplotype, while most of the Europeans inthis study carry the protective haplotype (E-2). Asian populations have mainly by the neutral haplotype (E-3). B. Frequencies of risk (E-1),protective (E-2), and neutral MYH9 haplotypes (E-3-E-5) in the HGDP : overall, and by the continental groups: African, European, MiddleEastern, South-Central Asian, East Asian, Oceanian, and American. African samples carry the largest proportion of risk haplotype, while most of theEuropeans and the peoples in the Middle East in this study have the protective haplotype (E-2). A large proportion of the South-Central Asianpopulations also have the protective haplotype, while the risk haplotype is present at very low levels. East Asian and Oceanian populations arerepresented mainly by the neutral haplotype (E-3 and some protective haplotypes, but with the risk haplotype virtually absent.doi:10.1371/journal.pone.0011474.g002
Selection of the MYH9 Alleles
PLoS ONE | www.plosone.org 7 July 2010 | Volume 5 | Issue 7 | e11474
disease in the general population is not well studies however,
estimates from the Democratic Republic of Congo report CKD
report rates of 12.4% for all stages of chronic kidney disease
diagnosed by decreased estimated glomerular filtration rates
(,60 ml/min/1.73 m) or proteinuria ($300 mg/day) with a high
prevalence of proteinuria not due to hypertension or diabetes
consistent with glomerulopathies such as FSGS or HIVAN [33].
South Africa also reports high rates of chronic kidney disease;
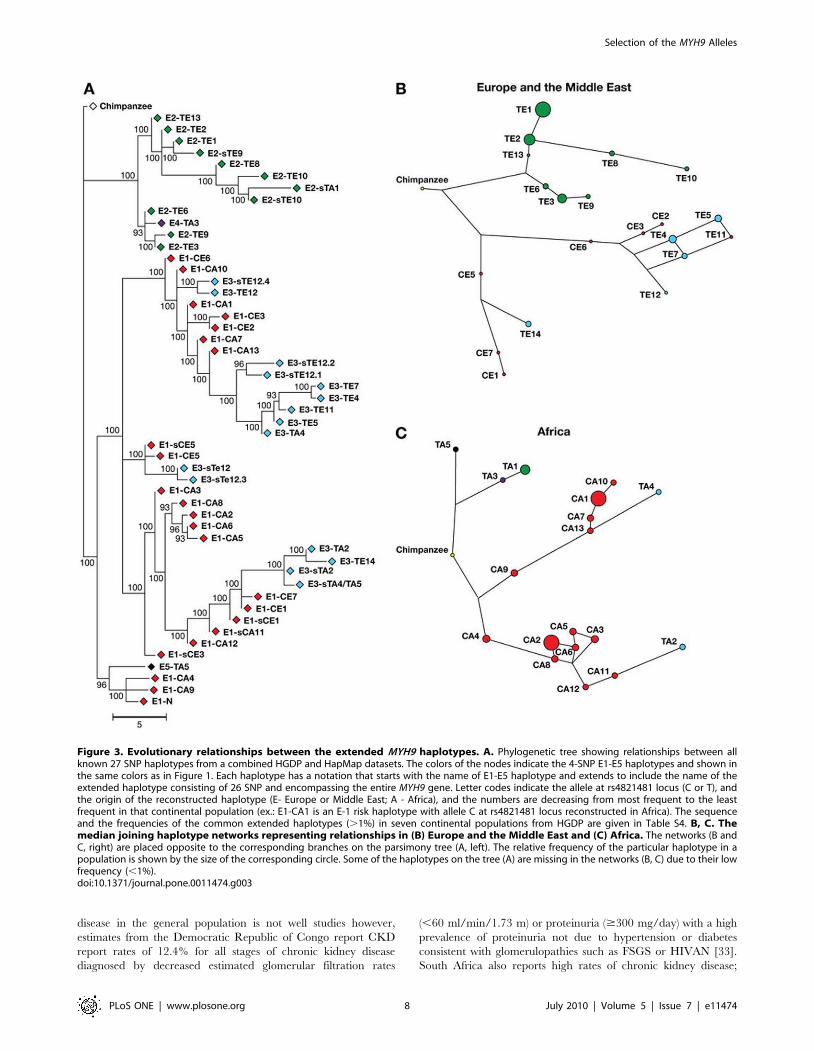
Figure 3. Evolutionary relationships between the extended MYH9 haplotypes. A. Phylogenetic tree showing relationships between allknown 27 SNP haplotypes from a combined HGDP and HapMap datasets. The colors of the nodes indicate the 4-SNP E1-E5 haplotypes and shown inthe same colors as in Figure 1. Each haplotype has a notation that starts with the name of E1-E5 haplotype and extends to include the name of theextended haplotype consisting of 26 SNP and encompassing the entire MYH9 gene. Letter codes indicate the allele at rs4821481 locus (C or T), andthe origin of the reconstructed haplotype (E- Europe or Middle East; A - Africa), and the numbers are decreasing from most frequent to the leastfrequent in that continental population (ex.: E1-CA1 is an E-1 risk haplotype with allele C at rs4821481 locus reconstructed in Africa). The sequenceand the frequencies of the common extended haplotypes (.1%) in seven continental populations from HGDP are given in Table S4. B, C. Themedian joining haplotype networks representing relationships in (B) Europe and the Middle East and (C) Africa. The networks (B andC, right) are placed opposite to the corresponding branches on the parsimony tree (A, left). The relative frequency of the particular haplotype in apopulation is shown by the size of the corresponding circle. Some of the haplotypes on the tree (A) are missing in the networks (B, C) due to their lowfrequency (,1%).doi:10.1371/journal.pone.0011474.g003
Selection of the MYH9 Alleles
PLoS ONE | www.plosone.org 8 July 2010 | Volume 5 | Issue 7 | e11474
Selection of the MYH9 Alleles
PLoS ONE | www.plosone.org 9 July 2010 | Volume 5 | Issue 7 | e11474
hypertension effects 25% of the adult black population and is the
cause of kidney failure in 21% of patients on dialysis [31].
HIVAN is the third leading cause of ESKD in African
American men between the ages of 20–64 years [34] and end
stage renal disease is 4 times more frequent in the African
American population. In African Americans ESKD attributed to
hypertension is strongly associated with MYH9 region risk alleles
[1–3]. The present study provides insights into the global
distribution of MYH9 risk alleles and haplotypes and may be
useful in forming public health policies to mitigate and reduce the
added burden of kidney disease in vulnerable populations.
In conclusion, our results suggest that the MYH9 risk alleles and
haplotypes are notably differentiated among human populations
that can be attributed to the interplay of geographic, demographic
and evolutionary factors, leading to striking differences between
African and non-African populations in genetic risk for chronic
kidney disease. More research is needed to understand which
factors account for these population differences. Understanding
haplotype structure, evolutionary history and the role of natural
selection in the MYH9 region are crucial next steps that may
reveal the true causal renal susceptibility loci.
Materials and Methods
Ethics StatementInstitutional review boards at National Cancer Institute and
National Institute of Diabetes and Digestive and Kidney Diseases,
National Institutes of Health, approved the study protocols.
Data and Samples StudiedWe obtained genotypes from the two primary sources of
genome-wide SNPs: the CEPH Human Genome Diversity Panel
(HGDP) and the International HapMap Project (Phase II). These
two datasets provide the best geographic sampling currently
available [8,9]. The CEPH-HGDP genotype data consists of
640,000 SNPs for 938 individuals representing 51 global
populations reported by Li et al [9]. Phase II of the International
HapMap Project genotyped 210 individuals for over 3 million
SNPs from four populations: Yoruba from Ibadan, Nigeria (YRI);
Chinese Han from Beijing, China (CHB); Japanese from Tokyo,
Japan (JPT); and Utah residents with ancestry from northern and
western Europe (CEU) [8]. A single SNP, rs4821481 in the E
haplotype block was previously genotyped on the HGDP panel
and available for download [9].
Genotyping and Haplotype ReconstructionTaqMan assays (Applied Biosystems, Foster City CA) were used
to genotype HGDP DNA samples from the Foundation Jean
Dausset-CEPH, Paris, France [9]. Genotypes were obtained for
963 individuals from 51 distinct ethnic groups for rs3752462 and
rs4821480 (previously reported tagging SNPs). E block haplotypes
were inferred from three of the four defining SNPs, omitting
rs2032487; this allowed inferring haplotypes E-1, E-2, E-4, and E-
5 with nearly 100% accuracy and haplotype E-3 with 95%
accuracy. To provide additional information for haplotype
reconstruction and increase the accuracy of inference, SNPs
rs2157257, rs5750250, and rs3830104 were also genotyped.
Since there were missing genotypes for rs4821481 (54%), we
used neighboring SNPs (rs2157257, rs5750250, and rs3830104)
known to be in strong LD with the missing marker to impute the
haplotypes for these samples. Haplotypes were reconstructed using
combined data within each population separately by implementa-
tion of the expectation-maximization (EM) algorithm available in
SAS/Genetics package (SAS 9.1.3, Cary NC). In populations with
many missing genotypes, uncertainty of the estimates increased, so
more than one haplotype was assigned to the same chromosome.
To compensate for this ambiguity, all possible haplotype pairs in
each individual were weighted by their posterior probabilities [35],
then partial probabilities for each haplotype were accounted for;
the inferred haplotype frequencies in each population reflect
uncertainties of the estimates.
Data AnalysisAllele and genotype frequencies, and observed heterozygosities
for alleles and haplotypes were estimated using SAS Genetics (SAS
9.1.3, Cary NC). FST was used to assess population divergence:
high FST indicates that most of the variance in allele frequencies
comes from the difference between populations used in the
comparison [36–37]. Under neutral conditions, FST is determined
by genetic drift affecting all loci across the genome in a similar
way, but selection can cause differences between populations in
the locus and the surrounding genomic region [1,18,19,38]. For
inferred haplotypes, we calculated pairwise conventional FST and
carried out 10,000 permutations for significance using Arlequin
3.1 [39]. Pairwise FST values were calculated between continental
groups, and between the individual populations based on the
continental groupings identified by Rosenberg et al. [10]. We also
used FST values from HGDP selection browser [11] and
Happlotter [13], since these studies used essentially the same
datasets (HGDP and HapMap, respectively).
Since a subset of HGDP samples have been genotyped for 26
SNPs covering the entire span of MYH9 [9,40,41] on the same
samples we were analyzing, we were able to match these extended
haplotypes to the five E haplotype risk categories of MYH9 for
renal disease (E-1 to E-5). The phylogenetic history of the
extended haplotypes was examined using a haplotype network
determined by the Network 4.5 program [20]. Network
approaches have several advantages over traditional phylogenetic
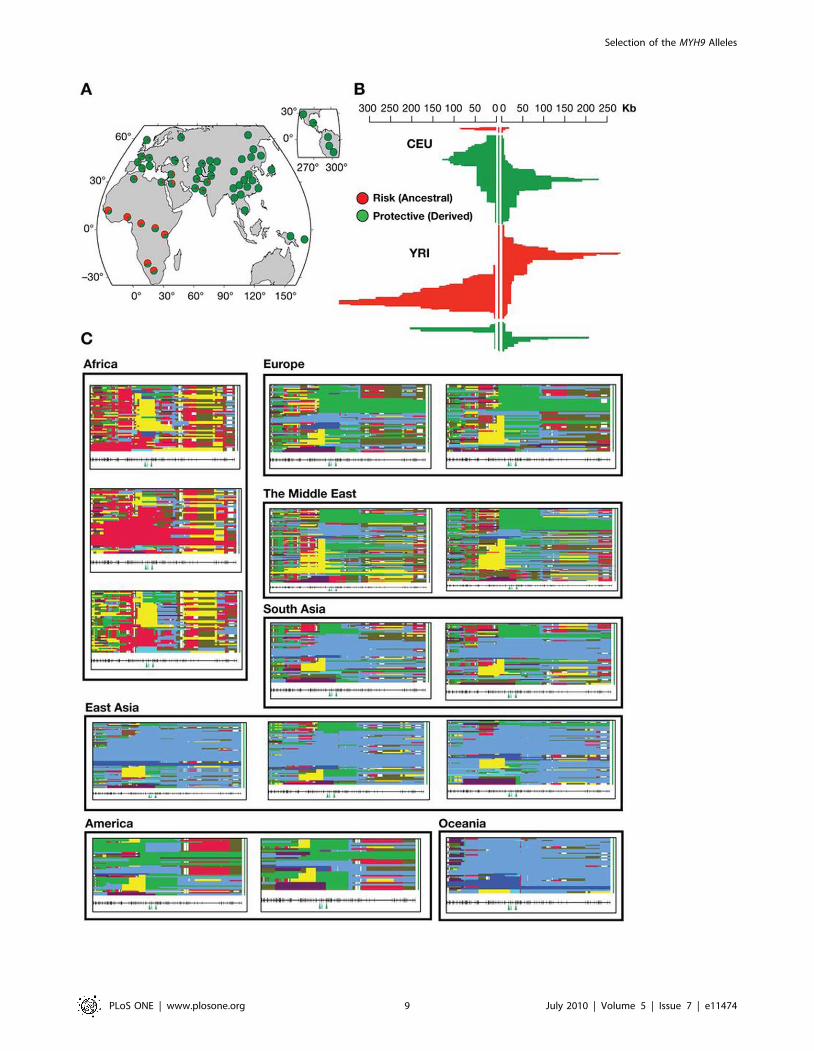
Figure 4. Summary of selection signatures for MYH9. A. Global allele frequencies of rs4821481, an E-1 determining SNP. Thefrequency of this SNP is very high in Africa resulting in an extreme FST value. This allele alone can represent risk haplotypes, since the C allele ispresent in over 99% of the risk (E-1) haplotype (Table 2). B. Signature of selection in the extended haplotypes around the rs4821481 locusobserved in HapMap populations (Voight et al. 2006). The risk haplotypes are represented in red and the protective haplotypes are in green.In Yoruba, positive iHs score (iHs = 2.67) indicates that haplotypes based on the ancestral allele are longer compared to derived allele background; iHs$2 are considered a signature of positive selection (Voight et al. 2006). The negative values of iHs (iHS = 21.48) indicates that European haplotypesare more likely to carry the derived allele (T) for rs4821481, but the data does not provide sufficient evidence for selection on this allele. C.Representation of extended haplotype pattern for 300 kb neighborhood around rs4821481 in the HGDP selection browser [11].Each box represents a single population, and observed haplotypes are shown as horizontal bars. Identical haplotypes have the same color in all of thegraphs, and all haplotypes start from one of the rs4821481 alleles. To summarize the data, most continents are represented by two populations:Europe (Russian and Basque), The Middle East (Bedouin and Palestinian), South Asia (Hazara and Singhi), America (Maya and Pima). Africa (Mandenka,Yoruba, and Biaka), and East Easia (Han, Yakut and Japanese) are represented by three populations each, and Oceania is represented by a singlepopulation (Papuan). An unusual pattern in Africa is confined to the Yoruba population (see Figure 4.B). In the West (Europe, Middle East) versus theEast Eurasia (East and South Central Asia), different haplotypes predominate concordantly with our earlier conclusions (see the worldwide map of riskhaplotypes in Figure 1).doi:10.1371/journal.pone.0011474.g004
Selection of the MYH9 Alleles
PLoS ONE | www.plosone.org 10 July 2010 | Volume 5 | Issue 7 | e11474
methods such as trees, since they account for the persistence of
ancestral haplotypes, the existence of multiple descendant
haplotypes, recombination and low levels of sequence variation
[21]. The networks were constructed by first connecting
haplotypes that differed by single nucleotide changes and next
adding increasingly more distant haplotypes. The process was
carried on until either all available haplotypes were included, or
the maximum number of mutational steps was reached.
Since we used 26 SNPs to infer risk and protective haplotypes,
each of the reported risk (E-1), protective (E-2) and neutral
haplotypes (E-3–5) include a number of haplotypes defined by
additional SNPs (two SNPS genotyped by us originally and
defining E-1-E-5, rs4821481 and rs3830104 [1], plus 24 additional
SNPs). To provide an overall reference of similarity between
extended haplotypes matched to the risk categories, a parsimony
tree was constructed using MEGA 4.0.2 [22,23]. The phylogeny
was inferred using the Maximum Parsimony method [42]. The
consensus tree inferred from 30 most parsimonious trees was
displayed, and the percentage of parsimonious trees in which the
associated taxa clustered together are shown next to the branches
(Figure 2).
To assess the possibility of a selection signature surround the E
haplotypes, we utilized the Integrated Haplotype Score (iHs)
values from the Haplotter [13] and HGDP selection browser [11].
This measure has been developed to detect evidence of recent
positive selection at a locus and considers differential levels of
linkage disequilibrium (LD) surrounding a putatively selected allele
by comparing it to LD around the alternative allele at the same
position [13]. The iHS statistic is related to the Extended
Haplotype Homozygosity test [43], but is considered to have
more power to detect selection with sweeps that reach inter-
mediate frequencies, rather than complete sweeps leading to
fixation [44]. A positive iHs score (iHs $ 2) indicates that
haplotypes based on the ancestral allele are longer compared to
those extending from the derived allele, while negative values of
the iHs statistics (iHs #22) indicate that the derived allele is under
selection [13].
Supporting Information
Table S1 Pairwise Fst between African populations from HGDP
and HapMap.
Found at: doi:10.1371/journal.pone.0011474.s001 (0.04 MB
DOC)
Table S2 Pairwise Fst between European populations from
HGDP.
Found at: doi:10.1371/journal.pone.0011474.s002 (0.04 MB
DOC)
Table S3 Pairwise Fst between the Middle Eastern populations
from HGDP.
Found at: doi:10.1371/journal.pone.0011474.s003 (0.03 MB
DOC)
Table S4 Representation of extended haplotypes of MYH9 (26
SNP) in seven continental populations from HGDP. The
frequency is given as a percentage of the total individuals in a
population and colored so the darker is the cell, the more common
is the haplotype. Rare haplotypes (,1%) are not shown. The data
was obtained from Pemberton et al. [40].
Found at: doi:10.1371/journal.pone.0011474.s004 (0.14 MB
DOC)
Figure S1 Linkage disequilibrium heat plots for 51 Human
Diversity Panel ethnic groups, showing D’ for 44 MYH9 SNPs
extending from rs2012928 to rs738278, encompassing MYH9 and
about 10 Kb on either side. LD was calculated from haplotype
frequencies; haplotypes were estimated using the EM method.
Haplotype inference was carried out to a length of 14 SNPs, hence
the bottom of the charts is gray (no inference). Gray squares closer
to the top of the chart indicate regions where haplotypes could not
be reliably inferred due to extreme LD. Notably, LD is much
greater in the African groups than other continental groups;
diversity is minimum for the Americas and Oceania.
Found at: doi:10.1371/journal.pone.0011474.s005 (3.31 MB
PDF)
Acknowledgments
We thank Drs. Juan Carlos Martinez-Cruzado, Bert Gold, Michael W.
Smith, Sarah Tishkoff, Howard Cann. and Alfred L. Roca for insightful
discussions. We also thank Allen Kane of Scientific Publications, Graphics
and Media, SAIC-Frederick, Inc., for help with editing and figures. The
content of this publication does not necessarily reflect the views or policies
of the Department of Health and Human Services, nor does mention of
trade names, commercial products or organizations imply endorsement by
the US Government.
Author Contributions
Conceived and designed the experiments: TKO GWN JK CAW.
Performed the experiments: PA. Analyzed the data: TKO GWN PA
CAW. Contributed reagents/materials/analysis tools: GWN JK CAW.
Wrote the paper: TKO JK CAW.
References
1. Kopp JB, Smith MW, Nelson GW, Johnson RC, Freedman BI, et al. (2008)
MYH9 is a major-effect risk gene for focal segmental glomerulosclerosis. Nat
Genet 40: 1175–1184.
2. Kao WH, Klag MJ, Meoni LA, Reich D, Berthier-Schaad Y, et al. (2008)
MYH9 is associated with nondiabetic end-stage renal disease in African
Americans. Nat Genet 40: 1185–1192.
3. Freedman BI, Hicks PJ, Bostrom MA, Comeau ME, Divers J, et al. (2009) Non-
muscle myosin heavy chain 9 gene MYH9 associations in African Americans
with clinically diagnosed type 2 diabetes mellitus-associated ESRD. Nephrol
Dial Transplant.
4. Freedman BI, Tuttle AB, Spray BJ (1995) Familial predisposition to
nephropathy in African-Americans with non-insulin-dependent diabetes melli-
tus. Am J Kidney Dis 25: 710–713.
5. Coresh J, Selvin E, Stevens LA, Manzi J, Kusek JW, et al. (2007) Prevalence of
chronic kidney disease in the United States. JAMA 298: 2038–2047.
6. Kopp JB, Winkler C (2003) HIV-associated nephropathy in African Americans.
Kidney Int Suppl: S43–49.
7. Nelson GW, Freedman BI, Bowden DW, Langefeld CD, An P, et al. (2010)
Dense mapping of MYH9 localizes the strongest kidney disease associations to
the region of introns 13 to 15. Hum Mol Genet 19: 1805–1815.
8. Frazer KA, Ballinger DG, Cox DR, Hinds DA, Stuve LL, et al. (2007) A second
generation human haplotype map of over 3.1 million SNPs. Nature 449:
851–861.
9. Jakobsson M, Scholz SW, Scheet P, Gibbs JR, VanLiere JM, et al. (2008)
Genotype, haplotype and copy-number variation in worldwide human
populations. Nature 451: 998–1003.
10. Rosenberg NA, Pritchard JK, Weber JL, Cann HM, Kidd KK, et al. (2002)
Genetic structure of human populations. Science 298: 2381–2385.
11. Pickrell JK, Coop G, Novembre J, Kudaravalli S, Li JZ, et al. (2009) Signals of
recent positive selection in a worldwide sample of human populations. Genome
Res 19: 826–837.
12. Oleksyk TK, Smith MH, O’Brien SJ (2010) Genome wide scans for footprints of
natural selection. Phil Trans R Soc B 365: 185–205.
13. Voight BF, Kudaravalli S, Wen X, Pritchard JK (2006) A map of recent positive
selection in the human genome. PLoS Biol 4: e72.
14. Yu F, Keinan A, Chen H, Ferland RJ, Hill RS, et al. (2009) Detecting natural
selection by empirical comparison to random regions of the genome. Hum Mol
Genet 18: 4853–4867.
15. Amato R, Pinelli M, Monticelli A, Marino D, Miele G, et al. (2009) Genome-
Wide Scan for Signatures of Human Population Differentiation and Their
Selection of the MYH9 Alleles
PLoS ONE | www.plosone.org 11 July 2010 | Volume 5 | Issue 7 | e11474
Relationship with Natural Selection, Functional Pathways and Diseases. PLoS
One 4: e7927.
16. Lohmueller KE, Mauney MM, Reich D, Braverman JM (2006) Variants
Associated with Common Disease Are Not Unusually Differentiated in
Frequency across Populations. The American Journal of Human Genetics 78:
130–136.
17. The International HapMap C (2005) A haplotype map of the human genome.
Nature 437: 1299–1320.
18. Pritchard JK, Pickrell JK, Coop G (2010) The Genetics of Human Adaptation:
Hard Sweeps, Soft Sweeps, and Polygenic Adaptation. Current Biology 20:
R208–R215.
19. Akey JM, Zhang G, Zhang K, Jin L, Shriver MD (2002) Interrogating a high-
density SNP map for signatures of natural selection. Genome Res 12:
1805–1814.
20. Bandelt HJ, Forster P, Sykes BC, Richards MB (1995) Mitochondrial portraits of
human populations using median networks. Genetics 141: 743–753.
21. Posada D, Crandall KA (2001) Intraspecific gene genealogies: trees grafting into
networks. Trends Ecol Evol 16: 37–45.
22. Kumar S, Nei M, Dudley J, Tamura K (2008) MEGA: a biologist-centric
software for evolutionary analysis of DNA and protein sequences. Brief
Bioinform 9: 299–306.
23. Tamura K, Dudley J, Nei M, Kumar S (2007) MEGA4: Molecular Evolutionary
Genetics Analysis (MEGA) software version 4.0. Mol Biol Evol 24: 1596–1599.
24. Bustamante CD, Fledel-Alon A, Williamson S, Nielsen R, Hubisz MT, et al.
(2005) Natural selection on protein-coding genes in the human genome. Nature
437: 1153–1157.
25. Neel JV (1962) Diabetes mellitus: a ‘‘thrifty’’ genotype rendered detrimental by
‘‘progress’’? Am J Hum Genet 14: 353–362.
26. Neel JV, Weder AB, Julius S (1998) Type II diabetes, essential hypertension, and
obesity as ‘‘syndromes of impaired genetic homeostasis’’: the ‘‘thrifty genotype’’
hypothesis enters the 21st century. Perspect Biol Med 42: 44–74.
27. Vanhamme L, Paturiaux-Hanocq F, Poelvoorde P, Nolan DP, Lins L, et al.
(2003) Apolipoprotein L-I is the trypanosome lytic factor of human serum.
Nature 422: 83–87.
28. Pays E, Vanhollebeke B (2009) Human innate immunity against African
trypanosomes. Curr Opin Immunol.
29. Chen Z, Naveiras O, Balduini A, Mammoto A, Conti MA, et al. (2007) The
May-Hegglin anomaly gene MYH9 is a negative regulator of platelet biogenesis
modulated by the Rho-ROCK pathway. Blood 110: 171–179.
30. Zakharia F, Basu A, Absher D, Assimes TL, Go AS, et al. (2009) Characterizing
the admixed African ancestry of African Americans. Genome Biol 10: R141.31. Fabian J, Naicker S (2009) HIV and kidney disease in sub-Saharan Africa. Nat
Rev Nephrol 5: 591–598.
32. Behar DM, Shlush LI, Maor C, Lorber M, Skorecki K (2006) Absence of HIV-associated nephropathy in Ethiopians. Am J Kidney Dis 47: 88–94.
33. Sumaili EK, Cohen EP, Zinga CV, Krzesinski JM, Pakasa NM, et al. (2009)High prevalence of undiagnosed chronic kidney disease among at-risk
population in Kinshasa, the Democratic Republic of Congo. BMC Nephrol
10: 18.34. USRDS (1999) US Renal Data System 1999 Annual Data Report. Bethesda,
MD: National Institutes of Health, National Institute of Diabetes and Digestiveand Kidney Diseases.
35. Shrestha S, Strathdee SA, Galai N, Oleksyk T, Fallin MD, et al. (2006)Behavioral risk exposure and host genetics of susceptibility to HIV-1 infection.
J Infect Dis 193: 16–26.
36. Lewontin RC, Krakauer J (1973) Distribution of gene frequency as a test of thetheory of the selective neutrality of polymorphisms. Genetics 74: 175–195.
37. Weir BS, Cockerham CC (1984) Estimating F-statistics for the analysis ofpopulation structure. Evolution 38: 358–1370.
38. Weir BS, Cardon LR, Anderson AD, Nielsen DM, Hill WG (2005) Measures of
human population structure show heterogeneity among genomic regions.Genome Res 15: 1468–1476.
39. Excoffier L, Laval G, Schneider S (2005) Arlequin (version 3.0): An integratedsoftware package for population genetics data analysis. Evol Bioinform Online 1:
47–50.40. Pemberton TJ, Jakobsson M, Conrad DF, Coop G, Wall JD, et al. (2008) Using
population mixtures to optimize the utility of genomic databases: linkage
disequilibrium and association study design in India. Ann Hum Genet 72:535–546.
41. Conrad DF, Jakobsson M, Coop G, Wen X, Wall JD, et al. (2006) A worldwidesurvey of haplotype variation and linkage disequilibrium in the human genome.
Nat Genet 38: 1251–1260.
42. Eck RV, Dayhoff MO (1966) Atlas of Protein Sequence and Structure.Maryland, Silver Springs, National Biomedical Research Foundation.
43. Sabeti PC, Reich DE, Higgins JM, Levine HZ, Richter DJ, et al. (2002)Detecting recent positive selection in the human genome from haplotype
structure. Nature 419: 832–837.44. Sabeti PC, Schaffner SF, Fry B, Lohmueller J, Varilly P, et al. (2006) Positive
natural selection in the human lineage. Science 312: 1614–1620.
Selection of the MYH9 Alleles
PLoS ONE | www.plosone.org 12 July 2010 | Volume 5 | Issue 7 | e11474
Related Documents