World Tuberculosis Day 2015 The TB situation in 2013: Findings from the joint TB surveillance and monitoring report by ECDC and the WHO Regional Office for Europe ECDC TB Team European Centre for Disease Prevention and Control Stockholm, 24 March 2015

World Tuberculosis Day 2015: latest EU/EEA surveillance data
Jul 19, 2015
Welcome message from author
This document is posted to help you gain knowledge. Please leave a comment to let me know what you think about it! Share it to your friends and learn new things together.
Transcript

World Tuberculosis Day 2015
The TB situation in 2013: Findings from the joint TB surveillance and monitoring report by ECDC and the WHO Regional Office for Europe
ECDC TB TeamEuropean Centre for Disease Prevention and Control
Stockholm, 24 March 2015
TB notifications by country
In 2013, 64 844 TB cases were reported in the EU/EEA.The notification rate was 12.7 per 100 000 population (range 3.4–83.5).
2
Figure 1: TB notification rate per 100 000 population by country, EU/EEA, 2013
Not included or not reporting
20 to 49 per 100 000
10 to 19 per 100 000
5 to 9 per 100 000
< 5 per 100 000
≥ 50 per 100 000
TB notification rate over time
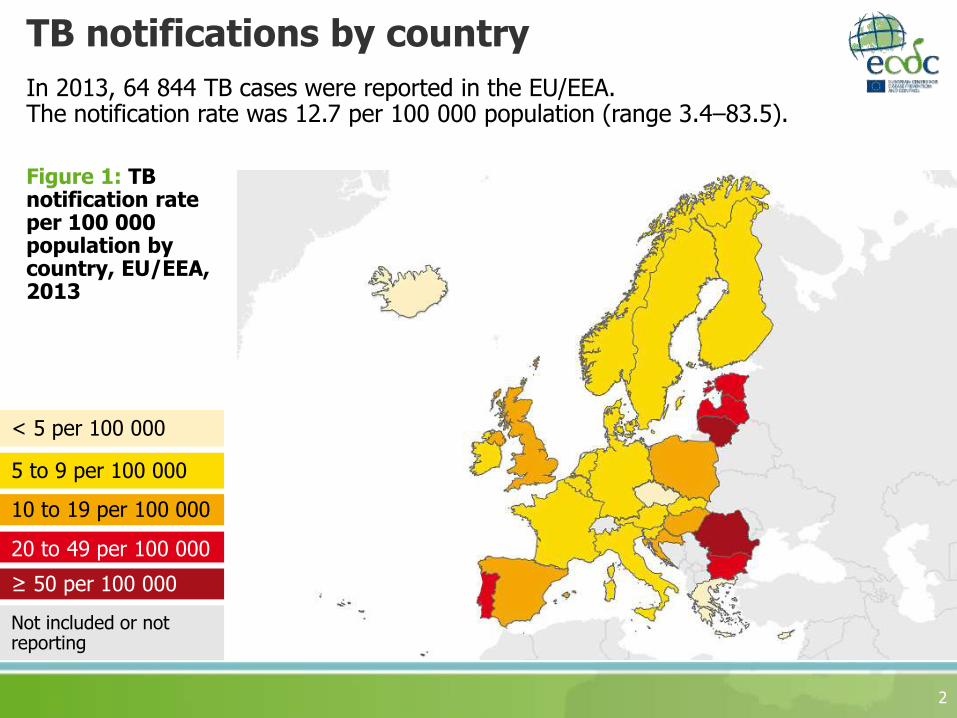
The TB notification rate has decreased from 19.3 per 100 000 population in 2004 to 12.7 in 2013.
3
Figure 2: TB notification rate per 100 000 population in EU/EEA 2004−2013
0
5
10
15
20
25
2004 2005 2006 2007 2008 2009 2010 2011 2012 2013
case
s/100 0
00
Year of reporting
EU definition: confirmed TB cases*
4
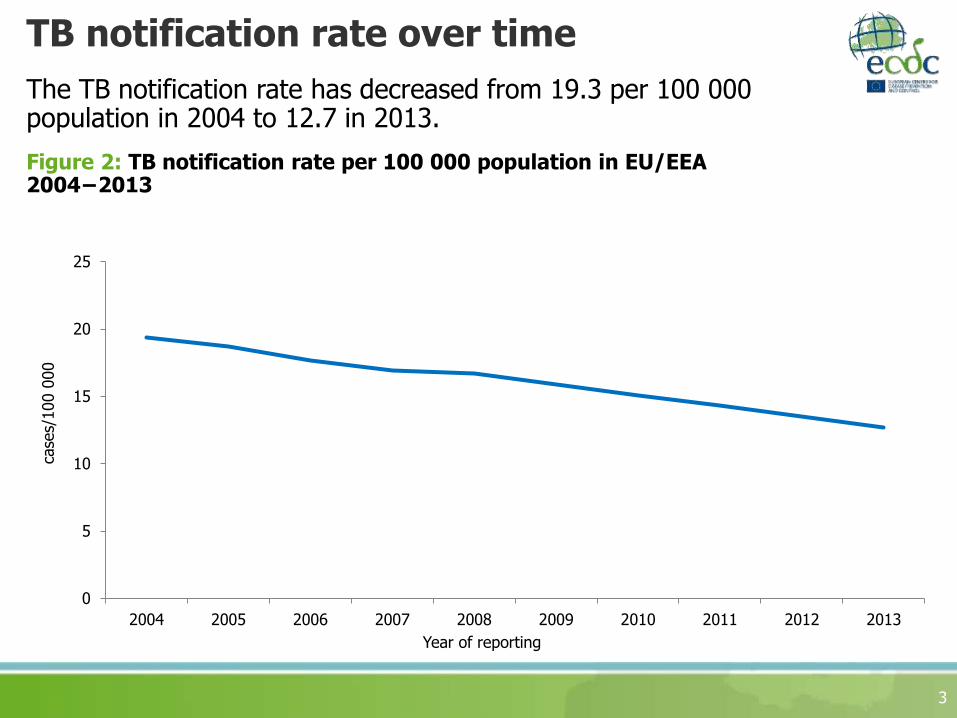
Figure 3: Percentage of laboratory-confirmed TB cases by country, EU/EEA, 2013
70 to 79%
≥ 80%
60 to 69%
< 60%
Not included or not reporting
* Confirmed by culture or by both a positive sputum microscopy result and Mycobacterium tuberculosis nucleic acid identified in nucleic acid amplification test.
In 2013, 62.1% (range 21.4–94.3%) of TB cases reported in the EU/EEA were laboratory confirmed.
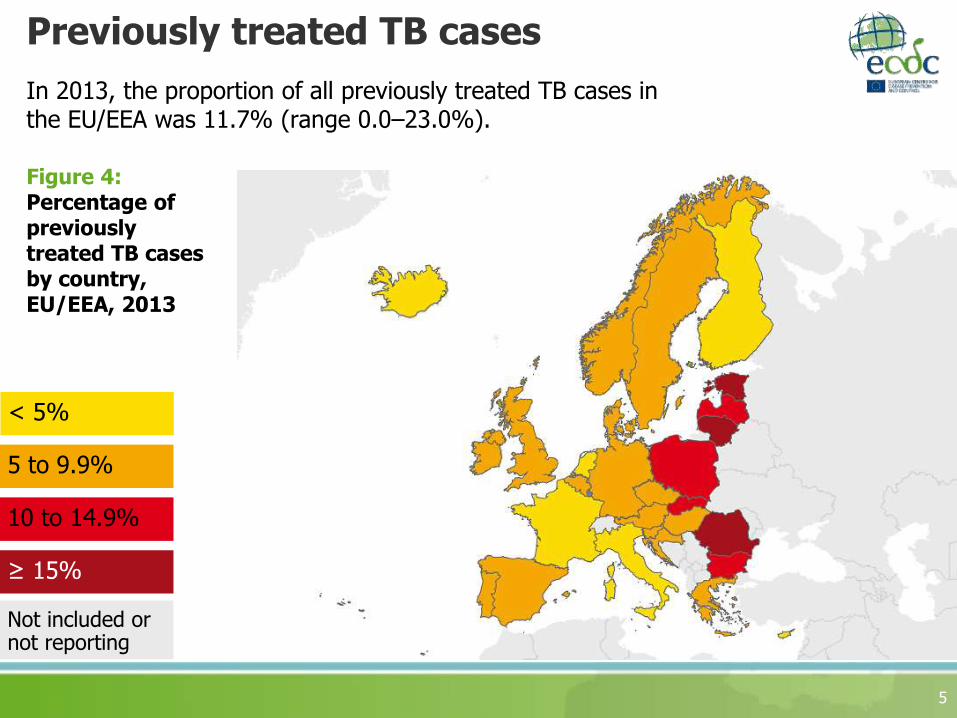
Previously treated TB cases
5
In 2013, the proportion of all previously treated TB cases in the EU/EEA was 11.7% (range 0.0–23.0%).
Figure 4: Percentage of previously treated TB cases by country, EU/EEA, 2013
Not included or not reporting
10 to 14.9%
≥ 15%
5 to 9.9%
< 5%
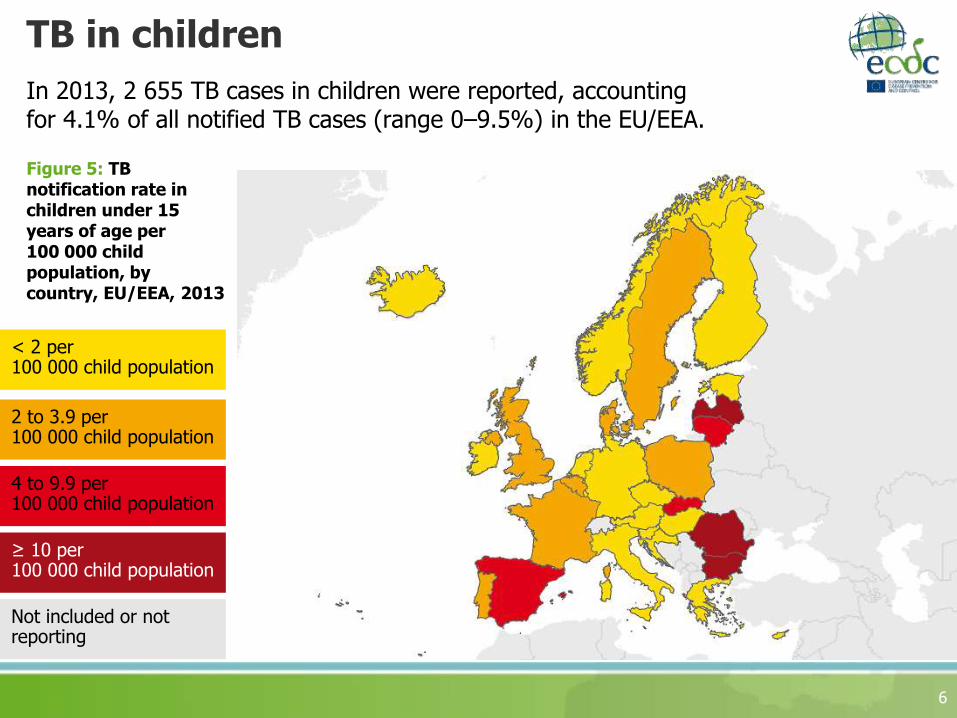
TB in children
6
Figure 5: TB notification rate in children under 15 years of age per 100 000 child population, by country, EU/EEA, 2013
Not included or not reporting
4 to 9.9 per 100 000 child population
2 to 3.9 per 100 000 child population
≥ 10 per 100 000 child population
< 2 per 100 000 child population
In 2013, 2 655 TB cases in children were reported, accounting for 4.1% of all notified TB cases (range 0–9.5%) in the EU/EEA.
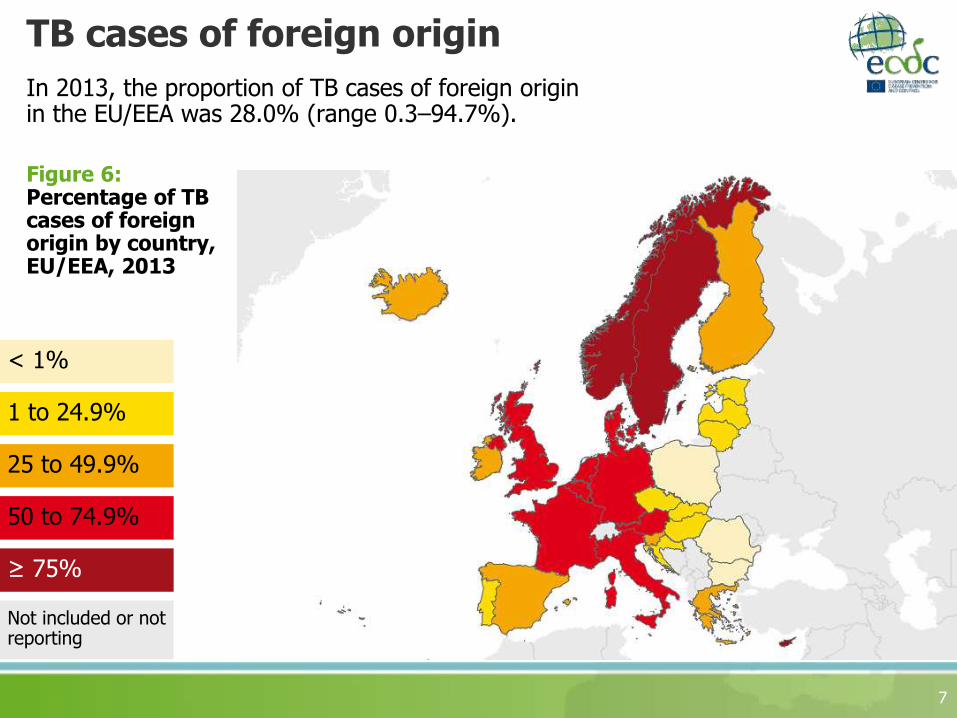
TB cases of foreign origin
7
In 2013, the proportion of TB cases of foreign origin in the EU/EEA was 28.0% (range 0.3–94.7%).
Figure 6: Percentage of TB cases of foreign origin by country, EU/EEA, 2013
25 to 49.9%
≥ 75%
1 to 24.9%
50 to 74.9%
< 1%
Not included or not reporting
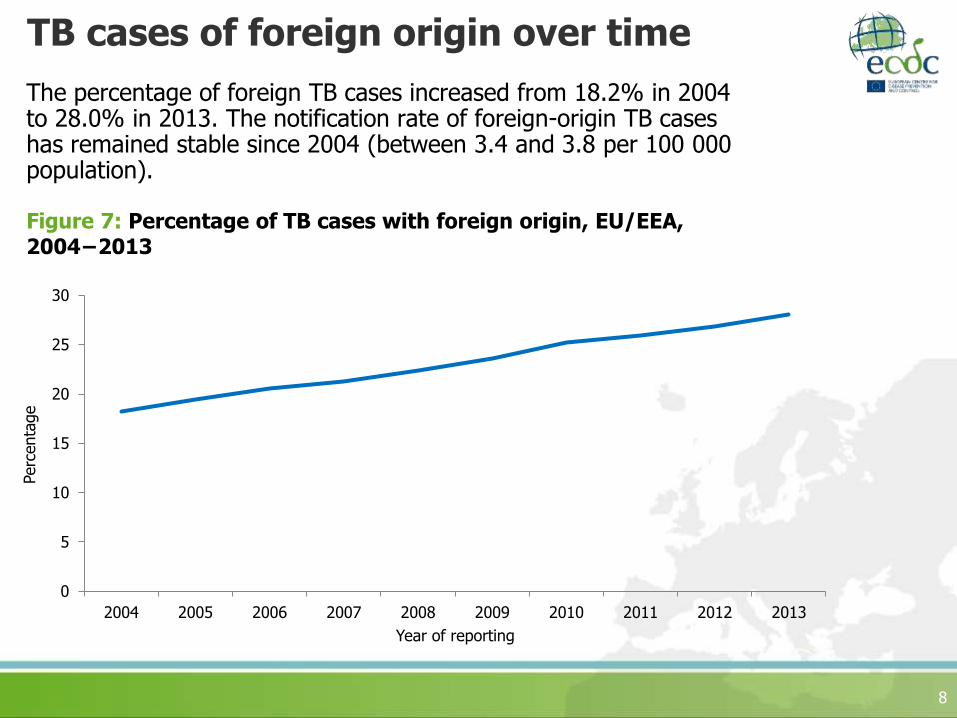
TB cases of foreign origin over time
The percentage of foreign TB cases increased from 18.2% in 2004 to 28.0% in 2013. The notification rate of foreign-origin TB cases has remained stable since 2004 (between 3.4 and 3.8 per 100 000 population).
8
Figure 7: Percentage of TB cases with foreign origin, EU/EEA, 2004−2013
0
5
10
15
20
25
30
2004 2005 2006 2007 2008 2009 2010 2011 2012 2013
Perc
enta
ge
Year of reporting

Extrapulmonary TB cases
9
In 2013, the proportion of extrapulmonary TB cases in the EU/EEA was 22.3% (range 4.7–63.6%).
Figure 8: Percentage of extrapulmonary TB cases by country, EU/EEA, 2013
20 to 29.9%
≥ 40%
10 to 19.9%
30 to 39.9%
< 10%
Not included or not reporting

Multidrug-resistant TB among all TB cases
10
In 2013, the proportion of TB cases with multidrug-resistance in the EU/EEA was 4.1% (range 0–22.7%).
Figure 9: Percentage of MDR TB among all confirmed TB cases by country, EU/EEA, 2013
2 to 4.9%
≥ 10%
1 to 1.9%
5 to 9.9%
< 1%
Not included or not reporting
Multidrug-resistant TB case notification rate over time
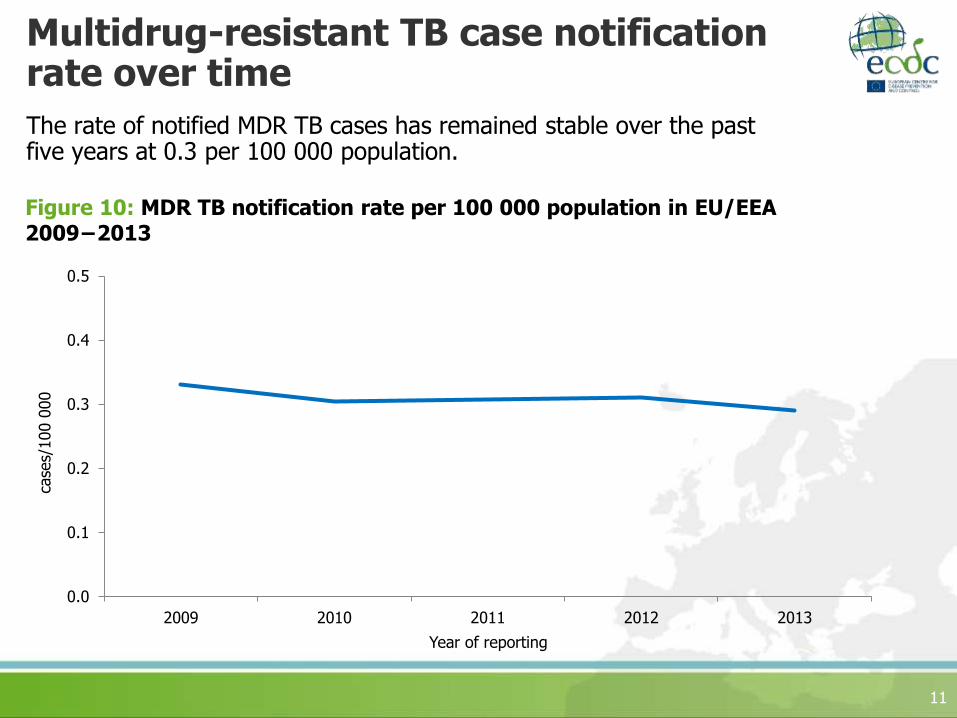
The rate of notified MDR TB cases has remained stable over the past five years at 0.3 per 100 000 population.
11
Figure 10: MDR TB notification rate per 100 000 population in EU/EEA 2009−2013
0.0
0.1
0.2
0.3
0.4
0.5
2009 2010 2011 2012 2013
case
s/100 0
00
Year of reporting

Multidrug-resistance among new pulmonary TB cases
12
Figure 11: Percentage of new pulmonary TB cases with MDR TB by country, EU/EEA, 2013
2 to 4.9%
1 to 1.9%
≥ 5%
< 1%
Not reporting
In 2013, the percentage of new pulmonary TB cases with multidrug-resistance in the EU/EEA was 2.6% (range 0–17.3%).

Multidrug-resistance among previously treated pulmonary TB cases
13
In 2013, the proportion of previously treated pulmonary TB cases with multidrug-resistance in the EU/EEA was 17.0% (range 0–100.0%).
Figure 12: Percentage of previously treated pulmonary TB cases with MDR TB by country, EU/EEA, 2013
10 to 19.9%
≥ 20%
1 to 9.9%
< 1%
Not reporting
Extensively drug-resistant TB (XDR TB)
14
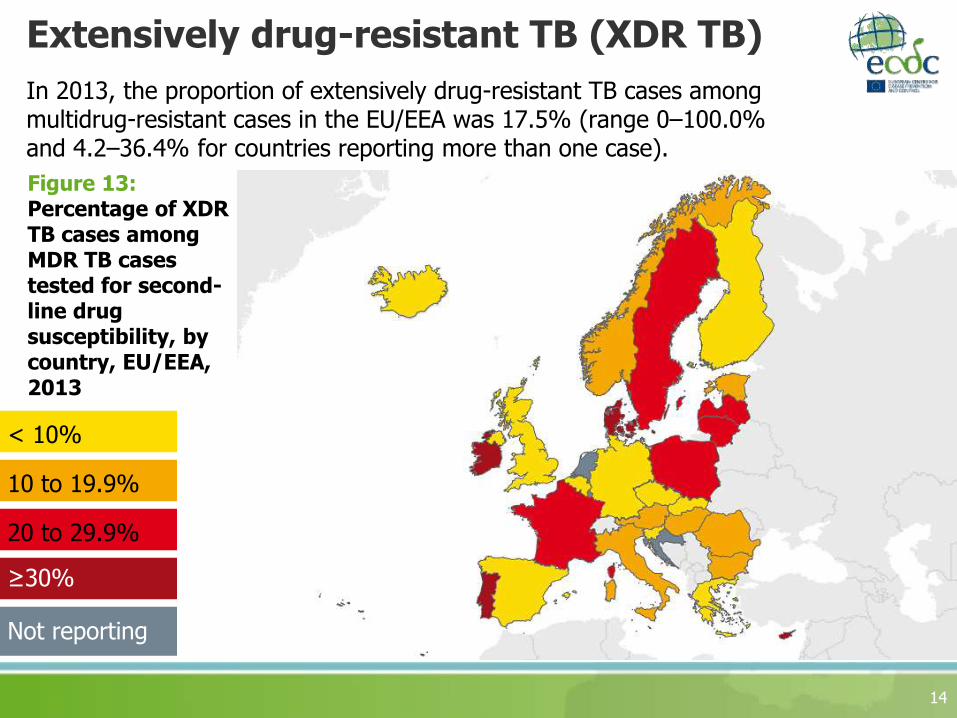
In 2013, the proportion of extensively drug-resistant TB cases among multidrug-resistant cases in the EU/EEA was 17.5% (range 0–100.0% and 4.2–36.4% for countries reporting more than one case).
Figure 13: Percentage of XDR TB cases among MDR TB cases tested for second-line drug susceptibility, by country, EU/EEA, 2013
20 to 29.9%
10 to 19.9%
≥30%
< 10%
Not reporting
TB/HIV co-infection
15
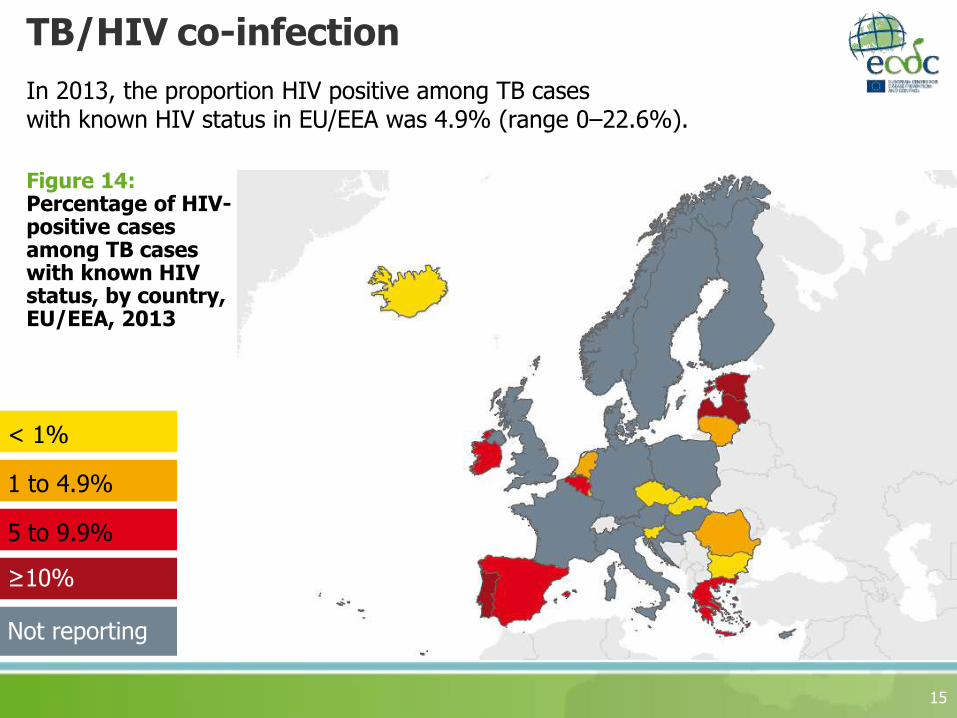
In 2013, the proportion HIV positive among TB cases with known HIV status in EU/EEA was 4.9% (range 0–22.6%).
Figure 14: Percentage of HIV-positive cases among TB cases with known HIV status, by country, EU/EEA, 2013
5 to 9.9%
1 to 4.9%
≥10%
< 1%
Not reporting
Treatment success after 12 months in all TB cases*
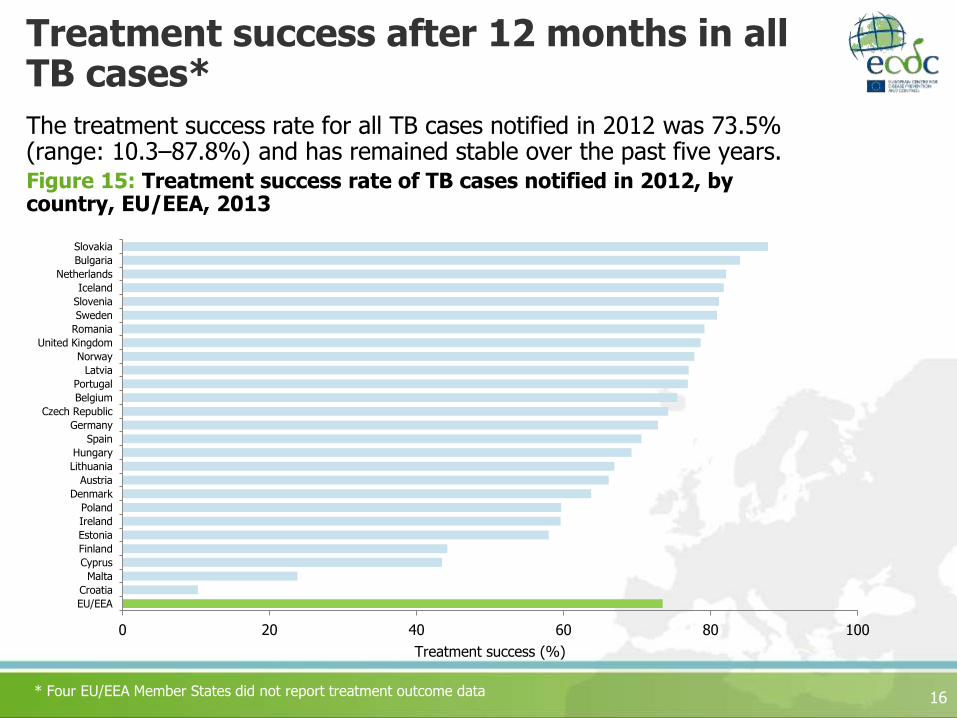
The treatment success rate for all TB cases notified in 2012 was 73.5% (range: 10.3–87.8%) and has remained stable over the past five years.
16
Figure 15: Treatment success rate of TB cases notified in 2012, by country, EU/EEA, 2013
* Four EU/EEA Member States did not report treatment outcome data
0 20 40 60 80 100
EU/EEA
Croatia
Malta
Cyprus
Finland
Estonia
Ireland
Poland
Denmark
Austria
Lithuania
Hungary
Spain
Germany
Czech Republic
Belgium
Portugal
Latvia
Norway
United Kingdom
Romania
Sweden
Slovenia
Iceland
Netherlands
Bulgaria
Slovakia
Treatment success (%)
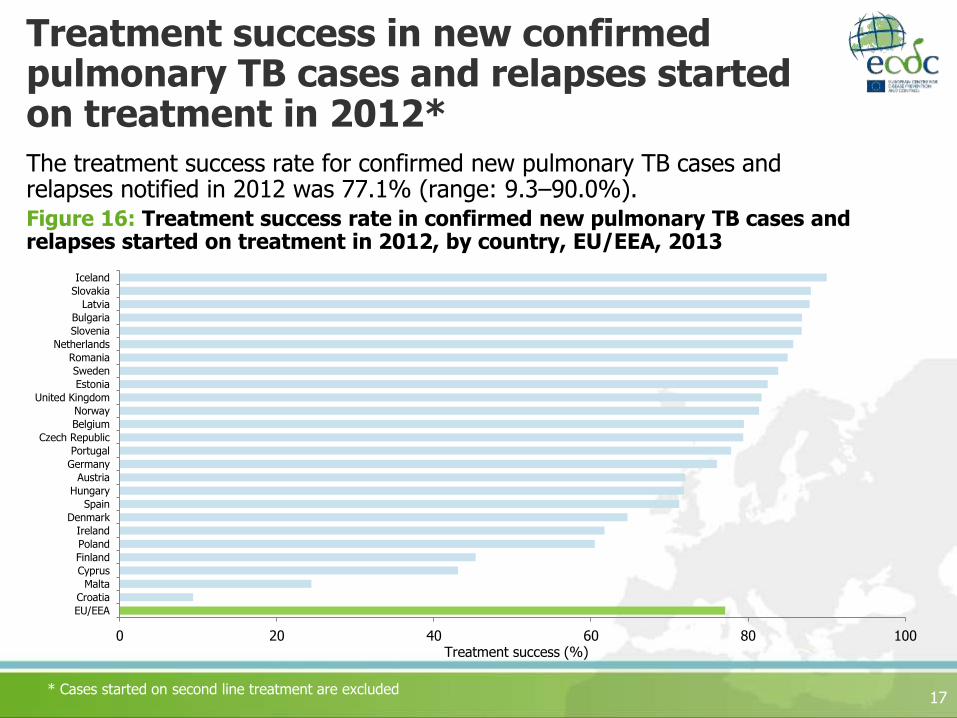
Treatment success in new confirmed pulmonary TB cases and relapses started on treatment in 2012*The treatment success rate for confirmed new pulmonary TB cases and relapses notified in 2012 was 77.1% (range: 9.3–90.0%).
17
Figure 16: Treatment success rate in confirmed new pulmonary TB cases and relapses started on treatment in 2012, by country, EU/EEA, 2013
* Cases started on second line treatment are excluded
0 20 40 60 80 100
EU/EEA
Croatia
Malta
Cyprus
Finland
Poland
Ireland
Denmark
Spain
Hungary
Austria
Germany
Portugal
Czech Republic
Belgium
Norway
United Kingdom
Estonia
Sweden
Romania
Netherlands
Slovenia
Bulgaria
Latvia
Slovakia
Iceland
Treatment success (%)
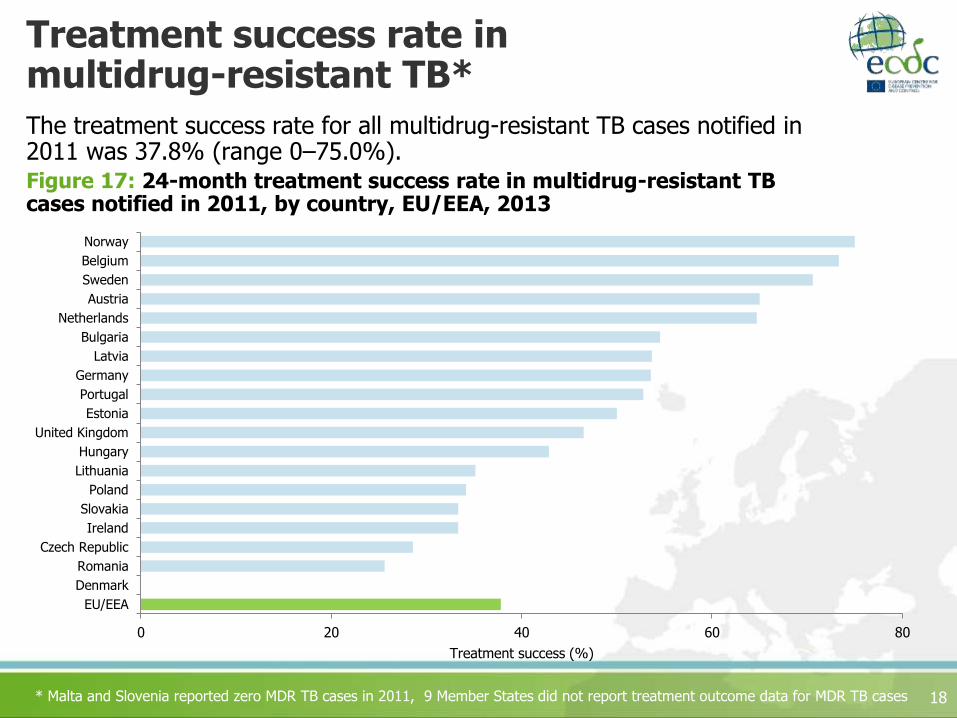
Treatment success rate in multidrug-resistant TB*
The treatment success rate for all multidrug-resistant TB cases notified in 2011 was 37.8% (range 0–75.0%).
18
Figure 17: 24-month treatment success rate in multidrug-resistant TB cases notified in 2011, by country, EU/EEA, 2013
* Malta and Slovenia reported zero MDR TB cases in 2011, 9 Member States did not report treatment outcome data for MDR TB cases
0 20 40 60 80
EU/EEA
Denmark
Romania
Czech Republic
Ireland
Slovakia
Poland
Lithuania
Hungary
United Kingdom
Estonia
Portugal
Germany
Latvia
Bulgaria
Netherlands
Austria
Sweden
Belgium
Norway
Treatment success (%)
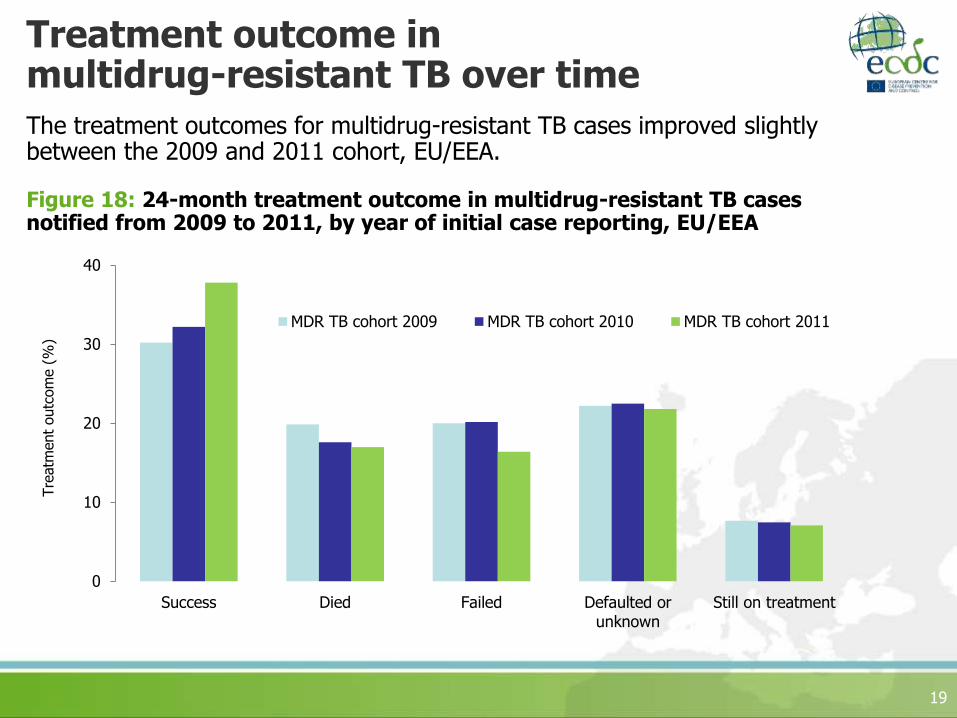
Treatment outcome in multidrug-resistant TB over time
The treatment outcomes for multidrug-resistant TB cases improved slightly between the 2009 and 2011 cohort, EU/EEA.
19
Figure 18: 24-month treatment outcome in multidrug-resistant TB cases notified from 2009 to 2011, by year of initial case reporting, EU/EEA
0
10
20
30
40
Success Died Failed Defaulted orunknown
Still on treatment
Tre
atm
ent
outc
om
e (
%)
MDR TB cohort 2009 MDR TB cohort 2010 MDR TB cohort 2011
20
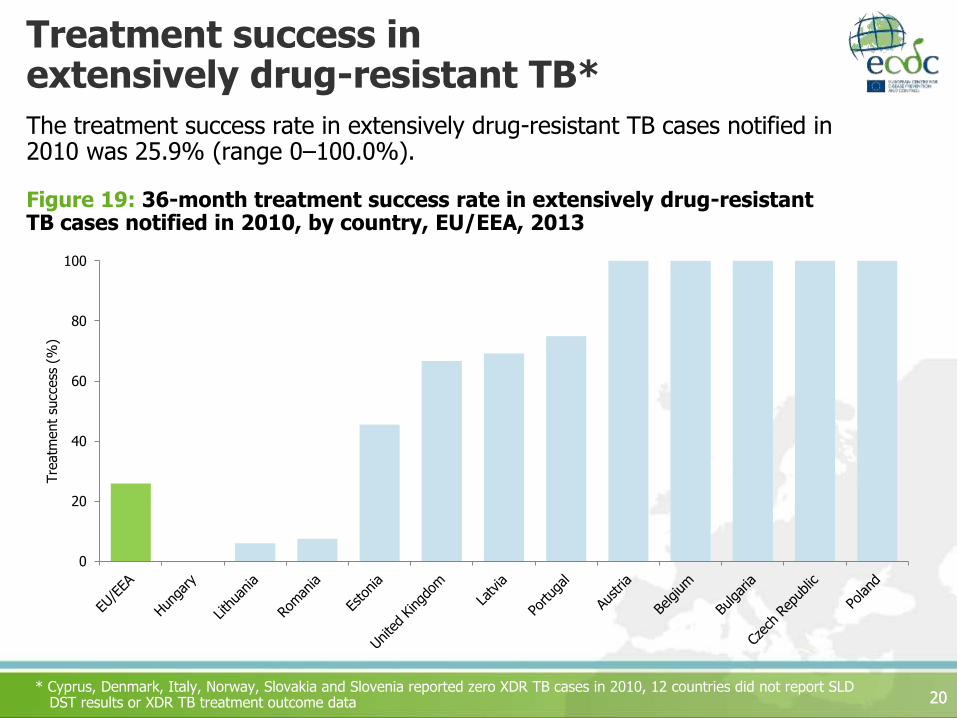
Treatment success in extensively drug-resistant TB*
The treatment success rate in extensively drug-resistant TB cases notified in 2010 was 25.9% (range 0–100.0%).
20
Figure 19: 36-month treatment success rate in extensively drug-resistant TB cases notified in 2010, by country, EU/EEA, 2013
* Cyprus, Denmark, Italy, Norway, Slovakia and Slovenia reported zero XDR TB cases in 2010, 12 countries did not report SLD DST results or XDR TB treatment outcome data
0
20
40
60
80
100
Tre
atm
ent
succ
ess
(%
)
Related Documents