64 Tile International 2/2018 Statistics Luca Baraldi, MECS - Machinery Economics Studies by ACIMAC ([email protected]) World sanitaryware exports and imports World ceramic sanitaryware import/export flows in- creased by 64% from 1.7 to 2.8 million tonnes over the pe- riod 2006-2016, correspond- ing to an annual compound growth rate of 5.1%. However, this growth came to an abrupt standstill in 2016 when sanitaryware exports shrank by 1.4% with respect to 2015. An analysis of exports by ge- ographical area of produc- tion reveals a fairly heteroge- neous trend. While Asia remained the world’s largest sanitaryware producer with a 55% share of world exports, it closed the year with a 4.7% year-on-year contraction to 1.59 million tonnes, the second consecu- tive decline after the previous year’s 0.6% fall. This contrac- tion was mainly due to the slowdown in Chinese exports, contrasting with the upturn in the other main Asian exporter countries, India, Thailand and Vietnam. The European Un- ion, the world’s second larg- est exporter region, contin- ued its 2015 growth to reach 583,000 tonnes (+2.4%), large- ly driven by the strong perfor- mance of the regions three largest exporter countries, Portugal, Poland and Germa- ny. North America (NAFTA) like- wise underwent expansion to the exceptional growth of Asia, whose exports rose from 447,000 tonnes in 2006 to 1.6 million tonnes in 2016, an overall increase of 256% (CAGR +13.5%). Asia saw its percentage share of global exports rise from 25% in 2006 to the current 55%, winning shares from all the other re- gions. The EU, which suffered an overall 8% downswing with re- spect to the volumes export- ed in 2006, saw its share of world trade shrink from 36.1% to 20.2%. The NAFTA region’s share fell from 16.4% to 12.8% despite overall 28% growth in exports over the decade. South Amer- reach 368,000 tonnes (+8.2%) thanks to the strong perfor- mance of Mexico. Non-EU Eu- ropean countries also per- formed well (+1% to 188,000 tonnes), driven by the recov- ery in Turkey. South America resumed its growth (+10.7%, 80,000 tonnes) following 4 years of steady decline, while Africa remained firmly in neg- ative territory (-14.4%, 72,000 tonnes) with the second con- secutive fall after 6 years of uninterrupted growth. Looking at the ten-year peri- od as a whole gives a very clear picture of how exports evolved in each region. One particularly striking trend is TAB. 1 - EXPORTS OF SANITARYWARE BY AREA (TONS) 2006 2009 2010 2011 2012 2013 2014 2015 2016 % 16/15 CAGR 16/06 % on 2016 world exports Asia 446,530 984,799 1,100,506 1,244,240 1,217,207 1,370,793 1,679,102 1,668,361 1,589,476 -4.7% 13.5% 55.1% European Union 633,805 508,040 522,118 532,638 523,150 519,939 530,149 569,475 583,409 2.4% -0.8% 20.2% Other Europe 163,174 125,198 132,132 145,787 169,188 171,264 178,482 185,960 187,805 1.0% 1.4% 6.5% NAFTA 287,058 262,666 268,401 303,537 290,715 320,345 329,677 340,565 368,326 8.2% 2.5% 12.8% South America 181,387 86,711 100,043 108,848 102,328 88,800 82,515 72,548 80,315 10.7% -7.8% 2.8% Africa 41,928 35,661 35,861 37,233 68,672 73,779 88,524 84,042 71,958 -14.4% 5.5% 2.5% Oceania 1,691 2,061 1,960 1,063 875 608 847 902 1,084 20.2% -4.3% 0.0% TOTAL WORLD 1,755,573 2,005,136 2,161,021 2,373,346 2,372,135 2,545,528 2,889,296 2,921,853 2,882,373 -1.4% 5.1% 100.0% % var y-o-y 16.5 7.8 9.8 -0.1 7.3 13.5 1.1 -1.4 Source: Acimac Research Dept. on BSRIA and ITC data

Welcome message from author
This document is posted to help you gain knowledge. Please leave a comment to let me know what you think about it! Share it to your friends and learn new things together.
Transcript
64Tile International 2/2018
Statistics
Luca Baraldi, MECS - Machinery Economics Studies by ACIMAC ([email protected])
World sanitaryware exports and imports
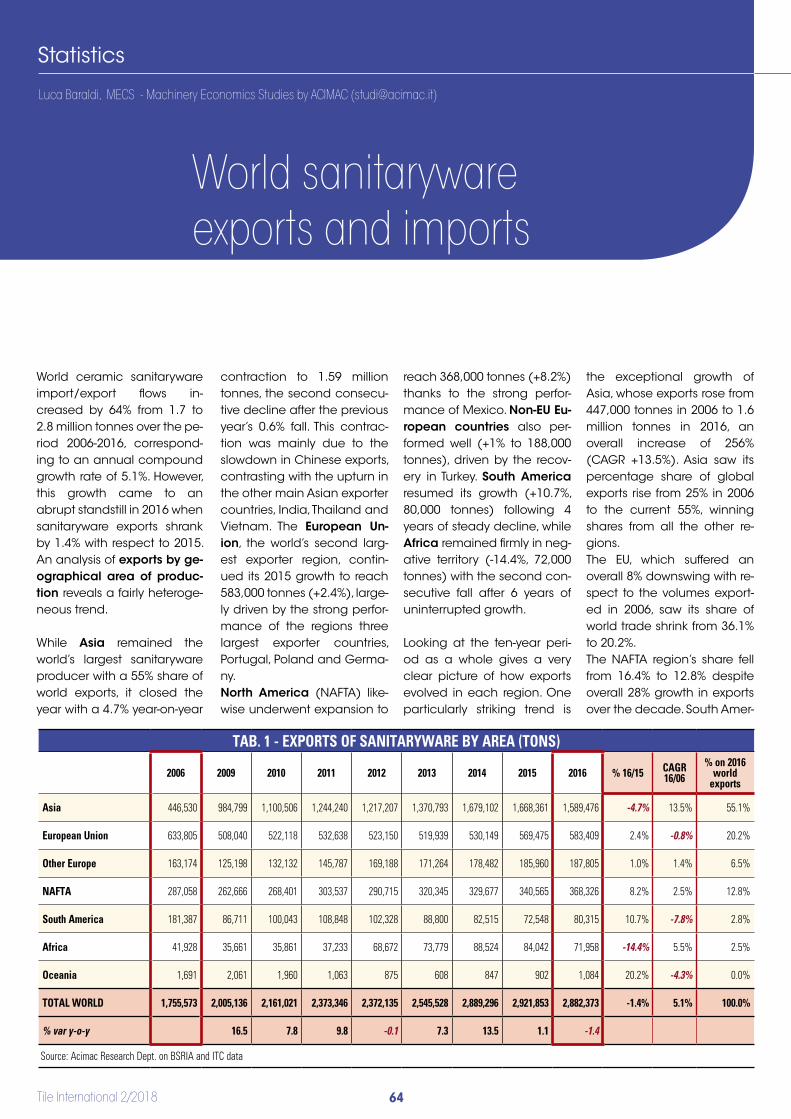
World ceramic sanitaryware import/export flows in-creased by 64% from 1.7 to 2.8 million tonnes over the pe-riod 2006-2016, correspond-ing to an annual compound growth rate of 5.1%. However, this growth came to an abrupt standstill in 2016 when sanitaryware exports shrank by 1.4% with respect to 2015. An analysis of exports by ge-ographical area of produc-tion reveals a fairly heteroge-neous trend.
While Asia remained the world’s largest sanitaryware producer with a 55% share of world exports, it closed the year with a 4.7% year-on-year
contraction to 1.59 million tonnes, the second consecu-tive decline after the previous year’s 0.6% fall. This contrac-tion was mainly due to the slowdown in Chinese exports, contrasting with the upturn in the other main Asian exporter countries, India, Thailand and Vietnam. The European Un-ion, the world’s second larg-est exporter region, contin-ued its 2015 growth to reach 583,000 tonnes (+2.4%), large-ly driven by the strong perfor-mance of the regions three largest exporter countries, Portugal, Poland and Germa-ny.North America (NAFTA) like-wise underwent expansion to
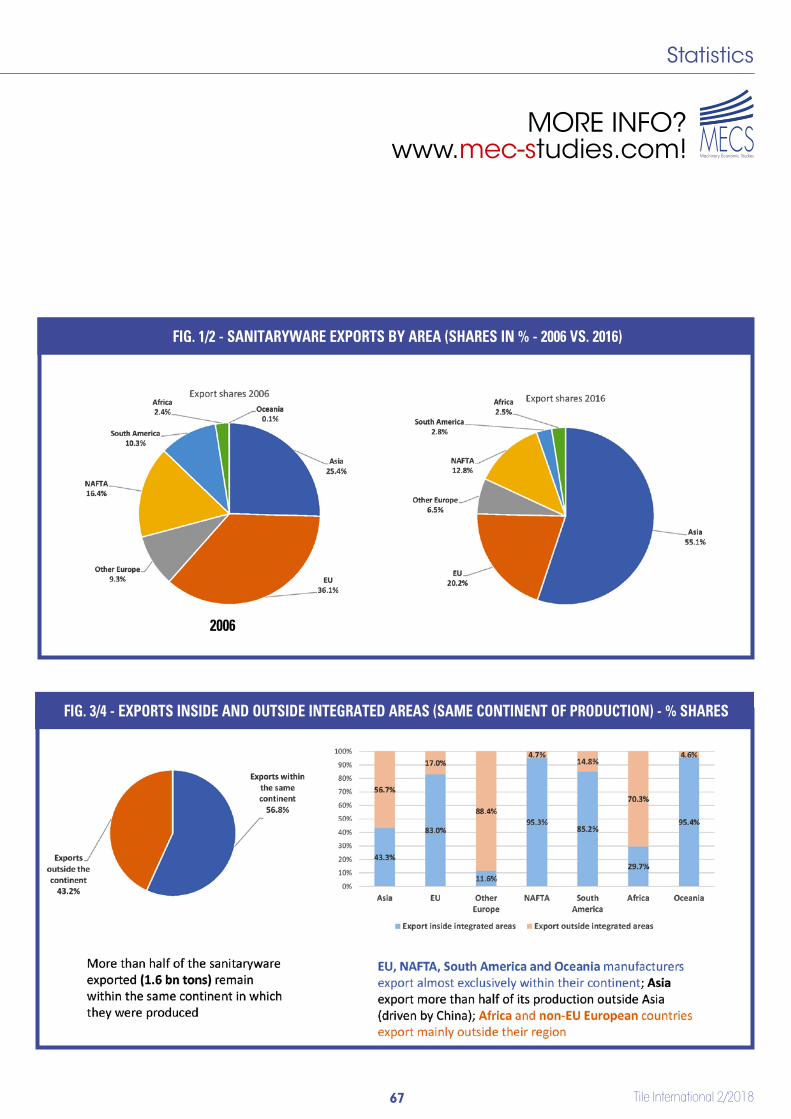
the exceptional growth of Asia, whose exports rose from 447,000 tonnes in 2006 to 1.6 million tonnes in 2016, an overall increase of 256% (CAGR +13.5%). Asia saw its percentage share of global exports rise from 25% in 2006 to the current 55%, winning shares from all the other re-gions. The EU, which suffered an overall 8% downswing with re-spect to the volumes export-ed in 2006, saw its share of world trade shrink from 36.1% to 20.2%. The NAFTA region’s share fell from 16.4% to 12.8% despite overall 28% growth in exports over the decade. South Amer-
reach 368,000 tonnes (+8.2%) thanks to the strong perfor-mance of Mexico. Non-EU Eu-ropean countries also per-formed well (+1% to 188,000 tonnes), driven by the recov-ery in Turkey. South America resumed its growth (+10.7%, 80,000 tonnes) following 4 years of steady decline, while Africa remained firmly in neg-ative territory (-14.4%, 72,000 tonnes) with the second con-secutive fall after 6 years of uninterrupted growth.
Looking at the ten-year peri-od as a whole gives a very clear picture of how exports evolved in each region. One particularly striking trend is
TAB. 1 - EXPORTS OF SANITARYWARE BY AREA (TONS)
2006 2009 2010 2011 2012 2013 2014 2015 2016 % 16/15 CAGR 16/06
% on 2016 world
exports
Asia 446,530 984,799 1,100,506 1,244,240 1,217,207 1,370,793 1,679,102 1,668,361 1,589,476 -4.7% 13.5% 55.1%
European Union 633,805 508,040 522,118 532,638 523,150 519,939 530,149 569,475 583,409 2.4% -0.8% 20.2%
Other Europe 163,174 125,198 132,132 145,787 169,188 171,264 178,482 185,960 187,805 1.0% 1.4% 6.5%
NAFTA 287,058 262,666 268,401 303,537 290,715 320,345 329,677 340,565 368,326 8.2% 2.5% 12.8%
South America 181,387 86,711 100,043 108,848 102,328 88,800 82,515 72,548 80,315 10.7% -7.8% 2.8%
Africa 41,928 35,661 35,861 37,233 68,672 73,779 88,524 84,042 71,958 -14.4% 5.5% 2.5%
Oceania 1,691 2,061 1,960 1,063 875 608 847 902 1,084 20.2% -4.3% 0.0%
TOTAL WORLD 1,755,573 2,005,136 2,161,021 2,373,346 2,372,135 2,545,528 2,889,296 2,921,853 2,882,373 -1.4% 5.1% 100.0%
% var y-o-y 16.5 7.8 9.8 -0.1 7.3 13.5 1.1 -1.4
Source: Acimac Research Dept. on BSRIA and ITC data
Tile International 2/201865
Statistics
MECS - Machinery Economics Studies by ACIMAC - ALL RIGHTS RESERVED
MECSMachinery Economic Studies
MORE INFO?www.mec-studies.com!
TAB. 2 - THE TOP EXPORTING COUNTRIES (TONS)
2006 2009 2010 2011 2012 2013 2014 2015 2016 % 16/15 CAGR 16/06% on 2016
world exports
China 199,895 768,129 901,962 958,533 918,750 1,015,513 1,280,270 1,335,212 1,238,558 -7.2% 20.0% 43.0%
Mexico 245,833 223,709 226,569 245,964 237,954 268,502 276,984 295,439 322,169 9.0% 2.7% 11.2%
India 43,454 70,354 15,076 90,611 118,226 134,255 119,626 119,752 135,776 13.4% 12.1% 4.7%
Turkey 121,207 84,933 94,354 101,350 113,445 119,602 125,256 120,613 127,065 5.3% 0.5% 4.4%
Portugal 104,659 78,297 75,049 65,552 67,251 68,525 78,360 87,434 93,891 7.4% -1.1% 3.3%
Thailand 70,620 52,857 57,189 58,712 56,976 68,107 75,794 79,242 81,016 2.2% 1.4% 2.8%
Poland 72,479 59,327 67,572 70,342 66,723 70,890 69,913 77,048 80,323 4.3% 1.0% 2.8%
Germany 52,529 58,722 63,742 68,291 66,712 56,560 58,343 65,734 79,124 20.4% 4.2% 2.7%
Bulgaria 51,327 35,833 40,566 47,969 51,911 53,094 55,728 56,183 54,491 -3.0% 0.6% 1.9%
Vietnam 17,810 16,766 19,590 24,570 32,088 42,750 57,424 47,892 50,064 4.5% 10.9% 1.7%
TOTAL 979,813 1,448,927 1,561,669 1,731,894 1,730,036 1,897,798 2,197,698 2,284,549 2,262,477
% on total world exports 55.8 72.3 72.3 73.0 72.9 74.6 76.1 78.2 78.5
Source: Acimac Research Dept. on BSRIA and ITC data
TAB. 3 - IMPORTS OF SANITARYWARE BY AREA (TONS)
2006 2009 2010 2011 2012 2013 2014 2015 2016 % 16/15 CAGR 16/06% on 2016
world imports
Asia 258,237 429,387 478,338 618,296 582,609 659,174 847,357 792,368 781,950 -1.3% 11.7% 27.1%
European Union 707,621 663,584 692,328 713,015 667,999 665,785 729,926 788,840 812,442 3.0% 1.4% 28.2%
Other Europe 107,672 91,633 96,507 107,822 115,890 124,121 124,274 89,730 70,917 -21.0% -4.1% 2.5%
NAFTA 525,356 575,430 620,716 606,694 626,710 704,168 749,982 809,546 819,357 1.2% 4.5% 28.4%
South America 71,966 91,217 119,957 139,156 147,494 134,075 136,408 146,436 130,758 -10.7% 6.2% 4.5%
Africa 64,204 122,561 111,952 147,015 190,985 212,495 247,685 234,447 197,607 -15.7% 11.9% 6.9%
Oceania 20,492 29,988 40,690 40,884 40,150 45,435 53,661 60,461 68,318 13.0% 12.8% 2.4%
TOTAL WORLD 1,755,573 2,005,136 2,161,021 2,373,346 2,372,135 2,545,528 2,889,296 2,921,853 2,882,373 -1.4% 5.1% 100.0%
% var y-o-y 16.5 7.8 9.8 -0.1 7.3 13.5 1.1 -1.4
Source: Acimac Research Dept. on BSRIA and ITC data
Tile International 2/2018
Statistics
66
ica, which in 2006 accounted for 10.3% of world exports, saw its share contract to 2.8% following a 56% slump in vol-umes over the 10-year period (CAGR -7.8%). The other European countries grew by 15% overall during the period in question and in 2016 controlled a 6.5% share compared to 9.3% in 2006. Af-rica is an exception to the trend with 72% growth in sani-taryware exports between 2006 and 2016 (CAGR +5.5%), raising its share of world trade from 2.4% to 2.5%.
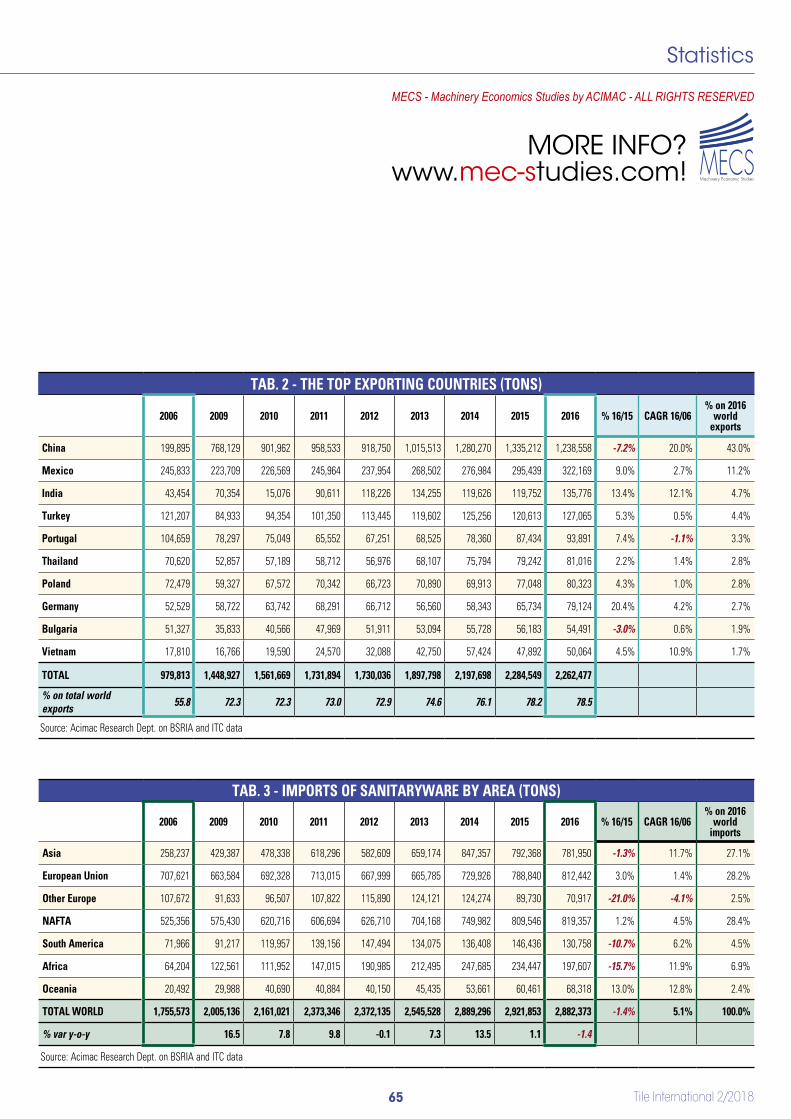
The rankings of the top 10 ex-porter countries remained essentially unchanged in
2016 with respect to the previ-ous year apart from the ap-pearance of Vietnam in tenth position in place of Italy, which dropped to eleventh place following a 13.9% downswing in exports with re-spect to 2015. The fact that eight out of ten countries saw an increase in sanitaryware exports com-pared to the previous year is a positive sign.China continued to top the rankings following an aston-ishing 520% increase over the ten-year period 2006-2016 (corresponding to a com-pound annual growth rate of 20%), up from 200,000 tonnes in 2006 to 1.24 million tonnes
in 2016. But as we mentioned, China’s export growth came to an abrupt halt in 2016 when it suffered a 7.2% slump in exports with respect to 2015. China alone accounted for 78% of Asian and 43% of world exports. Mexico, the second largest exporter country with an 11.2% share of global exports, reached 322,000 tonnes (up 9% on 2015), maintaining the upward trend of the previous three years. India rose to third place with a 4.7% share of total exports and 13.4% growth with re-spect to 2015 (135,000 tonnes), overtaking Turkey
which now ranks fourth with a total of 127,000 tonnes, 5.3% up on 2015.As mentioned, four European countries ranked amongst the top 10 world exporters: Portugal, Poland, Germany and Bulgaria, in that order. Germany achieved particu-larly impressive results with the highest percentage growth of all exporter coun-tries in 2016 (+20.4%).An analysis of 2016 imports to the various continents and regions also reveals a hetero-geneous trend. With 1.2% growth over 2015 to 819,000 tonnes, North Ameri-ca (NAFTA) maintained its position as the largest import-
TAB. 4 - THE TOP IMPORTING COUNTRIES (TON)
2006 2009 2010 2011 2012 2013 2014 2015 2016 % 16/15 CAGR 16/06% on 2016
world imports
USA 462,324 477,585 500,415 495,986 508,466 585,081 624,259 683,754 690,580 1.0% 4.1% 24.0%
Rep. Korea 16,162 69,880 84,543 105,416 94,980 99,658 115,816 132,361 148,344 12.1% 24.8% 5.1%
Germany 88,140 100,140 107,509 114,715 111,368 111,505 128,532 142,391 147,719 3.7% 5.3% 5.1%
United Kingdom 99,076 98,466 103,815 108,143 106,627 115,282 138,337 145,662 145,552 -0.1% 3.9% 5.0%
Canada 56,222 84,545 104,680 92,441 105,658 104,119 109,559 104,119 108,622 4.3% 6.8% 3.8%
France 106,972 111,245 115,108 118,933 118,084 107,797 104,078 101,819 107,421 5.5% 0.0% 3.7%
Spain 148,731 82,378 83,634 84,827 70,252 70,745 82,755 88,245 93,758 6.2% -4.5% 3.3%
Singapore 4,644 18,907 23,467 29,444 29,855 21,620 52,294 64,335 68,720 6.8% 30.9% 2.4%
Saudi Arabia 29,209 45,770 33,592 48,346 63,797 71,593 71,623 83,934 67,918 -19.1% 8.8% 2.4%
Italy 44,981 54,809 60,906 61,577 52,113 51,438 53,181 54,599 61,073 11.9% 3.1% 2.1%
TOTAL 1,056,461 1,143,725 1,217,669 1,259,828 1,261,201 1,338,838 1,480,435 1,601,219 1,639,707
% on total world imports 60.2 57.0 56.3 53.1 53.2 52.6 51.2 54.8 56.9
Source: Acimac Research Dept. on BSRIA and ITC data
Statistics
Tile International 2/201867
FIG. 1/2 - SANITARYWARE EXPORTS BY AREA (SHARES IN % - 2006 VS. 2016)
2006
FIG. 3/4 - EXPORTS INSIDE AND OUTSIDE INTEGRATED AREAS (SAME CONTINENT OF PRODUCTION) - % SHARES
MECSMachinery Economic Studies
MORE INFO?www.mec-studies.com!
Tile International 2/2018
Statistics
68
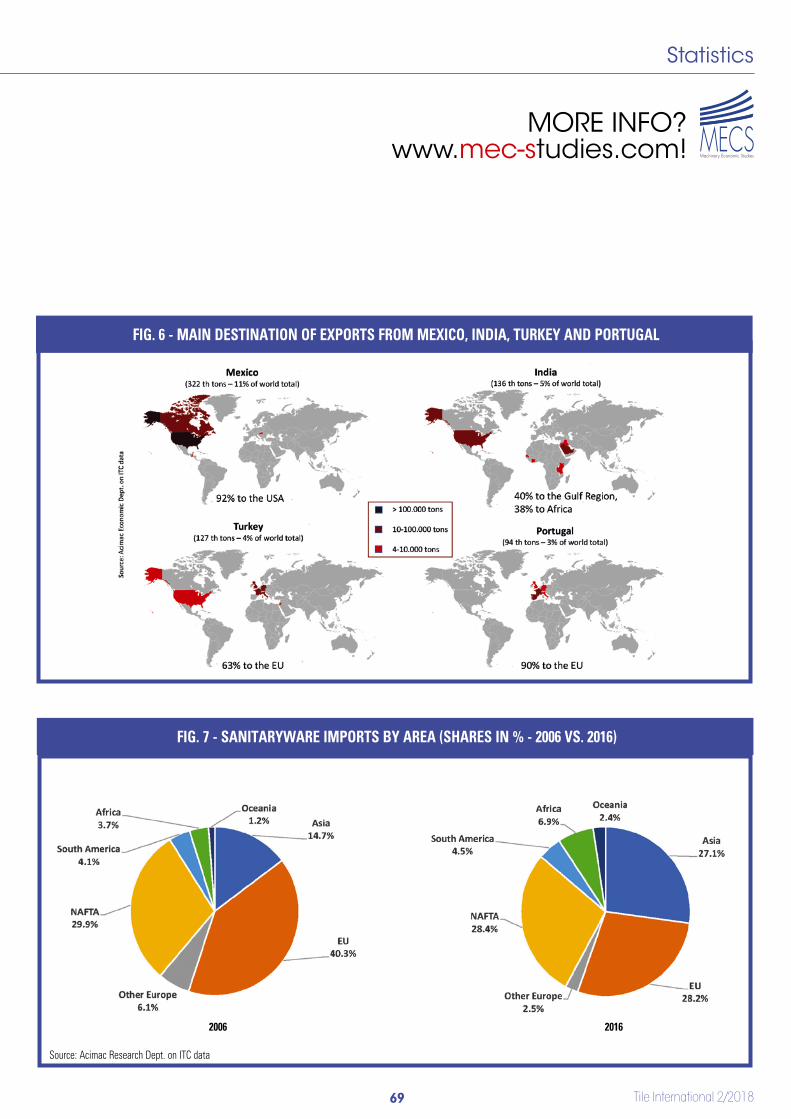
ing region with a 28.4% share of world imports. The European Union climbed to second place with a 28.2% share, equivalent to 812,000 tonnes (+3%). Asia tumbled to third place with a 1.3% decline in imports with respect to 2015, reaching 782,000 tonnes (27.1% of world imports). Oceania im-ports grew (+13%), contrast-ing with declines in South America (-10.7%), Africa (-15.7%) and non-EU Europe-an countries (-21%).
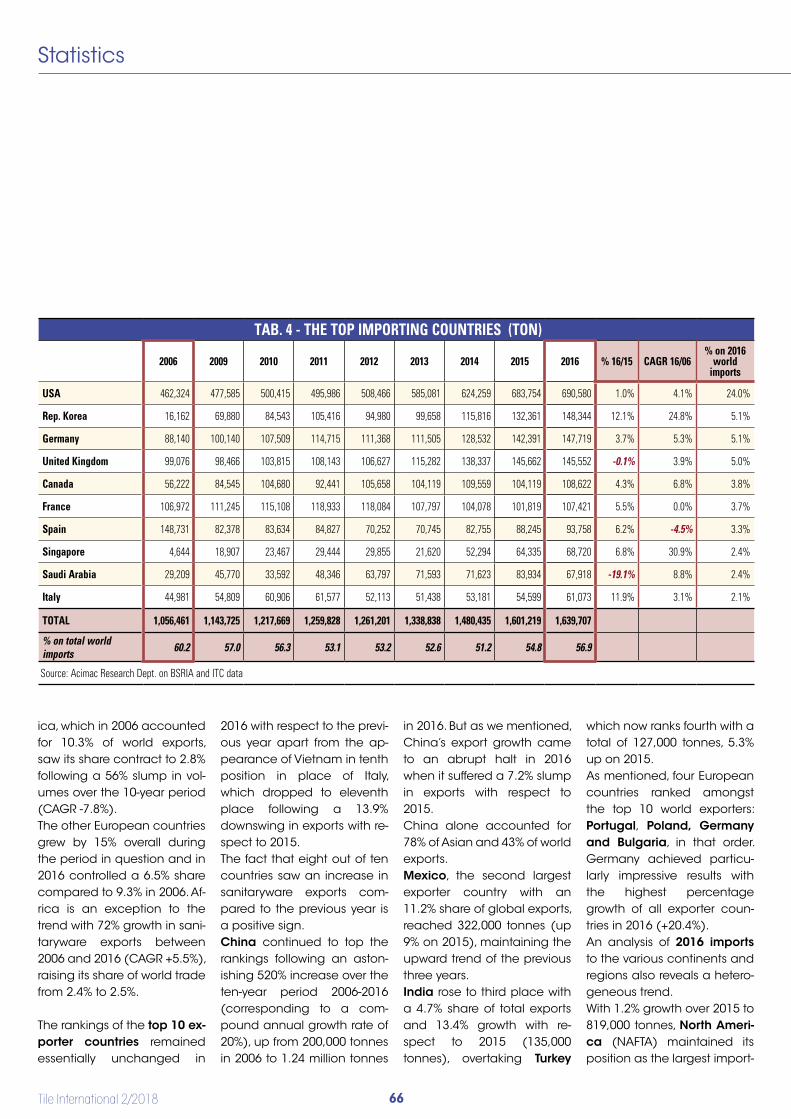
The first nine countries amongst the top 10 sanitary-ware importers maintained their positions in 2016 with re-
spect to the previous year. Eight countries out of ten in-creased their imports com-pared to 2015. In 2016, the im-ports of the top 10 importers made up 57% of world sani-taryware imports, a share that has remained virtually un-changed since 2006.
The United States was once again the world’s biggest sanitaryware importer in 2016 with 691,000 tonnes (1% up on 2015), a position it has en-joyed for many years given that it imported 463,000 tonnes (26% of world imports) back in 2006. It retained a strong lead over all other im-porter countries with 24% of
world imports, as well as al-most all (84%) of imports to the NAFTA region. South Korea climbed to sec-ond place with imports of 148,000 tonnes in 2016 (+12.1% on 2015), corre-sponding to a 5.1% share of world imports. This confirms its position as one of the coun-tries with the highest average annual growth rates in the pe-riod 2006-2016 (+24.8%). Germany and the UK both dropped one place to third and fourth respectively with imports of 148,000 tonnes (+3.7% on 2015) and 145,000 tonnes (-0.1%) in 2016. Both have maintained a steady growth trend over the last
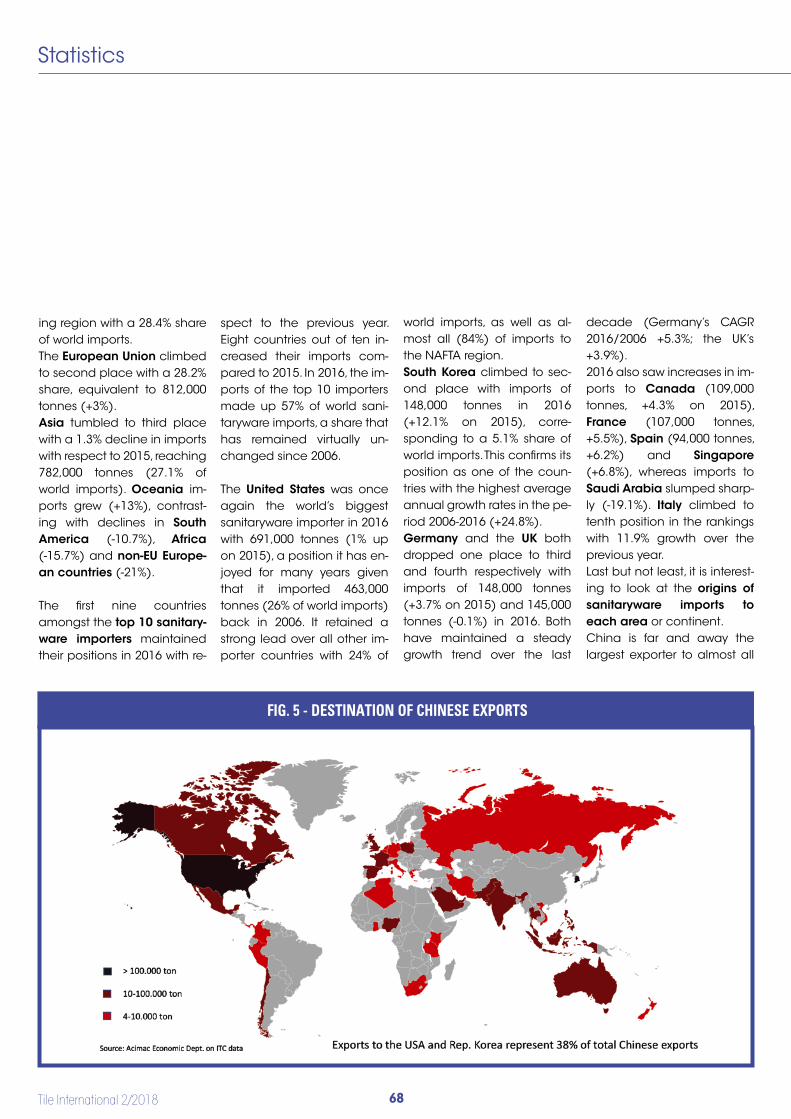
decade (Germany’s CAGR 2016/2006 +5.3%; the UK’s +3.9%).2016 also saw increases in im-ports to Canada (109,000 tonnes, +4.3% on 2015), France (107,000 tonnes, +5.5%), Spain (94,000 tonnes, +6.2%) and Singapore (+6.8%), whereas imports to Saudi Arabia slumped sharp-ly (-19.1%). Italy climbed to tenth position in the rankings with 11.9% growth over the previous year.Last but not least, it is interest-ing to look at the origins of sanitaryware imports to each area or continent.China is far and away the largest exporter to almost all
FIG. 5 - DESTINATION OF CHINESE EXPORTS
Statistics
Tile International 2/201869
MECSMachinery Economic Studies
MORE INFO?www.mec-studies.com!
FIG. 6 - MAIN DESTINATION OF EXPORTS FROM MEXICO, INDIA, TURKEY AND PORTUGAL
FIG. 7 - SANITARYWARE IMPORTS BY AREA (SHARES IN % - 2006 VS. 2016)
Source: Acimac Research Dept. on ITC data
2006 2016
Statistics
regions of the planet. It is the country of origin of 63% of im-ports to Asia (India, Vietnam and Thailand trail far behind with shares of between 5% and 8%) and 74% of imports to Oceania (second-placed Malaysia controls just 11%).Even outside its own regional market, China accounted for 48% of total imports to Africa (India ranked second with just 26.2%) and to North America despite the pres-ence of Mexico, the largest lo-cal player with a share of 38.3%. China was likewise the top ex-porter to South America with a 38.3% share, while Colom-bia, the second largest ex-porter country, saw its share
contract to 17.9%. Despite the presence of strong local play-ers, China was also the top exporter to the European Un-ion with an 18.3% share, fol-lowed by Portugal, Turkey, Po-land and Germany with shares of between 7% and 10%. The only market where Chinese exports ranked sec-ond was that of non-EU Euro-pean countries, where it con-trolled a 12% share of total imports behind the 14.1% of the leader Turkey.
An analysis of the top export-er countries’ target markets confirms that only a small number of them enjoy signifi-cant export shares outside their own geographical re-
ACIMACResearch Department
mr. Luca [email protected]
T. +39 059 510336www.mec-studies.com
gions. As mentioned, one of these is China which ships 39.7% of its exports to Asia, 31.8% to North America, 12.7% to Europe, 7.7% to Africa, 4% to South America and 4.1% to Oceania. Likewise, India sells just 47.1% of its exports in the Asian continent, while 38.1% is shipped to Africa and 9% to North America. Thailand sells 55.3% of its exports in Asia and Oceania and 37.9% in North America. At a global level, just 43.2% of total ex-ports are shipped to destina-tions outside the country of production. In accordance with this trend, the other ma-jor exporter countries are much more closely tied to their regional markets: 97.5%
of Mexican exports are sold in North America; 92% of Viet-namese exports are shipped to Asian markets; and 98.9% of Polish, 94% of Bulgarian and between 86% and 89% of Portuguese and German ex-ports remain in Europe. In keeping with Turkey’s geo-graphical position straddling Europe and Asia, its largest market is Europe with 71.1% of its exports and the second largest Asia with 19%. 5
i ta l i a n m a n u f a c t u r e r
Via triumvirato, 55/3 - 40132 BOlOGna, italy - tel. +39 051 311905 - [email protected]
Sistema POSA FACILE
5 mm3 mm1,5 mm
WORKS YOUR WAY
The levelling wedge in the cornerSPF
The universal levelling clipZERO
The quick and reliable levelling capCLICK
1 mm 2-3-4 mm 2-3-4 mm
1,5 mm
Now 1, 2, 3, 4 mmthickness also
available
NEW
ADVERTISING

Related Documents