World modeling on an MSL robotic soccer team João Silva * , Nuno Lau, António J.R. Neves, João Rodrigues, José Luís Azevedo ATRI, IEETA/DETI, University of Aveiro, 3810-193 Aveiro, Portugal article info Article history: Available online xxxx Keywords: Sensor fusion World model Kalman filter Linear regression Obstacle detection Visual matching abstract When a team of robots is built with the objective of playing soccer, the coordination and control algo- rithms must reason, decide and actuate based on the current conditions of the robot and its surroundings. This is where sensor and information fusion techniques appear, providing the means to build an accurate model of the world around the robot, based on its own limited sensor information and the also limited information obtained through communication with the team mates. One of the most important elements of the world model is the robot self-localization, as to be able to decide what to do in an effective way, it must know its position in the field of play. In this paper, the team localization algorithm is presented focusing on the integration of visual and compass information. An important element in a soccer game, perhaps the most important, is the ball. To improve the estimations of the ball position and velocity, two different techniques have been developed. A study of the visual sensor noise is presented and, according to this analysis, the resulting noise variation is used to define the parameters of a Kalman filter for ball position estimation. Moreover, linear regression is used for velocity estimation purposes, both for the ball and the robot. This implementation of linear regression has an adaptive buffer size so that, on hard devi- ations from the path (detected using the Kalman filter), the regression converges faster. A team cooper- ation method based on sharing the ball position is presented. Other important data during the soccer game is obstacle data. This is an important challenge for cooperation purposes, allowing the improve- ment of team strategy with ball covering, dribble corridor estimation, pass lines, among other strategic possibilities. Thus, detecting the obstacles is ceasing to be enough and identifying which obstacles are team mates and opponents is becoming a need. An approach for this identification is presented, consid- ering the visual information, the known characteristics of the team robots and shared localization among team members. The described work was implemented on the CAMBADA team and allowed it to achieve particularly good performances in the last two years, with a 1st and a 3rd place in the world champion- ship RoboCup 2008 and RoboCup 2009 editions, respectively, as well as distinctively achieve 1st place in 2008 and 2009 editions of the Portuguese Robotics Open. Ó 2010 Elsevier Ltd. All rights reserved. 1. Introduction Nowadays, there are several research domains in the area of multi robot systems. One of the most popular is robotic soccer. RoboCup 1 is an international joint project to promote artificial intel- ligence, robotics and related fields. Most of the RoboCup leagues have soccer as platform for developing technology, either at software or hardware levels, with single or multiple agents, cooperative or competitive [1]. Among RoboCup leagues, the Middle Size League (MSL) is one of the most challenging. In this league, each team is composed of up to five robots with maximum size of 50 50 cm base, 80 cm height and a maximum weight of 40 kg, playing in a field of 18 12 m. The rules of the game are similar to the official FIFA rules, with re- quired changes to adapt for the playing robots [2]. Each robot is autonomous and has its own sensorial means. They can communicate with each other, and with an external com- puter acting as a coach, through a wireless network. This coach computer cannot have any sensor, it only knows what is reported by the playing robots. The agents should be able to evaluate the state of the world and make decisions suitable to fulfill the cooper- ative team objective. CAMBADA, Cooperative Autonomous Mobile roBots with Advanced Distributed Architecture, is the Middle Size League Robotic Soccer team from the University of Aveiro. The project started in 2003, coordinated by the IEETA 2 ATRI 3 group and involves people working 0957-4158/$ - see front matter Ó 2010 Elsevier Ltd. All rights reserved. doi:10.1016/j.mechatronics.2010.05.011 * Corresponding author. E-mail addresses: [email protected] (J. Silva), [email protected] (N. Lau), [email protected] (A.J.R. Neves), [email protected] (J. Rodrigues), [email protected] (J.L. Azevedo). 1 http://www.robocup.org/. 2 Instituto de Engenharia Electrónica e Telemática de Aveiro – Aveiro’s Institute of Electronic and Telematic Engineering. 3 Actividade Transversal em Robótica Inteligente – Transverse Activity on Intelli- gent Robotics. Mechatronics xxx (2010) xxx–xxx Contents lists available at ScienceDirect Mechatronics journal homepage: www.elsevier.com/locate/mechatronics Please cite this article in press as: Silva J et al. World modeling on an MSL robotic soccer team. Mechatronics (2010), doi:10.1016/ j.mechatronics.2010.05.011

Welcome message from author
This document is posted to help you gain knowledge. Please leave a comment to let me know what you think about it! Share it to your friends and learn new things together.
Transcript
Mechatronics xxx (2010) xxx–xxx
Contents lists available at ScienceDirect
Mechatronics
journal homepage: www.elsevier .com/ locate/mechatronics
World modeling on an MSL robotic soccer team
João Silva *, Nuno Lau, António J.R. Neves, João Rodrigues, José Luís AzevedoATRI, IEETA/DETI, University of Aveiro, 3810-193 Aveiro, Portugal
a r t i c l e i n f o
Article history:Available online xxxx
Keywords:Sensor fusionWorld modelKalman filterLinear regressionObstacle detectionVisual matching
0957-4158/$ - see front matter � 2010 Elsevier Ltd. Adoi:10.1016/j.mechatronics.2010.05.011
* Corresponding author.E-mail addresses: [email protected] (J. Silva), nuno
(A.J.R. Neves), [email protected] (J. Rodrigues), [email protected] (J.L.1 http://www.robocup.org/.
Please cite this article in press as: Silvaj.mechatronics.2010.05.011
a b s t r a c t
When a team of robots is built with the objective of playing soccer, the coordination and control algo-rithms must reason, decide and actuate based on the current conditions of the robot and its surroundings.This is where sensor and information fusion techniques appear, providing the means to build an accuratemodel of the world around the robot, based on its own limited sensor information and the also limitedinformation obtained through communication with the team mates. One of the most important elementsof the world model is the robot self-localization, as to be able to decide what to do in an effective way, itmust know its position in the field of play. In this paper, the team localization algorithm is presentedfocusing on the integration of visual and compass information. An important element in a soccer game,perhaps the most important, is the ball. To improve the estimations of the ball position and velocity, twodifferent techniques have been developed. A study of the visual sensor noise is presented and, accordingto this analysis, the resulting noise variation is used to define the parameters of a Kalman filter for ballposition estimation. Moreover, linear regression is used for velocity estimation purposes, both for the balland the robot. This implementation of linear regression has an adaptive buffer size so that, on hard devi-ations from the path (detected using the Kalman filter), the regression converges faster. A team cooper-ation method based on sharing the ball position is presented. Other important data during the soccergame is obstacle data. This is an important challenge for cooperation purposes, allowing the improve-ment of team strategy with ball covering, dribble corridor estimation, pass lines, among other strategicpossibilities. Thus, detecting the obstacles is ceasing to be enough and identifying which obstacles areteam mates and opponents is becoming a need. An approach for this identification is presented, consid-ering the visual information, the known characteristics of the team robots and shared localization amongteam members. The described work was implemented on the CAMBADA team and allowed it to achieveparticularly good performances in the last two years, with a 1st and a 3rd place in the world champion-ship RoboCup 2008 and RoboCup 2009 editions, respectively, as well as distinctively achieve 1st place in2008 and 2009 editions of the Portuguese Robotics Open.
� 2010 Elsevier Ltd. All rights reserved.
1. Introduction
Nowadays, there are several research domains in the area ofmulti robot systems. One of the most popular is robotic soccer.RoboCup1 is an international joint project to promote artificial intel-ligence, robotics and related fields. Most of the RoboCup leagueshave soccer as platform for developing technology, either at softwareor hardware levels, with single or multiple agents, cooperative orcompetitive [1].
Among RoboCup leagues, the Middle Size League (MSL) is one ofthe most challenging. In this league, each team is composed of upto five robots with maximum size of 50 � 50 cm base, 80 cm heightand a maximum weight of 40 kg, playing in a field of 18 � 12 m.
ll rights reserved.
[email protected] (N. Lau), [email protected]).
J et al. World modeling o
The rules of the game are similar to the official FIFA rules, with re-quired changes to adapt for the playing robots [2].
Each robot is autonomous and has its own sensorial means.They can communicate with each other, and with an external com-puter acting as a coach, through a wireless network. This coachcomputer cannot have any sensor, it only knows what is reportedby the playing robots. The agents should be able to evaluate thestate of the world and make decisions suitable to fulfill the cooper-ative team objective.
CAMBADA, Cooperative Autonomous Mobile roBots with AdvancedDistributed Architecture, is the Middle Size League Robotic Soccerteam from the University of Aveiro. The project started in 2003,coordinated by the IEETA2 ATRI3 group and involves people working
2 Instituto de Engenharia Electrónica e Telemática de Aveiro – Aveiro’s Institute ofElectronic and Telematic Engineering.
3 Actividade Transversal em Robótica Inteligente – Transverse Activity on Intelli-gent Robotics.
n an MSL robotic soccer team. Mechatronics (2010), doi:10.1016/
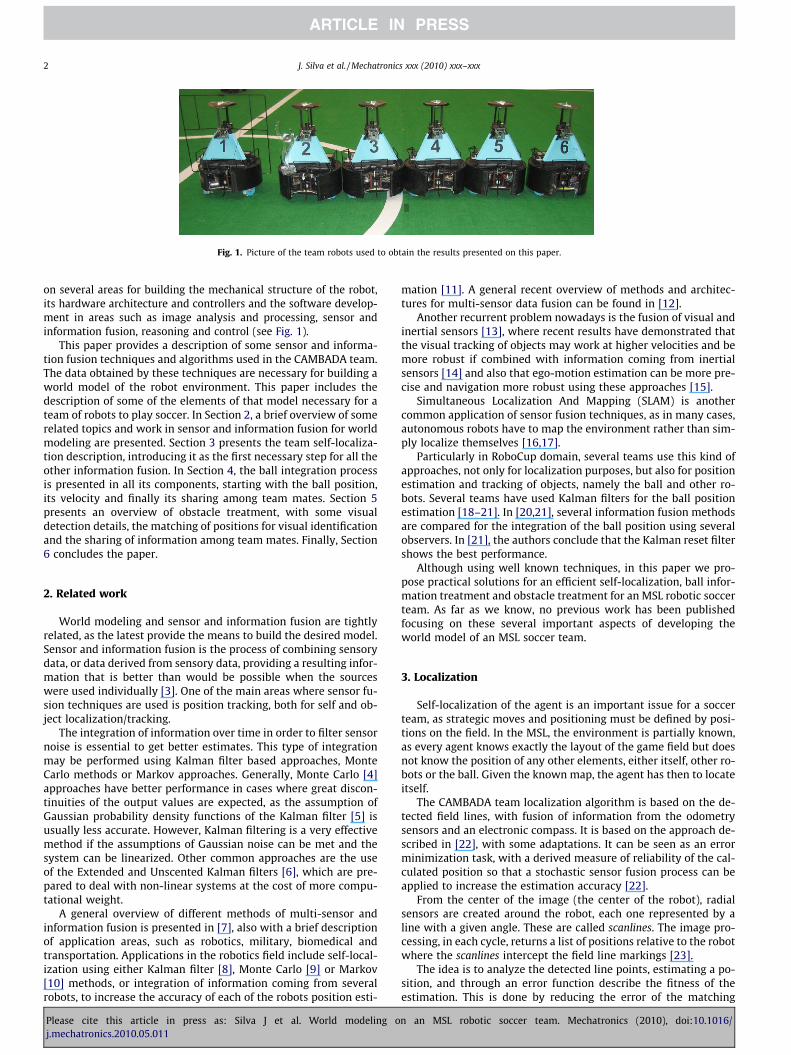
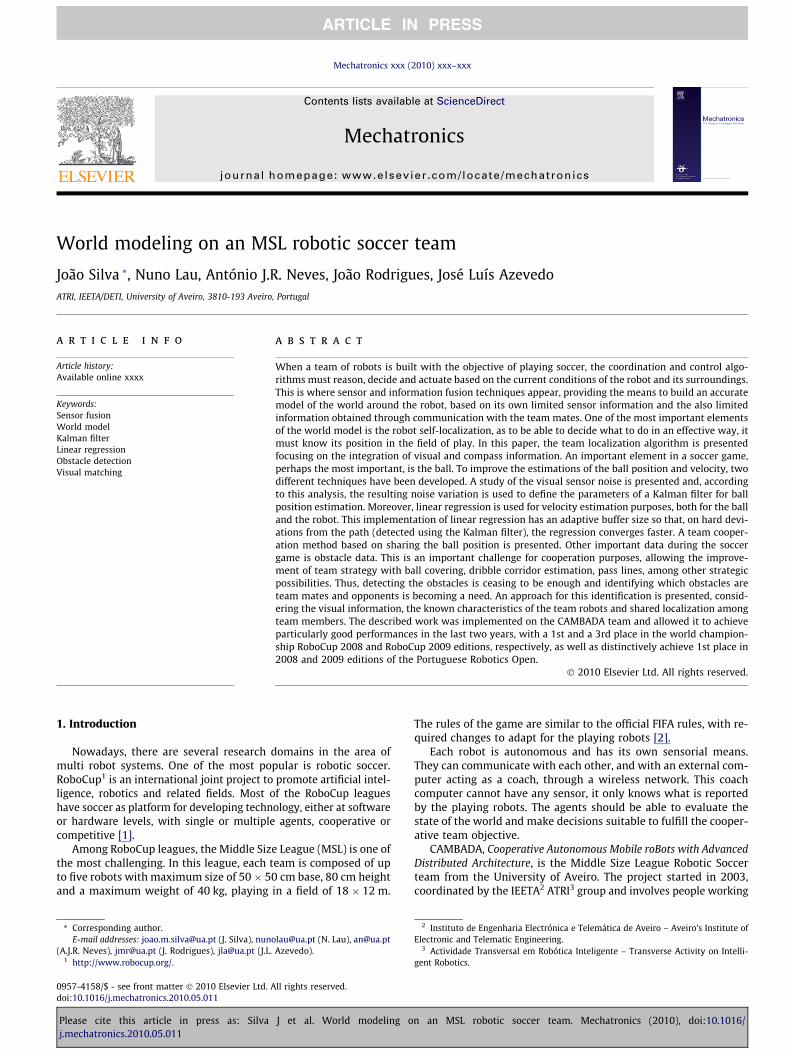
Fig. 1. Picture of the team robots used to obtain the results presented on this paper.
2 J. Silva et al. / Mechatronics xxx (2010) xxx–xxx
on several areas for building the mechanical structure of the robot,its hardware architecture and controllers and the software develop-ment in areas such as image analysis and processing, sensor andinformation fusion, reasoning and control (see Fig. 1).
This paper provides a description of some sensor and informa-tion fusion techniques and algorithms used in the CAMBADA team.The data obtained by these techniques are necessary for building aworld model of the robot environment. This paper includes thedescription of some of the elements of that model necessary for ateam of robots to play soccer. In Section 2, a brief overview of somerelated topics and work in sensor and information fusion for worldmodeling are presented. Section 3 presents the team self-localiza-tion description, introducing it as the first necessary step for all theother information fusion. In Section 4, the ball integration processis presented in all its components, starting with the ball position,its velocity and finally its sharing among team mates. Section 5presents an overview of obstacle treatment, with some visualdetection details, the matching of positions for visual identificationand the sharing of information among team mates. Finally, Section6 concludes the paper.
2. Related work
World modeling and sensor and information fusion are tightlyrelated, as the latest provide the means to build the desired model.Sensor and information fusion is the process of combining sensorydata, or data derived from sensory data, providing a resulting infor-mation that is better than would be possible when the sourceswere used individually [3]. One of the main areas where sensor fu-sion techniques are used is position tracking, both for self and ob-ject localization/tracking.
The integration of information over time in order to filter sensornoise is essential to get better estimates. This type of integrationmay be performed using Kalman filter based approaches, MonteCarlo methods or Markov approaches. Generally, Monte Carlo [4]approaches have better performance in cases where great discon-tinuities of the output values are expected, as the assumption ofGaussian probability density functions of the Kalman filter [5] isusually less accurate. However, Kalman filtering is a very effectivemethod if the assumptions of Gaussian noise can be met and thesystem can be linearized. Other common approaches are the useof the Extended and Unscented Kalman filters [6], which are pre-pared to deal with non-linear systems at the cost of more compu-tational weight.
A general overview of different methods of multi-sensor andinformation fusion is presented in [7], also with a brief descriptionof application areas, such as robotics, military, biomedical andtransportation. Applications in the robotics field include self-local-ization using either Kalman filter [8], Monte Carlo [9] or Markov[10] methods, or integration of information coming from severalrobots, to increase the accuracy of each of the robots position esti-
Please cite this article in press as: Silva J et al. World modeling oj.mechatronics.2010.05.011
mation [11]. A general recent overview of methods and architec-tures for multi-sensor data fusion can be found in [12].
Another recurrent problem nowadays is the fusion of visual andinertial sensors [13], where recent results have demonstrated thatthe visual tracking of objects may work at higher velocities and bemore robust if combined with information coming from inertialsensors [14] and also that ego-motion estimation can be more pre-cise and navigation more robust using these approaches [15].
Simultaneous Localization And Mapping (SLAM) is anothercommon application of sensor fusion techniques, as in many cases,autonomous robots have to map the environment rather than sim-ply localize themselves [16,17].
Particularly in RoboCup domain, several teams use this kind ofapproaches, not only for localization purposes, but also for positionestimation and tracking of objects, namely the ball and other ro-bots. Several teams have used Kalman filters for the ball positionestimation [18–21]. In [20,21], several information fusion methodsare compared for the integration of the ball position using severalobservers. In [21], the authors conclude that the Kalman reset filtershows the best performance.
Although using well known techniques, in this paper we pro-pose practical solutions for an efficient self-localization, ball infor-mation treatment and obstacle treatment for an MSL robotic soccerteam. As far as we know, no previous work has been publishedfocusing on these several important aspects of developing theworld model of an MSL soccer team.
3. Localization
Self-localization of the agent is an important issue for a soccerteam, as strategic moves and positioning must be defined by posi-tions on the field. In the MSL, the environment is partially known,as every agent knows exactly the layout of the game field but doesnot know the position of any other elements, either itself, other ro-bots or the ball. Given the known map, the agent has then to locateitself.
The CAMBADA team localization algorithm is based on the de-tected field lines, with fusion of information from the odometrysensors and an electronic compass. It is based on the approach de-scribed in [22], with some adaptations. It can be seen as an errorminimization task, with a derived measure of reliability of the cal-culated position so that a stochastic sensor fusion process can beapplied to increase the estimation accuracy [22].
From the center of the image (the center of the robot), radialsensors are created around the robot, each one represented by aline with a given angle. These are called scanlines. The image pro-cessing, in each cycle, returns a list of positions relative to the robotwhere the scanlines intercept the field line markings [23].
The idea is to analyze the detected line points, estimating a po-sition, and through an error function describe the fitness of theestimation. This is done by reducing the error of the matching
n an MSL robotic soccer team. Mechatronics (2010), doi:10.1016/
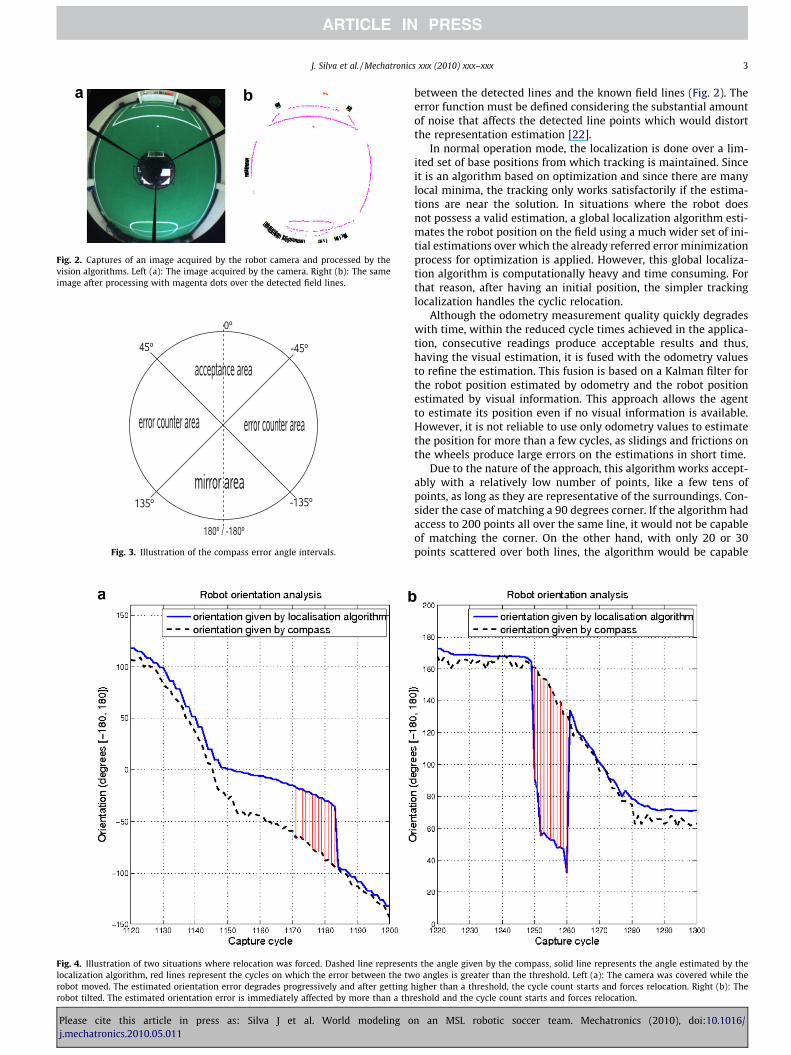
Fig. 2. Captures of an image acquired by the robot camera and processed by thevision algorithms. Left (a): The image acquired by the camera. Right (b): The sameimage after processing with magenta dots over the detected field lines.
Fig. 3. Illustration of the compass error angle intervals.
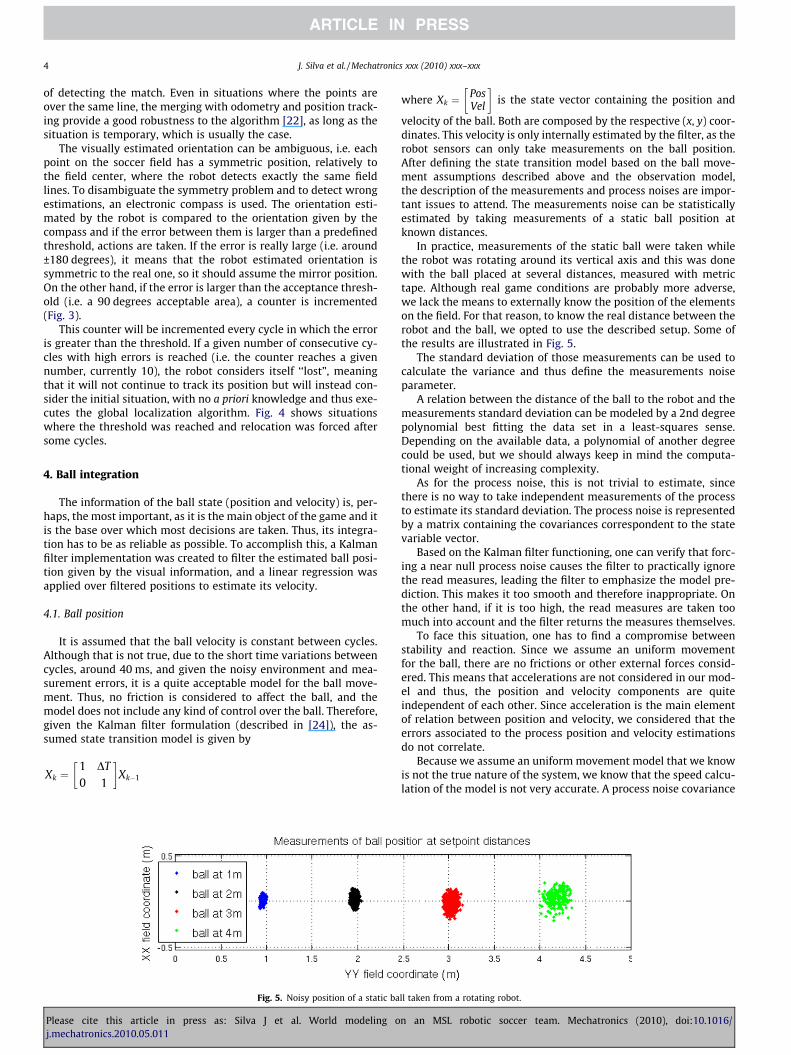
Fig. 4. Illustration of two situations where relocation was forced. Dashed line representlocalization algorithm, red lines represent the cycles on which the error between the twrobot moved. The estimated orientation error degrades progressively and after getting hrobot tilted. The estimated orientation error is immediately affected by more than a thr
J. Silva et al. / Mechatronics xxx (2010) xxx–xxx 3
Please cite this article in press as: Silva J et al. World modeling oj.mechatronics.2010.05.011
between the detected lines and the known field lines (Fig. 2). Theerror function must be defined considering the substantial amountof noise that affects the detected line points which would distortthe representation estimation [22].
In normal operation mode, the localization is done over a lim-ited set of base positions from which tracking is maintained. Sinceit is an algorithm based on optimization and since there are manylocal minima, the tracking only works satisfactorily if the estima-tions are near the solution. In situations where the robot doesnot possess a valid estimation, a global localization algorithm esti-mates the robot position on the field using a much wider set of ini-tial estimations over which the already referred error minimizationprocess for optimization is applied. However, this global localiza-tion algorithm is computationally heavy and time consuming. Forthat reason, after having an initial position, the simpler trackinglocalization handles the cyclic relocation.
Although the odometry measurement quality quickly degradeswith time, within the reduced cycle times achieved in the applica-tion, consecutive readings produce acceptable results and thus,having the visual estimation, it is fused with the odometry valuesto refine the estimation. This fusion is based on a Kalman filter forthe robot position estimated by odometry and the robot positionestimated by visual information. This approach allows the agentto estimate its position even if no visual information is available.However, it is not reliable to use only odometry values to estimatethe position for more than a few cycles, as slidings and frictions onthe wheels produce large errors on the estimations in short time.
Due to the nature of the approach, this algorithm works accept-ably with a relatively low number of points, like a few tens ofpoints, as long as they are representative of the surroundings. Con-sider the case of matching a 90 degrees corner. If the algorithm hadaccess to 200 points all over the same line, it would not be capableof matching the corner. On the other hand, with only 20 or 30points scattered over both lines, the algorithm would be capable
s the angle given by the compass, solid line represents the angle estimated by theo angles is greater than the threshold. Left (a): The camera was covered while theigher than a threshold, the cycle count starts and forces relocation. Right (b): The
eshold and the cycle count starts and forces relocation.
n an MSL robotic soccer team. Mechatronics (2010), doi:10.1016/
4 J. Silva et al. / Mechatronics xxx (2010) xxx–xxx
of detecting the match. Even in situations where the points areover the same line, the merging with odometry and position track-ing provide a good robustness to the algorithm [22], as long as thesituation is temporary, which is usually the case.
The visually estimated orientation can be ambiguous, i.e. eachpoint on the soccer field has a symmetric position, relatively tothe field center, where the robot detects exactly the same fieldlines. To disambiguate the symmetry problem and to detect wrongestimations, an electronic compass is used. The orientation esti-mated by the robot is compared to the orientation given by thecompass and if the error between them is larger than a predefinedthreshold, actions are taken. If the error is really large (i.e. around±180 degrees), it means that the robot estimated orientation issymmetric to the real one, so it should assume the mirror position.On the other hand, if the error is larger than the acceptance thresh-old (i.e. a 90 degrees acceptable area), a counter is incremented(Fig. 3).
This counter will be incremented every cycle in which the erroris greater than the threshold. If a given number of consecutive cy-cles with high errors is reached (i.e. the counter reaches a givennumber, currently 10), the robot considers itself ‘‘lost”, meaningthat it will not continue to track its position but will instead con-sider the initial situation, with no a priori knowledge and thus exe-cutes the global localization algorithm. Fig. 4 shows situationswhere the threshold was reached and relocation was forced aftersome cycles.
4. Ball integration
The information of the ball state (position and velocity) is, per-haps, the most important, as it is the main object of the game and itis the base over which most decisions are taken. Thus, its integra-tion has to be as reliable as possible. To accomplish this, a Kalmanfilter implementation was created to filter the estimated ball posi-tion given by the visual information, and a linear regression wasapplied over filtered positions to estimate its velocity.
4.1. Ball position
It is assumed that the ball velocity is constant between cycles.Although that is not true, due to the short time variations betweencycles, around 40 ms, and given the noisy environment and mea-surement errors, it is a quite acceptable model for the ball move-ment. Thus, no friction is considered to affect the ball, and themodel does not include any kind of control over the ball. Therefore,given the Kalman filter formulation (described in [24]), the as-sumed state transition model is given by
Xk ¼1 DT
0 1
� �Xk�1
Fig. 5. Noisy position of a static ba
Please cite this article in press as: Silva J et al. World modeling oj.mechatronics.2010.05.011
where Xk ¼PosVel
� �is the state vector containing the position and
velocity of the ball. Both are composed by the respective (x, y) coor-dinates. This velocity is only internally estimated by the filter, as therobot sensors can only take measurements on the ball position.After defining the state transition model based on the ball move-ment assumptions described above and the observation model,the description of the measurements and process noises are impor-tant issues to attend. The measurements noise can be statisticallyestimated by taking measurements of a static ball position atknown distances.
In practice, measurements of the static ball were taken whilethe robot was rotating around its vertical axis and this was donewith the ball placed at several distances, measured with metrictape. Although real game conditions are probably more adverse,we lack the means to externally know the position of the elementson the field. For that reason, to know the real distance between therobot and the ball, we opted to use the described setup. Some ofthe results are illustrated in Fig. 5.
The standard deviation of those measurements can be used tocalculate the variance and thus define the measurements noiseparameter.
A relation between the distance of the ball to the robot and themeasurements standard deviation can be modeled by a 2nd degreepolynomial best fitting the data set in a least-squares sense.Depending on the available data, a polynomial of another degreecould be used, but we should always keep in mind the computa-tional weight of increasing complexity.
As for the process noise, this is not trivial to estimate, sincethere is no way to take independent measurements of the processto estimate its standard deviation. The process noise is representedby a matrix containing the covariances correspondent to the statevariable vector.
Based on the Kalman filter functioning, one can verify that forc-ing a near null process noise causes the filter to practically ignorethe read measures, leading the filter to emphasize the model pre-diction. This makes it too smooth and therefore inappropriate. Onthe other hand, if it is too high, the read measures are taken toomuch into account and the filter returns the measures themselves.
To face this situation, one has to find a compromise betweenstability and reaction. Since we assume an uniform movementfor the ball, there are no frictions or other external forces consid-ered. This means that accelerations are not considered in our mod-el and thus, the position and velocity components are quiteindependent of each other. Since acceleration is the main elementof relation between position and velocity, we considered that theerrors associated to the process position and velocity estimationsdo not correlate.
Because we assume an uniform movement model that we knowis not the true nature of the system, we know that the speed calcu-lation of the model is not very accurate. A process noise covariance
ll taken from a rotating robot.
n an MSL robotic soccer team. Mechatronics (2010), doi:10.1016/
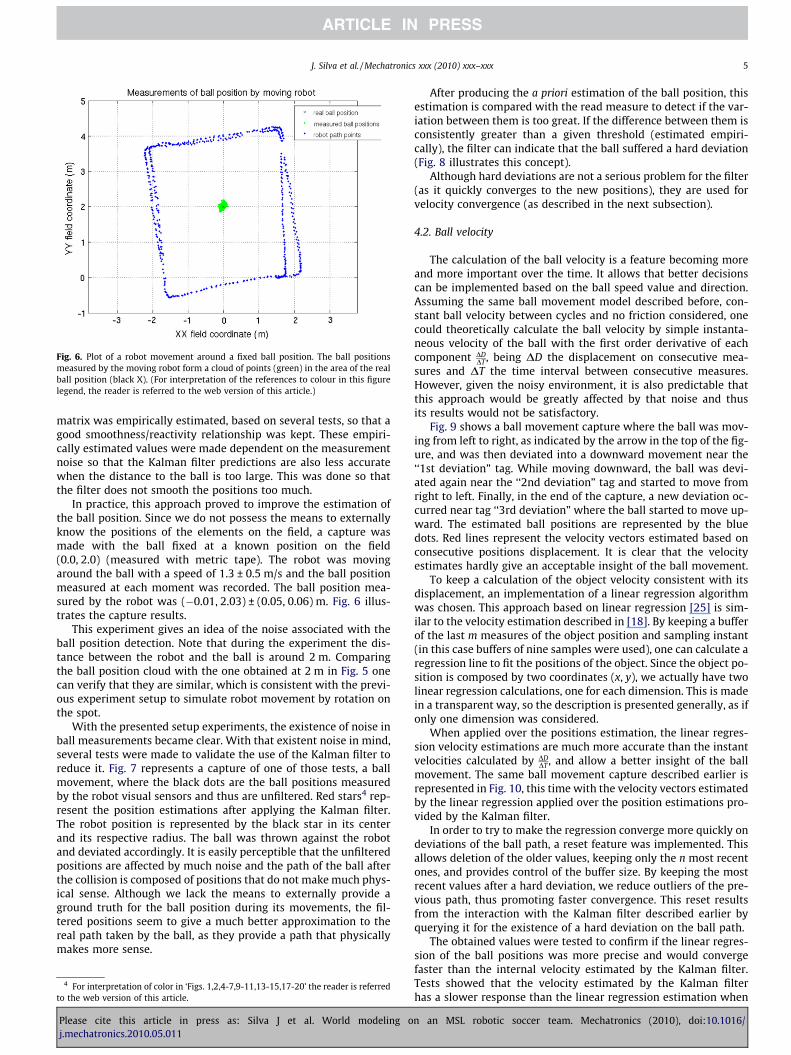
Fig. 6. Plot of a robot movement around a fixed ball position. The ball positionsmeasured by the moving robot form a cloud of points (green) in the area of the realball position (black X). (For interpretation of the references to colour in this figurelegend, the reader is referred to the web version of this article.)
J. Silva et al. / Mechatronics xxx (2010) xxx–xxx 5
matrix was empirically estimated, based on several tests, so that agood smoothness/reactivity relationship was kept. These empiri-cally estimated values were made dependent on the measurementnoise so that the Kalman filter predictions are also less accuratewhen the distance to the ball is too large. This was done so thatthe filter does not smooth the positions too much.
In practice, this approach proved to improve the estimation ofthe ball position. Since we do not possess the means to externallyknow the positions of the elements on the field, a capture wasmade with the ball fixed at a known position on the field(0.0, 2.0) (measured with metric tape). The robot was movingaround the ball with a speed of 1.3 ± 0.5 m/s and the ball positionmeasured at each moment was recorded. The ball position mea-sured by the robot was (�0.01, 2.03) ± (0.05, 0.06) m. Fig. 6 illus-trates the capture results.
This experiment gives an idea of the noise associated with theball position detection. Note that during the experiment the dis-tance between the robot and the ball is around 2 m. Comparingthe ball position cloud with the one obtained at 2 m in Fig. 5 onecan verify that they are similar, which is consistent with the previ-ous experiment setup to simulate robot movement by rotation onthe spot.
With the presented setup experiments, the existence of noise inball measurements became clear. With that existent noise in mind,several tests were made to validate the use of the Kalman filter toreduce it. Fig. 7 represents a capture of one of those tests, a ballmovement, where the black dots are the ball positions measuredby the robot visual sensors and thus are unfiltered. Red stars4 rep-resent the position estimations after applying the Kalman filter.The robot position is represented by the black star in its centerand its respective radius. The ball was thrown against the robotand deviated accordingly. It is easily perceptible that the unfilteredpositions are affected by much noise and the path of the ball afterthe collision is composed of positions that do not make much phys-ical sense. Although we lack the means to externally provide aground truth for the ball position during its movements, the fil-tered positions seem to give a much better approximation to thereal path taken by the ball, as they provide a path that physicallymakes more sense.
4 For interpretation of color in ‘Figs. 1,2,4-7,9-11,13-15,17-20’ the reader is referredto the web version of this article.
Please cite this article in press as: Silva J et al. World modeling oj.mechatronics.2010.05.011
After producing the a priori estimation of the ball position, thisestimation is compared with the read measure to detect if the var-iation between them is too great. If the difference between them isconsistently greater than a given threshold (estimated empiri-cally), the filter can indicate that the ball suffered a hard deviation(Fig. 8 illustrates this concept).
Although hard deviations are not a serious problem for the filter(as it quickly converges to the new positions), they are used forvelocity convergence (as described in the next subsection).
4.2. Ball velocity
The calculation of the ball velocity is a feature becoming moreand more important over the time. It allows that better decisionscan be implemented based on the ball speed value and direction.Assuming the same ball movement model described before, con-stant ball velocity between cycles and no friction considered, onecould theoretically calculate the ball velocity by simple instanta-neous velocity of the ball with the first order derivative of eachcomponent DD
DT , being DD the displacement on consecutive mea-sures and DT the time interval between consecutive measures.However, given the noisy environment, it is also predictable thatthis approach would be greatly affected by that noise and thusits results would not be satisfactory.
Fig. 9 shows a ball movement capture where the ball was mov-ing from left to right, as indicated by the arrow in the top of the fig-ure, and was then deviated into a downward movement near the‘‘1st deviation” tag. While moving downward, the ball was devi-ated again near the ‘‘2nd deviation” tag and started to move fromright to left. Finally, in the end of the capture, a new deviation oc-curred near tag ‘‘3rd deviation” where the ball started to move up-ward. The estimated ball positions are represented by the bluedots. Red lines represent the velocity vectors estimated based onconsecutive positions displacement. It is clear that the velocityestimates hardly give an acceptable insight of the ball movement.
To keep a calculation of the object velocity consistent with itsdisplacement, an implementation of a linear regression algorithmwas chosen. This approach based on linear regression [25] is sim-ilar to the velocity estimation described in [18]. By keeping a bufferof the last m measures of the object position and sampling instant(in this case buffers of nine samples were used), one can calculate aregression line to fit the positions of the object. Since the object po-sition is composed by two coordinates (x, y), we actually have twolinear regression calculations, one for each dimension. This is madein a transparent way, so the description is presented generally, as ifonly one dimension was considered.
When applied over the positions estimation, the linear regres-sion velocity estimations are much more accurate than the instantvelocities calculated by DD
DT , and allow a better insight of the ballmovement. The same ball movement capture described earlier isrepresented in Fig. 10, this time with the velocity vectors estimatedby the linear regression applied over the position estimations pro-vided by the Kalman filter.
In order to try to make the regression converge more quickly ondeviations of the ball path, a reset feature was implemented. Thisallows deletion of the older values, keeping only the n most recentones, and provides control of the buffer size. By keeping the mostrecent values after a hard deviation, we reduce outliers of the pre-vious path, thus promoting faster convergence. This reset resultsfrom the interaction with the Kalman filter described earlier byquerying it for the existence of a hard deviation on the ball path.
The obtained values were tested to confirm if the linear regres-sion of the ball positions was more precise and would convergefaster than the internal velocity estimated by the Kalman filter.Tests showed that the velocity estimated by the Kalman filterhas a slower response than the linear regression estimation when
n an MSL robotic soccer team. Mechatronics (2010), doi:10.1016/
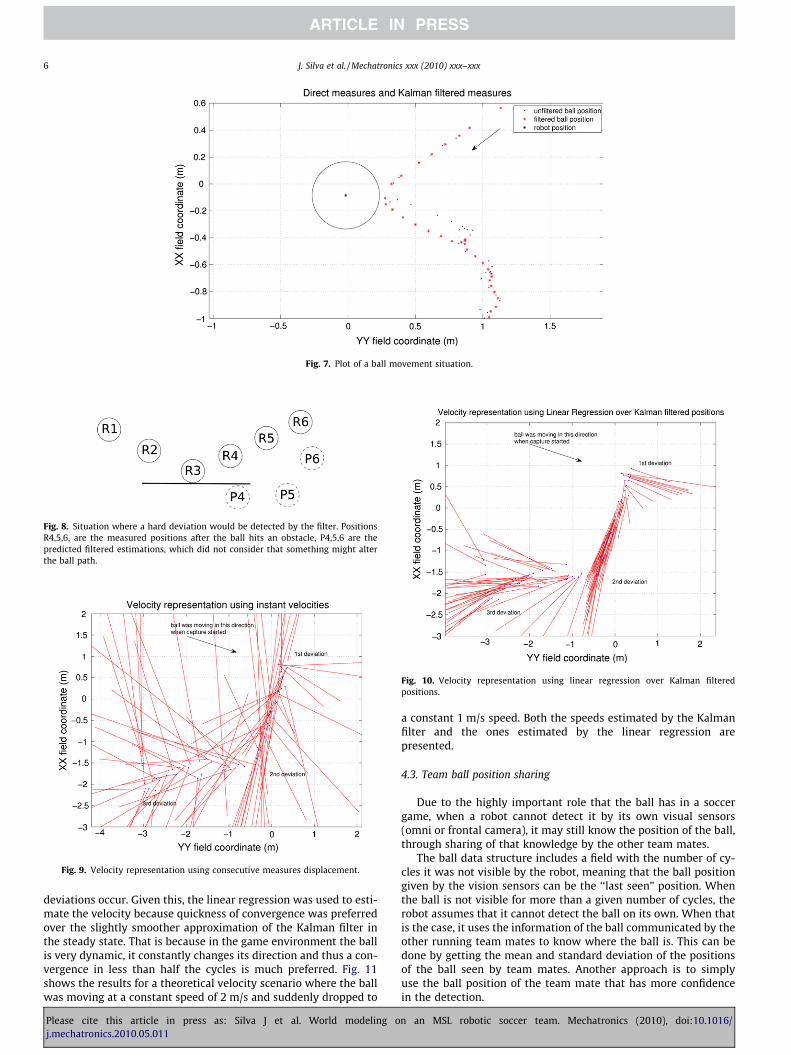
Fig. 8. Situation where a hard deviation would be detected by the filter. PositionsR4,5,6, are the measured positions after the ball hits an obstacle, P4,5,6 are thepredicted filtered estimations, which did not consider that something might alterthe ball path.
Fig. 9. Velocity representation using consecutive measures displacement.
Fig. 10. Velocity representation using linear regression over Kalman filteredpositions.
Fig. 7. Plot of a ball movement situation.
6 J. Silva et al. / Mechatronics xxx (2010) xxx–xxx
deviations occur. Given this, the linear regression was used to esti-mate the velocity because quickness of convergence was preferredover the slightly smoother approximation of the Kalman filter inthe steady state. That is because in the game environment the ballis very dynamic, it constantly changes its direction and thus a con-vergence in less than half the cycles is much preferred. Fig. 11shows the results for a theoretical velocity scenario where the ballwas moving at a constant speed of 2 m/s and suddenly dropped to
Please cite this article in press as: Silva J et al. World modeling oj.mechatronics.2010.05.011
a constant 1 m/s speed. Both the speeds estimated by the Kalmanfilter and the ones estimated by the linear regression arepresented.
4.3. Team ball position sharing
Due to the highly important role that the ball has in a soccergame, when a robot cannot detect it by its own visual sensors(omni or frontal camera), it may still know the position of the ball,through sharing of that knowledge by the other team mates.
The ball data structure includes a field with the number of cy-cles it was not visible by the robot, meaning that the ball positiongiven by the vision sensors can be the ‘‘last seen” position. Whenthe ball is not visible for more than a given number of cycles, therobot assumes that it cannot detect the ball on its own. When thatis the case, it uses the information of the ball communicated by theother running team mates to know where the ball is. This can bedone by getting the mean and standard deviation of the positionsof the ball seen by team mates. Another approach is to simplyuse the ball position of the team mate that has more confidencein the detection.
n an MSL robotic soccer team. Mechatronics (2010), doi:10.1016/
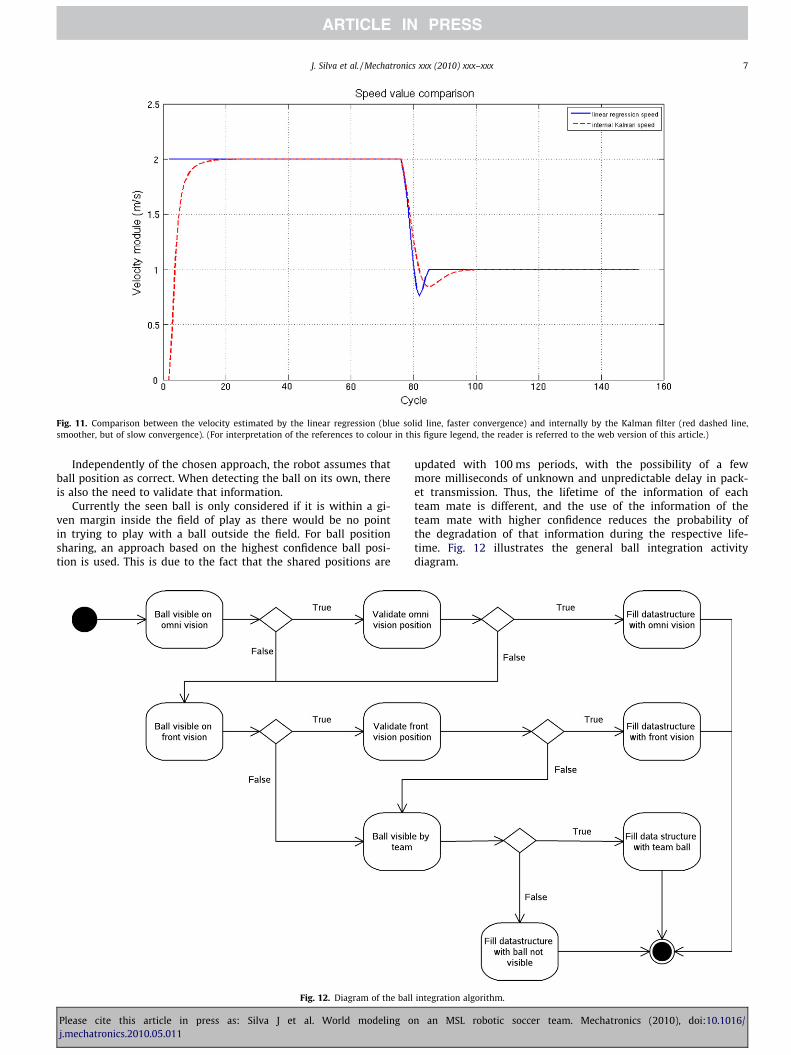
Fig. 11. Comparison between the velocity estimated by the linear regression (blue solid line, faster convergence) and internally by the Kalman filter (red dashed line,smoother, but of slow convergence). (For interpretation of the references to colour in this figure legend, the reader is referred to the web version of this article.)
J. Silva et al. / Mechatronics xxx (2010) xxx–xxx 7
Independently of the chosen approach, the robot assumes thatball position as correct. When detecting the ball on its own, thereis also the need to validate that information.
Currently the seen ball is only considered if it is within a gi-ven margin inside the field of play as there would be no pointin trying to play with a ball outside the field. For ball positionsharing, an approach based on the highest confidence ball posi-tion is used. This is due to the fact that the shared positions are
Fig. 12. Diagram of the ball
Please cite this article in press as: Silva J et al. World modeling oj.mechatronics.2010.05.011
updated with 100 ms periods, with the possibility of a fewmore milliseconds of unknown and unpredictable delay in pack-et transmission. Thus, the lifetime of the information of eachteam mate is different, and the use of the information of theteam mate with higher confidence reduces the probability ofthe degradation of that information during the respective life-time. Fig. 12 illustrates the general ball integration activitydiagram.
integration algorithm.
n an MSL robotic soccer team. Mechatronics (2010), doi:10.1016/
8 J. Silva et al. / Mechatronics xxx (2010) xxx–xxx
5. Obstacle treatment
While playing soccer, the robots have the need to navigatearound the field effectively, which means they have to repositionthemselves or dribble the ball avoiding the obstacles on the field,that can be either team or opponent robots, or eventually thereferee.
An increasing necessity felt by the team, to improve its perfor-mance, is a better obstacle detection and sharing of obstacle infor-mation among team mates. This is important to ensure a globalidea of the field occupancy, since the team formation usually keepsthe robots spread across the field. Pass lines and dribbling corridorscan be estimated more easily with a good coverage of field obsta-cles, allowing improvements on team strategy and coordination.
5.1. Visual obstacle detection
The CAMBADA robots gather their information about the sur-roundings by means of a robotic vision system. Currently, onlythe omni directional camera gathers information about obstacles,as no frontal camera is being used at this time.
According to RoboCup rules, the robots are mainly black. Sinceduring the game robots play autonomously, all obstacles in the
Fig. 13. Captures of an image acquired by the robot camera and processed by thevision algorithms. The areas of interest were surrounded. (a) The image acquired bythe camera. (b) The same image after processing. Obstacles are identified by theircenter (triangle), left and right limits (squares). It is visible that the two alignedobstacles are detected as a single larger obstacle (top right of the frames).
Fig. 14. Relation between pixels and metric distances. The center of the robot is con
Please cite this article in press as: Silva J et al. World modeling oj.mechatronics.2010.05.011
field are the robots themselves (occasionally the referee, which isrecommended to wear black/dark pants). The vision algorithm de-tects the obstacles by evaluating blobs of black color inside thefield of play [26]. Through the mapping of image positions to realmetric positions [27], obstacles are identified by their center (tri-angle on the processed image, Fig. 13b) and left and right limits(squares on the processed image, Fig. 13b). This is done by search-ing black regions on the scanlines of the vision algorithm [23], al-ready referred in Section 3.
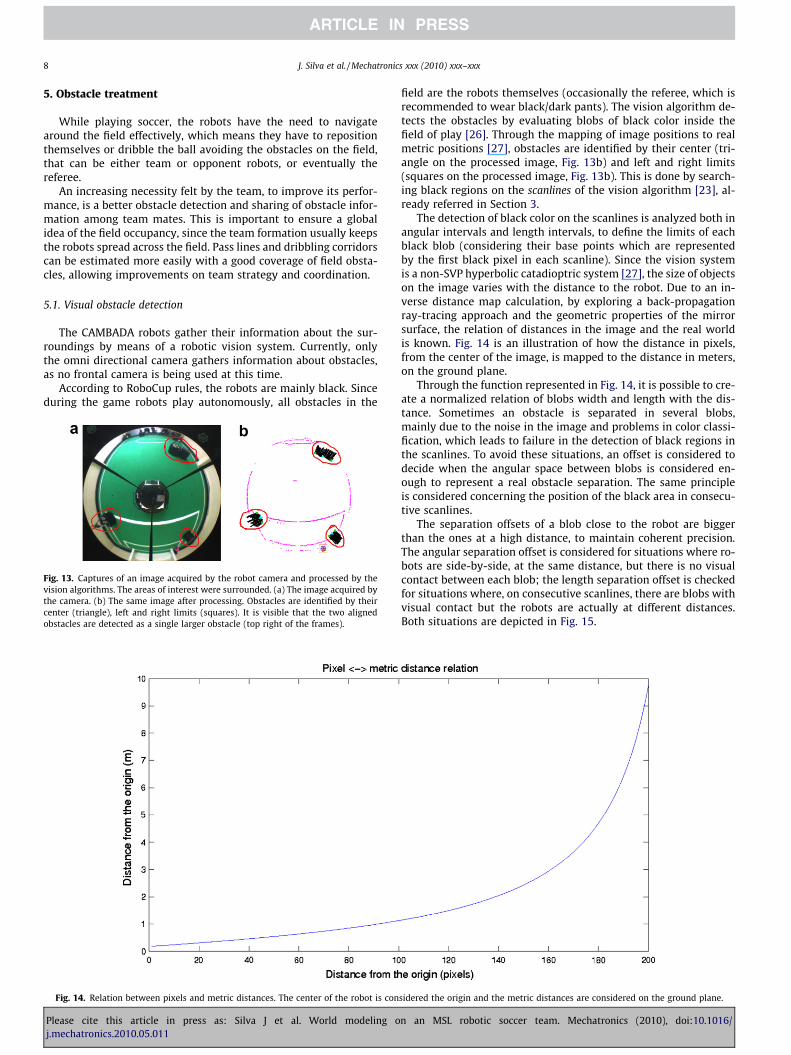
The detection of black color on the scanlines is analyzed both inangular intervals and length intervals, to define the limits of eachblack blob (considering their base points which are representedby the first black pixel in each scanline). Since the vision systemis a non-SVP hyperbolic catadioptric system [27], the size of objectson the image varies with the distance to the robot. Due to an in-verse distance map calculation, by exploring a back-propagationray-tracing approach and the geometric properties of the mirrorsurface, the relation of distances in the image and the real worldis known. Fig. 14 is an illustration of how the distance in pixels,from the center of the image, is mapped to the distance in meters,on the ground plane.
Through the function represented in Fig. 14, it is possible to cre-ate a normalized relation of blobs width and length with the dis-tance. Sometimes an obstacle is separated in several blobs,mainly due to the noise in the image and problems in color classi-fication, which leads to failure in the detection of black regions inthe scanlines. To avoid these situations, an offset is considered todecide when the angular space between blobs is considered en-ough to represent a real obstacle separation. The same principleis considered concerning the position of the black area in consecu-tive scanlines.
The separation offsets of a blob close to the robot are biggerthan the ones at a high distance, to maintain coherent precision.The angular separation offset is considered for situations where ro-bots are side-by-side, at the same distance, but there is no visualcontact between each blob; the length separation offset is checkedfor situations where, on consecutive scanlines, there are blobs withvisual contact but the robots are actually at different distances.Both situations are depicted in Fig. 15.
sidered the origin and the metric distances are considered on the ground plane.
n an MSL robotic soccer team. Mechatronics (2010), doi:10.1016/
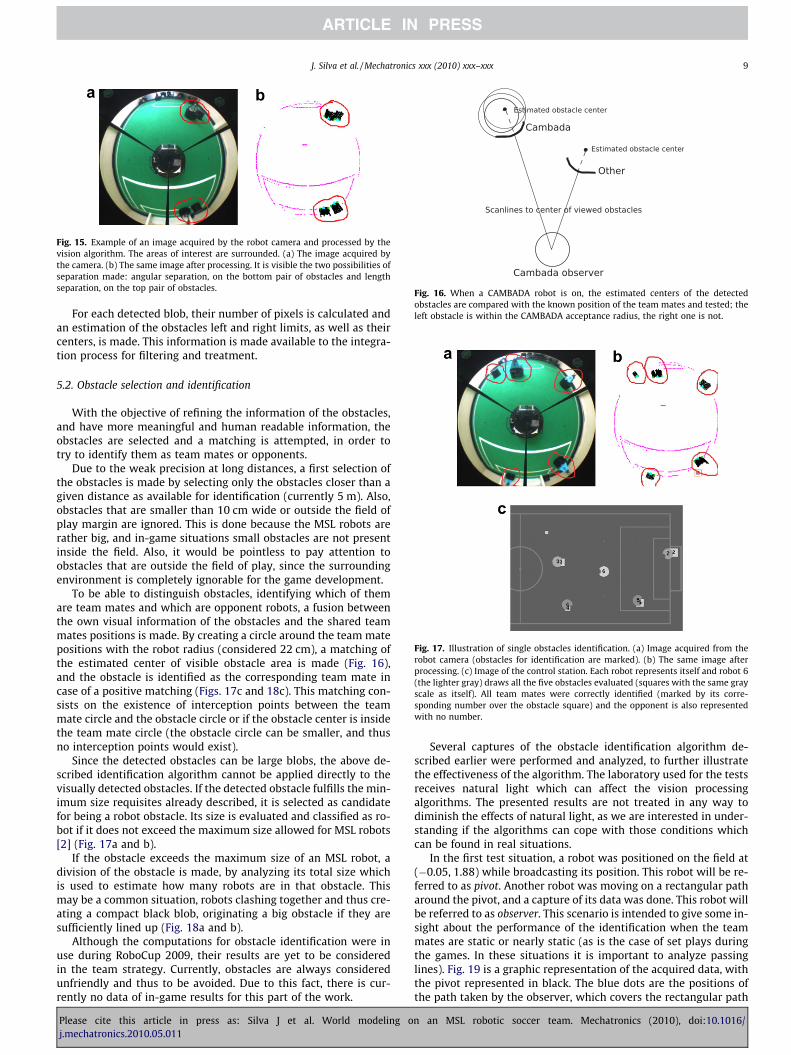
Fig. 15. Example of an image acquired by the robot camera and processed by thevision algorithm. The areas of interest are surrounded. (a) The image acquired bythe camera. (b) The same image after processing. It is visible the two possibilities ofseparation made: angular separation, on the bottom pair of obstacles and lengthseparation, on the top pair of obstacles.
Fig. 16. When a CAMBADA robot is on, the estimated centers of the detectedobstacles are compared with the known position of the team mates and tested; theleft obstacle is within the CAMBADA acceptance radius, the right one is not.
Fig. 17. Illustration of single obstacles identification. (a) Image acquired from therobot camera (obstacles for identification are marked). (b) The same image afterprocessing. (c) Image of the control station. Each robot represents itself and robot 6(the lighter gray) draws all the five obstacles evaluated (squares with the same grayscale as itself). All team mates were correctly identified (marked by its corre-sponding number over the obstacle square) and the opponent is also representedwith no number.
J. Silva et al. / Mechatronics xxx (2010) xxx–xxx 9
For each detected blob, their number of pixels is calculated andan estimation of the obstacles left and right limits, as well as theircenters, is made. This information is made available to the integra-tion process for filtering and treatment.
5.2. Obstacle selection and identification
With the objective of refining the information of the obstacles,and have more meaningful and human readable information, theobstacles are selected and a matching is attempted, in order totry to identify them as team mates or opponents.
Due to the weak precision at long distances, a first selection ofthe obstacles is made by selecting only the obstacles closer than agiven distance as available for identification (currently 5 m). Also,obstacles that are smaller than 10 cm wide or outside the field ofplay margin are ignored. This is done because the MSL robots arerather big, and in-game situations small obstacles are not presentinside the field. Also, it would be pointless to pay attention toobstacles that are outside the field of play, since the surroundingenvironment is completely ignorable for the game development.
To be able to distinguish obstacles, identifying which of themare team mates and which are opponent robots, a fusion betweenthe own visual information of the obstacles and the shared teammates positions is made. By creating a circle around the team matepositions with the robot radius (considered 22 cm), a matching ofthe estimated center of visible obstacle area is made (Fig. 16),and the obstacle is identified as the corresponding team mate incase of a positive matching (Figs. 17c and 18c). This matching con-sists on the existence of interception points between the teammate circle and the obstacle circle or if the obstacle center is insidethe team mate circle (the obstacle circle can be smaller, and thusno interception points would exist).
Since the detected obstacles can be large blobs, the above de-scribed identification algorithm cannot be applied directly to thevisually detected obstacles. If the detected obstacle fulfills the min-imum size requisites already described, it is selected as candidatefor being a robot obstacle. Its size is evaluated and classified as ro-bot if it does not exceed the maximum size allowed for MSL robots[2] (Fig. 17a and b).
If the obstacle exceeds the maximum size of an MSL robot, adivision of the obstacle is made, by analyzing its total size whichis used to estimate how many robots are in that obstacle. Thismay be a common situation, robots clashing together and thus cre-ating a compact black blob, originating a big obstacle if they aresufficiently lined up (Fig. 18a and b).
Although the computations for obstacle identification were inuse during RoboCup 2009, their results are yet to be consideredin the team strategy. Currently, obstacles are always consideredunfriendly and thus to be avoided. Due to this fact, there is cur-rently no data of in-game results for this part of the work.
Please cite this article in press as: Silva J et al. World modeling oj.mechatronics.2010.05.011
Several captures of the obstacle identification algorithm de-scribed earlier were performed and analyzed, to further illustratethe effectiveness of the algorithm. The laboratory used for the testsreceives natural light which can affect the vision processingalgorithms. The presented results are not treated in any way todiminish the effects of natural light, as we are interested in under-standing if the algorithms can cope with those conditions whichcan be found in real situations.
In the first test situation, a robot was positioned on the field at(�0.05, 1.88) while broadcasting its position. This robot will be re-ferred to as pivot. Another robot was moving on a rectangular patharound the pivot, and a capture of its data was done. This robot willbe referred to as observer. This scenario is intended to give some in-sight about the performance of the identification when the teammates are static or nearly static (as is the case of set plays duringthe games. In these situations it is important to analyze passinglines). Fig. 19 is a graphic representation of the acquired data, withthe pivot represented in black. The blue dots are the positions ofthe path taken by the observer, which covers the rectangular path
n an MSL robotic soccer team. Mechatronics (2010), doi:10.1016/
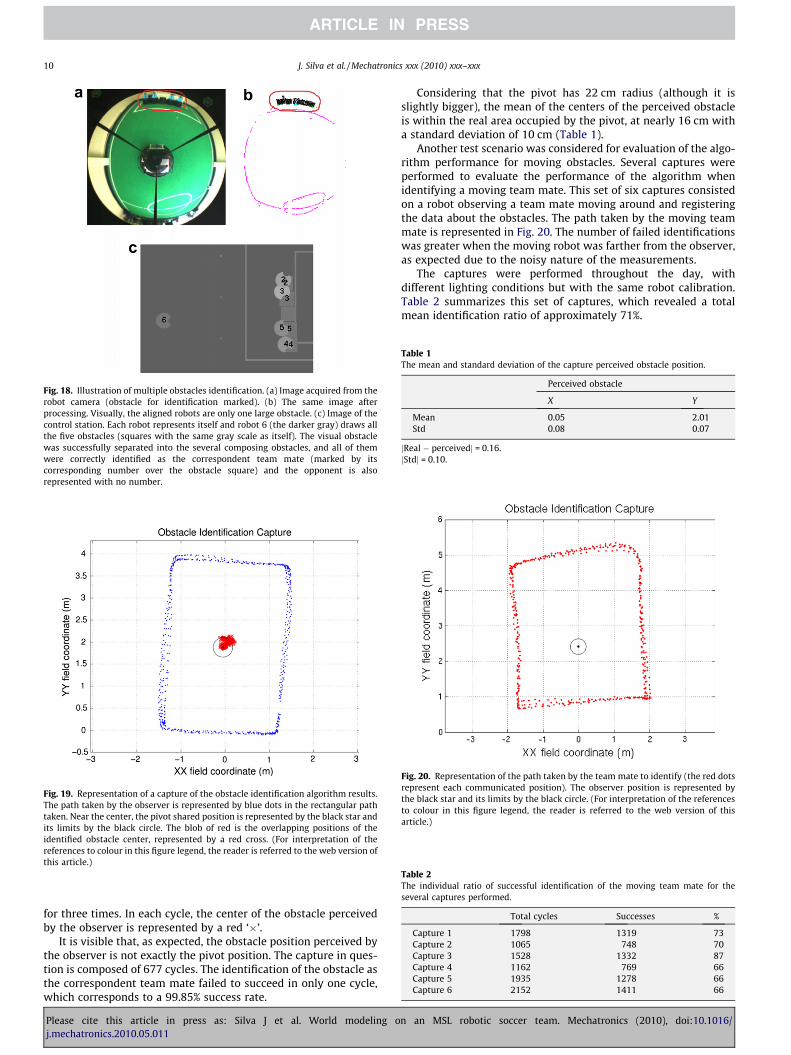
Fig. 18. Illustration of multiple obstacles identification. (a) Image acquired from therobot camera (obstacle for identification marked). (b) The same image afterprocessing. Visually, the aligned robots are only one large obstacle. (c) Image of thecontrol station. Each robot represents itself and robot 6 (the darker gray) draws allthe five obstacles (squares with the same gray scale as itself). The visual obstaclewas successfully separated into the several composing obstacles, and all of themwere correctly identified as the correspondent team mate (marked by itscorresponding number over the obstacle square) and the opponent is alsorepresented with no number.
Fig. 19. Representation of a capture of the obstacle identification algorithm results.The path taken by the observer is represented by blue dots in the rectangular pathtaken. Near the center, the pivot shared position is represented by the black star andits limits by the black circle. The blob of red is the overlapping positions of theidentified obstacle center, represented by a red cross. (For interpretation of thereferences to colour in this figure legend, the reader is referred to the web version ofthis article.)
Table 1The mean and standard deviation of the capture perceived obstacle position.
Perceived obstacle
X Y
Mean 0.05 2.01Std 0.08 0.07
jReal � perceivedj = 0.16.jStdj = 0.10.
Fig. 20. Representation of the path taken by the team mate to identify (the red dotsrepresent each communicated position). The observer position is represented bythe black star and its limits by the black circle. (For interpretation of the referencesto colour in this figure legend, the reader is referred to the web version of thisarticle.)
Table 2The individual ratio of successful identification of the moving team mate for theseveral captures performed.
Total cycles Successes %
Capture 1 1798 1319 73Capture 2 1065 748 70Capture 3 1528 1332 87Capture 4 1162 769 66Capture 5 1935 1278 66Capture 6 2152 1411 66
10 J. Silva et al. / Mechatronics xxx (2010) xxx–xxx
for three times. In each cycle, the center of the obstacle perceivedby the observer is represented by a red ‘�’.
It is visible that, as expected, the obstacle position perceived bythe observer is not exactly the pivot position. The capture in ques-tion is composed of 677 cycles. The identification of the obstacle asthe correspondent team mate failed to succeed in only one cycle,which corresponds to a 99.85% success rate.
Please cite this article in press as: Silva J et al. World modeling oj.mechatronics.2010.05.011
Considering that the pivot has 22 cm radius (although it isslightly bigger), the mean of the centers of the perceived obstacleis within the real area occupied by the pivot, at nearly 16 cm witha standard deviation of 10 cm (Table 1).
Another test scenario was considered for evaluation of the algo-rithm performance for moving obstacles. Several captures wereperformed to evaluate the performance of the algorithm whenidentifying a moving team mate. This set of six captures consistedon a robot observing a team mate moving around and registeringthe data about the obstacles. The path taken by the moving teammate is represented in Fig. 20. The number of failed identificationswas greater when the moving robot was farther from the observer,as expected due to the noisy nature of the measurements.
The captures were performed throughout the day, withdifferent lighting conditions but with the same robot calibration.Table 2 summarizes this set of captures, which revealed a totalmean identification ratio of approximately 71%.
n an MSL robotic soccer team. Mechatronics (2010), doi:10.1016/
J. Silva et al. / Mechatronics xxx (2010) xxx–xxx 11
5.3. Obstacle sharing
With the purpose of improving the global perception of theteam robots, the sharing of locally known information is an impor-tant feature. Obstacle sharing allows the team robots to have amore global perception of the field occupancy, allowing them toestimate, for instance, passing and dribbling corridors moreeffectively.
However, one has to keep in mind that, mainly due to illumina-tion conditions and eventual reflective materials, some of the de-tected obstacles may not be exactly robots, but dark shadowyareas. If that is the case, the simple sharing of obstacles wouldpropagate an eventually false obstacle among the team. Thus thealgorithm for sharing the obstacles makes a fusion of the severalteam mates information.
The fusion of the information is done mate by mate. After build-ing the worldstate by its own means, the agent checks all the avail-able obstacle information provided by team mates, one by one.Their obstacles are matched with the own ones. If the agent doesnot know an obstacle shared by the team mate, it keeps it in a tem-porary list of unconfirmed obstacles. This is done to all the teammates obstacles. When another team mate shares a commonobstacle, that same obstacle is confirmed and is transferred tothe local list of obstacles. In the current cycle, the temporary obsta-cles that were not confirmed are not considered. A robot does notuse negative information from other robots to remove obstacles itactually saw from its local world model. An outline of the algo-rithm is presented next.
for c:=1 to total_number_of_team_matesfor o:=1 to total_obstacles_of_team_matefor m:=1 to total_own_obstaclesif m matches o
I already know this obstacle, do nothing
else
if previously known by another team mate
obstacle confirmed and added
else
obstacle considered temporarily
waits for confirmation by another team
mate
endif
endif
endfor
endfor
endfor
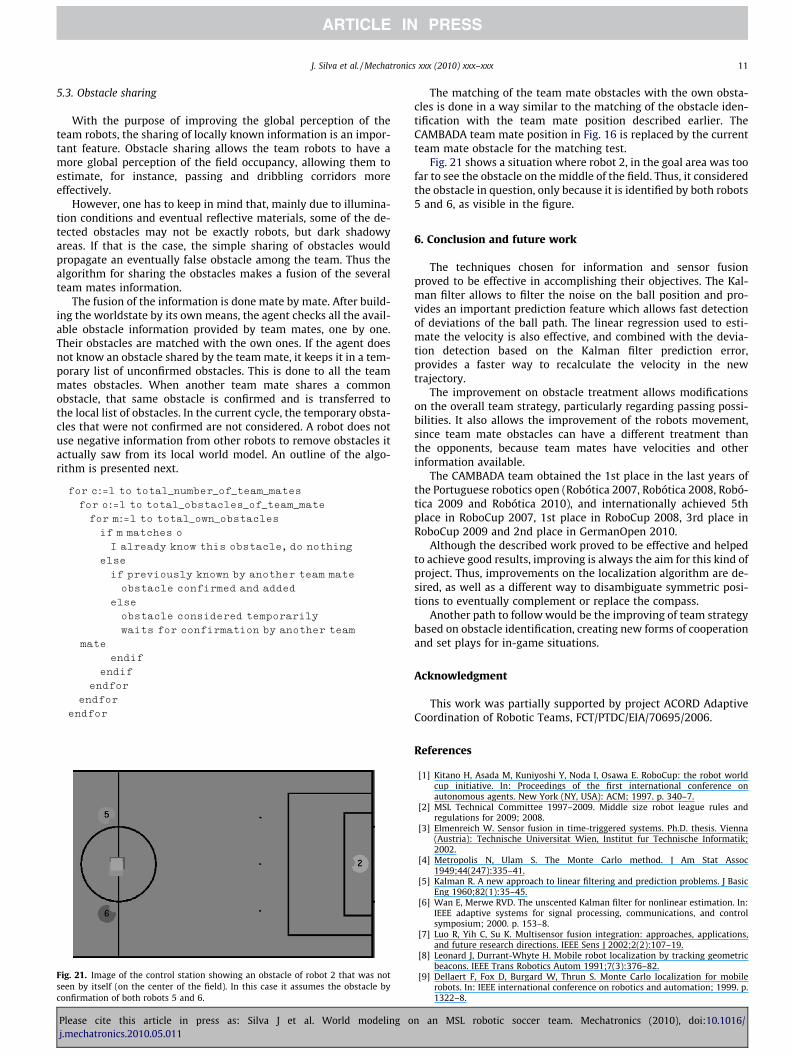
Fig. 21. Image of the control station showing an obstacle of robot 2 that was notseen by itself (on the center of the field). In this case it assumes the obstacle byconfirmation of both robots 5 and 6.
Please cite this article in press as: Silva J et al. World modeling oj.mechatronics.2010.05.011
The matching of the team mate obstacles with the own obsta-cles is done in a way similar to the matching of the obstacle iden-tification with the team mate position described earlier. TheCAMBADA team mate position in Fig. 16 is replaced by the currentteam mate obstacle for the matching test.
Fig. 21 shows a situation where robot 2, in the goal area was toofar to see the obstacle on the middle of the field. Thus, it consideredthe obstacle in question, only because it is identified by both robots5 and 6, as visible in the figure.
6. Conclusion and future work
The techniques chosen for information and sensor fusionproved to be effective in accomplishing their objectives. The Kal-man filter allows to filter the noise on the ball position and pro-vides an important prediction feature which allows fast detectionof deviations of the ball path. The linear regression used to esti-mate the velocity is also effective, and combined with the devia-tion detection based on the Kalman filter prediction error,provides a faster way to recalculate the velocity in the newtrajectory.
The improvement on obstacle treatment allows modificationson the overall team strategy, particularly regarding passing possi-bilities. It also allows the improvement of the robots movement,since team mate obstacles can have a different treatment thanthe opponents, because team mates have velocities and otherinformation available.
The CAMBADA team obtained the 1st place in the last years ofthe Portuguese robotics open (Robótica 2007, Robótica 2008, Robó-tica 2009 and Robótica 2010), and internationally achieved 5thplace in RoboCup 2007, 1st place in RoboCup 2008, 3rd place inRoboCup 2009 and 2nd place in GermanOpen 2010.
Although the described work proved to be effective and helpedto achieve good results, improving is always the aim for this kind ofproject. Thus, improvements on the localization algorithm are de-sired, as well as a different way to disambiguate symmetric posi-tions to eventually complement or replace the compass.
Another path to follow would be the improving of team strategybased on obstacle identification, creating new forms of cooperationand set plays for in-game situations.
Acknowledgment
This work was partially supported by project ACORD AdaptiveCoordination of Robotic Teams, FCT/PTDC/EIA/70695/2006.
References
[1] Kitano H, Asada M, Kuniyoshi Y, Noda I, Osawa E. RoboCup: the robot worldcup initiative. In: Proceedings of the first international conference onautonomous agents. New York (NY, USA): ACM; 1997. p. 340–7.
[2] MSL Technical Committee 1997–2009. Middle size robot league rules andregulations for 2009; 2008.
[3] Elmenreich W. Sensor fusion in time-triggered systems. Ph.D. thesis. Vienna(Austria): Technische Universitat Wien, Institut fur Technische Informatik;2002.
[4] Metropolis N, Ulam S. The Monte Carlo method. J Am Stat Assoc1949;44(247):335–41.
[5] Kalman R. A new approach to linear filtering and prediction problems. J BasicEng 1960;82(1):35–45.
[6] Wan E, Merwe RVD. The unscented Kalman filter for nonlinear estimation. In:IEEE adaptive systems for signal processing, communications, and controlsymposium; 2000. p. 153–8.
[7] Luo R, Yih C, Su K. Multisensor fusion integration: approaches, applications,and future research directions. IEEE Sens J 2002;2(2):107–19.
[8] Leonard J, Durrant-Whyte H. Mobile robot localization by tracking geometricbeacons. IEEE Trans Robotics Autom 1991;7(3):376–82.
[9] Dellaert F, Fox D, Burgard W, Thrun S. Monte Carlo localization for mobilerobots. In: IEEE international conference on robotics and automation; 1999. p.1322–8.
n an MSL robotic soccer team. Mechatronics (2010), doi:10.1016/
12 J. Silva et al. / Mechatronics xxx (2010) xxx–xxx
[10] Fox D, Burgard W, Thrun S. Markov localization for mobile robots in dynamicenvironments. J Artif Intell Res 1999;11:391–427.
[11] Mourikis A, Roumeliotis S. Performance analysis of multirobot cooperativelocalization. IEEE Trans Robotics 2006;22(4):666–81.
[12] Durrant-Whyte H, Henderson T. Multisensor data fusion. In: Siciliano B, KhatibO, editors. Springer handbook of robotics. Springer; 2008.
[13] Bejczy A, Dias J. Editorial: integration of visual and inertial sensors. J RoboticSyst 2004;21(2):41–2.
[14] Alenyá G, Martínez E, Torras C. Fusing visual and inertial sensing to recoverrobot ego-motion. J Robotic Syst 2004;21(1):23–32.
[15] Chroust S, Vincze M. Fusion of vision and inertial data for motion and structureestimation. J Robotic Syst 2004;21(2):73–83.
[16] Thrun WBS, Fox D. Probabilistic robotics. The MIT Press; 2005.[17] Siciliano B, Khatib O. Springer handbook of robotics. Springer; 2008.[18] Lauer M, Lange S, Riedmiller M. Modeling moving objects in a dynamically
changing robot application. In: Furbach U, editor. KI 2005: advances inartificial intelligence. Lecture notes in computer science, vol. 3698. Springer;2005. p. 291–303.
[19] Xu Y, Jiang C, Tan Y. SEU-3D 2006 soccer simulation team description. In: CDproc of RoboCup symposium 2006, Bremen, Germany; 2006.
[20] Marcelino P, Nunes P, Lima P, Ribeiro MI. Improving object localizationthrough sensor fusion applied to soccer robots. In: Proc scientificmeeting of the portuguese robotics open – Robótica 2003, Lisbon, Portugal;2003.
Please cite this article in press as: Silva J et al. World modeling oj.mechatronics.2010.05.011
[21] Ferrein A, Hermanns L, Lakemeyer G. Comparing sensor fusion techniques forball position estimation. In: Bredenfeld A, Jacoff A, Noda I, Takahashi Y, editors.RoboCup 2005: robot soccer world cup IX. Lecture notes in computer science,vol. 4020. Springer; 2006. p. 154–65.
[22] Lauer M, Lange S, Riedmiller M. Calculating the perfect match: an efficient andaccurate approach for robot self-localization. In: Bredenfeld A, Jacoff A, Noda I,Takahashi Y, editors. RoboCup 2005: robot soccer world cup IX. Lecture notesin computer science, vol. 4020. Springer; 2006. p. 142–53.
[23] Neves A, Martins D, Pinho A. A hybrid vision system for soccer robots usingradial search lines. In: Lopes LS, Silva F, Santos V, editors. Proc of the 8thconference on autonomous robot systems and competitions, Portugueserobotics open – Robótica 2008, Aveiro, Portugal; 2008. p. 51–5.
[24] Bishop G, Welch G. An introduction to the Kalman filter. In: Proc of SIGGRAPH,Course 8, No. NC 27599-3175. NC (USA): Chapel Hill; 2001.
[25] Motulsky H, Christopoulos A. Fitting models to biological data using linear andnonlinear regression. GraphPad Software Inc.; 2003.
[26] Neves A, Corrente G, Pinho A. An omnidirectional vision system for soccerrobots. In: Neves J, Santos MF, Machado JM, editors. Progress in artificialintelligence. Lecture notes in artificial intelligence, vol. 4874. Springer; 2007.p. 499–507.
[27] Cunha B, Azevedo J, Lau N, Almeida L. Obtaining the inverse distance map froma non-SVP hyperbolic catadioptric robotic vision system. In: Visser U, Ribeiro F,Ohashi T, Dellaert F, editors. RoboCup 2007: robot soccer world cup XI. Lecturenotes in artificial intelligence, vol. 5001. Springer; 2008. p. 417–24.
n an MSL robotic soccer team. Mechatronics (2010), doi:10.1016/
Related Documents