WORLD MIGRATION REPORT 2018: CHAPTER 2

Welcome message from author
This document is posted to help you gain knowledge. Please leave a comment to let me know what you think about it! Share it to your friends and learn new things together.
Transcript
WORLD MIGRATION REPORT 2018: CHAPTER 2

The opinions expressed in the report are those of the authors and do not necessarily reflect the views of the International Organization for Migration (IOM). The designations employed and the presentation of material throughout the report do not imply the expression of any opinion whatsoever on the part of IOM concerning the legal status of any country, territory, city or area, or of its authorities, or concerning its frontiers or boundaries.
All reasonable efforts have been made to ensure the accuracy of the data referred to in this report, including through data verification. We regret, however, any data errors that may remain. Unless otherwise stated, this report does not refer to data or events after June 2017.
IOM is committed to the principle that humane and orderly migration benefits migrants and society. As an intergovernmental organization, IOM acts with its partners in the international community to: assist in meeting the operational challenges of migration; advance understanding of migration issues; encourage social and economic development through migration; and uphold the human dignity and well-being of migrants.
Publisher: International Organization for Migration 17 route des Morillons P.O. Box 17 1211 Geneva 19 Switzerland Tel.: +41 22 717 9111 Fax: +41 22 798 6150 E-mail: [email protected] Website: www.iom.int
Suggested citation: IOM (2017) ‘Migration and migrants: A global overview’, in IOM (2017) World Migration Report 2018, IOM: Geneva.
Cover photo: Syrian refugee children get ready for class in Turkey. Many of these children are originally from Aleppo and escaped the ongoing civil war. Today, the children attend class at the Syrian Social Gathering, a multi-service centre supported by IOM. The centre provides services to all Syrian refugees, such as free legal advice for women, adult education in the evenings, and psychosocial care for those who have undergone traumatic experiences in the Syrian Arab Republic. © IOM (Photo: Muse Mohammed)
© 2017 International Organization for Migration (IOM)
All rights reserved. No part of this publication may be reproduced, stored in a retrieval system, or transmitted in any form or by any means, electronic, mechanical, photocopying, recording, or otherwise without the prior written permission of the publisher.
WORLD MIGRATION REPORT 2018 1
MIGRATION AND MIGRANTS: A GLOBAL OVERVIEW
Introduction
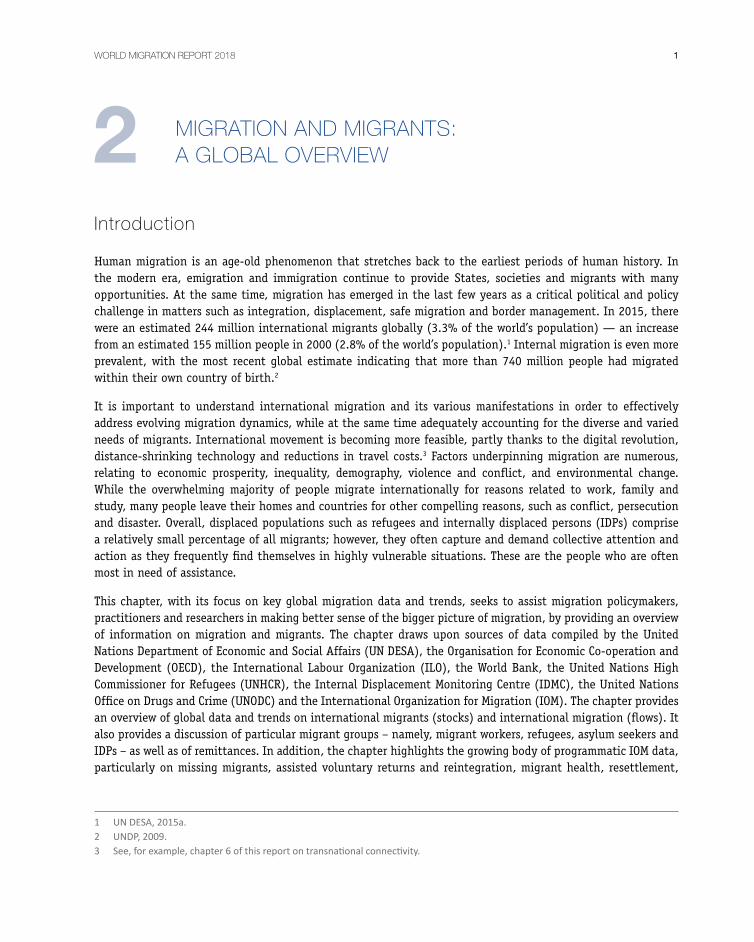
Human migration is an age-old phenomenon that stretches back to the earliest periods of human history. In the modern era, emigration and immigration continue to provide States, societies and migrants with many opportunities. At the same time, migration has emerged in the last few years as a critical political and policy challenge in matters such as integration, displacement, safe migration and border management. In 2015, there were an estimated 244 million international migrants globally (3.3% of the world’s population) — an increase from an estimated 155 million people in 2000 (2.8% of the world’s population).1 Internal migration is even more prevalent, with the most recent global estimate indicating that more than 740 million people had migrated within their own country of birth.2
It is important to understand international migration and its various manifestations in order to effectively address evolving migration dynamics, while at the same time adequately accounting for the diverse and varied needs of migrants. International movement is becoming more feasible, partly thanks to the digital revolution, distance-shrinking technology and reductions in travel costs.3 Factors underpinning migration are numerous, relating to economic prosperity, inequality, demography, violence and conflict, and environmental change. While the overwhelming majority of people migrate internationally for reasons related to work, family and study, many people leave their homes and countries for other compelling reasons, such as conflict, persecution and disaster. Overall, displaced populations such as refugees and internally displaced persons (IDPs) comprise a relatively small percentage of all migrants; however, they often capture and demand collective attention and action as they frequently find themselves in highly vulnerable situations. These are the people who are often most in need of assistance.
This chapter, with its focus on key global migration data and trends, seeks to assist migration policymakers, practitioners and researchers in making better sense of the bigger picture of migration, by providing an overview of information on migration and migrants. The chapter draws upon sources of data compiled by the United Nations Department of Economic and Social Affairs (UN DESA), the Organisation for Economic Co-operation and Development (OECD), the International Labour Organization (ILO), the World Bank, the United Nations High Commissioner for Refugees (UNHCR), the Internal Displacement Monitoring Centre (IDMC), the United Nations Office on Drugs and Crime (UNODC) and the International Organization for Migration (IOM). The chapter provides an overview of global data and trends on international migrants (stocks) and international migration (flows). It also provides a discussion of particular migrant groups – namely, migrant workers, refugees, asylum seekers and IDPs – as well as of remittances. In addition, the chapter highlights the growing body of programmatic IOM data, particularly on missing migrants, assisted voluntary returns and reintegration, migrant health, resettlement,
1 UN DESA, 2015a.2 UNDP, 2009. 3 See,forexample,chapter6ofthisreportontransnationalconnectivity.
2

Migration and migrants: A global overview2
displacement tracking, diaspora mapping and human trafficking. While these data are generally not global or representative, they can provide insights into changes that have occurred in relevant programming and operations globally. As the United Nation’s new migration agency, with activities relevant to all the themes discussed in this chapter, IOM has the capacity to provide further insights on migration and its various dynamics, including the diverse needs of migrants.
This chapter also highlights the challenges in achieving comparability and uniformity in data collection that make a comprehensive analysis of global migration trends difficult. Recent and ongoing efforts to collect and improve data have led to an expansion in available migration data. However, issues of fragmentation, and lack of uniformity and comparability, remain key challenges in developing a truly global picture of all key aspects of migration.4 Similarly, defining migration and migrants is complex, as discussed in the text box below.
Defining migration, migrant and other key terms
Outsideofgeneraldefinitionsofmigration and migrant,suchasthosefoundindictionaries,thereexistvariousspecificdefinitionsofkeymigration-relatedterms,includinginlegal,administrative,researchandstatisticalspheres.aThereisnouniversallyagreeddefinitionofmigration or migrant,however,severaldefinitionsarewidelyacceptedandhavebeendevelopedindifferentsettings,suchasthosesetoutinUN DESA’s 1998 Recommendations on Statistics of International Migration.b
Technical definitions, concepts and categories ofmigrants andmigration arenecessarily informedbygeographic,legal,political,methodological,temporalandotherfactors.Forexample,therearenumerouswaysinwhichmigrationeventscanbedefined,includinginrelationtoplaceofbirth,citizenship,placeofresidenceanddurationofstay.cThisisimportantwhenitcomestoquantifyingandanalysingtheeffectsofmigrationandmigrants(howeverdefined).Weencouragereaderstorefertoprimarysourcescitedinthechapterforinformationonspecificdefinitionsandcategorizationsunderlyingthedata.Asummaryofkeytechnicaldefinitionsofmigration-relatedtermsisprovidedinappendixA.
ReadersmayalsofindtheIOMGlossary on Migrationtobeausefulreference. TheglossaryisavailableattheIOMonlinebookstore:www.publications.iom.int/.
a See, for example, Poulain and Perrin, 2001. bUNDESA,1998.c See, for example, de Beer et al., 2010.
4 In general, explanatory notes, caveats, limitations andmethodologies on specific sources of data can be extensive and arethereforenotincludedinthischapter.However,sourceshavebeenclearlyidentifiedsothatreaderscanrefertothem.
WORLD MIGRATION REPORT 2018 3
International migrants: numbers and trends
UN DESA produces estimates of the number of international migrants globally. The following discussion draws on its estimates, which are based on data provided by States.5
The United Nations Recommendations on Statistics of International Migration defines an international migrant as any person who has changed his or her country of usual residence, distinguishing between “short-term migrants” (those who have changed their country of usual residence for at least three months, but less than one year) and “long-term migrants” (those who have done so for at least one year). However, not all countries use this definition in practice.6 Some countries use different criteria to identify international migrants by, for example, applying different minimum durations of residence. Differences in concepts and definitions, as well as data collection methodologies between countries, hinder full comparability of national statistics on international migrants.
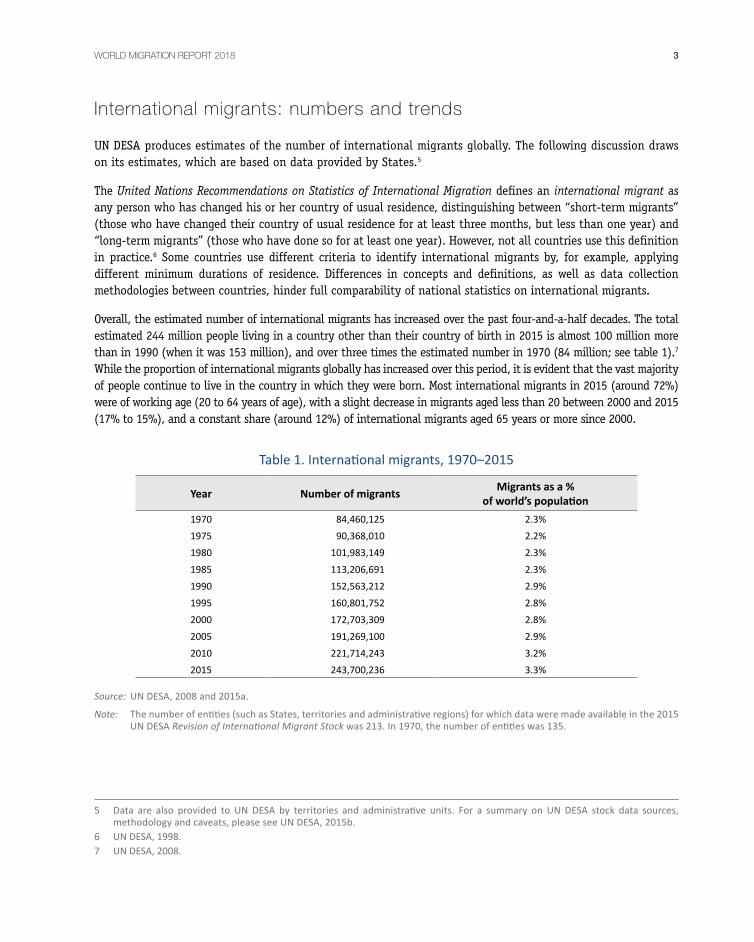
Overall, the estimated number of international migrants has increased over the past four-and-a-half decades. The total estimated 244 million people living in a country other than their country of birth in 2015 is almost 100 million more than in 1990 (when it was 153 million), and over three times the estimated number in 1970 (84 million; see table 1).7 While the proportion of international migrants globally has increased over this period, it is evident that the vast majority of people continue to live in the country in which they were born. Most international migrants in 2015 (around 72%) were of working age (20 to 64 years of age), with a slight decrease in migrants aged less than 20 between 2000 and 2015 (17% to 15%), and a constant share (around 12%) of international migrants aged 65 years or more since 2000.
Table1.Internationalmigrants,1970–2015
Year Number of migrants Migrants as a % of world’s population
1970 84,460,125 2.3%1975 90,368,010 2.2%1980 101,983,149 2.3%1985 113,206,691 2.3%1990 152,563,212 2.9%1995 160,801,752 2.8%2000 172,703,309 2.8%2005 191,269,100 2.9%2010 221,714,243 3.2%2015 243,700,236 3.3%
Source: UN DESA, 2008 and 2015a.
Note: Thenumberofentities(suchasStates,territoriesandadministrativeregions)forwhichdataweremadeavailableinthe2015UN DESA Revision of International Migrant Stockwas213.In1970,thenumberofentitieswas135.
5 Data are also provided to UNDESA by territories and administrative units. For a summary on UNDESA stock data sources,methodologyandcaveats,pleaseseeUNDESA,2015b.
6 UN DESA, 1998. 7 UNDESA,2008.
Migration and migrants: A global overview4
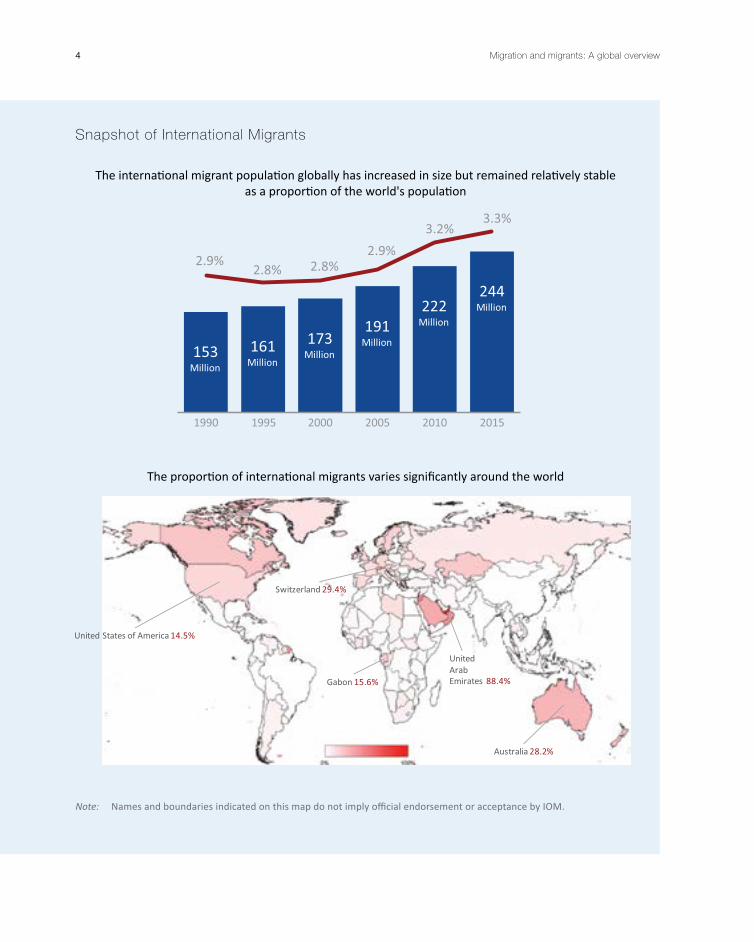
Snapshot of International Migrants
Theinternationalmigrantpopulationgloballyhasincreasedinsizebutremainedrelativelystable asaproportionoftheworld'spopulation
Theproportionofinternationalmigrantsvariessignificantlyaroundtheworld
Note: NamesandboundariesindicatedonthismapdonotimplyofficialendorsementoracceptancebyIOM.

WORLD MIGRATION REPORT 2018 5
2.7%
5.7%7%
0–45–9
10–1415–1920–2425–2930–3435–3940–4445–4950–5455–5960–6465–6970–74
2.9%
6.8% 6.8%3.4%
4.5%
8.3%9.7%
10.8%
11.2%10.2%
7%4.7%
3.9%3.5%
2.9%
3.6%4.1%
5.2%6.2%
7.1%7.9%
8.8%
9.5%9.9%
9.2%6.6%
4.6%3.9%
3.6%
3%
244millioninternationalmigrantsin2015outofaglobalpopulationof7.3billion: 1inevery30people
52% ofinternationalmigrantsaremale, 48% are female
Mostinternationalmigrants(72%)areofworkingage(20–64)years
* Age groups above 75 years omitted (male 4.5%, female 6.8%).
Note:SnapshotbasedoninfographicsbyIOM’sMigrationResearchDivisionandGlobalMigrationDataAnalysisCentre(IOM,2017d),whichdrawonUNDESAdata(UNDESA,2015a).
Migration and migrants: A global overview6
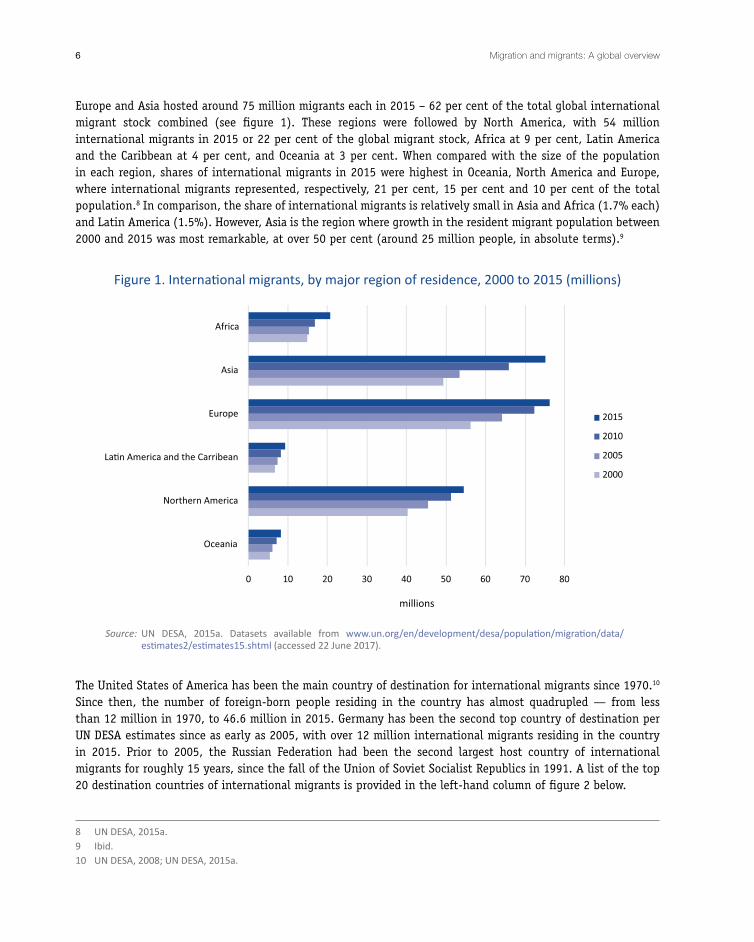
Europe and Asia hosted around 75 million migrants each in 2015 – 62 per cent of the total global international migrant stock combined (see figure 1). These regions were followed by North America, with 54 million international migrants in 2015 or 22 per cent of the global migrant stock, Africa at 9 per cent, Latin America and the Caribbean at 4 per cent, and Oceania at 3 per cent. When compared with the size of the population in each region, shares of international migrants in 2015 were highest in Oceania, North America and Europe, where international migrants represented, respectively, 21 per cent, 15 per cent and 10 per cent of the total population.8 In comparison, the share of international migrants is relatively small in Asia and Africa (1.7% each) and Latin America (1.5%). However, Asia is the region where growth in the resident migrant population between 2000 and 2015 was most remarkable, at over 50 per cent (around 25 million people, in absolute terms).9
Figure1.Internationalmigrants,bymajorregionofresidence,2000to2015(millions)
Source: UN DESA, 2015a. Datasets available from www.un.org/en/development/desa/population/migration/data/estimates2/estimates15.shtml(accessed22June2017).
The United States of America has been the main country of destination for international migrants since 1970.10 Since then, the number of foreign-born people residing in the country has almost quadrupled — from less than 12 million in 1970, to 46.6 million in 2015. Germany has been the second top country of destination per UN DESA estimates since as early as 2005, with over 12 million international migrants residing in the country in 2015. Prior to 2005, the Russian Federation had been the second largest host country of international migrants for roughly 15 years, since the fall of the Union of Soviet Socialist Republics in 1991. A list of the top 20 destination countries of international migrants is provided in the left-hand column of figure 2 below.
8 UN DESA, 2015a. 9 Ibid.10 UN DESA, 2008; UN DESA, 2015a.

WORLD MIGRATION REPORT 2018 7
The list of largest migrant source countries is shown in the right-hand panel in figure 2. Nearly half of all international migrants worldwide in 2015 were born in Asia,11 primarily originating from India (the largest country of origin), China, and other South Asian countries such as Afghanistan, Bangladesh and Pakistan. Mexico was the second largest country of origin, followed by a number of European countries that have sizable numbers of emigrants.
Figure2.Top20destinations(left)andorigins(right)ofinternationalmigrantsin2015(millions)
Source: UNDESA,2015a.Datasets forthe2015Revisionavailableatwww.un.org/en/development/desa/population/migration/data/estimates2/estimates15.shtml.
11 UN DESA, 2016.

Migration and migrants: A global overview8
In regard to the distribution of international migrants by countries’ income group,12 about two thirds of international migrants resided in high-income economies in 2015 – around 157 million. This compares with 77 million foreign-born who resided in middle-income countries (about one third of the total migrant stock) and almost 9 million in low-income countries in the same year.
UN DESA estimates of foreign-born populations do not reflect immigration status or policy categories (such as students, highly skilled migrants, or refugees). Capturing such attributes is inherently difficult for several key reasons. First, a person’s immigration status can be fluid and change quickly, arising from circumstances and legal-policy settings. For example, many international migrants who may be described as ‘‘undocumented’ or “irregular” enter countries on valid visas and then stay in contravention of one or more visa conditions. In fact, there are many paths to irregularity, such as crossing borders without authorization, unlawfully overstaying a visa period, working in contravention of visa conditions, being born into irregularity, or remaining after a negative decision on an asylum application has been made.13 Second, countries have different immigration policy settings and different ways of collecting data on migrants, which makes it difficult to establish a harmonized approach to capturing irregular migrant stocks globally. The pace of change in the migration policy arena also poses an extra dimension of complexity, as people may slip into and out of “irregularity”. Various analysts use different methods to produce intermittent estimates of irregular migrant populations. Table 2 shows a few existing estimates of irregular migrant populations in selected countries and regions. However, these should be treated with caution, as the estimation exercise can often be imprecise (for example, there are variations in the estimates of irregular migrant populations in the European Union and the United States). This is partly a reflection of the problematic nature of quantifying irregular migrant populations, given the often clandestine nature of irregularity, the difficulty in accessing administrative data on immigration status, and the fact that a migrant’s status can change.14 Migration flows are discussed in the following section.
Diaspora populations or transnational communities?
The term diasporaisusedinacademicandpolicycirclestorefertopeople(andoftentheirdescendants)fromaspecificcountrywhoarelivingabroad.However,thereisnosingleagreed-upondefinitionoftheterm.Infact,ithasbeensuggestedthatthetermtransnational communitiesmaybetterdescribethe reality of contemporary migration experiences, where migrants may establish and maintainconnectionswithpeopleintheirhomecommunitiesormigrantsinothercountries.Indeed,IOMusesthe terms diaspora and transnational communitiesinterchangeably(IOM,2017c).SeeappendixBforafurther discussion on the term diasporaandthedifficultiesinquantifyingglobaldiasporapopulations,aswellasIOM’sworkinthisarea.
12 PerWorldBankCountryIncomeGroupClassifications,inWorld Bank Country and Lending Groups. Availablefromhttp://datahelpdesk.worldbank.org/knowledgebase/articles/906519-world-bank-country-and-lending-groups(WorldBank,n.d.a).
13 Gordonetal.,2009.14 Koser, 2010.

WORLD MIGRATION REPORT 2018 9
Table2.Estimatesofirregularmigrantpopulationsinselectedcountriesandregions
Country/region Year Estimated population (stock) Source
Australia 2011 58,400 (a)
European Union2008 1.9–3.8million (b)
2008 8 million (c)
Germany 2014 180,000–520,000 (d)
Greece 2011 390,000 (e)
Israel 2015 150,000 (f)
Italy 2008 279,000–461,000 (b)
RussianFederation* 2011 5–6million (g)
South Africa 2010 3–6million (h)
Spain 2008 354,000 (i)
United Kingdom 2007 417,000–863,000 (j)
United States2014 11.1 million (k)
2016 11.3 million (k)
* Estimate refers to irregular migrant workers.
Source: (a) ANAO, 2013; (b) Clandestino Research Project, 2009a; (c) Frontex, 2010; (d) Clandestino ResearchProject, 2015; (e) Clandestino Research Project, 2012; (f) Fleischman et al., 2015; (g) OECD, 2012a; (h) South African Police Service, 2010; (i) Clandestino Research Project, 2009b; (j) Gordon et al., 2009; (k)Krogstad,PasselandCohn,2017.
International migration flows: definitions, numbers and gaps
While data on migrant stocks are widely available, data on global migration movements (flows) are much more limited. Available UN DESA estimates on global migrant stocks are extensive and global in scope; however, the database of migration flows only encompasses 45 countries.15 Capturing data on migration flows is challenging for several reasons. First, while international migration flows are generally accepted as covering inflows and outflows into and from countries, there has been a greater focus on recording inflows. For example, while countries such as Australia and the United States count cross-border movements, many others only count entries and not departures.16 Additionally, migration flow data in some countries are derived from administrative events related to immigration status (for example, issuance/renewal/withdrawal of a residence
15 Laczko,2017.16 Koser, 2010.

Migration and migrants: A global overview10
permit) and are thus used as a proxy for migration flows. Furthermore, migratory movements are often hard to separate from non-migratory travel, such as tourism or business. Tracking migratory movements also requires considerable resources, infrastructure and IT/knowledge systems. This poses particular challenges for developing countries, where the ability to collect, administer, analyse and report data on mobility, migration and other areas is often limited. Finally, many countries’ physical geographies pose tremendous challenges for collecting data on migration flows. Entry and border management, for example, is particularly challenging in some regions because of archipelagic and isolated borders, and it is further complicated by traditions of informal migration for work.17
Migration flows
There are currently two main international datasets on international migration flows, both of which are derived from national statistics: UN DESA’s International Migration Flows dataset and OECD’s International Migration Database.18 Since 2005, UN DESA has compiled data on the flows of international migrants to and from selected countries, based on nationally available statistics. The latest revision (2015) comprises data from 45 countries that collect this information (only 43 on emigration flows), up from 29 countries in 2008 and 15 countries in 2005.19 Progress in extending the dataset is encouraging; however, the ability to conduct trend analysis is limited.20
Researchers and analysts have made numerous attempts to better understand global or regional migration flows by using changes in migrant stock data as a proxy for flow data. Guy Abel and Nikola Sander recently undertook a sophisticated approach to this issue by analysing changes in international migrant stocks to estimate migration flows, visualizing data using circular plots.21 Figure 3 provides an update to this work by presenting estimated migration flows between 2010 and 2015.22
17 GallagherandMcAuliffe,2016.18 Otherprojectshavemadecontributionstothemonitoringofmigrationflowsataregional(non-global)level.Ofnote,theMigration
Modelling for Statistical Analyses (MIMOSA) project (commissioned by Eurostat) measured migration flows (immigration andemigration)aswellaspopulationstocks inEurope(deBeer,vanderErfandRaymer,2009;Raymeretal.,2011).The Integrated Modelling of European Migration (IMEM)project(Raymeretal.,2013)notablypresentsbilateralmigrantflowdatadisaggregatedbyageandgender,butisalsolimitedtocountriesinEurope.
19 ForUNDESAmigrantflowdata,aswellasforthespecificcountriesincluded,pleaseseeUNDESA,2015c.20 ForasummaryofUNDESAmigrantflowdatasources,methodologyandcaveats,pleaseseeUNDESA,2015d.21 AbelandSander,2014.22 PreparedbyGuyAbelin2017.

WORLD MIGRATION REPORT 2018 11
Figure3.Estimatedregionalmigrationflows,2010–2015
Source: UN DESA, 2015a. Datasets for the 2015 revision of International migration flows to and fromselectedcountriesavailablefromwww.un.org/en/development/desa/population/migration/data/empirical2/migrationflows.shtml.
Note: Thedirectionoftheflowisindicatedbythearrowhead.Thesizeoftheflowisdeterminedbythewidthofthearrowatitsbase.Numbersontheoutersectionaxis,usedtoreadthesizeofmigrationflows,areinmillions.So,forexample,between2010and2015,therewasanincreaseofaround4millionpeopleinNorthernAmericawhowereborninAsia.
The OECD data on migration flows have been collected since 2000, which allows for limited trend analysis, as shown in figure 4 (though data are not standardized, as explained in the note under the figure).23 The data estimates suggest that permanent migration inflows to OECD countries increased from 3.85 million in 2000 to 7.13 million in 2015, with a temporary lull occurring around the time of the global financial crisis (figure 4). Germany was the main OECD destination country in 2015, with over 2 million new international migrants (more than double the levels registered in 2000) arriving that year, followed by the United States (just over 1 million) and the United Kingdom (about 480,000 new migrants).24
23 ThissubsectionisbasedondatafromtheOECDInternationalMigrationDatabase,availablefromOECD,2015.ForadditionaldataonmigrantflowsandothermigrantdatainOECDcountries,pleaseseeOECD,n.d.a.
24 ThesearethetopOECDcountriesforpermanentinflowsofforeignnationalsforwhichdataweremadeavailablein2015.

Migration and migrants: A global overview12
Figure4.InflowsofforeignnationalsintoOECDcountries,permanentmigration, 2000–2015(millions)
Source: OECD,2015.
Note 1: Dataarenotstandardizedandthereforedifferfromstatisticsonpermanentmigration inflows intoselectedcountriescontainedinOECD’sInternationalMigrationOutlook2016(OECD,2016aand2016b).
Note 2: The35countriestypicallyincludedinOECDstatisticsarethefollowing:Australia,Austria,Belgium,Canada,Chile,CzechRepublic,Denmark,Estonia,Finland,France,Germany,Greece,Hungary,Iceland,Ireland,Israel,Italy,Japan,RepublicofKorea,Latvia,Luxembourg,Mexico,theNetherlands,NewZealand,Norway,Poland,Portugal,Slovakia,Slovenia,Spain,Sweden,Switzerland,Turkey,UnitedKingdomandUnitedStates.Insomeyears,dataforparticularcountriesarenotmadeavailable:dataweremadeavailablefor31countriesin2000,and33countriesin2015.Notably,dataforGreecehavenotbeenreportedsince2012anddataforTurkeyhavenotbeenreportedsince2010.
Disaggregation of migration flow data by sex and age
DataonageandsexprofilesofinternationalmigrationflowsarenotavailablefromUNDESAorOECD. AmethodologyforsexdisaggregationofbilateralmigrationflowsusingUNDESAstockdataispresentedinAbel, Samir andSander.d Raymeret al.e providebilateralmigrationflowestimatesby sexandage,butonly for European countries. Finally,Nawrotzki and Jiangf estimatedbilateralnetmigrationflowsdisaggregatedbyageandsexfortheyear2000;the informationiscontainedinthepubliclyavailableCommunity Demographic Model International Migration (CDM-IM) dataset. Statistics on bilateralmigrationflowsarealsoavailablefromtheDeterminantsofInternationalMigration(DEMIG)Country-to-Countrydatabase,whichcontainsbilateralmigrationflowdataforupto34countriesovertheperiod1946–2011.Thedatabasealsoprovidesgenderbreakdowns,whereavailable.
dAbel,SamirandSander,2013.eRaymeretal.,2013.fNawrotzkiandJiang,2015.
Typically, migration flow data of the sort described above encompass people who have migrated (or are residing) regularly on a visa or entry permit. Most such data do not capture irregular migration flows, which involve “movement that takes place outside the regulatory norms of the sending, transit and receiving country”.25
25 IOM,2017a.

WORLD MIGRATION REPORT 2018 13
It is important here to distinguish irregular migration (flows) from irregular migrants (stocks), as they are interlinked, but conceptually and practically distinct, although the two terms are often incorrectly used interchangeably.26 As mentioned earlier in this chapter, a person may, for example, enter a country regularly on a valid visa (thereby not engaging in irregular entry) and then overstay or contravene a visa condition, for example, and thus become irregular. Estimates of irregular migrants (stocks) were discussed in the previous section. For further discussion on irregular migration flows, see appendix C.
Human trafficking and migrant smuggling
Trafficking in persons often involvesmovements within countries or across international borders. Indifferentcontexts,migrants(includingworkers,refugees,asylumseekersandIDPs)canbecomevictimsofhumantrafficking.Duetotheclandestineandunderreportednatureofthisactivity,however,systematicdatacollectionisproblematicandglobalestimatesofhumantraffickingarelimited.Forinformationonavailabledata,aswellasonIOM’sworkinthisarea,seeappendixD.
Global-leveldataonmigrantsmugglingonroutestraversingland,airandseaareunavailable.Tragediesinvolvingsmuggledmigrantsareoftenakeyglimpseintothepotentialscaleandvulnerabilitiesassociatedwithsuchmovements.Inrecentyears,inrecognitionoftheneedforabetterunderstandingofmigrantsmugglingdynamics,effortshavebeenmade to reviewexistingdataand research (see, forexample,McAuliffeandLaczko,2016).
SeeappendixAfordefinitionsofthetermstrafficking in persons and smuggling of migrants.
Migrant fatalities and IOM’s Missing Migrants Project
InthewakeofthetragiceventsofOctober2013,inwhichanestimated368migrantsdiedinthesinkingof two boats near the Italian island of Lampedusa, IOM began collecting and compiling informationonmigrantswhoperishorgomissingonmigratoryroutesworldwide,withinitsMissingMigrantsProject(MMP). Informationonmigrant fatalities is collecteddailyandmadeavailableon theMissingMigrantsProject’sonlinedatabase,managedbyIOM’sGlobalMigrationDataAnalysisCentre(GMDAC).MMPalsoprovidesanalysisof issuesanddataonmigrantdeaths.Data sources includeofficial recordsof coastguards and medical examiners, media stories, reports from non-governmental organizations (NGOs)andUnitedNationsagencies,and interviewswithmigrants.Datacollectionchallengesaresignificant.For instance, themajority of deaths are amongmigrants travelling irregularly,which often occurs atsea, or in remote areas (chosenwith the aim of evading detection),meaning bodies are not found.Few official sources collect andmake data onmigrant deaths publicly available. Relying onmigranttestimoniesandmediasourcesmayalsobeproblematicduetoinaccuraciesandincompletecoverage.
26 McAuliffe,2017.

Migration and migrants: A global overview14
According to IOM’s MMP, 7,927 migrants worldwide died or went missing in 2016, 26 per centmore than the number of deaths and missing migrants recorded in 2015 (6,281). The numberof deaths and missing migrants recorded in the Mediterranean Sea increased by 36 per centin 2016, from 3,785 in 2015 to 5,143 in 2016. The Mediterranean accounted for more than 60percentofmigrantdeathsandmissingmigrantsrecordedbyMMPinbothyears. Nearly1,400deathsandmissingmigrantswererecordedinNorthAfricain2016,mostlyduetotheharshnaturalenvironment,violenceandabuse,dangeroustransportationconditions,andsicknessandstarvation.Figuresforotherregionsarehighlightedbelow.
Recorded migrant deaths and missing migrants worldwide, 2016
Source: IOM,n.d.i.
Note: Figurescorrespondtodeathsthatoccurredduringtheprocessofmigration.Allnumbersreflectonlythoseincidentsaboutwhich IOM isaware.Anunknownnumberofdeaths remainunreportedandtherefore, thesedatacompriseminimumestimates.Figuresincludebothbodiesfoundandmigrantswhoaremissingandpresumeddead.NamesandboundariesindicatedonthismapdonotimplyofficialendorsementoracceptancebyIOM.
FormoreonMMP,seehttps://missingmigrants.iom.int/about.Newdatasourcesareconstantlyaddedandeffortsareongoingtoimprovedatacollectionglobally.Foradiscussionofthechallengesofcollectingdata on migrant deaths, please see http://missingmigrants.iom.int/methodology.

WORLD MIGRATION REPORT 2018 15
IOM’s Assisted Voluntary Return and Reintegration Programmes
IOM has implemented assisted voluntary return and reintegration (AVRR) programmes since 1979.IOM’sAVRRsupport tomigrantscomprisesa rangeofactivities,andtypically includes: theprovisionofpre-departurecounselling,thepurchaseofflighttickets,administrativeandtravelassistanceand,wherepossible,theprovisionofreintegrationassistance.
Onaverage,between2005and2014,IOMassisted34,000migrantsperyearthroughAVRR.Inlinewiththerise inthevolumeofmigrationinrecentyears,thenumberofreturnshassignificantly increased.In2016,AVRRsupportwasprovidedto98,403migrantsreturningfrom110hostortransitcountriesto 161countriesorterritoriesoforigin.Thisamountstoa41percentincreasecomparedwith2015(69,540).Ofthe98,403AVRRbeneficiariesin2016,approximately32percentwerewomenand27percentwerechildren.Over3percentofthesereturneeswerevictimsoftrafficking,unaccompaniedmigrantchildren,ormigrantswithhealth-relatedneeds.Approximately39,000beneficiarieswereprovidedwithfinancialsupportincashand/orinkind,beforedepartureoruponarrivalintheircountriesorterritoriesoforigin.
Top 10 host/transit countries and countries/territories of origin of AVRR beneficiaries (2016)
Host or transit countries Countries or territories of origin
Germany 54,006 Albania 17,976Greece 6,153 Iraq 12,776Austria 4,812 Afghanistan 7,102Niger 4,788 Serbia 6,978Netherlands, the 4,635 Kosovo/UNSC1244 5,889 Belgium 4,117 Ethiopia 5,675Yemen 2,594 TheformerYugoslavRepublicofMacedonia 4,986 Finland 2,116 Iran(IslamicRepublicof) 4,485 Djibouti 1,803 Ukraine 3,438 Norway 1,459 RussianFederation 2,058
As highlighted in the above table, in 2016, themajority of AVRR beneficiaries (83%) returned fromthe European Economic Area (EEA) and Switzerland, particularly fromGermany,Greece, Austria, theNetherlands and Belgium. Returns from the EEA and Switzerland increased from 55,851 in 2015 to81,671in2016.RecenttrendsalsoindicatethatSouth–Southreturns,includingfromtransitcountries,areincreasing.In2016,returnsfromNigerandMoroccotocountriessuchasCameroon,Guinea,Guinea-BissauandSenegal,forexample,amountedtomorethan6percentoftheglobaltotal.Themainregionsoforigin forAVRRbeneficiaries in2016wereSouth-EasternEurope,EasternEuropeandCentralAsia(49%oftotal),AsiaandthePacific(16%),andtheMiddleEastandNorthAfrica(16%).Together,thetop10countriesandterritoriesoforiginaccountedfor72percentofthetotalnumberofAVRRbeneficiaries.
Formoreinformation,seewww.iom.int/assisted-voluntary-return-and-reintegration and www.iom.int/sites/default/files/our_work/DMM/AVRR/AVRR-2016-Key-Highlights.pdf.
Migration and migrants: A global overview16
Migrant workers
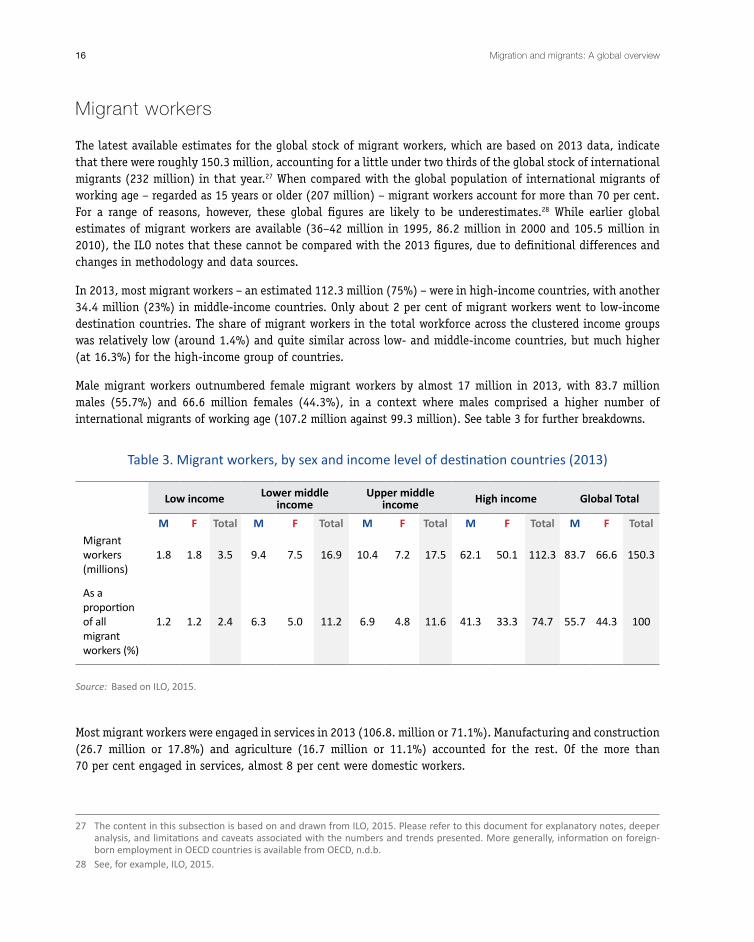
The latest available estimates for the global stock of migrant workers, which are based on 2013 data, indicate that there were roughly 150.3 million, accounting for a little under two thirds of the global stock of international migrants (232 million) in that year.27 When compared with the global population of international migrants of working age – regarded as 15 years or older (207 million) – migrant workers account for more than 70 per cent. For a range of reasons, however, these global figures are likely to be underestimates.28 While earlier global estimates of migrant workers are available (36–42 million in 1995, 86.2 million in 2000 and 105.5 million in 2010), the ILO notes that these cannot be compared with the 2013 figures, due to definitional differences and changes in methodology and data sources.
In 2013, most migrant workers – an estimated 112.3 million (75%) – were in high-income countries, with another 34.4 million (23%) in middle-income countries. Only about 2 per cent of migrant workers went to low-income destination countries. The share of migrant workers in the total workforce across the clustered income groups was relatively low (around 1.4%) and quite similar across low- and middle-income countries, but much higher (at 16.3%) for the high-income group of countries.
Male migrant workers outnumbered female migrant workers by almost 17 million in 2013, with 83.7 million males (55.7%) and 66.6 million females (44.3%), in a context where males comprised a higher number of international migrants of working age (107.2 million against 99.3 million). See table 3 for further breakdowns.
Table3.Migrantworkers,bysexandincomelevelofdestinationcountries(2013)
Low income Lower middle income
Upper middle income High income Global Total
M F Total M F Total M F Total M F Total M F TotalMigrantworkers(millions)
1.8 1.8 3.5 9.4 7.5 16.9 10.4 7.2 17.5 62.1 50.1 112.3 83.7 66.6 150.3
As a proportionof all migrant workers(%)
1.2 1.2 2.4 6.3 5.0 11.2 6.9 4.8 11.6 41.3 33.3 74.7 55.7 44.3 100
Source: BasedonILO,2015.
Most migrant workers were engaged in services in 2013 (106.8. million or 71.1%). Manufacturing and construction (26.7 million or 17.8%) and agriculture (16.7 million or 11.1%) accounted for the rest. Of the more than 70 per cent engaged in services, almost 8 per cent were domestic workers.
27 ThecontentinthissubsectionisbasedonanddrawnfromILO,2015.Pleaserefertothisdocumentforexplanatorynotes,deeperanalysis,andlimitationsandcaveatsassociatedwiththenumbersandtrendspresented.Moregenerally,informationonforeign-bornemploymentinOECDcountriesisavailablefromOECD,n.d.b.
28 See,forexample,ILO,2015.

WORLD MIGRATION REPORT 2018 17
In 2013, there were an estimated 11.5 million migrant domestic workers, comprising more than 17 per cent of all domestic workers (67.1 million) and over 7 per cent of all migrant workers. Of the 11.5 million, 8.45 million were female and 3.07 million were male. Migrant domestic workers were overwhelmingly located in high-income countries; and this was true of both female and male migrant domestic workers (see figure 5). IOM’s work on migrant health, as discussed in the following box, is particularly relevant for migrant workers and refugees (discussed in the next section).
Figure5.Migrantdomesticworkersbydestinationcountryincomelevelandsexasof2013 (millions)
Source: ILO,2015.
IOM’s work on migrant health
IOM delivers and promotes preventative and curative health programmes through its MigrationHealthDivision.Uponrequestfromreceiving-countrygovernments,IOMprovidesphysicalandmentalhealthassessmentsformigrantspriortotheirdeparture,whetherforthepurposesofresettlement,internationalemployment,or forobtaining temporaryorpermanentvisas.Specificservices includetuberculosistestingandcontrol;HIV,syphilisandhepatitistests;physicalexams;laboratorydiagnosticservices;medicalescortservices;andpre-departureimmunization.
Such health assessments contribute to the epidemiological knowledge base on selected migrantpopulations, allowing for the development of evidence-based programmes and health interventions.DatacollectionisstandardizedandcentralizedamongIOMcountryoffices,whichalsoenablesIOMtodecreaseprocessingtime,conserveresourcesandintegrateallmigrationhealthactivitiesatthecountrylevel.IOMisalsointheprocessofdevelopingamedicaldatarepositorytofacilitateanalysisofcurrentandhistoricaloperationaldata.
Migration and migrants: A global overview18
In 2015, IOM conducted more than 346,000 health assessments among migrants in more than 80 countries, covering both immigrants (65%) and refugees (35%). The majority of assessments were conducted in Asia (45%), followed by Africa (29%), the Middle East (14%) and Europe (13%). In 2016, IOM conducted almost 450,000 health assessment (52% immigrants and 48% refugees), representing an overall 27 per cent increase compared with 2015. Again, the majority of assessments were carried out in Asia (35%), followed by Africa (30%), the Middle East (23%) and Europe (12%). These figures are consistent with a steady growth in the number of global health assessment activities conducted by IOM over the preceding five years.
Beginning in 2012, IOM engaged with US agencies to develop and implement a vaccination programme for United States-bound refugees within the context of the US Refugee Admissions Program. The programme sought to introduce vaccinations early in the resettlement process to protect refugees against many of the common vaccine-preventable diseases. By the end of 2015, this programme had been implemented in over 12 countries. Overall, between 2012 and 2016, this programme was implemented in 21 countries with more than 215,000 refugees having received one or more vaccines.
For more on IOM’s work on migrant health, see www.health.iom.int/.
Remittances
Remittances are financial or in-kind transfers made by migrants directly to families or communities in their countries of origin. The World Bank compiles global data on remittances, notwithstanding the myriad data gaps, definitional differences and methodological challenges in compiling accurate statistics.29 Its data, however, do not capture unrecorded flows through formal or informal channels, and the actual magnitude of global remittances are therefore likely to be larger than available estimates.30 Despite these limitations, available data reflect an overall increase in recent decades, from USD 126 billion in 2000, to USD 575 billion in 2016, although the past two years have witnessed a decline. Between 2014 and 2015, global (inward) flows of remittances contracted by an estimated 2.7 per cent, from USD 598 billion in 2014 to USD 582 billion in 2015, and by another 1.2 per cent between 2015 and 2016. Consistent with this trend, remittances to developing countries (which account for the majority of the global total) have also declined for two consecutive years – a trend that has not been seen for three decades, according to the World Bank. Nonetheless and, notably, since the
29 The content of much of this subsection, unless otherwise noted, is based on and drawn from the World Bank’s data in relation to migration and remittances, available from World Bank, n.d.b; and publications on the topic, available from World Bank, n.d.c. In particular, the World Bank’s annual remittances datasets (World Bank, n.d.b), the Migration and Development Brief 25 (World Bank, 2015), Migration and Development Brief 26 (World Bank, 2016b),the Migration and Development Brief 27 (World Bank, 2017a) and its April 21 Press Release (World Bank, 2017b) are key sources of information. Please refer to these sources as well as the World Bank’s Factbooks on Migration and Development, including its latest, published in 2016, for explanatory notes, deeper analysis, caveats, limitations and methodologies associated with the numbers and trends presented.
30 World Bank, 2016a.

WORLD MIGRATION REPORT 2018 19
mid-1990s, remittances have greatly surpassed Official Development Assistance (ODA) levels,31 defined as government aid designed to promote the economic development and welfare of developing countries.32
In 2016, India, China, Philippines, Mexico and Pakistan were (in descending order) the top five remittance-recipient countries, although China and India were well above the rest, with total inward remittances exceeding USD 60 billion for each country (see table 4). Each of the remaining three countries received less than USD 30 billion in the same year. Many of these countries have remained in the top spots in this century. When remittances are viewed as a percentage of GDP, however, the top five countries are Kyrgyzstan (at 35.4%), followed by Nepal (29.7%), Liberia (29.6%), Haiti (27.8%) and Tonga (27.8%) in 2016.
High-income countries are almost always the main source of remittances. For decades, the United States has consistently been the top remittance-sending country, with a total outflow of USD 61.38 billion in 2015, followed by Saudi Arabia (USD 38.79 billion) and Switzerland (USD 24.38 billion). China, which is classified as an upper–middle income country by the World Bank, is also a major source (in addition to its role as a top recipient), with an outflow of USD 20.42 billion in 2015. The fifth-highest remittance-sending country in 2015 was the Russian Federation (USD 19.7 billion). Table 4 provides further details and trends.33
Table4.Topcountriesreceiving/sendingremittances(2000–2015)(currentUSDbillions)
Top countries receiving remittances
2000 2005 2010 2015
India 12.84 China 23.63 India 53.48 India 68.91
France 8.61 Mexico 22.74 China 52.46 China 63.94
Mexico 7.52 India 22.13 Mexico 22.08 Philippines, the 28.48
Philippines 6.96 Nigeria 14.64 Philippines, the 20.56 Mexico 26.23
RepublicofKorea 4.86 France 14.21 France 19.90 France 23.35
Spain 4.86 Philippines, the 13.73 Nigeria 19.75 Nigeria 18.96
Turkey 4.56 Belgium 6.89 Germany 12.79 Pakistan 19.85
United States of America 4.40 Germany 6.87 Egypt 12.45 Egypt 16.58
Germany 3.64 Spain 6.66 Bangladesh 10.85 Bangladesh 15.38
United Kingdom 3.61 Poland 6.47 Belgium 10.35 Germany 15.36
31 Seeibid.,forexample.32 See, forexample,OECD,n.d.c,whichalsocontainsdataonODA.There isagrowingbodyofworkexploringthedevelopmental,
economic and social impacts of this trend. 33 Breakdownsfor2016wereunavailableatthetimeofpublication.

Migration and migrants: A global overview20
Top countries sending remittances
2000 2005 2010 2015United States of America 34.40 United States
of America 47.25 United States of America 50.78 United States
of America 61.38
SaudiArabia 15.40 SaudiArabia 14.32 SaudiArabia 27.07 SaudiArabia 38.79
Germany 9.04 Germany 12.71 Russian Federation 21.45 Switzerland 24.38
Switzerland 7.59 Switzerland 9.99 Switzerland 16.88 China 20.42
France 3.77 United Kingdom 9.64 Germany 14.68 Russian
Federation 19.70
UnitedArabEmirates 3.68 France 9.48 Italy 12.89 Germany 18.56
RepublicofKorea 3.65 Italy 7.55 France 12.03 Kuwait 15.20
Israel 3.26 Russian Federation 6.83 Kuwait 11.86 France 12.68
Japan 3.17 Luxembourg 6.70 Luxembourg 10.64 Qatar 12.19
Netherlands, the 3.13 Republicof
Korea 6.67 UnitedArabEmirates 10.57 Luxembourg 11.35
Source: WorldBank,n.d.b.(accessedMay2017).Note: Allnumbersareincurrent(nominal)USDbillion.
Refugees and asylum seekers
By the end of 2016, there were a total of 22.5 million refugees, with 17.2 million under UNHCR’s mandate and 5.3 million refugees registered by the United Nations Relief and Works Agency for Palestine Refugees in the Near East.34 The total number of refugees is the highest on record, although the annual rate of growth has slowed since 2012. There were also 2.8 million people seeking international protection and awaiting determination of their refugee status, referred to as asylum seekers. Of the roughly 2 million first-instance applications for asylum lodged in 2016, Germany remained the top recipient, with over 720,000 applications, followed by the United States (262,000) and Italy (123,000).
UNHCR estimates that, at the end of 2016, those under 18 years of age constituted roughly 51 per cent of the global refugee population. Indeed, between 2003 and 2016, according to available disaggregated data, the proportion of children among stocks of refugees was very high, fluctuating between 41 and 51 per cent. The proportion of women remained relatively stable, at between 47 and 49 per cent, over the same period. Consistent with broader global dynamics, refugees were increasingly based in urban settings, with 60 per cent of refugees located in urban areas at the end of 2016.35
34 ThecontentinthissubsectionisbasedonanddrawnfromUNHCR,2017andUNHCR,2016.Pleaserefertothesedocumentsforexplanatorynotes,deeperanalysis, caveats, limitationsandmethodologies associatedwith thenumbers and trendspresented.UNHCR’spreviousGlobalTrendsreports,aswellas itsPopulationStatisticsdatabase(available fromUNHCR,n.d.)areotherkeysourcesofinformation.
35 SeeUNHCR’s2016and2017reportsforlimitationsapplicabletotheseassessmentsrelatedtoage,sexandlocation.
WORLD MIGRATION REPORT 2018 21
Unaccompanied and separated children lodged an estimated 75,000 individual asylum applications in 70 countries in 2016 – down from the exceptionally high number of applications in 2015 (98,400), yet still more than double the number reported in 2014.36 Consistent with the overall global trends in asylum application submissions, Germany received more than half of all reported claims from unaccompanied and separated children.
As in other years, unresolved or renewed conflict dynamics in key countries contributed most significantly to current figures and trends. Of the refugees under UNHCR’s mandate at the end of 2016, the top 10 countries of origin – Syrian Arab Republic, Afghanistan, South Sudan, Somalia, Sudan, the Democratic Republic of the Congo, Central African Republic, Myanmar, Eritrea and Burundi – accounted for roughly 13.5 million, or 79 per cent. Many of these countries have been among the top sources for refugees for at least five years.
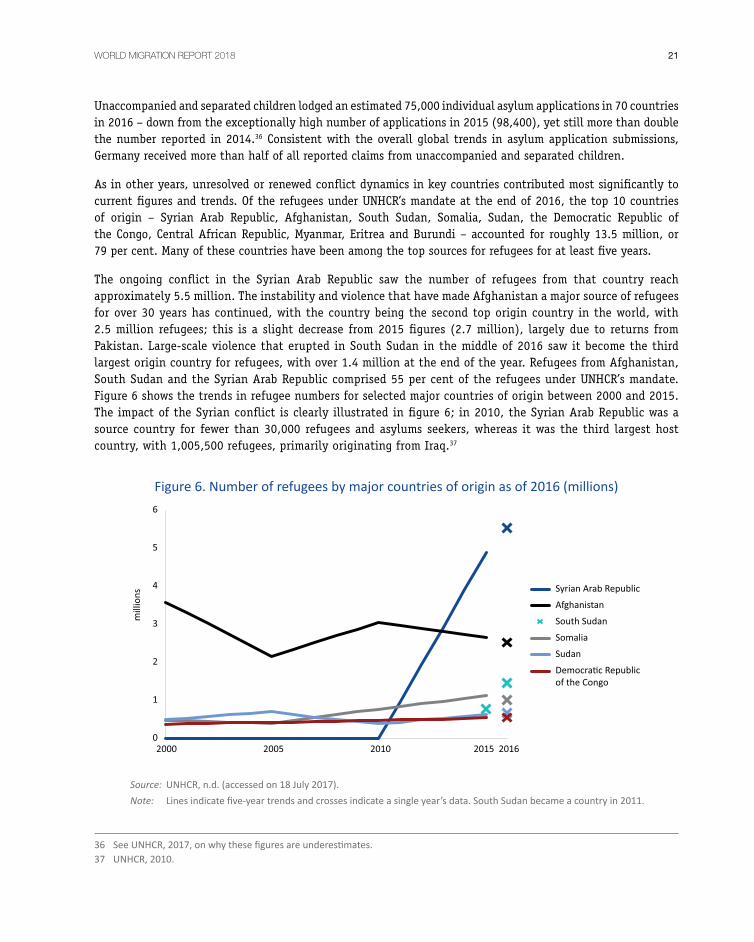
The ongoing conflict in the Syrian Arab Republic saw the number of refugees from that country reach approximately 5.5 million. The instability and violence that have made Afghanistan a major source of refugees for over 30 years has continued, with the country being the second top origin country in the world, with 2.5 million refugees; this is a slight decrease from 2015 figures (2.7 million), largely due to returns from Pakistan. Large-scale violence that erupted in South Sudan in the middle of 2016 saw it become the third largest origin country for refugees, with over 1.4 million at the end of the year. Refugees from Afghanistan, South Sudan and the Syrian Arab Republic comprised 55 per cent of the refugees under UNHCR’s mandate. Figure 6 shows the trends in refugee numbers for selected major countries of origin between 2000 and 2015. The impact of the Syrian conflict is clearly illustrated in figure 6; in 2010, the Syrian Arab Republic was a source country for fewer than 30,000 refugees and asylums seekers, whereas it was the third largest host country, with 1,005,500 refugees, primarily originating from Iraq.37
Figure6.Numberofrefugeesbymajorcountriesoforiginasof2016(millions)
Source: UNHCR,n.d.(accessedon18July2017).Note: Linesindicatefive-yeartrendsandcrossesindicateasingleyear’sdata.SouthSudanbecameacountryin2011.
36 SeeUNHCR,2017,onwhythesefiguresareunderestimates.37 UNHCR,2010.

Migration and migrants: A global overview22
In 2016, for the third consecutive year, Turkey was the largest host country in the world, with 2.9 million refugees, mainly Syrians (2.8 million). Reflecting the significant share of Syrians in the global refugee population, two other bordering countries – Jordan and Lebanon – also featured among the top 10. Pakistan and the Islamic Republic of Iran were also among the top refugee-hosting countries, as the two principal hosts of refugees from Afghanistan, the second largest origin country. Uganda, Ethiopia, Germany, the Democratic Republic of the Congo and Kenya comprised the rest. The vast majority of refugees were hosted in neighbouring countries. According to UNHCR, the least developed countries, such as Cameroon, Chad, the Democratic Republic of the Congo, Ethiopia, Kenya, Sudan and Uganda, hosted 28 per cent of the global total (4.9 million refugees). It is only when refugees are measured against national populations that high-income countries such as Sweden (fifth) and Malta (ninth) rank among the top 10. Figure 7 shows trends in refugee numbers for major host countries between 2000 and 2015.
Figure7.Numberofrefugeesbymajorhostcountriesasof2016(millions)
Source: UNHCR,n.d.(accessedon18July2017).Note: Linesindicatefive-yeartrendsandcrossesindicateasingleyear’sdata.
A key component of UNHCR’s mandate is to seek permanent solutions for refugees. Within this context, UNHCR also compiles statistics on the three traditional solutions: voluntary repatriation, local integration and resettlement. For many, return home is the preferred solution. However, for various reasons, as evidenced by the numbers discussed below, only a very small proportion of refugees achieve a solution in any given year, contributing to the protracted nature of many refugee predicaments.
During 2016, over 550,000 refugees returned to their countries of origin – more than double the number in 2015 and a notable increase from previous years. The majority of returns (384,000) were to Afghanistan, primarily from Pakistan. Prolonged and renewed conflicts have contributed to low levels of voluntary repatriation, with levels of returns between 2011 and 2015 accounting for only 10 per cent of all returns over the last two decades.
WORLD MIGRATION REPORT 2018 23
While there are many challenges to measuring those benefiting from local integration, UNHCR estimates that, in 2016, 23 countries reported at least one naturalized refugee (compared with 28 countries in 2015), with a total of 23,000 naturalized refugees for the year (compared with 32,000 in 2015). Canada, which naturalized an estimated 16,300 refugees in 2016 (compared with 25,900 in 2015), represents the greatest proportion, with France, Belgium and Austria contributing the bulk of the rest.
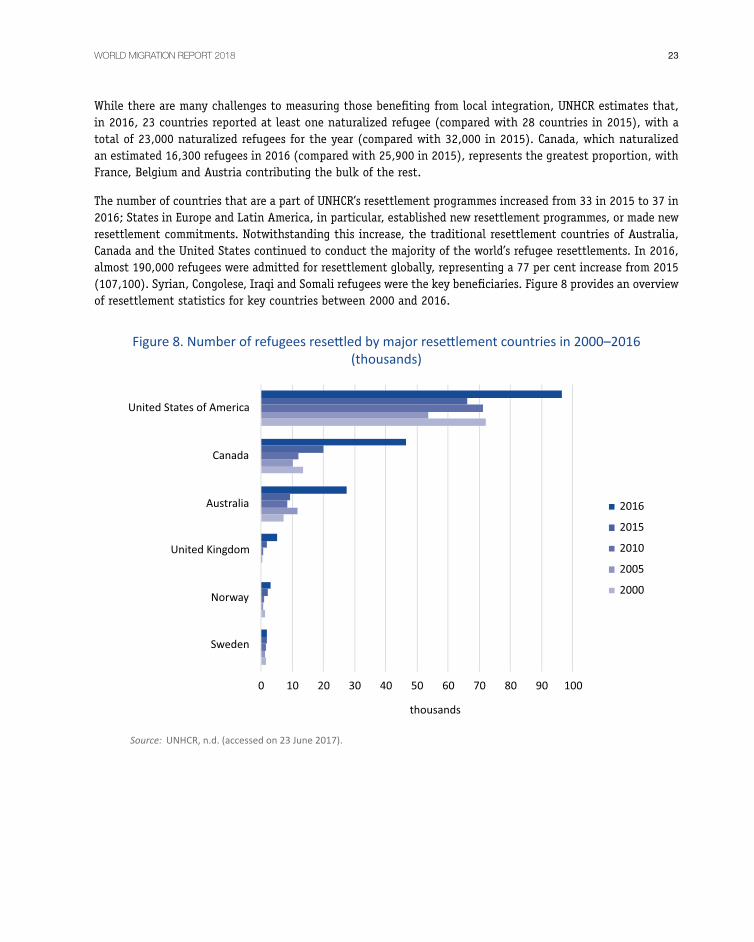
The number of countries that are a part of UNHCR’s resettlement programmes increased from 33 in 2015 to 37 in 2016; States in Europe and Latin America, in particular, established new resettlement programmes, or made new resettlement commitments. Notwithstanding this increase, the traditional resettlement countries of Australia, Canada and the United States continued to conduct the majority of the world’s refugee resettlements. In 2016, almost 190,000 refugees were admitted for resettlement globally, representing a 77 per cent increase from 2015 (107,100). Syrian, Congolese, Iraqi and Somali refugees were the key beneficiaries. Figure 8 provides an overview of resettlement statistics for key countries between 2000 and 2016.
Figure8.Numberofrefugeesresettledbymajorresettlementcountriesin2000–2016 (thousands)
Source: UNHCR,n.d.(accessedon23June2017).

Migration and migrants: A global overview24
IOM’s role in resettlement
IOMarrangessafeandorganizedtravelforrefugeesthroughresettlementprogrammes,aswellasforothervulnerablepersonsofconcernmovingthroughotherhumanitarianpathways.Beyondclassicalrefugeeresettlementandhumanitarianadmissionprogrammes,moreStatesareinterestedinorarecurrently carrying out other forms of admission, such as humanitarian visas, private sponsorships,academicscholarshipsandlabourmobilityschemes.IOM’smovementdataforresettlementassistancerefertotheoverallnumberofrefugeesandotherpersonsofconcerntravellingunderIOMauspicesfromvariouscountriesofdeparturetodestinationsaroundtheworldduringagivenperiod.
Duringcalendaryears2015and2016, IOMsupportedsome43States incarryingout resettlement,humanitarianadmissionandrelocationinitiativesinover140countriesofdeparture,withsignificantoperationsconductedinAfghanistan,Ethiopia,Iraq,Jordan,Kenya,Lebanon,Malaysia,Nepal,Thailand,TurkeyandtheUnitedRepublicofTanzania.In2015,atotalof126,867individualstravelledto30StatesunderIOMauspicesforresettlementassistance;thetopnationalitieswereSyrians,Burmese,Iraqis,AfghansandSomalis.In2016,atotalof204,937individualstravelledto39StatesunderIOMauspicesforresettlementassistance;thetopnationalitieswereSyrians,Congolese,Iraqis,AfghansandSomalis.Eachyear,thegenderbreakdownremainsthesame,with51percentmalesand49percentfemalesresettlingtothirdcountries.Between2010and2016,annualresettlementbyIOMincreasedbymorethan103percent,withover100,000vulnerablepersonsofconcernin2010,andcloseto205,000in2016.ThisislargelyduetotheemergencyresettlementofSyriansandadmissionofIraqiandAfghantranslators/interpretersthroughspecial immigrationvisas.An increase inSyrianresettlementbeganinthelatterhalfof2015,notablytoCanada,theUnitedKingdom,theUnitedStatesofAmerica,andanumberofEuropeancountriessuchasGermanyandSweden.
Under cooperative agreements, IOM provides stakeholders with necessary information and sharesdatawithkeypartnerssuchasUNHCR,resettlementcountriesandsettlementagencies.IOMworksinclosecollaborationwithUNHCRonaregularbasistoverifyandbetteralignaggregatedatarelatedtoresettlement,specificallyarounddeparturesfigures.
FormoreinformationonIOM’sresettlementactivities,see:www.iom.int/resettlement-assistance.
Internally displaced persons
IDMC compiles data on two types of internal displacement: new displacements during a given period, and the total stock of IDPs at a given point in time. At the end of 2016, there were 31.1 million new internal displacements in 125 countries.38 Disasters triggered by rapid-onset hazards were associated with the majority,
38 Thecontent inthissubsectionisbasedonanddrawnfromIDMC,2017andIDMC,2016.Pleaserefertothesedocumentsforexplanatorynotes,deeperanalysis,caveats,limitationsandmethodologiesassociatedwiththenumbersandtrendspresented.Theyear2016wasthefirstyearthatIDMCproducedasingleandcombinedannualreportthatincludedfiguresforconflictandviolenceaswellasdisasters. IDMC’spreviousGlobalEstimatesreports(availablefromwww.internal-displacement.org/global-report/),aswellasitsGlobalInternalDisplacementDatabase(availablefromIDMC,n.d.),areotherkeysourcesofinformation.
WORLD MIGRATION REPORT 2018 25
at 24.2 million new internal displacements in a total of 118 countries. Conflict and generalized violence accounted for the rest, at 6.9 million in 37 countries. In its latest report, IDMC reiterates the complexities associated with distinguishing between conflict and disasters as the immediate cause of displacement, and it highlights the growing need to identify better ways to report on displacement in the context of multiple drivers.39
The total global stock of people internally displaced by conflict and generalized violence at the end of 2016 was 40.3 million, having fallen from 40.8 million in 2015 – the highest on record since IDMC began monitoring in 1998. As with trends for refugees (discussed in the previous section), intractable and new conflicts have meant that the total number of persons internally displaced by conflicts and generalized violence has almost doubled since 2000, and has risen sharply since 2010. Total global stock figures for persons displaced by disasters are unavailable, although efforts are being made to address this issue. Available data indicate that, over the nine years since 2008, there have been 227.6 million displacements associated with disasters. Sample case data documented in 2015 also suggest that protracted displacement, ranging between 1 and 26 years, is affecting hundreds of thousands of people.
Since 2003, conflicts and violence resulted in an average of 5.3 million new displacements per year. This translates into about 15,000 men, women and children being forced to leave their homes every day.40 Between 2000 and 2015, the average was even higher, at 7.6 million per year or more than 20,000 people per day. The 2016 total of 6.9 million new displacements falls between the two averages, reflecting an overall rising trend since 2003. In 2015, Yemen was the worst-affected country in terms of new displacements (2.2 million) followed by the Syrian Arab Republic (1.3 million) and Iraq (1.1 million). In 2016, however, Yemen, the Syrian Arab Republic and Iraq (which had accounted for more than half of the global total of new displacements for 2015 at 8.8. million), recorded significantly lower figures,41 but still featured among the top 10, as did many other countries that were on the list in 2015. The Democratic Republic of the Congo, noted as an overlooked area of displacement crisis, topped the list in 2016 (with 922,000 people displaced), followed by the Syrian Arab Republic (824,000) and Iraq (659,000). When new displacement by conflict and violence is measured as a proportion of the population, the Syrian Arab Republic re-emerges at the top (with 4,400 displacements per 100,000 inhabitants), followed by El Salvador (3,600 per 100,000 inhabitants) and Libya (2,500 per 100,000 inhabitants). IDMC notes that El Salvador has consistently been one of the most violent countries in the last decade; however, the internal displacement stemming from criminal and gang violence in that country is largely invisible.
The 40.3 million people displaced by violence and conflicts at the end of 2016 are hosted in 56 countries and territories, although there is little variation in the countries that feature at the top. Colombia (with 7,246,000 people displaced) and the Syrian Arab Republic (6,326,000) are well above others and together comprise close to a third of the global stocks. These are followed by Sudan (3,300,000), Iraq (3,035,000), the Democratic Republic of the Congo (2,230,000), then Yemen, Nigeria, South Sudan, Ukraine and Afghanistan. Over 30 million of the global total of 40.3 million people displaced are located in these 10 countries. Indeed, Colombia, the Democratic Republic of the Congo, Iraq, Sudan and South Sudan have featured in the top 10 every year since 2003.
39 Beyond conflict, generalized violence and disasters brought on by rapid-onset natural hazards, global figures on internaldisplacementdonotcapturethemanyothercontextsinwhichpeoplefleetheirhomes,suchascriminalviolence,developmentprojectsandslow-onsetcrisesrelatedtodroughtandenvironmentalchange.InGRID 2016,IDMChighlightstheireffortstocollectdataontheseformsofdisplacementandthecomplexitiesinherentinthischallenge.(See,forexample,IDMC,2016.)
40 IDMC,2017.41 IDMC highlights possible reasons for these changes, including stabilization of front lines of conflicts, ceasefires, restrictions on
freedomofmovement,andchangesinmethodologyfordatacollection.

Migration and migrants: A global overview26
Each year since 2008, an average of 25.3 million people have been newly displaced by disasters.42 This is far greater than the average for conflict and violence, and reflects the indiscriminate, unpredictable and uncontrollable nature of certain hazards. These dimensions are strikingly apparent when considering the number of countries hosting the newly displaced: 118 for disasters, compared with 37 countries for conflict and violence. In 2016 (as in previous years), disasters triggered by climate and weather-related hazards, such as floods and storms, accounted for the bulk of the 24.2 million total (23.5 million or 97%). Since 2009, disasters triggered by geophysical hazards have caused an average of 2 million displacements per year, and have been the second largest contributor to global figures. However, the figures for 2016 were well below average, with roughly 700,000 new displacements recorded. China (7,434,000), the Philippines (5,930,000) and India (2,400,000) had the highest absolute numbers in 2016. As in previous years, the 24.2 million total, while a little less than the running average, far outnumbers new displacements associated with conflicts and violence, as figure 9 shows. IDMC does note, however, that a significant portion of the global total of those newly displaced by disasters is usually associated with short-term evacuations in a relatively safe and orderly manner.
Figure9.NewlydisplacedIDPs(millions)
Source: IDMC,n.d.(accessedon23June2017).
IOM’s Displacement Tracking Matrix
IOM’sdisplacementtrackingmatrix(DTM)systemtracksdisplacementincountriesaffectedbyconflictsornaturaldisasters.TheDTMsystemisdesignedtocapture,processanddisseminateinformationonthemovementsandevolvingneedsofdisplacedpopulationsandmigrants.Dataaresharedintheformofmaps, infographics, reports, interactiveweb-basedvisualizationsandraworcustomizeddataexports.
42 IDMC,2017.

WORLD MIGRATION REPORT 2018 27
Based on a given situation, the system can gather information on populations, locations, conditions,needsandvulnerabilitiesusingoneormoreofthefollowingmethodologicaltools:
(i) Trackingmobilityandcross-sectoralneedsinspecificlocationstotargetassistance;(ii) Trackingmovements(“flows”)andtheoverallsituationatorigin,transitanddestinationpoints;(iii) Registeringindividualsandhouseholdsforbeneficiaryselection,vulnerabilitytargetingand
programming;(iv) Conductingsurveys,togatherspecificinformationfrompopulationsofinterest.
In2015,theDTMsystemtrackedover14.5millionpeoplecaughtinconflictandnaturaldisastersin23countries.IOM’s2015and2016datawerethereferenceforseveralcountryestimatesoninternaldisplacement compiled by IDMCg,h. In October 2015, the DTM system established an informationportal onmigration flows to Europe, which is available from http://migration.iom.int/europe. The portalpublishesinformationonmovementtrends,transitroutes,andstrandedandmissingmigrants.
FormoreinformationonIOM’sDTM,see:www.globaldtm.info.
gIDMC,2017.
hIDMC,2016.
Data gaps and challenges
As evident throughout this chapter, there are several key gaps and challenges associated with the collection and analysis of data on migration. The following section provides a brief overview of some of these key gaps and challenges. However, there is an important body of work that explores these issues in greater detail and we encourage readers interested in the topic to refer to this work.43
Our knowledge and understanding of the scale of international migration is primarily derived from estimates of the stock of international migrants, or the number of people living in a country other than their country of birth at a specific point in time. However, the availability and quality of migrant stock data vary considerably between countries and regions due to limitations in data collection, such as failure to disaggregate key characteristics. For example, censuses, which are an important source of data for measuring migrant stock, are generally performed only every decade or so. They often only record immigrants and not emigrants, and do not document age, or year of migration.44 For example, some countries do not record country of birth, instead focusing on citizenship. This lack of uniformity in concepts and definitions of international migrants at international and national levels makes it difficult to estimate global migrant stock figures.
Data on migration flows are more limited than migrant stock data. Despite increasing efforts to aggregate data on migration flows from national sources, and to improve their comparability and standardization, data on these
43 See,forexample,Poulain,PerrinandSingleton,2006;RaymerandWillekens,2008;deBeeretal.,2010;KralerandReichel,2011.44 Willekens,2016.

Migration and migrants: A global overview28
dynamics of international migration are not available for most countries in the world.45 The UN DESA has compiled flow data for only 45 countries, while the OECD reports migration flows for some of its members. However, in both datasets, the duration used to define a migration event, and the coverage of population at risk, can vary, thereby hampering analysis. There is even less information on the scale, patterns and dynamics of irregular migration flows, due to the clandestine and fluid nature of this form of migration.46 The recent increase in such flows across the Mediterranean has prompted some actors to improve efforts to collect data on movements to Europe, but relatively little is known about numbers, patterns and characteristics in other parts of the world.47
Knowledge on the global scale and characteristics of labour migration is primarily based on estimates compiled by the ILO. These figures likely underestimate the true scale, due to a range of factors, such as the frequent undercounting of short-term labour migration movements. As with global migrant stocks, estimates of migrant workers and their respective characteristics suffer from statistical, definitional and methodological complexities. Estimates of global remittances are available annually through the World Bank but, again, there are caveats and considerable limitations associated with the available figures.
Several actors – notably, UNHCR, IDMC, UNODC and IOM – continue to improve the availability and coverage of global data on populations in situations of vulnerability (such as refugees, asylum seekers, IDPs and victims of trafficking), even though data collection in the context of conflicts, violence and disasters is inherently challenging. Methodological, operational and political complexities arise due to the nature of emergencies, as well as the characteristics, vulnerability and “visibility” of the populations being measured. The shortage of quantitative data on movements associated with environmental change, including climate change, however, represents a key gap. The multicausal nature of such movements presents particular challenges. Evidence on long-term trends associated with disasters, such as duration of displacement and subsequent movements and trajectories, is also scarce. These gaps have been recognized and efforts are under way to innovate and overcome these barriers.
Conclusion
In recent years, there has been an undeniable increase in available information and knowledge, as well as interest in migration globally. Spurred in part by large-scale movements of migrants (including refugees) and a growing interest in international cooperation on migration, governments, international organizations and other actors are engaged in ongoing efforts to build a stronger evidence base on the scale and characteristics of migration globally. There are also noteworthy gaps in knowledge at the global level. As this chapter illustrates, the available information is in many ways limited and fragmented, with more known about certain countries and regions than others. There are myriad complexities associated with collecting and comparing data on specific facets of migration. Even so, and despite evolving migration drivers and patterns, there is momentum for improving the availability and quality of global data on international migration through innovation and concerted effort, aided in part by its inclusion in the 2030 Sustainable Development Agenda48 and technological transformations.
45 UNDESA,2015c;Vezzoli,Villares-VarelaanddeHaas,2014;Lemaitreetal.,2007;Poulain,PerrinandSingleton,2006.46 Kraler and Reichel, 2011.47 McAuliffeandMence,2017.48 UN DESA, 2015e.

WORLD MIGRATION REPORT 2018 29
In this chapter, we have provided a global overview of migration and migrants, based on the current data available. Notwithstanding the data gaps and challenges in providing a global big picture, several high-level conclusions can be drawn. The available data can provide insights into global migration dynamics and trends, and contribute to informed decision-making. They also tell a story.
While we know that most people in the world continue to live in the country in which they were born, more people are also living in other countries, especially those within their region. At the same time, many are migrating to high-income countries that may be further afield. International migrants constitute a small – albeit growing – portion of the world’s total population. Global data on irregular migrant stocks, on the other hand, are unavailable.
Innovations and improvements are required for a better understanding of global trends in regular migration flows, so that coverage can expand beyond the 45 or so countries for which information exists. There is also growing recognition that people around the world are dying while migrating, particularly when using clandestine channels that rely on the services of smugglers and traffickers. This type of information is relatively new, and its quality and coverage require improvement.
Work is the major reason that people migrate internationally, and migrant workers constitute a large majority of the world’s international migrants. Most live in high-income countries and are engaged in the service sector. Male migrant workers outnumber females, while male migrants also have a higher labour force participation rate than female migrants. Most of the top remittance-sending countries remained the same between 2000 and 2015, as have the world’s top remittance-receiving countries. Overall, total global flows of remittances increased substantially between 2000 and 2016.
Finally, global displacement caused by conflict, generalized violence and other factors is at a record high. Intractable, unresolved and recurring conflicts and violence have led to an upsurge in the number of refugees around the world, with women and children comprising a substantial portion of the total. While a handful of countries continue to provide solutions for refugees, overall, these have been insufficient to address global needs. Similar factors have displaced millions of people within their own countries, while displacement associated with conflict and violence has nearly doubled since 2000. Yet, each year, new displacements associated with rapid-onset hazards far outnumber those due to conflict and violence, and there is a recognized need to gather better cumulative data. Better data on movement associated with environmental change, including the effects of climate change, are also required.
Migration and migrants: A global overview30
Appendix A
Key migration concepts and definitions
Internally displaced person (IDP)
The 1998 UN Guiding Principles on Internal Displacement define IDPs as:
[…] persons or groups of persons who have been forced or obliged to flee or to leave their homes or places of habitual residence, in particular as a result of or in order to avoid the effects of armed conflict, situations of generalized violence, violations of human rights or natural or human-made disasters, and who have not crossed an internationally recognized State border.
For more information on IDPs, and applicable definitions and associated caveats, refer to the IDMC documents and sources referenced in that section.
International migrant
The 1998 United Nations Recommendations on Statistics of International Migration, Revision 1, set out the key concepts related to the measurement of international migration. The Recommendations define an international migrant as any person who changes his or her country of usual residence (p. 9).49
Per the Recommendations, the country of usual residence is that in which the person has a place to live where he or she normally spends the daily period of rest.50 Also, people travelling abroad temporarily for purposes of recreation, holiday, business, medical treatment or religious pilgrimage51 should not be included in the international migrant group, as these cases do not imply a change in the country of usual residence.
The Recommendations also distinguish between long-term migrants and short-term migrants. A long-term migrant is defined as a person who moves to a country other than that of his or her usual residence for a period of at least a year (12 months), so that the country of destination effectively becomes his or her new country of usual residence (p. 10).52 Short-term migrants are defined as persons who move to a country other than that of their usual residence for a period of at least 3 months but less than a year53 – except for those travelling for the purposes indicated above, which exclude a change in the country of residence.
Therefore, an immigrant must not have been a usual resident, and will establish usual residence in the country he or she has entered. An emigrant should have been a usual resident of the country from which he or she is departing, and should be establishing usual residence in another country. Use of this definition allows for the collection of internationally comparable data on migration. While the UN recommends that such
49 UN DESA, 1998. 50 Ibid.51 Ibid.52 Ibid.53 Ibid.
WORLD MIGRATION REPORT 2018 31
a definition be adopted by national data systems, this should not be confused with administrative and legal definitions of an international migrant used in each country.54 It should also be noted that core concepts and definitions on international migrant embodied in national practices may often differ from concepts and definitions recommended by the UN; statistics on international migrant stocks presented in this chapter reflect national definitions and not necessarily those recommended by the UN.
Irregular migration
Although there is no universally accepted definition of irregular migration, it can be broadly defined as “movement that takes place outside the regulatory norms of the sending, transit and receiving countries”.55 From the perspective of a destination country, irregular migration may imply entry, stay or work in a country without the necessary authorization or documents required under immigration regulations. From the perspective of a sending country, irregularity implies not fulfilling the administrative requirements for leaving the country, or leaving such country without a valid passport or travel document.
Migration stocks and flows
Statistics on the size of the migrant population are normally based on stocks (the total number of international migrants present in a given country at a specific point in time) and flows (the number of migrants entering or leaving a country during a given period – typically one year). The term country used in these definitions may also refer to other units (such as territories and areas).56
The main criteria used for categorizing migrant stocks and flows are country of birth and citizenship, which are defined below. (Actual or intended duration of stay is a further element required for collection of statistics on migration flows.)57
• Citizenship indicates the particular legal bond between an individual and his or her country (State), acquired by birth or naturalization, whether by declaration, choice, marriage or other means according to national legislation.
• Country of birth refers to the country of residence (in its current borders, if the information is available) of the mother at the time of the birth or, in default, the country (in its current borders, if the information is available) in which the birth took place.
54 IOM,n.d.h.55 Ibid.;andIOM,2017a.56 UNDESA,2015b.57 IOM,n.d.h.

Migration and migrants: A global overview32
Migrant worker
Article 2(1) of the 1990 International Convention on the Protection of the Rights of All Migrant Workers and Members of Their Families defines the term migrant worker as: “a person who is to be engaged, is engaged, or has been engaged in a remunerated activity in a State of which he or she is not a national”. Article 3 goes on to note that the Convention does not apply to a number of groups, including refugees, stateless persons and trainees, among others.
Other global-level, legal definitions of the term migrant worker and related terms can be found in ILO Conventions, including the Migration for Employment Convention (Revised) 1949 (No. 97) and the Migrant Workers (Supplementary Provisions) Convention 1975 (No. 143).
For more information on migrant workers, and applicable definitions and associated caveats, refer to the ILO documents and sources referenced in that section.
Refugee
Article 1 of the 1951 Convention relating to the Status of Refugees, read together with its 1967 Protocol relating to the Status of Refugees, defines persons who fall within the global legal definition of a refugee. Article 1(A)(2), in particular, states that the term shall apply to any person who:
[…] owing to well founded fear of being persecuted for reasons of race, religion, nationality, membership of a particular social group or political opinion, is outside the country of his nationality and is unable or, owing to such fear, is unwilling to avail himself of the protection of that country; or who, not having a nationality and being outside the country of his former habitual residence as a result of such events, is unable or, owing to such fear, is unwilling to return to it.
Other provisions in Article 1 provide further guidance on persons who do not fall within this definition or persons who may cease to be refugees. Additionally, UNHCR’s Statute, UN General Assembly Resolutions and ECOSOC Resolutions also provide further guidance on persons may fall within UNHCR’s competence.58
For more information on refugees and asylum seekers, and applicable definitions and associated caveats, refer to the UNHCR documents and sources referenced in that section.
Remittances
The International Monetary Fund (IMF) refers to remittances as “household income from foreign economies arising mainly from the temporary or permanent movement of people to those economies”.59 Following the same definition, “remittances include cash and noncash items that flow through formal channels, such as via electronic wire, or through informal channels, such as money or goods carried across borders. They largely consist of funds and noncash items sent or given by individuals who have migrated to a new economy and
58 Formore,seeUNHCR,2013.59 IMF,2009.
WORLD MIGRATION REPORT 2018 33
become residents there, and the net compensation of border, seasonal, or other short-term workers who are employed in an economy in which they are not residents”.60
Therefore, remittances are normally calculated as the sum of “compensation of employees” and “personal transfers”.61 “Compensation of employees”, in relation to remittance calculations, is defined as “the income of border, seasonal, and other short-term workers who are employed in an economy where they are not resident and of residents employed by nonresident entities”;62 this means that salaries earned by resident employees of international organizations, embassies and consular offices, and other non-resident businesses are included in remittance calculations, although they technically do not (necessarily) imply transfer between resident migrants and non-resident households. Such amounts may also be very significant in certain countries where non-resident entities are numerous or employ high numbers of people. “Personal transfers” consist of all “current transfers in cash or in kind made or received by resident households to or from nonresident households”, thus including “all current transfers between resident and nonresident individuals”.63 Personal transfers may thus also provide an overestimate of actual transfers between resident migrants and non-resident households, which are what is commonly regarded as remittances. At the same time, the upward bias caused by counting remittances as the sum of personal transfers and compensation of employees may be partly offset by the probable undercounting of migrant remittances sent through informal channels. The extent of these biases is, however, very difficult to assess.
For more information on remittances, and applicable definitions and associated caveats, refer to the World Bank documents and sources referenced in that section.
Smuggling of migrants
Article 3(a) of the Protocol Against the Smuggling of Migrants by Land, Sea and Air defines “smuggling of migrants” as:
[…] the procurement, in order to obtain, directly or indirectly, a financial or other material benefit, of the illegal entry of a person into a State Party of which the person is not a national or a permanent resident.
Articles 3(b) and (c) provide further clarification:
(b) “Illegal entry” shall mean crossing borders without complying with the necessary requirements for legal entry into the receiving State;
(c) “Fraudulent travel or identity document” shall mean any travel or identity document:
(i) That has been falsely made or altered in some material way by anyone other than a person or agency lawfully authorized to make or issue the travel or identity document on behalf of a State; or
60 Ibid.61 Alvarezetal.,2015.62 IMF,2009.63 Ibid.

Migration and migrants: A global overview34
(ii) That has been improperly issued or obtained through misrepresentation, corruption or duress or in any other unlawful manner; or
(iii) That is being used by a person other than the rightful holder;
Trafficking in persons
Article 3 of the 2000 Protocol to Prevent, Suppress and Punish Trafficking in Persons, Especially Women and Children, supplementing the United Nations Convention against Transnational Organized Crime, defines “trafficking in persons” as:
(a) […] the recruitment, transportation, transfer, harbouring or receipt of persons, by means of the threat or use of force or other forms of coercion, of abduction, of fraud, of deception, of the abuse of power or of a position of vulnerability or of the giving or receiving of payments or benefits to achieve the consent of a person having control over another person, for the purpose of exploitation. Exploitation shall include, at a minimum, the exploitation of the prostitution of others or other forms of sexual exploitation, forced labour or services, slavery or practices similar to slavery, servitude or the removal of organs;
(b) The consent of a victim of trafficking in persons to the intended exploitation set forth in subparagraph (a) of this article shall be irrelevant where any of the means set forth in subparagraph (a) have been used;
(c) The recruitment, transportation, transfer, harbouring or receipt of a child for the purpose of exploitation shall be considered “trafficking in persons” even if this does not involve any of the means set forth in subparagraph (a) of this article;
(d) “Child” shall mean any person under eighteen years of age.
For more information on human trafficking, and applicable definitions and associated caveats, refer to the UNODC documents and sources referenced in that section.

WORLD MIGRATION REPORT 2018 35
Appendix B
Diaspora
The term diaspora has been extensively discussed and defined in a variety of ways, across several academic disciplines, although there is no single agreed-upon definition. In general, it refers to a country’s nationals or citizens abroad and their descendants. The term diaspora literally means dispersion (from dia speirein or “to scatter across” in Greek). Some scholars agree that the distinguishing characteristic of diasporas from other migrant groups is the presence of strong cultural, linguistic, historical, religious and affective ties with the country or community of origin, or a sense of shared identity and belonging.64 Defining diasporas on the basis of nationality (for example, the Chinese or Indian diasporas) may often hide differences between groups, such as religion or ethnicity. Others suggest that the term transnational communities may better describe the reality of contemporary migration experiences, whereby migrants may establish and maintain connections with people in their home communities or migrants in other countries, thus “belonging to two or more societies at the same time”.65
Defining diaspora for statistical purposes is extremely challenging. The complexity, sensitivity and lack of a common definition hinder the compilation of internationally comparable statistics on diaspora populations. At the national level, countries may have a statistical definition of diaspora, often reflecting their historical and political trajectories; however, emigrants and their descendants may or may not identify as members of diaspora, independently of the definition and political approach that their country of origin may utilize towards diaspora. Moreover, collection of information on emigrants often relies on data from host countries, which may be available for foreign nationals, but less so for their children or descendants. National population censuses and household surveys in countries of origin may provide some information on nationals living abroad, but issues of frequency (of censuses) and sampling (of surveys) are the main obstacles to a timely and comprehensive picture of diaspora groups. Therefore, even for single countries, quantification and qualification of diaspora groups – diaspora mappings – are hard to accomplish. IOM has assisted a number of countries in their efforts to map their diasporas; see the text box below on IOM’s work. For these reasons, generating a reliable estimate of the global stock of diasporas is an almost impossible task, unless the definition is narrowed down to groups of emigrants for whom data are available for most countries. This has been attempted by the OECD and the World Bank.66
64 VertovecandCohen,1999.65 Vertovec,2005.66 See, forexample,OECD,2012b. In this2012OECD report,diasporasweredefinedas foreign-bornpersonsaged15orolderby
countryofbirth,andtheirchildrenbornindestinationcountries.However,asmentionedinthereport,informationonchildrenofmigrantsindestinationcountriesisoftennotdisaggregatedbyanumberofcharacteristics.Therefore,informationonsexandageofdiasporasisnotprovidedinthereport.Also,onlygroupsresidinginOECDcountriesareconsidered,andstatisticsrefertotheyear2008.ThelargestdiasporasintheentiregroupofOECDcountrieswerethoseofMexico,withabout20millionpeople(or16%ofthetotaldiasporainOECDcountriesinthatyear),followedbyItaly(with5.2million–4%ofthetotal),Germany(4.1million–3%ofthetotal),India(3.8million–3%ofthetotal),andtheUnitedKingdom(2.9million–3%ofthetotal).AnupdatetothisOECDreportwasreleased in 2015.

Migration and migrants: A global overview36
IOM’s diaspora mapping
WithinIOM,thetermdiasporaisusedinterchangeablywithtransnational communities. Both terms refer tomigrantsordescendantsofmigrants,whose identityandsenseofbelonginghavebeenshapedbytheirmigrationexperienceandbackground.IOMusesthetermtransnational communitiesbecause,inaworldofunprecedentedglobalmobility,thesecommunitiescomprisepeoplewhoareconnectedtomorethanasinglecountry.Thisallowsforamorecomprehensiveapproachandfacilitatesinformationanddatacollection.
To provide relevant information on diaspora populations, while identifying potential individuals whowouldbeinterestedininvestingandcontributingtheirskillsintheirnativecountries,IOMmapsdataandideasthatareultimatelyusedinformulatingpolicypropositionsandrecommendations.Inmanycases,thedetermining factor for IOMtoengage transnational communities in itsprogramming isa requestfromthegovernmentofthediaspora-hostingcountryorthecountryoforigin.TheguidingprincipleforIOM’sparticipationshouldbethatofservingtheinterestsofallpartners:thecountriesthattransnationalcommunitiesareconnectedto,thediasporathemselves,andthesourcecountrycommunities.IOMhasformulateda comprehensiveapproachbasedon the3Es foraction: toEnable, EngageandEmpowertransnational communities as agents for development, with each stage involving interventions bygovernmentsandotherstakeholders,supportedbyIOMthroughpolicyadviceandprogramming.
Enabling Engaging Empowering
Maximizingthepotentialoftransnationalcommunities
Knowing and understanding transnationalcommunities
Facilitatingthemobilizationofskills,expertiseandresourcesof
transnationalcommunities
From2000to2016,IOMproducedmorethan100diasporamappingreportsforupto61countriesoforiginand75countriesofdestination,mostofwhichwereEuropeanorotherOECDcountries.Morethana thirdof themapping reports relate tomigrantsoriginating from theAsiaand thePacific,andCentral andWestAfrica regions. Diasporamapping focuses on different priorities, depending on thecontext in which the diaspora engagement takes place. Although most of the reports focus on thesociodemographic and economic profiles of diaspora communities, the objectives of suchmappingsvary fromananalysisof thecommunicationchannels thatparticulardiasporacommunitiesutilize, totheidentificationofhighlyandsemi-skilledprofessionals,amongothers.IOMisparticularlyinvolvedinsupportingtheactiveparticipationofdiasporaprofessionalsintheircountriesoforigin–forinstance,inthehealthandeducationsectors,wherespecificdevelopmentneedshavebeenidentified.

WORLD MIGRATION REPORT 2018 37
Appendix C
Irregular migration flows
As discussed in chapter 2, analysing data on the movements of people between countries and regions who are using regular visa and migration pathways is inherently difficult, as relatively few countries systematically collect and report such information. The difficulties are even more profound when it comes to capturing data on irregular migration flows – which, by their very nature tend to be clandestine, given that most (but not all) migrants seek to evade the authorities during such migration journeys. Consequently, there are no available data on irregular migration flows globally or regionally. In addition, relatively few countries globally have the capacity to fully monitor and collect data on irregular migration flows into or out of their territory. (Some notable exceptions include the more remote countries of Australia and New Zealand, where the atypical geographical isolation makes data collection much more straightforward.)67 Many countries around the world continue to invest in border management capabilities and technologies allowing for the capture of data related to irregular migration flows. Some commentators question the utility of attempting to quantify irregular migration, citing the practical difficulties as well as the underlying rationale for collecting and citing such statistics, which can amount to alarmism.68 There are, however, clear benefits to attempting to quantify irregular movements from the perspectives of national governments, regional and local governments, humanitarian service providers and others. A better understanding of the nature and extent of irregular migration flows would facilitate the development of more effective responses and mitigation strategies, particularly for populations at risk of displacement or irregular migration.69
Irregular migration flows are commonly considered to mean irregular entry into transit and destination countries, although irregular departure has also been a feature of certain regions and countries historically (for example, East Germany between 1949 and 1990) and contemporaneously (for example, the Democratic People’s Republic of Korea, or North Korea). Some people who undertake irregular migration – departure and/or entry – have an express need not to evade authorities, but rather to engage with authorities or others (such as UNHCR) in order to seek protection. At certain times and in certain locations, refugees and asylum seekers may make up a substantial proportion of people moving irregularly along particular migration corridors. Irregular migration may place migrants in dangerous and life-threatening situations, as tragically demonstrated by the estimated number of migrant fatalities and disappearances globally recorded by IOM’s Missing Migrants Project (see text box on IOM’s MMP in chapter 2).
The little that is known of global irregular migration flows is deduced from estimates of irregular migrant stocks (as imprecise as they may be), under the assumption that irregular migrants entered via irregular means (that is, without prior permission of authorities). To some extent, this is likely to be true; however, many irregular migrants do not engage in unauthorized entry but, instead, take on irregular immigration status deliberately or unknowingly after arrival. Against this backdrop, irregular maritime migration flows, with their heightened visibility in recent years, may appear to be more significant and perhaps larger in scale than they are in practice, compared with other similar flows. This is particularly relevant to irregular maritime migration flows to developed countries such as Australia, Greece, Italy, Spain and the United States. That is
67 McAuliffeandKoser,2017.68 Castles,2002;Clarke,2000.69 McAuliffe,2017.

Migration and migrants: A global overview38
not to downplay the challenges and difficulties posed by irregular migration flows; however, in the absence of other data and information, it is extremely difficult to place these flows, which are often closely monitored, in a broader context. This is illustrated in the text box on irregular maritime migration flows, below.
Irregular maritime migration flows
Unlikeotherformsofirregularmigration,thenumbersofirregularmaritimemigrantsmovingfrompoor,lessdevelopedand/orconflict-riddencountriestodevelopedcountries,suchastheflowsheadingforAustralia,EuropeandtheUnitedStates,arerelativelywelldocumented.Oneofthereasonsthatthismovementismonitoredsocloselyisthatitishighlyvisible.Italsotendstobeafocusofintensepublicinterest.Consequently,highlyregulatedborder-managementprocesseshaverecentlybeendeveloped,thereby increasingcertaincountries’capacity tocountandreporton thescopeof irregularmaritimeflows.TheU.S.CoastGuard,forexample,reportsprecisefiguresgoingbackto1995.TheEU’sFrontexhas increased its capacity, especially since2008, to reporton thenumberofpersonsdetectedwhileundertakingmaritimemigrationintheMediterraneanandNorthAtlantic.TheseflowsaretypicalofthefocusonSouth–Northmovementandhighlighttheinterestinmonitoringirregularmaritimemigrationto the North.
The scale of irregular maritime migration is difficult to quantify outside of the main South–Northmigrationcorridors.Thatsaid,evenasrecentlyas10yearsago,suchmovement intoEuropewasnotmonitoredand reportedon in thehighly systematizedway it is today through Frontex.Data tend tocaptureinterdictions/detections,andsoclearlydonotcaptureallattempts(successfulorotherwise).Itislikelythattherearesuccessfulundetectedmaritimeventuresinallcontextsbut,arguably,thisislesslikelyinsomecircumstances.Forexample,itispossiblethatfailingtobeinterceptedoffthenorth-westcoastofAustraliabyauthoritiesmayresultinirregularmigrantsperishingintheveryharshandisolatedcoastalregions;theneedtobedetectedbyauthoritiesisagenuineone.
BasedonMcAuliffeandMence(2017).

WORLD MIGRATION REPORT 2018 39
Appendix D
Human trafficking
Trafficking in persons is defined in Article 3 of the Protocol to Prevent, Suppress and Punish Trafficking in Persons, Especially Women and Children.70 Due to the clandestine, invisible and underreported nature of human trafficking, however, global estimates of victims of trafficking are limited and extremely challenging to collect. The latest available data, which are from 2014, indicate that 17,752 victims of human trafficking were detected in 85 countries.71 Between 2012 and 2014, 63,251 victims were detected in 106 countries and territories. UNODC notes that the majority of victims detected between 2012 and 2014 (57%) were trafficked transnationally, while the rest were trafficked within national borders.72 For the same reasons that there are limited data, actual numbers of victims are likely to be much higher than the detected number of victims.73
Of the total victims detected in 2014, women and girls comprised the majority, at 71 per cent of the total. Since the UNODC began collecting data on trafficking in persons in 2003, females have constituted the majority share of detected victims, although this proportion has decreased from 84 per cent in 2004, in line with the increasing recognition that males are also victims. Between 2012 and 2014, one in five detected victims were men. The share of children among detected victims has also risen from 13 per cent in 2004 (10% girls and 3% boys) to 28 per cent in 2014 (20% girls and 8% boys), down from a peak in 2011 at 34 per cent.
While detected victims were trafficked for a variety of reasons, including sexual exploitation, forced labour, forced marriage, begging and organ removal, sexual exploitation has predominated since 2003. The proportion has changed since 2008, however, from 61 per cent to 54 per cent in 2014. During the same period, the share of detected victims trafficked for forced labour has also changed from 31 per cent to 38 per cent, although 2011 and 2013 saw higher proportions (40% and 39%, respectively). When the total number of detected victims is disaggregated by sex and form of exploitation, it becomes apparent that greater proportions of women are subject to sexual exploitation (for example, 72% of the total detected female victims in 2014), while greater proportions of males are subject to forced labour (for example, 85.7% of the total detected male victims in 2014). UNODC notes that about four out of 10 detected victims were trafficked for forced labour between 2012 and 2014. Of these victims, 63 per cent were men.
There is recognition of the need to obtain better data on victims of trafficking. The adoption of the UN’s Sustainable Development Goals (SDGs) provides fresh impetus to improve the data, with the “number of
70 SeeappendixAfordefinitionoftrafficking in persons.71 Thecontent in this subsection isbasedonanddrawn fromUNODC,2016.Please refer to thisdocument forexplanatorynotes,
deeperanalysis,caveats,limitationsandmethodologiesassociatedwiththenumbersandtrendspresentedhere.UNODC’spreviousGlobalReportsonTraffickinginPersonsareotherkeysourcesofinformation.AnotherkeyglobalsourceofinformationontraffickingistheUnitedStatesDepartmentofState'sTraffickingPersonsReports,availablefromUnitedStatesDepartmentofState,2017.
72 Giventhedefinition,humantraffickingmaysometimesbeinaccuratelyunderstoodtoinvolveinternationalorinternalmigration.However,suchmovementisunnecessaryforsomeonetobeclassifiedasavictim.Inthiscontext,thenumberofdetectedvictimsdoes not necessarily meanmigrant victims of human trafficking. That said, many cases of trafficking do involve internal orinternationalmigration.
73 For example, theGlobal Slavery Index estimates that, in 2016, therewere 45.8million people living inmodern slavery in 167countries,with58percentofthispopulationin justfivecountries:Bangladesh,China, India,PakistanandUzbekistan(seeWalkFree Foundation, 2016, and www.globalslaveryindex.org/findings/). In 2012, the ILO estimated that, globally, there were 20.9millionvictimsofforcedlabour,with9.1million(or44%)havingmovedinternallyorinternationally(seeILO,2016).Whilethelegaldefinitionsof forced labour, slavery and trafficking in personsaredistinct, thereareoverlapsbetweenthedefinitionssuch thatpersonsestimatedasvictimsofforcedlabourorslaverycanalsobevictimsoftrafficking.

Migration and migrants: A global overview40
victims of human trafficking per 100,000 population, by sex, age and form of exploitation” included as an indicator under Goal 16 (Indicator 16.2.2).74 IOM’s operational efforts also provide useful insights (see below).
IOM’s data on assistance to victims of human trafficking
IOMbeganassistingvictimsoftraffickinginthe1990s.IOM’sglobaldatabase,thelargestofitskind,containsdata, includingprimarydata,on46,000 identified victimsof trafficking,whohavebeen: (1) identified; (2)assisted;or(3)identifiedandassistedbyIOM.Thesevictimsrepresent140nationalitiesandhavebeenidentified in150countries. Thisdatabasecontinues to increasebyapproximately5,000casesperyear.Forvarious reasons,however,notall thevictimsassistedby IOMarealways recorded in thedatabase.Additionally,IOMdataareonlycollectedinlocationswhereIOMhascounter-traffickingoperations.
AmongthevictimsoftraffickingrecordedinIOM’sdatabase,between2005and2015,theproportionofmalehumantraffickingvictimshasincreased,theproportionofvictimssubjecttosexualexploitationhasdeclined, and theproportion subject to forced labourhas grown.During the sameperiod, theaverage ageof victimswas 26 years (at thetimeof assistance), andhalf of the victimswere agedbetween18and34years.
During 2015 to 2016, 8,976 victims of human trafficking were identified, assisted, or identified andassisted.Theaverageagewas29years,althoughmalevictimswereolder,onaverage,thanfemales.Ofthetotalfortheperiod,approximately15percentwerechildren.
ThegraphbelowshowsIOM’sdatadisaggregatedbysectorsofexploitation.Thosefoundinsectorssuchasmining,construction,andlow-levelcrimearealmostexclusivelymen,whereasprostitution,hospitalityandtransportaredominatedbywomen.
Sectors of exploitation of identified, assisted, or identified and assisted victims, 2005–2015 (%)
74 UNDESA,2017.

WORLD MIGRATION REPORT 2018 41
IOM also collects data on indicators of the presence of human trafficking and other exploitativepracticesalongmigrationroutes.TheHumanTraffickingandOtherExploitativePracticesPrevalenceIndicationSurveyhasbeenconductedaspartofIOM’sDTMoperationssinceDecember2015.Thesedataindicatethatover30percentofthe16,000migrantsinterviewedalongtheCentralandEasternMediterranean migration routes during 2016 experienced human trafficking or other exploitativepracticesduringthejourney.
Formore informationonIOM’sdataandworkwithvictimsoftrafficking,seewww.iom.int/counter-trafficking.IOM’sprimarydataonidentifiedvictimsofhumantraffickingareavailablefordownloadat www.ctdatacollaborative.org/.

Migration and migrants: A global overview42
References
Abel, G. and N. Sander 2014 Quantifying global international migration flows. Science, 343(6178):1520–1522.
Abel, G., K. Samir and N. Sander 2013 Examining the role of international migration in global population projections. European Population
Conference 2014, 25–28 June 2014, Budapest, Hungary. Demographic Research Institute, Budapest. Available from http://epc2014.princeton.edu/abstracts/140830.
Alvarez, P., P. Briod, O. Ferrari and U. Rieder 2015 Remittances: How reliable are the data? Migration Policy Practice, 5(2):42–46.
Australian National Audit Office (ANAO)
2013 Individual management services provided to people in immigration detention, Canberra.
Castles, S. 2002 Migration and community formation under conditions of globalization. International Migration Review,
36:1143–1168.
Clarke, J. 2000 The problems of evaluating numbers of illegal migrants in the European Union. In: Regularisations of
Illegal Immigrants in the European Union (P. de Bruycker, ed.). Bruylant, Brussels.
Clandestino Research Project Database on Irregular Migration 2009a Clandestino Project Overview: Size and Development of Irregular Migration to the
EU. Database on Irregular Migration. Available from http://irregular-migration.net/typo3_upload/groups/31/4.Background_Information/4.2.Policy_Briefs_EN/ComparativePolicyBrief_SizeOfIrregularMigration_Clandestino_Nov09_2.pdf.
2009b Irregular Migration in Spain. Database on Irregular Migration. Available from http://irregular-migration.net/fileadmin/irregular-migration/dateien/4.Background_Information/4.2.Policy_Briefs_EN/Spain_PolicyBrief_Clandestino_Nov09_2.pdf.
2012 Update Report Greece: The Number of Irregular Migrants in Greece at the End of 2010 and 2011 (T. Maroukis). Database on Irregular Migration. Available from http://irregular-migration.net/fileadmin/irregular-migration/dateien/4.Background_Information/4.5.Update_Reports/Maroukis_2012_Update_report_Greece_2.pdf.
2015 Update Report Germany: Estimated Number of Irregular Foreign Residents in Germany (D. Vogel). Database on Irregular Migration. Available from http://irregular-migration.net/fileadmin/irregular-migration/dateien/4.Background_Information/4.5.Update_Reports/Vogel_2015_Update_report_Germany_2014_fin-.pdf.
de Beer, J., J. Raymer, R. van den Erf and L. van Wissen 2010 Overcoming the problems of inconsistent international migration data: A new method applied to flows
in Europe. European Journal of Population, 6(4):459–481.
de Beer, J., R. van der Erf and J. Raymer 2009 Estimates of OD Matrix by Broad Group of Citizenship, Sex and Age, 2002–2007. Report for the MIMOSA
project. Available from http://mimosa.cytise.be/Documents/Mimosa_2009b.pdf.
Fleischman, Y., S. Willen, N. Davidovitch and Z. Mor 2015 Migration as a social determinant of health for irregular migrants: Israel as case study. Social Science &
Medicine, 147:89–97.

WORLD MIGRATION REPORT 2018 43
Frontex 2010 Beyond the Frontiers: Frontex: The First Five Years. Frontex, Warsaw, p.20. Available from http://
frontex.europa.eu/assets/Publications/General/Beyond_the_Frontiers.pdf.
Gallagher, A. and M. McAuliffe 2016 South-East Asia and Australia. In: Migrant Smuggling Data and Research: A global review of the emerging
evidence base (M. McAuliffe and F. Laczko, eds). IOM, Geneva. Available from https://publications.iom.int/system/files/smuggling_report.pdf.
Gordon, l., K. Scanlon, T. Travers and C. Whitehead 2009 Economic Impact on London and the UK of an Earned Regularization of Irregular
Migrants in the UK. Greater London Authority, London. Available from www.london.gov.uk/sites/default/files/gla_migrate_files_destination/irregular-migrants-report.pdf.
Internal Displacement Monitoring Centre (IDMC) n.d. Database: IDMC Global figures 2016. IDMC, Geneva. Available from http://internal-displacement.org/
database/.
2016 GRID 2016: Global Report on Internal Displacement. IDMC, Geneva. Available from www.internal-displacement.org/globalreport2016/.
2017 GRID 2017: Global Report on Internal Displacement. IDMC, Geneva. Available from www.internal-displacement.org/global-report/grid2017/.
International Labour Organization (ILO) 2015 ILO Global Estimates on Migrant Workers – Results and Methodology. ILO, Geneva. Available from http://
ilo.org/wcmsp5/groups/public/---dgreports/---dcomm/documents/publication/wcms_436343.pdf.
2016 Promoting Fair Migration. ILO, Geneva. Available from http://ilo.org/wcmsp5/groups/public/---ed_norm/---relconf/documents/meetingdocument/wcms_453898.pdf.
International Monetary Fund (IMF) 2009 Balance of Payments and International Investment Position Manual, Sixth Edition (BPM6). IMF,
Washington, D.C.
International Organization for Migration (IOM) n.d.a Glossary on Migration. IOM, Geneva. Available from http://publications.iom.int/ (forthcoming).
n.d.b About: Missing Migrants Project: Tracking Deaths Along Migratory Routes. IOM, Geneva. Available from http://missingmigrants.iom.int/about.
n.d.c Methodology: Missing Migrants Project: Tracking Deaths Along Migratory Routes. IOM, Geneva. Available from http://missingmigrants.iom.int/methodology.
n.d.d Assisted Voluntary Return and Reintegration. IOM, Geneva. Available from www.iom.int/assisted-voluntary-return-and-reintegration.
n.d.e Migration Health: Healthy Migrants in Healthy Communities IOM, Geneva. Available from https://health.iom.int/.
n.d.f Displacement Tracking Matrix (DTM). IOM, Geneva. Available from www.globaldtm.info/.
n.d.g Counter-Trafficking. IOM, Geneva. Available from www.iom.int/counter-trafficking.
n.d.h ECOWAS Training Kit: Meeting National and Regional Needs for Migration Data. Global Migration Data Analysis Centre (GMDAC). IOM, Berlin (forthcoming).
n.d.i Latest Global Figures: Missing Migrants Project: Tracking Deaths Along Migratory Routes. IOM, Geneva. Available from https://missingmigrants.iom.int/.
2016a Assisted Voluntary Return and Reintegration: 2015 Key Highlights. IOM, Geneva. Available from www.iom.int/sites/default/files/our_work/DMM/AVRR/AVRR_2015_Key_Highlights.pdf.

Migration and migrants: A global overview44
2017a Key Migration Terms. IOM, Geneva. Available from www.iom.int/key-migration-terms.
2017b Migration Flows – Europe. Displacement Tracking Matrix. IOM, Geneva. Available from http://migration.iom.int/europe/.
2017c IOM’s Strategy to Enable, Engage and Empower Diaspora. IOM, Geneva. Available from https://diaspora.iom.int/ioms-strategy-enable-engage-and-empower-diaspora.
2017d GMDAC MigFacts: International Migration. IOM: Berlin. Available from http://gmdac.iom.int/gmdac-migfacts-international-migration.
Koser, K. 2010 Dimensions and dynamics of irregular migration. Population, Space and Place, 16(3):181–193.
Kraler, A. and D. Reichel 2011 Measuring irregular migration and population flows – what available data can tell. International
Migration, 49(5):97–128.
Krogstad, J., J. Passel and D. Cohn 2017 5 facts about illegal immigration in the U.S. Pew Research Center, 27 April. Available from www.
pewresearch.org/fact-tank/2017/04/27/5-facts-about-illegal-immigration-in-the-u-s/.
Laczko, F. 2017 Improving data on migration: A 10-point plan. Migration Policy Practice, 7:1, January–March 2017.
Available from https://publications.iom.int/system/files/smuggling_report.pdf.
Lemaitre, G., T. Liebig, C. Thoreau and P. Fron 2007 Standardized Statistics on Immigrant Inflows: Results, Sources and Methods. OECD, Paris.
McAuliffe, M. 2017 The nexus between forced and irregular migration: Insights from demography. In: The Demography of
Refugee and Forced Migration (G. Hugo, J. Abbasi-Shavazi and E.P. Kraly, eds). Springer.
McAuliffe, M. and F. Laczko (eds.) 2016 Migrant Smuggling Data and Research: A Global Review of the Emerging Evidence Base. IOM, Geneva.
Available from https://publications.iom.int/system/files/smuggling_report.pdf.
McAuliffe, M. and K. Koser (eds.) 2017 Introduction. In: A Long Way to Go: Irregular Migration Patterns, Processes, Drivers and Decision Making.
ANU Press, Canberra.
McAuliffe, M. and V. Mence 2017 Irregular maritime migration as a global phenomenon. In: A Long Way to Go: Irregular Migration Patterns,
Processes, Drivers and Decision Making (M. McAuliffe and K. Koser, eds). ANU Press, Canberra.
Nawrotzki R. and L. Jiang 2015 Indirectly estimating international net migration flows by age and gender: The community demographic
model international migration (CDM-IN) Dataset. Historical Methods, 48(3):113–127.
Organisation for Economic Co-Operation and Development (OECD) n.d.a International Migration Database. OECD Stat, Paris. Available from https://stats.oecd.org/Index.
aspx?DataSetCode=MIG.
n.d.b Foreign-born employment. OECD Stat, Paris. Accessed 03 July. Available from https://data.oecd.org/migration/foreign-born-employment.htm (accessed 03 July 2017).
n.d.c Net ODA. OECD State, Paris. Available from https://data.oecd.org/oda/net-oda.htm (accessed 30 June 2017).
2012a International Migration Outlook 2012. OECD Publishing, Paris. Available from www.oecd-ilibrary.org/social-issues-migration-health/international-migration-outlook-2012_migr_outlook-2012-en.

WORLD MIGRATION REPORT 2018 45
2012b Connecting with Emigrants: A Global Profile of Diasporas. OECD Publishing, Paris. Available from www.oecdbookshop.org/en/browse/title-detail/?isb=9789264177949.
2015 International Migration Database. OECD.Stat, Paris. Available from https://stats.oecd.org/Index.aspx?DataSetCode=MIG.
2016a Statistical annex. In: International Migration Outlook 2016. OECD Publishing, Paris. Available from www.oecd.org/els/mig/international-migration-outlook-2016-statistical-annex.pdf.
2016b International Migration Outlook 2016. OECD Publishing, Paris.
Poulain, M. and N. Perrin 2001 Is the measurement of international migration flows improving in Europe. Working Paper No. 12. Joint
ECE-EUROSTAT Work Session on Migration Statistics organized in cooperation with the UN Statistics Division. UN Statistical Commission and the UN Economic Commission for Europe (Eurostat). Geneva, 21–23 May. Available from www.unece.org/fileadmin/DAM/stats/documents/2001/05/migration/12.e.pdf.
Poulain, M., N. Perrin and A. Singleton (eds.) 2006 Towards Harmonized European Statistics on International Migration. UCL Presses Universitaires, Louvain,
Belgium.
Raymer, J. and F. Willekens (eds.) 2008 International Migration in Europe: Data, Models and Estimates. Wiley, Chichester.
Raymer, J., G.J. Abel, G. Disney and A. Wiśniowski
2011 Improving Estimates of Migration Flows to Eurostat. Economic and Social Research Council, Working Paper No. 15, December.
Raymer, J., A. Wiśniowski, J.J. Forster, P.W.F. Smith and J. Bijak 2013 Integrated modeling of European migration. Journal of the American Statistical Association, 108
(503):801–819.
South African Police Service 2010 Annual Report 2009/2010. Available from www.gov.za/sites/www.gov.za/files/saps-annual-report.pdf.
United Nations Department of Economic and Social Affairs (UN DESA) 1998 Recommendations on Statistics of International Migration: Revision 1. United Nations, New York. Available
from https://unstats.un.org/unsd/publication/SeriesM/SeriesM_58rev1E.pdf.
2008 International Migrant Stock: The 2008 Revision. United Nations, New York. Available from https://esa.un.org/migration/index.asp?panel=1.
2015 International Migration Report 2015. Retrieved from www.un.org/en/development/desa/population/migration/publications/migrationreport/docs/MigrationReport2015.pdf
2015a International Migrant Stock: The 2015 Revision. United Nations, New York. Available from www.un.org/en/development/desa/population/migration/data/estimates2/index.shtml.
2015b International Migrant Stock: The 2015 Revision: CD-ROM Documentation. Available from www.un.org/en/development/desa/population/migration/data/estimates2/docs/MigrationStockDocumentation_2015.pdf.
2015c International Migration Flows to and from Selected Countries: The 2015 Revision. United Nations, New York. Available from www.un.org/en/development/desa/population/migration/data/empirical2/migrationflows.shtml.
2015d International Migration Flows to and From Selected Countries: The 2015 Revision. CD-ROM Documentation. United Nations, New York. Available from www.un.org/en/development/desa/population/migration/data/empirical2/docs/migflows2015documentation.pdf.

Migration and migrants: A global overview46
2015e Sustainable Development Goals. United Nations, New York. Available from https://sustainabledevelopment.un.org/sdgs.
2016 Population Facts: Trends in International Migration, 2015. United Nations, New York. Available from www.un.org/en/development/desa/population/migration/publications/populationfacts/docs/MigrationPopFacts20154.pdf.
2017 Sustainable Development Goal 16. Sustainable Development Knowledge Platform. United Nations, New York. Available from https://sustainabledevelopment.un.org/sdg16.
United Nations Development Programme (UNDP) 2009 Human Development Report 2009. UNDP, New York. Available from http://hdr.undp.org/sites/default/
files/reports/269/hdr_2009_en_complete.pdf.
United Nations High Commissioner for Refugees (UNHCR) n.d. Population Statistics. UNHCR, Geneva. Available from http://popstats.unhcr.org/en/persons_of_
concern.
2010 UNHCR Global Trends 2010. UNHCR, Geneva. Available from www.unhcr.org/statistics/country/4dfa11499/unhcr-global-trends-2010.html.
2013 Note on the Mandate of the High Commissioner for Refugees and His Office. Division of International Protection. October 2013. Available from www.unhcr.org/protection/basic/526a22cb6/mandate-high-commissioner-refugees-office.html.
2016 Global Trends: Forced Displacement in 2015. UNHCR, Geneva. Available from www.unhcr.org/576408cd7.pdf.
2017 Global Trends: Forced Displacement in 2016. UNHCR, Geneva. Available from www.unhcr.org/dach/wp-content/uploads/sites/27/2017/06/2016_Global_Trends_WEB-embargoed.pdf.
United Nations Office on Drugs and Crime (UNODC) 2016 Global Report on Trafficking in Persons. UNODC, Vienna. Available from www.unodc.org/documents/data-
and-analysis/glotip/2016_Global_Report_on_Trafficking_in_Persons.pdf.
United States Department of State 2017 Trafficking in Persons Report. Office of the Under Secretary for Civilian Security, Democracy, and Human
Rights. Washington, DC. Available from www.state.gov/documents/organization/271339.pdf.
Vertovec, S. 2005 The Political Importance of Diasporas. Working Paper No. 3. Centre on Migration, Policy and Society,
University of Oxford, Oxford.
Vertovec, S. and R. Cohen (eds.) 1999 Migration, Diasporas and Transnationalism. Edward Elgar, Cheltenham.
Vezzoli, S., M. Villares-Varela and H. de Haas 2014 Uncovering International Migration Flow Data: Insights from the DEMIG Databases. Working paper No. 88.
International Migration Institute, Oxford.
Walk Free Foundation 2016 Global Findings: The Global Slavery Index 2016. Walk Free Foundation, Western Australia. Available from
www.globalslaveryindex.org/findings/.
Willekens, F. 2016 Evidence-based monitoring of international migration flows in Europe. Paper presented at the 2016
Conference of European Statistics Stakeholders (CESS), co-organized by the European Statistical Advisory Committee (ESAC), Budapest, 20–21 October; and at the Eurostat conference, Towards More Agile Social Statistics, Luxembourg, 28–30 November.

WORLD MIGRATION REPORT 2018 47
World Bank n.d.a World Bank Country and Lending Groups. World Bank, Washington, D.C. Available from https://
datahelpdesk.worldbank.org/knowledgebase/articles/906519-world-bank-country-and-lending-groups.
n.d.b Migration and Remittances Data: 24 September 2015 (updated as of April 2017). World Bank, Washington, D.C. Available from www.worldbank.org/en/topic/migrationremittancesdiasporaissues/brief/migration-remittances-data.
n.d.c Migration and Remittances Publications. World Bank, Washington, D.C. Available from www.worldbank.org/en/topic/migrationremittancesdiasporaissues/brief/migration-and-remittances-publications.
2015 Migration and Remittances: Recent Developments and Outlook. Migration and Development Brief 25. World Bank, Washington, D.C. Available from http://pubdocs.worldbank.org/en/102761445353157305/MigrationandDevelopmentBrief25.pdf.
2016a Migration and Remittances Factbook 2016 – Third edition. World Bank, Washington, D.C. Available from https://openknowledge.worldbank.org/bitstream/handle/10986/23743/9781464803192.pdf?sequence=3&isAllowed=y.
2016b Migration and Remittances: Recent Developments and Outlook. Migration and Development Brief 26. World Bank, Washington, D.C. Available from http://pubdocs.worldbank.org/en/661301460400427908/MigrationandDevelopmentBrief26.pdf.
2017a Migration and Remittances: Recent Developments and Outlook. Migration and Development Brief 27. World Bank, Washington, D.C. Available from http://pubdocs.worldbank.org/en/992371492706371662/MigrationandDevelopmentBrief27.pdf.
2017b Remittances to developing countries decline for second consecutive year. Press release, World Bank, Washington, D.C. Available from www.worldbank.org/en/news/press-release/2017/04/21/remittances-to-developing-countries-decline-for-second-consecutive-year.

17 route des Morillons, P.O. Box 17, 1211 Geneva 19, SwitzerlandTel.: +41 22 717 9111 • Fax: +41 22 798 6150E-mail: [email protected] • Website: www.iom.int
Related Documents