WORLD METEOROLOGICAL ORGANIZATION GLOBAL ATMOSPHERE WATCH No. 140 WMO/CEOS REPORT on a STRATEGY for INTEGRATING SATELLITE and GROUND-BASED OBSERVATIONS of OZONE JANUARY 2001

Welcome message from author
This document is posted to help you gain knowledge. Please leave a comment to let me know what you think about it! Share it to your friends and learn new things together.
Transcript

WORLD METEOROLOGICAL ORGANIZATIONGLOBAL ATMOSPHERE WATCH
No. 140
WMO/CEOS REPORT on a STRATEGY forINTEGRATING SATELLITE and
GROUND-BASED OBSERVATIONS ofOZONE
JANUARY 2001

WORLD METEOROLOGICAL ORGANIZATIONGLOBAL ATMOSPHERE WATCH
No. 140
WMO/CEOS REPORT on a STRATEGY forINTEGRATING SATELLITE and
GROUND-BASED OBSERVATIONS ofOZONE
WMO TD No. 1046

i
List of Contents
Foreword ...................................................................................................................................... iiiExecutive Summary...................................................................................................................... vMilestones in the History of Ozone ............................................................................................ ix
1. Introduction.......................................................................................................................... 11.1 The IGOS Strategy ................................................................................................. 11.2 The Ozone Project.................................................................................................. 21.3 Requirements and Data Sources .......................................................................... 51.4 The Objectives of the Report ................................................................................ 9
2. User Requirements............................................................................................................ 112.1 Sources of Information and Definitions ............................................................. 112.2 Relationships between Applications and Requirements .................................. 132.3 The Requirements................................................................................................ 14
3. Available and Planned Measurements ............................................................................. 213.1 Introduction.......................................................................................................... 213.2 Non-Satellite Measurements ............................................................................... 213.3 Satellite Measurements ....................................................................................... 35
4. Harmonisation of Provisions and Requirements ............................................................ 474.1 Introduction.......................................................................................................... 474.2 Total Column Ozone ............................................................................................ 474.3 Ozone Vertical Profile .......................................................................................... 494.4 Meteorological Parameters ................................................................................. 514.5 Related Chemical Constituents .......................................................................... 54
5. Calibration and Validation................................................................................................. 575.1 Introduction.......................................................................................................... 575.2 Calibration and Validation Approach.................................................................. 585.3 Algorithms and Radiative Transfer ..................................................................... 605.4 Ground-based Observations............................................................................... 605.5 Validation of Trace Gases ................................................................................... 645.6 Scientific Analyses............................................................................................... 655.7 Principles and Recommendations for Calibration and Validation ................... 665.8 Implementation Strategy ..................................................................................... 67
6. Recommendations............................................................................................................. 696.1 Introduction.......................................................................................................... 696.2 Algorithms and Calibration ................................................................................. 716.3 Implementation .................................................................................................... 726.4 Recommendations for Additional Space-Borne Measurements....................... 746.5 Advisory Body for the Ozone Project ................................................................. 756.6 Concluding Remarks ........................................................................................... 76

ii
Annex A: Lists of Scientists and Experts Consulted ............................................................. 77
Annex B: Tables of User Requirements .................................................................................. 81
Annex C: The Data Records of Regularly Reporting Ground-Based Ozone Stations........ 101
Annex D: Examples of Airborne Research Campaigns........................................................ 109
Annex E: Other Space-Based Instruments ........................................................................... 117
Annex F: Acronym/Abbreviation List .................................................................................... 125


iv

v
EXECUTIVE SUMMARY
Introduction
CEOS and WMO recognize the need for better integration of the major satellite andground-based systems to provide highly accurate, global environmental observation of theatmosphere, cryosphere, oceans and land in a cost effective fashion. To satisfy this objective, aframework for compiling user requirements, coupled with an overarching strategy for makingglobal observations is the goal of the new IGOS (Integrated Global Observing Strategy), set up bya number of international bodies including WMO and Space Agencies. This report is acontribution to the international effort. It proposes the better integration of the various systemsused to monitor ozone, including related key atmospheric parameters, and will contribute to theobjectives of the IGOS within a general IGOS theme on atmospheric chemistry.
This will assure the most effective use of available resources for global observations,although priorities must be established for upgrading existing and/or establishing new systemsand provide a framework for decisions to ensure:
• the long term continuity and spatial comprehensiveness of key observations• the research needed to improve understanding of Earth processes so that observations
can be properly interpreted.
The project will build upon existing and planned international global observationprogrammes (e.g. METOP, NPOESS, WMO-GAW and NDSC) and identify deficiencies in thecurrent and planned systems. This report and its recommendations were compiled by a collectionof clients, space agency representatives and a cross section of experts and specialist inatmospheric research. The list of contributors to this report and their institutions appears in AnnexA
The Ozone Project aims to develop the foundations of an integrated ozone measurementstrategy. This strategy reflects the need to understand variations of ozone in the troposphere andstratosphere because of the central role the gas plays in several major environmental problems:
• total column ozone is a controlling factor in determining levels of biologically damagingultraviolet radiation reaching the Earth’s surface;
• ozone is an oxidising pollutant that is harmful to humans, animals and vegetation anddegrades man-made materials;
• ozone is an active component of tropospheric and stratospheric photo-chemistry;• ozone is a “greenhouse” gas that contributes to the Earth’s radiative balance.
The project covers primarily the observational requirements associated with the "Montreal"Protocol of the Vienna Convention. One of its specific objectives is to document the requirementsfor observations of ozone and associated parameters needed to properly interpret the ozoneobservations. These are then reviewed in the light of provisions for data acquisition with the focuson the observing community and the steps needed to meet user requirements. The projectrecognises the need and existence of appropriate numerical chemical and transport models usedto interpret the observations.
Grateful acknowledgement must be made to the many scientists and institutions (listed inAnnex A) who have contributed to the production of this report both by participating in theworkshops and by written contributions. Without this support the production of this report wouldnot have been possible.
vi
Requirements
The Ozone Project has compiled a list of user requirements from the scientific community(WMO-GAW, SPARC, IGAC) and existing measurement programmes from space and the ground1
have been documented. From an analysis of the provisions and requirements, a set ofrecommendations for establishing an integrated global ozone observing system is proposed. Thisstrategy distinguishes measurements that are needed continuously from those that are onlyneeded occasionally. A well supported and on-going validation programme coupled with a dataquality control programme is essential. As data sets improve, planning for the reprocessing andthe distribution of data is a major objective.
In addition to ozone itself, an array of chemical species and other geophysical parameters must beobserved. These include long lived source gases, reservoir species, radicals and several closelyassociated meteorological variables such as temperature and winds to at least the same spatialand temporal resolution as the gases. Aerosols play an increasing role in the stratosphere andtroposphere for chemistry and climate research so their characteristics must also be measured. Inaddition, the total and spectral solar irradiances must be observed in order to be able to interpretclimate and ozone changes.
Available and Planned Measurements
A broad range of operational and research observations are underway and are plannedfrom both space and the ground. Data from Nimbus, TOMS, SAGE, SBUV/2, UARS, ERS-2,WMO-GAW and NDSC, as well as many aircraft and balloon missions, have led to an improvedunderstanding of relevant atmospheric processes and provided a baseline for assessing needs forfuture data sets. Research missions such as ENVISAT, EOS-Terra and EOS-Aura, andoperational missions such as METOP and NPOESS, will provide platforms to ensure thecontinuation of baseline measurements though they only partially satisfy the requirements. Amajor concern is the provision of data in the longer term (after the ENVISAT/EOS-Aura era) whenonly those from METOP and NPOESS will remain available.
TOMS type data sets are assured (though not TOMS itself) through EOS – Aura, but thereis a potential gap between EOS-Aura and NPOESS until the advent of NPOESS which willcontinue these measurements. Follow-on SAGE missions are assured although the exactplatforms are at this time somewhat uncertain. UV-VIS-NIR backscatter measurements willcontinue with GOME-2 on METOP. GCOM and follow-on ADEOS will also provide collaborativedata from space. The ODIN, ACE and SABRE research missions will compliment the largerresearch and operational missions. To date chemistry measurements have been made from lowEarth orbit, but upcoming missions must take advantage of new strategic orbits such as thegeostationary and L1 orbits to observe short term diurnal variations.
Ground observations (surface, balloon, and aircraft) must continue and be expanded toprovide correlative and validation data for the satellite missions as well as conducting essentialresearch observations. The networks such as NDSC and GAW (e.g. ozone sondes,Dobson/Brewer and in-situ source gas observing stations)need to continue to provide data as partof a better integrated system. Aircraft missions should continue to conduct extensive campaignsto study processes with high spatial resolution. The commercial airlines also have a role inproviding platforms for routine observations (e.g. MOZAIC).
Calibration and Validation
Another major concern is the continuation and consolidation of calibration and validationactivities as these are critical to assure the scientific value of observations. They are essential forderiving climate quality data sets. The space faring nations have and must continue to allocateresources for the calibration and validation of Earth science missions. Both Europe and the UnitedStates are now planning operational satellite systems that will carry ozone sounders to extend the

vii
long term record already produced by national research and operational missions. Japan is alsocommitted to fly atmospheric chemistry missions.
However, despite the fact that the major space agencies have embarked on thesemissions, no concurrent long term validation programme is being planned nor is there anyassurance that the existing ground-based infrastructure will be in place when it is needed. Satellitesystems can only meet the established requirements if they are supported by correlative data ofknown quality and continually challenged by reliable ground-based observations and quantitativescience.
Based on the experience gained from past satellite missions, an end-to-end approach forcalibration/validation, supported by a fully integrated global observing system including bothground and space-based elements, must be established. For satellites this approach includes theinternal calibration programmes, post-launch calibration employing on-board systems, externalvalidation programs using highly controlled correlative measurements, subsequent algorithmrefinements and scientific analyses of the data to ensure consistency with the best understandingof atmospheric processes and conditions. This is of particular importance given the existence ofparallel streams of the national missions, e.g. the European METOP and the US NPOESS ozoneinstruments.
Recommendations
As discussed above, many of the identified requirements will be met by the existing andplanned measurements from ground and space. However, there remains the problem of a lack offormal co-ordination among the space faring nations to optimise the deployed systems and toassure compatibility for international users. In addition, there must be formal recognition andsupport for the international community who are providing critical data from ground-based systemsfor the calibration and validation of the space-borne systems.
The recommendations contained in the report (Chapter 6) make specific proposals forremedying the missing components of the upcoming systems. They also describe improvementsthat are required in existing systems and current procedures. The following is a summary of theserecommendations:
• Establish a co-ordinated validation activity that extends over the entire lifetime ofsatellite sensors that encompasses all elements of the IGOS system and takesmaximum advantage of concurrent national validation activities.
• Extend the coverage of ground-based (WMO-GAW and NDSC) systems particularly inthe tropics and the Southern Hemisphere and designate a carefully selected subsetthereof as permanent, long term ground "truthing" facilities.
• The space agencies that require validation data must provide sustained support for theground networks to insure data availability and quality.
• Improve and/or provide additional measurements resulting from a survey of existingand planned measurements. There is a particular need for measurements in the lowerstratosphere and troposphere.
• The validation process is iterative and resources for reprocessing data must be madeavailable to ensure that users have access to the highest quality data.
• Standardise data formats and encourage the synergistic use of data supported byaccessible archives and proper provision for reprocessing.
• Improve national radiometric standards and sensitise the user community to calibrationissues.
• Encourage international co-operation in the development of algorithms employed bysimilar instruments and pool knowledge of radiative transfer physics.
• Establish a body of scientists, engineers and managers to provide technical support tofunding agencies to ensure compatibility and completeness of the systems.

viii
There is also a practical incentive for swift action. Several satellite missions with ozoneinstruments on board are scheduled for launch during this decade. The recommendations in thisreport attempt to co-ordinate these missions and to remedy those areas that remain deficient inthe present and planned observing systems. Data collected following this approach will have thenecessary quality to enable the state of the atmosphere to be reliably monitored and changesunderstood, thereby providing a basis for formulating sound environmental policies.
ix
MILESTONES IN THE HISTORY OF OZONE
1839 Discovery of the ozone as a permanent atmospheric trace gas by C.F. Schonbein.
1860 Surface ozone started to be measured at hundreds of locations.
1880 Strong absorption band of solar radiation between 200 and 320 nm attributed to upper-atmosphere ozone by Hartley.
1913 Proof from UV measurements that most ozone is located in the stratosphere.
1920 First quantitative measurements of the total ozone content.
1926 Six Dobson ozone spectrophotometers are distributed around the world for regular totalozone column measurements.
1929 The Umkehr method for vertical ozone distribution is discovered and determines theozone maximum is lower than 25 km.
1930 Photochemical theory of stratospheric ozone formation and destruction based onchemistry of pure oxygen.
1934 Ozone sonde on balloon confirms maximum concentration at about 20 km.
1955 Global network of ozone stations proposed for the International Geophysical Year (IGY).
1957 WMO establishes standard operating procedures for uniform ground-based ozoneobservations and the Global Ozone Observing System (GOOS) established.
1964 First ever satellite for total ozone measurement launched by US Department of Defense.
1965 Photochemical theory of ozone with destruction by HOx radicals.
1966 First total ozone measurements from satellites.
1971 Ozone destruction by NOx mechanism proposed.
1974 First consideration of CIOx chemistry as an ozone-destroying mechanism.
1974 Human-produced CFCs recognized as source of stratospheric chlorine.
1975 WMO conducts first international assessment of the state of global ozone.
1977 Plan of Action on Ozone Layer established by UNEP in collaboration with WMO.
1978 NASA’s Nimbus-7 launched carrying ozone and other atmospheric instruments
1981-98 Scientific assessments of the state of the ozone layer issued in 1981, 1985, 1988, 1991,1994, and 1998 by WMO in collaboration with UNEP and national research agencies.
1982 The US’s NOAA commits to operational stratospheric ozone monitoring on polarorbiting satellites (POESS followed by NPOESS).
1984 NASA-SAGE I: Stratospheric ozone profile measurements through solar occultation.
1984 Unusually low (-200 m atm cm) total ozone at Syowa, Antarctica, in October 1982, firstreported at the Ozone Commission Symposium in Halkidiki, but its significance wasrecognized only the next year.
1985 Vienna Convention for the Protection of the Ozone Layer concluded and data fromHalley station on the existence of an ozone hole during Antarctic springs since the early1980s published by the British Antarctic Survey.
1985 NASA’s Nimbus-7 TOMS maps Antarctic ozone whole which covers 10-20 millon squarekilometers
1983 Analysis of Montsouris (Paris) surface ozone (1873-1910) indicates levels then wereless than half of the present.

x
1984 Montreal Protocol on substances that deplete the ozone layer concluded under UNEPauspices and basic assessment of the state of the ozone initiated by the InternationalOzone Trends Panel.
1985 Decrease of ozone concentrations by –10 percent per decade in the lower stratospheredocumented; proof from NASA Antarctic Campaign that active chlorine and brominebyproducts of human activities are the cause of the Antarctic-spring ozone hole.
1990 London amendment to strengthen the Montreal Protocol by phasing out all CFCproduction and consumption by 2000.
1991 The WMO/UNEP Ozone Assessment – 1991 reveals ozone is declining not only inwinter-spring, but all year round and everywhere except over the tropics; very largeconcentrations of CIO measured in the Arctic confirms concerns for potential strongerozone decline.
1991 NASA’s Upper Atmospheric Research Satellite launched
1991 Quantified global and seasonal column ozone trends from TOMS.
1992 Copenhagen amendment further strengthened Montreal Protocol by phasing out CFCsby the end of 1995, adding controls on other compounds.
1992-94 Extremely low ozone values (-100 m atm cm) during Antarctic spring and largest area –24 m km2 covered; also the lowest ever ozone values measured during the northernwinter-spring seasons indicates increasing destructive capability by increasing chlorineand bromine concentrations in the stratosphere.
1998 WMO/SPARC/IOC/GAW assessment of trends in the vertical distribution of ozone usingSAGE, balloon, and umkehr data.
1998 Europe’s Eumetsat commits to operational ozone monitoring
1995 Nobel Prize for work on catalytic chemical destruction of ozone by Molina, Rowland,and Crutzen
1995 European Space Agency launches first mapping hyperspectral instrument (GOME) onERS-2 to measure atmospheric composition
1995 Record low ozone values (exceeding 25 percent below long-term average) observedJanuary to March over Siberia and a large part of Europe.
1996 Complete ban on industrial production of CFCs
1996 Japan launches the ADEOS series and plans follow on GCOM missions to measureozone and atmospheric chemistry
1996 CEOS initiated IGOS “The Ozone Project” as one of six pilot projects
1997 First Limb-scatter measurements of ozone throughout the Stratosphere from SpaceShuttle.
1998 Upper Atmospheric Research Satellite measured chlorine amounts in upperstratosphere leveling off resulting from Montreal and follow on protocols
2000 WMO/CEOS Report on a Strategy for Integrating Satellite and Ground BasedObservations of Ozone

1
1. INTRODUCTION
1.1 The IGOS Strategy
The IGOS (Integrated Global Observing Strategy) is intended to combine data from majorsatellite, airborne and ground-based systems to provide global environmental observations of theatmosphere, the cryosphere, the oceans and the land in a cost effective fashion. A fundamentalissue for IGOS is the identification of what it can contribute that cannot be achieved throughexisting national and international mechanisms. In short the added value of IGOS has to bedemonstrated.
To satisfy this objective IGOS must provide a framework for the formulation of a coherentset of user requirements to which providers can respond. It must formulate an overarchingstrategy for global observations, allowing those involved in their collection to improve theircontributions and to make better decisions on the allocation of resources to meet priorities, takingadvantage of better international collaboration and co-ordination.
To facilitate the most effective use of available resources for global observations, prioritiesneed to be established for upgrading existing and/or establishing new systems. IGOS musttherefore provide a framework for decisions intended to ensure:
• the long term continuity and spatial comprehensiveness of key observations;• the scientific research needed to improve understanding of Earth processes so that
observations can be properly interpreted.
It must build upon the strategies of existing international global observation programmesfocusing additional efforts in areas where satisfactory international arrangements and structuresdo not currently exist. It should aim to exploit international structures that successfully contribute tocurrent provision of global observations, rather than create a new centralised decision makingorganisation. The unnecessary duplication of observations must be avoided.
IGOS is intended to help provide governments with improved understanding of the need forglobal observations and the deficiencies of current systems. Allied with this, opportunities must beidentified for capacity building, assisting countries to obtain the maximum benefit from the total setof available observations. Situations where existing international arrangements for themanagement and distribution of key global observations and products could be improved must beidentified.
IGOS also seeks to stimulate the creation of improved high level products by facilitating theintegration of multiple data sets from different agencies and national and internationalorganisations. It assists the transition of systems from research to operational status throughimproved international co-operation.
In striving to respond to these principles, contributions to IGOS should help ensure:
• the long term continuity of measurements of key variables;• adequate archiving and access capability for all data sets;• consistency of data quality even when there are disturbances in the data record, e.g.
due to new technology;• an active and co-operative validation programme extending over the entire life of the
satellite sensor or measurement system to ensure the integrity of the space-bornedata:
• sufficient ancillary data to enable users to judge the data quality and to properlyinterpret the results.
Within this overall context the Committee for Earth Observation Satellites (CEOS) decidedto establish six Pilot Projects to assess the feasibility of achieving the objectives of IGOS. One of
2
these was the Ozone Project which is the subject of this report and which includes observationalrequirements arising out of the Montreal Protocol of the Vienna Ozone Convention .
1.2 The Ozone Project
Knowledge of the amount and distribution of ozone (and changes in total levels) in theEarth’s troposphere and stratosphere is important because of the central role ozone plays inseveral important environmental problems:
• First, ozone, through its absorption and emission of solar and terrestrial radiation,contributes significantly to atmospheric temperature structure and the radiative forcingof the troposphere-stratosphere system.
• Secondly, the total column amount of ozone in the atmosphere is a major factor indetermining the amounts of biologically damaging ultraviolet radiation that reach theEarth’s surface, as well as the photochemistry of the troposphere.
• Thirdly, near the Earth’s surface ozone is an oxidising pollutant which is harmful tohumans, animals and vegetation as well as contributing to the degradation of man-made materials. As such it influences much of the photochemistry that occurs in thetroposphere.
Knowledge of the distribution of ozone is also important to the operational meteorologicalcommunity both through its role as a contributor to the Earth’s radiative balance and through itsuse as a motion tracer. Advances in meteorological modelling are demonstrating that the inclusionof ozone can lead to improved weather and climate forecasts and, as a result, ozone is beginningto be assimilated in meteorological models. Operational agencies are also increasingly beingasked to predict levels of ultraviolet radiation reaching the surface; knowledge of ozone amounts isessential for this purpose.
Changes in the distribution of ozone in response to human activity have been anticipatedfor some time and over the past decades such changes have actually been observed. Figure 1(from NASA's Goddard Space Flight Center) illustrates predicted and TOMS measured globalozone trends. Predictions indicate a recovery in the near future, however these must beconfirmed with measurements with TOMS-like precision. The predicted changes in ozonedistributions are due to several factors. Emissions of industrially-produced chlorine (Cl) andbromine (Br) containing molecules into the atmosphere lead to destruction of ozone in thestratosphere due to the catalytic properties of chlorine and bromine. In addition, there are naturalsources of bromine in polar regions that may also contribute to the catalytic destruction of ozone.Emissions of nitrogen oxides, hydrocarbons, and carbon monoxide change the photochemistry ofozone in the troposphere and increased emissions of these species, associated with humanactivity (burning of fossel fuels and biomass), have led to increases in tropospheric ozoneamounts. Evolutions in climate also have the potential to change both tropospheric andstratospheric ozone in ways that are complex and not yet well understood.
In addition to the most spectacular such effect, namely the seasonal decrease in totalozone which takes place over Antarctica every spring (with the near-total removal of ozone insome altitudes), there has been a gradual decrease in total ozone amounts over much of the mid-latitudes. Most recently, there have been some significant instances of late winter/spring-timeozone depletion in the Arctic (most markedly in the winter of 1996-7). Satellites and balloons haveshown that while most of this decrease has taken place in the lower stratosphere, there have alsobeen some important decreases in ozone levels in the upper stratosphere. Figure 2 (from KNMI)illustrates very low ozone amounts over high latitudes of the Northern Hemisphere during forApril1997, as observed by GOME. Normally ozone near the pole reaches a maximum value at thistime

3
Figure 1: Measured and Predicted Ozone Trends(Courtesy, Goddard Space Flight Center)
Figure 2: Northern Hemisphere Assimilated Total Ozone (Courtesy, RoyalDutch Meteorological Institute)
4
Most of these changes have been attributed to long term increases in the concentrations ofhalogen-containing source gases whose breakdown products can destroy ozone through rapidcatalytic processes. The decrease in ozone amounts in the lower stratosphere coupled withincreases in greenhouse gases, have led to small but significant decreases in temperatures in thelower stratosphere over much of the Earth. These are amongst the most significant temperaturechanges that have been attributed to human activity. The ozone-temperature linkage in thestratosphere is therefore a critical one and detailed understanding of the feedback betweenchanges in these two quantities is a priority.
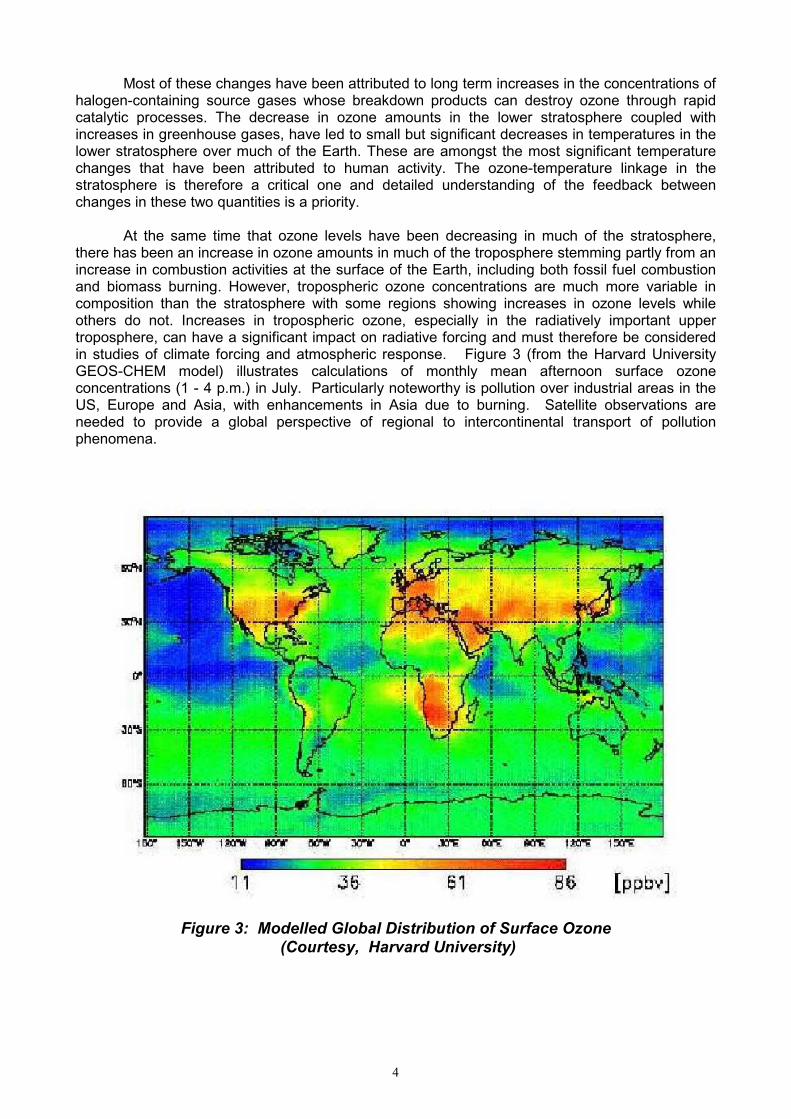
At the same time that ozone levels have been decreasing in much of the stratosphere,there has been an increase in ozone amounts in much of the troposphere stemming partly from anincrease in combustion activities at the surface of the Earth, including both fossil fuel combustionand biomass burning. However, tropospheric ozone concentrations are much more variable incomposition than the stratosphere with some regions showing increases in ozone levels whileothers do not. Increases in tropospheric ozone, especially in the radiatively important uppertroposphere, can have a significant impact on radiative forcing and must therefore be consideredin studies of climate forcing and atmospheric response. Figure 3 (from the Harvard UniversityGEOS-CHEM model) illustrates calculations of monthly mean afternoon surface ozoneconcentrations (1 - 4 p.m.) in July. Particularly noteworthy is pollution over industrial areas in theUS, Europe and Asia, with enhancements in Asia due to burning. Satellite observations areneeded to provide a global perspective of regional to intercontinental transport of pollutionphenomena.
Figure 3: Modelled Global Distribution of Surface Ozone (Courtesy, Harvard University)
5
A problem peculiar to the tropopause region is that of emissions from aviation. Aircraftemit particles and gases affecting ozone, methane, and cloudiness. The emissions from aircraftare released directly into the free troposphere and lower stratosphere. At present the impact ofNOx emissions on ozone formation near the tropopause and methane reduction and subsequentclimate effects can be quantified only with large uncertainties. In addition, the chemical andradiative effects of contrails and cirrus clouds, and the role of water vapour emissions in thestratosphere are far from being understood. The relative climate impact of these emissionscompared to that of CO2 has to be determined as prediction of the impact of aviation is currentlylimited by the general understanding of air chemistry, cloud physics and related processes.
Changes in the ozone profiles (in both the stratosphere and troposphere) can also haveimplications for global tropospheric chemistry because changes in levels of stratospheric ozonecan affect the ultraviolet radiation flux into the troposphere which, together with ozone itself, isresponsible for much of the photochemistry that takes place in this region of the atmosphere. Inpart, this photochemistry produces hydroxyl, a free radical that initiates the decomposition of manytrace gases in the atmosphere as well as the formation of some types of aerosol particles.
In parallel to these changes in ozone amounts and distribution, there are evolutions in thephysical state of the atmosphere. The increases in carbon dioxide and other radiatively activegases are altering the temperature structure of the atmosphere which, over the longer term, maybe associated with significant changes in the nature of the meteorological processes that occur inthe troposphere, as well as in the properties of the tropopause region and the dynamical couplingbetween the troposphere and stratosphere. These can affect the transport of energy andmomentum within the entire global atmospheric system together with the transport of ozone, itsphotochemical precursors and the agents of its catalytic destruction. Temperature changes willalso directly affect the rates of chemical reactions involved in ozone photochemistry.
Any long term changes in the structure and dynamics of the tropopause regions could havelarge impacts on the distribution of ozone in the stratosphere by changing, for instance,stratospheric water vapour amounts, formation conditions for PSCs (polar stratospheric clouds)and/or aerosols and the forcing of large scale stratospheric waves from the troposphere. Changesin the region of the tropopause will also affect levels of tropospheric ozone as the flux of ozoneacross the tropopause (from the stratosphere to the troposphere) is a major source of ozone tothe troposphere.
The ability of the scientific community to understand the observed changes in ozone andpredict future evolutions, especially in the context of an atmosphere whose physical state ischanging due to climate change, is critically dependent on the availability of comprehensivemodels capable of properly simulating both the chemical and physical evolution of the atmosphereand the linkages between the two. The further development of these models draws on bothadvances in modelling capability and their critical evaluation and validation. For this the provisionof the broad range of representative and reliable observational data, considered in this report, isessential.
1.3 Requirements and Data Sources
1.3.1 General Requirements
It is clear that knowledge of ozone concentrations and its distribution is of fundamentalimportance given the pivotal role ozone plays in the climate system. Human-induced changes inozone levels combine to make the accurate long term measurement of ozone a priority for policymakers as well as for the scientific and environmental communities. This places strict demands onmeasurement systems as they have to be capable of characterising long term trends in thepresence of the very large variability that exists on several temporal scales.

6
These include diurnal cycles, day-to-day meteorological, seasonal and inter-annual (quasi-biennial oscillation, El Niño/Southern Oscillation, North Atlantic Oscillation) variability as well as the11-year solar cycle and sporadic events such as volcanic eruptions and solar proton events. Itmust also be possible to accurately differentiate between changes in ozone and those of otheratmospheric parameters (e.g., temperature, aerosol loading) that may affect its directmeasurement or retrieval via remote sensing techniques.
Furthermore, full global coverage is essential so the measurement system addressingthese needs must be able to observe from the tropics to the poles. Moreover, as changes in thestratosphere and troposphere may be quite different (indeed of opposite signs), the accuratecharacterisation of both regions as well as their combined effect, is essential.
To interpret observed changes in ozone it is not enough to measure ozone alone. Inaddition to ozone itself, several atmospheric chemical species, meteorological (including aerosol)and solar parameters must also be observed. Without such information it will be difficult tounderstand why observed changes are taking place, making it impossible to forecast futuredevelopments and hence to assess the effectiveness of proposed (or current) control measures.For some applications, such as the prediction of the levels of ultraviolet radiation at the Earth'ssurface, the use of ozone data will be inadequate unless accompanied by knowledge of otherquantities such as the distribution of aerosols, clouds and their respective optical properties.
This means that three general groups of parameters will have to be measured, namelyozone itself, several closely associated meteorological variables and a number of chemicalparameters. These are summarised in Tables 1.1 and 1.2 which list the various geophysicalvariables separated according to the above criteria. Table 1.1 also indicates whether they areobserved by current systems, classifying them into one of three subgroups, namely:
• source gases - species having long lifetimes; typically produced by biological and/orindustrial processes at the Earth's surface;
• reservoir species - species having intermediate lifetimes; typically formed in theatmosphere as a result of the breakdown of source gases, although some are directlyemitted from the Earth's surface;
• free radicals - species having unpaired electrons and short lifetimes; often formedphotochemically from source gases or reservoir species.
In addition, meteorological information (such as temperature and winds) is needed to setthe observations into a proper context and, in some cases, for inclusion in the algorithms used toderive concentrations of trace constituents from observed radiances.
In compiling the lists of user requirements for observations of chemical species throughoutthe atmosphere it is important to recognise the breakdown between the different classes assummarised in these two tables. A distinction is made between parameters whose distributionsneed to be measured regularly over long periods of time over a broad range of geophysicalconditions (Table 1.1), and those whose concentrations only need to be measured on either alimited number of occasions (though over a similarly broad range of geophysical conditions) orregularly but at a limited number of locations (Table 1.2). As far as this report is concerned theformer are classified as being of primary importance and are the only ones considered further inthis document. In this report, carbon dioxide and other greenhouse gases were considered onlywith regard to their direct or indirect relevance to ozone so there is no detailed discussion ofmeasurement requirements arising as a consequence of the Kyoto Protocol.

7
Table 1.1: Parameters which must be observed regularly over long periods of time over a broad range of geophysical conditions
PARAMETER CLASS SURFACE TOTALCOLUMN
LOWERTROP.
UPPERTROP.
LOWERSTRAT.
UPPERSTRAT.
&MESO.
AVAILABLE MEASUREMENT PLATFORM
GBIS GBC GBP BBIS SBC SBPO3 Mon./Trends A A A A A A P P P P P PO3 Oper. Met. A A A P P P PO3 Air Quality A N N P SO3 UV Forecasts A A S P S P S
Temp. Met. Variable A A A A A P S P PWind Met. Variable A A P S P
Tropopause Met. Variable A A P SCloud Tops Met. Variable A A A P S P
H2O Source Gas A A A A A A P S P P PN2O Source Gas A A A P S S SCH4 Source Gas A A N N A A P S SCO Source Gas A A A A P S S PCO2 Source Gas A N P S
HCl Reservoir A A A P PHNO3
* Reservoir A A A S P
BrO Free Radical N N S P P SClO Free Radical N A A S S P PNO2 Free Radical A A N N A A P P S P PNO* Free Radical A A N N P P P
Aerosol Pres. Met. Variable A A A A A P P P P PAerosol Char. Met. Variable A N N A S S P S P
PSCs Met. Variable A P P S S PUV Met. Variable A A S P S P
Note * - not all of these are required everywhere; in some situations only one or two of them may be neededKey A = available N = needed GBIS = ground-based in-situ BBIS = balloon-based in-situ SBC = space-based column
P = primary role S = supporting role GBP = ground-based profile GBC = ground-based column SBP = space-based profil
8
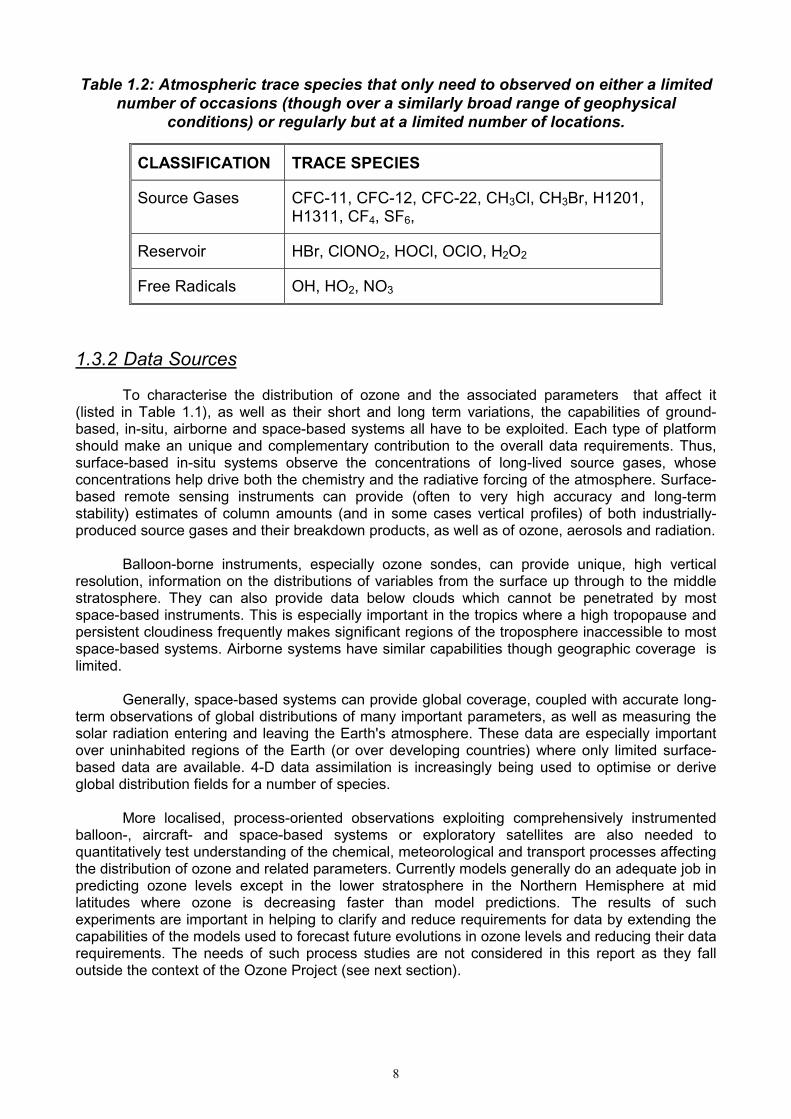
Table 1.2: Atmospheric trace species that only need to observed on either a limitednumber of occasions (though over a similarly broad range of geophysical
conditions) or regularly but at a limited number of locations.
CLASSIFICATION TRACE SPECIES
Source Gases CFC-11, CFC-12, CFC-22, CH3Cl, CH3Br, H1201,H1311, CF4, SF6,
Reservoir HBr, ClONO2, HOCl, OClO, H2O2
Free Radicals OH, HO2, NO3
1.3.2 Data Sources
To characterise the distribution of ozone and the associated parameters that affect it(listed in Table 1.1), as well as their short and long term variations, the capabilities of ground-based, in-situ, airborne and space-based systems all have to be exploited. Each type of platformshould make an unique and complementary contribution to the overall data requirements. Thus,surface-based in-situ systems observe the concentrations of long-lived source gases, whoseconcentrations help drive both the chemistry and the radiative forcing of the atmosphere. Surface-based remote sensing instruments can provide (often to very high accuracy and long-termstability) estimates of column amounts (and in some cases vertical profiles) of both industrially-produced source gases and their breakdown products, as well as of ozone, aerosols and radiation.
Balloon-borne instruments, especially ozone sondes, can provide unique, high verticalresolution, information on the distributions of variables from the surface up through to the middlestratosphere. They can also provide data below clouds which cannot be penetrated by mostspace-based instruments. This is especially important in the tropics where a high tropopause andpersistent cloudiness frequently makes significant regions of the troposphere inaccessible to mostspace-based systems. Airborne systems have similar capabilities though geographic coverage islimited.
Generally, space-based systems can provide global coverage, coupled with accurate long-term observations of global distributions of many important parameters, as well as measuring thesolar radiation entering and leaving the Earth's atmosphere. These data are especially importantover uninhabited regions of the Earth (or over developing countries) where only limited surface-based data are available. 4-D data assimilation is increasingly being used to optimise or deriveglobal distribution fields for a number of species.
More localised, process-oriented observations exploiting comprehensively instrumentedballoon-, aircraft- and space-based systems or exploratory satellites are also needed toquantitatively test understanding of the chemical, meteorological and transport processes affectingthe distribution of ozone and related parameters. Currently models generally do an adequate job inpredicting ozone levels except in the lower stratosphere in the Northern Hemisphere at midlatitudes where ozone is decreasing faster than model predictions. The results of suchexperiments are important in helping to clarify and reduce requirements for data by extending thecapabilities of the models used to forecast future evolutions in ozone levels and reducing their datarequirements. The needs of such process studies are not considered in this report as they falloutside the context of the Ozone Project (see next section).

9
1.4 The Objectives of the Report
To meet the scientific and user requirements in as cost effective and efficient fashion aspossible, it is essential to adopt an integrated global observing strategy, as set out in Section 1.This involves the strategic combination of data from all observing systems (i.e. ground-based,space-based etc.; in-situ and remote). To help establish this philosophy the Committee decided toinitiate a set of Pilot Projects one of which is the specific concern of this Report, namely theprovision of long term observations of ozone.
The CEOS therefore mandated a small group of scientists to produce a report on The LongTerm Continuity of Ozone Measurements to lay the groundwork for the formulation of a strategyfor atmospheric ozone and related parameters. The list of contributors and their institutions can befound in Annex A. It should be noted that two workshops have taken place; one in Tokyo in July1997 and one in Geneva in May 1999. During these meetings experts were asked to clarifyrequirements and review the capabilities of current observing systems with the aim of highlightingdeficiencies and indicating possible courses of remedial action. These are the origin of the variousrecommendations contained in this report.
Noting the specific objectives of the Ozone Project and in line with the argumentspresented in the previous section, it was decided to limit the list of variables (in addition to ozoneitself) to those strictly required either a) to properly interpret the ozone observations or b) for use inthe geophysical algorithms used to retrieve ozone distributions from space-based instruments.Therefore, this is a climatological, as opposed to a process study, oriented project. This limits thelist of variables to be considered and hence the scope of the recommendations contained in thisreport. The need for category b) variables will vary with the measurement technique.
Underlying this is an implicit assumption that the contributions of several relevantunmeasured parameters can be calculated from the measured distributions of a relatively smallsub-set of parameters. This assumes the existence of appropriate numerical chemical andtransport models which must be tested against comprehensive data sets obtained by researchoriented balloon, aircraft and/or space-borne missions.
A further point to note is that not all the requisite variables need to be observed frequentlyor globally. Those listed in Table 1.1 generally have to be observed frequently and globally overthe long term and quite often information on their vertical distributions is required. They are thefocus of this report.
For the reservoir and radical species listed in Table 1.2, it could be argued that once therelationship between their distributions and those of their chemical precursors and/or related familymembers (listed in Table 1.1) is well established (on the basis of observations), regular long termmeasurements may no longer be required. It is assumed that the requirements to observe thesource gases listed in Table 1.2 can basically be met by ground-based systems though satelliteobservations are required to ensure representative global coverage.
It is important to note that a number of the existing programmes have already beenspecifically designed to make long term observations of ozone and related parameters including:
• The ground-based Dobson/Brewer/Umkehr network for total ozone and ozone profilemeasurements, as well as the other surface-based measurements associated with theGlobal Atmosphere Watch (GAW) network of the World Meteorological Organization
• The ground-based remote-sensing network of instruments associated with the
internationally sponsored Network for Detection of Stratospheric Change (NDSC)
• Surface-based in-situ sampling associated with several nationally-operated (butglobally distributed) programmes (under the umbrella of WMO-GAW) designed todetermine surface-level concentrations of long-lived trace gases
• The balloon-based ozone sonde network of the WMO-GAW and NDSC programmes
10
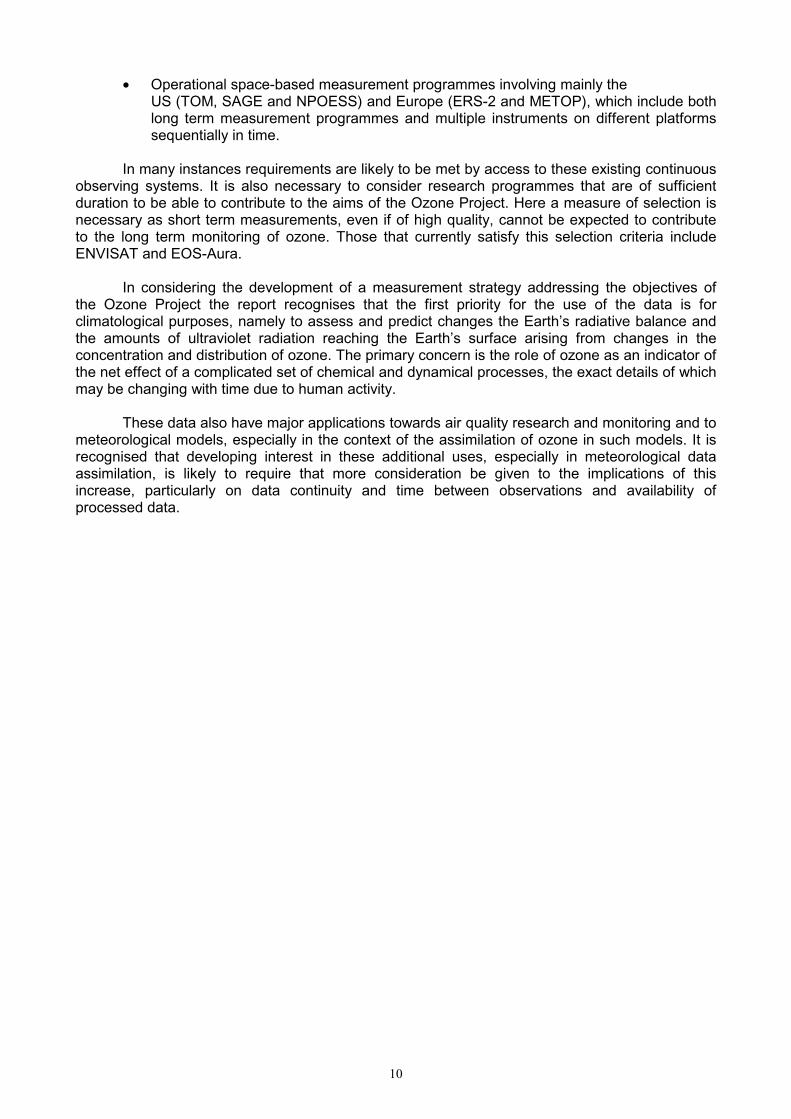
• Operational space-based measurement programmes involving mainly theUS (TOM, SAGE and NPOESS) and Europe (ERS-2 and METOP), which include bothlong term measurement programmes and multiple instruments on different platformssequentially in time.
In many instances requirements are likely to be met by access to these existing continuousobserving systems. It is also necessary to consider research programmes that are of sufficientduration to be able to contribute to the aims of the Ozone Project. Here a measure of selection isnecessary as short term measurements, even if of high quality, cannot be expected to contributeto the long term monitoring of ozone. Those that currently satisfy this selection criteria includeENVISAT and EOS-Aura.
In considering the development of a measurement strategy addressing the objectives ofthe Ozone Project the report recognises that the first priority for the use of the data is forclimatological purposes, namely to assess and predict changes the Earth’s radiative balance andthe amounts of ultraviolet radiation reaching the Earth’s surface arising from changes in theconcentration and distribution of ozone. The primary concern is the role of ozone as an indicator ofthe net effect of a complicated set of chemical and dynamical processes, the exact details of whichmay be changing with time due to human activity.
These data also have major applications towards air quality research and monitoring and tometeorological models, especially in the context of the assimilation of ozone in such models. It isrecognised that developing interest in these additional uses, especially in meteorological dataassimilation, is likely to require that more consideration be given to the implications of thisincrease, particularly on data continuity and time between observations and availability ofprocessed data.

11
2. USER REQUIREMENTS
In considering requirements for global observations of ozone and related species, it isimportant to be specific as the requirements can vary significantly from one set of users to anotherwith regard to spatial coverage, accuracy, etc. User requirements (like the capabilities of anymeasurement system) vary significantly with height, so it is necessary to link requirements toaltitude. In all cases the interest of the user is in end-to-end system performance set in the contextof an integrated global observing system.
2.1 Sources of Information and Definitions
The requirements presented in this report are derived from those included in the "User'sRequirements Data Base" prepared by the World Meteorological Organization and the report ofthe ad-hoc Global Climate Observing System (GCOS) Atmospheric Chemistry Panel meeting(Toronto, Canada, May 23, 1997). They were reviewed by participants at the initial meeting for theCEOS Ozone Pilot Project held in July, 1997 in Tokyo, Japan and during the Ozone ProjectConsultative Workshop held in May, 1999 in Geneva, Switzerland. The views of SPARC and IGAChave also had a strong bearing on the compilation of the requirements.
Two levels of requirements have been derived for each parameter, namely:
• The "target" set of requirements - defined as the set of requirements that satisfy theneeds of most (if not all) of the user community.
• The "threshold" set of requirements – defined as the minimum set of requirementswhich satisfy the needs of at least one set of users.
A system that did not meet the threshold requirements would be very difficult to justify but,on the other hand, to attempt to fully satisfy the target requirements is often unrealistic. Thus, thisreport (notably Chapter 4) mainly focuses on threshold requirements.
In generating the tables (see Table 2.1 and Annex B) which summarise the requirementsgreat reliance has been placed on "quantitative science", i.e. on measured concentrations, onpublished trend assessments and on known concentration differences in the vertical and horizontaldistribution of the stated parameters. The target values are derived from user observation criteria(as used in atmospheric chemistry, trend analyses, etc...) and substantiated by "local"observations which exploit the best available technology. This means that, based on anticipatedperformance and target and threshold values, the benefits associated with the deployment ofspecific systems will be identifiable.
Since requirements vary with height, it is logical (albeit a little controversial) to link andthereby generalise them to some broad pressure/altitude regimes, notably:
• Total Column• Lower Troposphere 0 to 5 km• Upper Troposphere 5 km to Tropopause• Lower Stratosphere Tropopause to 30 km• Upper Stratosphere and Mesosphere > 30 km
12
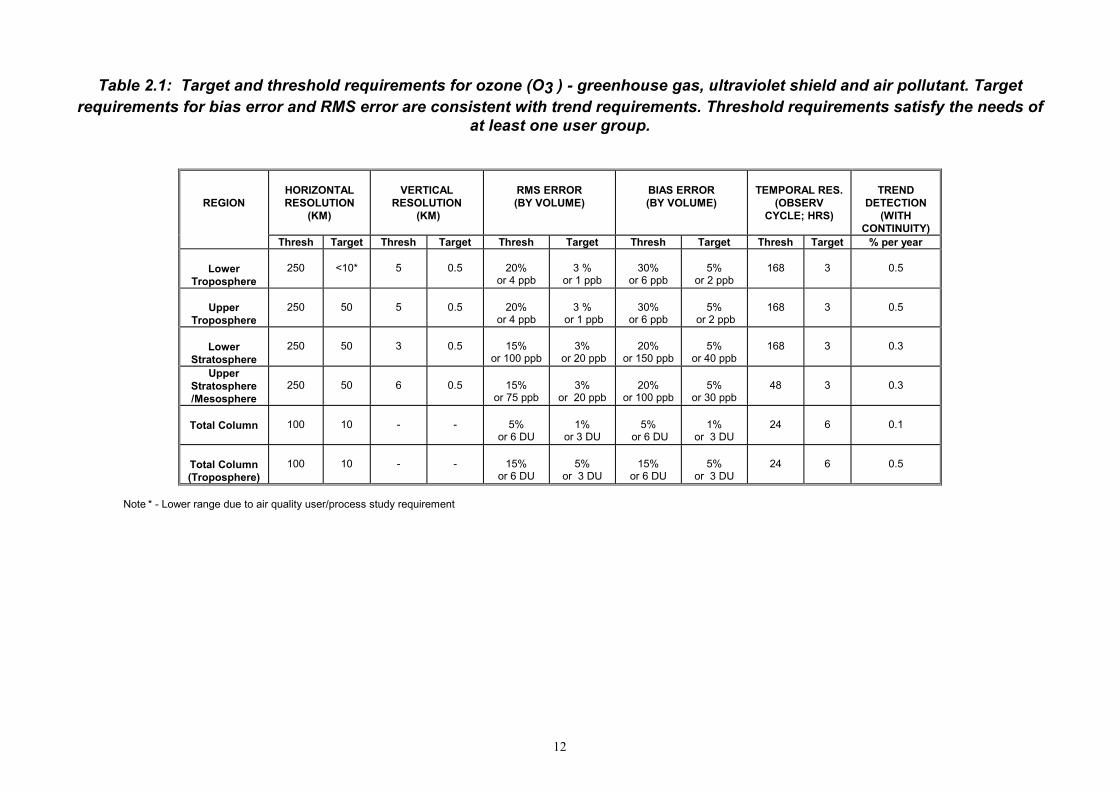
Table 2.1: Target and threshold requirements for ozone (O3 ) - greenhouse gas, ultraviolet shield and air pollutant. Targetrequirements for bias error and RMS error are consistent with trend requirements. Threshold requirements satisfy the needs of
at least one user group.
REGIONHORIZONTALRESOLUTION
(KM)
VERTICALRESOLUTION
(KM)
RMS ERROR(BY VOLUME)
BIAS ERROR(BY VOLUME)
TEMPORAL RES.(OBSERV
CYCLE; HRS)
TRENDDETECTION
(WITHCONTINUITY)
Thresh Target Thresh Target Thresh Target Thresh Target Thresh Target % per year
LowerTroposphere
250 <10* 5 0.5 20%or 4 ppb
3 %or 1 ppb
30%or 6 ppb
5%or 2 ppb
168 3 0.5
UpperTroposphere
250 50 5 0.5 20%or 4 ppb
3 % or 1 ppb
30%or 6 ppb
5% or 2 ppb
168 3 0.5
LowerStratosphere
250 50 3 0.5 15%or 100 ppb
3% or 20 ppb
20%or 150 ppb
5%or 40 ppb
168 3 0.3
UpperStratosphere/Mesosphere
250 50 6 0.5 15%or 75 ppb
3%or 20 ppb
20%or 100 ppb
5%or 30 ppb
48 3 0.3
Total Column 100 10 - - 5%or 6 DU
1%or 3 DU
5% or 6 DU
1%or 3 DU
24 6 0.1
Total Column(Troposphere)
100 10 - - 15%or 6 DU
5%or 3 DU
15%or 6 DU
5%or 3 DU
24 6 0.5
Note * - Lower range due to air quality user/process study requirement
13
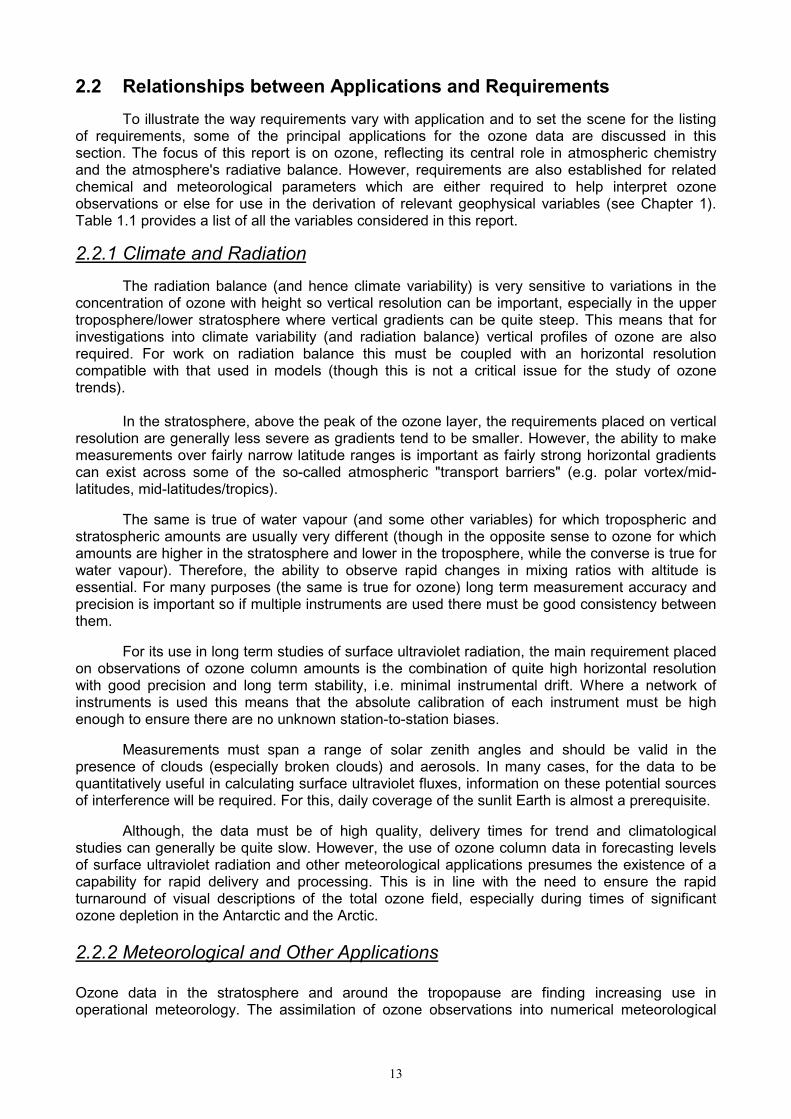
2.2 Relationships between Applications and Requirements
To illustrate the way requirements vary with application and to set the scene for the listingof requirements, some of the principal applications for the ozone data are discussed in thissection. The focus of this report is on ozone, reflecting its central role in atmospheric chemistryand the atmosphere's radiative balance. However, requirements are also established for relatedchemical and meteorological parameters which are either required to help interpret ozoneobservations or else for use in the derivation of relevant geophysical variables (see Chapter 1).Table 1.1 provides a list of all the variables considered in this report.
2.2.1 Climate and Radiation
The radiation balance (and hence climate variability) is very sensitive to variations in theconcentration of ozone with height so vertical resolution can be important, especially in the uppertroposphere/lower stratosphere where vertical gradients can be quite steep. This means that forinvestigations into climate variability (and radiation balance) vertical profiles of ozone are alsorequired. For work on radiation balance this must be coupled with an horizontal resolutioncompatible with that used in models (though this is not a critical issue for the study of ozonetrends).
In the stratosphere, above the peak of the ozone layer, the requirements placed on verticalresolution are generally less severe as gradients tend to be smaller. However, the ability to makemeasurements over fairly narrow latitude ranges is important as fairly strong horizontal gradientscan exist across some of the so-called atmospheric "transport barriers" (e.g. polar vortex/mid-latitudes, mid-latitudes/tropics).
The same is true of water vapour (and some other variables) for which tropospheric andstratospheric amounts are usually very different (though in the opposite sense to ozone for whichamounts are higher in the stratosphere and lower in the troposphere, while the converse is true forwater vapour). Therefore, the ability to observe rapid changes in mixing ratios with altitude isessential. For many purposes (the same is true for ozone) long term measurement accuracy andprecision is important so if multiple instruments are used there must be good consistency betweenthem.
For its use in long term studies of surface ultraviolet radiation, the main requirement placedon observations of ozone column amounts is the combination of quite high horizontal resolutionwith good precision and long term stability, i.e. minimal instrumental drift. Where a network ofinstruments is used this means that the absolute calibration of each instrument must be highenough to ensure there are no unknown station-to-station biases.
Measurements must span a range of solar zenith angles and should be valid in thepresence of clouds (especially broken clouds) and aerosols. In many cases, for the data to bequantitatively useful in calculating surface ultraviolet fluxes, information on these potential sourcesof interference will be required. For this, daily coverage of the sunlit Earth is almost a prerequisite.
Although, the data must be of high quality, delivery times for trend and climatologicalstudies can generally be quite slow. However, the use of ozone column data in forecasting levelsof surface ultraviolet radiation and other meteorological applications presumes the existence of acapability for rapid delivery and processing. This is in line with the need to ensure the rapidturnaround of visual descriptions of the total ozone field, especially during times of significantozone depletion in the Antarctic and the Arctic.
2.2.2 Meteorological and Other Applications
Ozone data in the stratosphere and around the tropopause are finding increasing use inoperational meteorology. The assimilation of ozone observations into numerical meteorological

14
models helps to consolidate information on atmospheric motion and the characteristics of thetropopause region. For this application the real-time or near real-time delivery of data is essential.For the moment the main focus is on total column amounts but the need for information on verticalprofiles can also be anticipated.
Near the tropopause ozone amounts vary significantly with atmospheric structure. Valuableinsights into the evolution of meteorological situations can be obtained by examining ozone data.These data can also be used in combination with information on the presence of clouds andaerosols to forecast surface ultraviolet radiation and to help establish boundary conditions fortropospheric air quality forecasts. Other data, which are typically obtained along with ozone data(notably observations of aerosols, in particular those of volcanic origin), may serve as the basis foradvice on how to avoid hazards or to improve estimates of radiative balance (essential for longterm forecasting). For all these applications the rapid delivery of data is essential.
Ozone is also one of the key parameters when considering air quality in the lowertroposphere. For this both high precision and long term stability are essential if the significance ofboth spatial and temporal variations in measurements is to be established. Air qualityprogrammes require knowledge of the distribution of ozone at the surface and as a function ofaltitude in the lower and middle troposphere. Knowledge of the concentrations of key ozoneprecursors (e.g. carbon monoxide, nitrogen oxides and hydrocarbons) and radiation levels [J(Oi
D)and J(NO2)] is essential.
Pollution events have strong daily variations therefore diurnal variations of ozone and itsprecursors must be made available in near-real time. In regions for which there can be variablecontamination from human activity, higher measurement frequencies are required to helpcharacterise the relative contributions of polluted and unpolluted air masses. Where data are usedfor trend and climatological studies, its rapid availability is not of critical importance, but if they areto be used to check compliance with air quality standards or to forecast air quality, rapid availabilityis again a priority. Profile information separating the boundary and the free troposphere isessential.
2.3 The Requirements
In this section the detailed requirements are presented, largely in tabular form (see AnnexB). Table 2.1 for ozone and the tables in Annex B for other atmospheric parameters summarisethe requirements for data on surface level concentrations, total column amounts and verticalprofiles using the altitude regions (where applicable) defined in Section 2.1. In reviewingmeasurement requirements for atmospheric trace constituents, it is helpful to follow theclassification introduced in Chapter 1 and to consider them as falling into one of three subgroups,namely source gases, reservoir species or free radicals plus pertinent meteorological informationrequired to set the observations into a proper context or for use in retrieval algorithms.
Generally, requirements vary from parameter to parameter and from region to region. Theyare less well established in the mesosphere than for other parts of the atmosphere. Thus,requirements in these parts of the atmosphere should not be considered as drivers for determiningobservation requirements. This is reflected in later chapters of this report where needs areassessed against provisions.
For ozone, the primary quantity of interest in this document, detailed requirements areprovided in Table B.1 in Annex B. Tables B.2 detail the requirements for the "source gases" listedin Table 1.1 (i.e. water vapour (H2O), nitrous oxide (N2O), methane (CH4), carbon monoxide (CO)and carbon dioxide (CO2)); Tables B.3 the requirements for the "reservoir species" listed in Table1.1 (i.e. hydrogen chloride (HCl); nitric acid (HNO3); Tables B.4 the requirements for the "freeradicals" listed in Table 1.1 (i.e. bromine oxide (BrO), chlorine monoxide (ClO), nitrogen dioxide(NO2) and nitric oxide (NO)). Specific requirements for information on temperature and wind aresummarised in Tables B.5 and those for aerosols and polar stratospheric clouds in Table B.6.

15
2.3.1 Ozone (Table 2.1 and B.1)
Ozone plays a key role in atmospheric chemistry and the radiative balance of theatmosphere. In the stratosphere it is the main absorber of ultraviolet radiation. This absorption isresponsible for the increasing temperature above the tropopause. In the lower stratosphere andupper troposphere it becomes a powerful greenhouse gas and forcing function for climate change.In the lower troposphere it is a pollutant and is created through complex chemical reactions withanthropogenic gases and sunlight. This means that the observational requirements varyconsiderably. Table B.1 attempts to satisfy most user requirements and to some degree it is acompromise. Because of the key role ozone plays in this report a more detailed justification for thetable of requirements is provided below.
General circulation models currently use a grid size of 1o x 1o, i.e. a horizontal resolution ofabout 250 km. This was set as the horizontal threshold. The horizontal target value for the lowertroposphere was set to 10 km based on the requirement of the air quality user community toresolve the horizontal ozone gradient within and downwind of major population centres. Above theplanetary boundary layer the horizontal ozone concentration gradient is less pronounced allowinga relaxation of the target value to 50 km. For the total column density, the threshold requirement of100 km is based on the Dobson/Brewer user community constraining the representivity of theirvertical "point" measurement to about this value. However, a much higher horizontal resolution willbe required to fully meet user requirements; thus the target value of 10 km.
The target value of 0.5 km for vertical resolution meets the modelling communityrequirement. Current regional climate and chemistry models which operate with vertical resolutionsof this order of magnitude and observations confirm that the vertical ozone gradient does changesignificantly with altitude on this scale. Of particular importance to climate modellers are the ozonechanges in the 8-12 km range (where an increase in ozone is postulated) and in the 15-20 kmrange (where a decrease in ozone concentration occurred). The values for vertical thresholdreflect the requirements of other user groups (air quality, climate and chemistry modellers, trendanalysts) who also need ozone profile information.
The target values for bias and RMS errors reflect the ozone concentrations observed withinthe stated vertical regions of the atmosphere and the issues that the different user groups need toresolve. For the troposphere, and particularly for the planetary boundary layer, the air qualitycommunity routinely demands an accuracy of 5% or 2 ppb and a precision of 3% or 1 ppb (alwaysthe larger of the two numbers).
For the lower stratosphere, several issues are important which have to be considered insetting the target value, notably ozone increase due to air traffic (8-12 km), ozone destruction athigher levels due to heterogeneous reactions (< 20 km), global ozone decrease due to CFCs andozone depletion in the Antarctic and Arctic regions. Since the ozone concentration above thetropopause increases significantly (by an order of magnitude) to attain a peak value at about 20-25km and decreases thereafter, different target and threshold requirements have been forwarded forthese altitude regimes by the user communities, reflecting their interest in specific scientific orpolicy issues.
With about 90% of the total ozone residing in the stratosphere, the total trend in columnozone is governed by changes in this region (mainly in the lower stratosphere). Between January1979 and May 1994 total ozone (60oN to 60oS) showed a decline of 2.9% per decade.Consequently the target value for total ozone (column) trend detection was set to 0.1 % per yearand for the lower/upper stratosphere to 0.3 % per year.
Ozone trends in the troposphere have been studied by many workers, but remain uncertainin large regions of the globe due to the lack of reliable long term data sets. The atmosphericchemistry user group required a target value of 0.5% for both planetary boundary layer and freetroposphere.

16
2.3.2 Other Chemical Species
a) Source Gases (Tables B.2)
The presence of source gases (produced both naturally and by human activity) can havesignificant impacts on the global atmosphere because of the radiative and chemical effectsassociated with their presence, in particular their role in influencing the distribution of ozone. Theirlong chemical lifetimes means that long term global measurements of a small number of them asa function of altitude, are sufficient to provide insights into atmospheric transport as well asproviding a dynamical context for the measurements of ozone and other parameters. This meansthat the accurate long term observation of some of these species is a critical requirement - themost important of which is water vapour.
Surface level measurements will be the most critical for establishing long term variations inthe concentrations of many of these constituents which can evolve significantly with time but whichcannot be predicted with any certainty. Classes of compounds for which such measurements areneeded include halides and halocarbons from both natural and anthropogenic sources. Some ofthese are included in Table 1.2.
The observation of the more chemically-active source gases are specified in this report andare listed in Table 1.1. The justification for these observations are discussed below.
Nitrous Oxide (N2O) and/or Methane (CH4) - it is useful to monitor one or more of the longlife tracers to help clarify the dynamical context of the tropospheric air masses associatedwith observations of trace species. Two of the most commonly used tracers are N2O andCH4. This reflects their differing lifetimes (which facilitates their use in transport studies), aswell as the fact that they are among the more easily observed source gases. Ideally bothshould be observed as their lifetimes in the atmosphere are sufficiently different to providecomplementary information. Both gases also play important roles in the stratosphere in thecatalytic cycle of ozone and, furthermore, of water vapour through the oxidation ofmethane. N2O and CH4 are also greenhouse gases.
Carbon Monoxide (CO) - this is an important gas in the budget of tropospheric ozone asthe oxidation of CO in the presence of NOx leads to the production of ozone. In NOx -poorregions CO oxidation results in the loss of ozone. CO also serves as a tracer fortropospheric air transferred into the stratosphere, notably associated with deep convectiveactivity which, above continental regions, often penetrates into the stratosphere.
Carbon Dioxide (CO2) - this is one of the most well-known end product of the burning(oxidation) of fossil fuels and biomass. Associated with increasing industrial activity, levelsincreased dramatically during the last century and are expected to continue to increase wellinto the future. CO2 is an important greenhouse gas, having little interaction with solarradiation but absorbing infrared radiation from the Earth's surface. Increasing CO2 levelsare expected to lead to tropospheric warming, with model predictions of increases over thenext century in the global average surface temperature ranging between one and a fewdegrees. The large-scale long term monitoring of CO2 is of critical importance.1
The concentrations of source gases can vary significantly with height in regions where theyphotolyse. This means that for observations of these species to be useful they must have avertical resolution that is no worse than the scale height (6-8 km). However, in general, a verticalresolution of at least 2-3 km will be required and an even higher resolution (~1 km) would be very
1 In Table B.2e target values in the troposphere are set to meet the most stringent requirements for trend detection(currently 0.36 ppm/year and only detectable through surface-based observations). Target values for horizontalresolution (10 km) are set to allow detection of "hot spots" of CO2 emissions from satellites (total column). Lowerstratospheric CO2 measurements are important for obtaining the seasonal cycle of CO2 which has an amplitude of about4 ppm in the tropics (transport process studies). Upper stratospheric CO2 measurements reflect only the annualincrease. In addition, height resolved stratospheric CO2 measurements are used for deriving temperature.
17
useful. As spatial and temporal variations are important, high horizontal resolution, coupled withhigh precision will be essential.
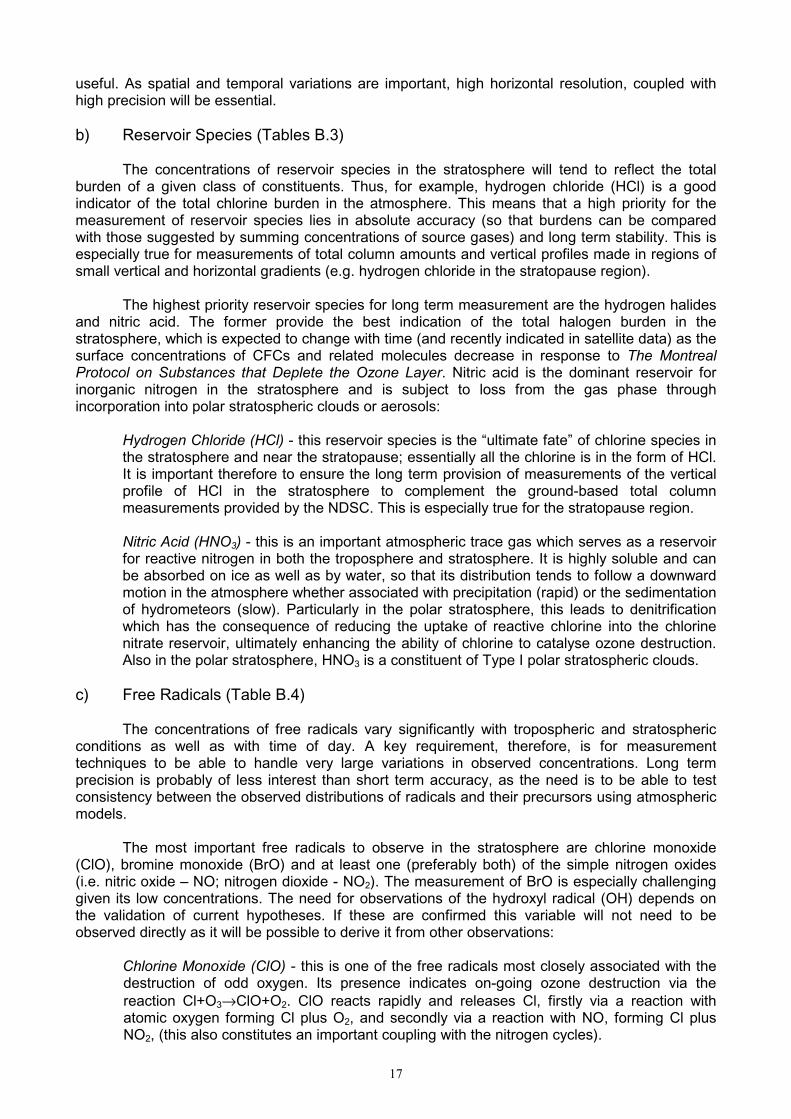
b) Reservoir Species (Tables B.3)
The concentrations of reservoir species in the stratosphere will tend to reflect the totalburden of a given class of constituents. Thus, for example, hydrogen chloride (HCl) is a goodindicator of the total chlorine burden in the atmosphere. This means that a high priority for themeasurement of reservoir species lies in absolute accuracy (so that burdens can be comparedwith those suggested by summing concentrations of source gases) and long term stability. This isespecially true for measurements of total column amounts and vertical profiles made in regions ofsmall vertical and horizontal gradients (e.g. hydrogen chloride in the stratopause region).
The highest priority reservoir species for long term measurement are the hydrogen halidesand nitric acid. The former provide the best indication of the total halogen burden in thestratosphere, which is expected to change with time (and recently indicated in satellite data) as thesurface concentrations of CFCs and related molecules decrease in response to The MontrealProtocol on Substances that Deplete the Ozone Layer. Nitric acid is the dominant reservoir forinorganic nitrogen in the stratosphere and is subject to loss from the gas phase throughincorporation into polar stratospheric clouds or aerosols:
Hydrogen Chloride (HCl) - this reservoir species is the “ultimate fate” of chlorine species inthe stratosphere and near the stratopause; essentially all the chlorine is in the form of HCl.It is important therefore to ensure the long term provision of measurements of the verticalprofile of HCl in the stratosphere to complement the ground-based total columnmeasurements provided by the NDSC. This is especially true for the stratopause region.
Nitric Acid (HNO3) - this is an important atmospheric trace gas which serves as a reservoirfor reactive nitrogen in both the troposphere and stratosphere. It is highly soluble and canbe absorbed on ice as well as by water, so that its distribution tends to follow a downwardmotion in the atmosphere whether associated with precipitation (rapid) or the sedimentationof hydrometeors (slow). Particularly in the polar stratosphere, this leads to denitrificationwhich has the consequence of reducing the uptake of reactive chlorine into the chlorinenitrate reservoir, ultimately enhancing the ability of chlorine to catalyse ozone destruction.Also in the polar stratosphere, HNO3 is a constituent of Type I polar stratospheric clouds.
c) Free Radicals (Table B.4)
The concentrations of free radicals vary significantly with tropospheric and stratosphericconditions as well as with time of day. A key requirement, therefore, is for measurementtechniques to be able to handle very large variations in observed concentrations. Long termprecision is probably of less interest than short term accuracy, as the need is to be able to testconsistency between the observed distributions of radicals and their precursors using atmosphericmodels.
The most important free radicals to observe in the stratosphere are chlorine monoxide(ClO), bromine monoxide (BrO) and at least one (preferably both) of the simple nitrogen oxides(i.e. nitric oxide – NO; nitrogen dioxide - NO2). The measurement of BrO is especially challenginggiven its low concentrations. The need for observations of the hydroxyl radical (OH) depends onthe validation of current hypotheses. If these are confirmed this variable will not need to beobserved directly as it will be possible to derive it from other observations:
Chlorine Monoxide (ClO) - this is one of the free radicals most closely associated with thedestruction of odd oxygen. Its presence indicates on-going ozone destruction via thereaction Cl+O3→ClO+O2. ClO reacts rapidly and releases Cl, firstly via a reaction withatomic oxygen forming Cl plus O2, and secondly via a reaction with NO, forming Cl plusNO2, (this also constitutes an important coupling with the nitrogen cycles).

18
A third rapid process retrieving Cl from ClO is photodissociation. The catalytic cyclesinvolving Cl and ClO which destroy ozone can be stopped by the (slower) reactions of Clwith hydrogen compounds, most importantly methane, forming the reservoir species HCl.Another important channel for removing active chlorine is the reaction of ClO with NO2,forming the reservoir species ClONO2 (which again can dissociate in the ultraviolet). ClO istherefore a key species in active stratospheric chlorine chemistry.
Bromine Oxide (BrO) - despite its much smaller abundance in the stratosphere comparedto that of ClO, the presence of BrO, is highly significant for ozone destruction because ofthe "per-atom" effectiveness of bromine in destroying ozone. Recent evidence also seemsto suggest that, in addition to its role in the polar stratosphere, the presence of BrO in thetroposphere during the polar spring is important and is highly synergistic with ClO.
The catalytic cycle involves the ozone depleting reaction Br+O3→BrO+O2 and the‘recycling’ of Br from BrO. This can be effected (similar to the ClO cycle) by reactions withatomic oxygen or NO, as well as with another BrO molecule. A strong synergy is achievedif ClO and BrO appear together as they accelerate Br and Cl retrieval through the reactionBrO+ClO→Br+OClO→Br+Cl+O2.
Nitrogen Dioxide (NO2) and Nitric Oxide (NO) - NO2 (along with its sister species NO) playsan important role in atmospheric chemistry. In the stratosphere it participates in thecatalytic destruction of ozone, while in the troposphere its presence largely determines therate of in-situ photochemical ozone production.
Conversely, the sedimentation of polar stratospheric cloud particles containing nitricacid may enhance the future loss of ozone by reducing the conversion of ClO to ClONO2.Further uncertainties are associated with factors such as the production of NOx bylightning, aircraft emissions and the convective transport of surface level pollutants. Thismeans that the global budget of reactive nitrogen is both uncertain and variable in time,especially in the vicinity of the upper troposphere/lower stratosphere. Observations of NO2
and its sister NO are essential to contain this uncertainty.
2.3.3 Meteorological Parameters (Table B.2a and Tables B.5)
To obtain a full understanding of the distribution and concentration of ozone andassociated trace species in both the troposphere and the stratosphere, knowledge of certainmeteorological parameters is essential. Some of these are also required to drive the algorithmsused to retrieve ozone and other variables. The list of relevant meteorological parameters includesvertical profiles of temperature and water vapour, the height of the tropopause, cloud informationand wind profiles. Wind profiles are needed to take proper account of atmospheric dynamics andtransport mechanisms, especially in the upper troposphere and in the stratosphere, wheninterpreting ozone observations.
Most of the requirements for knowledge of meteorological parameters, as defined by theUpper Air Project in support of IGOS, also encompass the needs of the Ozone Project (in factmany actually exceed them). Thus, assuming that these requirements are met, here in this reportthe focus is on the two notable exceptions, namely tropopause height and levels of water vapour inthe region of the upper troposphere/lower stratosphere. In both instances the requirements of theOzone Project are more stringent. The actual requirements for tropopause height are forknowledge to 0.1 km (target) and 0.2 km (threshold) assuming the WMO definition of tropopause(based on thermal stability). The detailed requirements for water vapour are listed in Table B.2aand those for temperature and wind in Tables B.5.
The more exacting requirements associated with tropopause height arise primarily from itsuse as an indicator of changes in ozone column amounts. The need to accurately characterisewater vapour levels in the upper troposphere and lower stratosphere (which can be very sensitiveto the temperature of the tropopause) stems from the important role that water plays in controllingthe chemistry, radiative balance and particle formation in this part of the atmosphere. Here

19
concentrations are very small from a meteorological point of view and the requirements defined bythe Upper Air Project do not sufficiently constrain the distribution of water vapour for the use ofthese data in chemistry studies.
2.3.4 Aerosol (Tables B.6)
The dominant source of stratospheric aerosol are the major volcanic eruptions that depositvolcanic ash and aerosol precursor gases (i.e. sulphur dioxide that is rapidly oxidised to sulphuricacid and nucleated into fine particles) into the stratosphere where it can reside for up to 3 years,depending on its location above the tropopause. This means that the stratospheric aerosol burdenis essentially determined by volcanic activity.
The properties of stratospheric aerosol, which are relevant to the stratospheric ozonebudget and essential for retrieving ozone concentrations, are the extinction coefficient (Table B.6b) and (derived from this information) the size distribution and surface area/volume (Table B.6 c)and aerosol backscatter (Table B.6 d). These properties are measured or inferred from a fewground-based stations (aerosol lidars) or (occasionally) from aircraft or balloon platforms. Theaccuracy and precision levels listed in these tables as "target" are indeed achievable with thesesystems and comfortably meet the target requirements stated by the user, in particular foraddressing the issue of ozone destruction on aerosol surfaces and for incorporating the requiredaerosol parameters in the ozone retrieval algorithms. Some ozone sensors (limb viewing) ceaseoperation when optically dense aerosol is present
Since aerosols exhibit very strong vertical (and horizontal) gradients, the vertical resolutionhas been set rather tightly allowing, for example, the assessment of the impact of the presence ofaerosols on ozone concentration. In addition, consideration was given to the climate forcing ofstratospheric aerosol which requires not only extinction/backscatter measurements approachingthe stated target values, but also the ability to detect long term trends (~1% per year) in both thestratospheric aerosol burden and in the total aerosol column. The threshold requirements (of about20 % per year) are essentially determined by the need to detect the presence of large quantities ofvolcanic aerosol after major eruptions.
The requirements to be able to detect the presence of polar stratospheric clouds (PSCs)responsible for the processes that lead to ozone destruction and ultimately to the annuallyrecurring ozone hole phenomena, are summarised in Table B.6 a. Because of the relatively highoptical density of PSCs, their detection from space and ground seems to be feasible if themeasurements lie within the limits stated in Table B.6 d.
The importance of tropospheric aerosol is related to a lesser degree to ozone itself, butmore to the measurement of UV-B fluxes at the surface, to aerosol forcing (Earth radiation budget)and most importantly to air quality issues. Regional haze originating from fossil fuel combustion orbiomass burning and dust storms are but a few of the issues that challenge the sciencecommunity. To satisfy their respective needs requires that the target values listed in Tables B.6 b-d are closely met, not only with regard to RMS and bias error but also for vertical resolution. At aminimum, measurements must differentiate between the aerosol residing in the planetaryboundary layer versus that in the free troposphere. Unlike stratospheric aerosol, troposphericaerosol is highly inhomogeneous, both in space and time, and, to complicate the situation further,in chemical composition and physical characteristics.
2.3.5 Spectrally Resolved Solar Ultraviolet Irradiance
Accurate knowledge of levels of solar ultraviolet radiation, which drives atmosphericphotochemistry and provides the photons that ultimately reach the Earth's surface, is essential ifquantitative knowledge of the relationship between atmospheric ozone levels and surfaceultraviolet radiative fluxes is to be obtained. Some information can be obtained based on the useof proxy quantities for solar variability and observed relationships between spectrally resolvedsolar ultraviolet radiation and these proxies. However, the possible variation in the wavelength
20
dependence of solar output over multiple solar cycles indicates that the direct measurement ofsolar ultraviolet spectral irradiance must be carried out on a regular basis.
a) Top of the Atmosphere
For top of the atmosphere (TOA) solar irradiance measurements the key requirement is adaily measurement of about 30 minutes per day (total and spectral). The wavelength rangecoverage needed to link atmospheric photochemistry and surface ultraviolet radiation extends fromapproximately 200 to 400 nm (wavelengths shorter than 200 nm are mainly important in controllingthe extent and temperature of the mesosphere and the thermosphere). Wavelengths in the nearinfrared up to about 2000 nm are needed for the study of water vapour absorption and cloudprocesses. A wavelength resolution of the order of 0.5 nm is required, especially in the UV-Bregion, where the absorption cross section of ozone exhibits significant wavelength dependencewhich will have a major impact on the surface flux of ultraviolet radiation.
The specific requirements for solar spectral irradiance observations are based on knowncyclical variations and their expected effects on atmospheric chemistry and radiation. For thewavelength range 200 to 2000 nm, absolute accuracy should be 0.03% with a relative accuracy of0.01% per year. For shorter wavelengths, absolute accuracy and relative accuracy should bebetter than 5% and 1% per year, respectively. Wavelength resolution at shorter wavelengths (butgreater than 200 nm) should be higher (approximately 0.2 nm) but can then be reduced to 30 nmabove 1000 nm.
b) Surface Measurements
For surface measurements of ultraviolet radiation the requirements are for observationslonger than 290 nm because radiation of shorter wavelengths are filtered out by ozone. For therest of the spectrum spectral resolution requirements are similar to those noted above. However,the required frequency of observation is much greater as there are many short term variations insurface ultraviolet flux associated with variations in cloud amounts, as well as in aerosol amountsand the overlying ozone column. There is also a change in solar zenith angle over the course ofthe day that affects surface ultraviolet fluxes.
As there can be rapid changes in radiance due to the overhead passage of clouds, it isimportant that ultraviolet spectral measurements are made continuously during these periods toensure that temporal and wavelength variation are discernable. They must also provide goodspectral discrimination as there is an enormous variation in the surface ultraviolet flux withwavelength due to the existence of a sharp “cut-off” in ozone absorption in the atmosphere. Forstudies of surface ultraviolet radiation under cloudless conditions, ozone profiles (in stratosphereand troposphere) are needed. Aerosol optical depth are also controlling factors and should bemeasured.

21
3. AVAILABLE AND PLANNED MEASUREMENTS
3.1 Introduction
In this chapter, the sources of observations of ozone, associated meteorologicalparameters, other trace constituents and related parameters (discussed in Chapter 2) areconsidered within the context of the concerns of the Ozone Project. The emphasis is on ground-,balloon-, airborne and space-based measurement systems capable of the routine operationalprovision of these data. Little attention is given to process-oriented measurements such as thoseinvolving research aircraft or balloons, which typically do not provide data sets relevant to thestudy and interpretation of long term global trends which are the concern of this report.
Requirements for some parameters traditionally measured by the operationalmeteorological agencies have been identified in this report. The provision of these data isconsidered in Chapter 4, The Harmonisation of Provisions and Requirements. The focus is oninstances where the data normally provided operationally by meteorological agencies are not likelyto meet the requirements for long term ozone monitoring (see also Chapter 2).
In addition, it is important to note that some measurements of clear relevance to the longterm monitoring of ozone, most notably surface level ozone measurements, are made throughnetworks operated by air quality-oriented agencies. The Global Atmosphere Watch (GAW) and itssurface ozone data base can play a critical role in assuring the availability, representativeness anduniform data quality of such observations. It is important that such measurement networks willcontinue to exist and be well maintained.
The information presented in this chapter was obtained from the institutions, agencies, andprogrammes responsible for the observing systems described. Much of the material on space-based measurements was taken from an article “Summary of Space-Based Observations ofAtmospheric Chemistry” which appeared in a newsletter of the Stratospheric Processes and theirRole in Climate (SPARC) subgroup of the World Climate Research Programme (WCRP).
3.2 Non-Satellite Measurements
A wide variety of non-satellite instruments and platforms are available and in operation formaking routine total column and profile ozone measurements. As many of these also makemeasurements of other trace constituents, instruments that measure ozone and relatedparameters are treated together. Some of these activities are incorporated into national andinternational networks such as the NDSC and the WMO GAW, while others make measurementsprimarily on a campaign basis. Both types of measurement can make valuable contributions to theprovision of the data required to quantify and interpret changes in the global ozone distribution, aswell as helping to validate the accuracy and precision and hence the stability of satelliteobservations.
3.2.1 Ground-based in-situ Measurements
The ground-based in-situ measurements most relevant to the interpretation of ozoneobservations concern surface-emitted, long-lived source gases that give rise to chemically activespecies (including those containing chlorine and bromine) in the atmosphere, or are radiativelyactive in climate forcing. Several well-established, geographically distributed networks exist formonitoring the long term evolution of the concentration of these species, notably the AdvancedGlobal Atmospheric Gases Experiment (AGAGE) network of the US National Aeronautics andSpace Administration and the flask sampling network of the US National Oceanic and AtmosphericAdministration. A map of ground-based in-situ sampling stations which have long term datarecords of trace constituent composition is shown in Figure 3.1.

22
These networks place substantial emphasis on the high quality, consistent calibration ofinstruments' accuracy and precision over the long term. They routinely observe the full range ofchlorofluorocarbons (CFCs) and related halocarbons (methyl chloroform and carbon tetrachloride),bromine-containing halons and methyl bromide, hydrogenated chlorofluorocarbons (HCFCs) andother CFC replacement compounds, as well as methane and nitrous oxide. In so doing, they coverall the source gases listed in Table 1.1 (and Table 1.2) for which the primary requirement is forregular observations at ground level. It is worth noting that the list of species whose concentrationsare being monitored is slowly expanding to include shorter-lived species such as methyl bromide,as well as the long-lived species that were the original focus of these networks.
The stations cover a range of geographic locations, including relatively unpolluted areas, sothat the atmospheric “background” is well characterised and contamination from polluted urban airis minimised. Individual stations operated by scientists in other nations also exist, and thecalibration of the measurement systems used in these has, in many cases, been compared withthat of the AGAGE and NOAA networks. Table 3.1 lists all the trace species/parameters observed(though not all be every station). It will be noted that some also measure ozone profiles andcolumn amounts.
3.2.2 Ground-Based Remote Sensing Measurements
Ground-based remote-sensing instruments for atmospheric chemistry measurements canbe viewed as falling into overlapping groups:
• those that have been designed primarily to make ozone measurements versus thosethat have been developed to provide a more comprehensive set of atmosphericobservations
• those designed primarily for the measurement of total column amounts versus those
designed primarily for the measurement of vertical distributions (this breakdown is notcompletely clean - for example the ultraviolet-visible and the Fourier transform infraredinstruments (see below), which have been designed primarily to measure columnamounts, also provide some information on the vertical distributions of a fewconstituents, notably NO2 and CO, respectively).
As indicated above, Table 3.1 lists the species (plus aerosols and UV flux) measured bythe different ground-based remote sensing systems, including those for which profile and columnamount information are available (and the source of these data). Table 3.2 summarises theinstrumentation available in the NDSC, including both the primary (that contain the full range ofNDSC instrumentation) and complimentary sites. A map showing sites currently affiliated to theNDSC is reproduced in Figure 3.2. Particular issues related to calibration, validation, and datamanagement for these systems are discussed in Chapter 5.

23

24
Table 3.1: The list of species observed by ground-based observing stationsand (where appropriate) the technique used to observe vertical profiles or column
amounts
INSTRUMENT TYPE
SPECIES LIDAR FTIR UV/VIS µWAVE Sondes Dobson/Brewer
UVSpectrometer
O3 p p c p p p
N2O c p
NO c
NO2 c p p
NO3 c
HNO3 p p
HNO4
N2O5
CFCl3 c
CF2Cl2 c
CF3CCl3
CCl4 c
CH3CCl3
CH3Cl c
HCl p
ClO p
OclO p
ClONO2 c
HF c
CF2O c
CF3Br
CF2ClBr
CH3Br
BrO p
H2O p p p
H2O2 p
OH c
HO2 p
CH4 p
CO p p
SF6 c
CF4 c
OCS c
SO2
HCN c
T p p
Aerosols p p
UV Flux p
Note: "p" - profiles and column amounts "c" - column amounts only
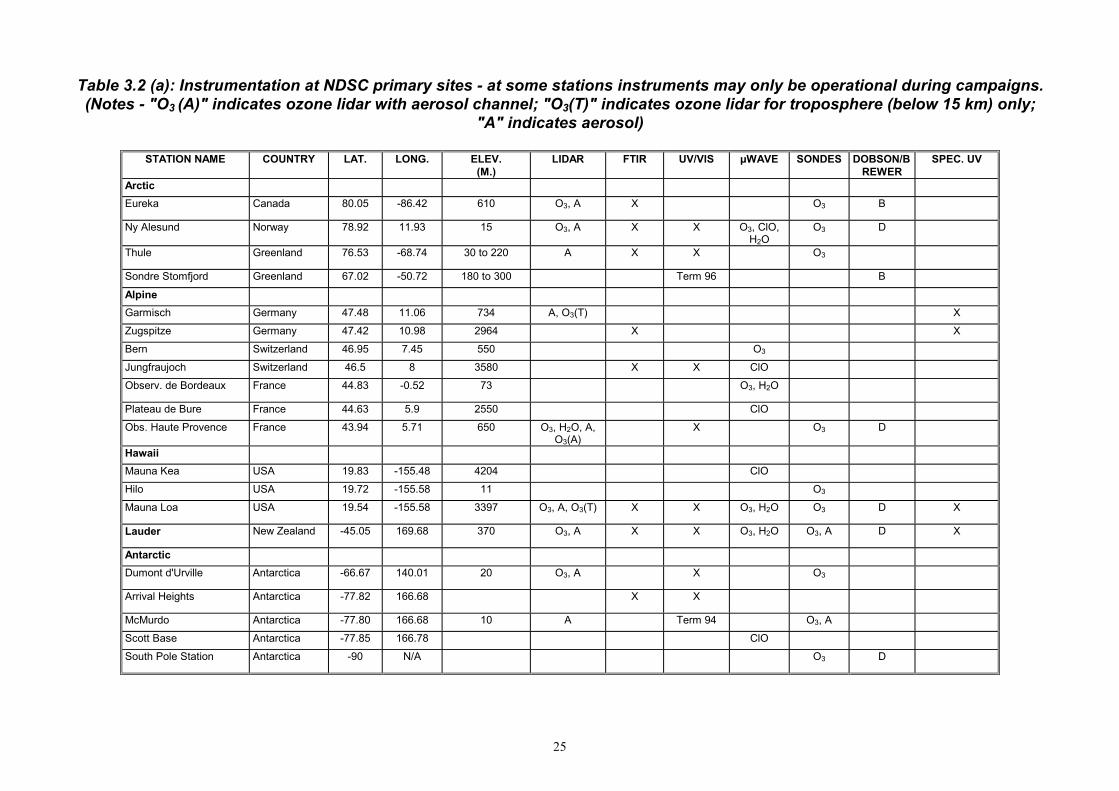
25
Table 3.2 (a): Instrumentation at NDSC primary sites - at some stations instruments may only be operational during campaigns.(Notes - "O3 (A)" indicates ozone lidar with aerosol channel; "O3(T)" indicates ozone lidar for troposphere (below 15 km) only;
"A" indicates aerosol)
STATION NAME COUNTRY LAT. LONG. ELEV.(M.)
LIDAR FTIR UV/VIS µWAVE SONDES DOBSON/BREWER
SPEC. UV
Arctic
Eureka Canada 80.05 -86.42 610 O3, A X O3 B
Ny Alesund Norway 78.92 11.93 15 O3, A X X O3, ClO,H2O
O3 D
Thule Greenland 76.53 -68.74 30 to 220 A X X O3
Sondre Stomfjord Greenland 67.02 -50.72 180 to 300 Term 96 B
Alpine
Garmisch Germany 47.48 11.06 734 A, O3(T) X
Zugspitze Germany 47.42 10.98 2964 X X
Bern Switzerland 46.95 7.45 550 O3
Jungfraujoch Switzerland 46.5 8 3580 X X ClO
Observ. de Bordeaux France 44.83 -0.52 73 O3, H2O
Plateau de Bure France 44.63 5.9 2550 ClO
Obs. Haute Provence France 43.94 5.71 650 O3, H2O, A,O3(A)
X O3 D
Hawaii
Mauna Kea USA 19.83 -155.48 4204 ClO
Hilo USA 19.72 -155.58 11 O3
Mauna Loa USA 19.54 -155.58 3397 O3, A, O3(T) X X O3, H2O O3 D X
Lauder New Zealand -45.05 169.68 370 O3, A X X O3, H2O O3, A D X
Antarctic
Dumont d'Urville Antarctica -66.67 140.01 20 O3, A X O3
Arrival Heights Antarctica -77.82 166.68 X X
McMurdo Antarctica -77.80 166.68 10 A Term 94 O3, A
Scott Base Antarctica -77.85 166.78 ClO
South Pole Station Antarctica -90 N/A O3 D

26
Table 3.2 (b): Instrumentation at NDSC Complimentary Sites - at some stations instruments may only be operational duringcampaigns. (Notes - "O3(A)" indicates ozone lidar with aerosol channel; "O3(T)" indicates ozone lidar for troposphere
(below 15 km) only; "A" indicates aerosol)
STATION NAME COUNTRY LAT. LONG. ELEV.(M.)
LIDAR FTIR UV/VIS µWAVE SONDES DOBSON SPEC. UV
Scoresbysund Greenland 70.48 -21.97 X
Andoya Norway 69.3 16 A, O3 X X
Kiruna Sweden 67.83 20.42 X
Sodankyla Finland 67.37 26.63 X O3
Zhigansk Russia 67.2 123.4 X
Harestua Norway 60.2 10.8 560 X
Zvenigorod Russia 55.4 36.5 A, O3 X X
Aberystwyth UK 52 4 A, O3 X O3
Moshiri Japan 44.4 142.3 X X
Toronto Canada 43.8 -79.5 A,O3
Rikubetsu Japan 43.5 143.8 370 X X
Greenbelt USA 38.9 -76.7 A
Wallops Island USA 37.93 -75.48 O3
Mt. Barcroft USA 37.6 -118.2 X
Billings (OK) USA 36.61 -97.48 315 X
Tsukuba Japan 36.05 140.13 O3
Kiso Japan 35.8 137.6 X
Table Mountain (CA) USA 34.4 -117.7 2300 O3, O3(T), A H2O
Kitt Peak USA 32 -111.5 2120 X
Tarawa Kiribati Rep. 1.4 172.9 X
Bandung Indonesia -6.4 107.4 X
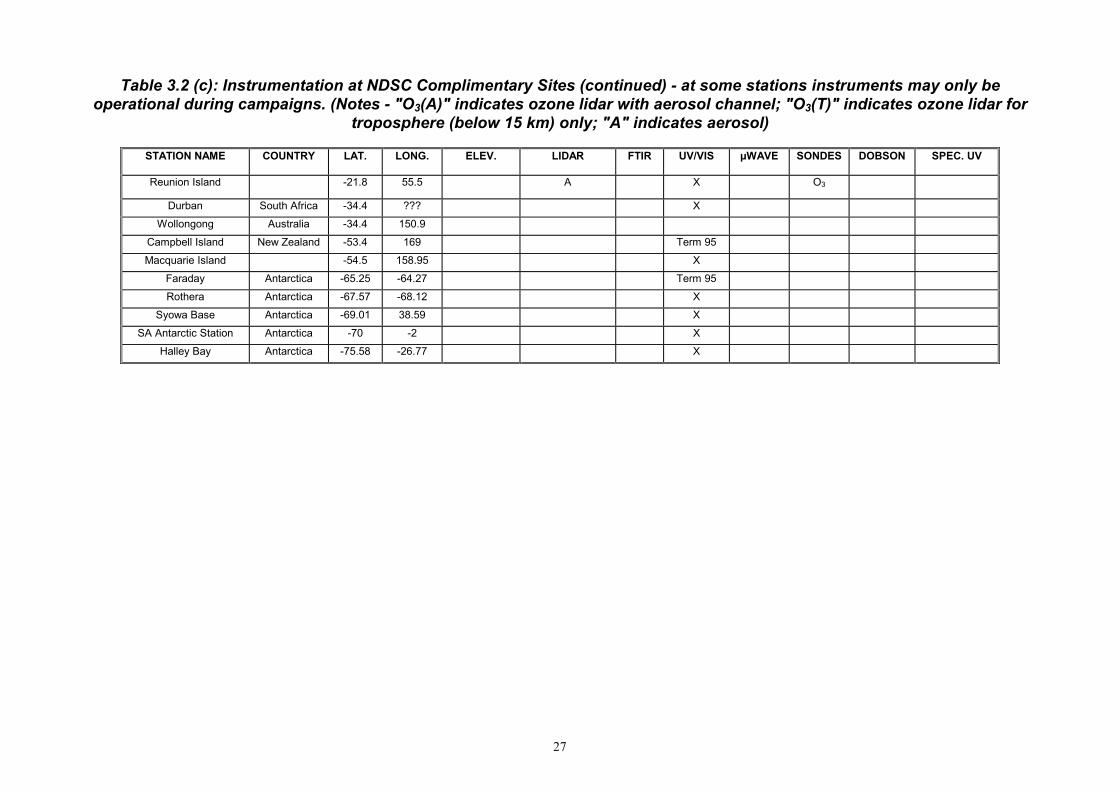
27
Table 3.2 (c): Instrumentation at NDSC Complimentary Sites (continued) - at some stations instruments may only beoperational during campaigns. (Notes - "O3(A)" indicates ozone lidar with aerosol channel; "O3(T)" indicates ozone lidar for
troposphere (below 15 km) only; "A" indicates aerosol)
STATION NAME COUNTRY LAT. LONG. ELEV. LIDAR FTIR UV/VIS µWAVE SONDES DOBSON SPEC. UV
Reunion Island -21.8 55.5 A X O3
Durban South Africa -34.4 ??? X
Wollongong Australia -34.4 150.9
Campbell Island New Zealand -53.4 169 Term 95
Macquarie Island -54.5 158.95 X
Faraday Antarctica -65.25 -64.27 Term 95
Rothera Antarctica -67.57 -68.12 X
Syowa Base Antarctica -69.01 38.59 X
SA Antarctic Station Antarctica -70 -2 X
Halley Bay Antarctica -75.58 -26.77 X
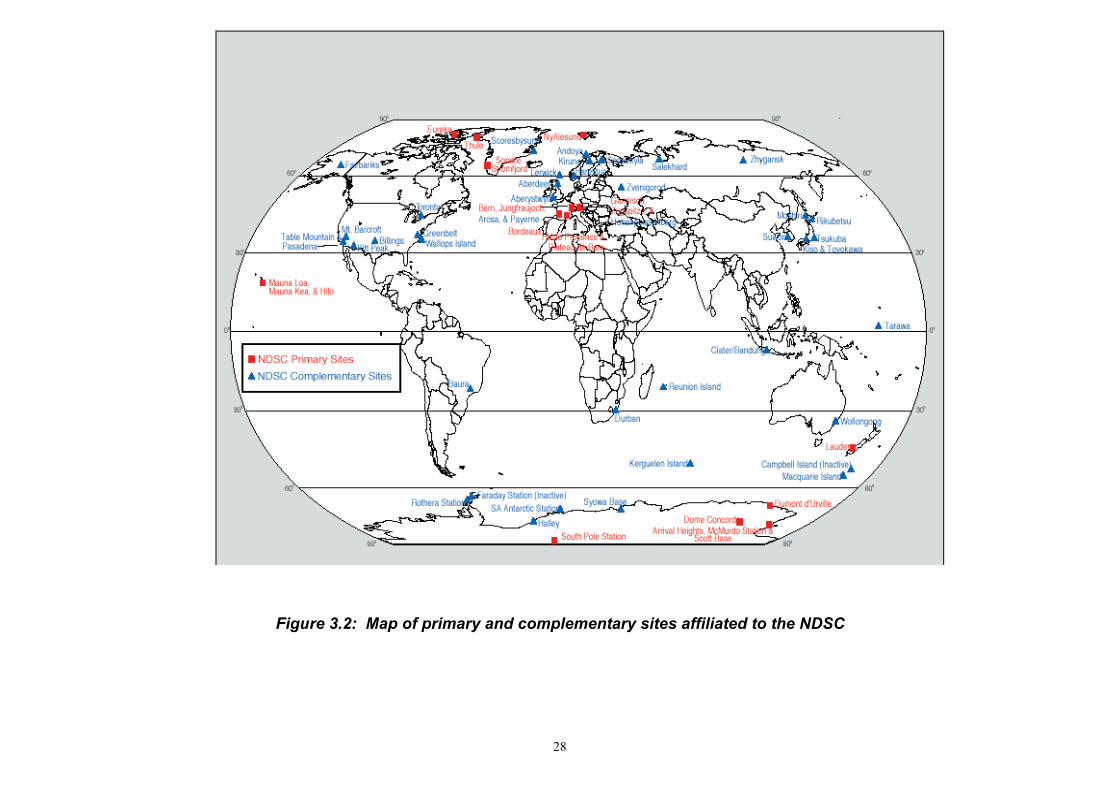
28
Figure 3.2: Map of primary and complementary sites affiliated to the NDSC

29
a) Column Measurements
The Dobson Spectrophotometer has a history of high quality total ozone observationsstretching back nearly 70 years and regular measurements have been made with it forabout 40 years. The current WMO-GAW network includes approximately 70 stations withmany of these concentrated at mid-latitudes in the northern hemisphere (e.g.33 in Europe).Almost all of these instruments have their calibration tied to a single standard Dobsoninstrument (#83) through regional and national standard Dobson instruments. Although thecontinuation of this network has often been clouded by uncertainty, the on-going efforts ofthe WMO-GAW programme and the importance of the long term data set based on thisnetwork, have allowed it to survive basically intact. A map showing the regularly reportingDobson and Brewer Spectrometer stations, as well as those using other well-establishedtechniques (such as filter instruments) to measure total column ozone is shown in Figure3.3. Annex C provides further information on the data records available from regularlyreporting ground-based ozone measuring stations.
The Brewer Spectrometer is a high quality instrument which measures ozone, as well asseveral other constituents, by making spectral measurements in the UV-B part of the solarspectrum. Its high performance coupled with the feasibility of automating its operation, hasled to the deployment of about 70 of these instruments in the network. As with the Dobsoninstrument, many are concentrated at mid-latitudes in the northern hemisphere (e.g. 20 inthe U.S.). A reference triad of Brewer instruments is maintained at MSC Canada as astandard and, at least initially, the station instruments are linked to this standard. TheBrewer is also a component of the GAW network and about 15 of them are included withinthe NDSC. There are also travelling standards.
The Ultraviolet-Visible Spectrometer, of which the SAOZ is the most widely usedexample, is able to obtain total ozone amounts at low sun elevation angles wheninstruments such as the Brewer and Dobson are not capable of making measurements.This has led to them being mainly sited at the poles for use in polar winter conditionsthough they are also used in other latitudes. The calibration of these instruments is not aswell established as is the case for the other two instruments but work within the NDSCshould help remedy this situation. These instruments can also be used to measure othertrace constituents with strong absorption in the visible and ultraviolet wavelength regionssuch as NO2, NO3, BrO and OClO.
Fourier Transform Infrared Spectrometers (FTIR) can be used to make measurementsof a whole host of atmospheric constituents in addition to ozone, including a number oflong life gases (methane, nitrous oxide, water vapour, carbon monoxide and selectedCFCs) and important reservoir molecules like hydrogen chloride, hydrogen fluoride, nitricacid and chlorine nitrate. Column amounts of such species measured over many yearsusing FTIRs have been critical in documenting the increasing concentrations ofhalogenated species in the atmosphere. The nearly two dozen FTIR instruments affiliatedwith the NDSC are operating according to protocol rules established and up-dated by anad-hoc NDSC working group. A mobile FTIR serves as a "reference" to ensure internalconsistency for this type of instrumentation throughout the network. Furthermore, a strongeffort is underway within the NDSC and WMO-GAW stations to ensure the provision ofhigh quality measurements and, even now, FTIR ozone amounts are routinely comparedwith Dobson and Brewer observations.
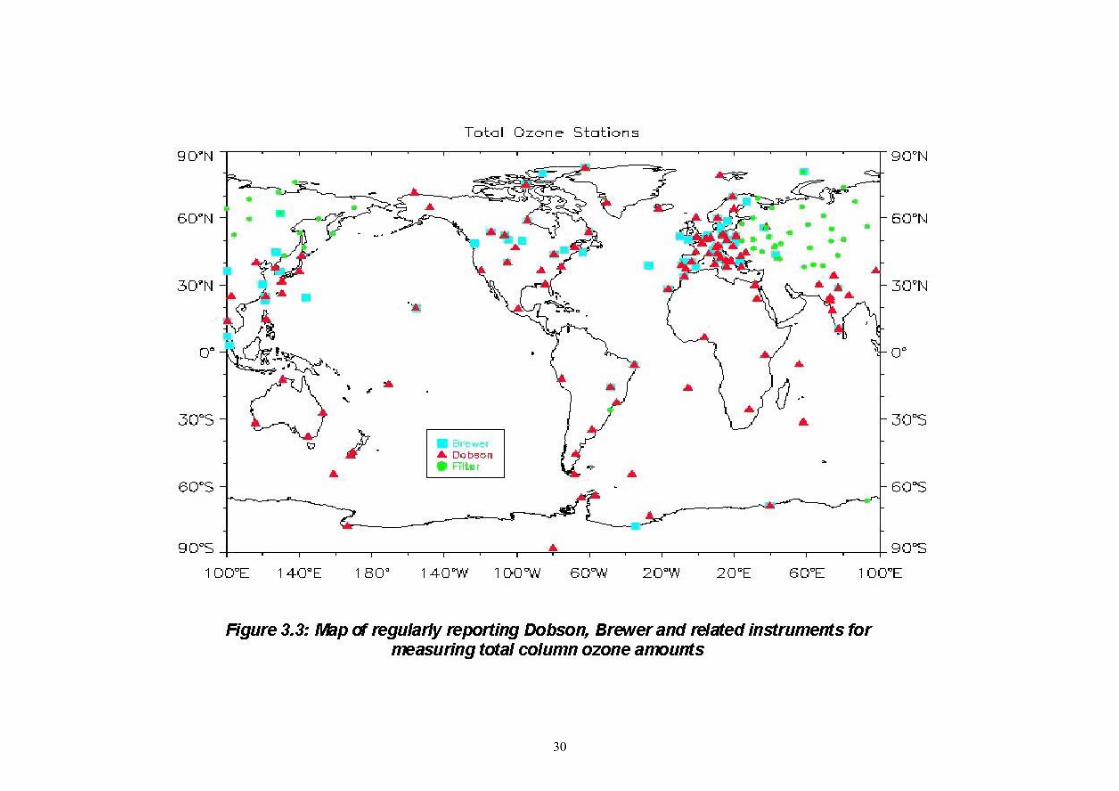
30

31
Filter Instruments have had a complex history due to problems with filter stability which limitsthe ability of such instruments to make accurate long term measurements. A network of 40 filterinstruments, mostly in the Russian Federation, report data. Recent advances in the ability to make morestable filters leaves open the possibility that such instruments may, ultimately, be able to make importantcontributions to long term records of ozone column amounts (also aerosols). A notable example of suchefforts is the Atmospheric Radiation Measurement (ARM) programme under the auspices of the USDepartment of Energy. Other filter instruments are also used extensively for the measurement ofsurface fluxes of ultraviolet radiation. Their long term stability remains to be proven, although preliminaryindications suggest that it is much improved over that of its predecessors. Unless these filters have afairly narrow spectral band pass (e.g.1-2 nm) there are additional complications associated with theiruse for ultraviolet trend measurements.
b) Profile Measurements
Dobson and Brewer instruments are both capable of exploiting the Umkehr technique toproduce vertical profiles of ozone in the stratosphere. These profiles have an altitude resolutionof 5 km or greater but suffer from the same geographical distribution constraints as the totalozone observations made with these instruments. Only a limited number of the Dobson locations(15) make profile observations and most of these are where the Dobson instrument has beenautomated. The Brewer is, by its very nature, an automated instrument so that its potential forprofile observations is much greater than is the case with the Dobson, but at present only alimited number of profiles are being reported.
Lidars are used to obtain profiles of atmospheric variables in both the stratosphere andtroposphere with one to two kilometer resolution. In the stratosphere they are used to measureprofiles of ozone and temperature at over 15 locations world wide. Most of these instruments areaffiliated with the NDSC as primary or complementary sites. The NDSC has carried out severalvalidation campaigns and concluded that these instruments produce valid data in the range of15-50 km for ozone and up to 80 km for temperature. In addition, a few tropospheric versions ofthese instruments are currently operating, mostly in a campaign mode, though nine arecommitted to long term operation as part of existing international networks including the NDSC.They are used primarily to measure tropospheric ozone profiles and, at some stations, watervapour profiles in the upper troposphere. Lidars also make important contributions to the longterm observation of stratospheric aerosols. An international lidar network has been developedwhich provides very extensive spatial coverage, although as with all ground-based instruments,measurements are restricted to land-covered areas. Observations from developing countries andremote territories are much fewer than from more populated, developed areas.
Microwave Radiometers are used to observe ozone profiles from the stratosphere up to themesosphere and are able to make measurements under most weather conditions. They arecurrently being operated at several NDSC sites. The validity of their ozone profiles has beenestablished through validation campaigns and by intercomparison with other profilemeasurements. As they observe in emission, these instruments can make measurements duringboth day and night (including the polar night). Microwave observations of diurnal variations and atthe South Pole have been particularly important as such instruments can also be used to makemeasurements of a range of trace constituents, the most important of which are H2O and ClO, aswell as long-lived molecules like N2O. The vertical resolution of these instruments is typically fairlybroad (5-10 kilometers) which places constraints on the usefulness of their data in regions ofstrong vertical gradients.
FTIR and UV/Visible Instruments can provide profile information on some gases although theirprimary use has been for determination of total column amounts. FTIR instruments make use ofthe pressure variation of the line width (and the temperature dependence of thermal emission)and have been shown to provide low vertical resolution information on species such as CO, CH4,HCl, HNO3, O3 and H2O,. UV/Visible instruments can make profile measurements at twilightwhen the Earth’s shadow line is scanning upwards in altitude. Such measurements have beenmade for NO2, OClO, and BrO.

32
c) Balloon-Based Measurements
For many years now balloon-borne instruments have been used to make the long term globalobservations of ozone required to monitor ozone trends (with the main focus in the past on thestratosphere). For this ozone sondes have been utilised and, at present, these sondes provide the bulkof the data on vertical profiles of ozone from near the surface to approximately 30 km. The observationsderived from ozone sondes are of a very high vertical resolution which is unattainable by any of theexisting (or near-term projected) satellite techniques.
Regular soundings are currently made at about 40 sites. Although these tend to be concentratedat middle and high latitudes in the northern hemisphere, several of the more recently established sitesare in the under-sampled tropical and subtropical regions. About half of the sites have records thatextend 10 years or longer and most stations are affiliated with the WMO/GAW network; some to theNDSC. A map of regularly reporting ozone sonde stations is shown in Figure 3.4. Information on theavailable data from the different sonde stations (e.g. length of record, frequency of flights) is included inTable 3.3. An effort has recently been made to increase the frequency of ozone sonde launches in thetropics and southern hemisphere subtropics through the Southern Hemisphere Additional Ozone sonde(NASA/SHADOZ) programme.
Long term information on stratospheric composition may be obtained through the judicious use ofthe results of long series of process-oriented balloon profiles (correcting for seasonal and geographicdifferences between flights). This has been achieved by relating concentrations of the more rapidlychanging species (like the CFCs) to those of more slowly changing ones (like nitrous oxide) which canhelp establish a reference co-ordinate system for the measurements. Measurement validation has beenthrough field intercomparison campaigns and most recently through the use of the simulation facility atthe Research Centre in Jülich, Germany (WMO-GAW world calibration facility for ozone sondes).
In addition, there are several programmes where ozone and other trace constituents aremeasured as part of a larger process-oriented balloon payload. These measurements are particularlyuseful as they are made with instruments capable of observing a complement of photochemical andtracer species in addition to ozone. Campaigns take place on a regular basis within the US andEuropean (notably the French and German but see Table 3.4) balloon programmes. They include largepayloads such as the Observations of the Middle Stratosphere (OMS) programme, as well as flights ofpayloads like the SAOZ, AMON and MIPAS instruments. The long duration Montgolfier balloon could bevery promising and is planned to be flown in the next few years. Balloon flights also provide an importantelement of satellite calibration and validation programmes (e.g., UARS, ADEOS, and for the SAGE IIIand ENVISAT campaigns).
d) Airborne Measurement Programmes
The only currently operational programmes in which atmospheric trace constituents are routinelymeasured on board aircraft are the European MOZAIC and CARIBIC programmes, in which in-situozone photometers, water vapour and NOy measuring instruments have been placed on French andGerman airliners. These fly international routes between Europe and Asia, North and South America,and Africa, with the heaviest concentration of flights over the North Atlantic. The sampling is primarily inthe upper troposphere but does include some stratospheric data. Profile information can be obtainedduring take off and landing. The MOZAIC programme dates back to 1993 and was preceded by theNASA/GASP in the seventies which may be viewed as the precursor to MOZAIC. In addition, aninstrument suite is currently under development in the US for the routine measurement of ozone, watervapour, carbon dioxide and tetrachloroethylene. The long term goal of this activity is operational use oncommercial aircraft, supplementing the MOZAIC and CARIBIC programmes.
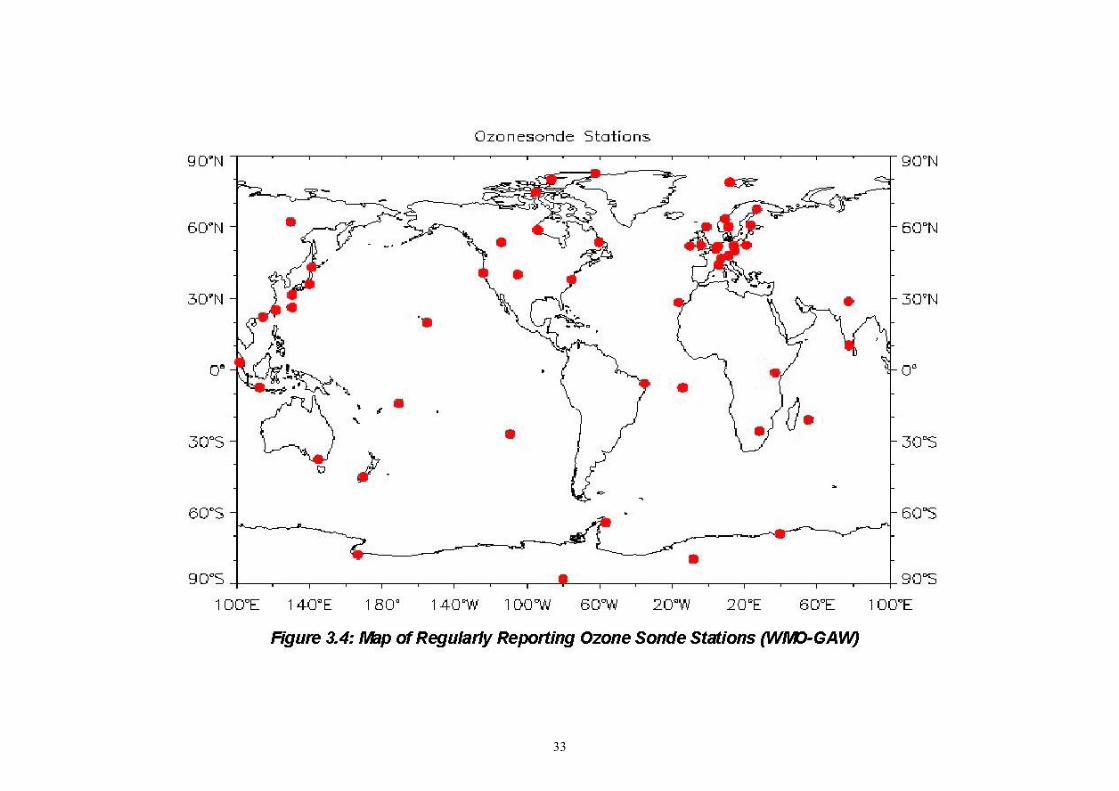
33

34
Table 3.3: The WMO-GAW data records of regularly reporting ozone sonde stations(note that some of these have operated only over limited time intervals and so their
data are not suitable for trend calculations)
STATION LOCATION COUNTRY LAT. LONG. START END SONDE TYPE
Alert Canada 82.5 -62.3 5-Jan-87 ECCEureka Canada 80.05 -86.42 1-Nov-82 ECCNy Alesund Norway 78.89 11.88 31-Oct-90 ECCResolute Canada 74.72 -94.98 1-May-78 ECC
5-Jan-66 30-Nov-79 BMSodankyla Finland 67.4 26.6 1-Jan-89 ECCYakutsk Russia 62.08 129.75 1-Jan-94 ECCChurchill Canada 58.75 -94.97 24-May-78 ECC
19-Oct-73 10-Sep-79 BMEdmonton Canada 53.55 -114.1 17-May-78 ECC
1-Oct-70 21-Aug-79 BMLegionowo Poland 52.4 20.87 17-Jan-79 BMLindenberg Germany 52.21 14.12 1-Mar-92 ECC
14-Sep-74 29-Feb-92 OSEde Bilt Netherlands 52.06 5.00 1-Jan-93 ECCUccle Belgium 50.8 4.35 1-Jan-97 ECC
9-Nov-66 31-Dec-97 BMPrague Czech Rep. 50.02 14.45 3-Jan-92 ECC
30-Jan-79 29-Mar-91 OSEHohenpeissenberg Germany 47.8 11.02 8-Mar-65 BMPayerne Switzerland 46.82 6.95 1-Nov-66 BMHaute Provence France 43.93 5.7 2-Sep-90 ECCSapporo Japan 43.05 141.33 5-Dec-68 JapanBoulder USA 40.03 -105.25 12-Mar-79 ECCWallops Island USA 37.93 -75.48 1-Jul-67 ECCTsukuba/Tateno Japan 36.05 140.1 6-Mar-68 JapanKagoshima Japan 31.55 130.55 12-May-68 JapanNew Delhi India 28.65 77.22 1-Nov-83 IndiaIzana (Tenerife) Spain 28.29 -16.49 1-Nov-68 ECCNaha Japan 26.2 130.55 12-May-68 JapanTaipei Rep. of China 25.03 121.53 1-Jan-92 ECCHong Kong China 22.2 114.3 4-Mar-93 ECCHilo USA 19.72 -155.07 25-Sep-82 ECCPetaling Jaya Malaysia 3.1 101.65 1-Jan-92 ECCKodaikanal India 10.23 77.47 19-Jul-71 IndiaNairobi Kenya -1.27 36.8 1-Jan-96 ECCNatal Brazil -5.84 -35.21 10-Aug-79 ECCWatukosek Indonesia -7.5 112.6 1-May-93 JapanAscension Island UK -7.58 -14.24 28-Jul-90 ECCSamoa USA -14.25 -170.56 1-Aug-86 ECCReunion Island France -21 55 1-Sep-92 ECCPretoria/Irene South Africa -25.73 28.18 1-Jul-90 ECCEaster Island Chile -27.1 -109.3 1-Jan-94 ECCMelbourne/Aspendale Australia -37.8 144.97 1-Jun-65 BMLauder New Zealand -45.03 169.68 1-Aug-86 ECCMarambio Antarctica -64.63 -56.72 24-Mar-66 ECCSyowa Antarctica -69 39.58 17-Mar-66 JapanMcMurdo\Aug-Oct Antarctica -77.83 166.67 1-Jan-88 ECCNeumeyer Antarctica -79.65 -8.25 22-Mar-92 ECCAmundsen-Scott Antarctica -90 N/A 1-Jan-86 ECC

35
Table 3.4: Some European balloon-borne experiments
INSTRUMENT COUNTRY TECHNIQUE OTHER SPECIES
Ozone sensors
AMON France stellar occult., UV-VIS spectrometer NO2, NO3, OClO, OBrO, aerosol extinctionBOCCAD France solar occult. and scattering, 4-l radiometer aerosols
DOAS Germany limb viewing, UV-VIS spectrometer NOx, NOy, BrO, OclO
LPMA France solar occult., FTIR spectrometer N2O, NO, NO2, HNO3, ClONO2, HCl, HF, H2O, CH4
MIPAS Germany emission, FTIR spectrometer N2O, NO, NO2, HNO3, N2O5, ClONO2, H2O, CH4
O3 Semi Conductor UK in-situ, solid state sensor
SALOMON France moon occult., UV-VIS spectrometer NO2, NO3, OClO, OBrO, aerosol extinction
SAOZ France sun occult., UV-VIS spectrometer NO2, aerosol extinction
SPIRALE France in-situ, IR laser diode absorption spectrometer NO, NO2, CO, CH4
Other sensors
ASTRID Germany in-situ, grab sampler N2O, CFC-11, CH4
BALLAD France limb viewing, VIS-NIR 3-l radiometer aerosols
BROCOLI Germany resonance fluorescence ClO, BrO
DESCARTES UK in-situ, cryogenic air sampler CFC-11, CFC-113
ELHYSA France in-situ, H2O
FISH Germany in-situ, Lyman-alpha hygrometer H2O
Filter Radiometer Germany in-situ, narrow-band UV radiometer photolysis rate of O3, NO2
Grab sampling Germany in-situ, air collection N2O, CFC-11, CFC-12, CFC-113
LMD-Aerosol France in-situ, particle counter aerosol number
Mass Spec Germany in-situ, mass spectrometer HNO3, H2SO4, HCl, HF
MACSIMS France in-situ, mass spectrometer HNO3, N2O5
RADIBAL,µRADIBAL
France solar scattering, NIR 2-l photopolarimeter aerosol model and extinction
SDLA-LAMA France in-situ, NIR laser diode absorption spectrometer H2O, CH4
Research aircraft can carry comprehensive payloads for the study of the chemistry of thetroposphere and stratosphere. Several aircraft/payload combinations exist and have been usedextensively to investigate the stratosphere and upper troposphere. These aircraft programmeshave made enormous contributions to the validation of satellite sensors and to our understandingof the chemistry of the stratosphere and upper troposphere, as well as of the relationship betweenchemical and transport processes. In some cases, the duration and spatial coverage of thesequence of missions is long enough to be relevant to studies of long term trend issues that arethe focus of this report. Some examples of airborne research campaigns are provided in Annex D.
3.3 Satellite Measurements
In this section, space-based systems capable of providing routine operational observationsof the required parameters (see Chapter 2) are discussed and a summary of their capabilitiespresented. The space-based measurement systems are organised into two groups, namely thosethat are designed primarily for long term continuous operations and those that are planned as“one-time” experimental missions. Generally, the lifetimes of the latter are too short for their datato be relevant to the long term data requirements considered in this report. However, these groupsare to a certain extent complementary and not necessarily exclusive, as some research-orientedsatellites may operate for a sufficiently long time (e.g. UARS now has more than eight years ofoperation) that relatively long term studies can be carried out with their data.

36
Within the class of measurements designed for long term operation, presently-operatingand future measuring systems are treated separately. Time lines for space-based measurementprogrammes contributing to the study of ozone are shown in Figure 3.5, while Table 3.5 shows themeasurement objectives of the different space-based measurement programmes. In addition to theinstruments and missions listed below, there are many others that provide information of relevance(e.g. insights into relevant processes) to the Ozone Project. These are listed in Annex E.
3.3.1 Currently Operating Operational Systems
In this section five currently operating measurement systems, designed for the long termmeasurement of stratospheric ozone and related parameters, are considered. Additional long termmeasurement systems not yet in operation but planned are treated in Section 3.3.2, while relevantresearch satellite systems (both present and future) are considered in Section 3.3.3.
a) The Stratosphere Aerosol and Gas Experiment (SAGE II) series of instrumentsobserve the absorption of visible and near-infrared radiation during solar occultation todetermine the concentrations of ozone, water vapour, nitrogen dioxide, and aerosolextinction in the stratosphere and, for some parameters, in the upper (cloud free)troposphere. This technique is self-calibrating and can provide excellent accuracy/precisionand vertical resolution (~1 km), although it has the usual spatial limitations associated withthe solar occultation technique (i.e. two latitudes of observation per orbit corresponding tolocal sunrise and local sunset).
The currently operating SAGE II instrument was launched in October 1984 onboardthe Earth Radiation Budget Satellite (ERBS). The previous SAGE instrument (which couldnot be used to observe water vapour) operated from 1979-1981. In both instances thesatellites flew in inclined (~57 degree) orbits so their observations cover much of theEarth’s surface (subject to the usual spatial sampling problems).
A related instrument, the Stratospheric Aerosol Monitor (SAM II) made observationsof PSCs from the Nimbus 7 satellite (1979-1994) using a single near-infrared wavelength.This satellite flew in a polar-orbiting, sun-synchronous orbit so all the occultations were athigh latitudes, which facilitated its for PSC studies.
b) The Total Ozone Mapping Spectrometer (TOMS) series of instruments makesmeasurements of the total column amount of ozone using six ultraviolet wavelengths andthe backscatter ultraviolet (BUV) technique. By exploiting cross-track scanning, the TOMSinstruments typically obtain full daily coverage of the sunlit Earth. The horizontal resolutionis typically 50x50 km2 at nadir. Four TOMS instruments have flown - Nimbus 7 TOMS(1979-1993), Meteor-3 TOMS (1991-1994), Earth Probe TOMS (1996 - present) andADEOS TOMS (1996-1997). An additional TOMS instrument is planned for 2000 on boardthe QuikTOMS spacecraft.
With the exception of Meteor-3 TOMS, all the TOMS instruments have flown onboard polar-orbiting, sun-synchronous satellites. Provided the equator crossing times areclose to noon, solar zenith angles will be low and the orbit will be well tuned to therequirements of TOMS as atmospheric path lengths will be short. In addition to itsmeasurements of total ozone, it has been shown that TOMS can provide information abouttropospheric aerosols, stratospheric sulphur dioxide (when levels are high due to largevolcanic eruptions), the surface flux of ultraviolet radiation, the ultraviolet reflectivity of theatmosphere (including the ground and clouds), and (this requires other data and dependson various assumptions) tropospheric ozone, especially at low latitudes.

37
Table 3.5 (a): Measurement objectives of the different space-based system (note that limb and occultationinstruments measure predominantly stratospheric column not TOTAL column)
Instrument Platform OzoneColumn
OzoneProfile
AerosolColumn
AerosolProfile
Constit.Column
Constit.Profile
Temp.Profile
Winds Irrad. SurfaceUV
TOMS Earth Probe X X SO2
OMI EOS-Aura X X X SO2, BrO, NO2,CH2O
UV/Vis X
OMPS NPOESS X X X SO2, BrO, CH2O,OclO
UV/Vis/NIR
X
SBUV Nimbus 7 X X SO2,NO (p< 1 mb)
UV
SBUV/2 NOAA-11,14, (POES)
X X SO2,NO (p< 1 mb)
UV
SSBUV Shuttle X X SO2,NO (p< 1 mb)
UV
GOME ERS-2 X X X SO2, BrO, NO2,CH2O, OClO,
H2O
UV/Vis X
SCIAMACHY ENVISAT X X X SO2, BrO, NO2,CH2O, CO, CH4,OclO, H2O, N2O
UV/Vis/NIR
X
GOME-2 METOP X X X SO2, BrO, NO2,CH2O, OClO,
H2O
UV/Vis X
SAGE I AEM-2 X X X X NO2 NO2
SAGE II ERBS X X X X NO2, H2O NO2, H2OSAGE III METEOR,
ISS & TBD1X X X X NO2, H2O, NO3,
OclONO2, H2O, NO3,
OclOX
UVISI MSX X X O3, NO2 O3, NO2
ACE SCISAT-1 X X X X About 30species
About 30species
X
SMILES ISS X X ClO, H2O, H2O2,HCl, HNO3, BrO,
ClO, H2O, H2O2,HCl, HNO3, BrO,
X
IMG ADEOS X X H2O, CH4, CO H2O, CH4, CO X X
(Note 1): TBD - to be determined)

38
Table 3.5 (b): Measurement objectives of the different space-based systems (note that limb and occultation instrumentsmeasure predominantly stratospheric column not TOTAL column)
Instrument Platform OzoneColumn
OzoneProfile
AerosolColumn
AerosolProfile
Constit.Column
Constit.Profile
Temp.Profile
Winds Irrad. SurfaceUV
ODUS GCOM-A1 X X SO2, BrO, NO2, CH2O,OClO
UV/Vis X
SOFIS GCOM-1 X X X X NO2, CH4, CFCl3,CF2Cl2, HNO3, ClONO2,
CO2
NO2, CH4, CFCl3,CF2Cl2, HNO3, ClONO2,
CO2
POAM II SPOT-3 X X X X NO2 NO2 XPOAM III SPOT-4 X X X X NO2, H2O NO2, H2O X
LIMS Nimbus 7 X X NO2, H2O, HNO3 NO2, H2O, HNO3
SAMS Nimbus 7 CH4, N2O CH4, N2OX
SOLSE/LORE Shuttle X XATMOS Shuttle X X Close to 30 species Close to 30 species xMAS Shuttle X X ClO, H2O ClO, H2O XCRISTA Shuttle/SPAS X More than 20 species More than 20 species xMAHRSI Shuttle/SPAS OH, NO OH, NO
CLAES UARS X X X X More than 10 species More than 10 species XISAMS UARS X X X X H2O, CH4, NO, NO2,
N2O, N2O5,HNO3, COH2O, CH4, NO, NO2,
N2O, N2O5,HNO3, COX
HALOE UARS X X X X H2O, CH4, NO, NO2,HCl, HF
H2O, CH4, NO, NO2,HCl, HF
X
MLS UARS X X ClO, H2O, HNO3 ClO, H2O, HNO3 XHRDI UARS XSOLSTICE UARS UVSUSIM UARS UV
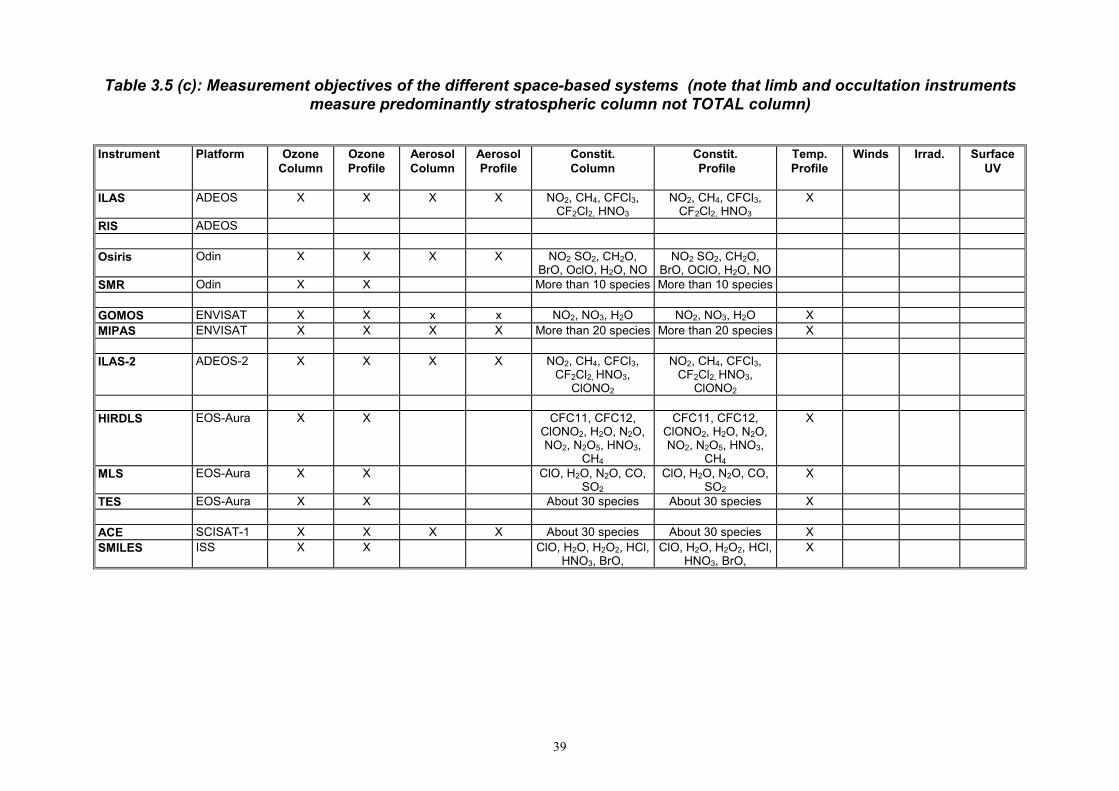
39
Table 3.5 (c): Measurement objectives of the different space-based systems (note that limb and occultation instrumentsmeasure predominantly stratospheric column not TOTAL column)
Instrument Platform OzoneColumn
OzoneProfile
AerosolColumn
AerosolProfile
Constit.Column
Constit. Profile
Temp.Profile
Winds Irrad. SurfaceUV
ILAS ADEOS X X X X NO2, CH4, CFCl3,CF2Cl2, HNO3
NO2, CH4, CFCl3,CF2Cl2, HNO3
X
RIS ADEOS
Osiris Odin X X X X NO2 SO2, CH2O,BrO, OclO, H2O, NO
NO2 SO2, CH2O,BrO, OClO, H2O, NO
SMR Odin X X More than 10 species More than 10 species
GOMOS ENVISAT X X x x NO2, NO3, H2O NO2, NO3, H2O XMIPAS ENVISAT X X X X More than 20 species More than 20 species X
ILAS-2 ADEOS-2 X X X X NO2, CH4, CFCl3,CF2Cl2, HNO3,
ClONO2
NO2, CH4, CFCl3,CF2Cl2, HNO3,
ClONO2
HIRDLS EOS-Aura X X CFC11, CFC12,ClONO2, H2O, N2O,NO2, N2O5, HNO3,
CH4
CFC11, CFC12,ClONO2, H2O, N2O,NO2, N2O5, HNO3,
CH4
X
MLS EOS-Aura X X ClO, H2O, N2O, CO,SO2
ClO, H2O, N2O, CO,SO2
X
TES EOS-Aura X X About 30 species About 30 species X
ACE SCISAT-1 X X X X About 30 species About 30 species XSMILES ISS X X ClO, H2O, H2O2, HCl,
HNO3, BrO,ClO, H2O, H2O2, HCl,
HNO3, BrO,X

40

41
c) The Solar Backscatter Ultraviolet (SBUV) series of instruments measures both totalozone amounts and the vertical distributions of ozone using the backscatter ultraviolet(BUV) technique. The SBUV instrument also measures spectrally-resolved solar irradiancefrom 180 to 405 nm with 1 nm resolution. Instruments in this series have included theoriginal SBUV instrument which flew on-board the Nimbus 7 satellite and the SBUV/2instruments which have flown aboard several meteorological satellites (afternoon equatorialcrossing time) operated by the US National Oceanic and Atmospheric Administration(NOAA), including NOAA-9, NOAA-11, and NOAA-14.
Unlike TOMS, the SBUV instruments are not capable of cross-track scanning, asthey only view in nadir. Vertical profiling is 7 km in the middle and upper stratosphere, withlittle sensitivity in the lower stratosphere. The equatorial crossing time of the NOAA POESspacecraft have drifted which may limit the usefulness of some of these data for highaccuracy trend studies (though this has been taken into account in characterising the dataand the algorithm; future POES platforms will have stable orbits beginning in 2000). LikeTOMS, SBUV can provide some information on sulphur dioxide levels when these areelevated following volcanic eruption. When operated in a spectral scanning mode it canalso provide information on the column amounts of nitric oxide in the mesosphere andthermosphere.
Help in calibrating the SBUV instruments during the 1989-1996 period was providedby observations made by a Shuttle-borne version of the instrument (SSBUV), which madeeight flights over this time period. The SSBUV flights provided a first order correction to thelong term observations of the SBUV/2 series. The SSBUV observations were particularlyimportant for calibrating the SBUV/2 solar irradiance measurements which correlated wellwith the UARS solar irradiance instruments.
d) The Global Ozone Monitoring Experiment (GOME) instrument was launched onboard the European Space Agency’s Earth Remote Sensing satellite (ERS-2) in 1995.GOME uses a nadir-viewing geometry to measure total column amounts and verticalprofiles of ozone and total column amounts of a wide range of trace constituents, includingBrO, NO2, H2O, SO2, CH2O, and OClO (in the polar vortex), as well as providinginformation on clouds, aerosols and surface spectral reflectance (see Table 3.5). The ERS-2 spacecraft flies in a polar sun-synchronous orbit which is well suited for suchmeasurements.
The instrument has a broad spectral coverage (240 - 790 nm) which is coupled withan excellent spectral resolution (0.2-0.4 nm). This enables it to exploit a combination ofspectroscopic fitting and the backscatter ultraviolet (BUV) technique. Its horizontalresolution can vary between 40x80 km2 and 40x320 km2; on most days it operates at thelatter spatial resolution.
The resolution of GOME ozone vertical profiles is 7-10 km and, because of its multi-spectral capability, profile information can be derived in both the lower stratosphere and theupper troposphere unlike BUV measurements. Like SBUV it has been calibrated againstthe SSBUV as well as against other instruments (see Chapter 5, Calibration andValidation). The GOME has a multi-faceted calibration programme including views of theSun and the Moon as well as an internal lamp.
e) The Tiros-N Operational Vertical Sounder (TOVS) series of instruments flying aboardNOAA’s operational meteorological satellites were designed primarily as a source ofmeteorological data (notably temperature and moisture). However, in addition, they doprovide information on total column ozone amounts (see also SEVIRI). This measurementis made using the 9.6 µm channel of the High Resolution Infrared Sounder (HIRS) whichforms part of the TOVS and which was originally included to remove ozone effects from thetemperature sounding channels.

42
There is some uncertainty as to what the 9.6 µm channel actually senses in the uppertroposphere and lower stratosphere though it is probably best characterised as an observation oflower stratospheric ozone. TOVS is quite insensitive to middle- and upper-stratospheric ozone.However, it does provide data during the polar night which is not possible with either TOMS orGOME because they require the presence of solar radiation to make measurements; TOVSexploits emission and can therefore work in darkness.
3.3.2 Currently Planned Operational Satellite Systems
This section considers satellite programmes planned for the near future which are intendedto help satisfy requirements for the operational provision of these data on a long term basis. It alsooutlines some variants of current experimental instruments which may find operational application.
Additional SBUV instruments are planned for future NOAA polar orbiting meteorologicalsatellites with afternoon equatorial crossing times; currently scheduled launch dates are shown inFigure 3.5. Utimately, these instruments will be replaced by GOME-2, OMI, and OMPS which havesuperior performance.
Table 3.5 provides details of the species observed by each of the operational systemsdescribed below together with an indication of their performances. Again, in referring to this table,it is important to remember that system performance is very dependent on orbit characteristics.
a) The Stratosphere Aerosol and Gas Experiment (SAGE III) is an improved version ofthe SAGE instrument, with higher spectral resolution and greater spectral wavelengthcoverage. It will also have a lunar occultation capability which will allow observations to bemade over a broader range of latitudes than are available from solar occultation alone(especially in sun-synchronous orbits where solar occultations are confined to highlatitudes). Its lunar occultation capability should enable it to make measurements of NO3
and OClO which are present almost exclusively at night because of their rapid daytimephotolysis (temperatures will not be available in this mode of operation).
As compared with previous SAGE instruments, this version has an ultravioletchannel (290 nm), which can be used for the improved detection of ozone in the upperatmosphere, and an additional near-infrared channel (1.5 µm) that can provide informationon the distribution of aerosol in the cloud-free troposphere. Temperature information is alsoincluded through the observation of the molecular oxygen A band (near 762 nm); thesemeasurements will facilitate the conversion of measurements to the desired mixing ratioversus pressure co-ordinate system (rather than the observed number density versusaltitude one).
In order to provide a better geographic coverage (given the inherent coveragelimitation of solar occultation), the goal is to have one SAGE instrument flying in an inclinedorbit and another in a sun-synchronous polar orbit. Currently planned flights are aboard aRussian Meteor-3M (polar sun-synchronous orbit) in mid-2000 and the International SpaceStation (51.5 degree inclination orbit) in early 2001. A third SAGE III instrument is currentlyunder construction for use aboard a platform still to be decided.
b) The Global Ozone Monitoring Experiment (GOME-2) is similar to GOME with slightlybetter accuracy and better spatial resolution, but the same vertical resolution. Theimprovements mainly relate to improvement in performance (i.e. accuracy) rather than thenumber of atmospheric variables observed. Like GOME, the GOME-2 instruments will beultraviolet/visible, nadir-viewing instruments exploiting a combination of the SBUV andspectroscopic fitting techniques to observe a range of atmospheric variables, far wider thanany of the other instruments described above (see Table 3.3).
The GOME-2 instruments will be flown on the METOP series of meteorologicalsatellites which have a total planned life time of fifteen years. They will fly in the “morning”polar orbit, METOP being the European operational replacement for the current series of
43
NOAA operational meteorological satellites. This is a joint ESA/EUMETSAT programmewith the launches planned for 2003, 2007, and 2010.
c) The Infrared Atmospheric Sounding Interferometer (IASI) is also part of the corepayload of EUMETSAT Polar System (EPS) METOP-1 and will contribute to the primarymission objective of EPS which is the assessment of meteorological parameters. TheAMSU-A and MHS microwave sounding systems, the HIRS/3 infrared sounder and theAVHRR/3 imager are all companion instruments of the meteorological payload. It willoperate from a low altitude, sun-synchronous polar orbit, over a 2000 km wide swath.
The main focus of IASI is the provision of temperature profiles with improvedaccuracy and vertical resolution compared with the currently existing infrared temperaturesounder HIRS on the NOAA polar satellites. To achieve this goal a high spectral resolutionis required, and a novel instrument was designed based on a Michelson interferometer. Itwill cover the spectral range from 645 to 2760 cm-1 with a spectral resolution (unapodised)between 0.25 and 0.5 cm-1.
Among the parameters that will be measured with IASI, either in a stand-alone or ina synergistic mode with other EPS instruments, are, in addition to temperature profiles,water vapour profiles, surface characteristics (i.e. temperature, emissivity), cloudparameters (top pressure and temperature, effective amount) and column integrated andvertical information on some minor constituents (O3, CO, CH4, N2O, SO2).
d) The Ozone Mapping and Profiling Suite (OMPS) is a two-instrument combinationbeing planned for the US National Polar Orbiting Environmental Satellite System(NPOESS) series of polar orbiting spacecraft. The OMPS instrument is still under definitionthough provisional instrument specifications have been listed. These envisage the OMPSinstrument providing full daily global mapping of total column ozone amounts with ahorizontal resolution of 50x50 km at nadir (or better), and vertical profiling (no mapping)with a vertical resolution of at least 5 km; with an objective of 3 km vertical resolution.
The vertical profiling resolution requirement rules out a nadir-viewing instrument;therefore the OMPS instrument will include both a nadir-viewing total ozone instrument(using a push broom technique) and a limb-viewing vertical profile instrument using thelimb scattering technique in the ultraviolet, the visible and the near-infrared.
The first NPOESS spacecraft with the OMPS instrument is not expected to flybefore 2009, although the actual launch date could vary in the range 2007-2010 dependingon the operational conditions of the remaining NOAA polar orbiting spacecraft (such asNOAA-N). It is currently expected that NPOESS will continue the spectrally resolved andtotal solar irradiance measurements using the instrument currently operating aboard UARSand planned for the SORCE mission (see Annex E).
e) The Stationary Visible/Infrared Imager (SVIRI) will fly on the Second GenerationMeteosat (MSG) series of satellites; the first is due for launch in 2001 and they haveplanned lifetimes of 15 years. These will be operational meteorological satellites flying ingeostationary orbit above the Greenwich meridian. They will replace the current series ofMeteosat satellites.
SVIRI will represent a significant advance on the current Meteosat imager, having 5channels in the visible and 5 in the infrared. One of the latter (at 9.7 µm) is intended to beused to observe the distribution of ozone though not to the accuracy attainable with GOMEor SAGE. It will have a horizontal resolution of about 3 km.

44
3.3.3 Current and Projected Research Satellite Systems
This section outlines four major research missions of sufficient duration to provide longterm data sets relevant to the Ozone Project. In addition to the actual provision of data,experimental satellite missions also point the way to the future by providing a test bed for newoperational instruments.
a) The Upper Atmosphere Research Satellite (UARS) was launched in September, 1991to study the chemistry and dynamics of the Earth’s stratosphere and mesosphere, as wellas solar radiation and particle forcing of the Earth-atmosphere system. UARS has a total of10 instruments, all but two of which are still working. UARS instruments may be brokendown into several categories - atmospheric chemistry (Halogen Occultation Experiment -HALOE, Microwave Limb Sounder - MLS, Cryogenic Limb Array Etalon Spectrometer -CLAES, Improved Stratospheric and Mesospheric Sounder - ISAMS), atmosphericdynamics (High Resolution Doppler Interferometer - HRDI, Wind Imaging Interferometer -WINDII), solar irradiance (Solar-Stellar Irradiance Comparison Experiment - SOLSTICE,Solar Ultraviolet Spectral Irradiance Monitor - SUSIM, Active Cavity Radiometer IrradianceMonitor - ACRIM), and particle input (Particle Environment Monitor - PEM). All except twoof these (CLAES, ISAMS) continue to operate after more than eight years. UARS providescontinuous coverage equatorward of 340 but only views higher latitudes half the time(viewing northward or southward in approximately 36 day increments).
The present focus of UARS is to document long term changes in the upperatmosphere together with solar and particle forcings. In particular, the continuingmeasurement of the vertical profile of ozone, key source and reservoir gases, andtemperatures, as well as the UV solar spectral irradiance have provided valuable data setsfor the study of both long term trends and interannual variability in the stratosphere.
b) The ENVISAT mission will fly in 2001 and includes three instruments focused onatmospheric chemistry. These are the Scanning Imaging Absorption Spectrometer forAtmospheric Cartography (SCIAMACHY), the Michelson Interferometer for PassiveAtmospheric Sounding (MIPAS), and the Global Ozone Monitoring by Occultation of Stars(GOMOS) instruments. SCIAMACHY is a multi-wavelength (240-1750 nm, 1.9-2.4 µm),multi-viewing geometry (limb/nadir/occultation) instrument designed to measure the columnand profile distribution of a number of gases, including high horizontal resolutionmeasurements of ozone.
MIPAS, a high spectral resolution limb sounder, operating in the wavelength rangefrom 4.15-14.6 µm, will provide measurements of vertical profiles of more than 20 species(especially nitrogen-containing species), as well as pressure/temperature, aerosols, andPSCs. GOMOS will use the stellar occultation technique to measure ozone profiles and thepossibility to retrieve NO2, NO3, H2O, and aerosol extinction profiles. Since there are verymany stars to use as light sources, the stellar occultation technique has the potential toprovide much more complete spatial coverage than is available from solar occultations, someasurements at nearly all latitudes are possible even though ENVISAT will be in a polarsun-synchronous orbit. An operational version of this instrument is under consideration (i.e.COALA).
ENVISAT will fly in a high inclination, sun-synchronous orbit at an altitude of 800km. The local mean solar time in the descending node will be 10:00 hrs. The plannedmission duration is five years. Both MIPAS and SCIAMACHY will provide global coverage;the coverage of GOMOS will depend on the distribution of occultation targets.
c) The EOS-Aura mission which is planned for launch in mid 2003 will have fourinstruments dedicated to the study of atmospheric chemistry. These include theTropospheric Emission Spectrometer (TES), the Microwave Limb Sounder (MLS), and theHigh Resolution Dynamics Limb Sounder (HIRDLS), and an ultraviolet mappingspectrometer for study of total column and profiles of ozone known as the Ozone
45
Monitoring Instrument (OMI). TES is a high spectral resolution instrument designed toobserve both tropospheric ozone and its precursor nitrogen dioxide. It will have both a nadirand a limb mode, and will also provide information on a number of constituents in the lowerto middle stratosphere.
MLS is a significantly enhanced version of the UARS MLS instrument and willmeasure a number of constituents in the stratosphere and upper troposphere, includingOH. By virtue of measuring the distribution of OH, ClO, BrO, and several nitrogen oxides,MLS will provide the first global information on catalytic ozone destruction by all importantchemical families in the stratosphere.
HIRDLS is an infrared emission instrument designed to measure stratospheric traceconstituent and temperature distributions at high horizontal and vertical resolution, andshould provide information on small-scale variability in the atmosphere for use in transportstudies. A primary focus of HIRDLS is the study of long-lived trace gases that most clearlyreflect atmospheric transport processes, although HIRDLS will also measure severalchemical reservoir species as well.
The OMI is a hyperspectral nadir viewing instrument with daily global coverage andspatial resolution of 13x24 km for total ozone column. Additional parameters, such as thosemeasured by GOME (see Section 3.3.1) will also be measured by OMI but at somewhatreduced spatial resolution over that which it achieves for total ozone.
EOS-Aura will fly in a 750km orbit with a 1:45 PM equatorial crossing time. SinceTES, MLS, and HIRDLS are emission instruments, coverage of the entire Earth will beprovided by these instruments. OMI, which uses a scattering technique, only obtains dataover sunlit areas so no coverage of polar night is provided. The instruments and spacecraftare designed for five years.
d) The GCOM-A1 programme of Japan will consist of two instruments for atmosphericchemistry flying aboard a satellite in an inclined non sun-synchronous orbit planned forlaunch in 2006. The first of these instruments is the Ozone Dynamics UltravioletSpectrometer (ODUS), a grating spectrometer covering the wavelength range from 306 to420 nm with 0.5 nm spectral resolution and ground resolution of 20x20 km at nadir. It isdesigned to measure the column amounts of ozone, aerosol, SO2, NO2, BrO, and OClO(similar to GOME and OMI). The second instrument is a follow-on to the second ImprovedLimb Atmospheric Spectrometer (ILAS-II) planned to fly aboard ADEOS-II in 2001. Thisfollow on instrument will improve on the ozone, aerosol, and trace constituent profiles madeby its predecessors. It is planned to complement the GCOM-A1 payload with a thirdinstrument. The GCOM-A1 spacecraft is planned for operation until 2010.In addition to these three major missions there are several other missions that can provide
information of relevance to the Ozone Project. These missions are more concerned with processstudies than monitoring. They are listed in Annex E.
3.3.4 Observations from Non-Low Earth Orbits
Finally it is relevant to highlight the role of space-borne instruments making observationsfrom satellites flying on non-low Earth orbits as, in particular, they offer the opportunity toincrease temporal coverage. This is important as there are large diurnal variations in theemission of pollutants which are associated with the photochemical production of ozone in theplanetary boundary layer and free troposphere. The levels of ozone produced are high.
The production of tropospheric ozone and photochemical smog typically peaks in the mid-to-late afternoon. NO2 emissions follow traffic and energy use patterns. The time scale of theoxidation of SO2 yielding H2SO4 which acts as condensation nuclei for aerosol and cloudformation, is similarly short. Biogenic emissions also have complex emission patterns increasingwhen the temperature rises but also being strongly dependent on levels of humidity. Bothdetermine the rate of opening of stomata. Comprehensive measurements of air quality on urban,

46
regional, continental, and global scales impose stringent requirements on space-borneobservations with a focus on the upper troposphere.
High temporal and spatial resolutions are required to determine accurately the emissionrates of pollutants from industrial pollution, biomass burning and biogenic emissions to theatmosphere. These measurements are also necessary to assess the impact of anthropogenicactivity on air quality and for meteorological applications. Excluding latitudes above about 70°,remote sensing instrumentation on sun-synchronous low Earth orbits (LEO) can only observe thesame location at the same local time at best once a day. This may be contrasted withinstruments mounted on geostationary platforms which can observe continuously approximatelyone third of the globe, from about 650 N to 650 S. A further observing location is the so-called L1orbit, which enables the whole Earth to be observed about once a day.
In order to obtain global coverage having the required spatial and temporal resolution afleet of LEO satellite-borne instruments (approximately 14) is needed. The same data set can begenerated by instruments aboard three geostationary platforms, separated by 120° in longitude.In theory one instrument in a L1 orbit can also provide the same information. On the downside itis important to remember that the geostationary orbit is approximately 40 times further from theEarth than the LEO and the L1 orbit is further away still. Thus a passive remote sensinginstrument in L1 requires a relatively large telescope and launcher. The TRIANA mission nowplanned for 2002 launch will be the first Earth science mission to test this vantage point.
Instruments in geostationary orbit are attractive for the transcontinental monitoring ofpollution and biomass burning. Observations of quite high spatial resolution are possible from thisorbit if the ability to “stare” continuously at a particular location is used to increase signal-to-noiseratios. A combination of three geostationary platforms, as has been employed for meteorologicalobservations, would provide the requisite global coverage. This geostationary perspective hasnot yet been exploited to monitor air quality though several missions are now under study toevaluate this unique vantage point. These are described in Annex E.
Currently there is an experimental TOZ total ozone column product available from theNOAA GOES platform which is similar to the TOVS product. It is only obtained in non-cloudyfields-of-view but it is produced many times a day.

47
4. HARMONISATION OF PROVISIONS AND REQUIREMENTS
4.1 Introduction
In this chapter the user requirements (see Chapter 2) are compared with current dataprovisions (see Chapter 3). This assessment takes account, not only of the provision andcapabilities of space-borne instruments but also those of the other elements of the observingnetwork i.e. ground-based and airborne. Chapter 6 highlights the main conclusions andrecommendations that emerge from this exercise.
The provision of the large number of measurement systems described in Chapter 3 goes along way towards helping to satisfy the requirements outlined in Chapter 2. However, in addition toaddressing individual requirements, there is a critical overarching requirement that the OzoneProject must satisfy, namely the need for:
• accurate long term calibration.• continuity of data provision with overlap in case of instrument change;
The first requires regular calibration (traceable to international standards) and validation of
derived geophysical parameters over the lifetime of a sensor or observing system. It is essential toavoid gaps in data streams, inconsistent calibration between instruments and long term drifts ininstrument performance. It is also important to ensure the proper harmonisation of ground andspace-based systems. The quality of ground-based observations and their spatial representivitymust be documented. The second requirement represents a particularly challenging issue for space-basedsystems as it may prove prohibitively expensive to try to ensure the provision of systemssufficiently robust to safeguard continuity in case of failures (including launch, spacecraft andinstrument failures) for anything beyond a very limited set of parameters. Some prioritisation of theneed for continuity of observation of different parameters must be established. There are two different measurement protocols covering the required parameters,summarised as:
monitoring – long term continuous measurement by a series of closely related and regularlyintercalibrated instruments; regular observation - continuity of measurement is desired but there is a much greatertolerance for gaps in data records.
Thus, species such as the chlorofluorcarbons with very small spatial and temporal variationmay only require periodic observation from space for long term characterisation, while a trace gassuch as ozone must be continually monitored. The other point that must be highlighted is the need to view all the various components ofthe observing system. Thus, in the sections that follow, in addition to considering each system inits own right, the composite picture is assessed in the light of the requirements detailed in Chapter2. The question of the calibration and validation of space-borne instruments is addressed inChapter 5 Calibration and Validation.
4.2 Total Column Ozone
4.2.1 Ground-Based Measurements
The current ground-based measurement programme for total ozone column amounts isadequate for providing long term, well calibrated measurements of column amounts for monitoring stratospheric trends. However, there are difficulties in ensuring continued support for the operationof some of the existing stations as in several instances only minimal funding is available. Unless
48
this is corrected it will ultimately compromise the quality of the data, especially if resourcesbecome inadequate to support participation in calibration-related activities.
The elements of the current network are deployed in areas where support from nationalagencies is available, that are logistically convenient for operation and, as a result, are not welldistributed geographically. In particular, there is a lack of sites in the tropics and SouthernHemisphere. The provision of funding for establishing networks in the tropics and SouthernHemisphere is a challenge for the international community which must be resolved in the very nearfuture.
4.2.2 Space-Based Measurements
Space-based measurements of total and profile ozone amounts form one of the mostimportant IGOS data sets although they mainly reflect changes in stratospheric ozone. No singleobserving technique fully meets user requirements so it is necessary to exploit the capabilities ofcomplementary observing systems.
For example, there is excellent complementarity between the TOMS technique which usesa limited set of wavelengths but provides data with excellent spatial resolution, and the GOMEapproach which can observe a much larger set of wavelengths but at reduced spatial resolution.Because of their enhanced spectral coverage, the GOME-type instruments have the potential tomake more accurate observations than TOMS.
The plans currently in place by the space agencies go a long way towards meeting therequirements listed earlier. Two major polar orbiting programmes are already in place:
• The US programme of TOMS (one flying now, one planned for launch in 2000), the
Dutch OMI instrument on EOS-Aura in 2003 and the OMPS instrument planned forNPOESS (beginning in 2007-2010).
• The European programme of GOME (currently flying on ERS-2), SCIAMACHY(planned for 2001 on ENVISAT) and GOME-2 and IASI (planned for 2005 and beyondon the METOP series of operational satellites).
In addition, there is NOAA/SBUV/2 which is a major operational programme currently inplace. METOP and NPOESS will be fully operational programmes (after the launch of METOP-2there should always be a "hot" spare available in orbit) and ENVISAT will supply productsoperationally. The provision of operational products from EOS-Aura is being considered.
A gap in the US series could occur prior to 2010 if the NPOESS OMPS instrument does notfly prior to the end of the expected period of operation of the OMI instrument on EOS-Aura (late2007 assuming a late 2002 launch). In such a case, the global observing system would depend onthe instruments flown on the METOP/GOME-2 and the POES/SBUV/2 which do not provide thespatial coverage to meet all requirements (Chapter 2).
If the first NPOESS/OMPS launch does not occur till the end of its potential launch windowan alternative strategy must be considered. One possibility would be an early flight of the OMPSinstrument. The Japanese GCOM-A1/ODUS which is planned for 2006 to 2010 would be a goodcandidate to fill this gap. However, the GCOM-A1 orbit is not sun-synchronous and thereforecannot meet the spatial requirement.
From geostationary orbit only Meteosat Second Generation (MSG) includes an ozonemonitor (from 2001). This will be based on an infrared emission nadir-viewing technique and hasquite a lot in common with TOVS. These data are not strictly compatible with those fromultraviolet-based nadir-viewing systems so intercomparisons will be essential. The inclusion ofsimilar (or ultraviolet) instruments on some of the other geostationary satellites would be a verygood idea as a combination of polar orbiting and geostationary systems is required to ensure theproper combination of geographic and temporal coverage.

49
Overall the situation is quite encouraging provided NPOESS OMPS is not delayed.Exploitation of geostationary missions will provide a unique opportunity to strengthen temporalcoverage.
4.3 Ozone Vertical Profile
4.3.1 Ground-Based Measurements
In the stratosphere the ground-based measurements of vertical profiles of ozone which areof most relevance to the Ozone Project are the lidar and Umkehr observations (based on theDobson and Brewer instruments), though currently only a limited number of Dobson instrumentsare being used for Umkehr observations. A first priority must be to ensure the continuation ofUmkehr observations from those stations with long data records. However, the initiation of newUmkehr observations is also necessary as geographic coverage is currently limited.
Lidar instruments have the potential to provide high resolution, well calibrated, observationsof ozone profiles in the stratosphere and will undoubtedly increase in importance in the future.Many of the lidar observing systems are already affiliated with the NDSC. This is important asadherence to NDSC protocols undoubtedly helps to ensure the overall consistency of data quality.The current ozone lidar network is not well distributed geographically and the provision ofadditional lidar sites in the tropics and Southern Hemisphere is very important.
In the troposphere, lidars are principally able to provide high resolution information onozone profiles so, given the increasing importance of tropospheric ozone data, the provision ofadditional lidar instruments and their intercomparison must be viewed as a priority. These shouldalso be affiliated with the NDSC and WMO-GAW. The contribution of these observing systems willundoubtedly increase as they become more widely distributed (possibly associated with theirexpanding use in air quality monitoring programmes). They would also prove very useful in helpingto validate space-based tropospheric ozone profiles.
The microwave spectrometers included in the NDSC can also be used to observe verticalprofiles of ozone. These instruments are fairly unique as they can provide information day andnight (this also makes geophysical validation easier). The provision of these data together withobservations of some important related trace constituents, notably chlorine monoxide, watervapour and nitrous oxide, is of great importance. It is essential to ensure the continuation of highlatitude observations made with these instruments (especially in winter) as they are the bestsource of these data.
The main concerns here are to improve the geographic distribution of the lidar stations,notably in the Southern Hemisphere and in the tropics, and to increase the number of suchstations affiliated with the NDSC.
4.3.2 Balloon- and Aircraft-Based Measurements
An extremely critical element of an integrated system is the maintenance of the balloon-based ozone sonde programme, whose importance was noted earlier (Chapter 3). Apart fromensuring the continuation of the current system, the main priorities are the expansion of thenetwork in the tropics and Southern Hemisphere, the continued focus on calibration andintercomparison according to the WMO-GAW programme (especially if new types of instrumentare introduced) and the development of new improved instruments that correct some of thedeficiencies of current instruments.
Some progress has been made in improving the availability of ozone sonde data in thetropics but much of this is on a temporary basis. The development of a long term international planto ensure the continued operation of ozone sondes in the tropics is a top priority as, at present,there is a strong possibility of the data base being terminated or drastically reduced. For ozonesonde data to be useful for trend determination, a measurement frequency of at least twice

50
monthly is needed, with weekly flights being preferable. The expansion of regular ozone sondeflights to several geographic areas, where there are few or no regular data (i.e. South America,Africa, all regions of the former Soviet Union and the Middle East), would be a major enhancementto the current international observing programme.
Calibration is also an issue as the use of different types of ozone sondes in differentlocations, combined with the effects of variations in sonde preparation on their use, means that thedifferent groups must regularly intercompare sondes (both in actual use and in controlledchambers). Support for this type of activity has been limited in the past. Steps must be taken toensure their continuation and regular implementation. Intercomparisons with lidars is equallyimportant. This topic is discussed in detail in Chapter 5.
Finally, it is necessary to focus efforts on the development of improved ozone sondes,especially if they can be made smaller, simpler and/or cheaper, to facilitate increased use. Thiscould be an excellent goal for technology programmes. Current problems include requirements forpump efficiency corrections and the need to “normalise to Dobson” by comparing integrated totalozone profiles with those obtained from nearby Dobson stations.
Routine operational aircraft observations, such as those within the MOZAIC programme,should continue and be expanded because of their ability to characterise the tropopause region,especially at mid-to-high latitudes (the tropical tropopause is well above the altitude rangeaccessible to today’s commercial aircraft). Some expansion of the programme to improve thespatial distribution of measurements would be very useful, especially when this means that thesedata span several ozone sonde and/or lidar locations.
Again the main concern is the lack of coverage in the tropics and in the SouthernHemisphere, though in assessing the requirement the provision of lidar stations must be taken intoaccount. Routine operational aircraft observations should also be expanded and the developmentof improved ozone sondes considered.
4.3.3 Space-Based Measurements
Space-based vertical profile measurements of ozone are not nearly as well in line withrequirements as is the case for total ozone column amounts. The current situation is complex -several instruments associated with long term measurement programmes measure the verticalprofile of ozone in the stratosphere and in the cloud-free upper troposphere, but none has all thedesired characteristics (i.e. good vertical resolution, good spatial coverage). Candidate solutionsfor the stratosphere include ultraviolet/visible limb scattering (proposed for NPOESS) andmicrowave/infrared emission. In the troposphere proper, the problem is even more acute as onlylimited data are currently available and vertical resolution is coarse except near the tropopause. Apressing requirement is the development of instruments capable of redressing this deficiency.
Those instruments with good vertical resolution (e.g. SAGE II and soon SAGE III) tend tohave limited spatial coverage because of their reliance on solar occultation, while those with betterspatial coverage (e.g. SBUV/2 and OMI) lack vertical resolution, especially in the troposphere andlower stratosphere. For the future, instruments based on the stellar occultation technique (e.g.GOMOS) may strike a reasonable compromise between these two extremes though, as indicatedabove, there are other possibilities including limb viewing infrared and microwave instruments.However, none of these techniques appears capable of meeting requirements in the troposphere.
Many of the current instruments are operating well beyond their anticipated lifetimes, forexample, SAGE II has been operating since 1984. SAGE III instruments are planned for launchbut the first of these instruments (as the current POAM-3 instrument) will fly in a polar sun-synchronous orbit so that solar occultation will be limited to high latitudes. Lunar occultations madewith this instrument will provide some tropical and mid-latitude data but these must be consideredas experimental until successfully demonstrated using actual SAGE III data (SCIAMACHY shouldalso help clarify the potential of this approach).

51
The next SAGE instrument in an inclined orbit, planned for the International Space Station(ISS), will not be launched until 2002 and will suffer from some loss of data due to downtimeassociated with Shuttle visits as well as the limited viewing capabilities available from the ISS. Anadditional SAGE III instrument is being constructed, but no flight opportunity has yet beenidentified.
The SBUV/2 situation is mixed as the NOAA-14 instrument has problems with its gratingdrive and the solar diffuser is not operational on the NOAA-11 instrument (this limits calibration forozone profiles). The SBUV/2 instrument launched in September 2000 will overlap NOAA-9 andNOAA-11, and will be major sources of archival information on ozone changes in the upperstratosphere.
A significant contribution should ultimately be made by the GOME instrument on ERS-2which is just starting to return ozone vertical profiles. Although these must still be considered asresearch products, operational products may shortly become available. Reprocessing shouldensure the availability of these data back to 1995 and support the requirements for trend detectionstated in Chapter 2. Mention must also be made of SCIAMACHY, OMI and GOME-2, especiallythe latter which will fly on an operational series of satellites. Together these instruments (also withOSIRIS and SMR on ODIN) should ensure data continuity from 1995 to at least 2010. However,given the importance of these data, there is still a need for a high vertical resolution (with goodglobal coverage) operational ozone profiler, such as is planned for NPOESS (OMPS), that can beflown on a regular basis.
Over the next few years a number of ozone-profile measuring research-orientedinstruments will be launched. Several of these (notably MIPAS, HIRDLS and MLS) should providethe desired combination of vertical resolution and spatial coverage (though the troposphere willremain a problem). However, these instruments are all complex and not well suited to long termoperational use. Significant effort will have to be devoted to the construction of a unified data setwhich includes data from these and any predecessor instruments that may overlap with them.
SCIAMACHY, in its solar, lunar occultation and limb scattering modes, will provide profilesto the desired vertical resolution in the stratosphere and upper troposphere though, like SAGE,with limited geographic coverage. GOMOS has the potential to provide both good verticalresolution and reasonable geographic coverage. However, this will be the first routineimplementation of stellar occultation (currently limited to a small number of observations by UVISIwhich are not generally available) so its role in ensuring a continuous data set cannot be taken forgranted. An operational version (COALA) is on the drawing board which could be implemented ifGOMOS lives up to expectations.
Overall the situation is complex as there is no single instrument (or group of instruments)capable of fully meeting the requirements, notably for good vertical profiles in the troposphere. It isalso disturbing that the flight opportunities required to exploit SAGE III are still not confirmed.
4.4 Meteorological Parameters
Although another of the CEOS projects (i.e. the Upper Air Project) in support of IGOS willbe providing requirements for most of the meteorological variables relevant to the Ozone Project(i.e. temperature, wind, cloud information, water vapour concentrations/specific humidity, etc.), itdoes not per se consider the requirements of the Ozone Project for these data. In most instancesthis does not pose a problem but there are some instances where the Ozone Project'srequirements for meteorological information are stricter than those required to meet the objectivesof the Upper Air Project. These are considered in this section but, without doubt, the most seriousconcern is the provision of adequate observations of water vapour in the upper troposphere and inthe stratosphere, and the precise location of the tropopause.

52
The discussion in the ensuing sections does not implicitly refer to the contribution of theoperational radiosonde network. These sondes are capable of measuring all these parameters tothe requisite accuracy but are restricted in geographic coverage, notably in the tropics and in theSouthern Hemisphere. Programmes such as MOZIAC help to resolve the coverage problem overthe oceans in the Northern Hemisphere but the rest of the globe remains a problem. It is also clearthat GNSS occultation data have a vital role to play, assuming these data are properly assimilated.
4.4.1 Upper Tropospheric and Stratospheric Water Vapour
Although the Upper Air Project has listed requirements for water vapour profiles in theupper troposphere, these are inadequate for the Ozone Project. In particular, the climate andweather oriented focus of the Upper Air Project has led to these requirements being stated interms of specific humidity. This makes sense in the lower and middle troposphere where watervapour amounts are reasonably large, but is of little use in the upper troposphere where theconcentrations are extremely small (lower ppm-range). Here a small uncertainty in specifichumidity can correspond to an enormous uncertainty in relative humidity.
The stricter requirements placed on upper tropospheric and stratospheric water vapournear the tropopause (see Annex B; Table B.2a) impose a significant constraint on measurementsystems. In particular, the large change in water vapour mixing ratio with altitude, especially nearthe top of the tropospause, means that high vertical resolution is of critical importance if theobservations are to prove useful within the context of the Ozone Project. Here ground-basedlidars, capable of measuring water vapour profiles, should play a very useful role.
The operational space-borne meteorological sounders are not designed to meet theserequirements. However, limb-viewing chemically-oriented profilers such as MIPAS, HIRDLS,SCIAMACHY and MLS do have the capability but all are non-operational instruments and longterm data continuity is not anticipated. Another possibility is the combination of GPS/MET data withindependent temperature observations which has considerable potential for meeting the ozoneProject's requirements.
To date the most important long-heritage measurements of water vapour in the lowerstratosphere and upper troposphere are those emanating from HALOE (since September 1991)and SAGE II (covering mainly the pre-Pinatubo period when aerosol contamination was small; re-initiation of the SAGE II water vapour measurements once stratospheric aerosol loading hasdeclined (after 1995) should be feasible though the revised SAGE algorithm is not yet available.However, both these instruments are well past their planned lifetimes. The logical step would be toseek the continuation of one or both of these occultation-based measurements.
The SAGE III instrument planned for the ISS should provide tropical and mid-latitudecoverage (though viewing will be limited - see earlier). High latitude observations will be providedby SAGE III, POAM-3 and ILAS-2, but long term measurements are not guaranteed.
4.4.2 Stratospheric Temperatures
The need for accurate temperature information throughout the stratosphere is clearlyessential to the Ozone Project and here again the requirements are stricter than those formulatedby the Upper Air Project. These temperature data are also required to convert the observationsmade by occultation-viewing instruments (they actually observe number density versus altitude)into the more scientifically useful mixing ratio versus pressure co-ordinate system. However,fortunately, most of the newer occultation sensors make simultaneous measurements oftemperature (e.g. SAGE III, POAM-2) so normally there would be no need to look to externallysupplied temperatures.

53
Several of the existing measurement systems can provide the requisite stratospherictemperature information, including lidars, GNSS occultation, radiosondes and essentially allinfrared- and microwave-based satellite instruments (though not all on an operational basis) and asensor onboard MOZAIC. The oxygen A-band absorption technique which is already being usedon several satellite systems (e.g. GOMOS and SAGE III) will also provide temperature profiles.Also, if successfully implemented, ultraviolet limb scattering (SCIAMACHY) could also help ensurethe provision of the requisite observations of stratospheric temperatures (air density and ozonemust be retrieved together) as will research-oriented instruments exploiting emission techniques(e.g. HIRDLS, MLS and MIPAS). Given this multiplicity of sources it appears that most of thestratospheric temperature needs for ozone applications should in principle be met, at least duringENVISAT and EOS-Aura.
4.4.3 Tropopause Height and Temperature
The interpretation of long term records of ozone amounts (especially total ozone columnamounts) requires the height of the tropopause to be accurately known as there is a strongcorrelation between tropopause height and ozone column amounts. Even a very small change intropopause height would, if it continued for an extended period of time, have an effect on derivedozone column amounts which might be confused with actual chemically-generated changes.
The needed precision (i.e. tropopause height known to approximately 100 m; year-to-yearconsistency to about 50 m - see Chapter 2) requires the long term availability of lidar, radiosondeand/or GNSS occultation data. No other measuring systems can be expected to provide therequisite accuracy and stability of observation of tropopause height. As noted earlier, thegeographic distribution of lidar stations is limited, especially in the tropics and SouthernHemisphere, though GNSS occultation should provide good global coverage. Continued supportfor both systems would ensure the availability of good global information to the requisite accuracy.
The temperature of the tropopause is also a required parameter. This should be obtainedto sufficient accuracy by any temperature profiling system meeting the requirements specified bythe Upper Air Project (using the WMO definition of tropopause). Here specific mention must bemade of the IASI and AIRS instruments. The former will fly on the operational METOP satellites.
4.4.4 Cloud Top Height and Cover
As far as the Ozone Project is required, the main justification for observations of cloud topheights (and coverage) is for use in the accurate retrieval of ozone information from instrumentswith nadir-viewing geometry and for estimating UV fluxes at the ground. The most importantrequirement placed on observations of cloud top height and coverage is the co-registration ofcloud top heights with ozone measurements (especially total column amounts).
This can be achieved in one of two ways - either as part of the measurements made by theozone instrument itself, for example, through measurement of the oxygen A-band at 762 nm or atshorter wavelengths (such as 393-397 nm) through the Ring Effect or by the inclusion of anotherinstrument (i.e. lidar) on the same platform as the ozone measuring instrument.
Some of the available and projected instruments (e.g. SAGE III, GOME, OMI andSCIAMACHY) have sufficient spectral range and wavelength resolution for cloud top heights to bederivable from the instrument’s data alone. The same will be true of GOME-2 on METOP, anoperational system which includes IASI, another source of cloud height information. The imager onMETOP will of course provide high quality images of clouds as will the NPOESS instrument. Cloudcover should prove no problem.
54
4.5 Related Chemical Constituents
A list of related chemical constituents that are needed to interpret ozone changes waspresented in Chapter 1. This was based on the assumption that the actual requirement is forcontinued observations of a small number of key parameters whose concentrations can be relatedto those of other constituents through chemical models.
The requirements listed in Chapter 2 are, at least for the stratosphere, quite well addressedby planned space and ground-based measurement systems. However, there is a problemensuring the long term continuity of observation of some of the parameters which will be measuredfrom ENVISAT and EOS-Aura but not from the planned operational systems. Follow on researchspace platforms are only being considered.
For many of these chemical constituents the observing requirements are more in the veinof “continuous” observations rather than “monitoring” (see earlier). This means that small gaps indata records, instrument-to-instrument variability and long term drift can be tolerated providedbiases and precision are compatible with the detection of small changes. This is not generally thecase for ozone column and profile measurements (or for temperature profiles).
4.5.1 Associated Trace Constituents
a) Surface-Based In Situ Measurements
The major requirement that must be met by surface-based in situ measurements is theneed for very accurate determination of concentrations of CFCs, halons, CFC replacements, otherhalocarbons (including methyl chloroform, carbon tetrachloride, methyl bromide) and otherchemically and radiatively active source gases (e.g. nitrous oxide, methyl bromide). Existing longterm networks, notably WMO-GAW (e.g. AGAGE and the NOAA/CMDL flask sampling network),perform well in this area and essentially meet the requirements listed in Chapter 2. However,geographic coverage remains a problem.
It is clear that these activities, with their strong emphasis on ensuring consistency ofcalibration over both the short and long term must continue. This means that all sites attempting todocument the long term evolution of surface concentrations of halocarbons and related species,must engage in calibration tests, intercomparisons and data quality control (see Chapter 5).
Some expansion of the current network is essential if improved information about thelongitudinal distribution of sources of long life gases in the Northern Hemisphere is to be derivedfrom the surface concentration data (data from relatively industrialised areas in Europe and Asiawould be especially useful additions to the overall international network). There is also a need toexpand the data base in the tropics and in the Southern Hemisphere.
b) Surface-Based Remote Sensing Measurements
Through its combination of sensing instruments the NDSC can provide information on allthe main trace constituents (see Table 3.1). This means that continued support for the NDSC iscrucial to documenting the long term evolution of the distributions of trace constituents. It isespecially true of total column amounts which are most easily measured with infrared andultraviolet/visible instruments.
Microwave radiometers also provide profile information on chlorine oxide (ClO) and otherspecies. Again some geographic expansion of the current network would be desirable through theaddition of complementary sites, especially in the tropics and Southern Hemisphere. However, it isimportant to remember that only those sites that pay sufficient attention to long term calibrationcan be considered as contributing to the overall requirement.

55
c) Space-Based Measurements
The constituents considered in this section are those for which there is the greatestneed for continuous measurement from space (these are listed in Table 1.1). Not all theseneed, in general, to be measured in the “monitoring” mode since their long term trend canbe reliably assessed from an expanded ground-based network (i.e. CO2, N2O, CH4 andCFCs).
Nitrous Oxide ( N2O) and Methane (CH4) - Source Gases - currently planned instrumentswill provide quite a lot of information on these two trace gases. Thus, observations of CH4
are currently being made with HALOE, and the planned MIPAS, SCIAMACHY, ILAS-2,HIRDLS, MLS and TES instruments will all make measurements of the vertical distributionof one or both of these constituents. The vertical resolutions of these instruments are morein line with the threshold requirement (3 km) than the target value (1 km). HIRDLS,because of its high vertical and horizontal resolution, probably comes closest to therequirements listed in Chapter 2, at least for the stratosphere and upper troposphere.
In the lower troposphere where the variations in these constituents are fairly small againsta large background, the planned measurement systems will do less well though bothSCIAMACHY and MOPITT will observe CH4 column amounts as will IASI on METOP. PostENVISAT/EOS-Aura only the latter will continue. There are no specific NPOESSrequirements for these measurements.
Instruments exploiting infrared-based occultation have the capability to meet therequirements but again there are no firm plans to develop operational versions of theseinstruments, or for further flight opportunities. None of these instruments can meet therequirements for tropospheric data
Carbon Monoxide (CO) - Source Gas - the most important historical set of measurementsof CO were made using the MAPS instrument flying on the US space shuttle though onlyfor short periods. Regular measurements from space will become available with MOPITTon TERRA, SCIAMACHY on ENVISAT, IASI on METOP and TES on EOS-Aura. Beyondthat only IASI data will be available.
Carbon Dioxide (CO2) - Source Gas - CO2 measurements from space have thus far beenmainly used for determining atmospheric temperature profiles. With the possible exceptionof SCIAMACHY, the accuracy of space-based CO2 observations is not sufficient to detectsmaller, short term changes in CO2, or to observe horizontal variations, though the largerchanges (factor of two) expected over the next century should be detectable. For currenttrend detection, none of the sensors meet the requirements.
Hydrogen Chloride (HCl) -Reservoir - the vertical profile of HCl is currently being measuredby the HALOE instrument on UARS and will be measured by the MLS instrument on EOS-Aura. In addition there is the SMILES instrument on the International Space Station whichcan also observe HCl (though with limited viewing capability - see earlier). Beyond this thefuture is uncertain though the continued operation of a HALOE-like infrared occultationinstrument or a related instrument, such as an infrared Fourier transform spectrometer, inan inclined orbit would go a long way towards satisfying the requirement.
An alternative approach would be the periodic flight of a suitable instrument (probablyexploiting infrared solar occultation) on the Space Shuttle, such as has been done with theATMOS instrument. As there is relatively little seasonal or spatial variation in thedistribution of this constituent near the stratopause, long term trends can in principle bedetermined from a series of intermittent measurements. Here the self-calibrating nature ofoccultation instruments would be a distinct advantage as this would help reduce theuncertainty associated with intermittent observations.

56
Nitric Acid (HNO3) - Reservoir - so far satellite observations of HNO3 have only beenconducted on a limited basis, notably with HALOE on UARS. However these observationswould be useful in helping to clarify questions relating to polar stratospheric denitrification.Some data should be provided by MIPAS on ENVISAT. The performance of TES on EOS-Aura will also be of interest as it should be able to observe HNO3 from the surface toaround 35 km. HNO3 will be adequately observed from HIRDSC on EOS-Aura.
Nitrogen Dioxide (NO2) and Nitric Oxide (NO) - Free Radicals - currently operating andplanned satellite systems should provide significant information on both NO and NO2.HALOE and SAGE II use solar occultation to measure their profiles and GOME can beused to observe total column amounts. Vertical profiles of NO and NO2 will also bemeasured by several forthcoming instruments, notably SAGE III, POAM-3, SCIAMACHY,GOMOS (+COALA), HIRDLS and TES. Total column amounts will be measured by GOME-2, SCIAMACHY and OMI. For the long term, observations of column amounts is adequatebut the same cannot be said of profile information at high latitudes.
Denitrification at high latitudes is very important so it is vital to maintain profilemeasurements at high latitudes to complement the measurements made using occultationinstruments in a polar sun-synchronous orbits. The current plan for this (involving POAM-3,SAGE III and ILAS-2) will provide some measurements, but this is not very well co-ordinated (as evidenced by the unfortunate separation between the visible/ultravioletPOAM-3 and SAGE III instruments and the infrared ILAS-2). ACE will now carry both anultraviolet/visible spectrometer and an infrared interferometer focusing on occultationmeasurements on many gases related to polar processing. This is no assurance thatthese measurements will be continued beyond ACE.
Chlorine Monoxide (ClO)- Free Radical - observations are currently being made with theMLS instrument onboard UARS and will be continued with its successor onboard EOS-CHEM. Additional observations should come from the microwave instrument aboard ODINand SMILES on the International Space Station (though with limited viewing capabilities).However, given the importance of ClO, it is necessary to develop a long term plan forensuring the provision of continuous observations of ClO.
These need not be in the “monitoring” mode (as described above) as a continuous seriesof high quality observations (with occasional gaps) should prove adequate given the focuson examining inter-annual variations over the entire globe. The need for long term trendinformation can perhaps be met by ground-based microwave radiometers associated withthe NDSC.
Therefore, the major need for ClO is to develop a plan for the continuation of vertical profilemeasurements in the post EOS Aura timeframe. The requirement could probably be met bythe provision of a relatively focused microwave instrument. Another possibility is SMILESon the International Space Station, though viewing will be limited and its orbit isincompatible with the need to observe ClO in the polar regions.
Bromine Oxide (BrO) - Free Radical - the need for global observations of total columnamounts can be met to a certain extent by making observations in the ultraviolet/visible aswith GOME, SCIAMACHY and OMI. In the long term these data will be safeguarded by theprovision of GOME-2 (and its successors) on METOP.

57
5. CALIBRATION AND VALIDATION
5.1 Introduction
To assure the scientific value of remote sensing measurements, calibration and validationare critical activities; for deriving climate quality data sets they are essential. This is recognised bythe space faring nations who have and must continue to allocate resources for the calibration andvalidation for Earth science research missions. For example, NASA’s UARS programme set asidesupport for correlative measurements to validate most of its key data products. This effort providedthe essential credibility for UARS data which led researchers to use the data to make some majorscientific discoveries on the processes controlling stratospheric ozone. CNES played a major rolein the UARS correlative measurements programme. Their validation activities continued in supportof ILAS flying on NASDA’s ADEOS mission with several multiple balloon flights involving Europeanpartners.
ESA’s ENVISAT mission, which includes three atmospheric chemistry instruments, hasinitiated an international effort to establish a comprehensive calibration and validation programme.NASA’s EOS-Aura mission, also carrying an international payload, will initiate and support a globalcalibration and validation programme. These missions will rely primarily on the existing ground-based infrastructure (surface, balloon, aircraft and networks) to provide the needed correlativedata.
Both the European Community and the United States are now planning operational satellitesystems that will carry the ozone sounders required to extend the long term record alreadyproduced by national research missions and the US NOAA operational system. NASA will alsocontinue to fly ozone chemistry instruments on their ADEOS and GCOM series of satellites.However, despite the fact that the major space agencies have embarked on operationalatmospheric chemistry missions, no unified concurrent validation programme has been establishednor is there any assurance that the requisite ground-based infrastructure will be in place.
Satellite systems can only meet the requirements listed in Chapter 2 if they are supportedby correlative data of known quality and are continually challenged by reliable ground-basedobservations and quantitative science. An on-going effort at NASA’s Goddard Space Flight Centerhas shown that the series of satellite BUV instruments onboard NOAA operational and NASAinternational research satellites can provide a continuous and accurate ozone data record ofclimate quality, satisfying assessment issues extending from 1970 to the present. However, thishas only been accomplished by the comprehensive cross calibration and validation of satellite andground-based observations. This effort has also included the concurrent development of improvedradiative transfer models and the refinement of algorithms, and to a large degree has beennecessitated and guided by the intercomparisons. It is quite clear that satellite and ground-basedobservations together form mutually supporting (and complementary) sources of information forquantifying changes in the global distribution of ozone throughout the atmosphere.
Based on the experienced gained in these research satellite missions, an end-to-endapproach to calibration/validation, highlighting the need for a fully integrated global observingsystem encompassing both ground and space-based, is clearly essential. This end-to-endapproach must include the satellite's internal calibration programme, post-launch calibration(employing on-board systems), an external validation programme using highly controlledcorrelative measurements, subsequent algorithm refinements and a scientific analysis of the datato ensure consistency with the best understanding of atmospheric processes and conditions.These steps form the basis of the recommendations from this chapter which are summarised inChapter 6.
Although validation programmes following this approach are planned for upcoming nationalresearch missions, there are currently no calibration and validation programmes designed toguarantee the overall integrity of global measurements over long periods of time and which meet
58
the objectives of IGOS. This is of particular importance given the existence of parallel streams ofthe national missions (e.g. the European METOP and the US NPOESS ozone instruments). Inaddition, a realistic possibility remains that gaps in one or both streams will arise and that thesystems may employ different wavelength ranges and techniques associated with significantlydifferent vertical resolutions. The ability of the atmospheric chemistry user community to combinedata sets from different remote sensing instruments will require that the calibration properties ofthe individual systems are well understood and that the validation programmes be placed on acommon footing.
This chapter defines the calibration and validation process and describes briefly the varioussystems available for validation. A set of principles and guidelines are listed to establish the basisof an international calibration/validation programme. Finally an implementation strategy isproposed.
5.2 Calibration and Validation Approach
Satellite sensors represent an enormous investment of intellectual and economic resourcesbut in return offer unique opportunities for observing the Earth, notably the ability to obtainessentially global coverage with a small number of well-characterised instruments. However, tosatisfy the requirements listed in Chapter 2, of the scientific and the policymaking communities andpotential commercial users, the geophysical products derived from satellite sensors must be ofknown quality and adequate for their intended use. The calibration and validation of satellitesensors establishes the foundation on which the integrity of all these data is based:
Calibration involves the definition of a set of pre-launch and in-orbit operations (orprocedures) to determine the relationship between the quantities derived from the output ofthe satellite instrument and the corresponding values available from a traceablenational/international standard.
Characterisation is the set of procedures used to quantitatively determine the sensor’sresponse over the range of operating conditions experienced in orbit during its lifetime.
Validation is the objective assessment of the accuracy of the observables (radiances) andretrievals of geophysical/atmospheric parameters from calibrated and well characterisedinstruments over a range of geophysical conditions.
Experience has shown that several steps are required to produce validated data. Thesesteps are illustrated in Figure 5.1 beginning with the space-based measurement. These data areconverted to geophysical values, namely radiances commonly called Level 1 products, by meansof pre-launch calibration and on-board systems which correct for time dependent changes.Radiance, Level 1 validation, can only be performed via comparisons conducted using instrumentswith overlapping wavelengths. This has been done in the past and should be feasible for theupcoming research and operational missions (i.e. ENVISAT, EOS-Aura, METOP and NPOESS)though the need to observe the "same" air mass (time and location) will pose the usual problems.
Validation of Level 1 radiance data should be considered as a tool for isolating calibrationerrors from algorithm errors. Algorithms, based on the best understanding of radiative transferproperties of the atmosphere, convert radiances into estimates of atmospheric composition andphysical parameters (Level 2 products). These Level 2 products are validated by means ofcorrelative measurements and scientific analysis (to check for scientific consistency - this mayrequire further refinements of the algorithms). Once this is completed, the data may have to bereprocessed to produce climate quality data sets. To realise the full potential of an instrument thisiteration normally occurs several times over the life time of the sensor.
Correlative measurements used for Level 2 validation come from many sources. Theseinclude operational and dedicated surface-based measurements, dedicated airborne measurementcampaigns (aircraft and balloons), nationally and internationally co-ordinated field programmesand sensors on other spacecraft measuring the same parameter. Also important are national and

59
international networks such as WMO-GAW, the NDSC and the World Climate ResearchProgramme (WCRP) Baseline Surface Radiation Network (BSRN).
However, it is important to remember that in many cases correlative measurements are notthe primary goal of the measuring network or programme, so their use in correlative measurementprogrammes must recognise their limitations for that purpose. One key consideration is the needto observe the "same" air mass (space and time).
60
The data quality of atmospheric chemical data products, derived from space-basedmeasurements, can be characterised by their accuracy, precision, resolution (temporal,horizontal/vertical coverage) and compatibility. The definition of data quality for measurementsfrom national and international networks should follow the ISO-9000 guidelines (and ISO norms)where it is established in terms of accuracy, precision, completeness, comparability andrepresentativity The ability to reliably assess and document the data quality of all correlativemeasurements used in the validation process must be a major objective of both IGOS and thisOzone Project. This ultimately requires the traceability of all geophysical parameters tonational/international primary standards, reference instruments or reference methods endorsed bythe international scientific community.
The current ground-based ozone observing network (total and profile) has limited spatialcoverage and thus cannot fully address the requirements of the satellite community for validationand complementary measurements over a broad range of geophysical conditions. However,itdoes provide a basis for a system addressing these requirements. For this a number of long termmonitoring sites, covering a range of geophysical conditions, must be selected from globalnetworks and designated as permanent satellite validation facilities. To be useful their long termprovision must be assured by the network operators, and for this the long term support of satelliteproviders will be undoubtedly required.
5.3 Algorithms and Radiative Transfer
The retrieval of atmospheric constituents from measured radiances involves the use ofradiative transfer models which can only be as good as the knowledge of the processes involved.This knowledge evolves continually so there is an ongoing need to refine radiative transfer modelsin the light of increased knowledge, as well as to fine tune the retrieval algorithms to accommodateinstrument changes during its life in orbit. The algorithms, the radiative models and theirrefinement all play an important role in validation as shown in Figure 5.1.
In many cases there is no unique solution to the retrieval problem so additional a prioridata, derived from other measurement systems (often ground-based), are required to furtherconstrain the analysis. Commonly (but not always) this is an iterative process, during whichmeasured and modelled radiances are closely matched and then geophysical parameters areretrieved. These steps involve the use of both radiative transfer models and retrieval algorithms.
The BUV ozone data discussed above (Section 5.1) and the ongoing activity to validateGOME data are examples of this process. Algorithm refinements incorporate instrument,radiometric and wavelength calibration corrections. Radiative transfer model refinements followfrom improved understanding of the role of clouds and aerosols, of Raman scattering effects, etc.The selection of a priori data, the improvement of radiative transfer models and the refinement ofalgorithms are all essential components of validation and must be included as part of the IGOSlong term measurement strategy.
5.4 Ground-based Observations
Ground-based measurements have and will continue to play a vital role in an integratedobserving system as they are the primary source of data for validating Level 2 data products. It istherefore essential to ensure that these systems are sustained to maintain continuity and dataquality. Intercomparisons between the various systems are essential to maintain the data quality ofthe ground-based network. The natural extension for defining and documenting theintercomparison process is to adopt and implement the International Standards Organisation’s ISO9000 series standards for quality systems.
Given the fact that the global ozone monitoring system has become an essential foundationfor international decision-making, it is incumbent upon the various organisations to be able todemonstrate the quality of the measurements at a level that can audited rather than to simply rely

61
on individual scientific reputation or competence. It is therefore logical to apply the ISO 9000series principles and practices to this scientific field.
The following sections briefly describe the various ground-based ozone observing systemsand the way data quality is maintained. Table 5.1 lists routinely available ground-based systems inplace or planned. In addition, there are data available from the routine operational aircraftobserving programmes (Table 5.2) as well as from special calibration/validation campaigns suchas those being planned in support of ENVISAT and EOS-Aura.
Table 5.1: Current Long Term Global Ground Based Ozone ReferenceMeasurements
INSTRUMENT NETWORK DATA STATUS
Dobson Spectrometer1
WMO-GAW and NDSC Total Column Ongoing
(part of GCOS)
Brewer Spectrometer2
WMO-GAW and NDSC Total Column Ongoing
(part of GCOS)
Ozone Sonde3 WMO-GAW and NDSC Profile Ongoing
(part of GCOS)
Ozone Lidar4 Selected Research
SitesTropospheric Profile
(< 12 km)
Research
(not yet incorporated innetworks)
Ozone Lidar4 NDSC Stratospheric Profile
(> 12 km)
Ongoing
FTIR5 Selected WMO-GAW
and NDSC StationsTotal Column Research
(not yet incorporated innetworks)
Microwave Radiometry Selected NDSCStations
Total Column andProfile
Research
DOAS6 SESAME Total Column Research
Note - traceable standards or calibration facilities are as follows:
1. WMO-World Calibration Facility for Dobson, CMDL Boulder CO (Dobson No. 83) withadditional regional calibration facilities for the six WMO regions
2. WMO-World Calibration Facility for Brewer, MSC Toronto Canada3. WMO-World Calibration/Instrument Characterisation Facility, Forschungszentrum Jülich
Germany. Traceable to NIST-Standard UV Photometer4. Intercomparison with ozone sonde, which in turn is traceable to NIST Standard UV
Photometer5. Fourier Transform Infrared Spectroscopy. No reference method, intercomparison with
Dobson/Brewer.6. UV/Visible Differential Absorption Spectrometry of sunlight scattered by the atmosphere at
zenith.

62
Table 5.2: Routine Operational Aircraft Observing Programmes
PROGRAMME DESCRIPTION SPECIES SCALE/DOMAIN AIRCRAFT PERIOD
CARIBIC Instrumentedcontainer
O3, CO, Aerosols Europe/Indian Ocean B767 1997-
MOZAIC II Automaticairborne devices
O3, H20 150 W - 50 E/80oN-25
oS
A340 1996-99
NOXA Automaticairborne devices
NO, NO2, O3 15oN-70
o N 90
oW-120
oE
B747 1995-96
TOP Grab samples CO2, CH4, CO,N2O
38oN-38
o S/145
oE
B747 1993-98 / ?
MOZAIC III Automaticmeasurementdevice
O3, H2O, CO, NOy 150oW-50
o E/80
oN-25
oS
A340 1999-
NASA project(planned)
Automaticmeasurementdevice
O3, CO, CHCl3;CO2
Global B747 Not yetdetermined
5.4.1 Dobson Spectrophotometer
The ground-based network for the monitoring of the globe’s atmospheric ozone content isprimarily based on an international network of about 70 Dobson spectrophotometers, some of whichhave been operational for many decades. Data collected over many years provide a crucial sourceof quality information suitable for the detection of multi-decadal trends and variations in ozoneamounts.
International intercomparisons are now the established way of maintaining calibration withinthe Dobson instrument network, i.e. the means by which the superior, independent calibration of theWorld Standard Dobson Instrument (Dobson #83) is propagated throughout the network. In additionto the actual field intercomparisons, laboratory assessments, internal adjustments and calibrationwork are carried out in support of the intercomparison exercise.
The intercomparisons are organised by the WMO-GAW programme. The data quality ofthese instruments has steadily improved and a sustainable precision of a few tenths of a percentare now common. The quality of the intercomparisons is critical to the network’s quality and to theaccuracy with which ozone trends can be monitored. These must be continued. Data are availablefrom the WMO World Ozone and Ultraviolet Radiation Data Centre, hosted by the MeteorologicalService of the Canada (MSC) in Toronto.
5.4.2 Brewer Spectrometer
Brewer ozone spectrometers ("Brewers") were first deployed in the early 1980s and thereare now over 70 in operation. The reference for measurements of ozone made using these devicesis the Brewer Reference Triad, a group of three Brewers that are operated in Toronto most of thetime. They are calibrated independently at the Mauna Loa Observatory in Hawaii. One or other ofthese Brewers has been taken to the Observatory eleven times since May 1983.

63
A key advantage of such a multiple-instrument standard reference (over one based on asingle instrument) is the possibility to make simultaneous measurements of the same quantity by allthree Brewers. An analysis of such measurements, spanning approximately 2200 days when allthree were in operation at Toronto, shows that:
• the precision of the absolute calibration of these devices is about 0.3% (1-sigma);• the divergence in long term trends between the three Reference Brewers is less than 1% per
decade.
Toronto is the WMO-designated Centre for Brewer Calibration and MSC has undertaken tomaintain and consolidate the three Reference Brewers. The calibration of the other operationalBrewers is normally based on a few days of simultaneous on-site measurements made inconjunction with a Travelling Standard Brewer, which is returned regularly to Toronto where it iscompared continually with the three Reference Brewers. Regular co-located observations are madewith Dobson spectrophotometer #77. Intercomparisons with the Brewers deployed in the networkshave been conducted over the past several years and these data are now being evaluated. Ozonedata from approximately 70 Brewers are available from the World Ozone and Ultraviolet RadiationData Centre.
5.4.3 Russian Filter Ozonometer M-124
The Russian network for observing total ozone column amounts consists of about 40stations that are equipped with the M-124 filter ozonometers. Total ozone amounts are retrievedfrom measurements made in direct sunlight at zenith angles of 20o-70o and from measurementsmade in clear or cloudy conditions for zenith angles of 20o-85o. This allows the measurement ofozone to be made at northern stations (16 Russian stations are located north of 60o) underpractically all weather conditions.
All the M-124 ozonometers are calibrated against a reference instrument. For the Russiannetwork the Dobson spectrophotometer #108 has been designated as the standard and thisinstrument is regularly compared with the WMO world standard Dobson spectrophotometer #83.The results of three intercomparisons (i.e. Boulder 1988, Hradec Králové 1993, and Kalavrita 1997)have shown that the measurement-scale drift of Dobson spectrophotometer # 108 does not exceed0.5%.
Regular quality control, instrument calibration and verification are carried out under theauspices of the Main Geophysical Observatory (St. Petersburg, Russia) and are based on inter-comparisons and Langley analyses. Total measurement errors are less than 3% and estimateduncertainties of mean monthly ozone values and ozone trends made by the M-124 ozonometersapproach those of other ozone stations employing Brewer and Dobson instruments
5.4.4 Ozone Sondes
Knowledge of long term trends of height resolved tropospheric and stratospheric ozone datais limited by the lack of global coverage provided by the existing ozone sounding stations and thequestionable homogeneity of the data (WMO Scientific Assessment of Ozone Depletion, 1994).
In order to provide reliable data for IGOS and to optimise the use of existing networks for theaccurate measurement of tropospheric ozone profiles, it is absolutely essential to further improvethe quality of ozone sonde data. This can only be achieved by the intercalibration and theintercomparison of existing ozone sonde types and agreement on procedures for data processingand analysis (WMO Report No. 104, 1995). Recognising this need WMO-GAW has initiatedactivities intended to ensure the realisation of quality assurance goals. These include theestablishment of a ”World Calibration Facility for Ozone Sondes” at the Research Centre in Jülich,Germany where all major types of ozone sondes have already been compared and will continue tobe compared under controlled conditions.

64
The JOSIE (Jülich Ozone Sonde Intercomparison Experiment) 1996 provided valuableinformation about the performance of the different ozone sonde types and the influence of operatingprocedures applied by participating laboratories. JOSIE-96 also showed that it is essential tovalidate ozone sondes on a routine basis. Ozone sondes have gone through various modificationssince they were first manufactured which adds uncertainty to trend analyses. Accuracy andprecision are altitude dependent and vary in magnitude according to sonde type, with the minimumuncertainty in the middle stratosphere. It has been found that ECC-type (electro-chemical cell)sondes typically achieve a precision of 3-5 % , while non-ECC types of sondes display a somewhatlower precision (around 5-15 %). WMO-GAW now requires the routine testing of a representativeset of manufactured ozone sondes on a regular basis, following a standard operating procedure toincrease confidence in observed trends in the future.
5.4.5 Lidar
The differential absorption lidar (DIAL) system can be used to monitor vertical profiles ofatmospheric ozone with good vertical resolution. The method is particularly well suited for trendstudies as it is self-calibrated. However, DIAL measurements are subject to both statistical errors(related to measurement signal-to-noise ratios) and to systematic errors arising from instrumentallimitations, differential backscatter and non-ozone differential extinction. This leads necessarily tosignificantly different assessments of the accuracy and precision of DIAL systems at different levelsin the atmosphere. Lidar measurements require clear skies and this has to be taken into account inselecting sites for long term studies.
At the present time there are about 12 stratospheric ozone lidar systems in operationthroughout the world which are used for long term monitoring as part of the Network for Detection ofStratospheric Change (NDSC). The NDSC has developed a validation policy to ensure that theresults included in its archives are of a known quality and is as high as possible within theconstraints of measurement technology and retrieval theory at the time the data were taken andanalysed.
Several intercomparisons involving DIAL systems and other instruments have shown that theregion of best agreement among all the instruments (including SAGE II) is between 20 to 40 km. Inthis region, single profile measurements agree to within 15% and average profiles based on specificcampaigns agree to within 10%. Systematic biases in this region are small. The DIALmeasurements are characterised by good precision and good vertical resolution especially in thelower stratosphere. However, below 15 km altitude and in particular in the troposphere, theaccuracy and precision of lidar systems must be further assessed through additionalintercomparison experiments.
There is only a handful of tropospheric ozone lidars in world wide use and most operate inthe research mode. Under optimised conditions they provide, continuously, profiles of ozone, dayand night, with a vertical resolution of better than 1 km. However, they have not been rigorouslyintercompared against independent measurement systems.
5.5 Validation of Trace Gases
The validation of measurements of trace gases listed in Annex B (Tables B.2) requiresspecial consideration as the concentrations of these gases are usually much lower than that ofozone and their spatial and temporal variability are not as well understood. Some of these gasescan be measured by a variety of remote sensing techniques (occultation, thermal emission, etc.)spanning different wavelength ranges and employing various algorithms. This variety affords manyapproaches to validation as the various techniques can be intercompared. Validation strategiesmust also take into account the fact that in these instances a trace gas will probably be observedwith different geometries and influenced by atmospheric variations. For some gases well calibratedground systems may not exist and, in these instances, validation will have to rely on the space-based system intercomparisons.

65
Given the large differences between the trace gases to be validated and among theinstruments used, validations must be planned on a case-to-case basis. Knowledge of instrumentprecision and atmospheric variability must be taken into account. For the trace gases listed in AnnexB (Tables B.2), instrument accuracies and precisions must be considered. It appears that the bestground-based instruments usually achieve higher accuracy and precision than space-borne ones(by a factor of between two to four). These factors define the number of coincident measurementsneeded to obtain the desired accuracy of validation. For ground-based comparisons, coincidencesare less frequent and the separation distance must also be considered if the requisite statisticalsignificance is to be achieved. For some trace gases the validation depends on comparisons withsophisticated ground-based instruments launched from a balloon. In these cases the bias errors aslisted in Annex B (Tables B.2) may never be achieved because of lack of precision and the limitednumber of comparisons.
Validation (intercomparison) of parameters among satellite instruments is also feasible.However, to achieve a given validity may require many more coincidences because of the lowerinstrument precision. On the other hand, the typical number of coincidences available with low missdistances and low miss times is high. A further advantage of such intercomparisons is that they canbe done in a "latitude-dependent" way. This is very desirable for measurements with globalcoverage. It is clear that a freshly calibrated instrument, installed in orbit for a few weeks, can be avery suitable intercomparison/validation tool. Ideally, intersatellite comparisons of trace gas datashould be supported by well calibrated ground-based systems.
Validation plans for ENVISAT and EOS-Aura are underway and will include specialcampaigns (balloons, ships and aircrafts and the existing infrastructure (e.g. NDSC, GAW) withsome likely upgrades. Resources should be sustained such that these high quality data beavailable for validation of future systems.
5.6 Scientific Analyses
The scientific analysis of satellite observations through the use of models has been shown tobe a powerful tool for validating satellite data although this is not validation in the true sense asmodels do not necessarily predict the ”truth”. However, this process does allow objective humaninterpretation of the data to ensure that they are reasonable and do not contain artifacts created bythe measurement process. All data sets should undergo such an analysis before being released tothe user (Figure 5.1). Two tools are available to support such an approach, namely chemistry-transport models and data assimilation (note they are not independent of each other).
5.6.1 Comparisons with Chemistry and Transport Models
Satellites provide valuable data for evaluating the performance of climate and atmosphericchemistry models. However, models can also be used to help validate satellite data as chemistryand transport models provide guidelines for values expected from observations. This approach isapplicable to both the determination of ozone trends and the observation of various trace speciesassociated with ozone chemistry. When the data sets disagree one or both are likely to be incorrect(although there is always the possibility that both agree and are both incorrect). Combining modelsand observations provides an opportunity to separate the effects of individual processes in modelsexploiting the large-scale coverage offered by satellites.
Models can also be used to test the consistency of retrieval algorithms. Although ground-based measurements provide the primary validation data, they are limited in spatial and temporalcoverage. Regional and global models can be used to assess the consistency of an entire set ofobservations from a satellite. This can be particularly useful for assessing algorithms used to deriveconcentrations of species that are infrequently observed by satellites, and for cases where attemptsare made to increase vertical resolution. Discrepancies may point to problems with the retrievalalgorithms or possibly to aliasing due to the temporal coverage. However, they may also point tomodel deficiencies so caution must be exercised though models have an important complementaryrole to play in satellite validation.
66
5.6.2 Data Assimilation
Data assimilation is an essential tool in meteorology for deriving the optimal description ofthe dynamical state of the atmosphere from various types of observations with different coveragesand uncertainties. In data assimilation, satellite observations (e.g., ozone) are fed into anatmospheric model and are weighted with model-calculated ozone values in order to predict themost likely state of the atmosphere. By extending the amount of data available to dynamical modelsby data assimilation (which retains dynamical information on ozone), it is possible to obtain maps of,for example, the distribution of ozone at any specific time, according to requirements. This is incontrast to satellite global images from low Earth orbit which are based on interpolated data pointsmeasured at different times.
Satellite instruments usually observe averages over a large area, whereas ground-basedmeasurements often represent local values which increases the uncertainty of intercomparisons.Furthermore, ground-based measurements are often taken at different times and at geographicallocations than the satellite measurements. Comparisons with ground-based measurements can beenhanced by employing data assimilation models to "intelligently" interpolate in space and time.Cross comparison of data obtained from other satellite instruments can also be used for validation,but suffer many of the same problems. Here again the use of data assimilation will improve thestatistics of the validations. Moreover, data assimilation offers the possibility of identifying groundstations which deliver controversial data (by comparison with the analysed model fields) orfailures/problems in space-borne instruments.
Data assimilation models can also be used to compare satellite observations with predictedtracer values (e.g. of ozone) based on previous observations made by the same satellite instrument.Information on the differences between new observations and model forecasts provides insights intothe self-consistency of the data set provided by the satellite instrument, as well as on the quality ofthe model. This implies that chemistry can aid dynamics and vice versa. In this manner, knowledgeof the ozone field can be significantly further improved by incorporating sonde, lidar, aeroplane,surface and satellite measurements into a single harmonised and quality assured data set.However, although operational data assimilation systems are currently available for use in NWP(numerical weather prediction), only experimental ones exist for atmospheric chemistry.
5.7 Principles and Recommendations for Calibration and Validation
In order to implement a calibration and validation programme appropriate for IGOS, all thesteps described above and illustrated in Figure 5.1 must be considered. Thus, for the Ozone Projectit is strongly recommended that the following set of principles be adopted by national andinternational organisations responsible for the development of space programmes and ground-based networks:
• A "sense of community responsibility" must be fostered between the space agencies andnational/international agencies involved in the maintenance of ground-based networks. Thelatter often lack the resources required to ensure the maintenance of data sets ofconsistently high levels of quality or to provide the global coverage necessary to supplementa truly global, space-based, ozone observing system; while the former may have formalpolicies (or directions from their funding governments) that severely limit or prohibit their longterm support for ground-based systems.
• A formal holistic validation programme must be developed and implemented which extendsover the entire life of each sensor/platform and across multiple instruments/ platforms. Thesense of "community responsibility" would be aided by recognising the ground-basednetworks and the satellite observations as integral parts of the ozone observing system. Forthis some carefully selected ground stations will have to be designated as permanent ground"truthing" stations.

67
• Procedures must be developed, implemented and properly documented to assure theconsistency of calibration and validation across related programmes, including ground-basednetworks ("harmonisation"). Whenever appropriate, instrument outputs and derivedgeophysical parameters must be tied to recognised traceable standards, referenceinstruments and reference methods. Support for the infrastructure required to supportcontinual upgrades and to ensure the long term consistency of calibrations must beassured.
• The space agencies and instrument providers must commit themselves to long term co-operation with the scientific community to encourage the maximum use of the data providedby the ozone observing system. Quantitative science is the ultimate and highest level ofquality assurance.
• The long term and iterative nature of calibration/validation activities and algorithmdevelopment must be recognised. Programmes should be developed in a way that assuresthat validation results will be used in the algorithm improvement, which will then be tied torequirements for subsequent reprocessing and the revalidation of data sets. The availabilityof resources for these efforts must be assured.
• Validation strategies (e.g., size, scope, nature of key ground networks) for spaceprogrammes must be tailored specifically to the measurements at hand. The validationprocess should involve the participation of appropriate members of the international scientificcommunity working together with the developers of specific instruments. Tools such as dataassimilation should be exploited.
5.8 Implementation Strategy
Implementing this set of principles represents a change in agency philosophy and asignificant expansion of validation activity as illustrated in Figure 5.1. On the other hand, they alsooffer the potential for conserving significant resources through the co-ordination of calibration andvalidation campaigns and programmes and the optimisation and sharing of facilities and expertise(including the operational systems planned in Europe, Asia and the US).
A preliminary review of the launch schedule for satellites carrying ozone sensors and thosealready in orbit (see Chapter 3) clearly shows a window of opportunity exists at this time forimplementing some or all of the recommendations listed in this report (Chapter 6). Most of the longterm ground-based facilities, frequently called upon to assist in the geophysical validation of space-based systems already form an integral part of the global ozone observing system operated co-operatively by WMO-GAW and NDSC. However, their continued operation well into the 21st centuryis not assured and must be a matter of primary concern.
What is needed, then, is a pilot project with the specific goal of designing and formalising thestrategy for developing a co-ordinated approach to the construction and realisation of the globallyharmonised and mutually interdependent network of satellite and ground-based sensors, required toassure the consistent provision of high quality ozone data sets (and associated observations) over along time period. This task could in principle be accomplished under the auspices of an IGOS"ozone project".

68
69
6. RECOMMENDATIONS
6.1 Introduction
The discovery of an annual spring time ozone depletion over Antarctica over a decade agoprovided evidence of a global change in the chemical composition of the atmosphere and, as aresult, new ground was broken in linking scientific observations and international policy action(Montreal Protocol on Substances Depleting the Ozone Layer and ensuing amendments thatbanned the production of ozone depleting substances and in particular the CFCs). The destructionof ozone in the stratosphere and the global build-up of greenhouse gases are global environmentalthreats and no one country acting alone can prevent the degradation to the continued well-being ofthe planet’s ecosystems and the quality of life.
We are now faced increasingly with the need to assess the global consequences ofindustrialisation for which reliable global environmental data are essential. Today, ground-based2
and space-based sensors are used to verify not only that the Montreal Protocol is in fact working butalso, generally, to gather vital data on the changing global atmosphere and thus help establish asolid scientific foundation for future policy debate and action. An integrated global observing system(i.e. the combination and co-ordination of space-based and ground-based measurements) isrequired as these sources of information complement and help validate each other. Both areneeded to ensure the provision of the data required to develop policies to protect the environment.
IGOS provides the basis for a strategic planning process linking research, long termobservations and operations. It entails matching requirements in the way of observations withexisting and planned capabilities and implies the existence of a forum in which national andinternational agencies co-ordinate and tailor their own commitments to meet a global goal. However,it also implies that countries which lack technological capabilities to actively participate in spaceendeavours, or which have insufficient financial and human resources to establish a ground-basedcomponent, be offered the opportunity to participate in IGOS, possibly calling upon a fund set upspecifically for such a purpose. From an IGOS perspective there are many areas of the globe thatare grossly under-sampled. This situation must be rectified by additional financial support. Thesecountries would then become stakeholders in (and contributors to) IGOS and be in a position toparticipate actively in the process of global decision making (see Agenda 21 (Article 40) UnitedNations Conference on Environment and Development, Rio de Janeiro, 1992).
Many of the elements of an integrated global observing system for ozone exist today.National/international ozone monitoring and atmospheric chemistry research programmes havealready deployed several systems with additional missions scheduled for launch within the next tenyears. These systems include an array of space missions, ground-based networks andmeasurements taken from airborne platforms (aircraft and balloons).
The primary purpose of these observations is to determine if the international protocols,established to offset ozone depletion by regulating critical anthropogenic halogen-bearing gases,are effective. These observations include measurements of total column and profile amounts ofozone on a global basis. Also included are observations of atmospheric constituents important toozone chemistry, namely source, radical, reservoir and trace gases (and aerosol) whosedistributions and evolution must be understood in order to explain the observed changes in ozoneoccurrence.
In addition to the ozone depletion issue, it is now recognised that global observations ofozone and other atmospheric trace substances are important to further understand climate and airquality. Systems developed in response to the environmental impact of ozone depletion are beingre-directed and/or adapted to take observations in the lower atmosphere to advance knowledge ofthe impact of active constituents on the radiative and chemical properties of the lower atmosphere. 2 Note that generally in this report the use of the phrase "ground-based system" in the chapter implies airborne (balloonand aircraft) operations as well as ground-based.
70
There is an overall requirement for accurate long term data sets so that observations can becompared with models and their predictions. In some cases this implies the need for continuousdata sets (with overlaps assured when instruments are deployed in series) while for otherparameters only intermittent but regular, well calibrated measurements are required.
Ozone and atmospheric chemistry-related observations are being provided by a combinationof operational and research space-based systems and ground-based measurements. Theoperational systems include the European GOME instrument on ERS-2 and METOP, and the USOMPS instrument on NPOESS. In both cases commitments have made to continue making theobservations for at least two decades.
In addition, both Europe and the US will conduct at least one long term (~5 years)atmospheric research mission, namely ENVISAT and EOS-Aura respectively. Japan, through itsADEOS and GCOM missions will combine operational and research observations. Ground-basedsystems that have been relied on for "ground truthing" these satellite sensors include those rununder the auspices of WMO-GAW and NDSC. However, the primary goal of these networks is todocument the physical and chemical changes of the atmosphere and to help unravel the causes ofthe observed changes. The same is true of both ENVISAT and EOS-Aura.
The extent that these provisions, described in Chapter 3, meet the observationalrequirements specified in Chapter 2, is discussed in Chapter 4. However, there remains the problemof a lack of formal co-ordination among the space faring nations to optimise the deployed systemsand to assure data consistency/uniformity for international users. In addition, there must be formalrecognition and support for the international community which is providing the critical data (primarilythrough ground-based measurements) for the independent calibration and validation of the space-borne systems. Not only does this community provide supporting data for the satellite-basedsystems, but it also collects crucial observations of ozone, climate and air quality not measurablefrom space. These capabilities were also described in Chapter 3 and include measurementsconducted from the ground-based systems. The whole of Chapter 5 is devoted to an explanation ofthe need for a long term calibration/ validation programme and an implementation plan thatrecognises the crucial and complementary role of ground-based systems.
The following recommendations highlight the missing components of the future integratedsystem as well as the deficiencies of existing systems which need to be improved in order to meetthe requirements of the science and user community for atmospheric observations. Only byimplementing these recommendations will the objectives of the Ozone Project and of IGOS itself bemet.
The recommendations described in this chapter are separated into four components:
• The first addresses algorithm development and calibration procedures.• The second deals with the implementation of a globally integrated system.• The third considers the need for improved or additional measurements .• The fourth addresses the need for technical support for the funding agencies.
These recommendations draw heavily on the content of the previous chapters. Thesechapters outline the scientific requirements for long term ozone and atmospheric chemistryobservations, describe past, existing and planned observing systems, and illustrate how theserequirements could be met by existing and planned observing systems.
The recommendations presented below attempt to identify those areas that remain deficientand hence will hinder the collection of crucial environmental data on the state of the atmosphere ofthe quality required to enable the state of the atmosphere to be properly monitored and changescorrectly interpreted, providing a basis for formulating environmental policy.

71
6.2 Algorithms and Calibration
6.2.1 Algorithms
The performance of inversion algorithms are based on the ability to predict observedradiances and to retrieve the geophysical parameters from these radiances. For the plannedmeasurements, a great deal of algorithm development, supported by national agencies, isunderway. To some degree there is already international co-operation by the respective instrumentscience teams in the areas of radiative transfer model development and comparisons.
• International co-operation in the development of algorithms must continue withan emphasis on pooling knowledge and establishing reference atmosphericmodels and cross checking radiative transfer physics.
The performances of these models will determine the accuracies of the final data products.
Maximising accuracy will minimise systematic differences between observing systems involvingvarious measurement techniques and approaches.
• Algorithms for many common observing systems, such as those exploitingbackscatter (GOME, OMPS) and thermal emission (IMG, MIPAS, TES), aregenerally not identical. Therefore, intercomparisons must be encouraged ifmaximum accuracy is to be achieved.
It is possible that a common algorithm could evolve for all systems exploiting the samemeasurement technique. Here it will be essential to ensure that a consistent spectroscopy is usedwhen considering instruments covering the same spectral ranges.
• To ensure the availability of such spectra the quality of existing spectra must bereviewed and further laboratory measurements instigated to correct deficiencies
6.2.2 Calibration
The calibration of both space- and ground-based systems provide key data on instrumentcharacteristics, essential for the transfer of instrument output to radiances and to the realisation ofthe high measurement accuracies needed to minimise systematic differences between observingsystems (essential if these data are to be of value to the user community). The techniquesemployed rely on national standards and require careful implementation.
• Scientists who maintain and improve national calibration standards must beinvolved when these standards are applied to calibrating remote sensinginstruments.
The refinement of calibration techniques by the instrument providers is already underway butneeds to be consolidated.
• Calibration techniques must be intercompared and, where applicable, cross
calibration must be encouraged. • The user must be involved in the analysis of calibration data. For this full
documentation and description of procedures will be essential.
The ground-based measurement systems (i.e. existing networks plus supplementary stations)must be regularly challenged through calibrations and intercomparisons - an absolute pre-requisitefor reliable data gathering. For this purpose, WMO-GAW has either established World CalibrationFacilities (WCFs) or else it has provided reference instruments, though not for all measurementparameters and with no assurance of long term continuity. All ground-based measurements must

72
ultimately be traceable to a world standard (calibration gases or reference instruments) and mustdemonstrably meet the data quality objectives set by IGOS.
• Additional support is needed to upgrade and maintain a comprehensive and
rigorous quality assurance programme for ground-based components.
• Traceability must be established for all parameters and measures implemented toremedy omissions.
For the latter, as an interim solution, instrument intercomparisons would be an acceptableprocedure for initiating the global harmonisation of data sets.
6.3 Implementation
The implementation of an integrated observing system has many facets includingdeployment, instrument operations, data acquisition, data production and archiving and, last but notleast, data validation. For each of these facets the needs of the international user must beconsidered recognising however that national agencies, that provide the resources, may have otherpriorities. Nevertheless, it is important to note that it is very likely that significant cost efficiencies willbe achieved through international co-operation.
A further problem arises because in many instances the measurement types and theirplatforms have already been selected. This limits flexibility as it means that it is feasible to consideronly a limited set of options in formulating an integrated strategy for deployment; only certain areasremain open for further consideration and international co-operation. These include algorithmdevelopment, their implementation, pre-launch instrument calibration and, most importantly, acommitment to sensor validation over its life time on the basis of ground-based and airborneobservations.
6.3.1 Coverage
As discussed in Chapter 3, the deployment of the space-borne component of the globalsystem is already underway. Although these systems have been designed to meet individualnational priorities, they are based on requirements that have fairly wide international scientificsupport. However, they do not yet meet the full requirements.
Ground-based systems must not only meet the challenge of supporting the space-basedcomponent through well co-ordinated validation activities, but they must also expand their activitiesinto geographic areas that are now grossly under sampled.
• Mechanisms must be identified that will allow countries in under sampledgeographic areas to become actively involved in IGOS and the Ozone Projectunder the umbrella of WMO-GAW and/or NDSC.
• The geographical distribution of ground-based systems (for nearly everyatmospheric constituent) falls short of requirements and must be expanded,notably in the tropics and in the Southern Hemisphere.
In parallel, in partial support of the recommendation, it is important to ensure that scientistsand engineers in developing countries are fully involved in the Ozone Project.
The various instruments that are deployed in space will have different capabilities with regardto field-of-view and geographical and vertical coverage. This will be particularly true for instrumentsflying in low and non-low Earth orbits such as geostationary. Another point to note is that METOP,NPOESS, and GCOM, though all in low Earth orbit, will have different (or even varying) equatorcrossing times.

73
• The operation of deployed instruments must be co-ordinated to ensure that thecoverage required to meet the requirements particularly in the case of the failureof one of the observing systems.
• Options must be considered which will facilitate the synergistic use of data fromdifferent measurement systems such as space-borne systems operating indifferent orbits (i.e. LEO, GEO and L1).
6.3.2 Operations
The challenge of securing and maintaining financial commitments for upgrading and/orexpanding existing ground-based networks cannot be met by WMO-GAW and NDSC alone; neitherof them has sufficient resources even to meet current commitments and needs. WMO-GAW relieslargely on the ability of Membership countries to support stations within their boundaries, whilescientists contributing to NDSC must secure their own support through proposals to fundingagencies. Clearly this situation is not satisfactory and demands a solution. One solution is toestablish a special fund.
• The possibility of establishing a fund must be considered to provide support (onthe basis of demonstrated need and capability) to the ground-based component toensure its uninterrupted long term operation and also to expand the network intoregions of the globe that are currently under sampled.
This activity could also be supported by individual bilateral agreements.
6.3.3 Data Production and Archiving
The justification for the deployment of the various space and ground-based systems is tocollect data that is easily accessible and useable by the user. Various agencies have devotedsignificant resources to support the provision of data to users. Data formats are being devised andharmonised, archives built and outreach activities initiated to ensure that the user is aware of datacharacteristics and validity. However, this needs to be consolidated:
• To facilitate data usage providers must consider developing data products thathave common formats, descriptions and accessibility routines.
• As far as is practicable common units must be employed to describe co-ordinates
(height and location) and the numerical values of measured quantities. • Archived data bases must have common formats with pointers available to
indicate locations and how to access to data from the various archives.
• Resources must be made available to reprocess data sets in the light of validationexercises and to ensure that the highest quality data sets are available to the usercommunity.
These recommendations are applicable to both space- and ground-based systems.
6.3.4 Validation
The calibration and validation of environmental data sets is fundamental to the realisation ofthe long term objectives of the Ozone Project and the use of the data. Therefore, space faringnations and nations participating in global atmospheric research, have allocated significantresources to support calibration and validation. However, currently there is no specific programmedesigned to guarantee the overall integrity of global measurements over the long term and requiredto meet the objectives of the Ozone Project.

74
Chapter 5 deals with this issue in some detail considering an end-to-end approach forcalibration and validation which includes pre-and post-launch calibration, the refinement ofalgorithms and scientific analysis (exploiting best understanding of the atmosphere) necessary toinsure consistency. A comprehensive and controlled correlatives measurement programme usingground-based (ground, balloon, and aircraft) observations forms the basis of the ozone atmosphericchemistry validation programme. This implies, however, that ground-based observations providequality assured data sets and that consequently the recommendations in Section 6.2.1. have beenimplemented, at least for parameters critical for satellite validation.
Chapter 4 specifies the deficiences in the existing provisions which are also addressed inChapter 5. They include subset recommendations specific to calibration/validation. These may besummarised as follows:
• A holistic validation programme must be developed and implemented extendingover the entire life time of each observing system and across observing systems.The space- and ground-based systems (including algorithms, spectroscopy, etc.)must be considered as integral parts of the overall observing system.
• The long term and iterative nature of calibration/validation and algorithm
development must be recognised. Resources must be made available to ensurethat validation results are used for algorithm improvement, which are then tied torequirements for the subsequent reprocessing and the revalidation of data sets.
• A carefully selected subset of WMO-GAW and NDSC stations must be designated
as permanent satellite validation stations and fully integrated into the planningand execution phases of satellite validation activities. They would be the primarystations for the long term validation of satellite sensors as called for in thisreport.
• Data assimilation facilities must be further developed and made available forvalidation purposes. Associated with this the possibility of relaxing resolution(spatial and temporal) requirements could be considered.
• The geographical distribution of ground-based systems (for nearly everyatmospheric constituent) falls short of requirements and must be expanded,notably in the tropics and in the Southern Hemisphere, to demonstrate the abilityof space-borne systems to retrieve accurate data under all observing conditions.
6.4 Recommendations for Additional Space-Borne Measurements
Chapter 4 compares current provisions with the requirements. Decisions on the deploymentof these systems were based on a combination of user requirements, national priorities andavailable resources. It is clear that proposed systems, assuming funding is stable, come a long wayto meeting the requirements. However, there are some significant deficiencies.
ENVISAT, EOS-Aura and the ILAS-2/GCOM missions together should meet many of therequirements outlined in Chapter 2. However, these are non-operational missions (though someENVISAT products will be produced operationally in near real time) which are expected to endbefore the end of this decade, and there are no firm plans for follow-on missions of a similar kind.Space faring nations may be planning follow-on missions but it is not clear that these will also meetthe requirements listed in Chapter 2:

75
• There is a need to enhance the operational provision of data. GOME-2 and OMPSflying on METOP and NPOESS will only measure a subset of the requirements.These or new systems must include:
• Reliable measurements of lower and upper tropospheric ozone at urban scaleresolution required for a variety of environmental purposes;
• Profile information for NO, NO2, CH4 in the troposphere for air quality andclimate research;
• Upper tropospheric/lower stratospheric measurements of BrO and ClO(though SAGE III may produce some BrO profile information in the lowerstratosphere).
• Non low Earth Orbits must be considered for the detailed global observation of airquality as they will permit the continuous monitoring of plumes and theobservation of high temporal and diurnal variations. TRIANA will be exploringthis vantage point.
For tropospheric observations, the ground-based networks have to play a dominant role inensuring representative spatial and temporal coverage for all important parameters. To assume thisrole requires that recommendations regarding network expansion, rigorous quality assurance andlong term commitment of this component be fully implemented.
6.5 Advisory Body for the Ozone Project
The formulation and realisation of an integrated global observing strategy for ozonerepresents an enormous challenge for scientists, engineers, managers and politicians. Success willonly be achieved through the involvement of many different communities ranging from atmosphericmodellers, laboratory spectroscopists and those involved in technology development, systemoperations and data analysis together with scientific users and policy makers. Observations of thecomposition of the atmosphere involves an extremely diverse set of instruments operating undervarying conditions.
In addition, even as the environment changes because of long term environmental cyclesand anthropogenic forcing, the ozone/atmospheric chemistry discipline continues to evolve withadvances in knowledge . Thus, requirements (and hence subsequent strategy) can also beexpected to evolve with time.
• It is therefore recommended that an international advisory body be established toprovide overall direction and to ensure the implementation of specific sets ofrecommendations, taking due note of the philosophies and time constraintsoutlined in this report.
The advisory body would be best organised under the auspices of bodies such as WMO andCEOS. It must have the capability to address the following topics:
• The identification of missions required to meet requirements not covered by theoperational (METOP and NPOESS) systems.
• The refinement of requirements notably in the light of emerging interests in air
quality and advances in understanding of chemical interaction and climateforcing.
• The further modelling activities needed to improve the scientific basis for
predictions. Data type requirements must be specified.

76
• The organisation of data providers to ensure the best and most cost effective use
of resources including space- and ground-based systems.
A calibration/validation advisory group is also needed to consider global approaches to theprovision of high quality data from the space- and ground-based observing networks. This groupshould also consider global strategies for calibration/validation activities (including specialcampaigns).
6.6 Concluding Remarks
There is a definite sense of urgency in the need for the international community to commit toand fully establish strategy dedicated to monitoring of ozone and atmospheric chemistry and toswiftly implement the recommendations made in this report. Critical gaps in observing systems mustbe corrected as soon as possible. Anticipated trends in population growth and correspondingincreases in demand for energy, food and other natural resources, imply the need for prudentdecisions to be made in order to minimise the impact on the environment, while maintaining durabledevelopment.
Reliable answers are needed to the question: “What is changing and why?” There is also amore practical incentive for swift action: Several satellite systems are scheduled for launch duringthis decade all requiring extensive ground validation and co-ordination to comply with the aboverecommendations. A considerable cost savings is anticipated if a fully functional Ozone Projectsupporting IGOS is established which could actually off-set some, if not all, of the financial burdenresulting from the implementation of recommendations put forth in this report.

77
ANNEX A
LIST OF SCIENTISTS AND EXPERTS CONSULTED

78

79
List of Scientists and Experts Consulted
The views of three general classes of scientists and experts were sought in drafting theReport on the Ozone Project, namely:
A) User Body Representatives
EC A. Ghazi (EC, Brussels, Belgium)EOCU N. Harris (European Ozone Research Coordinating Unit, Cambridge, UK)GCOS D. Whelpdale (Atmospheric Environment Service, Downsview, Ontario, CDN)IGAC G. Brasseur (Service d’Aéronomie du CNRS, Verrières-le-Buisson, F)IGBP C. Rapley (British Antarctic Survey, Cambridge, UK)IOC R. Hudson (University of Maryland, College Park, USA)IPCC N. Harris (European Ozone Research Coordinating Unit, Cambridge, UK)NDSC R. Zander (Institut d’Astrophysique et de Geophysique de l’Université de Liege, B)
SPARC M. Geller (State University of New York at Stony Brook, NY, USA)UNEP G. Mégie (Service d’Aéronomie du CNRS, Paris, F)WCRP H. Grassl (WMO, Geneva, CH)WMO J. Gille (National Center for Astrophysic Research, Boulder, CO, USA) and V. Mohnen
(Atmospheric Research Science Centre, Albany, USA)
B) Space Agency Representatives
USA (NASA) J. Kaye (co-lead; NASA Headquarters, Washington DC, USA)Europe (ESA) C. Readings (co-lead; ESA–ESTEC, Noordwijk, NL)Canada (CSA) R. HumFrance (CNES) N. Papineau (CNES Headquarters, Paris, F)Europe (Eumetsat) A. Ratier (Eumetsat, Darmstadt, D)Germany (DLR) M. Bittner (DLR, Oberpfaffenhofen, D)Italy (ASI) F. Svelto (ASI, Rome, I)Japan (NASDA) T. Ogawa (NASDA, Tokyo, J)UK (BNSC) N. Harris (European Ozone Research Coordinating Unit, Cambridge, UK)USA (NOAA) L. Flynn (NOAA-NESDIS, Camp Springs, MD, USA)
C) Experts and Specialists Consulted
D. Albritton (NOAA Aeronomy Laboratory, Boulder, Colorado USA)P. Bernath (University of Waterloo, Ontario, Canada)R. Bevilacqua (US Navel Research Laboratory, Washington DC, USA)J. Burrows (University of Bremen, Bremen, Germany)P. Canziani (University of Buenos Aires, Buenos Aires, Argentina)K. Chance (Smithsonian Astrophysical Observatory, Cambridge, Massachussets, USA)M-L. Chanin (Service d'Aéronomie du CNRS, Verrières-le-Buisson, France)W.F.J. Evans (Trent University, Ontario, Canada)J. Fishman (NASA Langley Research Center, Hampton, Virginia, USA)G. Golitsyn (Russian Academy of Sciences, Moscow, Russia)M. Gunson (Jet Propulsion Laboratory, Pasadena, California, USA)F. Hasebe (Ibaraki University, Mito, Japan)

80
E. Hilsenrath (NASA GSFC, Greenbelt, Maryland, USA)I. Isaksen (University of Oslo, Norway)
J. Langen (ESA–ESTEC, Noordwijk, NL)M. Lawrence (Max Planck Institut für Chemie, Mainz, Germany)H. Kelder (KNMI, de Bilt, & Technical University, Eindhoven, The Netherlands)V. Khattatov (Central Aerological Observatory, Moscow, Russia)V. Kirchhoff (INPE, Cachoeira Paulista, Brazil)J. Langen (ESA–ESTEC, Noordwijk, The Netherlands)G. Leppelmeier (Finnish Meteorological Institute, Helsinki, Finland)J. Logan (Harvard University, Cambridge, Massachussets, USA)H. Masuko (Communications Research Laboratory, Tokyo, Japan)M. McCormick (NASA Langley Research Center, Hampton, Virginia, USA)A. Miller (NOAA NWS, Camp Springs, Maryland, USA)J. Miller (WMO, Geneva, Switzerland)D. Offermann (University of Wuppertal, Germany)S. Oltmans (NOAA/CMDL, Boulder, Colorado, USA)R. Randel (NCAR, Bolder, USA)W. Planet (NOAA-NESDIS, Camp Springs, MD, USA)U. Platt (University of Heidelberg, Germany)M. Schoeberl (NASA GSFC, Greenbelt, Maryland, USA)P. Simon (Belgian Institute for Space Aeronomy, Brussels, Belgium)Y. Timofeyev (St. Petersburg State University, Russia)D. Wardle (Meteorological Service of Canada, Downsview, Canada)

81
ANNEX B
TABLES OF USER REQUIREMENTS

82
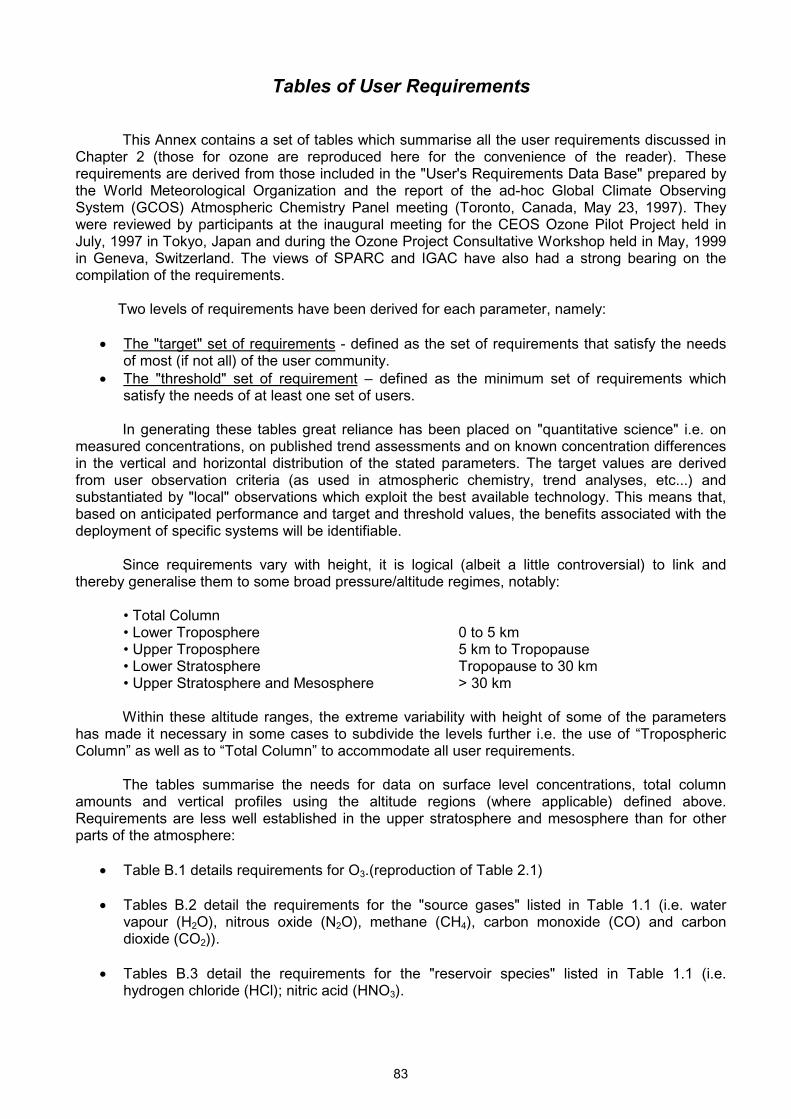
83
Tables of User Requirements
This Annex contains a set of tables which summarise all the user requirements discussed inChapter 2 (those for ozone are reproduced here for the convenience of the reader). Theserequirements are derived from those included in the "User's Requirements Data Base" prepared bythe World Meteorological Organization and the report of the ad-hoc Global Climate ObservingSystem (GCOS) Atmospheric Chemistry Panel meeting (Toronto, Canada, May 23, 1997). Theywere reviewed by participants at the inaugural meeting for the CEOS Ozone Pilot Project held inJuly, 1997 in Tokyo, Japan and during the Ozone Project Consultative Workshop held in May, 1999in Geneva, Switzerland. The views of SPARC and IGAC have also had a strong bearing on thecompilation of the requirements.
Two levels of requirements have been derived for each parameter, namely:
• The "target" set of requirements - defined as the set of requirements that satisfy the needsof most (if not all) of the user community.
• The "threshold" set of requirement – defined as the minimum set of requirements whichsatisfy the needs of at least one set of users. In generating these tables great reliance has been placed on "quantitative science" i.e. on
measured concentrations, on published trend assessments and on known concentration differencesin the vertical and horizontal distribution of the stated parameters. The target values are derivedfrom user observation criteria (as used in atmospheric chemistry, trend analyses, etc...) andsubstantiated by "local" observations which exploit the best available technology. This means that,based on anticipated performance and target and threshold values, the benefits associated with thedeployment of specific systems will be identifiable.
Since requirements vary with height, it is logical (albeit a little controversial) to link andthereby generalise them to some broad pressure/altitude regimes, notably:
• Total Column • Lower Troposphere 0 to 5 km • Upper Troposphere 5 km to Tropopause • Lower Stratosphere Tropopause to 30 km • Upper Stratosphere and Mesosphere > 30 km
Within these altitude ranges, the extreme variability with height of some of the parameters
has made it necessary in some cases to subdivide the levels further i.e. the use of “TroposphericColumn” as well as to “Total Column” to accommodate all user requirements.
The tables summarise the needs for data on surface level concentrations, total columnamounts and vertical profiles using the altitude regions (where applicable) defined above.Requirements are less well established in the upper stratosphere and mesosphere than for otherparts of the atmosphere:
• Table B.1 details requirements for O3.(reproduction of Table 2.1) • Tables B.2 detail the requirements for the "source gases" listed in Table 1.1 (i.e. water
vapour (H2O), nitrous oxide (N2O), methane (CH4), carbon monoxide (CO) and carbondioxide (CO2)).
• Tables B.3 detail the requirements for the "reservoir species" listed in Table 1.1 (i.e.
hydrogen chloride (HCl); nitric acid (HNO3).

84
• Tables B.4 detail the requirements for the "free radicals" listed in Table 1.1 (i.e. bromineoxide (BrO), chlorine monoxide (ClO), nitrogen dioxide (NO2) and nitric oxide (NO)).
• Tables B.5 detail the requirements for temperature and wind (for water vapour see Table
B.2a).
• Tables B.6 detail the requirements for aerosols and polar stratospheric clouds.
It should be noted that in Table B.2e the target values for CO2 in the troposphere are set tomeet the most stringent requirements for trend detection (currently 0.36 ppm/year and onlydetectable through surface-based observations). The target values for horizontal resolution (10 km)are set to allow detection of "hot spots" of CO2 emission from satellites (total column). Lowerstratospheric CO2 measurements are important for obtaining the seasonal cycle of CO2 which hasan amplitude of about 4 ppm in the tropics (transport process studies). Upper stratospheric CO2
measurements reflect only the annual increase. In addition, height resolved stratospheric CO2
measurements are used for deriving temperature.

85
Table B.1: Target and threshold requirements for ozone (O3 ) - greenhouse gas, ultraviolet shield and air pollutant. Targetrequirements for bias error and RMS error are consistent with trend requirements. Threshold requirements satisfy the needs of
at least one user group.
RegionHorizontal
Resolution (km)Vertical Resolution
(km)RMS Error
(by volume)Bias Error
(by volume)Temporal Res.
(observing cycle; hrs)Trend Detection(with continuity)
Threshold Target Threshold Target Threshold Target Threshold Target Threshold Target % per year
LowerTroposphere
250 <10* 5 0.5 20%or 4 ppb
3 % or1 ppb
30%or 6 ppb
5% or2 ppb
168 3 0.5
UpperTroposphere
250 50 5 0.5 20%or 4 ppb
3 % or1 ppb
30%or 6 ppb
5% or2 ppb
168 3 0.5
LowerStratosphere
250 50 3 0.5 15%or 100 ppb
3% or20 ppb
20%or 150 ppb
5% or40 ppb
168 3 0.3
UpperStratosphere/Mesosphere
250 50 6 0.5 15%or 75 ppb
3% or20 ppb
20%or 100 ppb
5% or30 ppb
48 3 0.3
Total Column 100 10 - - 5%or 6 DU
1% or3 DU
5% or6 DU
1% or3 DU
24 6 0.1
Total Column(Troposphere)
100 10 - - 15% or 6DU
5% or3 DU
15% or6 DU
5% or3 DU
24 6 0.5
Note * - Lower range due to air quality user/process study requirements.

86
Table B.2a: Target and threshold requirements for water vapour (H2O) - climate gas and OH-precursor (specific humidity:ratio of mass of water vapour to the mass of moist air, units g / kg.). Target requirements for bias error and RMS error are
consistent with trend requirements. Threshold requirements satisfy the needs of at least one user group.
RegionHorizontal
Resolution (km)Vertical Resolution
(km)RMS Error(by mass)10-3g/kg
Bias Error(by mass)
10-3gkg
Temporal Resolution(observing cycle; hrs)
TrendDetection
(% per year)
Threshold Target Threshold Target Threshold Target Threshold Target Threshold Target
LowerTroposphere
500* 10* 2* 0.1* 1* 0.25* n/s* n/s* 12* 0.5* n/s*
UpperTroposphere
250 50 3 0.5 3 0.5 3 0.5 168 6 1
Lower1)
Stratosphere250 50 3 0.5 1 0.3 1 0.3 168 6 1 3)
UpperStratosphere/Mesosphere
250 50 3 0.5 1.5 0.4 1.5 0.4 168 6 14)
Total ColumnStratosphere2)
250 50 - - 1 0.3 1 0.3 168 6 1
Total Column(Troposphere)
500* 10* - - 500g/m2* 1000g/m2
*n/s* n/s* 12* 0.5* n/s*
Note * - Requirement for lower tropospheric water vapor comes from IGOS Upper Air Group (n/s – not specified)Note 1) - High resolution (<100 m) required near the hygropause.Note 2) - Based on average mixing ratio for the layer.Note 3) - Estimated currend trend <35 ppb/year in lower stratosphere.Note 4) - Estimated current trend 70 to 120 ppb/year.

87
Table B.2b: Target and threshold requirements for nitrous oxide (N2O ) - greenhouse gas and stratospheric chemistry (sourceof NO). Target requirements for bias error and RMS error are consistent with trend requirements. Threshold requirements
satisfy the needs of at least one user group.
RegionHorizontal
Resolution (km)Vertical Resolution
(km)RMS Error
(by volume)Bias Error
(by volume)Temporal Resolution
(observing cycle;days)
TrendDetection
(% per year)*
Threshold Target Threshold Target Threshold Target Threshold Target Threshold Target
LowerTroposphere
250 100 4 1 5 % or15 ppb
0.5 % or1.5 ppb
10% or30 ppb
1 % or3 ppb
7 0.5 0.5
UpperTroposphere
250 100 4 1 5 % or15 ppb
0.5 % or1.5 ppb
10% or30 ppb
1 % or3 ppb
7 0.5 0.5
LowerStratosphere
250 100 3 1 10% or20 ppb
2 % or 5ppb
20% or40 ppb
4 % or10 ppb
7 0.5 0.5
UpperStratosphere/Mesosphere
250 100 3 1 20% or40 ppb
5 % or10 ppb
30% or50 ppb
10% or20 ppb
7 0.5 0.5
Total Column 250 100 - - 5 % 1 % 10 % 2 % 7 0.5 0.5
Total Column(Troposphere)
250 100 - - 5 % 5% 10 % 2 % 7 0.5 0.5
Note* - Tropospheric concentration 300 to 330 ppb and current annual trend 0.6 ppb/year (0.2 %/year).

88
Table B.2c: Target and threshold requirements for methane (CH4) - greenhouse gas, stratospheric source of H2O and AtmosphericChemistry. Target requirements for bias error and RMS error are consistent with trend requirements. Threshold requirements satisfy
the needs of at least one user group.
RegionHorizontal
Resolution (km)Vertical Resolution
(km)RMS Error
(by volume)Bias Error
(by volume)Temporal Resolution
(observing cycle;days)
TrendDetection
(% per year)2)
Threshold Target Threshold Target Threshold Target Threshold Target Threshold Target
LowerTroposphere
250 10 1) 4 2 10 % or100 ppb
1 % or15 ppb
20% or200 ppb
2 % or30 ppb
7 0.5 0.5
UpperTroposphere
250 50 4 2 10 % or100 ppb
1 % or15 ppb
20% or200 ppb
2 % or30 ppb
7 0.5 0.5
LowerStratosphere
250 50 3 1 10 % or100 ppb
2 % or25 ppb
30% or200 ppb
5 % or50 ppb
7 0.5 0.5
UpperStratosphere/Mesosphere
250 50 3 1 10 % or100 ppb
2 % or25 ppb
30% or200 ppb
5 % or50 ppb
7 0.5 0.5
Total Column 250 50 - - 5 % 1 % 10 % 2 % 7 0.5 0.5
Total Column(Troposphere)
250 50 - - 5 % 1 % 10 % 2 % 7 0.5 0.5
Note 1) - To detect source regions.Note 2) - Tropospheric concentration 1.7 to 1.8 ppm, inter-hemispheric difference 150 ppb and current trend 5-10 ppb/year.

89
Table B.2d: Target and threshold requirements for carbon monoxide (CO) - precursor, atmospheric chemistry and air quality.Target requirements for bias error and RMS error are consistent with trend requirements. Threshold requirements satisfy the
needs of at least one user group.
RegionHorizontal
Resolution (km)Vertical Resolution
(km)RMS Error
(by volume)Bias Error
(by volume)Temporal Resolution(observing cycle; hrs)
TrendDetection
(% per year)
Threshold Target Threshold Target Threshold Target Threshold Target Threshold Target
LowerTroposphere3)
250 101) 2 0.5 20% or30 ppb
1 % or2 ppb
40% or60 ppb
2 % or4 ppb
24 6 22)
UpperTroposphere3)
250 101) 4 1 20% or30 ppb
1 % or2 ppb
40% or60 ppb
2 % or4 ppb
24 6 2
LowerStratosphere
250 50 5 2 15 % or12 ppb
5 % or2 ppb
25 % or20 ppb
10 %or
5 ppb
24 6 n.r 5)
Total Column4) 250 10 - - 10 % 1 % 20 % 2 % 24 6 2
Total Column(Troposphere)
250 10 - - 20 % 2% 40 % 5 % 24 6 2
Note 1) - Lower range due to air quality user/process study requirementsNote 2) - Based on current tropospheric trend of minus <2.3 ppb / year.Note 3) - N.H. background range in LT:100-240 ppb; S.H. in LT: 30-75 ppb; in LS 20 to 70 ppb in both Hemispheres.Note 4) -Total column density range : 0.5 to 3*10 14 molecules m -2.Note 5) - Not relevant.

90
Table B.2e: Target and threshold requirements for carbon dioxide (CO2) - precursor, atmospheric chemistry and air quality.Target requirements for bias error and RMS error are consistent with trend requirements. Threshold requirements satisfy the
needs of at least one user group.
RegionHorizontal
Resolution (km)Vertical Resolution
(km)RMS Error
(by volume)Bias Error
(by volume)Temporal Resolution
(observing cycle;days)
TrendDetection
(% per year)
Threshold Target Threshold Target Threshold Target Threshold Target Threshold Target
LowerTroposphere
5000 10 2 0.5 1 ppm 0.02 ppm 2 ppm 0.1 ppm 2 permonth
0.5 0.05
UpperTroposphere
5000 10 5 1 2 ppm 0.04 ppm 4 ppm 0.2 ppm 2 permonth
0.5 n.r
LowerStratosphere
5000 250 5 1 2 ppm 0.5 ppm 5 ppm 1 ppm 2 permonth
0.5 n.r
Total Column 5000 250 25 5 2 ppm 0.5 ppm 5 ppm 1 ppm 2 permonth
0.5 n.r
Total Column(Troposphere)
5000 10 n.r n.r 10% 0.5% 20% 1% 2 permonth
0.5 0.15
Note n.r. - Not relevant
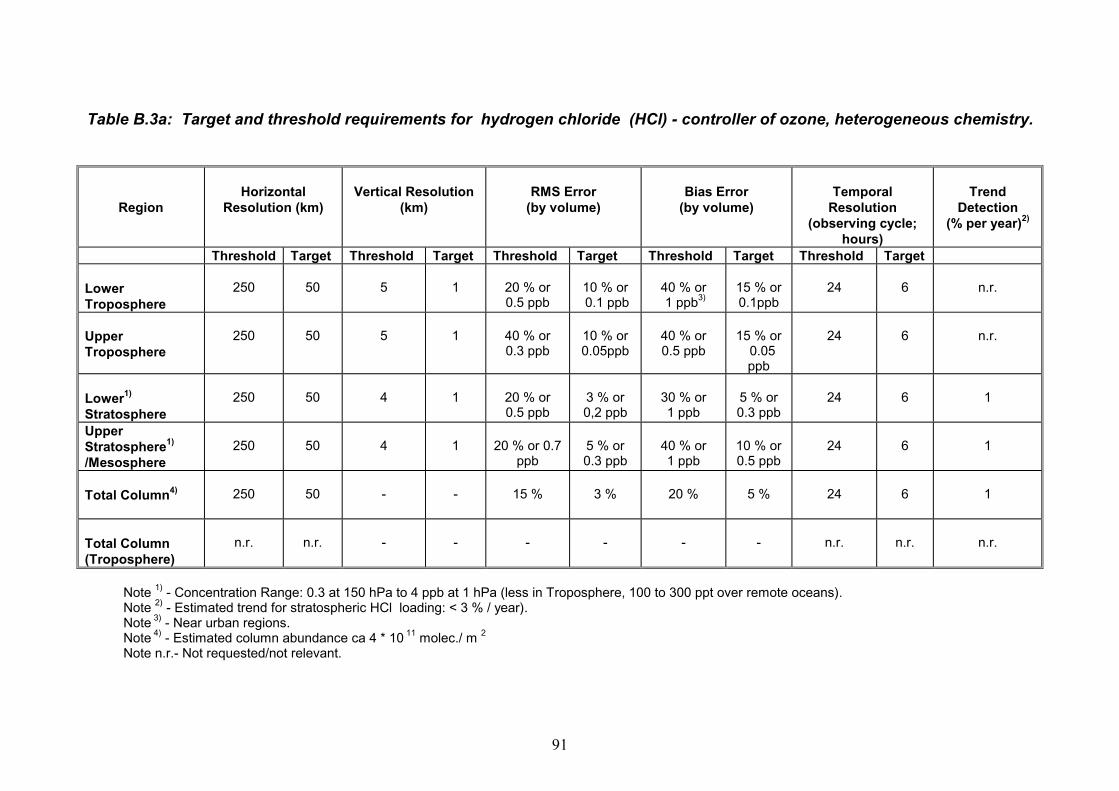
91
Table B.3a: Target and threshold requirements for hydrogen chloride (HCl) - controller of ozone, heterogeneous chemistry.
RegionHorizontal
Resolution (km)Vertical Resolution
(km)RMS Error
(by volume)Bias Error
(by volume)Temporal
Resolution(observing cycle;
hours)
TrendDetection
(% per year)2)
Threshold Target Threshold Target Threshold Target Threshold Target Threshold Target
LowerTroposphere
250 50 5 1 20 % or0.5 ppb
10 % or 0.1 ppb
40 % or 1 ppb3)
15 % or0.1ppb
24 6 n.r.
UpperTroposphere
250 50 5 1 40 % or0.3 ppb
10 % or0.05ppb
40 % or0.5 ppb
15 % or 0.05ppb
24 6 n.r.
Lower1)
Stratosphere250 50 4 1 20 % or
0.5 ppb3 % or0,2 ppb
30 % or1 ppb
5 % or0.3 ppb
24 6 1
UpperStratosphere1)
/Mesosphere250 50 4 1 20 % or 0.7
ppb5 % or0.3 ppb
40 % or1 ppb
10 % or0.5 ppb
24 6 1
Total Column4) 250 50 - - 15 % 3 % 20 % 5 % 24 6 1
Total Column(Troposphere)
n.r. n.r. - - - - - - n.r. n.r. n.r.
Note 1) - Concentration Range: 0.3 at 150 hPa to 4 ppb at 1 hPa (less in Troposphere, 100 to 300 ppt over remote oceans).Note 2) - Estimated trend for stratospheric HCl loading: < 3 % / year).Note 3) - Near urban regions.Note 4) - Estimated column abundance ca 4 * 10 11 molec./ m 2
Note n.r.- Not requested/not relevant.

92
Table B.3b: Target and threshold requirements for nitric acid (HNO3) - precursor and controller. Target requirements for biaserror and RMS error are consistent with trend requirements. Threshold requirements satisfy the needs of at least one
user group.
RegionHorizontal
Resolution (km)Vertical Resolution
(km)RMS Error
(by volume)Bias Error
(by volume)Temporal Resolution(observing cycle; hrs)
Threshold Target Threshold Target Threshold Target Threshold Target Threshold Target
LowerTroposphere
250 101) 3 0.5 40% or1 ppb2)
10% or0.1 ppb
50% or2 ppb2)
15% or0.2 ppb
24 6
UpperTroposphere
250 101) 3 0.5 40% or 200ppt
10% or75 ppt
50% or500 ppt
15% or 100ppt
24 6
LowerStratosphere
250 50 4 0.5 30%or 1 ppb
10% or40 ppt
40% or2 ppb
15% or250 ppt
24 6
UpperStratosphere/Mesosphere
250 50 4 0.5 30% or1 ppb
10% or100 ppt
40% or2 ppb
15% or250 ppt
24 6
Total Column 250 10 - - 10 % 1 % 20 % 2 % 24 6
Total Column(Troposphere)
250 10 - - 10 % 1 % 20 % 2 % 24 6
Note 1) - Range due to air quality user/process study requirements.
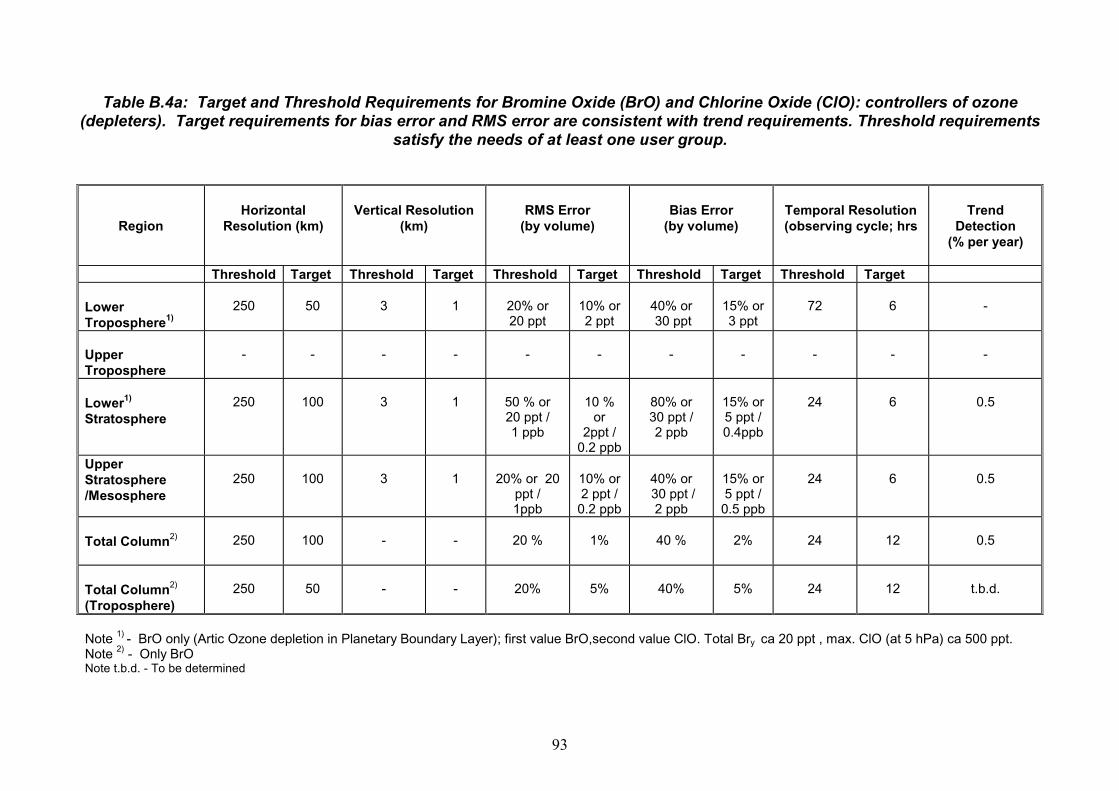
93
Table B.4a: Target and Threshold Requirements for Bromine Oxide (BrO) and Chlorine Oxide (ClO): controllers of ozone(depleters). Target requirements for bias error and RMS error are consistent with trend requirements. Threshold requirements
satisfy the needs of at least one user group.
RegionHorizontal
Resolution (km)Vertical Resolution
(km)RMS Error
(by volume)Bias Error
(by volume)Temporal Resolution(observing cycle; hrs
TrendDetection
(% per year)
Threshold Target Threshold Target Threshold Target Threshold Target Threshold Target
LowerTroposphere1)
250 50 3 1 20% or20 ppt
10% or2 ppt
40% or 30 ppt
15% or3 ppt
72 6 -
UpperTroposphere
- - - - - - - - - - -
Lower1)
Stratosphere250 100 3 1 50 % or
20 ppt /1 ppb
10 %or
2ppt /0.2 ppb
80% or30 ppt /2 ppb
15% or5 ppt /0.4ppb
24 6 0.5
UpperStratosphere/Mesosphere
250 100 3 1 20% or 20ppt /1ppb
10% or2 ppt /0.2 ppb
40% or 30 ppt /2 ppb
15% or5 ppt /0.5 ppb
24 6 0.5
Total Column2) 250 100 - - 20 % 1% 40 % 2% 24 12 0.5
Total Column2)
(Troposphere)250 50 - - 20% 5% 40% 5% 24 12 t.b.d.
Note 1) - BrO only (Artic Ozone depletion in Planetary Boundary Layer); first value BrO,second value ClO. Total Bry ca 20 ppt , max. ClO (at 5 hPa) ca 500 ppt.Note 2) - Only BrONote t.b.d. - To be determined

94
Table B.4b: Target and threshold requirements for nitric oxide (NO) and nitrogen dioxide (NO2) - precursor and controller.Target requirements for bias error and RMS error are consistent with trend requirements. Threshold requirements satisfy the
needs of at least one user group.
RegionHorizontal
Resolution (km)Vertical Resolution
(km)RMS Error
(by volume)Bias Error
(by volume)Temporal Resolution(observing cycle; hrs
Threshold Target Threshold Target Threshold Target Threshold Target Threshold Target
LowerTroposphere
250 101) 3 0.5 40%or 10 ppt
10% or2 ppt
50% or15 ppt
15% or3 ppt
24 6
UpperTroposphere
250 30 3 0.5 40%or 20 ppt
10% or3 ppt
50% or20 ppt
15% or 5 ppt
24 6
LowerStratosphere
250 30 4 0.5 30%or 100 ppt
10% or40 ppt
40% or150 ppt
15% or50 ppt
24 6
UpperStratosphere/Mesosphere
250 30 4 0.5 30%or 150 ppt
10% or50 ppt
40% or250 ppt
15% or75 ppt
24 6
Total ColumnNO2 only2)
250 30 - - 10 % 1 % 20 % 2 % 24 6
Total Column(Troposphere)
250 30 - - 10 % 1 % 20 % 2 % 24 6
Note 1) - Lower range due to air quality user/process study requirementsNote 2) - Total column density range: 2* 10 10 to 2*10 12 molecules m -2 (day/night difference taken into account)

95
Table B.5a: Requirements for temperature (requirements from the IGOS Upper Air Group). Target requirements for bias errorand RMS error are consistent with trend requirements. Threshold requirements satisfy the needs of at least one user group.
RegionHorizontal
Resolution (km)Vertical Resolution
(km)RMS Error Bias Error Temporal Resolution
(observing cycle;hours)
Threshold Target Threshold Target Threshold Target Threshold Target Threshold Target
LowerTroposphere 500 10 3.0 0.1 3.0K 0.5K n/s n/s 24 6
UpperTroposphere 500 10 3.0 0.5 3.0K 0.5K n/s n/s 24 6
LowerStratosphere 500 10 3.0 0.5 3.0K 0.5K n/s n/s 24 6
UpperStratosphere/Mesosphere
500 50 10.0 1.0 5.0K 0.5K n/s n/s 24 6
Note n/s – Not specified

96
Table B.5b: Requirements for wind data (requirements from the IGOS Upper Air Group). Target requirements for bias error andRMS error are consistent with trend requirements. Threshold requirements satisfy the needs of at least one user group.
RegionHorizontal
Resolution (km)Vertical Resolution
(km)RMS Error Bias Error Temporal Resolution
(observing cycle;days)
Threshold Target Threshold Target Threshold Target Threshold Target Threshold Target
LowerTroposphere 500
10 50.1 10 m/s 1 m/s
n/s n/s12/24 1/48
UpperTroposphere 500 10 10 0.5 10 1 n/s n/s 12/24 1/48
LowerStratosphere 500 10 10 0.5 10 1 n/s n/s 12/24 1/48
UpperStratosphere/Mesosphere
500 50 5 2.0 10 3 n/s n/s 6/24 3/24
Note n/s – Not specified
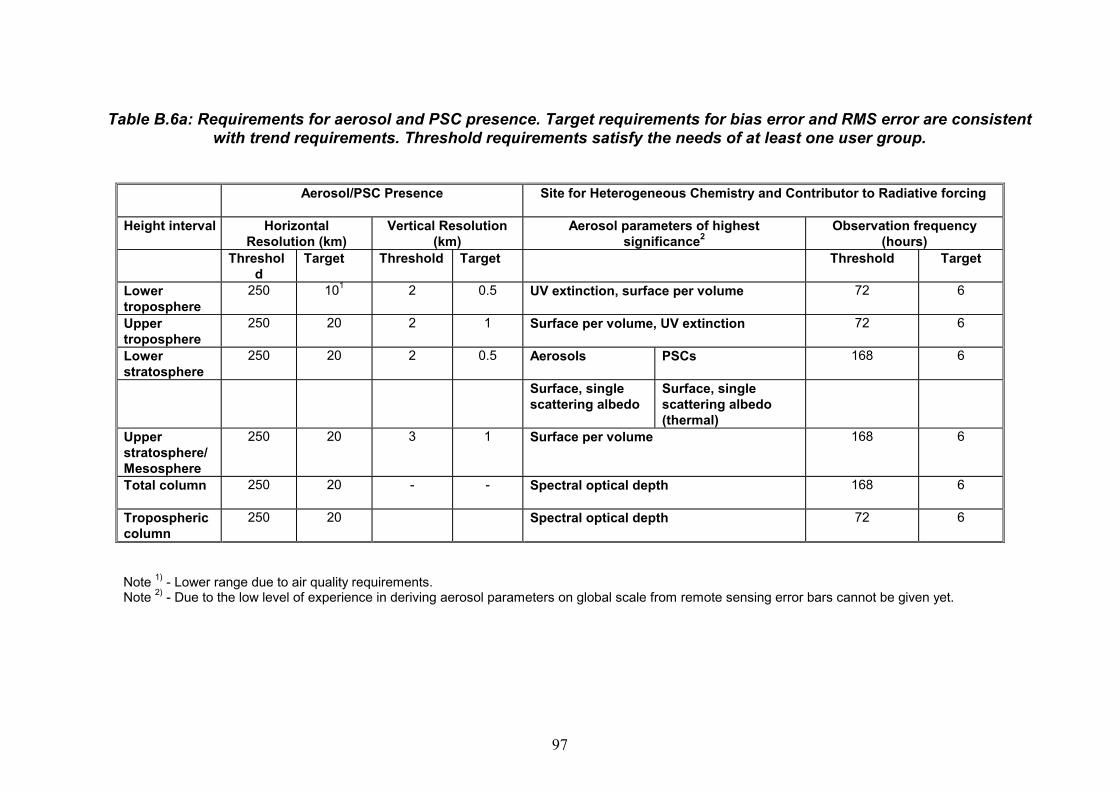
97
Table B.6a: Requirements for aerosol and PSC presence. Target requirements for bias error and RMS error are consistentwith trend requirements. Threshold requirements satisfy the needs of at least one user group.
Aerosol/PSC Presence Site for Heterogeneous Chemistry and Contributor to Radiative forcing
Height interval HorizontalResolution (km)
Vertical Resolution(km)
Aerosol parameters of highestsignificance2
Observation frequency(hours)
Threshold
Target Threshold Target Threshold Target
Lowertroposphere
250 101 2 0.5 UV extinction, surface per volume 72 6
Uppertroposphere
250 20 2 1 Surface per volume, UV extinction 72 6
Lowerstratosphere
250 20 2 0.5 Aerosols PSCs 168 6
Surface, singlescattering albedo
Surface, singlescattering albedo(thermal)
Upperstratosphere/Mesosphere
250 20 3 1 Surface per volume 168 6
Total column 250 20 - - Spectral optical depth 168 6
Troposphericcolumn
250 20 Spectral optical depth 72 6
Note 1) - Lower range due to air quality requirements.Note 2) - Due to the low level of experience in deriving aerosol parameters on global scale from remote sensing error bars cannot be given yet.

98
Table B.6 b: Target and threshold requirements for aerosol extinction (nadir and limb) and derived parameters ( sunphotometry orshadow-band radiometry for ground-based measurements) - heterogeneous chemistry and climate impact and atmospheric
correction. Target requirements for bias error and RMS error are consistent with trend requirements. Threshold requirements satisfythe needs of at least one user group.
RegionHorizontal
Resolution (km)Vertical Resolution
(km)RMS Error(Precision)
AOD 6)
Bias Error(Accuracy)
AOD 6)
Temporal Resolution(observing cycle;
hrs)
Trend(% peryear)
Threshold Target Threshold Target Threshold Target Threshold Target Threshold TargetLowerStratosphere1) 250 20 3 0.1 0.01 0.001 0.05 0.002 168 6
1 % or>20%5)
UpperTroposphere1) 250 20 3 0.1 0.02 0.005 0.05 0.01 72 6 1 %
Total ColumnStratosphere2) 250 20 - - 0.15 2) 0.004 0.2 5) 0.006 168 6
1 % or>20 % 5)
Total ColumnTroposphere3) 250 20 - - 0.2 0.01 0.3 0.02 72 6 1 %
Total Column 250 20 - - 0.2 0.004 0.3 0.006 168 6 1 %
LowerTroposphere3) 250 104) 3 0.1 0.05 0.01 0.07 0.02 72 6 1 %
Note 1) - From limb measurements at defined tangent heights.Note 2) - Integrated over stratospheric limb profile.Note 3) - Combining nadir and limbNote 4) - Lower range due to air quality user requirements: visual range.Note 5)- Larger value to detect major volcanic aerosol build up and decay in stratosphere.Note 6) - Aerosol Optical Depth: I / I0 = exp ( - AOD * air mass factor); Rayleigh scatter and gas- absorption subtracted; there exists significant dynamic
ranges of AOD in loer stratosphere for background and volcanic eruptions and in lower troposphere, upper troposphere for background andduststorms, pollution episodes which are reflected in target and threshold values.

99
Table B.6c: Target and threshold requirements for aerosol size distribution, surface area, volume (derived parameters) andcomposition - heterogeneous ozone chemistry and climate. Target requirements for bias error and RMS error are consistent
with trend requirements. Threshold requirements satisfy the needs of at least one user group.
RegionHorizontal
Resolution (km)Vertical Resolution
(km)RMS Error
(precision1) -% for allparameters)
Bias Error(accuracy1)- % for all
parameters)
Temporal Resolution(observing cycle;
hrs)
Threshold Target Threshold Target Threshold Target Threshold Target Threshold Target
LowerTroposphere
250 102) 3 0.1 20 5 30 5 72 6
UpperTroposphere
250 20 3 0.1 30 10 50 10 72 6
LowerStratosphere
250 20 3 0.1 30 5 50 10 168 6
Total ColumnStratosphere
250 20 - - 30 5 40 10 168 6
Total Column n.r. n.r. - - n.r. n.r. n.r. n.r. n.r. n.r.
Note 1) - Expressed as percent deviation from reference method: in situ determination of size distribution and composition (in stratosphere: Wyoming dust sonde;in troposphere: aerosol size distribution instruments; for compostion: filter collection followed by chemical analysis). Volume at 20 km: 0.05 to 10 cubicmicrometers. Lower range due to air quality user requirements.
Note n.r.- Not relevant / not requested.

100
Table B.6d: Target and threshold requirements for aerosol backscatter (mid-visible) and derived parameters (radio sondesform calibration basis for profiling from ground stations). Target requirements for bias error and RMS error are consistent with
trend requirements. Threshold requirements satisfy the needs of at least one user group.
RegionHorizontal
Resolution (km)Vertical Resolution
(km)RMS Error Bias Error Temporal Resolution
(observing cycle;hrs)
TrendDetection
(% per year)
Threshold Target Threshold Target Threshold Target Threshold Target Threshold Target
LowerTroposphere
250 101) 2 0.05 t.b.d. t.b.d. t.b.d. t.b.d. 72 6 t.b.d
UpperTroposphere
250 20 2 0.05 t.b.d. t.b.d. t.b.d. t.b.d. 72 6 t.b.d
Lower3)
Stratosphere250 20 2 0.05 0.1*R3) 0.01*R3) 0.2*R3) 0.02*R3) 168 6 1% or
>20% 2)
UpperStratosphere/Mesosphere
250 20 - - 1*E-4
1 / sr 2)5*E-6
1 / sr3*E-4
1 / sr 2)1.5*E-5
1 / sr168 6 1% or
>20 % 2)
Total Column 250 20 - - t.b.d. t.b.d. t.b.d. t.b.d. 168 6 t.b.d.
Total Column(Troposphere)
250 20 - - t.b.d. t.b.d. t.b.d. t.b.d. 72 6 t.b.d.
Note 1) - Lower range due to air quality user/process study requirements.Note 2)- Upper range to detect major volcanic aerosol build up and decay in stratosphere.Note 3) - R = Rayleigh.Note t.b.d.- Local density profile and chemical composition must be known at the time and place of backscatter measurement (due to local variability currentlyunknown).
101
ANNEX C
THE DATA RECORDS OF REGULARLY REPORTINGGROUND-BASED OZONE STATIONS

102
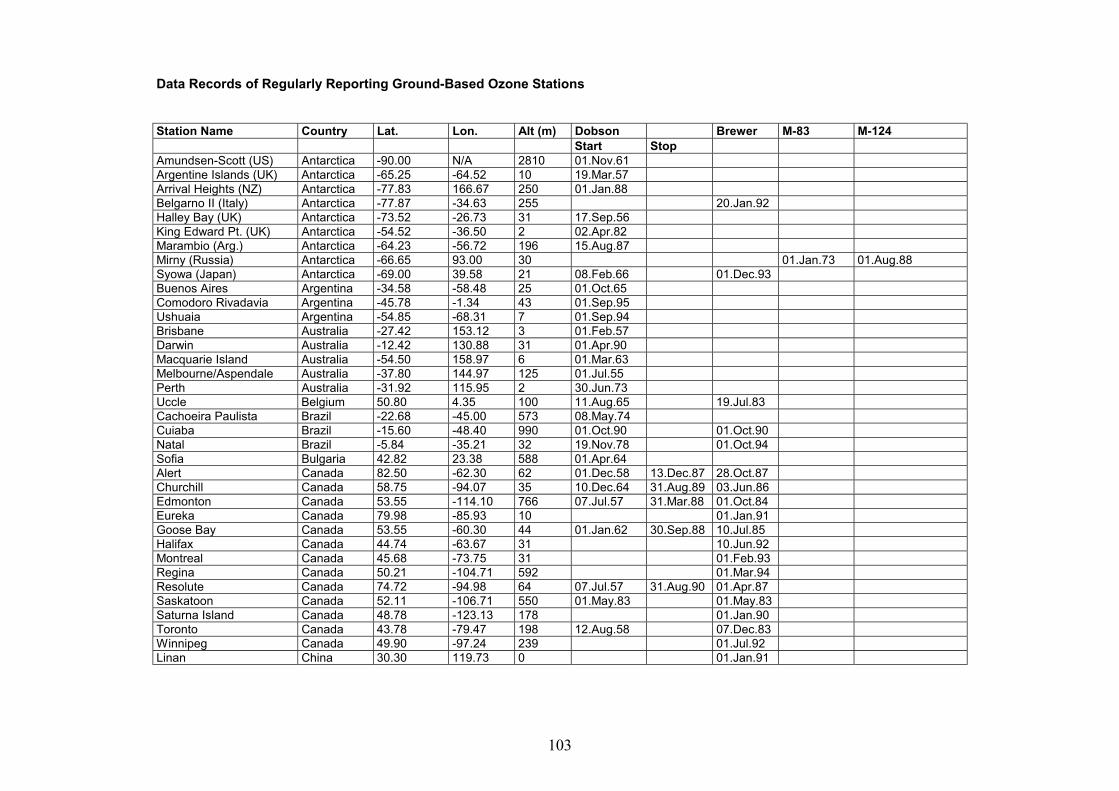
103
Data Records of Regularly Reporting Ground-Based Ozone Stations
Station Name Country Lat. Lon. Alt (m) Dobson Brewer M-83 M-124Start Stop
Amundsen-Scott (US) Antarctica -90.00 N/A 2810 01.Nov.61Argentine Islands (UK) Antarctica -65.25 -64.52 10 19.Mar.57Arrival Heights (NZ) Antarctica -77.83 166.67 250 01.Jan.88Belgarno II (Italy) Antarctica -77.87 -34.63 255 20.Jan.92Halley Bay (UK) Antarctica -73.52 -26.73 31 17.Sep.56King Edward Pt. (UK) Antarctica -54.52 -36.50 2 02.Apr.82Marambio (Arg.) Antarctica -64.23 -56.72 196 15.Aug.87Mirny (Russia) Antarctica -66.65 93.00 30 01.Jan.73 01.Aug.88Syowa (Japan) Antarctica -69.00 39.58 21 08.Feb.66 01.Dec.93Buenos Aires Argentina -34.58 -58.48 25 01.Oct.65Comodoro Rivadavia Argentina -45.78 -1.34 43 01.Sep.95Ushuaia Argentina -54.85 -68.31 7 01.Sep.94Brisbane Australia -27.42 153.12 3 01.Feb.57Darwin Australia -12.42 130.88 31 01.Apr.90Macquarie Island Australia -54.50 158.97 6 01.Mar.63Melbourne/Aspendale Australia -37.80 144.97 125 01.Jul.55Perth Australia -31.92 115.95 2 30.Jun.73Uccle Belgium 50.80 4.35 100 11.Aug.65 19.Jul.83Cachoeira Paulista Brazil -22.68 -45.00 573 08.May.74Cuiaba Brazil -15.60 -48.40 990 01.Oct.90 01.Oct.90Natal Brazil -5.84 -35.21 32 19.Nov.78 01.Oct.94Sofia Bulgaria 42.82 23.38 588 01.Apr.64Alert Canada 82.50 -62.30 62 01.Dec.58 13.Dec.87 28.Oct.87Churchill Canada 58.75 -94.07 35 10.Dec.64 31.Aug.89 03.Jun.86Edmonton Canada 53.55 -114.10 766 07.Jul.57 31.Mar.88 01.Oct.84Eureka Canada 79.98 -85.93 10 01.Jan.91Goose Bay Canada 53.55 -60.30 44 01.Jan.62 30.Sep.88 10.Jul.85Halifax Canada 44.74 -63.67 31 10.Jun.92Montreal Canada 45.68 -73.75 31 01.Feb.93Regina Canada 50.21 -104.71 592 01.Mar.94Resolute Canada 74.72 -94.98 64 07.Jul.57 31.Aug.90 01.Apr.87Saskatoon Canada 52.11 -106.71 550 01.May.83 01.May.83Saturna Island Canada 48.78 -123.13 178 01.Jan.90Toronto Canada 43.78 -79.47 198 12.Aug.58 07.Dec.83Winnipeg Canada 49.90 -97.24 239 01.Jul.92Linan China 30.30 119.73 0 01.Jan.91

104
Data Records of Regularly Reporting Ground-Based Ozone Stations
Station Name Country Lat. Lon. Alt (m) Dobson Brewer M-83 M-124Start Stop
Longfengshan China 44.75 127.60 UNK 01.Jan.91Mt. Waliguan China 36.17 100.43 3816 01.Sep.93Xianghe China 39.98 116.37 80 01.Jan.79Hradev Kralove Czech Rep. 50.18 15.83 285 01.Jan.61 15.Dec.93Copenhagen Denmark 55.72 12.56 50 01.Jun.92Aswan Egypt 23.97 32.45 190 01.Dec.84Cairo Egypt 30.08 31.28 37 01.Nov.67Sodankyla Finland 67.40 26.60 179 01.May.88Biscarrosse/SMS France 44.73 -1.23 18 16.Mar.76Haute Provence France 43.93 5.70 684 02.Sep.83Magny-Les-Hameaux France 48.73 2.07 165 12.Jun.80Tbilisi Georgia 41.68 44.95 490 01.Jan.74 01.Jun.86Cologne Germany 50.93 6.93 50 01.Jan.76Hohenpeissenberg Germany 47.80 11.02 975 11.May.67 01.Jan.86Lindenberg Germany 52.21 14.12 112 01.Jan.92 01.Jan.92Potsdam Germany 52.22 13.05 89 01.Jan.64 01.May.87Athens Greece 37.98 23.73 10 01.Oct.89Thessaloniki Greece 40.51 22.97 50 12.Mar.82Sondrestrom Greenland 67.00 -50.62 300 28.Jun.89Budapest-Lorinc Hungary 47.43 19.18 139 01.Jan.70Reykjavik Iceland 64.13 -21.90 60 19.Jan.61Ahmedabad India 23.03 72.65 55 24.Jan.60Kodaikanal India 10.23 77.47 2343 01.Jul.57 01.Mar.94Mt. Abu India 24.60 72.70 1220 27.May.57New Delhi India 28.65 77.22 220 01.Jan.55 15.Mar.94Poona India 18.53 73.85 559 01.Mar.73Srinagar India 34.10 74.80 1586 25.Nov.56Varanasi India 25.32 83.03 76 01.Dec.63Valentia Ireland 51.93 -10.25 14 01.Jan.92Brindisi Italy 40.65 17.95 5 01.Sep.82Cagilari/Elmas Italy 39.25 9.05 240 30.Jun.54Ispra (Varese) Italy 45.80 8.63 240 01.Jan.92Messina Italy 38.20 15.55 51 01.Jan.87 01.Jan.87Naples Italy 40.85 15.25 45 10.Apr.58Rome Italy 40.90 12.52 UNK 01.Jan.86Sestola Italy 44.22 10.77 1030 01.Jan.76 01.Jan.90

105
Data Records of Regularly Reporting Ground-Based Ozone Stations
Station Name Country Lat. Lon. Alt (m) Dobson Brewer M-83 M-124Start Stop
Vigna Di Valle Italy 42.08 12.22 262 10.Jan.56 17.Jul.86Kagoshima Japan 31.55 130.55 31 01.Nov.63
Minamitorishima Japan 24.30 143.97 9 15.Nov.93Naha Japan 26.20 130.55 27 01.Apr.74
Sapporo Japan 43.05 141.33 19 10.Oct.61Tsukuba/Tateno Japan 36.05 140.10 21 13.Apr.59
Alma-Ata Kazakhstan 43.23 76.93 847 01.Jan.73 01.Aug.85Aralskoe More Kazakhstan 46.78 61.67 56 01.Jan.74 01.Jul.85Atiray (Gurev) Kazakhstan 47.03 41.85 0 01.Jan.74 01.Aug.84
Karaganda Kazakhstan 49.80 73.13 553 01.Jan.73 01.Aug.84Semiplatinsk Kazakhstan 50.35 80.25 206 01.Nov.75 01.Jul.85
Nairobi Kenya -1.27 -36.80 1710 19.Apr.84Pohang Korea 36.03 129.38 6 01.Jan.94Seoul Korea 37.57 126.95 84 07.May.84Riga Latvia 57.19 24.25 7 26.Feb.73 16.Aug.84
Petaling Jaya Malaysia 3.10 101.65 46 01.Oct.92Mexico City Mexico 19.33 -99.18 2268 01.Jun.74Casablanca Morocco 33.57 -7.67 55 29.May.89 29.May.89
Maputo Mozambique -25.97 -48.40 70 11.May.79 01.Jan.91DeBilt Netherlands 52.00 5.18 1 17.Dec.93
Invercargill New Zealand -46.42 168.32 1 01.Jan.70 30.Sep.87Lauder New Zealand -45.03 169.68 370 01.Jan.87Lagos Nigeria 6.60 3.33 10 01.Apr.93
Ny Alesund Norway 78.89 11.88 15 01.Nov.66Oslo Norway 59.91 10.72 90 17.Jun.69 01.May.90
Tromso Norway 69.65 18.95 100 01.Jan.43 01.Jan.94Quetta Pakistan 30.11 66.57 1721 01.Jun.57
Huancayo Peru -12.05 -75.32 3313 14.Feb.62 31.Dec.92Manila Philipines 14.63 121.83 61 06.Dec.78Belsk Poland 51.84 20.79 180 20.Mar.63 12.Feb.91
Angra Do Heroismo Portugal 38.66 -27.22 74 11.Jul.92Funchal (Madeira) Portugal 40.42 -7.55 49 01.Oct.89
Lisbon Portugal 38.77 -9.15 105 30.Jun.67 01.Jul.89Penhas Douradas Portugal 40.42 -7.55 1380 15.Oct.94
Kunming PR China 25.03 102.68 1917 01.Jan.80Bucharest Romania 44.48 26.13 100 01.Jan.80

106
Data Records of Regularly Reporting Ground-Based Ozone Stations
Station Name Country Lat. Lon. Alt (m) Dobson Brewer M-83 M-124Start Stop
Archangelsk Russia 64.58 40.50 UNK 01.Aug.73 01.Jul.84Bolshaya Elan Russia 46.92 142.73 22 01.Jan.74 01.Jul.83Dikson Island Russia 73.50 80.23 18 01.Mar.73 01.Apr.85Ekaterinburg Russia 56.80 60.63 290 01.Jan.73 01.Sep.85Hanty Mansijsk Russia 60.97 69.07 40 01.Jan.74 01.Sep.84Heiss Island Russia 80.62 58.10 20 01.Jan.90 01.Jan.74 01.Mar.87Igarka Russia 67.47 86.57 20 01.Mar.73 01.Jan.87Irkutsk Russia 52.26 104.35 467 01.Jan.73 01.Jul.85Kislovodsk Russia 43.73 42.66 2070 01.Mar.89Kotelnyj Island Russia 76.00 137.90 UNK 01.Feb.74 01.Jul.87Krasnoyarsk Russia 56.00 92.88 137 01.Jan.73 01.Jul.85Markovo Russia 64.68 170.42 22 01.Feb.73 01.Aug.86Moscow Russia 55.75 37.67 187 01.Jan.91 01.Jan.73 01.Jul.84Murmansk Russia 68.97 33.05 46 01.Feb.73 01.Jul.85Nagaevo Russia 59.58 150.78 118 01.Feb.73 01.Aug.85Nikolaevsk-Na-Amure Russia 53.15 140.70 46 01.Jan.74 10.Jan.87Obninsk Russia 55.50 36.20 UNK 10.May.91Olenek Russia 68.50 112.43 127 01.Jan.74 01.Jan.87Omsk Russia 54.93 73.40 119 01.Jan.73 01.Aug.84Pechora Russia 65.12 57.10 61 01.Feb.73 01.Feb.85Petropavlovsk/Kamchatski Russia 53.15 140.70 78 01.Jan.73 01.Sep.84Samara (Kuibyshev) Russia 53.25 50.45 137 01.Jan.73 01.Sep.84St. Petersburg Russia 59.97 30.30 74 01.Jan.73 01.Jan.85Tiksi Russia 71.58 128.92 8 01.Apr.75 01.Jan.87Tura Russia 64.17 100.07 UNK 01.Jan.74 01.Aug.87Vitim Russia 59.45 112.58 186 01.Mar.73 01.Jan.87Vladivostok Russia 43.12 131.90 80 01.Jan.73 01.Aug.84Volgograd Russia 48.58 45.72 UNK 01.Oct.74 01.Jan.87Voronez Russia 51.70 39.17 147 01.Jan.74 01.Jul.84Yakutsk Russia 62.08 129.75 98 01.Jan.88 01.Feb.73 01.Oct.85Cimljansk Russia 47.73 42.25 64 01.Jan.74 01.Jul.85Poprad-Ganovce Slovakia 49.03 20.32 706 20.Aug.93Pretoria/Irene South Africa -25.73 28.18 1'524 01.Aug.89El Arenosillo Spain 37.10 -6.73 41 01.Jan.76Izana (Tenerife) Spain 28.29 -16.49 2367 01.May.91 01.May.91Madrid Spain 40.45 -3.72 UNK 01.Jan.91 01.Jan.91

107
Data Records of Regularly Reporting Ground-Based Ozone Stations
Station Name Country Lat. Lon. Alt (m) Dobson Brewer M-83 M-124Start Stop
Murcia Spain 38.00 1.17 69 01.May.95Norkoping Sweden 58.58 16.15 43 02.Feb.87Vindeln Sweden 64.24 19.77 225 01.Jan.92Arosa Switzerland 46.78 9.68 1840 23.Jul.26 01.Dec.88Dushanbe Tadzikhstan 38.58 68.78 825 01.Jan.73 01.Nov.84Chengkung Taiwan 23.10 121.37 0 01.Jan.90Taipei Taiwan 25.03 121.53 25 01.Jul.65 01.Jul.87Bangkok Thailand 12.67 100.61 53 01.Jan.78 01.Jan.97Songkhla Thailand 7.20 100.60 13 01.Jan.97Ashkabad Turkmenistan 37.97 58.33 227 01.Jan.74 01.Jul.87Cardzou Turkmenistan 39.08 63.60 191 01.Sep.74 01.Aug.84Bracknell UK 51.38 -0.78 70 01.Jan.67Camborne UK 50.22 -5.32 88 01.Jan.91Lerwick UK 60.13 -1.18 80 01.Mar.52Mahe (Seychelles) UK Islands -4.68 55.53 6 10.Nov.75St. Helena UK Islands -15.93 -5.65 460 18.Jan.77Fedosija Ukraine 45.03 35.38 26 01.Jan.73 01.Jul.84Kiev Ukraine 50.40 30.45 121 01.Jan.73 01.Jun.85Lwow Ukraine 49.82 23.95 325 01.Aug.74 01.Aug.85Odessa Ukraine 46.48 30.63 42 01.Jan.73 01.Aug.84Salto Uruguay -31.38 57.97 31 01.Apr.96Barrow USA 71.32 -
156.6011 05.Jun.86
Bismarck USA 46.77 -100.75
511 01.Jan.63
Boulder USA 40.03 -105.25
1640 03.Dec.63 01.Jan.86
Caribou USA 46.87 -68.03 192 01.Jan.63Fairbanks/Poker Flat USA 64.82 -
147.87138 06.Mar.84
Hanford/Fresno USA 36.32 -119.63
73 06.Oct.82
Mauna Loa USA 19.53 -155.58
3397 01.Dec.63 15.Nov.97
Nashville USA 36.25 -86.57 182 01.Jan.63Samoa USA -14.25 -
170.5682 01.Dec.75
Tallahassee USA 30.40 -84.35 21 01.May.64Wallops Island USA 37.93 -75.48 13 23.Jun.67

108

109
ANNEX D
EXAMPLES OF AIRBORNE RESEARCH CAMPAIGNS

110
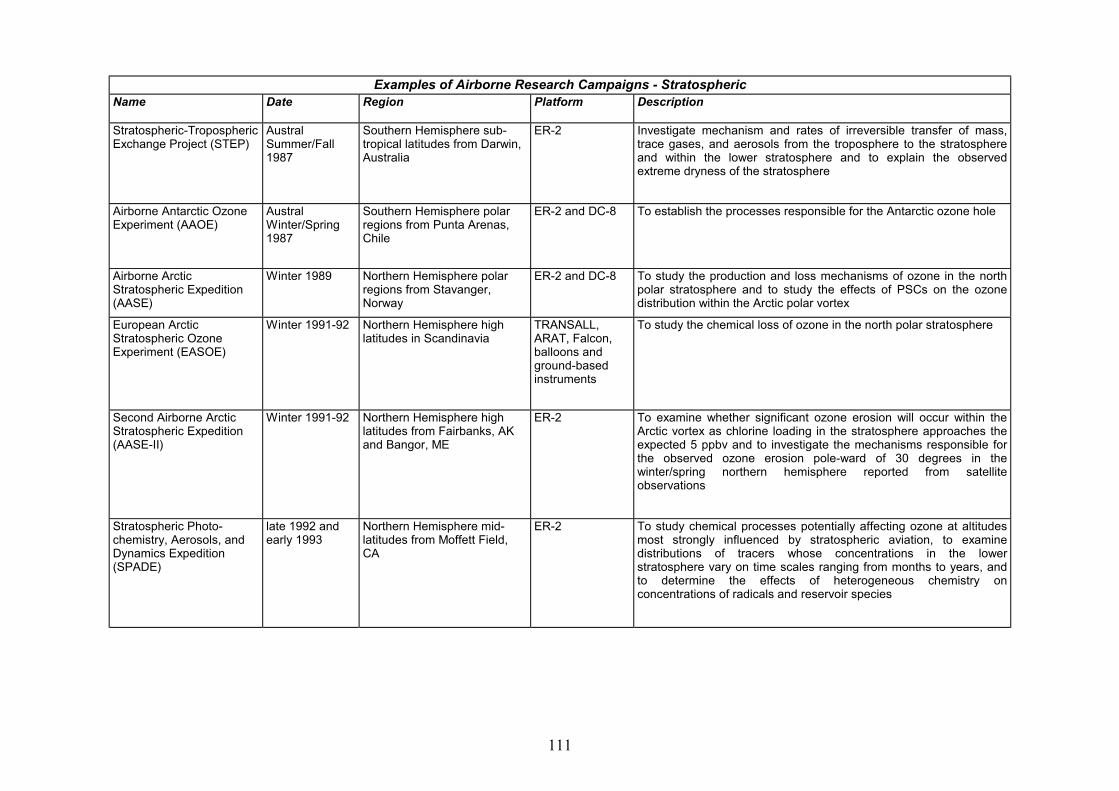
111
Examples of Airborne Research Campaigns - StratosphericName Date Region Platform Description
Stratospheric-TroposphericExchange Project (STEP)
AustralSummer/Fall1987
Southern Hemisphere sub-tropical latitudes from Darwin,Australia
ER-2 Investigate mechanism and rates of irreversible transfer of mass,trace gases, and aerosols from the troposphere to the stratosphereand within the lower stratosphere and to explain the observedextreme dryness of the stratosphere
Airborne Antarctic OzoneExperiment (AAOE)
AustralWinter/Spring1987
Southern Hemisphere polarregions from Punta Arenas,Chile
ER-2 and DC-8 To establish the processes responsible for the Antarctic ozone hole
Airborne ArcticStratospheric Expedition(AASE)
Winter 1989 Northern Hemisphere polarregions from Stavanger,Norway
ER-2 and DC-8 To study the production and loss mechanisms of ozone in the northpolar stratosphere and to study the effects of PSCs on the ozonedistribution within the Arctic polar vortex
European ArcticStratospheric OzoneExperiment (EASOE)
Winter 1991-92 Northern Hemisphere highlatitudes in Scandinavia
TRANSALL,ARAT, Falcon,balloons andground-basedinstruments
To study the chemical loss of ozone in the north polar stratosphere
Second Airborne ArcticStratospheric Expedition(AASE-II)
Winter 1991-92 Northern Hemisphere highlatitudes from Fairbanks, AKand Bangor, ME
ER-2 To examine whether significant ozone erosion will occur within theArctic vortex as chlorine loading in the stratosphere approaches theexpected 5 ppbv and to investigate the mechanisms responsible forthe observed ozone erosion pole-ward of 30 degrees in thewinter/spring northern hemisphere reported from satelliteobservations
Stratospheric Photo-chemistry, Aerosols, andDynamics Expedition(SPADE)
late 1992 andearly 1993
Northern Hemisphere mid-latitudes from Moffett Field,CA
ER-2 To study chemical processes potentially affecting ozone at altitudesmost strongly influenced by stratospheric aviation, to examinedistributions of tracers whose concentrations in the lowerstratosphere vary on time scales ranging from months to years, andto determine the effects of heterogeneous chemistry onconcentrations of radicals and reservoir species
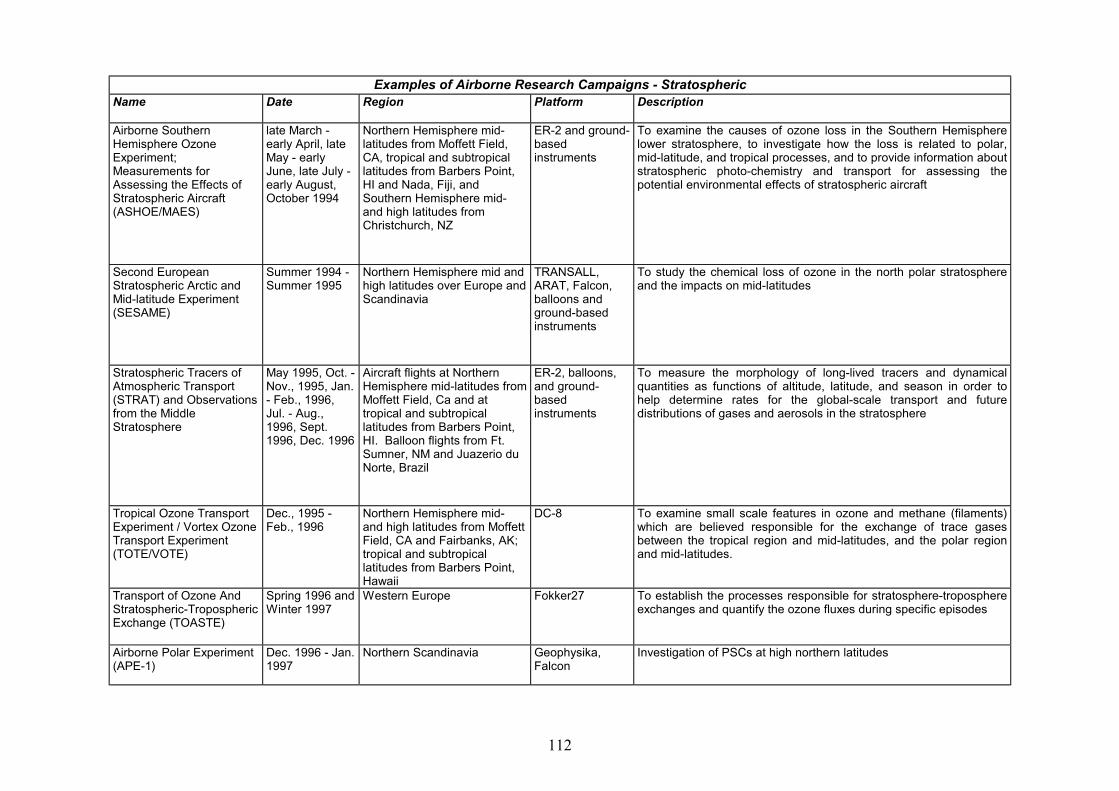
112
Examples of Airborne Research Campaigns - StratosphericName Date Region Platform Description
Airborne SouthernHemisphere OzoneExperiment;Measurements forAssessing the Effects ofStratospheric Aircraft(ASHOE/MAES)
late March -early April, lateMay - earlyJune, late July -early August,October 1994
Northern Hemisphere mid-latitudes from Moffett Field,CA, tropical and subtropicallatitudes from Barbers Point,HI and Nada, Fiji, andSouthern Hemisphere mid-and high latitudes fromChristchurch, NZ
ER-2 and ground-basedinstruments
To examine the causes of ozone loss in the Southern Hemispherelower stratosphere, to investigate how the loss is related to polar,mid-latitude, and tropical processes, and to provide information aboutstratospheric photo-chemistry and transport for assessing thepotential environmental effects of stratospheric aircraft
Second EuropeanStratospheric Arctic andMid-latitude Experiment(SESAME)
Summer 1994 -Summer 1995
Northern Hemisphere mid andhigh latitudes over Europe andScandinavia
TRANSALL,ARAT, Falcon,balloons andground-basedinstruments
To study the chemical loss of ozone in the north polar stratosphereand the impacts on mid-latitudes
Stratospheric Tracers ofAtmospheric Transport(STRAT) and Observationsfrom the MiddleStratosphere
May 1995, Oct. -Nov., 1995, Jan.- Feb., 1996,Jul. - Aug.,1996, Sept.1996, Dec. 1996
Aircraft flights at NorthernHemisphere mid-latitudes fromMoffett Field, Ca and attropical and subtropicallatitudes from Barbers Point,HI. Balloon flights from Ft.Sumner, NM and Juazerio duNorte, Brazil
ER-2, balloons,and ground-basedinstruments
To measure the morphology of long-lived tracers and dynamicalquantities as functions of altitude, latitude, and season in order tohelp determine rates for the global-scale transport and futuredistributions of gases and aerosols in the stratosphere
Tropical Ozone TransportExperiment / Vortex OzoneTransport Experiment(TOTE/VOTE)
Dec., 1995 -Feb., 1996
Northern Hemisphere mid-and high latitudes from MoffettField, CA and Fairbanks, AK;tropical and subtropicallatitudes from Barbers Point,Hawaii
DC-8 To examine small scale features in ozone and methane (filaments)which are believed responsible for the exchange of trace gasesbetween the tropical region and mid-latitudes, and the polar regionand mid-latitudes.
Transport of Ozone AndStratospheric-TroposphericExchange (TOASTE)
Spring 1996 andWinter 1997
Western Europe Fokker27 To establish the processes responsible for stratosphere-troposphereexchanges and quantify the ozone fluxes during specific episodes
Airborne Polar Experiment(APE-1)
Dec. 1996 - Jan.1997
Northern Scandinavia Geophysika,Falcon
Investigation of PSCs at high northern latitudes
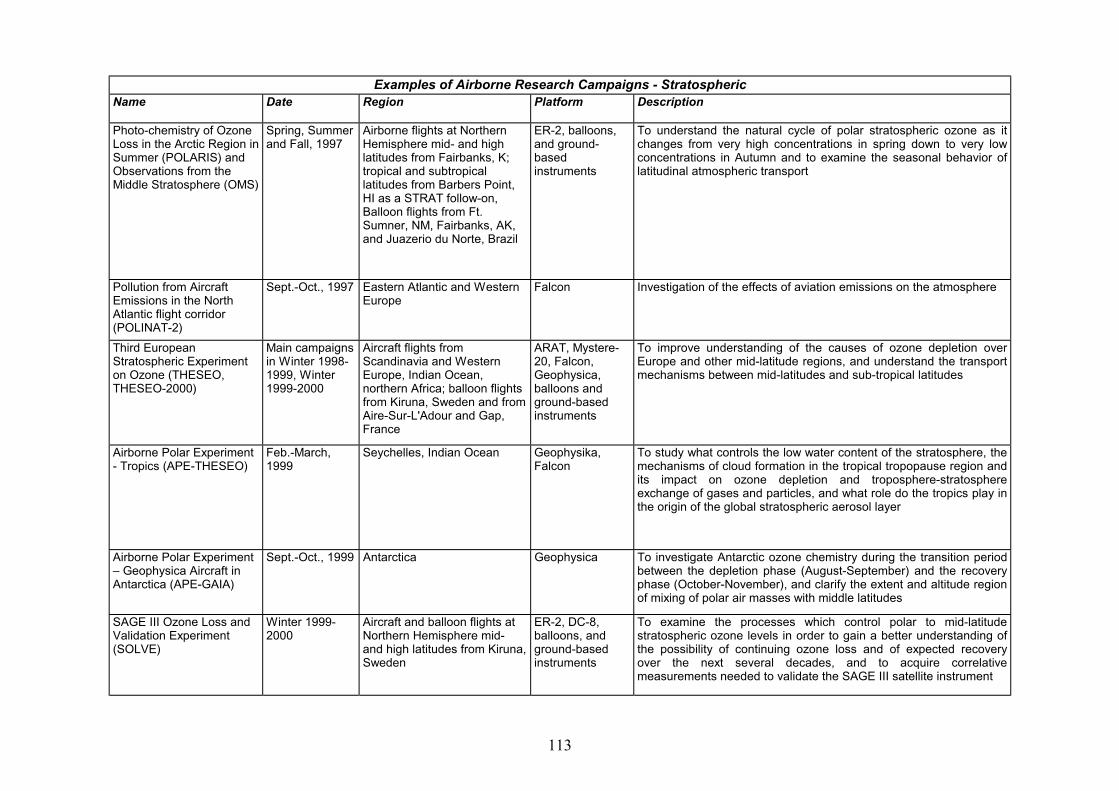
113
Examples of Airborne Research Campaigns - StratosphericName Date Region Platform Description
Photo-chemistry of OzoneLoss in the Arctic Region inSummer (POLARIS) andObservations from theMiddle Stratosphere (OMS)
Spring, Summerand Fall, 1997
Airborne flights at NorthernHemisphere mid- and highlatitudes from Fairbanks, K;tropical and subtropicallatitudes from Barbers Point,HI as a STRAT follow-on,Balloon flights from Ft.Sumner, NM, Fairbanks, AK,and Juazerio du Norte, Brazil
ER-2, balloons,and ground-basedinstruments
To understand the natural cycle of polar stratospheric ozone as itchanges from very high concentrations in spring down to very lowconcentrations in Autumn and to examine the seasonal behavior oflatitudinal atmospheric transport
Pollution from AircraftEmissions in the NorthAtlantic flight corridor(POLINAT-2)
Sept.-Oct., 1997 Eastern Atlantic and WesternEurope
Falcon Investigation of the effects of aviation emissions on the atmosphere
Third EuropeanStratospheric Experimenton Ozone (THESEO,THESEO-2000)
Main campaignsin Winter 1998-1999, Winter1999-2000
Aircraft flights fromScandinavia and WesternEurope, Indian Ocean,northern Africa; balloon flightsfrom Kiruna, Sweden and fromAire-Sur-L'Adour and Gap,France
ARAT, Mystere-20, Falcon,Geophysica,balloons andground-basedinstruments
To improve understanding of the causes of ozone depletion overEurope and other mid-latitude regions, and understand the transportmechanisms between mid-latitudes and sub-tropical latitudes
Airborne Polar Experiment- Tropics (APE-THESEO)
Feb.-March,1999
Seychelles, Indian Ocean Geophysika,Falcon
To study what controls the low water content of the stratosphere, themechanisms of cloud formation in the tropical tropopause region andits impact on ozone depletion and troposphere-stratosphereexchange of gases and particles, and what role do the tropics play inthe origin of the global stratospheric aerosol layer
Airborne Polar Experiment– Geophysica Aircraft inAntarctica (APE-GAIA)
Sept.-Oct., 1999 Antarctica Geophysica To investigate Antarctic ozone chemistry during the transition periodbetween the depletion phase (August-September) and the recoveryphase (October-November), and clarify the extent and altitude regionof mixing of polar air masses with middle latitudes
SAGE III Ozone Loss andValidation Experiment(SOLVE)
Winter 1999-2000
Aircraft and balloon flights atNorthern Hemisphere mid-and high latitudes from Kiruna,Sweden
ER-2, DC-8,balloons, andground-basedinstruments
To examine the processes which control polar to mid-latitudestratospheric ozone levels in order to gain a better understanding ofthe possibility of continuing ozone loss and of expected recoveryover the next several decades, and to acquire correlativemeasurements needed to validate the SAGE III satellite instrument

114
Examples of Airborne Research Campaigns - TroposphericName Date Region Platform Description
ChemicalInstrumentation andTest Experiment(CITE-1)
Nov., 1983 andApril, 1984
Western US and CentralNorth Pacific, Hawaii
CV-990 Airborne inter-comparison of NO, CO, and OH measurementtechniques; increased confidence in CO and NO measurements;eliminated insufficiently sensitive OH techniques; and providedbaseline measurements of NO and CO over the north central Pacific
Atmospheric BoundaryLayer Experiment(ABLE-1)
June, 1984 Tropical North Atlanticfrom Barbados
Electra Airborne study of boundary layer chemistry and dynamics over thetropical Atlantic Ocean and the French Guinea rainforest. Providedstriking new insights into marine boundary layer sulphur transport anddemonstrated the great importance of transported Saharan dust as anutrient source to the tropical Atlantic Ocean comparable to the outflowfrom the Amazon River.
Atmospheric BoundaryLayer Experiment(ABLE-2A)
August, 1985 Central regions of Brazil'sAmazon rainforest,Manaus, Brazil
Electra andground-based
First and still the largest joint US/Brazilian study of basin-scalebiosphere-atmospheric interactions and tropospheric chemistry overthe Brazilian Amazon rainforest during the dry season in the southernhemisphere. Used co-ordinated airborne and ground basedmeasurements. Provided important new estimates of CH4 emissionsfrom the tropics, revised tropical convective cloud models, and allowednew estimates of O3 photochemical production. Produced thesurprising result that transport of dust from Africa may have served tofertilise the Amazon rainforest.
ChemicalInstrumentation andTest Experiment(CITE-2)
August, 1986 Wallops Flight Facilityand California
Electra Airborne inter-comparisons of NO, NO2, PAN, and HNO3 instruments·Demonstrated capability for baseline measurements for NO & PANand for NO2 under some atmospheric conditions and indicated needfor additional R&D for HNO3 measurements.
Atmospheric BoundaryLayer Experiment(ABLE-2B)
May, 1987 Central regions of Brazil'sAmazon rainforest,Manaus, Brazil
Electra andground-based
Joint US/Brazilian study of basin-scale biosphere-atmosphericinteractions and tropospheric chemistry over the Brazilian Amazonrainforest during the wet season in the Southern Hemisphere
Atmospheric BoundaryLayer Experiment(ABLE-3A)
August, 1988 Northern latitudes ofAlaska from Point Barrowand Bethel, AK
Electra andground-based
Co-ordinated air and ground based study of O3 photo-chemistry andbiogenic sources of tropospheric green house gases in Alaska. Firstregional scale measurement of the flux of CH4 from the AlaskanWetlands using co-ordinated ground-base and airborne fluxtechniques, and satellite observations for regional scaling of fluxmeasurements. Provided important new input to photochemicalmodels that showed sensitivity of the high latitudes to long rangetransport of natural and anthropogenic emissions.

115
Examples of Airborne Research Campaigns - TroposphericName Date Region Platform Description
ChemicalInstrumentation andTest Experiment(CITE-3)
Sept., 1989 North Atlantic mid-latitudes from WallopsIsland, VA and tropicalSouth Atlantic mid-latitudes from Natal,Brazil
Electra Airborne inter-comparison of SO2, COS, H2S, CS2, and DMSmeasurement techniques in the remote troposphere· Provided highconfidence for measurements of COS, H2S, CS2, and DMS, anddemonstrated the need for additional instrument evaluation for SO2
measurements
Atmospheric BoundaryLayer Experiment(ABLE-3B)
July, 1990 Hudson Bay lowlandsfrom North Bay, Canadaand Northern Quebec andLabrador from GooseBay, Canada
Electra andground-based
Joint US/Canadian study of high latitude photo-chemistry and biogenicsources of greenhouse gases. Revised the global emissions ofmethane estimates from high latitude wetlands and re-emphasised therelative importance of tropical wetlands as a natural source of methane
Pacific ExploratoryMission (PEM) WEST A
Sept.-Oct., 1991 North-western pacificOcean
DC-8 and ground-based
Joint US/Asian study of the impact of Asian continental outflow on thechemistry of the troposphere over the north-western Pacific Oceanduring a period characterised by minimum Asian outflow; Observedimpact of Asian continent several thousand kms into the Pacific, evenduring the fall "quiescent" continental outflow period. Found largescale lofting via convective processes to be a significant source ofsulphur and hydrocarbons in the upper troposphere. Established thehigh troposphere at mid-latitudes as a major source of O3, and thelower and mid troposphere in tropics as a sink. Found lightning inconvective clouds to be a major source of NOx in the high tropicalPacific troposphere. Demonstrated clear need for further R&D for NOy
and NO2 measurements. Established baseline measurements for thePacific troposphere
Transport and ChemistryNear the Equator(TRACE-A)
October, 1992 Tropical Atlantic basedfrom Barasilia, Brazil,Johannesburg, SouthAfrica, Winhock, Namibia,and Ascension Island
DC-8 and ground-based
Joint NASA/Brazilian co-ordinated with an European/African study inSouthern Africa to investigate the role of biomass burning plumes inproducing elevated ozone levels over the tropical Atlantic Ocean; ·Demonstrated conclusively that enhanced O3 detected by satellitesover the tropical Atlantic is photo-chemically produced from emissionproducts of biomass burning products from Africa and Brazil. Foundthat the meteorology over the south Atlantic acts to confine these in thetropical Atlantic basin, thereby providing near ideal conditions for theformation and accumulation of O3 and other photochemical products
Pacific ExploratoryMission (PEM) WEST B
March, 1994 North-western pacificOcean
DC-8 andP-3B
Joint US/Asian airborne & ground based study of the impact of Asiancontinental outflow on the chemistry of the troposphere over the northwestern Pacific Ocean during a period of enhanced outflow
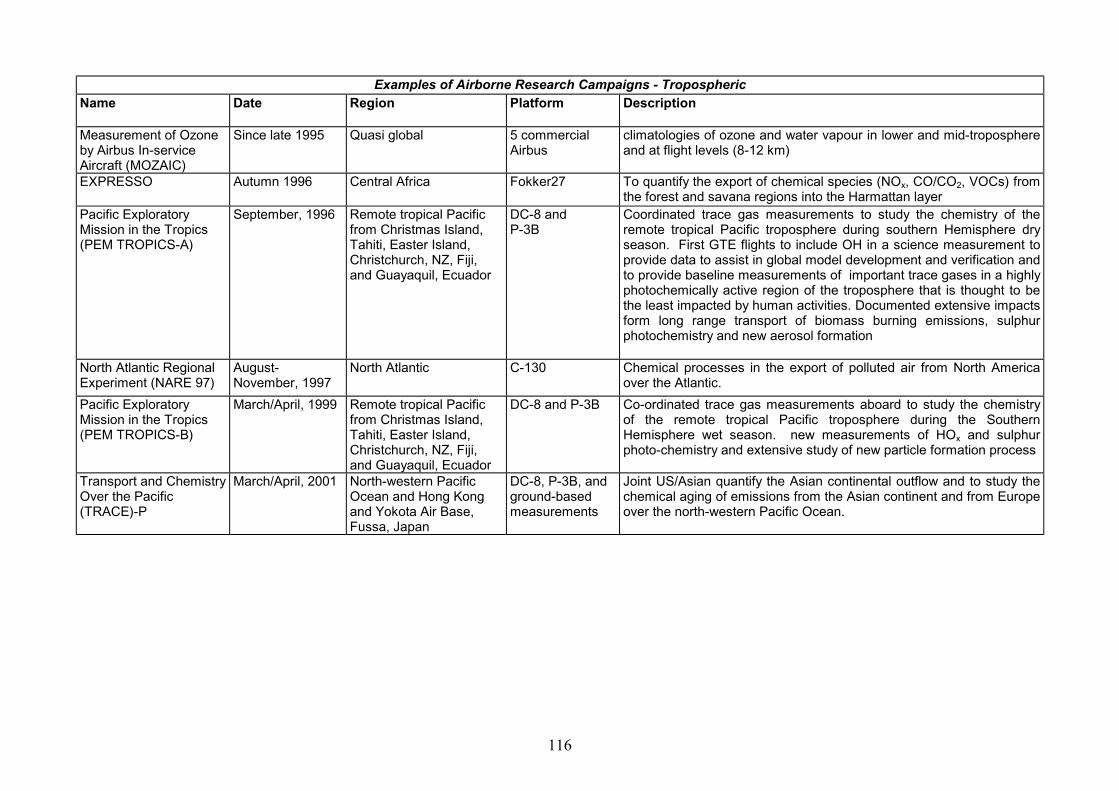
116
Examples of Airborne Research Campaigns - TroposphericName Date Region Platform Description
Measurement of Ozoneby Airbus In-serviceAircraft (MOZAIC)
Since late 1995 Quasi global 5 commercialAirbus
climatologies of ozone and water vapour in lower and mid-troposphereand at flight levels (8-12 km)
EXPRESSO Autumn 1996 Central Africa Fokker27 To quantify the export of chemical species (NOx, CO/CO2, VOCs) fromthe forest and savana regions into the Harmattan layer
Pacific ExploratoryMission in the Tropics(PEM TROPICS-A)
September, 1996 Remote tropical Pacificfrom Christmas Island,Tahiti, Easter Island,Christchurch, NZ, Fiji,and Guayaquil, Ecuador
DC-8 andP-3B
Coordinated trace gas measurements to study the chemistry of theremote tropical Pacific troposphere during southern Hemisphere dryseason. First GTE flights to include OH in a science measurement toprovide data to assist in global model development and verification andto provide baseline measurements of important trace gases in a highlyphotochemically active region of the troposphere that is thought to bethe least impacted by human activities. Documented extensive impactsform long range transport of biomass burning emissions, sulphurphotochemistry and new aerosol formation
North Atlantic RegionalExperiment (NARE 97)
August-November, 1997
North Atlantic C-130 Chemical processes in the export of polluted air from North Americaover the Atlantic.
Pacific ExploratoryMission in the Tropics(PEM TROPICS-B)
March/April, 1999 Remote tropical Pacificfrom Christmas Island,Tahiti, Easter Island,Christchurch, NZ, Fiji,and Guayaquil, Ecuador
DC-8 and P-3B Co-ordinated trace gas measurements aboard to study the chemistryof the remote tropical Pacific troposphere during the SouthernHemisphere wet season. new measurements of HOx and sulphurphoto-chemistry and extensive study of new particle formation process
Transport and ChemistryOver the Pacific(TRACE)-P
March/April, 2001 North-western PacificOcean and Hong Kongand Yokota Air Base,Fussa, Japan
DC-8, P-3B, andground-basedmeasurements
Joint US/Asian quantify the Asian continental outflow and to study thechemical aging of emissions from the Asian continent and from Europeover the north-western Pacific Ocean.

117
ANNEX E
OTHER SPACE-BASED INSTRUMENTS

118
119
Other Space-Based Instruments
The description of space-based instruments used to make measurements relevant to theOzone Project in Section 3.3 was limited to those instruments that are currently or are planned tobe part of long term measurement systems involving multiple related instruments and those onseveral large research-oriented platforms whose lifetime may be sufficiently long that there is areasonable possibility that their data sets will be useful for intermediate to long term studies of theatmosphere. In selecting this limited set a number of other useful instruments have been left out.These instruments, which fall into the basic categories of those that have flown previously, thosethat are currently flying, and those that are being considered for future use, are summarised here.
E.1 Previously-flown Instruments
E.1.1 Nimbus 7
The Nimbus 7 spacecraft contained several instruments for measuring atmospheric traceconstituents and aerosols. Two of them - the TOMS and SBUV instruments - were described inSection 3.3.1. Other relevant instruments include the Limb Infrared Monitor of the Stratosphere(LIMS), the Stratosphere and Mesosphere Sounder (SAMS), and the Stratospheric Aerosol Monitor(SAM II).
LIMS was an infrared emission instrument that made near-global measurements (64�S -84�N) for the period from October 1978- May 1979. Constituents measured were O3, NO2, H2O,HNO3, as well as temperature. Two observations per day were made, typically around 1 p.m. and11 p.m., so that diurnal variations could be studied. Most of the measurements were limited to thestratosphere, although ozone and temperature measurements extended through much of themesosphere.
SAMS made measurements over an approximately three year period of the distribution ofN2O and CH4, concentrating on the middle and upper stratosphere and lower mesosphere. TheSAMS measurements were instrumental in showing the two-dimensional structure of long-livedtracers in the stratosphere. SAM II was a single channel (1 micron) solar occultation instrumentthat operated for nearly 15 years. The SAM II data played a crucial rule in providing knowledgeabout the temporal and geographic distribution of PSCs
E.1.2 ATMOS
The first chemically comprehensive set of space-based measurements of a broad range ofatmospheric trace constituents was made by the Atmospheric Trace Molecule Spectroscopy(ATMOS) instrument, an infrared occultation interferometer, aboard the Spacelab 3 Space Shuttlemission in April-May, 1985. Data from this mission were limited to two latitude bands - roughly30oN and 47oS. ATMOS measured nearly all the important nitrogen-containing species in thestratosphere (i.e. NO, NO2, N2O5, HNO3, HNO4, ClONO2, N2O), most of the important halogen-containing species (i.e. HCl, ClONO2, HF, CF2O, CF3Cl, CF2Cl2, CH3Cl, CHClF2, CCl4, CF4) and avariety of other species (i.e. H2O, CH4, CO, OCS, HCN, C2H2, C2H6), including isotopicallysubstituted forms of O3 and H2O.
Subsequent flights of the ATMOS instrument (March 1992, April 1993 and November1994), as part of the Atmospheric Laboratory for Applications and Science (ATLAS) series ofshuttle missions, have extended ATMOS coverage to the tropics and high latitudes and have beenused for trend determination through comparison of the mid-1985 and late-1994 observations. Inparticular, high northern latitudes were observed by ATLAS-2 in April, 1993, while high southernlatitudes were observed by ATLAS-3 in November, 1994. In both cases, observations were madewhile the springtime polar vortices still existed, and comparative observations of air inside andoutside the vortex were carried out.
120
E.1.3 MAS
The Millimetre-Wave Atmospheric Sounder (MAS) instrument flew aboard the SpaceShuttle in 1992, 1993, and 1994 as part of the ATLAS payload. MAS used millimetre-waveemission techniques to make observations of ozone, water vapour, chlorine monoxide andtemperature. MAS had a high spectral resolution that made it particularly well suited to studyingthe mesosphere region, where emission lines are quite narrow and details, such as Zeemansplitting of molecular oxygen lines, can be observed.
E.1.4 CRISTA/MAHRSI
The Cryogenic Infrared Spectrometers and Telescopes for the Atmosphere (CRISTA) andMiddle Atmosphere High Resolution Spectrographic Investigation (MAHRSI) flew aboard theGerman ASTRO-SPAS satellite which was deployed from and retrieved by the Space Shuttleduring flights in November, 1994, and August, 1997.
CRISTA measures temperature and trace gas concentrations using both infrared and far-infrared wavelengths. There are multiple detectors and three telescopes for the infrared, looking atslightly different angles from the Shuttle, so that small horizontal scale features can be observed inthe temperature and constituent profiles. These measurements are unique because of this highresolution and the results show very clear evidence of interesting structural features in thedistributions of relatively long-lived constituents such as ozone and nitric acid. CRISTAobservations extend well into the thermosphere for some species.
MAHRSI is an ultraviolet instrument designed to measure NO and OH, mainly in themesosphere and thermosphere. The OH retrieval has recently been extended to 45 km. The initialresults from MAHRSI suggested that mesospheric OH levels were significantly below thoseexpected based on observed levels of water vapour and ozone and known hydrogen-oxygenphotochemistry.
E.1.5 ADEOS
The Japanese ADEOS spacecraft, which operated for approximately one year (1996-1997)had several instruments used for making atmospheric chemistry measurements.
The Interferometric Monitor of Greenhouse Gases (IMG), a nadir-observing Michelsen-typeFourier Transform Spectrometer, was designed to measure several gases, including densityprofiles of CO2 and H2O, total ozone column, and mixing ratios of CH4, N2O, and CO in thetroposphere. Its combination of high spectral resolution and a nadir-viewing geometry made itunique for instruments applied to atmospheric chemistry.
The Improved Limb Atmospheric Spectrometer (ILAS) instrument used the technique ofabsorption at solar occultation to measure the vertical profile of ozone, aerosols, and several tracegases. Both infrared and visible wavelengths were used to determine constituent/aerosol andpressure/temperature measurements, respectively. The combination of the solar occultationtechnique and the polar sun-synchronous orbit of the ADEOS spacecraft, meant that the ILASobservations were all at high latitudes.
The Retroreflector in Space (RIS) was used in conjunction with laser ground stations tosupport vertical profile and/or column measurements of a small number of gases.
E.1.6 SOLSE/LORE
The Shuttle Ozone Limb Sounder Experiment (SOLSE) and Limb Ozone RetrievalExperiment (LORE) flew aboard the Space Shuttle (STS-97) in the fall of 1997. These instrumentswere designed to test the possible use of ultraviolet limb sounding to measure ozone in thestratosphere and upper troposphere. LORE used optical filters in the ultraviolet, visible, and

121
infrared wavelengths to measure ozone profiles throughout the stratosphere. SOLSE operated atultraviolet wavelengths with a two-dimensional detector array to ultraviolet limb scatteringtechnique., The UV limb scattering technique demonstrated by SOLSE has been selected as thevertical profiling technique for the OMPS instrument (see Section 3.3.2).
E.2 Currently Flying Instruments
E.2.1 POAM-3
The Polar Ozone Aerosol Monitor (POAM-3) instrument is a solar occultation instrumentsimilar in spirit to the SAGE instruments. It was built for the US Naval Research Laboratory andwas launched aboard the French SPOT-4 in the winter of 1998. The POAM instrument, animproved version of the POAM-2 instrument which flew aboard the French SPOT-3 satellite from1993-1996, uses the solar occultation technique to measure ozone, water vapour, aerosols, polarstratospheric clouds, temperature, and nitrogen dioxide in the stratosphere.
By flying in a polar, sun-synchronous orbit it obtains information at high latitudes, making itparticularly important for studies of PSCs at high latitudes. The observations should help extendthe PSC climatology derived from SAM II and POAM-2. Its orbital coverage nicely complementsthat of the SAGE III instrument planned for the Russian Meteor-3M satellite, as POAM III willmeasure mostly very high southern latitudes and mid-high northern latitudes, while SAGE III willmeasure moderately high southern latitudes and very high northern latitudes.
E.2.2 UVISI
The Ultraviolet Visible Imagers and Spectrographic Imager (UVISI) instrument flies on-board the Midcourse Space Experiment (MSX) of the US Department of Defense. It is a very highspectral resolution imager, and can be used in various modes, which include the detection of ozoneby exploiting stellar occultations (see COALA). Its high spectral resolution makes it an excellentplatform for testing remote sensing techniques. However, due to operational constraints associatedwith the primary mission of MSX, the UVISI instrument obtained only limited data during the earlyphase of MSX operation.
E.2.3 GPS
The Global Positioning System (GPS) provides information on the temperature distributionof the stratosphere and upper troposphere with high vertical resolution, including excellentcharacterisation of the tropopause region. This uses a radio occultation technique based onsources aboard one set of space-based platforms and receivers on another set of platforms. Theaccuracy of the temperature retrievals is reduced as one gets lower down into the tropospherewhere water vapour concentrations become sufficiently high that a constant molecular weight forair can no longer be assumed. GPS observations are well-scattered geographically because thediversity of GPS sources and observing platforms ensures that the occultations will be welldistributed.
E.2.4 OLME
The Chilean Ozone Layer Monitoring Experiment (OLME) was launched aboard the ChileanFASat Bravo instrument in the summer of 1998. OLME uses ultraviolet cameras with both chargecoupled device (CCD) and ultraviolet photodiode detectors to measure the total ozone column. Itwas designed to concentrate on making observations of ozone in the Antarctic and sub-Antarcticregions of Chile.
E.2.5 MOPITT
The Measurement of Pollution in the Troposphere (MOPITT) instrument, a Canadianinfrared instrument, measures tropospheric carbon monoxide and is flying aboard EOS Terra.

122
MOPITT observes CO profiles (3-4 levels with resolution of several km are expected to beretrieved), as well as total column amounts of CO. It also measures total column methane. Byflying aboard Terra, MOPITT also has available coincident measurements of surface propertiesthat may be particularly useful in studies of the relationships between the land surface (especiallythe presence of fires) and atmospheric CO concentrations.
E.3 Future Instruments
E.3.1 COALA
The Calibration for Ozone by Atmospheric Limb Acquisitions instrument (COALA) is aderivative of the GOMOS (Global Ozone Monitoring by Occultation of Stars) which will fly on ESA’sENVISAT satellite which is due for launch in 2001 (see Section 3.3.3). Like GOMOS it exploits theabsorption of ultraviolet and visible radiation during stellar occultation to determine theconcentrations of ozone, water vapour, aerosols and nitrogen dioxide in the stratosphere.
Like all occultation devices this technique is “self-calibrating” and should provide excellentaccuracy and vertical resolution (~1 km). Compared to SAGE its accuracy will be slightly reducedbut, in compensation, it will provide much enhanced geographical coverage. Unlike the UVISI, itconcentrates on exploiting stellar occultation. No firm flight opportunities have emerged yet,though it has aroused considerable interest as it has been designed for operational use.
E.3.2 ODIN
The ODIN mission, a collaborative effort of scientists from Sweden, France, Canada, andFinland, will have two instruments designed to study ozone and atmospheric chemistry. Theseconsist of a radiometer (SMR) using sub-millimetre wavelengths to measure ozone, chlorinemonoxide, water vapour and other constituents, and an Optical Spectrograph and Infrared ImagingSystem (OSIRIS) using ultraviolet-visible and near infrared wavelengths for studying ozone, NO2,aerosols and several other constituents. The launch of ODIN, to a sun-synchronous 600 km orbit,is scheduled for late 2000 for a two year mission. These are limb scan measurements which willprovide altitude profiles of ozone and over 20 other gases in the stratosphere. ODIN will fly in apolar orbit along the terminator and will test a tomographic technique for ozone above 50 km.
E.3.3 ILAS-2
The second version of the Improved Limb Atmospheric Spectrometer (ILAS-2), anoccultation-based instrument using both infrared and visible radiation, is scheduled for flight aboardthe Japanese ADEOS-2 spacecraft in 2001.
E.3.4 FTS
Although no plans currently exist for a follow on to EOS-CHEM, a recent long term planningexercise carried out by NASA calls for the long term measurement of a number of atmosphericparameters using a series of Fourier-transform infrared spectrometers (FTS) aboard an inclined-orbiting platform (assumed to be the International Space Station, which would allow for combinedflight with the SAGE III instrument).
Coupling this with the provision of a microwave emission instrument in polar sun-synchronous orbit would provide long term continuity of key measurements made by MLS (e.g.upper troposphere/lower stratosphere ozone, water vapour, and temperature). One or more FTSinstruments similar to that planned for the inclined orbiting platform might also be used on the polarsun-synchronous platform depending on the completeness of the species set to be measured withthe planned microwave instrument.

123
The first FTS in an inclined orbit would not fly until several years after the launch of EOSCHEM, and the polar sun-synchronous spacecraft would probably not be launched untilapproximately 2007.
E.3.5 ACE
The Atmospheric Chemistry Experiment (ACE) is a Canadian instrument to fly on theSCISAT-1 satellite of the Canadian Space Agency. The main goal of the ACE mission is tomeasure and to understand the chemical and dynamical processes that control the distribution ofozone in the upper troposphere and stratosphere. A comprehensive set of simultaneousmeasurements of trace gases, thin clouds, aerosols, and temperature will be made by solaroccultation from a satellite in low earth orbit. A high inclination (74 degrees) orbit at 650 km willgive ACE coverage of tropical, mid-latitude, and polar regions. The vertical resolution will be betterthan 4 km from the cloud tops (or about 5 km for clear scenes) up to about 100 km. A highresolution (0.02 cm-1) infrared Fourier Transform Spectrometer (FTS) operating from 2 to 13microns will measure atmospheric absorption spectra during sunrise and sunset. Aerosols andclouds (e.g., PSCs) will also be monitored using the extinction of solar radiation in the visible (0.5µm) and near infrared (1 µm) regions with two solar imagers. An ultraviolet/visible spectrograph willprobably be included in the mission. ACE is scheduled for launch in 2002 for a 2 year mission.
E.3.6 SWIFT
The Stratospheric Wind Interferometer for Transport Studies (SWIFT) project is intendedfor global measurement and analysis of stratospheric winds using a Doppler Michelsoninterferometer to detect wavelength shifts in the thermal emission from an ozone line near 9microns. The measurement concept is based on the WINDII instrument that flies aboard UARS(see section 3.3.3.a). While WINDII employed non-thermal air glow emission for its Dopplermeasurements for the altitude range of 80 to 300 km, the SWIFT instrument will use thermalemission, making the method effective over the altitude range from 20 to 45 km. Winds are to bemeasured with an accuracy of at least 5 m/sec, and ozone concentrations are to be measuredsimultaneously to 5 percent. SWIFT is intended to demonstrate the capability of operationalstratospheric wind measurements assimilated into a forecast model, but also will satisfy severalwind-related research objectives. A launch opportunity for SWIFT is being actively sought by theCanadian Space Agency.
E.3.7 AIRS
The Atmospheric Infrared Sounder (AIRS), a facility instrument selected to fly on NASA'sEOS-Aqua observatory scheduled for launch in December, 2000, is intended to measure primarilyatmospheric state parameters of temperature, humidity, and cloud characteristics. It obtains aspectrum of the thermal infrared radiation between 650 - 2700 cm-1 with a spectral resolution of1/1200. At the signal-to-noise of the AIRS detectors (noise equivalent temperatures of 0.2 K at250 K) it will be possible to infer temperature profiles through the troposphere to six levels in thestratosphere (100 to 1 mb) with a precision of 2 K in the upper levels. The spectral features ofseveral atmospheric trace gases, including ozone, will provide at least total column information. Itis planned to include ozone total column amounts as a standard (at launch) product for each AIRSretrieval footprint (45 km at nadir). The development of other products for routine production (socalled research products) which include ozone profiles at some number of levels (to bedetermined), columns or profiles of methane, and CO, will be left until after launch. Pre-launchsimulations suggest that the AIRS retrieved ozone column amounts can be made with a precisionof 2-3%. It is possible that some ozone profile information may be obtained from the AIRS spectra,but this would be a research product that would probably not be available until some time after thelaunch.

124
E.3.8 SABER
The SABER (Sounding of the Atmosphere using Broadband Emission Radiometry)instrument will fly aboard NASA’s Thermosphere-Ionosphere-Mesosphere Energetics andDynamics (TIMED) mission, currently scheduled for launch in the spring of 2001 and an operationalduration of two years. Although the primary scientific goal of TIMED and SABER is to quantify thebasic thermal structure and energy budget of the mesosphere and lower thermosphere (60 to 180km), SABER will provide information on temperature, density, pressure, trace constituentdistributions, and heating and cooling rates through much of the stratosphere (down to 15 km).SABER is a 10-channel broadband radiometer with an instantaneous field of view of 2 km thatmeasures infrared limb emission of CO2, O3, NO, O2(
1�), OH, and H2O. These measurements willbe inverted to yield (as routine, operational products) temperature (15 to 100 km, day and night),ozone (15 to 95 km, day and night), water vapour (15 to 80 km, day and night), CO2 (80 to 140 km,daytime only). Additional analyses of the SABER radiance measurements will yield rates of coolingdue to emission by CO2, NO, O3, and H2O and rates of heating due to absorption of solar radiation(by O3, O2 and CO2, ultraviolet to infrared wavelengths), throughout the middle atmosphere. Ratesof heating due to exothermic chemical reactions will be derived in the mesosphere from the OHand O2 airglow measurements, day and night. Concentrations of atomic species H (80 to 100 km)and O (50 to 120 km) will also be inferred using a variety of techniques.
E.3.9 TRIANA
The NASA Triana mission is scheduled for launch in 2001 and will occupy the L-1 Lagrangelibration point (some one million miles from the Earth) to provide continuous coverage of the sunlitportion of the Earth as it rotates. Observations using the EPIC spectro radiometer will be madeevery 15 minutes. This instrument measures radiances at ten wavelengths in the ultraviolet,visible, and near infrared regions (at 317.5, 325, 340, 388, 393.5, 443, 551, 645, 870, and 905 nm)that can be transformed into data products (ozone, aerosols, cloud optical depth, cloud height,sulphur dioxide, precipitable water vapour, volcanic ash, and UV irradiance) every hour for theentire globe at 8-km surface resolution. The coverage of TRIANA complements that of instrumentsaboard polar-orbiting satellites, that make at most two observations of any particular location onEarth per day (one if using sunlight, such as the UV observations used for many ozonemeasurements through the BUV or DOAS technique).

125
ANNEX F
ACRONYM/ABBREVIATION LIST

126

127
Acronym/Abbreviation List
ACE Atmospheric Chemistry ExperimentACRIM Active Cavity Radiometer Irradiance MonitorAGAGE Advanced Global Atmospheric Gases ExperimentARM Atmospheric Radiation ExperimentATMOS Atmospheric Trace Molecule SpectrometerBSRN Baseline Surface Radiation NetworkBUV Backscattered Ultra VioletCEOS Committee on Earth Observation SatellitesCFCs ChlorofluorocarbonsCLAES Cryogenic Limb Array Etalon SpectrometerCNES Centre National d’Etudes SpatialesCOALA Calibration for Ozone by Atmospheric Limb AcquisitionsCRISTA Cryogenic Infrared Spectrometers and Telescopes for the AtmosphereDOAS Differential Optical Absorption SpectroscopyENVISAT ENVIronmental SATelliteEOS Earth Observing SystemERBS Earth Radiation Budget SatelliteERS Earth Remote Sensing satelliteESA European Space AgencyEUMETSAT EUropean Organisation for METeorological SATellitesFTIR Fourier Transform InfraRedGAW Global Atmosphere WatchGCOS Global Climate Observing SystemGEO Geostationary Earth OrbitGOME Global Ozone Monitoring ExperimentGOMOS Global Ozone Monitoring by Occultation of StarsGPS-MET Global Positioning System - MeteorologyHALOE HALogen Occultation ExperimentHCFCs Hydrogenated ChlorofluorocarbonsHIRDLS HIgh Resolution Dynamics Limb SounderHIRS HIgh Resolution infrared SounderHRDI High Resolution Doppler InterferometerIASI Infrared Atmospheric Sounding InterferometerIGAC International Global Atmospheric ChemistryIGOS Integrated Global Observing StrategyILAS Improved Limb Atmospheric SpectrometerIMG Interferometric Monitor of Greenhouse GasesImS Imaging SpectrometerISAMS Improved Stratospheic And Mesospheric SounderLEO Low Earth OrbitLIMS LImb Microwave SounderLORE Limb Ozone Retrieval ExperimentMAHRSI Middle Atmosphere High Resolution Spectrographic InvestigationMAS Millimetre wave Atmosphere SounderMETOP Meteorological Operational SatelliteMIPAS Michelson Interferometer for Passive Atmospheric SoundingMLS Microwave Limb SounderMSC Meteorological Service of CanadaMOPITT Measurement of Pollution in the TroposphereMOZAIC Measurement of Ozone by Airbus in service AircraftNASA National Aeronautics and Space AdministrationNDSC Network for the Detection of Stratospheric ChangeNOAA National Oceanic and Atmospheric Administration

128
NOXA Nitrogen OXides and ozone measurements along Air routesNPOESS National Polar Orbiting Environmental Satellite SystemODIN Swedish satellite to investigate the ozone layerODUS Ozone Dynamics Ultraviolet SpectrometerOMI Ozone Mapping InstrumentOMPS Ozone Mapping and Profiling SuiteOMS Observations from the Middle StratosphereOSIRIS Optical Spectrograph and Infrared Imaging SystemPEM Particle Environment MonitorPOAM Polar Ozone Aerosol MonitorPSC Polar Stratospheric CloudRIS Retroreflector In SpaceSAGE Stratospheric Aerosol and Gas ExperimentSAMS Stratospheric and Mesospheric SounderSAM II Stratospheric Aerosol MonitorSAOZ Systeme d'Analyse par Observations ZenthalesSBUV Solar Backscatter UltraVioletSCIAMACHY Scanning Imaging Absorption Spectrometer for Atmospheric CartographySMR SubMillimetre RadiometerSMILES Superconducting subMIllimetre Limb Emission SounderSOLSE Shuttle Ozone Limb Sounder ExperimentSOLSTICE SOLar-STellar Irradiance Comparison ExperimentSPARC Stratospheric Processes And their Role in ClimateSSBUV Shuttle Solar Backscatter UltravioletSUSIM Solar Ultraviolet Spectral Irradiance MonitorSVIRI Stationary Visible/InfraRed ImagerTES Troposphere Emission SpectrometerTOA Top Of AtmosphereTOMS Total Ozone Mapping SpectrometerTOP Tropospheric Observation ProjectTOVS TIROS Operational Vertical SounderUARS Upper Atmosphere Research SatelliteUV UltraVioletUVISI Ultraviolet and Visible Imagers and Spectrographic ImagersWCRP World Climate Research ProgrammeWINDII WINd Imaging InterferometerWMO World Meteorological Organization

129
GLOBAL ATMOSPHERE WATCHREPORT SERIES
1. Final Report of the Expert Meeting on the Operation of Integrated Monitoring Programmes, Geneva,2-5 September 1980
2. Report of the Third Session of the GESAMP Working Group on the Interchange of PollutantsBetween the Atmosphere and the Oceans (INTERPOLL-III), Miami, USA, 27-31 October 1980
3. Report of the Expert Meeting on the Assessment of the Meteorological Aspects of the First Phase ofEMEP, Shinfield Park, U.K., 30 March - 2 April 1981
4. Summary Report on the Status of the WMO Background Air Pollution Monitoring Network as at April1981
5. Report of the WMO/UNEP/ICSU Meeting on Instruments, Standardization and MeasurementsTechniques for Atmospheric CO2, Geneva, 8-11; September 1981
6. Report of the Meeting of Experts on BAPMoN Station Operation, Geneva, 23-26 November, 1981
7. Fourth Analysis on Reference Precipitation Samples by the Participating World MeteorologicalOrganization Laboratories by Robert L. Lampe and John C. Puzak, December 1981*
8. Review of the Chemical Composition of Precipitation as Measured by the WMO BAPMoN by Prof.Dr. Hans-Walter Georgii, February 1982
9. An Assessment of BAPMoN Data Currently Available on the Concentration of CO2 in the Atmosphereby M.R. Manning, February 1982
10. Report of the Meeting of Experts on Meteorological Aspects of Long-range Transport of Pollutants,Toronto, Canada, 30 November - 4 December 1981
11. Summary Report on the Status of the WMO Background Air Pollution Monitoring Network as at May1982
12. Report on the Mount Kenya Baseline Station Feasibility Study edited by Dr. Russell C. Schnell
13. Report of the Executive Committee Panel of Experts on Environmental Pollution, Fourth Session,Geneva, 27 September - 1 October 1982
14. Effects of Sulphur Compounds and Other Pollutants on Visibility by Dr. R.F. Pueschel, April 1983
15. Provisional Daily Atmospheric Carbon Dioxide Concentrations as Measured at BAPMoN Sites for theYear 1981, May 1983
16. Report of the Expert Meeting on Quality Assurance in BAPMoN, Research Triangle Park, NorthCarolina, USA, 17-21 January 1983
17. General Consideration and Examples of Data Evaluation and Quality Assurance ProceduresApplicable to BAPMoN Precipitation Chemistry Observations by Dr. Charles Hakkarinen, July 1983
18. Summary Report on the Status of the WMO Background Air Pollution Monitoring Network as at May1983
19. Forecasting of Air Pollution with Emphasis on Research in the USSR by M.E. Berlyand, August 1983
20. Extended Abstracts of Papers to be Presented at the WMO Technical Conference on Observationand Measurement of Atmospheric Contaminants (TECOMAC), Vienna, 17-21 October 1983
21. Fifth Analysis on Reference Precipitation Samples by the Participating World MeteorologicalOrganization Laboratories by Robert L. Lampe and William J. Mitchell, November 1983

130
22. Report of the Fifth Session of the WMO Executive Council Panel of Experts on EnvironmentalPollution, Garmisch-Partenkirchen, Federal Republic of Germany, 30 April - 4 May 1984 (TD No. 10)
23. Provisional Daily Atmospheric Carbon Dioxide Concentrations as Measured at BAPMoN Sites for theYear 1982. November 1984 (TD No. 12)
24. Final Report of the Expert Meeting on the Assessment of the Meteorological Aspects of the SecondPhase of EMEP, Friedrichshafen, Federal Republic of Germany, 7-10 December 1983. October1984 (TD No. 11)
25. Summary Report on the Status of the WMO Background Air Pollution Monitoring Network as at May1984. November 1984 (TD No. 13)
26. Sulphur and Nitrogen in Precipitation: An Attempt to Use BAPMoN and Other Data to Show Regionaland Global Distribution by Dr. C.C. Wallén. April 1986 (TD No. 103)
27. Report on a Study of the Transport of Sahelian Particulate Matter Using SunphotometerObservations by Dr. Guillaume A. d'Almeida. July 1985 (TD No. 45)
28. Report of the Meeting of Experts on the Eastern Atlantic and Mediterranean Transport Experiment("EAMTEX"), Madrid and Salamanca, Spain, 6-8 November 1984
29. Recommendations on Sunphotometer Measurements in BAPMoN Based on the Experience of aDust Transport Study in Africa by Dr. Guillaume A. d'Almeida. September 1985 (TD No. 67)
30. Report of the Ad-hoc Consultation on Quality Assurance Procedures for Inclusion in the BAPMoNManual, Geneva, 29-31 May 1985
31. Implications of Visibility Reduction by Man-Made Aerosols (Annex to No. 14) by R.M. Hoff and L.A.Barrie. October 1985 (TD No. 59)
32. Manual for BAPMoN Station Operators by E. Meszaros and D.M. Whelpdale. October 1985 (TD No.66)
33. Man and the Composition of the Atmosphere: BAPMoN - An international programme of nationalneeds, responsibility and benefits by R.F. Pueschel. 1986
34. Practical Guide for Estimating Atmospheric Pollution Potential by Dr. L.E. Niemeyer. August 1986(TD No. 134)
35. Provisional Daily Atmospheric CO2 Concentrations as Measured at BAPMoN Sites for the Year 1983.December 1985 (TD No. 77)
36. Global Atmospheric Background Monitoring for Selected Environmental Parameters. BAPMoN Datafor 1984. Volume I: Atmospheric Aerosol Optical Depth. October 1985 (TD No. 96)
37. Air-Sea Interchange of Pollutants by R.A. Duce. September 1986 (TD No. 126)
38. Summary Report on the Status of the WMO Background Air Pollution Monitoring Network as at 31December 1985. September 1986 (TD No. 136)
39. Report of the Third WMO Expert Meeting on Atmospheric Carbon Dioxide MeasurementTechniques, Lake Arrowhead, California, USA, 4-8 November 1985. October 1986
40. Report of the Fourth Session of the CAS Working Group on Atmospheric Chemistry and AirPollution, Helsinki, Finland, 18-22 November 1985. January 1987
41. Global Atmospheric Background Monitoring for Selected Environmental Parameters. BAPMoN Datafor 1982, Volume II: Precipitation chemistry, continuous atmospheric carbon dioxide and suspendedparticulate matter. June 1986 (TD No. 116)
42. Scripps reference gas calibration system for carbon dioxide-in-air standards: revision of 1985 byC.D. Keeling, P.R. Guenther and D.J. Moss. September 1986 (TD No. 125)

131
43. Recent progress in sunphotometry (determination of the aerosol optical depth). November 1986
44. Report of the Sixth Session of the WMO Executive Council Panel of Experts on EnvironmentalPollution, Geneva, 5-9 May 1986. March 1987
45. Proceedings of the International Symposium on Integrated Global Monitoring of the State of theBiosphere (Volumes I-IV), Tashkent, USSR, 14-19 October 1985. December 1986 (TD No. 151)
46. Provisional Daily Atmospheric Carbon Dioxide Concentrations as Measured at BAPMoN Sites for theYear 1984. December 1986 (TD No. 158)
47. Procedures and Methods for Integrated Global Background Monitoring of Environmental Pollution byF.Ya. Rovinsky, USSR and G.B. Wiersma, USA. August 1987 (TD No. 178)
48. Meeting on the Assessment of the Meteorological Aspects of the Third Phase of EMEP IIASA,Laxenburg, Austria, 30 March - 2 April 1987. February 1988
49. Proceedings of the WMO Conference on Air Pollution Modelling and its Application (Volumes I-III),Leningrad, USSR, 19-24 May 1986. November 1987 (TD No. 187)
50. Provisional Daily Atmospheric Carbon Dioxide Concentrations as Measured at BAPMoN Sites for theYear 1985. December 1987 (TD No. 198)
51. Report of the NBS/WMO Expert Meeting on Atmospheric CO2 Measurement Techniques,Gaithersburg, USA, 15-17 June 1987. December 1987
52. Global Atmospheric Background Monitoring for Selected Environmental Parameters. BAPMoN Datafor 1985. Volume I: Atmospheric Aerosol Optical Depth. September 1987
53. WMO Meeting of Experts on Strategy for the Monitoring of Suspended Particulate Matter in BAPMoN- Reports and papers presented at the meeting, Xiamen, China, 13-17 October 1986. October 1988
54. Global Atmospheric Background Monitoring for Selected Environmental Parameters. BAPMoN Datafor 1983, Volume II: Precipitation chemistry, continuous atmospheric carbon dioxide and suspendedparticulate matter (TD No. 283)
55. Summary Report on the Status of the WMO Background Air Pollution Monitoring Network as at 31December 1987 (TD No. 284)
56. Report of the First Session of the Executive Council Panel of Experts/CAS Working Group onEnvironmental Pollution and Atmospheric Chemistry, Hilo, Hawaii, 27-31 March 1988. June 1988
57. Global Atmospheric Background Monitoring for Selected Environmental Parameters. BAPMoN Datafor 1986, Volume I: Atmospheric Aerosol Optical Depth. July 1988
58. Provisional Daily Atmospheric Carbon Dioxide Concentrations as measured at BAPMoN sites for theyears 1986 and 1987 (TD No. 306)
59. Extended Abstracts of Papers Presented at the Third International Conference on Analysis andEvaluation of Atmospheric CO2 Data - Present and Past, Hinterzarten, Federal Republic of Germany,16-20 October 1989 (TD No. 340)
60. Global Atmospheric Background Monitoring for Selected Environmental Parameters. BAPMoN Datafor 1984 and 1985, Volume II: Precipitation chemistry, continuous atmospheric carbon dioxide andsuspended particulate matter.
61. Global Atmospheric Background Monitoring for Selected Environmental Parameters. BAPMoN Datafor 1987 and 1988, Volume I: Atmospheric Aerosol Optical Depth.
62. Provisional Daily Atmospheric Carbon Dioxide Concentrations as measured at BAPMoN sites for theyear 1988 (TD No. 355)

132
63. Report of the Informal Session of the Executive Council Panel of Experts/CAS Working Group onEnvironmental Pollution and Atmospheric Chemistry, Sofia, Bulgaria, 26 and 28 October 1989
64. Report of the consultation to consider desirable locations and observational practices for BAPMoNstations of global importance, Bermuda Research Station, 27-30 November 1989
65. Report of the Meeting on the Assessment of the Meteorological Aspects of the Fourth Phase ofEMEP, Sofia, Bulgaria, 27 and 31 October 1989
66. Summary Report on the Status of the WMO Global Atmosphere Watch Stations as at 31 December1990 (TD No. 419)
67. Report of the Meeting of Experts on Modelling of Continental, Hemispheric and Global RangeTransport, Transformation and Exchange Processes, Geneva, 5-7 November 1990
68. Global Atmospheric Background Monitoring for Selected Environmental Parameters. BAPMoN DataFor 1989, Volume I: Atmospheric Aerosol Optical Depth
69. Provisional Daily Atmospheric Carbon Dioxide Concentrations as measured at Global AtmosphereWatch (GAW)-BAPMoN sites for the year 1989 (TD No. 400)
70. Report of the Second Session of EC Panel of Experts/CAS Working Group on EnvironmentalPollution and Atmospheric Chemistry, Santiago, Chile, 9-15 January 1991 (TD No. 633)
71. Report of the Consultation of Experts to Consider Desirable Observational Practices and Distributionof GAW Regional Stations, Halkidiki, Greece, 9-13 April 1991 (TD No. 433)
72. Integrated Background Monitoring of Environmental Pollution in Mid-Latitude Eurasia by Yu.A. Izraeland F.Ya. Rovinsky, USSR (TD No. 434)
73. Report of the Experts Meeting on Global Aerosol Data System (GADS), Hampton, Virginia, 11-12September 1990 (TD No. 438)
74. Report of the Experts Meeting on Aerosol Physics and Chemistry, Hampton, Virginia, 30-31 May1991 (TD No. 439)
75. Provisional Daily Atmospheric Carbon Dioxide Concentrations as measured at Global AtmosphereWatch (GAW)-BAPMoN sites for the year 1990 (TD No. 447)
76. The International Global Aerosol Programme (IGAP) Plan: Overview (TD No. 445)
77. Report of the WMO Meeting of Experts on Carbon Dioxide Concentration and Isotopic MeasurementTechniques, Lake Arrowhead, California, 14-19 October 1990
78. Global Atmospheric Background Monitoring for Selected Environmental Parameters BAPMoN Datafor 1990, Volume I: Atmospheric Aerosol Optical Depth (TD No. 446)
79. Report of the Meeting of Experts to Consider the Aerosol Component of GAW, Boulder, 16-19December 1991 (TD No. 485)
80. Report of the WMO Meeting of Experts on the Quality Assurance Plan for the GAW, Garmisch-Partenkirchen, Germany, 26-30 March 1992 (TD No. 513)
81. Report of the Second Meeting of Experts to Assess the Response to and Atmospheric Effects of theKuwait Oil Fires, Geneva, Switzerland, 25-29 May 1992 (TD No. 512)
82. Global Atmospheric Background Monitoring for Selected Environmental Parameters BAPMoN Datafor 1991, Volume I: Atmospheric Aerosol Optical Depth (TD No. 518)
83. Report on the Global Precipitation Chemistry Programme of BAPMoN (TD No. 526)
84. Provisional Daily Atmospheric Carbon Dioxide Concentrations as measured at GAW-BAPMoN sitesfor the year 1991 (TD No. 543)
133
85. Chemical Analysis of Precipitation for GAW: Laboratory Analytical Methods and Sample CollectionStandards by Dr Jaroslav Santroch (TD No. 550)
86. The Global Atmosphere Watch Guide, 1993 (TD No. 553)
87. Report of the Third Session of EC Panel/CAS Working Group on Environmental Pollution andAtmospheric Chemistry, Geneva, 8-11 March 1993 (TD No. 555)
88. Report of the Seventh WMO Meeting of Experts on Carbon Dioxide Concentration and IsotopicMeasurement Techniques, Rome, Italy, 7 - 10 September 1993, (edited by Graeme I. Pearman andJames T. Peterson) (TD No. 669)
89. 4th International Conference on CO2 (Carqueiranne, France, 13-17 September 1993) (TD No. 561)
90. Global Atmospheric Background Monitoring for Selected Environmental Parameters GAW Data for1992, Volume I: Atmospheric Aerosol Optical Depth (TD No. 562)
91. Extended Abstracts of Papers Presented at the WMO Region VI Conference on the Measurementand Modelling of Atmospheric Composition Changes Including Pollution Transport, Sofia, 4-8October 1993 (TD No. 563)
92. Report of the Second WMO Meeting of Experts on the Quality Assurance/Science Activity Centres ofthe Global Atmosphere Watch, Garmisch-Partenkirchen, 7-11 December 1992 (TD No. 580)
93. Report of the Third WMO Meeting of Experts on the Quality Assurance/Science Activity Centres ofthe Global Atmosphere Watch, Garmisch-Partenkirchen, 5-9 July 1993 (TD No. 581)
94. Report on the Measurements of Atmospheric Turbidity in BAPMoN (TD No. 603)
95. Report of the WMO Meeting of Experts on UV-B Measurements, Data Quality and Standardization ofUV Indices, Les Diablerets, Switzerland, 25-28 July 1994 (TD No. 625)
96. Global Atmospheric Background Monitoring for Selected Environmental Parameters WMO GAWData for 1993, Volume I: Atmospheric Aerosol Optical Depth
97. Quality Assurance Project Plan (QAPjP) for Continuous Ground Based Ozone Measurements (TDNo. 634)
98. Report of the WMO Meeting of Experts on Global Carbon Monoxide Measurements, Boulder, USA,7-11 February 1994 (TD No. 645)
99. Status of the WMO Global Atmosphere Watch Programme as at 31 December 1993 (TD No. 636)
100. Report of the Workshop on UV-B for the Americas, Buenos Aires, Argentina, 22-26 August 1994
101. Report of the WMO Workshop on the Measurement of Atmospheric Optical Depth and Turbidity,Silver Spring, USA, 6-10 December 1993, (edited by Bruce Hicks) (TD No. 659)
102. Report of the Workshop on Precipitation Chemistry Laboratory Techniques, Hradec Kralove, CzechRepublic, 17-21 October 1994 (TD No. 658)
103. Report of the Meeting of Experts on the WMO World Data Centres, Toronto, Canada,17-18 February 1995, (prepared by Edward Hare) (TD No. 679)
104. Report of the Fourth WMO Meeting of Experts on the Quality Assurance/Science Activity Centres(QA/SACs) of the Global Atmosphere Watch, jointly held with the First Meeting of the CoordinatingCommittees of IGAC-GLONET and IGAC-ACE, Garmisch-Partenkirchen, Germany, 13-17 March1995 (TD No. 689)
105. Report of the Fourth Session of the EC Panel of Experts/CAS Working Group on EnvironmentalPollution and Atmospheric Chemistry (Garmisch, Germany, 6-11 March 1995) (TD No. 718)
106. Report of the Global Acid Deposition Assessment (edited by D.M. Whelpdale and M-S. Kaiser) (TDNo. 777)
134
107. Extended Abstracts of Papers Presented at the WMO-IGAC Conference on the Measurement andAssessment of Atmospheric Composition Change (Beijing, China, 9-14 October 1995) (TD No. 710)
108. Report of the Tenth WMO International Comparison of Dobson Spectrophotometers (Arosa,Switzerland, 24 July - 4 August 1995)
109. Report of an Expert Consultation on 85Kr and 222Rn: Measurements, Effects and Applications(Freiburg, Germany, 28-31 March 1995) (TD No. 733)
110. Report of the WMO-NOAA Expert Meeting on GAW Data Acquisition and Archiving (Asheville, NC,USA, 4-8 November 1995) (TD No. 755)
111. Report of the WMO-BMBF Workshop on VOC Establishment of a “World Calibration/InstrumentIntercomparison Facility for VOC” to Serve the WMO Global Atmosphere Watch (GAW) Programme(Garmisch-Partenkirchen, Germany, 17-21 December 1995) (TD No. 756)
112. Report of the WMO/STUK Intercomparison of Erythemally-Weighted Solar UV Radiometers,Spring/Summer 1995, Helsinki, Finland (TD No. 781)
113. The Strategic Plan of the Global Atmosphere Watch (GAW) (TD No. 802)
114. Report of the Fifth WMO Meeting of Experts on the Quality Assurance/Science Activity Centres(QA/SACs) of the Global Atmosphere Watch, jointly held with the Second Meeting of theCoordinating Committees of IGAC-GLONET and IGAC-ACEEd, Garmisch-Partenkirchen, Germany,15-19 July 1996 (TD No. 787)
115. Report of the Meeting of Experts on Atmospheric Urban Pollution and the Role of NMSs (Geneva, 7-11 October 1996) (TD No. 801)
116. Expert Meeting on Chemistry of Aerosols, Clouds and Atmospheric Precipitation in the Former USSR(Sankt Peterburg, Russian Federation, 13-15 November 1995)
117. Report and Proceedings of the Workshop on the Assessment of EMEP Activities Concerning HeavyMetals and Persistent Organic Pollutants and their Further Development (Moscow, RussianFederation, 24-26 September 1996) (Volumes I and II) (TD No. 806)
118. Report of the International Workshops on Ozone Observation in Asia and the Pacific Region(IWOAP, IWOAP-II), (IWOAP, 27 February-26 March 1996 and IWOAP-II, 20 August-18 September1996) (TD No. 827)
119. Report on BoM/NOAA/WMO International Comparison of the Dobson Spectrophotometers (PerthAirport, Perth, Australia, 3-14 February 1997), (prepared by Robert Evans and James Easson) (TDNo. 828)
120. WMO-UMAP Workshop on Broad-Band UV Radiometers (Garmisch-Partenkirchen, Germany, 22-23April 1996) (TD No. 894)
121. Report of the Eighth WMO Meeting of Experts on Carbon Dioxide Concentration and IsotopicMeasurement Techniques (prepared by Thomas Conway) (Boulder, CO, 6-11 July 1995) (TD No.821)
122 Report of Passive Samplers for Atmospheric Chemistry Measurements and their Role in GAW(prepared by Greg Carmichael) (TD No. 829)
123 Report of WMO Meeting of Experts on GAW Regional Network in RA VI, Budapest, Hungary, 5-9May 1997
124 Fifth Session of the EC Panel of Experts/CAS Working Group on Environmental Pollution andAtmospheric Chemistry, (Geneva, Switzerland, 7-10 April 1997) (TD No. 898)
125. Instruments to Measure Solar Ultraviolet Radiation, Part 1: Spectral Instruments (lead author G.Seckmeyer) (TD No. 1066)

135
126. Guidelines for Site Quality Control of UV Monitoring (lead author A.R. Webb) (TD No. 884)
127. Report of the WMO-WHO Meeting of Experts on Standardization of UV Indices and theirDissemination to the Public (Les Diablerets, Switzerland, 21-25 July 1997) (TD No. 921)
128. The Fourth Biennial WMO Consultation on Brewer Ozone and UV Spectrophotometer Operation,Calibration and Data Reporting, (Rome, Italy, 22-25 September 1996) (TD No. 918)
129. Guidelines for Atmospheric Trace Gas Data Management (Ken Masarie and Pieter Tans), 1998 (TDNo. 907)
130. Jülich Ozone Sonde Intercomparison Experiment (JOSIE, 5 February to 8 March 1996), (H.G.J. Smitand D. Kley) (TD No. 926)
131. WMO Workshop on Regional Transboundary Smoke and Haze in Southeast Asia (Singapore, 2-5June 1998) (Gregory R. Carmichael). Two volumes
132. Report of the Ninth WMO Meeting of Experts on Carbon Dioxide Concentration and Related TracerMeasurement Techniques (Edited by Roger Francey), (Aspendale, Vic., Australia)
133. Workshop on Advanced Statistical Methods and their Application to Air Quality Data Sets (Helsinki,14-18 September 1998) (TD No.956)
134. Guide on Sampling and Analysis Techniques for Chemical Constituents and Physical Properties inAir and Precipitation as Applied at Stations of the Global Atmosphere Watch.
Carbon Dioxide
135. Sixth Session of the EC Panel of Experts/CAS Working Group on Environmental Pollution andAtmospheric Chemistry (Zurich, Switzerland, 8-11 March 1999) (WMO TD No.1002)
136. WMO/EMEP/UNEP Workshop on Modelling of Atmospheric Transport and Deposition of PersistentOrganic Pollutants and Heavy Metals (Geneva, Switzerland, 16-19 November 1999) (Volumes I andII) (TD No. 1008)
137. WMO RA-II/RA-V GAW Urban Research Meteorology and Environment (GURME) Workshop(Beijing, China, 1-4 November 1999) (WMO-TD. 1014)
138. Reports on WMO International Comparisons of Dobson Spectrophotometers, Parts I – Arosa,Switzerland, 19-31 July 1999, Part II – Buenos Aires, Argentina (29 Nov. – 12 Dec. 1999 and Part III –Pretoria, South Africa (18 March – 10 April 2000).
139. The Fifth Biennial WMO Consultation on Brewer Ozone and UV Spectrophotometer Operation,Calibration and Data Reporting (Halkidiki, Greece, September 1998)(WMO TD No. 1019).
140. WMO/CEOS Report on a Strategy for Integrating Satellite and Ground-based Observations of Ozone(WMO TD No. 1046).
Related Documents