1 RICE UNIVERSITY World Gas Trade Model: Some Implications for South Korea Amy Myers Jaffe Peter Hartley Kenneth B. Medlock III Presented at an International Energy Seminar on Energy Security of Korea for the Next Decades: Economics and Geopolitics Hosted by The Policy Committee, The Uri Party Organized by Korea Energy Economics Institute (KEEI) Convention Hall, Hyundai Capital Building Seoul, South Korea July 22, 2005 James A. Baker III Institute for Public Policy RICE UNIVERSITY

Welcome message from author
This document is posted to help you gain knowledge. Please leave a comment to let me know what you think about it! Share it to your friends and learn new things together.
Transcript

1
RICEUNIVERSITY
World Gas Trade Model:Some Implications for South Korea
Amy Myers JaffePeter Hartley
Kenneth B. Medlock III
Presented at an International Energy Seminar on
Energy Security of Korea for the Next Decades: Economics and Geopolitics
Hosted by
The Policy Committee, The Uri Party
Organized by Korea Energy Economics Institute (KEEI)
Convention Hall, Hyundai Capital Building
Seoul, South Korea
July 22, 2005
James A. Baker IIIInstitute for Public Policy
RICE UNIVERSITY

2
RICEUNIVERSITY
Overview and motivationWorldwide, the demand for natural gas is rising:
Key reasons for the demand increase:Environmental pressure for cleaner fuelsWholesale electricity market competition raised the demand for smaller scale electricity plant, which CCGT satisfied
The share of gas may continue to rise:Gas may supply transport fuel needs (GTL, oil shale, fuel cell)A possible contrary influence is that coal gasification, solar, hydro and/or nuclear power, perhaps assisted by falling costs of HVDC,could displace gas in electricity generation
Source: EIA
Petroleum (45%)
Natural Gas (19%)
Coal (26%)
Hydroelectric (6%)
Nuclear (3%)Renewables, waste (1%)
Petroleum (38%)
Natural Gas (22%)
Coal (27%)
Hydroelectric (7%)
Nuclear (6%)
Renewables, waste (1%)
Petroleum (36%)
Natural Gas (24%)
Coal (25%)
Hydroelectric (7%)
Nuclear (7%)
Renewables, waste (1%)1980 1990 2002
289.05×10¹⁵
BTU 351.08×10¹⁵
BTU 405.12×10¹⁵
BTU

3
RICEUNIVERSITY
Overview and motivationSouth Korea began importing gas in 1986, but gas was < 5% of Korean primary energy demand until 1994 and is now > 10%
South Korea will face more competition for LNG suppliesThere is high growth in energy demand in China and IndiaDeclining North American and North Sea reserves with increasing demand has stimulated actual and planned LNG importFalling LNG shipping costs have expanded the options for suppliers
World gas supply potential is large, but:It is concentrated in areas remote from marketsProduction and transport infrastructure is requiredPrices need to rise in real terms to finance the investmentsUnstable political regimes may make investments unattractive
Russia could be a big supplier of natural gas to both Europe andAsia, making developments there critical
The Rice World Gas Trade Model, based on economic and geological fundamentals, can be used to examine political and economic influences on the world market for natural gas

4
RICEUNIVERSITY
Rice World Gas Trade ModelModel framework: Market Builder from Altos Partners
The model calculates equilibrium prices and quantities across a fixed number of locations and time periods
In each period, gas is produced or transported until there are no opportunities for profitable arbitrage across locationsProducers schedule production to eliminate profitable arbitrage across time periodsSupplies isolated from markets, or in areas lacking infrastructure, earn lower rents and are extracted lastConsumers shift the timing of demand in response to anticipated changes in prices
The supply data is based on the USGS World Resource Assessmentupdated with latest reserve revisions
The econometric model for forecasting demand was developed usingEIA International Energy Outlook 2004, IEA World Energy Outlook 2002 andWorld Bank data on population and economic growth
The demand for natural gas is related to:The level of economic development (GDP/capita)
Following Medlock and Soligo (2001), energy demand increases with GDP/capita but at a decreasing rateBut the natural gas share in primary energy demand also increases with development
PopulationCountry-specific effects reflecting, for example, resource endowment or climatePrices (wholesale industrial $/BTU) of natural gas, oil and coal
5
RICEUNIVERSITY
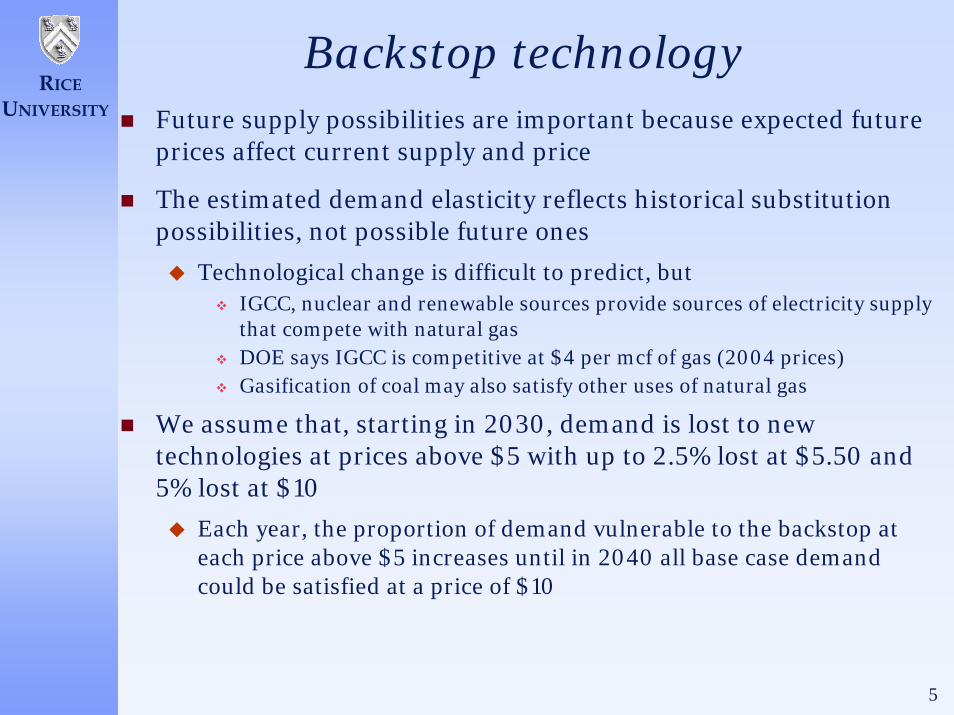
Backstop technologyFuture supply possibilities are important because expected future prices affect current supply and price
The estimated demand elasticity reflects historical substitutionpossibilities, not possible future ones
Technological change is difficult to predict, butIGCC, nuclear and renewable sources provide sources of electricity supply that compete with natural gas DOE says IGCC is competitive at $4 per mcf of gas (2004 prices)Gasification of coal may also satisfy other uses of natural gas
We assume that, starting in 2030, demand is lost to new technologies at prices above $5 with up to 2.5% lost at $5.50 and 5% lost at $10
Each year, the proportion of demand vulnerable to the backstop at each price above $5 increases until in 2040 all base case demandcould be satisfied at a price of $10

6
RICEUNIVERSITY
More detail on supplyRegional resource potential of
associated and unassociated natural gas resources,
both conventional and unconventional gas deposits in North America and Australia (CBM), and
conventional gas deposits in the rest of the world
was assessed in three categories:
proved reserves (2003 Oil & Gas Journal estimates)
growth in known reserves (P-50 USGS estimates)
undiscovered resource (P-50 USGS estimates)
Cost estimates for North America (including Canada and Mexic0) were applied elsewhere based on geological characteristics
The North American estimates (developed by Altos & USGS) include:capital cost of development,operating and maintenance costs, andcost changes by region and deposit type as resources deplete

7
RICEUNIVERSITY
Example cost of supply curves
0
5
10
15
20
25
0 500 1000 1500 2000 2500
Cumulative Reserve Additions (Quadrillion BTU)
Alaska Qatar Saudi Arabia Iran West Siberia
Comparative Cost of Supply Curves for Selected Regions
Sources: USGS, EIA, author calculations

8
RICEUNIVERSITY
Technological change in mining
Technology Curves in the Resource Extraction IndustriesPercentage of Initial Cost
50.0%
60.0%
70.0%
80.0%
90.0%
100.0%
2000 2005 2010 2015 2020 2025 2030 2035 2040 2045 2050
CAPEX OPEX
Source: Adapted from "Balancing Natural Gas Policy" National Petroleum Council, 2003

9
RICEUNIVERSITY
Linking supply with demand

10
RICEUNIVERSITY
Representing transport networksThe model examines a world market of expanding depth and geographical extent
North American, European pipeline networks are now the main transport systems
LNG is only about 5% of world demand, but is important in Japan & Korea, and increasing elsewhere
To allow calculations, supplies and demands are aggregated into discrete “nodes”, parallel pipes are aggregated into a single link, and minor distribution and gathering pipes are ignored
Transport links are inherently discrete
We allow many potential pipeline links including ones that have been discussed and others that might appear profitable at prices calculated in initial iterations of the model
A hub and spoke representation is used for LNG to allow many potential trading partnersWhile bilateral contracts now dominate LNG trade, the market is becoming more flexibleDecreasing distances between suppliers and customers increases arbitrage opportunitiesContracts are financial arrangements that do not necessarily constrain physical trades
Contracts can be fulfilled by swap agreements as increased market depth increases trading options
The model chooses new or expanded transport capacity from supply sources to demand sinks based on:
capital costs of expansion, and
operating and maintenance costs of new and existing capacity

11
RICEUNIVERSITY
Pipeline costs
EIA published cost data for 52 pipeline projects
Using this data, we estimated a regression relating specific capital cost (annual cost per unit of capacity) to project characteristics
Project cost is raised by:Length of the pipelineCrossing mountainsMoving offshore or crossing a lake or seaDeveloping in more populous areas
Higher capacity reduces per unit costs as a result of scale economies

12
RICEUNIVERSITY
LNG transportation network
13
RICEUNIVERSITY
LNG costs
Consulted a variety of sources (including a 2003 EIA report and industry contacts)
Shipping costs split into a fixed capital cost for ship development plus operating costs of:
2.25% of fixed cost of developmentfuel use during transit (0.15% per day)
Liquefaction costs are a fixed cost ($4.11/mcf/yr) plus a variable feed gas cost (model calculated)
Regasification costs vary by location (primarily because land costs vary)
14
RICEUNIVERSITY
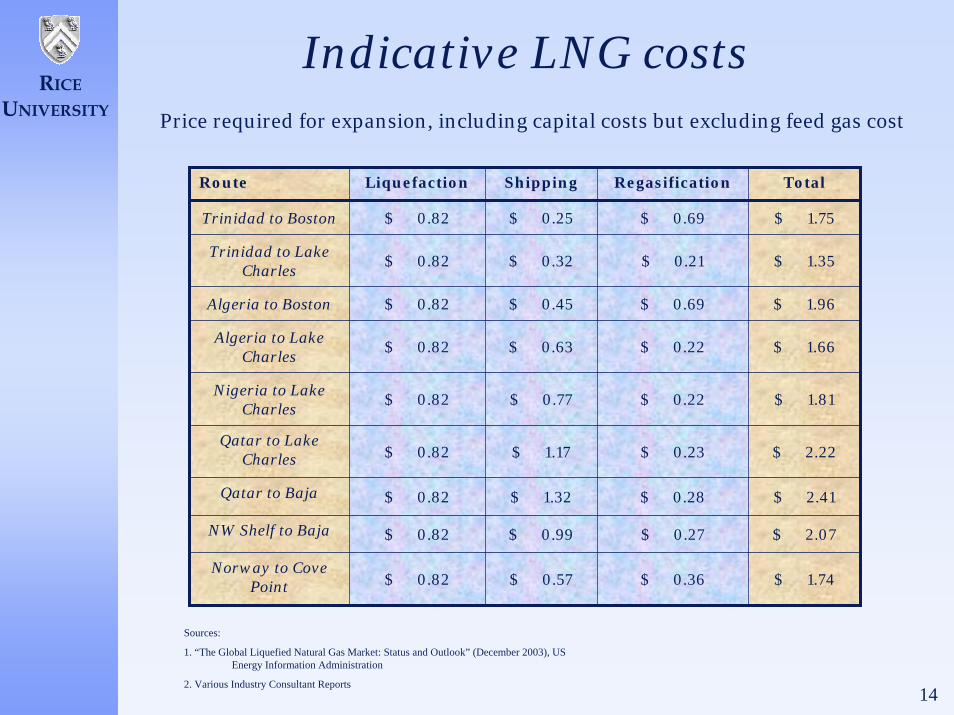
Indicative LNG costsPrice required for expansion, including capital costs but excluding feed gas cost
Route Liquefaction Shipping Regasification Total
Trinidad to Boston $ 0.82 $ 0.25 $ 0.69 $ 1.75
Trinidad to Lake Charles
$ 0.82 $ 0.32 $ 0.21 $ 1.35
Algeria to Boston $ 0.82 $ 0.45 $ 0.69 $ 1.96
Algeria to Lake Charles
$ 0.82 $ 0.63 $ 0.22 $ 1.66
Nigeria to Lake Charles
$ 0.82 $ 0.77 $ 0.22 $ 1.81
Qatar to Lake Charles $ 0.82 $ 1.17 $ 0.23 $ 2.22
Qatar to Baja $ 0.82 $ 1.32 $ 0.28 $ 2.41
NW Shelf to Baja $ 0.82 $ 0.99 $ 0.27 $ 2.07
Norway to Cove Point $ 0.82 $ 0.57 $ 0.36 $ 1.74
Sources:
1. “The Global Liquefied Natural Gas Market: Status and Outlook” (December 2003), US Energy Information Administration
2. Various Industry Consultant Reports

15
RICEUNIVERSITY
Technological change in LNGLNG transport, liquefaction, and regasification capital and O&M costs are expected to decline
Rates of change in the model are based on a statistical fit to WEIO rates
$-
$2.00
$4.00
$6.00
$8.00
$10.00
$12.00
$14.00
$16.00
1995 2000 2005 2010 2015 2020 2025 2030 2035 2040
$/mcf
Total
Regasification
Liquefaction
Shipping
LNG Capital Costs$/MMBtu/yr
Source: World Energy Investment Outlook, 2003 , International Energy Agency

16
RICEUNIVERSITY
Selected price projections
2002 2006 2010 2014 2018 2022 2026 2030 2034 2038$0
$1
$2
$3
$4
$5
$6
$7
$8
Henry Hub
Beijing
Tokyo
Zeebrugge
Buenos Aires
Delhi
Seoul
Source: RWGTM, Hartley and Medlock (2005)
17
RICEUNIVERSITY
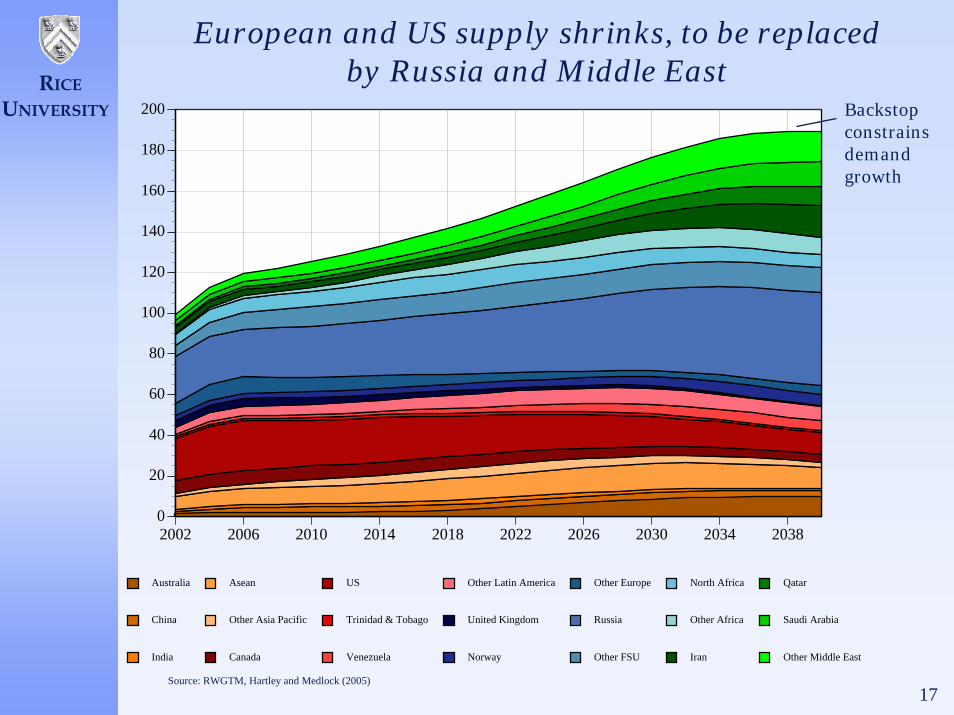
European and US supply shrinks, to be replaced by Russia and Middle East
2002 2006 2010 2014 2018 2022 2026 2030 2034 20380
20
40
60
80
100
120
140
160
180
200
Australia
China
India
Asean
Other Asia Pacific
Canada
US
Trinidad & Tobago
Venezuela
Other Latin America
United Kingdom
Norway
Other Europe
Russia
Other FSU
North Africa
Other Africa
Iran
Qatar
Saudi Arabia
Other Middle East
Source: RWGTM, Hartley and Medlock (2005)
Backstop constrains demand growth

18
RICEUNIVERSITY
Demand projections
2002 2006 2010 2014 2018 2022 2026 2030 2034 20380
20
40
60
80
100
120
140
160
180
200
Australia
China
India
Japan
Asean exporters
Asean importers
Other Asia Pacific
Canada
US
Brazil
Mexico
Venezuela
Other Latin America
France
Germany
Italy
Spain
United Kingdom
Other Europe
Russia
Other FSU
Africa
Iran
Saudi Arabia
Other Middle East
Source: RWGTM, Hartley and Medlock (2005)

19
RICEUNIVERSITY
Natural gas trades
2002 2006 2010 2014 2018 2022 2026 2030 2034 2038-80
-60
-40
-20
0
20
40
60
80
China
India
Japan
Asean importers
Other Asia Pacific
US
Mexico
France
Germany
Italy
Spain
United Kingdom
Other Europe/FSU
Australia
Asean exporters
Canada
Venezuela
Norway
Russia
North Africa
Other Africa
Iran
Qatar
Saudi Arabia
Other Middle East
Other Latin America
Exports
Imports
Source: RWGTM, Hartley and Medlock (2005)

20
RICEUNIVERSITY
LNG exports to come from higher risk sources
2002 2006 2010 2014 2018 2022 2026 2030 2034 20380
10
20
30
40
50
60
Australia
Indonesia
Malaysia
Papua New Guinea
Other Pacific Basin
Qatar
Iran
UAE
Saudia Arabia
Other Middle East
North Africa
Nigeria
Equitorial Guinea
Angola
Greenland
Russia Atlantic
Venezuela
Other Atlantic Basin
Pacific
Mid-East
Atlantic
Source: RWGTM, Hartley and Medlock (2005)
21
RICEUNIVERSITY
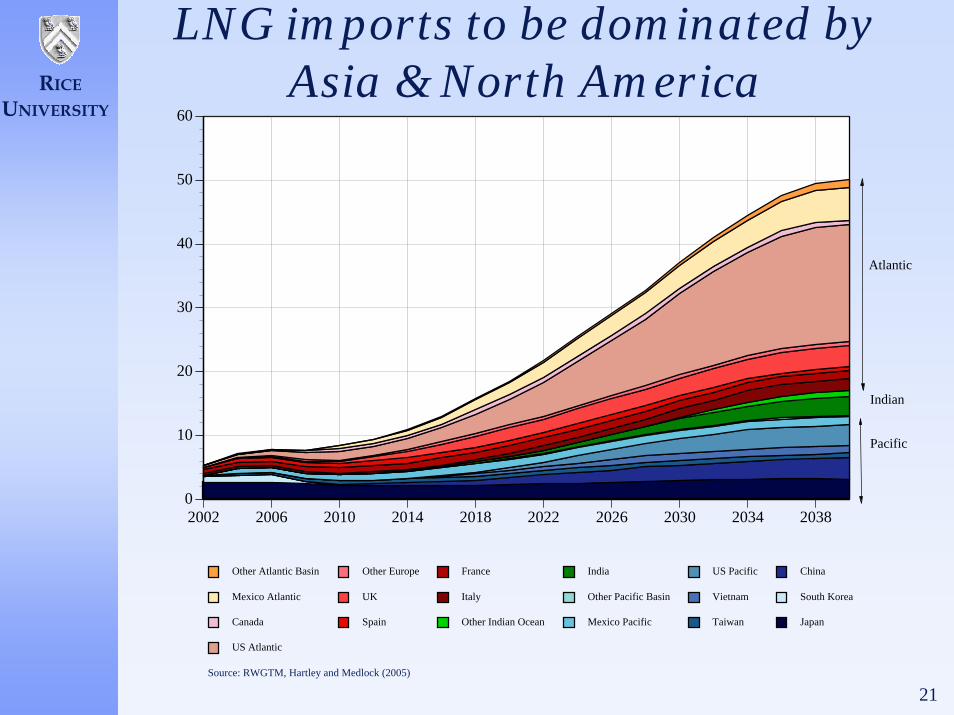
LNG imports to be dominated by Asia & North America
2002 2006 2010 2014 2018 2022 2026 2030 2034 20380
10
20
30
40
50
60
Japan
South Korea
China
Taiwan
Vietnam
US Pacific
Mexico Pacific
Other Pacific Basin
India
Other Indian Ocean
Italy
France
Spain
UK
Other Europe
US Atlantic
Canada
Mexico Atlantic
Other Atlantic Basin
Pacific
Indian
Atlantic
Source: RWGTM, Hartley and Medlock (2005)
22
RICEUNIVERSITY
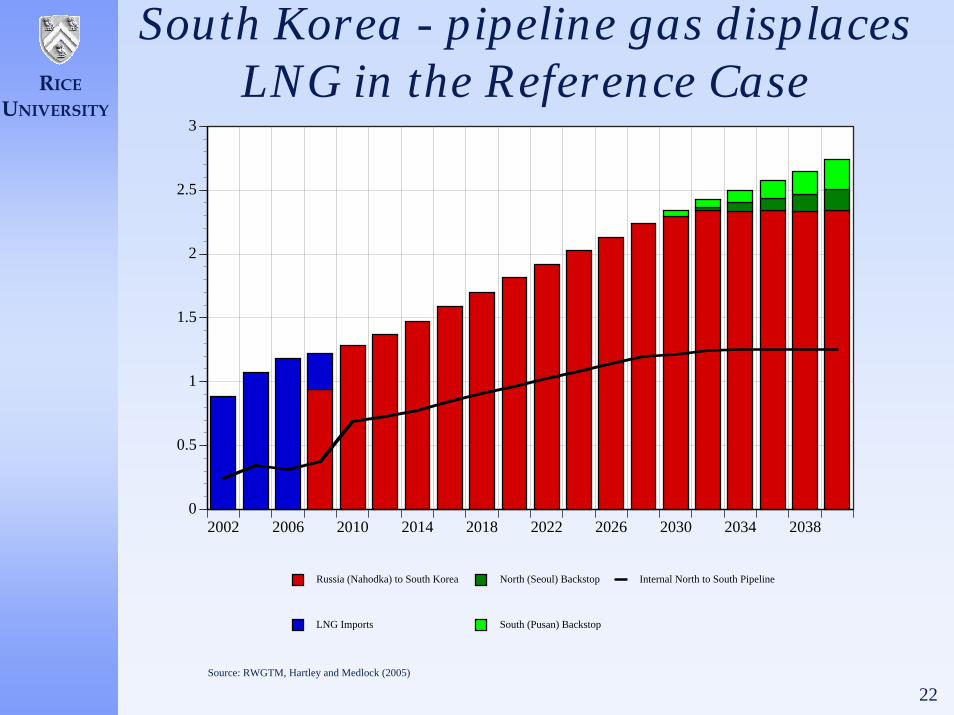
South Korea - pipeline gas displaces LNG in the Reference Case
2002 2006 2010 2014 2018 2022 2026 2030 2034 20380
0.5
1
1.5
2
2.5
3
Russia (Nahodka) to South Korea
LNG Imports
North (Seoul) Backstop
South (Pusan) Backstop
Internal North to South Pipeline
Source: RWGTM, Hartley and Medlock (2005)
23
RICEUNIVERSITY
Some implications of the Reference CaseRussia becomes a major force in the global gas market
Russian pipeline gas continues to be important for EuropeRussia also becomes a major supplier of natural gas to China, Korea and Japan
Japan continues to import LNG as the high cost of a national gas grid is prohibitiveUltimately, gas is also piped east from West SiberiaKorea shifts to pipeline gas from Russia and stops importing LNGIn consequence, Seoul prices fall from approximating Tokyo prices to approximating Beijing prices
Russia also enters the LNG market possibly supplying the US“Net-back” prices in Russia have to be equilibrated
Over the period from 2002-2040 Australia, Qatar and Indonesia are the largest suppliers ofLNG (>40% of total), but in 2040 Iran, Russia and Saudi Arabia join Australia and Qatar to supply more than 60% of LNG exports
Russian pipeline gas exports to Europe and Asia make Russia the dominate exporter overall
Other long-haul international pipelines are constructedThe trans-Saharan pipeline (Nigeria to Algeria) is constructed in 2012India imports Iranian gas via pipeline from 2020Europe also imports gas from the Middle East via Turkey in substantial amounts from 2020A pipeline from West Siberia to East Siberia is constructed in the mid 2030’s to supply NE Asia
North America becomes a major importer of LNGAlaska gas serves only to replace declines in other North American production having no dramatic impact on pricesGas prices in the US eventually exceed prices in JapanRussia, Middle East, Australia retain low gas prices
South American gas is consumed primarily in South AmericaTrinidad LNG export growth is limited to the near term, but Venezuela is significant laterBrazil imports Bolivian and Venezuelan suppliesArgentina imports Bolivian supplies and becomes an LNG importer
A backstop technology is implemented almost everywhere by 2040, but is used most heavily in the US, western Europe and Japan

24
RICEUNIVERSITY
Will Russia Continue to Increase its Oil and Gas Exports?
Sustainable Russian export growth depends on removing major bottlenecks in
Eastern Siberia
Northern route to Barent’s Sea for ocean bound movements by ultra large tankers
Bypass to Bosporus Strait
State control in pipeline sector unlikely to change
Problem of financing –state funds and higher tariffs unlikely to be enough
Outside investors?
State Stabilization Fund?

25
RICEUNIVERSITY
Putin reasserting government control over Russia’s natural resources
Philosophy dates back to late 1990s
Believes in a mixed system of state and private ownership in assets but state protecting the interests of the nation
Since early 2004, new appointments of like minded officials to cabinet, presidential administration and state oil and gas firms
Many have background that includes service in state security organs
Sea change likely to affect business model for Russian industry
New round of redistribution of petroleum assetsCorporate responsibility a la Russe; need to follow “unwritten rules” to succeed in RussiaThese rules involve limits to Western involvement and Western style managementKremlin decides export routes

26
RICEUNIVERSITY
Geopolitical Trends1. Russia actively being courted by U.S., China, Japan,
Europe Kremlin as a moderator of global prices?
2. Kremlin’s plans for industry reorganization is dampening level of increase by disrupting speedy implementation of plans to remove infrastructure constraints or if it causes a slow down in capital expenditures and project development
3. Russia worried about fate of eastern regionsEmigration a demographic threat to Russia’s sovereigntyFears of splintering of oil-rich distant regionsWants to use East Siberian resources to spur local economic develop; many in the Kremlin take a Russia first attitude towards energy resources
4. Energy as key plank to Russia’s diplomacy in AsiaRussia wants to speed up integration process with Asia Pacific but pipeline routing remains an economic and diplomatic problem, but political/diplomatic problems surrounding the routing question remain to be tackled

27
RICEUNIVERSITY
Two scenario analyses
1. Pipelines from Nahodka & NE China through North Korea are blocked
Political relations with North Korea prevent them
An undersea pipeline to South Korea from China can still be built
Connections between South Korea and Japan are also permitted, but these are too expensive to use
2. Russia to China pipelines also don’t get built
Political difficulties may also prevent this developmentWe also rule out the pipeline from Uzbekistan to China
It otherwise provides an indirect route for gas sales from the Volga-Urals region in Russia to China
Sakhalin pipeline to Japan still is possible

28
RICEUNIVERSITY
No North Korea pipes: LNG and China pipeline share South Korean market more equally
2002 2006 2010 2014 2018 2022 2026 2030 2034 20380
0.5
1
1.5
2
2.5
3
LNG Imports
China to South Korea (undersea)
North (Seoul) Backstop
South (Pusan) Backstop
Internal North to South Pipeline

29
RICEUNIVERSITY
No North Korea pipes:Changes in Selected Prices
2002 2006 2010 2014 2018 2022 2026 2030 2034 2038$-1.5
$-1.0
$-0.5
$0.0
$0.5
$1.0
$1.5
Henry Hub
Beijing
Tokyo
Zeebrugge
Buenos Aires
Delhi
Seoul
Price zig-zag results from earlier construction of a pipeline (2006 instead of 2008). The price is lowered below the reference case price in 2006, and no longer falls in 2008 as the reference price does.
30
RICEUNIVERSITY
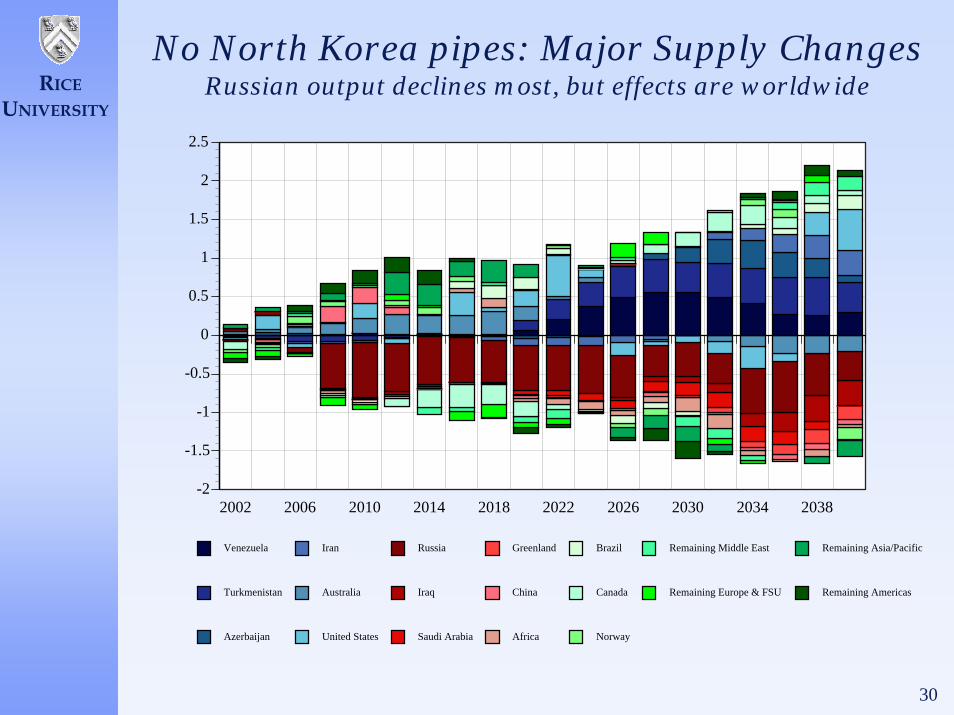
No North Korea pipes: Major Supply ChangesRussian output declines most, but effects are worldwide
2002 2006 2010 2014 2018 2022 2026 2030 2034 2038-2
-1.5
-1
-0.5
0
0.5
1
1.5
2
2.5
Venezuela
Turkmenistan
Azerbaijan
Iran
Australia
United States
Russia
Iraq
Saudi Arabia
Greenland
China
Africa
Brazil
Canada
Norway
Remaining Middle East
Remaining Europe & FSU
Remaining Asia/Pacific
Remaining Americas
31
RICEUNIVERSITY
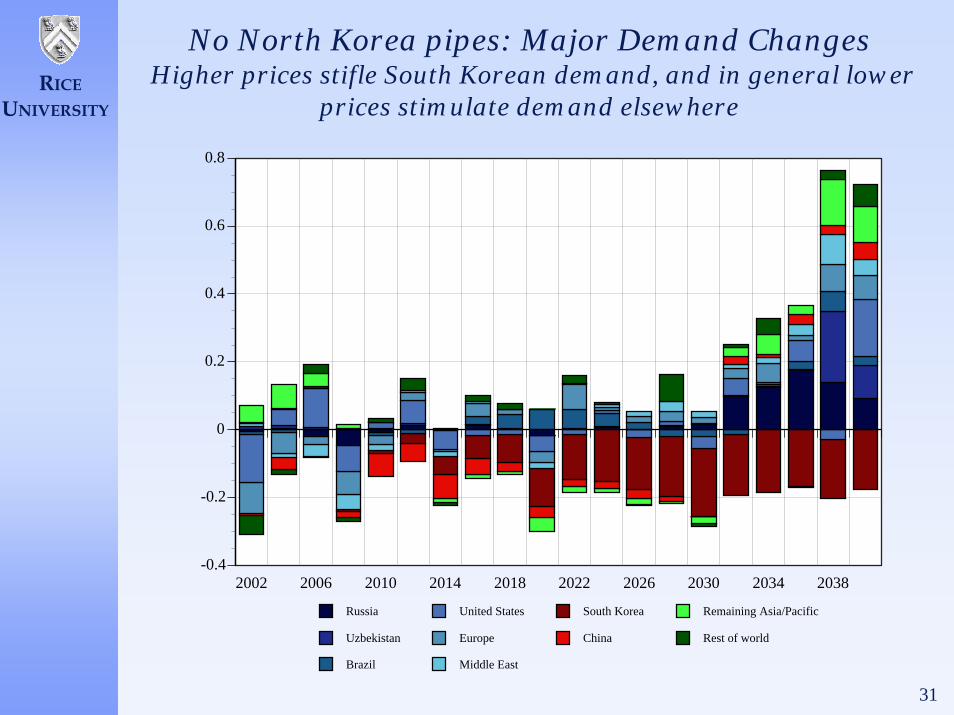
No North Korea pipes: Major Demand ChangesHigher prices stifle South Korean demand, and in general lower
prices stimulate demand elsewhere
2002 2006 2010 2014 2018 2022 2026 2030 2034 2038-0.4
-0.2
0
0.2
0.4
0.6
0.8
Russia
Uzbekistan
Brazil
United States
Europe
Middle East
South Korea
China
Remaining Asia/Pacific
Rest of world

32
RICEUNIVERSITY
No North Korea pipes: Major Changes in LNG SupplyMore Sakhalin gas is now exported as LNG, beating out other LNG
from Australia and Saudi after 2030
2002 2006 2010 2014 2018 2022 2026 2030 2034 2038-1.5
-1
-0.5
0
0.5
1
1.5
2
Russia Pacific
Venezuela
Iran
Papua New Guinea
Brunei
Indonesia
Egypt
Qatar
Philippines
Russia Atlantic
Australia
Greenland
Nigeria
Malaysia
Saudia Arabia
Remaining
33
RICEUNIVERSITY
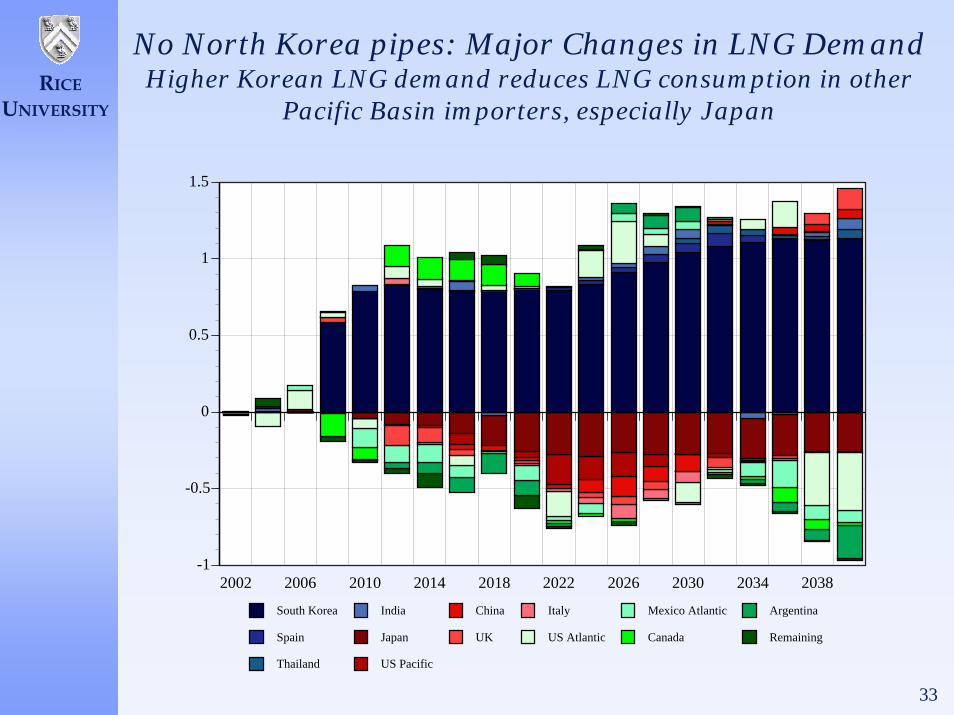
No North Korea pipes: Major Changes in LNG Demand Higher Korean LNG demand reduces LNG consumption in other
Pacific Basin importers, especially Japan
2002 2006 2010 2014 2018 2022 2026 2030 2034 2038-1
-0.5
0
0.5
1
1.5
South Korea
Spain
Thailand
India
Japan
US Pacific
China
UK
Italy
US Atlantic
Mexico Atlantic
Canada
Argentina
Remaining

34
RICEUNIVERSITY
China & Korea pipes off: Effects on Korean Supplies LNG beats a potential Sakhalin-Japan-Korea pipe
2002 2006 2010 2014 2018 2022 2026 2030 2034 20380
0.5
1
1.5
2
2.5
3
LNG Imports
North (Seoul) Backstop
South (Pusan) Backstop
Internal North to South Pipeline

35
RICEUNIVERSITY
China & Korea pipes off:Changes in Selected Prices
2002 2006 2010 2014 2018 2022 2026 2030 2034 2038$-1.0
$-0.5
$0.0
$0.5
$1.0
$1.5
Henry Hub
Beijing
Tokyo
Zeebrugge
Buenos Aires
Delhi
Seoul

36
RICEUNIVERSITY
China & Korea pipes off:Major Supply ChangesNow higher overall LNG demand allows main LNG
exporters (Australia, Iran, Qatar, Indonesia) to expand
2002 2006 2010 2014 2018 2022 2026 2030 2034 2038-3
-2.5
-2
-1.5
-1
-0.5
0
0.5
1
1.5
2
Australia
Iran
Azerbaijan
Qatar
United States
Indonesia
China
Russia
Saudi Arabia
Greenland
Nigeria
Iraq
Canada
Norway
Turkmenistan
Venezuela
Remaining

37
RICEUNIVERSITY
China & Korea pipes off: Major Demand ChangesNow Chinese demand decline exceeds the Korean one; remaining
Pacific Basin importers are again adversely affected
2002 2006 2010 2014 2018 2022 2026 2030 2034 2038-1.4
-1.2
-1
-0.8
-0.6
-0.4
-0.2
0
0.2
0.4
0.6
Russia
Remaining FSU
Middle East
China
South Korea
Remaining Asia Pacific
United States
Canada & Mexico
Africa
Europe
South America

38
RICEUNIVERSITY
China & Korea pipes off: Major Changes in LNG SupplyAgain Sakhalin LNG exports rise, but now the overall LNG market
expands enough that few LNG exports decline
2002 2006 2010 2014 2018 2022 2026 2030 2034 2038-1.5
-1
-0.5
0
0.5
1
1.5
2
2.5
3
3.5
Russia Pacific
Australia
Remaining Pacific Basin
Iran
Saudia Arabia
Qatar
Remaining Middle East
Greenland
Nigeria
Russia Atlantic
Venezuela
Remaining Atlantic Basin
39
RICEUNIVERSITY
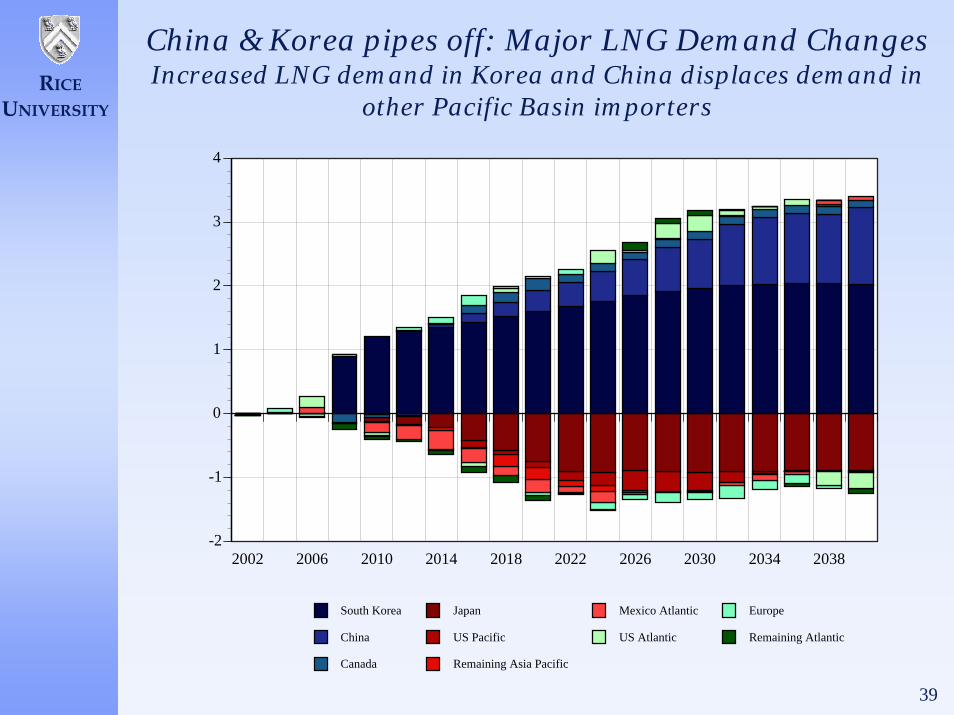
China & Korea pipes off: Major LNG Demand ChangesIncreased LNG demand in Korea and China displaces demand in
other Pacific Basin importers
2002 2006 2010 2014 2018 2022 2026 2030 2034 2038-2
-1
0
1
2
3
4
South Korea
China
Canada
Japan
US Pacific
Remaining Asia Pacific
Mexico Atlantic
US Atlantic
Europe
Remaining Atlantic

40
RICEUNIVERSITY
Some implications of the ResultsIn the coming worldwide market for natural gas, political disturbances in one area have global effects
The results illustrate the key role Russia will play in the future world gas market
Russia not only has a lot of gasIt also is strategically placed to ship gas either east or west and hence in a position to arbitrage between European and Asian marketsToward the end of the horizon, Russia also becomes a significantexporter of LNG, thus helping to solidify the link between LNG prices and pipeline gas prices around the world
North America and the Middle East also link Pacific and Atlanticgas markets
Middle East producers can export LNG east or west, and also can ship gas via pipeline to Europe or the Indian sub-continentIn North America, if Pacific Basin gas prices rise, more Atlantic Basin LNG is imported and the arbitrage point moves toward the west coast
A final point more specific to the Korean experiments is that Japan is a close competitor to South Korea for Pacific Basin LNGand increased Korean demand raises Japanese prices
41
RICEUNIVERSITY
References for further informationDetails on the construction of the model can be found in the paper:
Hartley and Medlock (2005a), “The Baker Institute World Gas Trade Model”, available at
http://www.rice.edu/energy/publications/docs/GAS_BIWGTM_March2005.pdf
Other scenarios are discussed in the companion paper:
Hartley and Medlock (2005b), “Political and Economic Influences on the Future World Market for Natural Gas”, available at
http://www.rice.edu/energy/publications/docs/GAS_PoliticalEconomicInfluences.pdf
The model of economic development and energy demand is explained further in:
Medlock and Soligo (2001), “The Composition and Growth in Energy Demand in China”, available at
http://www.rice.edu/energy/publications/docs/AsianEnergySecurity_CompositionGrowthEnergyDemandChina.pdf
Related Documents