World energy balances : Overview statistics 2017

Welcome message from author
This document is posted to help you gain knowledge. Please leave a comment to let me know what you think about it! Share it to your friends and learn new things together.
Transcript

World energybalances:Overv iew
st
at
is
tic
s
2017

2 - WORLD ENERGY BALANCES: OVERVIEW (2017 edition)
INTERNATIONAL ENERGY AGENCY
The following analysis is an overview from the publication World Energy Balances 2017. Please note that we strongly advise users to read definitions, detailed methodology and country specific notes which can be found online under References at www.iea.org/statistics/topics/energybalances/ Please address your inquiries to [email protected]. Please note that all IEA data are subject to the following Terms and Conditions found on the IEA’s website: http://www.iea.org/t&c/
WORLD ENERGY BALANCES: OVERVIW (2017 edition) - 3
INTERNATIONAL ENERGY AGENCY
WORLD ENERGY BALANCES: AN OVERVIEW
Global trends
This overview provides a detailed look at energy de-velopments based on complete supply and demand data for 2015 for 150 countries and regions and provisional partial supply or production data for 2016.
In 2015, global energy demand as measured by TPES was stable compared to 2014 (+0.3%) at slightly more than 13 600 Mtoe. Such stability resulted from con-trasting trends: In non-OECD countries, energy de-mand rose by 0.5%, whereas in OECD countries it decreased by 0.3% and remained stable in 2016, as discussed in more detail in the OECD section.
Production
World energy production was 13 790 Mtoe in 2015 – 0.6% more than in 2014. Oil production increased the most for the second year in a row (+2.3%), followed by renewables (+1.9%), natural gas and nuclear (+1.4% for each).
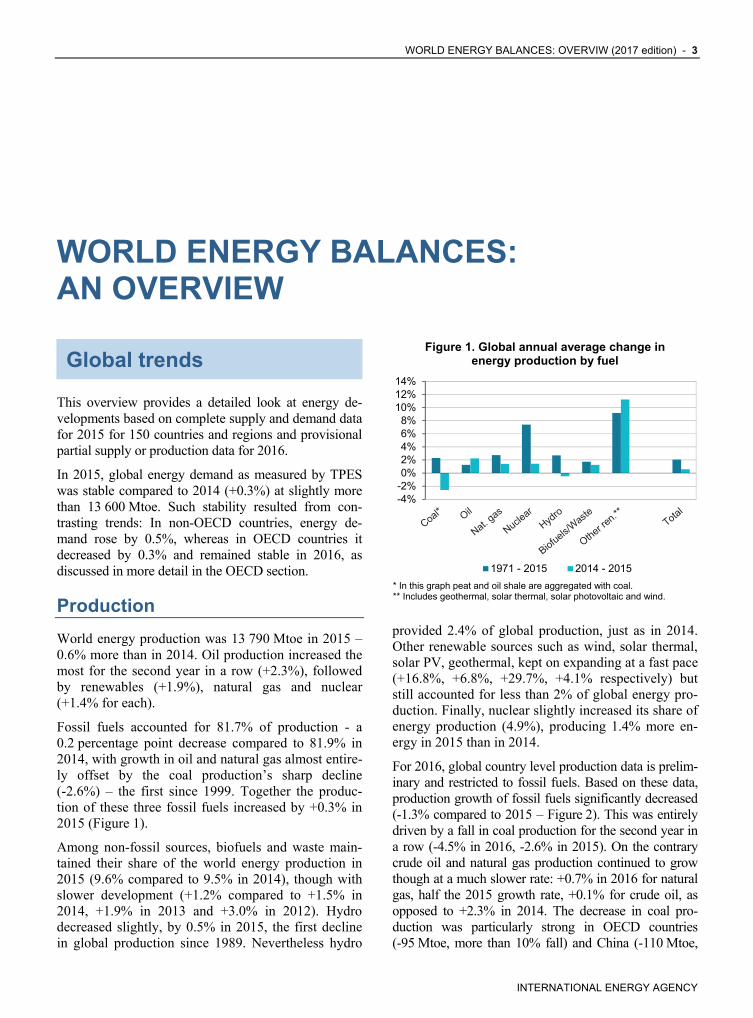
Fossil fuels accounted for 81.7% of production - a 0.2 percentage point decrease compared to 81.9% in 2014, with growth in oil and natural gas almost entire-ly offset by the coal production’s sharp decline (-2.6%) – the first since 1999. Together the produc-tion of these three fossil fuels increased by +0.3% in 2015 (Figure 1).
Among non-fossil sources, biofuels and waste main-tained their share of the world energy production in 2015 (9.6% compared to 9.5% in 2014), though with slower development (+1.2% compared to +1.5% in 2014, +1.9% in 2013 and +3.0% in 2012). Hydro decreased slightly, by 0.5% in 2015, the first decline in global production since 1989. Nevertheless hydro
provided 2.4% of global production, just as in 2014. Other renewable sources such as wind, solar thermal, solar PV, geothermal, kept on expanding at a fast pace (+16.8%, +6.8%, +29.7%, +4.1% respectively) but still accounted for less than 2% of global energy pro-duction. Finally, nuclear slightly increased its share of energy production (4.9%), producing 1.4% more en-ergy in 2015 than in 2014.
For 2016, global country level production data is prelim-inary and restricted to fossil fuels. Based on these data, production growth of fossil fuels significantly decreased (-1.3% compared to 2015 – Figure 2). This was entirely driven by a fall in coal production for the second year in a row (-4.5% in 2016, -2.6% in 2015). On the contrary crude oil and natural gas production continued to grow though at a much slower rate: +0.7% in 2016 for natural gas, half the 2015 growth rate, +0.1% for crude oil, as opposed to +2.3% in 2014. The decrease in coal pro-duction was particularly strong in OECD countries (-95 Mtoe, more than 10% fall) and China (-110 Mtoe,
Figure 1. Global annual average change inenergy production by fuel
* In this graph peat and oil shale are aggregated with coal. ** Includes geothermal, solar thermal, solar photovoltaic and wind.
-4%-2%0%2%4%6%8%
10%12%14%
1971 - 2015 2014 - 2015
4 - WORLD ENERGY BALANCES: OVERVIEW (2017 edition)
INTERNATIONAL ENERGY AGENCY
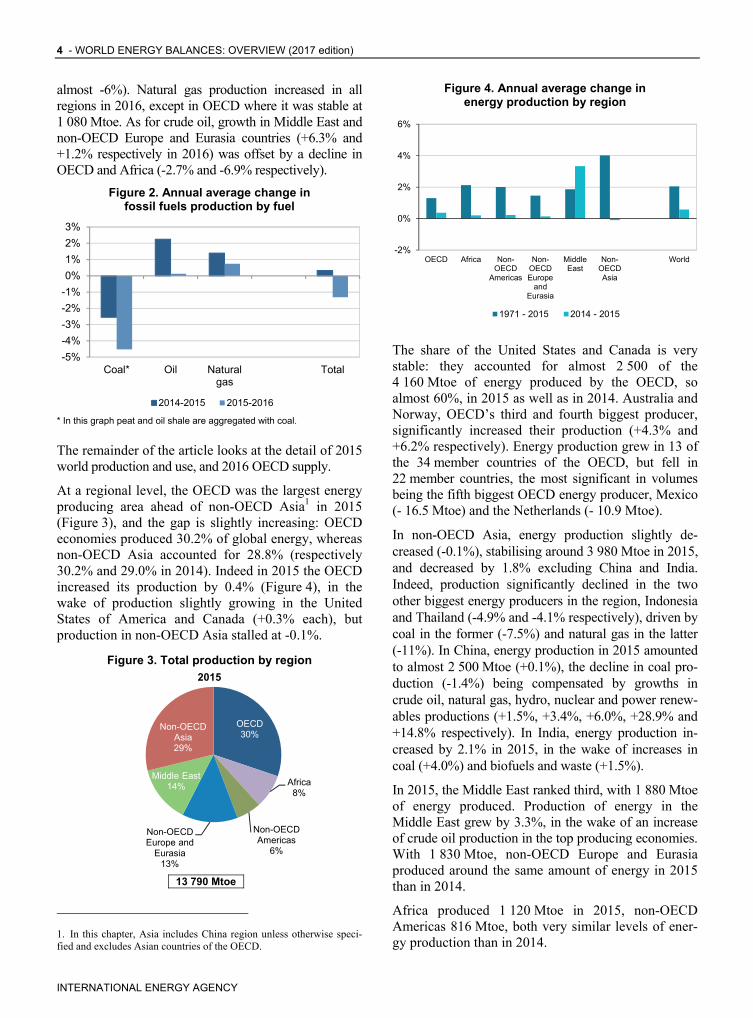
almost -6%). Natural gas production increased in all regions in 2016, except in OECD where it was stable at 1 080 Mtoe. As for crude oil, growth in Middle East and non-OECD Europe and Eurasia countries (+6.3% and +1.2% respectively in 2016) was offset by a decline in OECD and Africa (-2.7% and -6.9% respectively).
Figure 2. Annual average change in fossil fuels production by fuel
* In this graph peat and oil shale are aggregated with coal.
The remainder of the article looks at the detail of 2015 world production and use, and 2016 OECD supply.
At a regional level, the OECD was the largest energy producing area ahead of non-OECD Asia1 in 2015 (Figure 3), and the gap is slightly increasing: OECD economies produced 30.2% of global energy, whereas non-OECD Asia accounted for 28.8% (respectively 30.2% and 29.0% in 2014). Indeed in 2015 the OECD increased its production by 0.4% (Figure 4), in the wake of production slightly growing in the United States of America and Canada (+0.3% each), but production in non-OECD Asia stalled at -0.1%.
Figure 3. Total production by region 2015
13 790 Mtoe
1. In this chapter, Asia includes China region unless otherwise speci-fied and excludes Asian countries of the OECD.
Figure 4. Annual average change in energy production by region
The share of the United States and Canada is very stable: they accounted for almost 2 500 of the 4 160 Mtoe of energy produced by the OECD, so almost 60%, in 2015 as well as in 2014. Australia and Norway, OECD’s third and fourth biggest producer, significantly increased their production (+4.3% and +6.2% respectively). Energy production grew in 13 of the 34 member countries of the OECD, but fell in 22 member countries, the most significant in volumes being the fifth biggest OECD energy producer, Mexico (- 16.5 Mtoe) and the Netherlands (- 10.9 Mtoe).
In non-OECD Asia, energy production slightly de-creased (-0.1%), stabilising around 3 980 Mtoe in 2015, and decreased by 1.8% excluding China and India. Indeed, production significantly declined in the two other biggest energy producers in the region, Indonesia and Thailand (-4.9% and -4.1% respectively), driven by coal in the former (-7.5%) and natural gas in the latter (-11%). In China, energy production in 2015 amounted to almost 2 500 Mtoe (+0.1%), the decline in coal pro-duction (-1.4%) being compensated by growths in crude oil, natural gas, hydro, nuclear and power renew-ables productions (+1.5%, +3.4%, +6.0%, +28.9% and +14.8% respectively). In India, energy production in-creased by 2.1% in 2015, in the wake of increases in coal (+4.0%) and biofuels and waste (+1.5%).
In 2015, the Middle East ranked third, with 1 880 Mtoe of energy produced. Production of energy in the Middle East grew by 3.3%, in the wake of an increase of crude oil production in the top producing economies. With 1 830 Mtoe, non-OECD Europe and Eurasia produced around the same amount of energy in 2015 than in 2014.
Africa produced 1 120 Mtoe in 2015, non-OECD Americas 816 Mtoe, both very similar levels of ener-gy production than in 2014.
-5%
-4%
-3%
-2%
-1%
0%
1%
2%
3%
Coal* Oil Naturalgas
Total
2014-2015 2015-2016
OECD30%
Africa 8%
Non-OECD Americas
6%
Non-OECD Europe and
Eurasia13%
Middle East14%
Non-OECD Asia29%
-2%
0%
2%
4%
6%
OECD Africa Non-OECD
Americas
Non-OECDEurope
andEurasia
MiddleEast
Non-OECDAsia
World
1971 - 2015 2014 - 2015
WORLD ENERGY BALANCES: OVERVIW (2017 edition) - 5
INTERNATIONAL ENERGY AGENCY
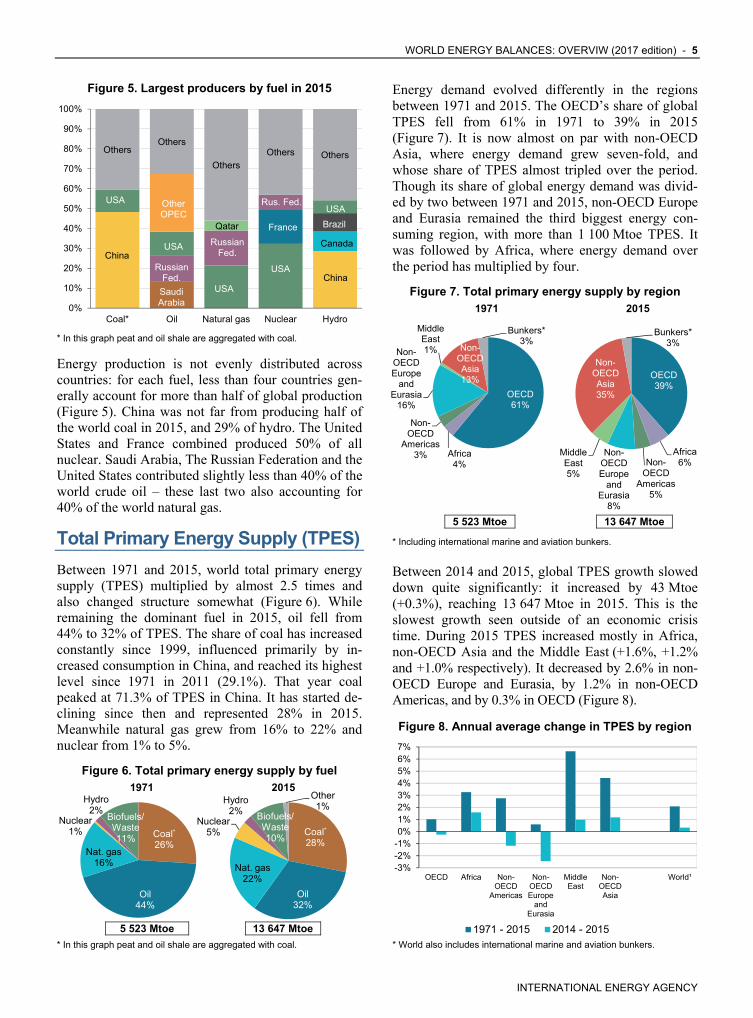
Figure 5. Largest producers by fuel in 2015
* In this graph peat and oil shale are aggregated with coal.
Energy production is not evenly distributed across countries: for each fuel, less than four countries gen-erally account for more than half of global production (Figure 5). China was not far from producing half of the world coal in 2015, and 29% of hydro. The United States and France combined produced 50% of all nuclear. Saudi Arabia, The Russian Federation and the United States contributed slightly less than 40% of the world crude oil – these last two also accounting for 40% of the world natural gas.
Total Primary Energy Supply (TPES)
Between 1971 and 2015, world total primary energy supply (TPES) multiplied by almost 2.5 times and also changed structure somewhat (Figure 6). While remaining the dominant fuel in 2015, oil fell from 44% to 32% of TPES. The share of coal has increased constantly since 1999, influenced primarily by in-creased consumption in China, and reached its highest level since 1971 in 2011 (29.1%). That year coal peaked at 71.3% of TPES in China. It has started de-clining since then and represented 28% in 2015. Meanwhile natural gas grew from 16% to 22% and nuclear from 1% to 5%.
Figure 6. Total primary energy supply by fuel 1971 2015
5 523 Mtoe 13 647 Mtoe
* In this graph peat and oil shale are aggregated with coal.
Energy demand evolved differently in the regions between 1971 and 2015. The OECD’s share of global TPES fell from 61% in 1971 to 39% in 2015 (Figure 7). It is now almost on par with non-OECD Asia, where energy demand grew seven-fold, and whose share of TPES almost tripled over the period. Though its share of global energy demand was divid-ed by two between 1971 and 2015, non-OECD Europe and Eurasia remained the third biggest energy con-suming region, with more than 1 100 Mtoe TPES. It was followed by Africa, where energy demand over the period has multiplied by four.
Figure 7. Total primary energy supply by region 1971 2015
5 523 Mtoe 13 647 Mtoe
* Including international marine and aviation bunkers.
Between 2014 and 2015, global TPES growth slowed down quite significantly: it increased by 43 Mtoe (+0.3%), reaching 13 647 Mtoe in 2015. This is the slowest growth seen outside of an economic crisis time. During 2015 TPES increased mostly in Africa, non-OECD Asia and the Middle East (+1.6%, +1.2% and +1.0% respectively). It decreased by 2.6% in non-OECD Europe and Eurasia, by 1.2% in non-OECD Americas, and by 0.3% in OECD (Figure 8).
Figure 8. Annual average change in TPES by region
* World also includes international marine and aviation bunkers.
OthersOthers
Others
Others Others
0%
10%
20%
30%
40%
50%
60%
70%
80%
90%
100%
Coal* Oil Natural gas Nuclear Hydro
China
USA Other OPEC
USA
Russian Fed.
Saudi Arabia
Qatar
USA
Russian Fed.
Rus. Fed.
France
USA
USA
Canada
China
Brazil
-3%-2%-1%0%1%2%3%4%5%6%7%
OECD Africa Non-OECD
Americas
Non-OECDEurope
andEurasia
MiddleEast
Non-OECDAsia
World¹
1971 - 2015 2014 - 2015
Coal*
26%
Oil44%
Nat. gas16%
Nuclear1%
Hydro2%
Biofuels/Waste11%
Coal*
28%
Oil32%
Nat. gas22%
Nuclear5%
Hydro2% Biofuels/
Waste10%
Other1%
OECD61%
Africa4%
Non-OECD
Americas3%
Non-OECD Europe
and Eurasia
16%
Middle East 1% Non-
OECD Asia 13%
Bunkers*3%
OECD39%
Africa6%Non-
OECD Americas
5%
Non-OECD Europe
and Eurasia
8%
Middle East 5%
Non-OECD Asia 35%
Bunkers*3%

6 - WORLD ENERGY BALANCES: OVERVIEW (2017 edition)
INTERNATIONAL ENERGY AGENCY
Non-OECD countries account for a continuously growing share of the world energy consumption. In 2015, China accounted for 22% of global TPES while the United States accounted for 16% (Table 1). India and the Russian Federation ranked third and fourth, respectively. Japan, the second largest OECD con-suming country, was in fifth position. Together, these five countries accounted for more than half the global TPES in 2015.
Table 1. TPES – top ten countries in 2015 and 1971
Country TPES (Mtoe)
Share in world TPES
2015 1971
People’s Rep. of China 2 973 22% 7% United States 2 188 16% 29% India 851 6% 3% Russian Federation 710 5% N/A Japan 430 3% 5% Germany 308 2% 6% Brazil 298 2% 1% Canada 273 2% 0.3% Korea 270 2% 3% France 247 2% 3% Rest of the world 5 099 37% 44%
World 13 647 100% 100%
Global energy demand was even more concentrated in 2015 compared to 1971, as the top ten countries repre-sented 63% of global energy demand, as opposed to 56% in 1971.
In 2015, the top five countries in terms of TPES ac-counted for less than half of the world GDP2, and world population (47% and 45% respectively) but consumed 52% of total world energy. However, the relative shares of GDP, population and TPES of these five countries significantly varied from one to another (Figure 9).
The United States consumed 16% of world energy, with 4% of the world’s population. Conversely, China and India consumed 22% and 6% of global energy respectively, but accounted for 19% and 18% of the global population. The Russian Federation and Japan also consumed significant amounts of energy in 2015 (5.2% and 3.1% of global TPES respectively). How-ever, energy intensities differed significantly. To pro-duce the same amount of wealth, as measured by GDP in PPP, the Russian Federation consumed 2.4 times as much energy as Japan (the country with the lowest
2. In this chapter, GDP refers to GDP using purchasing power parities.
energy intensity of the five top energy consumers), and twice as much than India, in 2015; naturally such comparisons reflect the importance of specific indus-tries in each country.
Figure 9. Top five energy consumers: 2015 relative shares*
* Relative shares within the top five, which differ from shares in the world total.
Though still dominant, power generation from coal has been decreasing for the three last years, reaching 39.3% of the electricity produced globally in 2015, its lowest share since 2002 (Figure 10). Generation from gas grew slowly to reach 15% in 1990; since then steady increases have seen it grow to 22.9% in 2015. This is around the same share as renewables (22.8%) which initially was dominated by hydro, but recent growth has come from the development of wind and solar PV. Nuclear production had steadily increased in the 1970s and 1980s, before plateauing at around 17% of electricity and then declining since the 2000s. Pow-er production from oil has peaked at almost 25% of power production in 1973, just before the oil crisis, and has been declining since then. From being the second fuel used for electricity production after coal, it has become the fifth.
Figure 10. World electricity generation mix 1971-2015
* Other includes non renewable waste and non renewable heat.
0%
20%
40%
60%
80%
100%
TPES Population GDP PPP
Japan
RussianFederation
India
UnitedStates
China
0%
5%
10%
15%
20%
25%
30%
35%
40%
45%Nuclear
Coal
Oil
Natural gas
Renewables
Other*
WORLD ENERGY BALANCES: OVERVIW (2017 edition) - 7
INTERNATIONAL ENERGY AGENCY
Total Final Consumption (TFC)
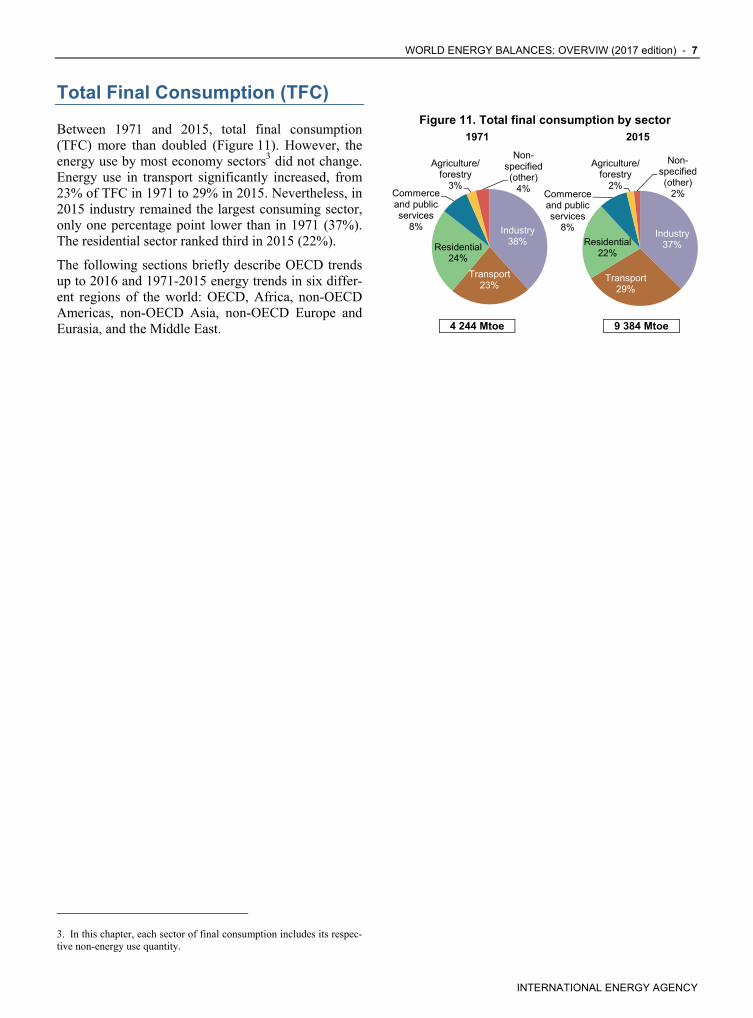
Between 1971 and 2015, total final consumption (TFC) more than doubled (Figure 11). However, the energy use by most economy sectors3 did not change. Energy use in transport significantly increased, from 23% of TFC in 1971 to 29% in 2015. Nevertheless, in 2015 industry remained the largest consuming sector, only one percentage point lower than in 1971 (37%). The residential sector ranked third in 2015 (22%).
The following sections briefly describe OECD trends up to 2016 and 1971-2015 energy trends in six differ-ent regions of the world: OECD, Africa, non-OECD Americas, non-OECD Asia, non-OECD Europe and Eurasia, and the Middle East.
3. In this chapter, each sector of final consumption includes its respec-tive non-energy use quantity.
Figure 11. Total final consumption by sector 1971 2015
4 244 Mtoe 9 384 Mtoe
Industry 38%
Transport 23%
Residential 24%
Commerce and public services
8%
Agriculture/forestry
3%
Non-specified (other)
4%
Industry 37%
Transport 29%
Residential 22%
Commerce and public services
8%
Agriculture/forestry
2%
Non-specified (other)
2%
8 - WORLD ENERGY BALANCES: OVERVIEW (2017 edition)
INTERNATIONAL ENERGY AGENCY
OECD
Key supply trends in 2016
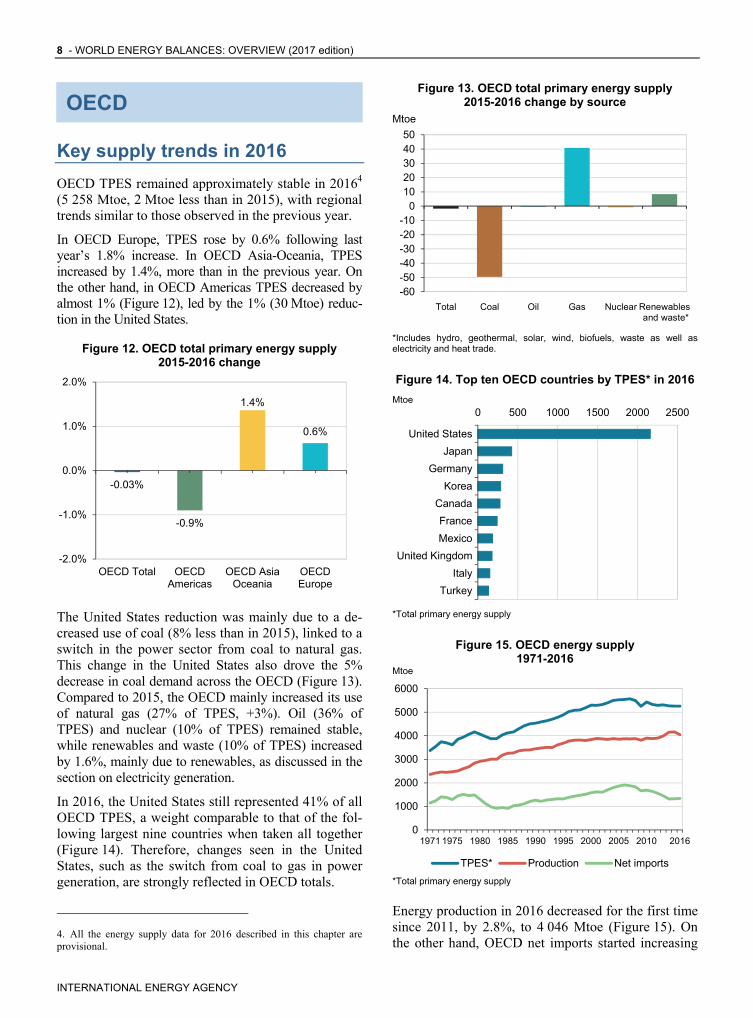
OECD TPES remained approximately stable in 20164 (5 258 Mtoe, 2 Mtoe less than in 2015), with regional trends similar to those observed in the previous year.
In OECD Europe, TPES rose by 0.6% following last year’s 1.8% increase. In OECD Asia-Oceania, TPES increased by 1.4%, more than in the previous year. On the other hand, in OECD Americas TPES decreased by almost 1% (Figure 12), led by the 1% (30 Mtoe) reduc-tion in the United States.
Figure 12. OECD total primary energy supply 2015-2016 change
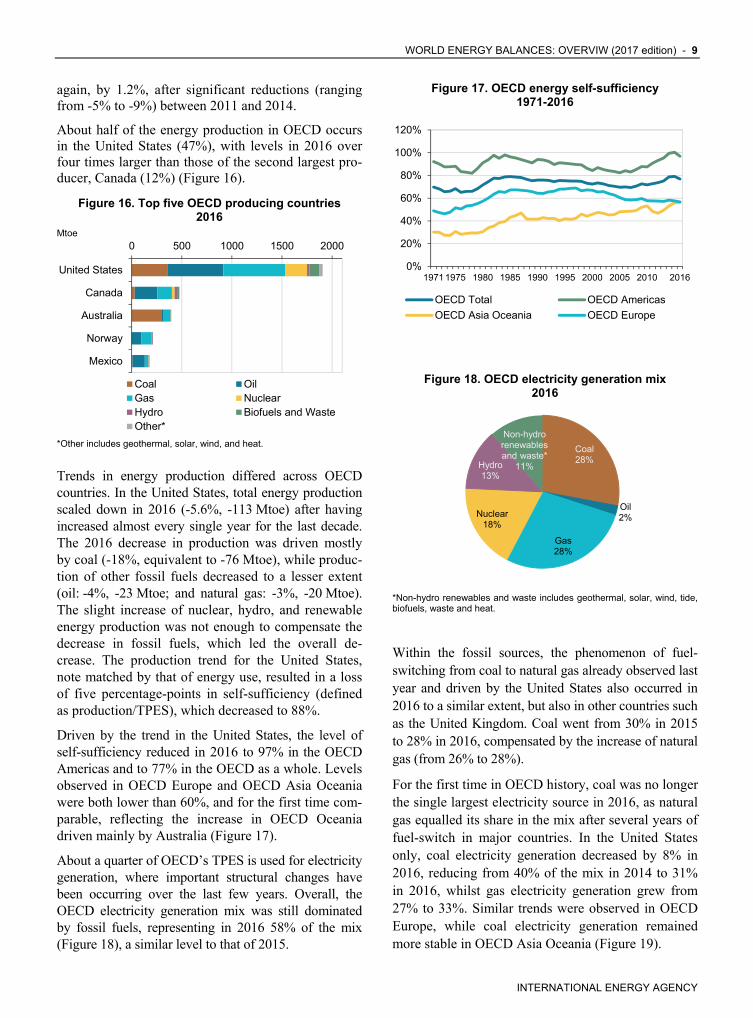
The United States reduction was mainly due to a de-creased use of coal (8% less than in 2015), linked to a switch in the power sector from coal to natural gas. This change in the United States also drove the 5% decrease in coal demand across the OECD (Figure 13). Compared to 2015, the OECD mainly increased its use of natural gas (27% of TPES, +3%). Oil (36% of TPES) and nuclear (10% of TPES) remained stable, while renewables and waste (10% of TPES) increased by 1.6%, mainly due to renewables, as discussed in the section on electricity generation.
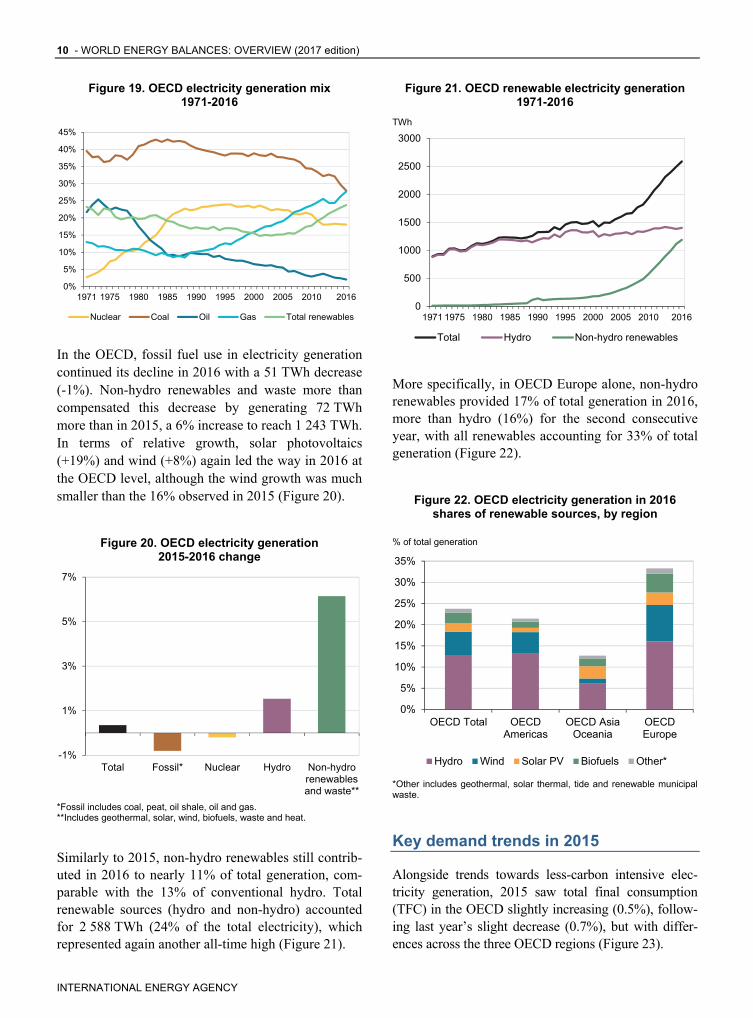
In 2016, the United States still represented 41% of all OECD TPES, a weight comparable to that of the fol-lowing largest nine countries when taken all together (Figure 14). Therefore, changes seen in the United States, such as the switch from coal to gas in power generation, are strongly reflected in OECD totals.
4. All the energy supply data for 2016 described in this chapter are provisional.
Figure 13. OECD total primary energy supply 2015-2016 change by source
Mtoe
*Includes hydro, geothermal, solar, wind, biofuels, waste as well as electricity and heat trade.
Figure 14. Top ten OECD countries by TPES* in 2016
Mtoe
*Total primary energy supply
Figure 15. OECD energy supply 1971-2016
Mtoe
*Total primary energy supply
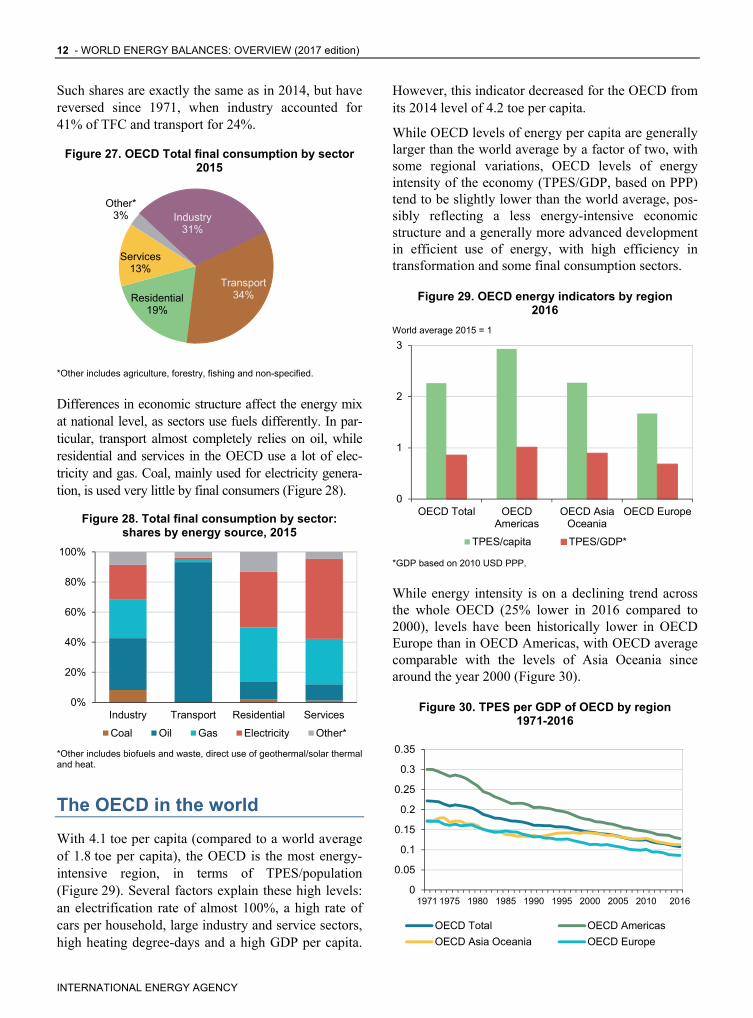
Energy production in 2016 decreased for the first time since 2011, by 2.8%, to 4 046 Mtoe (Figure 15). On the other hand, OECD net imports started increasing
-0.03%
-0.9%
1.4%
0.6%
-2.0%
-1.0%
0.0%
1.0%
2.0%
OECD Total OECDAmericas
OECD AsiaOceania
OECDEurope
-60-50-40-30-20-10
01020304050
Total Coal Oil Gas Nuclear Renewables and waste*
0 500 1000 1500 2000 2500
Turkey
Italy
United Kingdom
Mexico
France
Canada
Korea
Germany
Japan
United States
0
1000
2000
3000
4000
5000
6000
1971 1975 1980 1985 1990 1995 2000 2005 2010 2016
TPES* Production Net imports
WORLD ENERGY BALANCES: OVERVIW (2017 edition) - 9
INTERNATIONAL ENERGY AGENCY
again, by 1.2%, after significant reductions (ranging from -5% to -9%) between 2011 and 2014.
About half of the energy production in OECD occurs in the United States (47%), with levels in 2016 over four times larger than those of the second largest pro-ducer, Canada (12%) (Figure 16).
Figure 16. Top five OECD producing countries 2016
Mtoe
*Other includes geothermal, solar, wind, and heat.
Trends in energy production differed across OECD countries. In the United States, total energy production scaled down in 2016 (-5.6%, -113 Mtoe) after having increased almost every single year for the last decade. The 2016 decrease in production was driven mostly by coal (-18%, equivalent to -76 Mtoe), while produc-tion of other fossil fuels decreased to a lesser extent (oil: -4%, -23 Mtoe; and natural gas: -3%, -20 Mtoe). The slight increase of nuclear, hydro, and renewable energy production was not enough to compensate the decrease in fossil fuels, which led the overall de-crease. The production trend for the United States, note matched by that of energy use, resulted in a loss of five percentage-points in self-sufficiency (defined as production/TPES), which decreased to 88%.
Driven by the trend in the United States, the level of self-sufficiency reduced in 2016 to 97% in the OECD Americas and to 77% in the OECD as a whole. Levels observed in OECD Europe and OECD Asia Oceania were both lower than 60%, and for the first time com-parable, reflecting the increase in OECD Oceania driven mainly by Australia (Figure 17).
About a quarter of OECD’s TPES is used for electricity generation, where important structural changes have been occurring over the last few years. Overall, the OECD electricity generation mix was still dominated by fossil fuels, representing in 2016 58% of the mix (Figure 18), a similar level to that of 2015.
Figure 17. OECD energy self-sufficiency 1971-2016
Figure 18. OECD electricity generation mix 2016
*Non-hydro renewables and waste includes geothermal, solar, wind, tide, biofuels, waste and heat.
Within the fossil sources, the phenomenon of fuel-switching from coal to natural gas already observed last year and driven by the United States also occurred in 2016 to a similar extent, but also in other countries such as the United Kingdom. Coal went from 30% in 2015 to 28% in 2016, compensated by the increase of natural gas (from 26% to 28%).
For the first time in OECD history, coal was no longer the single largest electricity source in 2016, as natural gas equalled its share in the mix after several years of fuel-switch in major countries. In the United States only, coal electricity generation decreased by 8% in 2016, reducing from 40% of the mix in 2014 to 31% in 2016, whilst gas electricity generation grew from 27% to 33%. Similar trends were observed in OECD Europe, while coal electricity generation remained more stable in OECD Asia Oceania (Figure 19).
0 500 1000 1500 2000
United States
Canada
Australia
Norway
Mexico
Coal OilGas NuclearHydro Biofuels and WasteOther*
0%
20%
40%
60%
80%
100%
120%
1971 1975 1980 1985 1990 1995 2000 2005 2010 2016
OECD Total OECD Americas
OECD Asia Oceania OECD Europe
Coal 28%
Oil 2%
Gas 28%
Nuclear 18%
Hydro 13%
Non-hydro renewables and waste*
11%
10 - WORLD ENERGY BALANCES: OVERVIEW (2017 edition)
INTERNATIONAL ENERGY AGENCY
Figure 19. OECD electricity generation mix 1971-2016
In the OECD, fossil fuel use in electricity generation continued its decline in 2016 with a 51 TWh decrease (-1%). Non-hydro renewables and waste more than compensated this decrease by generating 72 TWh more than in 2015, a 6% increase to reach 1 243 TWh. In terms of relative growth, solar photovoltaics (+19%) and wind (+8%) again led the way in 2016 at the OECD level, although the wind growth was much smaller than the 16% observed in 2015 (Figure 20).
Figure 20. OECD electricity generation 2015-2016 change
*Fossil includes coal, peat, oil shale, oil and gas. **Includes geothermal, solar, wind, biofuels, waste and heat.
Similarly to 2015, non-hydro renewables still contrib-uted in 2016 to nearly 11% of total generation, com-parable with the 13% of conventional hydro. Total renewable sources (hydro and non-hydro) accounted for 2 588 TWh (24% of the total electricity), which represented again another all-time high (Figure 21).
Figure 21. OECD renewable electricity generation 1971-2016
TWh
More specifically, in OECD Europe alone, non-hydro renewables provided 17% of total generation in 2016, more than hydro (16%) for the second consecutive year, with all renewables accounting for 33% of total generation (Figure 22).
Figure 22. OECD electricity generation in 2016 shares of renewable sources, by region
% of total generation
*Other includes geothermal, solar thermal, tide and renewable municipal waste.
Key demand trends in 2015
Alongside trends towards less-carbon intensive elec-tricity generation, 2015 saw total final consumption (TFC) in the OECD slightly increasing (0.5%), follow-ing last year’s slight decrease (0.7%), but with differ-ences across the three OECD regions (Figure 23).
0%
5%
10%
15%
20%
25%
30%
35%
40%
45%
1971 1975 1980 1985 1990 1995 2000 2005 2010 2016
Nuclear Coal Oil Gas Total renewables
-1%
1%
3%
5%
7%
Total Fossil* Nuclear Hydro Non-hydrorenewablesand waste**
0
500
1000
1500
2000
2500
3000
1971 1975 1980 1985 1990 1995 2000 2005 2010 2016
Total Hydro Non-hydro renewables
0%
5%
10%
15%
20%
25%
30%
35%
OECD Total OECDAmericas
OECD AsiaOceania
OECDEurope
Hydro Wind Solar PV Biofuels Other*

WORLD ENERGY BALANCES: OVERVIW (2017 edition) - 11
INTERNATIONAL ENERGY AGENCY
Figure 23. OECD Total final consumption 2014-2015 change by region
In 2015, final consumption increased in OECD Eu-rope compared to 2014 levels due to 2015 being a colder winter, whilst it fell slightly in OECD Ameri-cas, which is the opposite of the observed trends last year. Overall, the OECD final consumption has been generally flat over the last five years, around levels comparable to those of the early 2000’s (Figure 24).
Figure 24. OECD Total final consumption by region, 1971-2015
Mtoe
At the sectoral level, industry and residential consump-tion decreased in 2015 by 1%, whilst transport consump-tion increased by nearly 2%, notably through an increase in road consumption, half of which happened in the United States. In OECD Europe, the over 2% increase in TFC was driven by increases in residential energy con-sumption (+12 Mtoe), road transport (+8.3 Mtoe) and commerce and public services (+7 Mtoe). The increase in buildings consumption should be put in perspective with a relatively low 2014 consumption figure due to warmer winter conditions.
With slight variations in TFC and a growing GDP, the general decoupling of economic growth from energy consumption observed over the years continued across the OECD (Figure 25).
Figure 25. Final energy intensity in OECD 1971-2015
1971=100
*GDP based on 2010 USD PPP.
Changes in final energy intensities are very different across countries, depending on changes in economic structures and on efficiency improvements. However, sectoral energy intensities (defined based on the national GDP) also show decreasing trends and levels, with the downward trend continuing in 2015 for all sectors of consumption (Figure 26).
Figure 26. Sectoral energy intensities* in OECD 1971-2015
toe/million USD PPP
*Defined as sectoral final consumption/GDP PPP.
The structure of OECD TFC shows that transport was again the largest energy consuming sector in 2015, accounting for roughly a third of final energy con-sumption, followed by industry with 31% (Figure 27).
0.5%
-0.7%
0.3%
2.3%
-1%
-1%
0%
1%
1%
2%
2%
3%
OECD Total OECDAmericas
OECD AsiaOceania
OECDEurope
0
500
1000
1500
2000
1971 1975 1980 1985 1990 1995 2000 2005 2010 2015
OECD Americas OECD Asia OceaniaOECD Europe
0
50
100
150
200
250
300
350
1971 1975 1980 1985 1990 1995 2000 2005 2010 2015
GDP* Total Final Consumption (TFC) TFC/GDP*
0
10
20
30
40
50
60
70
1971 1975 1980 1985 1990 1995 2000 2005 2010 2015
Industry Transport Residential Services
12 - WORLD ENERGY BALANCES: OVERVIEW (2017 edition)
INTERNATIONAL ENERGY AGENCY
Such shares are exactly the same as in 2014, but have reversed since 1971, when industry accounted for 41% of TFC and transport for 24%.
Figure 27. OECD Total final consumption by sector 2015
*Other includes agriculture, forestry, fishing and non-specified.
Differences in economic structure affect the energy mix at national level, as sectors use fuels differently. In par-ticular, transport almost completely relies on oil, while residential and services in the OECD use a lot of elec-tricity and gas. Coal, mainly used for electricity genera-tion, is used very little by final consumers (Figure 28).
Figure 28. Total final consumption by sector: shares by energy source, 2015
*Other includes biofuels and waste, direct use of geothermal/solar thermal and heat.
The OECD in the world
With 4.1 toe per capita (compared to a world average of 1.8 toe per capita), the OECD is the most energy-intensive region, in terms of TPES/population (Figure 29). Several factors explain these high levels: an electrification rate of almost 100%, a high rate of cars per household, large industry and service sectors, high heating degree-days and a high GDP per capita.
However, this indicator decreased for the OECD from its 2014 level of 4.2 toe per capita.
While OECD levels of energy per capita are generally larger than the world average by a factor of two, with some regional variations, OECD levels of energy intensity of the economy (TPES/GDP, based on PPP) tend to be slightly lower than the world average, pos-sibly reflecting a less energy-intensive economic structure and a generally more advanced development in efficient use of energy, with high efficiency in transformation and some final consumption sectors.
Figure 29. OECD energy indicators by region 2016
World average 2015 = 1
*GDP based on 2010 USD PPP.
While energy intensity is on a declining trend across the whole OECD (25% lower in 2016 compared to 2000), levels have been historically lower in OECD Europe than in OECD Americas, with OECD average comparable with the levels of Asia Oceania since around the year 2000 (Figure 30).
Figure 30. TPES per GDP of OECD by region 1971-2016
Industry31%
Transport34%Residential
19%
Services13%
Other*3%
0%
20%
40%
60%
80%
100%
Industry Transport Residential Services
Coal Oil Gas Electricity Other*
0
1
2
3
OECD Total OECDAmericas
OECD AsiaOceania
OECD Europe
TPES/capita TPES/GDP*
0
0.05
0.1
0.15
0.2
0.25
0.3
0.35
1971 1975 1980 1985 1990 1995 2000 2005 2010 2016
OECD Total OECD Americas
OECD Asia Oceania OECD Europe
WORLD ENERGY BALANCES: OVERVIW (2017 edition) - 13
INTERNATIONAL ENERGY AGENCY
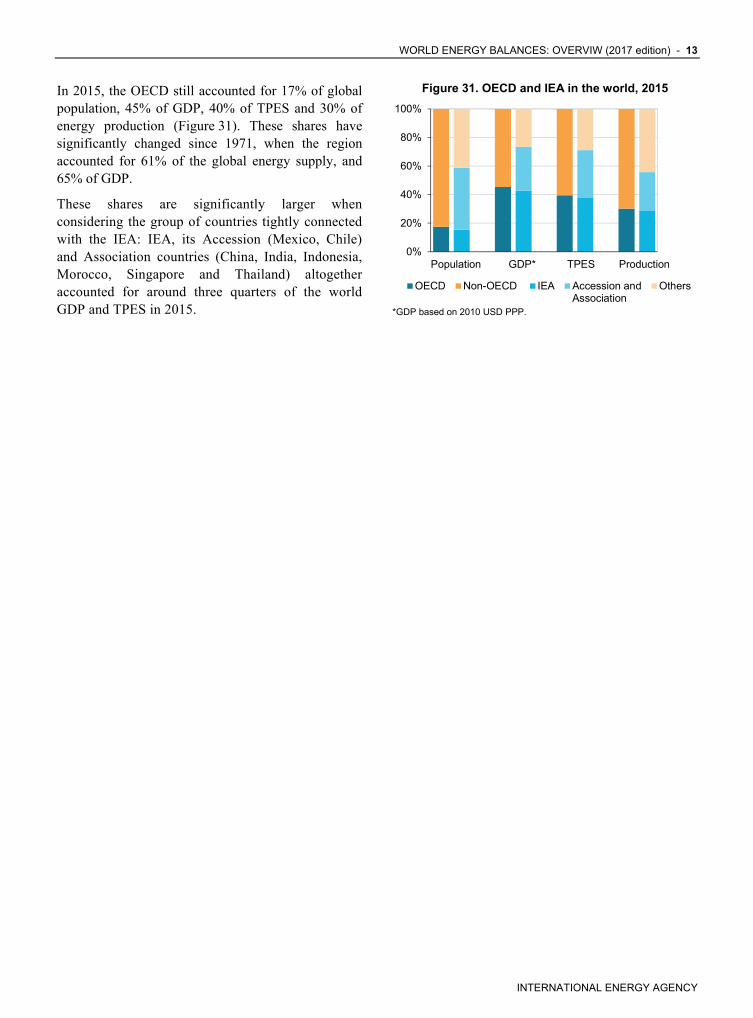
In 2015, the OECD still accounted for 17% of global population, 45% of GDP, 40% of TPES and 30% of energy production (Figure 31). These shares have significantly changed since 1971, when the region accounted for 61% of the global energy supply, and 65% of GDP.
These shares are significantly larger when considering the group of countries tightly connected with the IEA: IEA, its Accession (Mexico, Chile) and Association countries (China, India, Indonesia, Morocco, Singapore and Thailand) altogether accounted for around three quarters of the world GDP and TPES in 2015.
Figure 31. OECD and IEA in the world, 2015
*GDP based on 2010 USD PPP.
0%
20%
40%
60%
80%
100%
Population GDP* TPES Production
OECD Non-OECD IEA Accession andAssociation
Others

14 - WORLD ENERGY BALANCES: OVERVIEW (2017 edition)
INTERNATIONAL ENERGY AGENCY
Africa
In 2015, Africa produced 8.1% of the world’s energy, a similar share than in 1971 (7.8%). African produc-tion is dominated by oil (36%), and traditional bio-mass (34%), followed by natural gas (15%) and coal (14%). Africa’s share of global TPES increased from 3.5% in 1971 to 5.8% in 2015; and despite many African countries being dependent on imports of fossil fuels, as a region it is energy self-sufficient and a net exporter of coal, natural gas and crude oil.
Fossil fuels production is unevenly distributed across Africa (Figure 32). West Africa was the main produc-er of crude oil in 2015, due to Nigeria (almost 27% of the African crude oil). North Africa produces mainly crude oil and natural gas: in 2015 Algeria accounted for more than 43% of the natural gas and 18% of the crude oil in Africa, and Egypt for 9% of crude oil and 19% of natural gas. Southern Africa is characterized by the high share of coal and of crude oil; South Africa, the fifth largest coal exporter in the world, produced 94% of African coal in 2015 whereas Angola is the second biggest producer of crude oil in Africa, with 23% of the region production. Energy production in East and Central Africa remains dominated by bio-fuels, mainly biomass.
Figure 32. Energy production by sub-region in 2015 Africa
* In this graph peat and oil shale are aggregated with coal.
North Africa includes Algeria, Egypt, Libya, Morocco and Tunisia; East Africa includes Eritrea, Ethiopia, Kenya, Mauritius, Mozambique, South Sudan, Sudan and United Republic of Tanzania; Southern Africa includes Angola, Botswana, Namibia, South Africa, Zambia and Zimbabwe; Central Africa includes Cameroon, Congo and Democratic Republic of Congo; West Africa includes Benin, Côte d'Ivoire, Gabon, Ghana, Niger, Nigeria, Senegal and Togo.
In 2015, Africa’s crude oil production slightly decreased compared to 2014 (-1.0%), as it continued declining in
Libya though at a slower pace (-15%), in Algeria and Egypt (-2.3% and -1.7% respectively) but recovered in Angola (+6.4%) and increased in Gabon (+4.9%). Africa represented 9% of world crude oil output and it exported 80% of this production in 2015.
The production and consumption of biofuels (mainly fuelwood) is significantly higher across Africa (48% of total TPES in 2015) than the world average (10% of total TPES). The presence of large forests, agro-industry, agriculture, a large rural population, and a low GDP per capita have resulted in a large use of solid biofuels for cooking. Because of the extensive use of wood and charcoal with its low efficiency, energy intensity5 is higher than the world average.
Figure 33: Total primary energy supply* by fuel Africa
1971 2015
192 Mtoe 787 Mtoe
* Excluding electricity trade. ** In this graph peat and oil shale are aggregated with coal.
However, the share of traditional biomass in TPES has decreased significantly between 1971 and 2015 (Figure 33), due to increased electrification, and par-ticularly the recent development of power generation from natural gas. Natural gas share in TPES increased steeply from 1% in 1971 to 14% in 2015. Coal con-tinued to represent an important share of African TPES (14% in 2015) even if it has declined since 1971. Its share is largely due to South Africa, where coal represented in 2015 85% of primary production, 68% of TPES, 93% of electricity generation and 24% of total final consumption.
In 2015, power generation in Africa was almost nine times the level in 1971 (Figure 34), whilst also seeing a significant change in the fuel mix. Natural gas was barely nil in 1971 but in 2015 provided almost 300 TWh of electricity, a 37% share of electricity generation in Africa (compared to 26% in OECD, 41%
5. Measured by the ratio TPES/GDP.
0
50
100
150
200
250
300
350
400
NorthAfrica
EastAfrica
SouthernAfrica
CentralAfrica
WestAfrica
OtherAfrica
Mtoe
Other
Biofuels/Waste
Nat. gas
Oil
Coal
Coal** 19%
Oil 18%
Nat. gas 1%
Hydro 1%
Biofuels/Waste61%
Coal** 14%
Oil 22%
Nat. gas 14%
Hydro 1%
Biofuels/Waste48%
Other1%

WORLD ENERGY BALANCES (2017 edition) - 15
INTERNATIONAL ENERGY AGENCY
in non-OECD Europe and Eurasia, and 67% in the Middle East). Its share in the power mix reached even higher level in gas-producing countries such as Algeria (98%), Nigeria (82%), and neighbouring importing countries like Tunisia (91%). In 1971, coal was the first fuel used for power generation in Africa (62%); in 2015 it ranked second after natural gas and accounted for 33% of power generation, providing 257 TWh. Hydro was the second provider of electricity in Africa in 1971 (23 TWh, 26% of the power produced in the continent) and ranked third in 2015 with 121 TWh.
Electricity production reflects the disparity in fossil fuel resources between sub-regions of Africa. In 2015, North African countries plus South Africa, repre-sented only 20% of the population but generated 75% of the electricity in Africa. Electricity remains a grave scarcity for most Sub-Saharan African countries, with national electrification rates in 2014 averaging 35%, compared to 45% for the whole continent, but only 19%
in rural Sub-Saharan areas, but even much less in some countries (less than 1% in Burkina Faso, the Democratic Republic of Congo, Chad, Central African Republic, Djibouti, Sierra Leone or South Sudan)6.
Figure 34. Electricity generation by fuel, Africa
* In this graph peat and oil shale are aggregated with coal.
6. Electrification rate extracted from the World Energy Outlook 2016 electricity database: www.worldenergyoutlook.org/resources/
0
100
200
300
400
500
600
700
800
900
1971 2015
Other
Nuclear
Hydro
Gas
Oil
Coal
TWh

16 - WORLD ENERGY BALANCES: OVERVIEW (2017 edition)
INTERNATIONAL ENERGY AGENCY
Non-OECD Americas
In 2015, energy production in non-OECD Americas reached 816 Mtoe, 2 Mtoe more than in 2014. In-creased energy production in Brazil (+4.5%) and Argentina (+1.1%) – first and fourth biggest energy producers in the region – was offset by a decline in Venezuela (-1.6%) and Colombia (-2.0%), respective-ly second and third major producers. In Colombia, which accounted for 93% of the region’s coal, coal production decreased by 3.4%, reaching a level of 55.6 Mtoe. In Venezuela, crude oil production declined for the fourth year in a row (-0.9%). On the contrary in Brazil, non-OECD Americas second oil producer, crude oil production rose by 8% in 2015. Natural gas production decreased by 2.6% in 2015, in the wake of lower productions in some of the region main providers, Trinidad and Tobago (-5.3%), Venezuela (-1.4%) and Bolivia (-11.1%).
Overall the energy mix in non-OECD Americas in 2015 was similar to 2014: oil provided the biggest share of TPES in the region (44% - Figure 35), followed by natural gas (22%) and biofuels and waste (20%).
Figure 35. Total primary energy supply* by fuel, Non-OECD Americas
1971 2015
190 Mtoe 628 Mtoe
* Excluding electricity trade. ** In this graph peat and oil shale are aggregated with coal.
In 2015, other renewables (solar thermal, solar photo-voltaic, wind, geothermal), saw a 22% increase in production compared to 2014 (Figure 36). Hydro production declined for the fourth year in a row, at a level not seen since 2001 (-4.6%), mainly due to the lower production in Brazil, Venezuela, Argentina and Colombia. Though declining, hydro still accounted for 56% of total non-OECD Americas power generation, a much higher share than globally (16%). Biofuels have been increasing at a steady annual rate of 3% since 2013: liquid biofuels (and in particular transport
biofuels in Brazil) in addition to traditional solid bio-fuels, are important in non-OECD Americas (20% of TPES, twice more than globally).
Figure 36. Annual change in TPES by fuel, Non-OECD Americas
* In this graph peat and oil shale are aggregated with coal. ** Includes geothermal, solar thermal, solar photovoltaic and wind.
In 2015, industry remained the biggest energy consum-ing sector (38%), followed by transport (35%) and resi-dential (16%). Industry increased from 50 Mtoe in 1971 to 177 Mtoe in 2015. However, transport saw the largest increase in growing energy final consumption by more than four times since 1971 (Figure 37). Residential near-ly doubled over the period, and ranked third in 2015.
In 1971, oil accounted for half of total final consumption and it peaked at 55% in 1979 before the second oil crisis. However the development of electricity, particularly in the residential and the industry sectors, shows why oil’s share in TFC is slowly diminishing and reached 47% in 2015. The share of electricity has almost tripled during that period, reaching 18% in 2015. Natural gas increased from less than 4% to more than 13%, mainly driven by industry use (from 7% to 24%) and residential (from 4% to 15%).
Figure 37. Total final consumption by sector and fuel, Non-OECD Americas
* In this graph peat and oil shale are aggregated with coal.
-6%
-2%
2%
6%
10%
14%
18%
22%
1971-2015 2014-2015
0
20
40
60
80
100
120
140
160
180
200
1971 2015 1971 2015 1971 2015 1971 2015
Mtoe
Other
Electricity
Nat. gas
Oil
Coal*
Industry Transport Residential Other
Coal** 4%
Oil 44%
Nat. gas 22%
Nuclear 1%
Hydro 9%
Biofuels/Waste20%
Other 1%
Coal** 3%
Oil 53%
Nat. gas 8%
Hydro 3%
Biofuels/Waste32%
WORLD ENERGY BALANCES (2017 edition) - 17
INTERNATIONAL ENERGY AGENCY
Non-OECD Asia
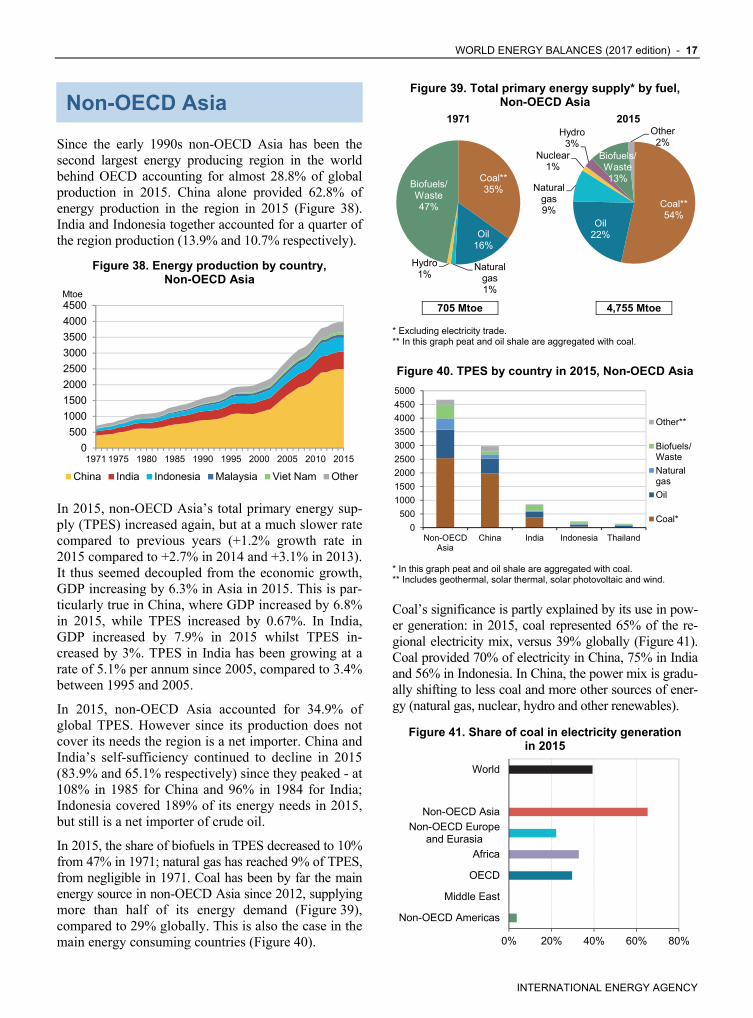
Since the early 1990s non-OECD Asia has been the second largest energy producing region in the world behind OECD accounting for almost 28.8% of global production in 2015. China alone provided 62.8% of energy production in the region in 2015 (Figure 38). India and Indonesia together accounted for a quarter of the region production (13.9% and 10.7% respectively).
Figure 38. Energy production by country, Non-OECD Asia
In 2015, non-OECD Asia’s total primary energy sup-ply (TPES) increased again, but at a much slower rate compared to previous years (+1.2% growth rate in 2015 compared to +2.7% in 2014 and +3.1% in 2013). It thus seemed decoupled from the economic growth, GDP increasing by 6.3% in Asia in 2015. This is par-ticularly true in China, where GDP increased by 6.8% in 2015, while TPES increased by 0.67%. In India, GDP increased by 7.9% in 2015 whilst TPES in-creased by 3%. TPES in India has been growing at a rate of 5.1% per annum since 2005, compared to 3.4% between 1995 and 2005.
In 2015, non-OECD Asia accounted for 34.9% of global TPES. However since its production does not cover its needs the region is a net importer. China and India’s self-sufficiency continued to decline in 2015 (83.9% and 65.1% respectively) since they peaked - at 108% in 1985 for China and 96% in 1984 for India; Indonesia covered 189% of its energy needs in 2015, but still is a net importer of crude oil.
In 2015, the share of biofuels in TPES decreased to 10% from 47% in 1971; natural gas has reached 9% of TPES, from negligible in 1971. Coal has been by far the main energy source in non-OECD Asia since 2012, supplying more than half of its energy demand (Figure 39), compared to 29% globally. This is also the case in the main energy consuming countries (Figure 40).
Figure 39. Total primary energy supply* by fuel, Non-OECD Asia
1971 2015
705 Mtoe 4,755 Mtoe
* Excluding electricity trade. ** In this graph peat and oil shale are aggregated with coal.
Figure 40. TPES by country in 2015, Non-OECD Asia
* In this graph peat and oil shale are aggregated with coal. ** Includes geothermal, solar thermal, solar photovoltaic and wind.
Coal’s significance is partly explained by its use in pow-er generation: in 2015, coal represented 65% of the re-gional electricity mix, versus 39% globally (Figure 41). Coal provided 70% of electricity in China, 75% in India and 56% in Indonesia. In China, the power mix is gradu-ally shifting to less coal and more other sources of ener-gy (natural gas, nuclear, hydro and other renewables).
Figure 41. Share of coal in electricity generation in 2015
0
500
1000
1500
2000
2500
3000
3500
4000
4500
1971 1975 1980 1985 1990 1995 2000 2005 2010 2015
Mtoe
China India Indonesia Malaysia Viet Nam Other
0
500
1000
1500
2000
2500
3000
3500
4000
4500
5000
Non-OECDAsia
China India Indonesia Thailand
Other**
Biofuels/Waste
Naturalgas
Oil
Coal*
0% 20% 40% 60% 80%
Non-OECD Americas
Middle East
OECD
Africa
Non-OECD Europeand Eurasia
Non-OECD Asia
World
Coal**35%
Oil 16%
Natural gas1%
Hydro 1%
Biofuels/Waste 47% Coal**
54%Oil
22%
Natural gas9%
Nuclear 1%
Hydro 3%
Biofuels/Waste13%
Other 2%
18 - WORLD ENERGY BALANCES: OVERVIEW (2017 edition)
INTERNATIONAL ENERGY AGENCY
In 2015, total electricity generation in non-OECD Asia increased by 3.6%, mainly driven by India (+6.9%). Electricity production grew in the region at an average annual rate of 8.1% since 1971.
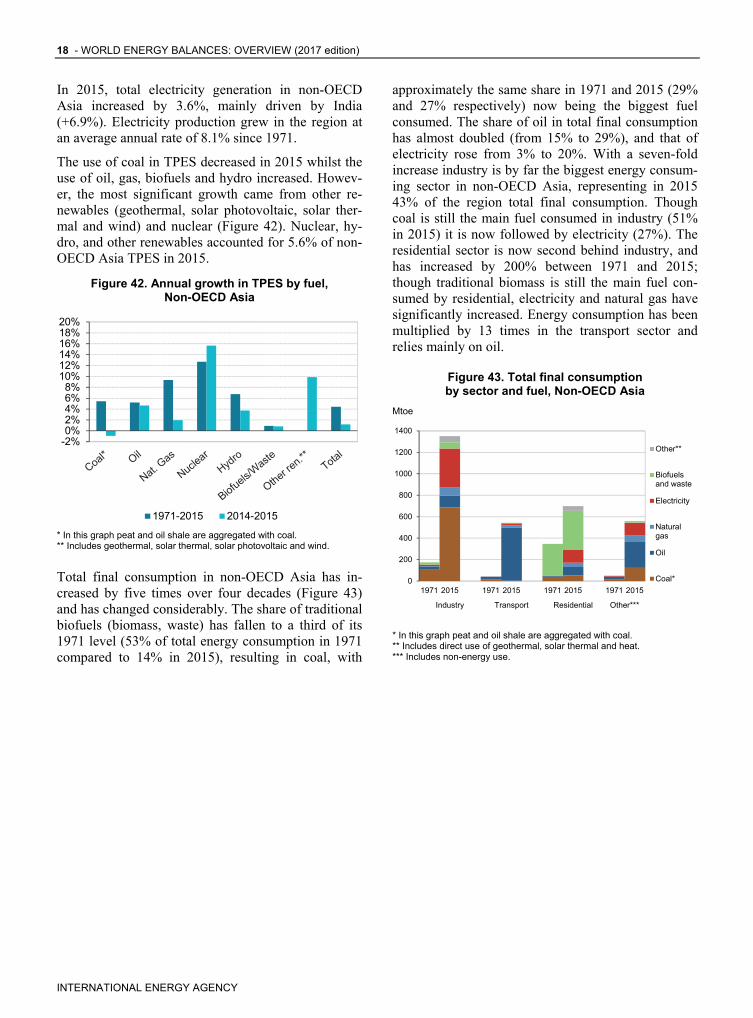
The use of coal in TPES decreased in 2015 whilst the use of oil, gas, biofuels and hydro increased. Howev-er, the most significant growth came from other re-newables (geothermal, solar photovoltaic, solar ther-mal and wind) and nuclear (Figure 42). Nuclear, hy-dro, and other renewables accounted for 5.6% of non-OECD Asia TPES in 2015.
Figure 42. Annual growth in TPES by fuel, Non-OECD Asia
* In this graph peat and oil shale are aggregated with coal. ** Includes geothermal, solar thermal, solar photovoltaic and wind.
Total final consumption in non-OECD Asia has in-creased by five times over four decades (Figure 43) and has changed considerably. The share of traditional biofuels (biomass, waste) has fallen to a third of its 1971 level (53% of total energy consumption in 1971 compared to 14% in 2015), resulting in coal, with
approximately the same share in 1971 and 2015 (29% and 27% respectively) now being the biggest fuel consumed. The share of oil in total final consumption has almost doubled (from 15% to 29%), and that of electricity rose from 3% to 20%. With a seven-fold increase industry is by far the biggest energy consum-ing sector in non-OECD Asia, representing in 2015 43% of the region total final consumption. Though coal is still the main fuel consumed in industry (51% in 2015) it is now followed by electricity (27%). The residential sector is now second behind industry, and has increased by 200% between 1971 and 2015; though traditional biomass is still the main fuel con-sumed by residential, electricity and natural gas have significantly increased. Energy consumption has been multiplied by 13 times in the transport sector and relies mainly on oil.
Figure 43. Total final consumption by sector and fuel, Non-OECD Asia
Mtoe
* In this graph peat and oil shale are aggregated with coal. ** Includes direct use of geothermal, solar thermal and heat. *** Includes non-energy use.
-2%0%2%4%6%8%
10%12%14%16%18%20%
1971-2015 2014-2015
0
200
400
600
800
1000
1200
1400
1971 2015 1971 2015 1971 2015 1971 2015
Industry Transport Residential Other***
Other**
Biofuelsand waste
Electricity
Naturalgas
Oil
Coal*

WORLD ENERGY BALANCES (2017 edition) - 19
INTERNATIONAL ENERGY AGENCY
Non-OECD Europe and Eurasia
In 2015, total energy production in non-OECD Europe and Eurasia was lower than energy production in the Middle East for the first time since 1998. Energy pro-duction in non-OECD Europe and Eurasia remained largely stable at 2014 levels (+2 Mtoe, +0.1%), where-as the Middle East added 61 Mtoe of production (+3.3%), mainly crude oil from Saudi Arabia, Iraq and UAE.
Energy production in the Russian Federation, which represented 73% of the regional total, grew by 1.1% (15 Mtoe) from 2014 to 2015 (Figure 44). This growth was offset by a fall in reported Ukrainian pro-duction (-16 Mtoe, -20.3%). Please refer to the coun-try notes included in this publication for details of territorial coverage.
Figure 44. Top producers Annual change in production in 2015,
Non-OECD Europe and Eurasia
*Other includes hydro, geothermal, solar, wind, and heat
Preliminary data on the trade of coal, crude oil and natural gas for 2016 shows that the Russian Federation remains world’s largest exporter of natural gas (205 bcm) and second largest exporter of crude oil (243 Mt). Turkmenistan stays the 6th largest exporter of natural gas and Kazakhstan the 8th largest exporter of coal.
Energy production is very unevenly distributed across non-OECD Europe and Eurasia. Although the region
as a whole is energy self-sufficient (Figure 45), it includes some of the most energy import-dependent countries in the world: In 2015, only 2% of Malta’s energy consumption was covered by domestic produc-tion. The self-sufficiency ratio was 6% for Cyprus and 14% for Belarus. In contrast, Azerbaijan produced four times more energy than it consumed.
Figure 45. Energy production and demand, 1971-2015,
Non-OECD Europe and Eurasia
*excluding electricity trade.
In 2015, non-OECD Europe and Eurasia saw the sharpest regional decrease in energy demand com-pared to 2014, both in percentage (-2.4%) and in abso-lute value (-28 Mtoe).
Figure 46. Annual average change in total primary energy supply by sub-region,
Non-OECD Europe and Eurasia
Balkans is Albania, Bosnia and Herzegovina, Bulgaria, Croatia, Former Yugoslav Republic of Macedonia, Kosovo, Montenegro, Romania and Serbia; Caucasus is Armenia, Azerbaijan and Georgia Central Asia is Kazakhstan, Kyrgyzstan, Tajikistan, Turkmenistan and Uzbekistan; Mediterranean is Cyprus, Gibraltar and Malta Eastern Europe is Belarus, Moldova, Ukraine and Lithuania
Note: Estonia, Latvia and Slovenia are OECD members.
-20
-10
0
10
20
30
40
Coal OilGas NuclearHydro Biofuels and WasteOther*
Mtoe
0
500
1000
1500
2000
1971 1975 1980 1985 1990 1995 2000 2005 2010 2015
TPES* Production
Mtoe
-14%-12%-10%-8%-6%-4%-2%0%2%4%6%
Balkans Caucasus CentralAsia
RussianFed.
Medi-terranean
EasternEurope
2014 - 2015 2010 - 2015
20 - WORLD ENERGY BALANCES: OVERVIEW (2017 edition)
INTERNATIONAL ENERGY AGENCY
The Russian Federation’s energy demand decreased by 2.0% (-15 Mtoe) between 2014 and 2015 (Figure 46) where reported consumption of natural gas for power and heat fell by 21 Mtoe in 2015, compared to 2014. The other main contributor to the regional energy demand drop was Ukraine (-14.8%, 16 Mtoe between 2014 and 2015) where increase in end-use consumer prices and ongoing economic turmoil impacted energy consumption.
Energy demand also dropped in Belarus (-9%, 2 Mtoe), partly due to warmer weather. However, energy demand continued to grow in the Caucasus (+1.8%) and in Central Asia (+0.8%), in line with the trends observed in the previous years. The growth observed in the Balkan region (+3.8%) was driven by Serbia (+11.3%).
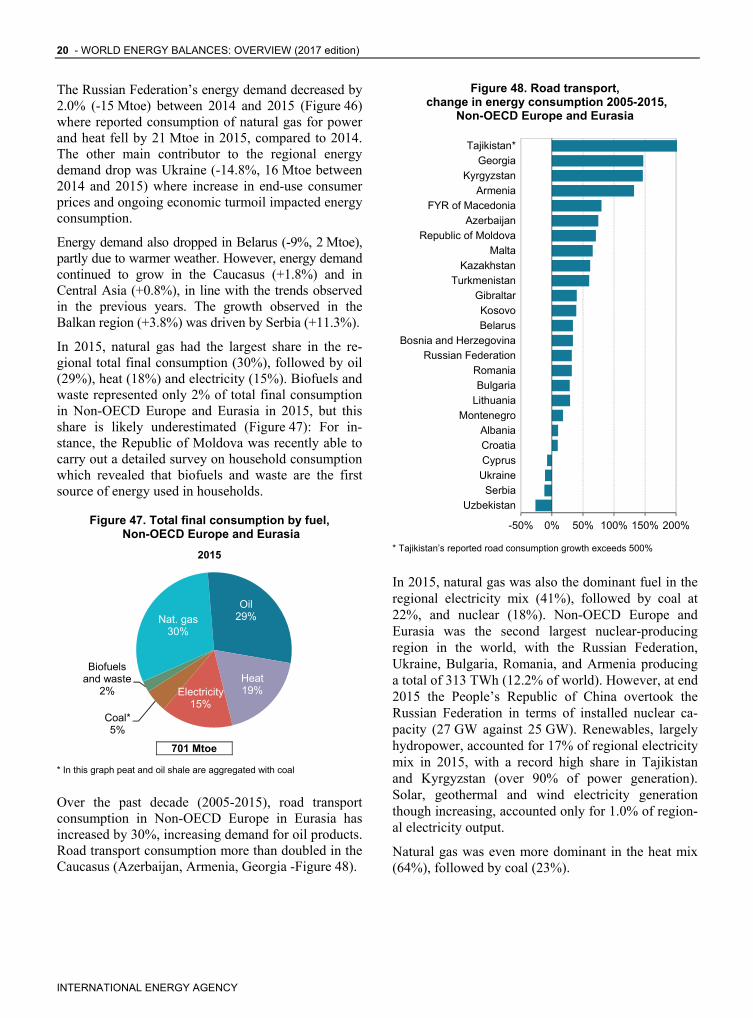
In 2015, natural gas had the largest share in the re-gional total final consumption (30%), followed by oil (29%), heat (18%) and electricity (15%). Biofuels and waste represented only 2% of total final consumption in Non-OECD Europe and Eurasia in 2015, but this share is likely underestimated (Figure 47): For in-stance, the Republic of Moldova was recently able to carry out a detailed survey on household consumption which revealed that biofuels and waste are the first source of energy used in households.
Figure 47. Total final consumption by fuel, Non-OECD Europe and Eurasia
2015
701 Mtoe
* In this graph peat and oil shale are aggregated with coal
Over the past decade (2005-2015), road transport consumption in Non-OECD Europe in Eurasia has increased by 30%, increasing demand for oil products. Road transport consumption more than doubled in the Caucasus (Azerbaijan, Armenia, Georgia -Figure 48).
Figure 48. Road transport, change in energy consumption 2005-2015,
Non-OECD Europe and Eurasia
* Tajikistan’s reported road consumption growth exceeds 500%
In 2015, natural gas was also the dominant fuel in the regional electricity mix (41%), followed by coal at 22%, and nuclear (18%). Non-OECD Europe and Eurasia was the second largest nuclear-producing region in the world, with the Russian Federation, Ukraine, Bulgaria, Romania, and Armenia producing a total of 313 TWh (12.2% of world). However, at end 2015 the People’s Republic of China overtook the Russian Federation in terms of installed nuclear ca-pacity (27 GW against 25 GW). Renewables, largely hydropower, accounted for 17% of regional electricity mix in 2015, with a record high share in Tajikistan and Kyrgyzstan (over 90% of power generation). Solar, geothermal and wind electricity generation though increasing, accounted only for 1.0% of region-al electricity output.
Natural gas was even more dominant in the heat mix (64%), followed by coal (23%).
Nat. gas30%
Oil29%
Heat19%Electricity
15%Coal*5%
Biofuels and waste
2%
-50% 0% 50% 100% 150% 200%
Uzbekistan
Serbia
Ukraine
Cyprus
Croatia
Albania
Montenegro
Lithuania
Bulgaria
Romania
Russian Federation
Bosnia and Herzegovina
Belarus
Kosovo
Gibraltar
Turkmenistan
Kazakhstan
Malta
Republic of Moldova
Azerbaijan
FYR of Macedonia
Armenia
Kyrgyzstan
Georgia
Tajikistan*
WORLD ENERGY BALANCES (2017 edition) - 21
INTERNATIONAL ENERGY AGENCY
Middle East
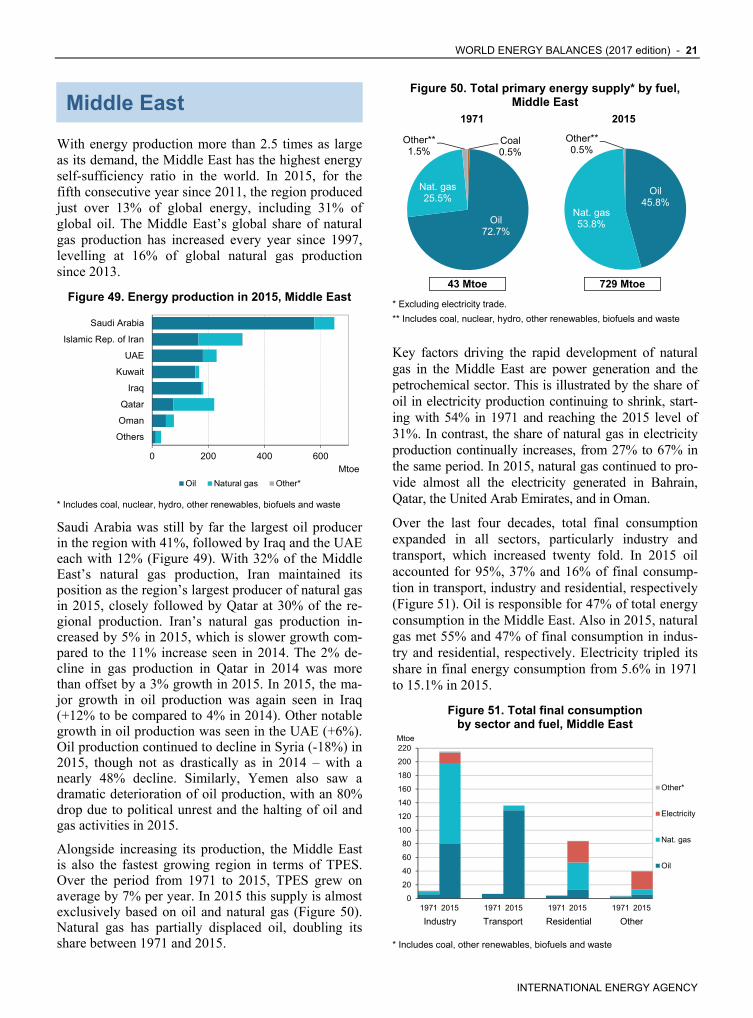
With energy production more than 2.5 times as large as its demand, the Middle East has the highest energy self-sufficiency ratio in the world. In 2015, for the fifth consecutive year since 2011, the region produced just over 13% of global energy, including 31% of global oil. The Middle East’s global share of natural gas production has increased every year since 1997, levelling at 16% of global natural gas production since 2013.
Figure 49. Energy production in 2015, Middle East
* Includes coal, nuclear, hydro, other renewables, biofuels and waste
Saudi Arabia was still by far the largest oil producer in the region with 41%, followed by Iraq and the UAE each with 12% (Figure 49). With 32% of the Middle East’s natural gas production, Iran maintained its position as the region’s largest producer of natural gas in 2015, closely followed by Qatar at 30% of the re-gional production. Iran’s natural gas production in-creased by 5% in 2015, which is slower growth com-pared to the 11% increase seen in 2014. The 2% de-cline in gas production in Qatar in 2014 was more than offset by a 3% growth in 2015. In 2015, the ma-jor growth in oil production was again seen in Iraq (+12% to be compared to 4% in 2014). Other notable growth in oil production was seen in the UAE (+6%). Oil production continued to decline in Syria (-18%) in 2015, though not as drastically as in 2014 – with a nearly 48% decline. Similarly, Yemen also saw a dramatic deterioration of oil production, with an 80% drop due to political unrest and the halting of oil and gas activities in 2015.
Alongside increasing its production, the Middle East is also the fastest growing region in terms of TPES. Over the period from 1971 to 2015, TPES grew on average by 7% per year. In 2015 this supply is almost exclusively based on oil and natural gas (Figure 50). Natural gas has partially displaced oil, doubling its share between 1971 and 2015.
Figure 50. Total primary energy supply* by fuel, Middle East
1971 2015
43 Mtoe 729 Mtoe
* Excluding electricity trade.
** Includes coal, nuclear, hydro, other renewables, biofuels and waste
Key factors driving the rapid development of natural gas in the Middle East are power generation and the petrochemical sector. This is illustrated by the share of oil in electricity production continuing to shrink, start-ing with 54% in 1971 and reaching the 2015 level of 31%. In contrast, the share of natural gas in electricity production continually increases, from 27% to 67% in the same period. In 2015, natural gas continued to pro-vide almost all the electricity generated in Bahrain, Qatar, the United Arab Emirates, and in Oman.
Over the last four decades, total final consumption expanded in all sectors, particularly industry and transport, which increased twenty fold. In 2015 oil accounted for 95%, 37% and 16% of final consump-tion in transport, industry and residential, respectively (Figure 51). Oil is responsible for 47% of total energy consumption in the Middle East. Also in 2015, natural gas met 55% and 47% of final consumption in indus-try and residential, respectively. Electricity tripled its share in final energy consumption from 5.6% in 1971 to 15.1% in 2015.
Figure 51. Total final consumption by sector and fuel, Middle East
* Includes coal, other renewables, biofuels and waste
0 200 400 600
Others
Oman
Qatar
Iraq
Kuwait
UAE
Islamic Rep. of Iran
Saudi Arabia
Mtoe
Oil Natural gas Other*
0
20
40
60
80
100
120
140
160
180
200
220
1971 2015 1971 2015 1971 2015 1971 2015
Mtoe
Other*
Electricity
Nat. gas
Oil
Industry Transport Residential Other
Coal0.5%
Oil72.7%
Nat. gas25.5%
Other**1.5%
Oil45.8%
Nat. gas53.8%
Other**0.5%
Related Documents