'? woRLD M ETEO RO LOGICAL 0 R G AN I ZATI 0 N WORLD CLIMATE CONFERENCE GENEVA, FEBRUARY 1979 l- "' . - EXTENDED SUMMARIES OF PAPERS PRESENTED AT THE CONFERENCE

Welcome message from author
This document is posted to help you gain knowledge. Please leave a comment to let me know what you think about it! Share it to your friends and learn new things together.
Transcript
'?woRLD M ETEO RO LOGICAL 0 R G AN I ZATI 0 N
WORLD CLIMATE CONFERENCE
GENEVA, FEBRUARY 1979
l-"' . - EXTENDED SUMMARIES OF PAPERS PRESENTED AT THE CONFERENCE
WORLD METEOROLOGICAL ORGANIZATION WMO z_
I Gll--Cf ~ WOR
WORLD CLIMATE CONFERENCE
A CONFERENCE OF EXPERTS ON CLIMATE AND MANKIND
GENEVA, FEBRUARY 1979
-~ EXTENDED SUMMARIES OF PAPERS PRESENTED AT THE CONFERENCE
•

\·'"";/-->. c-z ~, _.,.., / ·--·

CONTENTS
Foreword VII
Provisional programme for the World Climate Conference •..................... IX
I
Summaries of Overview Papers
Climate and Public Policy
Climate at the Millennium: Keynote Address ............•.•...•.. 1 Robert M. White, Conference Chairman, Climate Research
Board, National Academy of Sciences, Washington, D.C., u.s.A.
1. Climatic Change and Human Strategy . . . . . . • . . . • . . • . . . . . . . . . . • . . • . • 11 E.K. Fedorov, U.S.S.R. State Committee for Hydro-
meteorology and Control of Natural Environment, Moscow, U.S.S.R.
II The Global System that Determines Climate
2. Global Ecology and Man •.•.......................••.........•..•. 24 Bert Bolin, Department of Meteorology, University of
Stockholm, Sweden
3. Climatic Variation and Variability: Empirical Evidence from Meteorological and Other Sources . . . . . . . . . • . . . . . . . . . . . . . . . • . 39
F. Kenneth Hare, Institute for Environmental Studies, University of Toronto, Canada
4. Climates of Past Geological Epochs . .. .. .. .. .. . .. . • .. .. .. . . . . .. .. 48 E.P. Gerasimov1 U.S.S.R. State Committee for Hydro-
5.
meteorology and Control of Natural Environment, Moscow, U.S.S.R.
The Physical Basis of Climate W. Lawrence Gates, Oregon
Oregon, U.S.A. State University, Corvall1s,
6. Modelling of Climatic Changes and the Problem of Long-Range
71
Weather Forecasting •.........•..••..••..•..... , . . • . . . • . . . . . • • . . 85 G.I. Marchuk, Central Computing Centre, Siberian
Academy of Sciences, Novosibirsk, U.S.S.R.

IV CONTENTS
7. Climate Monitoring and Climatic Data Collection Services for Determining Climatic Changes and Variations : Monitoring Data Relevant to Climate ..•.....•.•.•.......•..•.. 94
Ju. A. Izrael, U.S.S.R. State Committee for Hydro-meteorology and Control of Natural Environment, Moscow, U.S.S.R.
III Influences of Mankind on the Climate System
8. Human Activities that Affect Climate •..•.•••.••..•..•.••.•••. 101 R.E. Munn, Institute for Environmental Studies,
9.
University of Toronto, Canada Lester Machta, Air Resources Laboratories, National
Oceanic and Atmospheric Administration, Washington, D.C., U.S.A.
Some Results of Climate Experiments with Numerical Models ................... ~· ..... • ............... -............. .
B. John Mason, Meteorological Office, Bracknell, U.K.
10. A Scenarib of Possible Future Climates - Natu;al and
124
Man-Made . . . . . . . . . • . . . . . . . . • . . . • . . . . . . . . . • . . . . . . . • . . . • • • . • • • . . 147 Hermann Flohn, Meteorological Institute, University
of Bonn, Federal Republic of Germany
11. Energy and Climate: A Review with Emphasis on Global. Interactions .. e ••••••••••• D.................................. 153
Jill Williams, International Institute for Applied Systems Analysis, Laxenburg, Austria
Wolf H~fele, International Institute for Applied Systems Analysis, Laxenburg, Austria
Wolfgang Sassin, International Institutute for Applied Systems Analysis, Laxenburg, Austria·
IV Impacts of Climate on Mankind
Water Resources
12. Climate Variability and the Design and Operation of Writer Resource Systems .•............•..•.••.•......••..••.•. •...... 165
John C. Schaake, Jr., Hydrologic Services Division, National Weather Service, National Oceanic and Atmospheric Administration, Silver Spring, Maryland, U.S.A.
Zdzislaw Kaczmarek, Institute of Meteorology and Water Management, Warsaw, Poland

CONTENTS
Human Health
13. Climate, Health and Disease ...............•.................. 183 Wolf H. Weihe, Biological Central Laboratory,
University Hospital, Zurich, Switzerland
Agriculture
14. Global Aspects of Food Production ............................ 191 M.S. Swaminathan, Indian Council of Agricultural
Research, New Delhi, India
15. Climatic Variability and Agriculture in the Temperate Regions . . . . . . . . . . . . . . . . . . . . . . . . . . . . . . . . . . . . . . . . . . . . . . . . . . . . . . 214
James D. McQuigg, Consulting Climatologist, Columbia, Missouri, U.S.A.
16. Climatic Variability and Agriculture in Tropical Moist Regions •............................ , . . . . . . . . . . . . . . . . . . . . . . . . 223
Hayao Fukui, Center for Southeast Asian Studies, Kyoto University, Japan
17. Climatic Variability and Agriculture in the Semi-Arid Tropics .•............................................. , . . . . . . 246
Francesco Mattei, Ufficio Centrale di Ecologia Agraria (UCEA), Rome, Italy
18. Study on the Climatic Change and Exploitation of Climatic Resources in China . . . . . . . . . . . . . . . . . . . . . . . . . . . . . . . . . . . . . . . . . . . 258
Chang Chia-cheng, Academy of Meteorological Science, Central Meteorological Service, Peking, China
Wang Shao-wu, Peking University, China Cheng Szu-chung, Geographical Institute, Academic
Sinica, Peking, China
Land Use
19. Climatic Variability and Land Use: An African Perspective 262 Julius A. Oguntoyinbo, Department of Geography,
University of Ibadan, Nigeria Richard S. Odingo, Department of Geography, University
of Nairobi, Kenya
Forestry
21. Climatic Variability and Forestry Albert Baumgartner, Department ~f.Bl~~ii~~t~i~gy·~~d······
Applied Meteorology, University of Munich, Federal Republic of Germany
273
V
VI CONTENTS
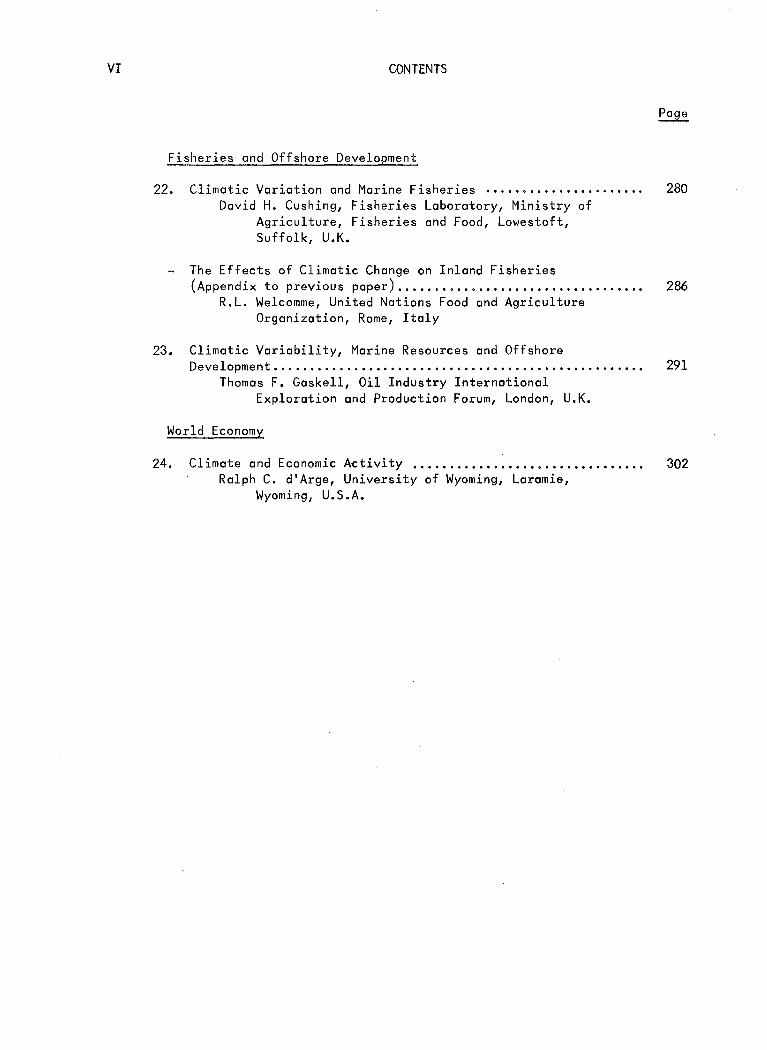
Fisheries and Offshore Development
22. Climatic Variation and Marine Fisheries • • . . . . . • . . . . . • . . . • • • . • 280 David H. Cushing, Fisheries Laboratory, Ministry of
Agriculture, Fisheries and Food, Lowestoft, Suffolk, U.K.
The Effects of Climatic Change on Inland Fisheries (Appendix to previous paper).................................. 286
R.L. Welcomme, United Nations Food and Agriculture Organization, Rome, Italy
23. Climatic Variability, Marine Resources and Offshore Development. . . . . . . . . . • . . • . . . . . . • . . . . . . . . . . . . . . . . . . . . . . . . . • . . . . 291
Thomas F. Gaskell, Oil Industry International Exploration and Production Forum, London, U.K.
World Economy
24. Climate and Economic Activity ...•.•..........•.....••••.•.•.• 302 Ralph C. d'Arge, University of Wyoming, Laramie,
Wyoming, U.S.A.

FOREWORD
During the past decade large variations of climate have occurred in many parts of the world and have had very serious, in some cases disastrous, consequences for the people living in the areas affected. The southern border of the Sahara Desert, known as the Sahel region, experienced a five-year drought which caused famine and death on a massive scale. There are many other areas which have suffered economically and in other ways from abnormal manifestations of climate. These events have aroused widespread concern among national and international organizations and have raised a host of questions regarding mankind's vulnerability to variations or changes in climate.
There can thus be little doubt that climate variability and change must be taken into account in both shor~and long-range planning of the affairs of mankind. This point is made abundantly clear in this volume. An added sense of urgency is now imparted to the subject of climate by the fact that there is strong evidence that the climate itself may be influenced by the activities of mankind.
It was for these reasons that the twenty-ninth session of the WMO Executive Committee (1977) decided that a high-level scientific and technical Conference should be convened by WMO early in 1979 and should be attended not only by meteorologists but also by experts from all the climate-sensitive branches of the national economy, including agriculture, energy, water resources, fisheries and health. The Executive Committee also decided that the ultimate aim should be for WMO to convene a further conference at ministerial level at which the attention of decision-makers should be called to the growing sensitivity of mankind and his activities to climate change and variability, and the need for this to be taken into account in long-term planning for economic and social development.
An Organizing Committee for the Conference was established. Participants included representatives of WMO bodies, representatives of other United Nations agencies, such as Unesco, FAO, WHO and UNEP, the representatives of nongovernmental organizations such as ICSU and IIASA (International Institute for Applied Systems Analysis) as well as a number of experts invited in their individual capacities. The main task of the Organizing Committee was to translate the decisions of the WMO Executive Committee into concrete plans, including the designation of topics to be considered, the manner of their presentation, the advanced documentation required and many other points of a practical nature.
As regards the agenda for the Conference, the Organizing Committee agreed that the Conference should be divided into two distinct phases, each lasting one week. During the first week a number of review or overview papers would be submitted on preselected topics or sub-topics. These would be prepared by individuals or groups of experts and each would include a comprehensive assessment of the problem area.

VIII FOREWORD
During the second week the working groups would have in-depth discussions on the issues raised in the review papers and their presentations. Finally, an overall assessment and plan of action based on the entire prior work of the Conference would be prepared.
The present publication contains the extended summaries of the overview papers; it is available in English, French, Russian and Spanish. It will be noted that the topics covered by these overview papers cover a very wide range, as dictated by the subject, and that they emphasize the impacts that climatic variability and change have on a variety of climate-sensitive activities.
I wish to take authors of the overview Secretariat in order to lity with other papers. to thank Professor F. K.
this opportunity to express my deep appreciation to all the papers. Some of the papers have been edited in the WMO ensure consistent presentation of the subject and compatabi-This task required a great deal of effort for which I wish Hare, Dr. W. W. Kellogg and Mr. P. J. Meade.
Finally, I also wish to express my gratitude to the members of the Bureau of the Organizing Committee for the Conference, in particular its Chairman, Dr. R. M. White, who has guided the work of the Committee with great skill and vision. It is indeed reassuring to know that he will also be serving as the Chairman of the' Conference.
~-D. A. Davies
Secretory-General

PROVISIONAL PROGRAMME FOR THE WORLD CLIMATE CONFERENCE
(Geneva, 12 to 23 February 1979)
Honorary President: Mr. M. F. Taha, President of WMO
Chairman: Dr. R.M. White
Monday, 12 February 1979
Morning Session A
Opening
Chairman: M. F. Taha, President of WMO, The Meteorological Authority, Cairo, Egypt
Agency Statements Keynote Address - R.M. White, Climate Research Board, National Academy
of Sciences, Washington, D.C., U.S.A., Conference Chairman Climatic Change and Human Strategy - E.K. Fedorov, U~S.S.R. State
Committee for Hydrometeorology and Control of Natural Environment, Moscow, U.S.S.R.
Afternoon Session B Chairman: A. Villevieille, Etablissement d'etudes et de recherches meteorologiques, Boulogne-Billancourt Cedex, France
l. Global Ecology and Man - B. Bolin, Department of Meteorology, University of Stockholm, Sweden
2. Climatic Variation and Variability, Empirical Evidence from Meteorological and other Sources - F.K. Hare, Institute for Environmental Studies, University of Toronto, Canada
3. Climates of Past Geological Epochs - E.P. Gerasimov, U.S.S.R. State Committee for Hydrometeorology and Control of Natural Environment, Moscow, U.S.S.R.
Tuesday, 13 February 1979
Morning Session C Chairman: G. 0. P. Obasi, WMO Secretariat, Geneva
1. The Physical Basis of Climate - W.L. Gates, Oregon State University, Corvallis, Oregon, U.S.A.

X PROVISIONAL PROGRAMME
Tuesday, 13 February 1979 (cont.)
Morning Session C
2. Modelling of Climatic Changes and the Problems of Long-Range Weather Forecasting - G.I. Marchuk, Central Computing Centre, Siberian Academy of Sciences, Novosibirsk, U.S.S.R.
3. Some Results of Climate Experiments with Numerical ModelsB.J. Mason, Meteorological Office, Bracknell, U.K.
Afternoon Session D Chairman: W.J. Gibbs, Blackburn, Victoria, Australia
1. Climate Monitoring and Climatic Data Collection Services for Determining Climatic Changes and Variations - Ju. A. Izrael, U.S.S.R. State Committee for Hydrometeorology and Control of Natural Environment, Moscow, U.S.S.R.
2. Human Activities that Affect Climate - R.E. Munn, Institute for Environmental Studies, University of Toronto, Canada, and L. Machta, Air Resources Laboratories, National Oceanic and Atmospheric Administration, Washington, D.C., U.S.A.
3. A Scenario of ~ossible Future Climates, Natural and Man-Made -H. Flohn, Meteorological Institute, University of Bonn, Federal Republic of Germany
Wednesday, 14 February 1979
Morning Session E Chairman: R. Revelle, Department of Political Science, University of California, San Diego, U.S.A.
1. Energy and Climate: A Review with Emphasis on Global Interactions -J. Williams, W. Hafele, W. Sassin, International Institute for Applied Systems Analysis, Laxenburg, Austria
2. Climate Variability and the Development and Management of Water Resources- J.C. Schaake, Jr., Hydrologic Services Division, National Weather Service, National Oceanic and Atmospheric Administration, Silver Spring, Maryland, U.S.A.,· and Z. Kaczmarek, Institute of Meteorology and Water Management, Warsaw, Poland
3. Climatic Variability and Human Health - W.H. Weihe, Biological Central Laboratory, University Hospital, Zurich, Switzerland
Afternoon Session F Chairman: W. Baier, Agrometeorology Research and Service, Chemistry and Biology Research Institute, Ottawa, Canada
PROVISIONAL PROGRAMME XI
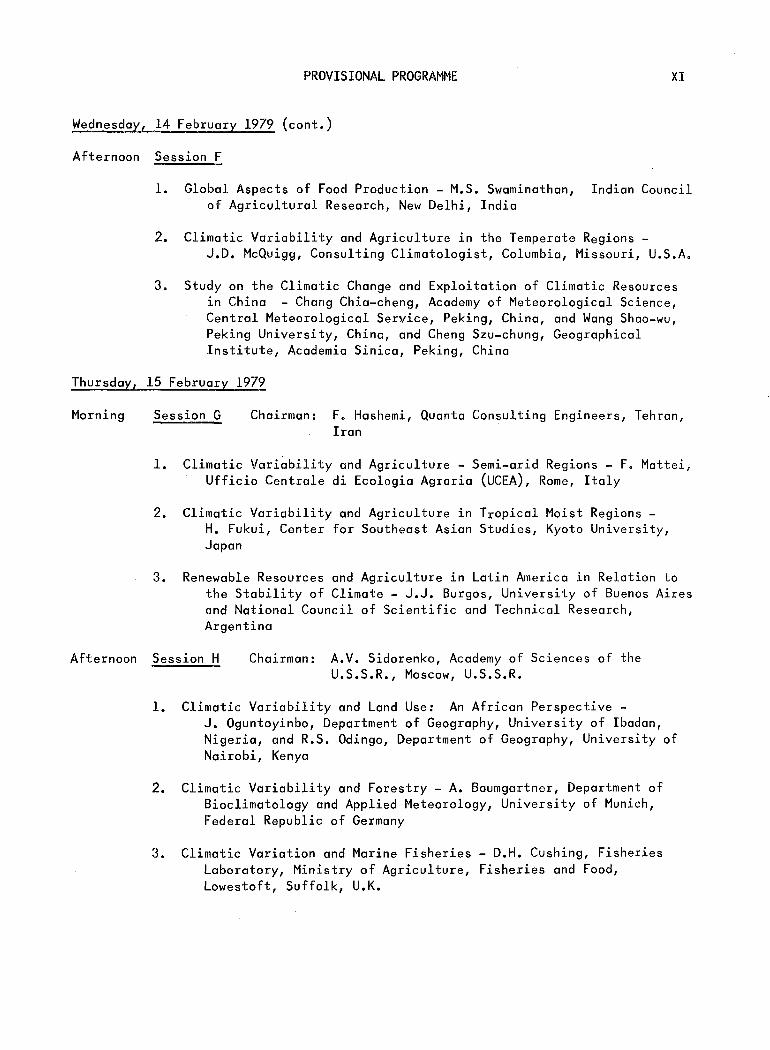
Wednesday, 14 February 1979 (cont.)
Afternoon Session F
1. Global Aspects of Food Production - M.S. Swaminathan, Indian Council of Agricultural Research, New Delhi, India
2. Climatic Variability and Agriculture in the Temperate Regions -J.D. McQuigg, Consulting Climatologist, Columbia, Missouri, U.S.A.
3. Study on the Climatic Change and Exploitation of Climatic Resources in China - Chang Chia-cheng, Academy of Meteorological Science, Central Meteorological Service, Peking, China, and Wang Shao-wu, Peking University, China, and Cheng Szu-chung, Geographical Institute, Academic Sinica, Peking, China
Thursday, 15 February 1979
Morning Session G Chairman: F. Hashemi, Quanta Consulting Engineers, Tehran, Iran
1. Climatic Variability and Agriculture - Semi-arid Regions - F. Mattei, Ufficio Centrale di Ecologia Agraria (UCEA), Rome, Italy
2. Climatic Variability and Agriculture in Tropical Moist Regions -H. Fukui, Center for Southeast Asian Studies, Kyoto University, Japan
3. Renewable Resources and Agriculture in Latin America in Relation to the Stability of Climate - J.J. Burgos, University of Buenos Aires and National Council of Scientific and Technical Research, Argentina
Afternoon Session H Chairman: A.V. Sidorenko, Academy of Sciences of the U.S.S.R., Moscow, U.S.S.R.
1. Climatic Variability and Land Use: An African Perspective -J. Oguntoyinbo, Department of Geography, University of Ibadan, Nigeria, and R.S. Odingo, Department of Geography, University of Nairobi, Kenya
2. Climatic Variability and Forestry - A. Baumgartner, Department of Bioclimatology and Applied Meteorology, University of Munich, Federal Republic of Germany
3. Climatic Variation and Marine Fisheries - D.H. Cushing, Fisheries Laboratory, Ministry of Agriculture, Fisheries and Food, Lowestoft, Suffolk, U.K.
XII PROVISIONAL PROGRAMME
Friday, 16 February 1979
Morning Session I Chairman: V.A. Kovda, Agrochemistry and Pedology Institute, Moscow, U.S.S.R.
1. Climatic Variability, Marine Resources and Offshore Development -T. Gaskell, Oil Industry International Exploration and Production Forum, London, U.K.
2. Climate and Economic Activity - R. d'Arge, University of Wyoming, Laramie, Wyoming, U.S.A.
3. Economic Decision-making and Climatic Variability - K.J. Arrow, Department of Economics, Harvard University, Cambridge, Massachusetts, U.S.A.
Afternoon Session J Chairman: R.M. White, Climate Research Board, National Academy of Sciences, Washington, U.S.A.
Plenary, Session Chairmen presentations
Organization of Working Groups
I.
II.
III.
IV.
Climate Data and Applications Cc-chairmen: R. Czelnai, Meteorological Service of the HPR,
Budapest, Hungary H.E. Landsberg, Institute for Physical Science and Technology, University of Maryland, College Park, U.S.A.
Identification of Climatic Impacts Cc-chairmen: J.C.I. Dooge, Department of Civil Engineering, University
College, Dublin, Ireland
Organization of Cc-chairmen:
A.E. Collin, Atmospheric Environment Service, Downsview, Canada
Integrated Impact Studies S. Ichimura, Centre for Southeast Asian Studies, Kyoto University, Japan W.J. Maunder, New Zealand Meteorological Service, Wellington, New Zealand
Research on Climatic Change and Variability Cc-chairmen: Ju.S. Sedunov, U.S.S.R. State Committee for Hydro
meteorology and Control of Natural Environment, Moscow, U.S.S.R. A. Wiin-Nielsen, European Centre for Medium-Range Weather Forecasts, Brackn~ll, U.K.

PROVISIONAL PROGRAMME XIII
Schedule of Working Groups
Monday, 19 February a.m. I and IV
p.m. II and III
Tuesday, 20 February a.m. I and IV
p.m. II and III
Wednesday, 21 February a.m. I and IV
p.m. II and III
Thursday, 22 February a.m. Meeting of Chairmen
p.m. Preparation of reports of conclusions and recommendations
Friday, 23 February a.m. Plenary session
p.m. Reserve

CLIMATE AT THE MILLENNIUM
by
Robert M. White*
Chairman
World Climate Conference
Keynote Address
*Climate Research Board, U.S. National Academy of Sciences, Washington, D.C., U.S.A.
- 2 -
Mr. President, Mr. Secretary-General, distinguished participants: The World Climate Conference has been convened to assess the state of man's knowledge of climate and to consider the effects of climate variability and change on human society. The issues we will address during the next two weeks are as old as mankind and as new as our interdependent social and economic systems. During this Conference we will hear how climate has shaped our past, moulds our society today, and may affect our future. We can learn from the past, endure the present, but the future is in our hands. We can contribute to a bright future for mankind by national and international actions to provide for the wise use of climatic resources to improve the economic and environmental welfare of people everywhere and to mitigate destructive impacts of climate. This conference can be the beginning of that process.
One may ask, "Why a World Climate Conference now?" The timing of our meeting is a response to several concerns. The first is the worldwide reaction to the climatic events that have so disrupted huMan society over the past decade. The second arises from a growing appreciation that not only is humanity vulnerable to variations in climate, but climate is also vulnerable to the acts of humanity. The third is a perception of a broader climatic vulnerability stemming from world population growth, increased world demand for food, energy, and other resources, increased interdependence of nations, and the pace of economic development. It is a vulnerability that can only increase because the underlying causes will intensify, not diminish.
The disastrous consequences of climatic events of the past decade are well known. No part of the world has been immune. During the late sixties and early seventies the southern border regions of the Sahara desert, the Sahel, succumbed to a five-year drought with famine and death on a continental scale. The year 1972 saw a worldwide epidemic of costly climatic episodes, including drought in the Soviet Union and the occurrence of El Nino off Peru. In 1974, poor monsoons reduced food production in India. In 1975, cold waves in Brazil badly damaged coffee crops. In 1976, drought in Europe caused widespread economic dislocations. In the United States, the recent cold winters forced many industries 'cind s6hools to close.
These events have demonstrated the sensitivity of human welfare and international relations to climatic events. They have demonstrated the fragility of world food production and trade systems and the extent to which income and employment continue to depend on the workings of the natural world. The remarkable aspect of these climatic fluctuations is that they are not unusual. Similar events have occurred frequently in the historical record. What is new, is the realization that vulnerability of human society to climatic events has not disappeared with technological development.
Moreover, we cannot allow shorter period fluctuations of climate to lull us into complacency. We have been blessed by a benign climate in most of the world during the post several years, save for parts of the Sahel in the past year. As a result there has been a lessening of attention in the public press, and among governmental officials in their concerns about climate.
- 3 -
To connect human suffering exclusively to natural events is utterly mistaken because the vulnerability or resilience of a society to climate obviously depends on many factors. To illustrate, it is interesting to observe that during the decade of the seventies the world grain trade went through one full cycle of surplus to shortage and back to surplus. In the early 1970's, there were large world grain reserves. During the period 1972 - 1974 world food production on a per-capita basis suffered its sharpest decline in twenty years. Crop failures due to climatic stress occurred in many parts of the world. We then reached a stage in which the stocks of grain, on a worldwide basis, had been reduced from a normal 20 per cent of world consumption to about 10 per cent. But, by 1977 and 1978, global grain harvests were setting records. With such fluctuations in the world food grain picture, it is easy for decisionmakers to forget the disaster of yesterday and remember only the good times of today. As climate specialists, we know better.
If natural climate disasters had not been enough to motivate governments and the scientific community to action, the ominous possibilities for man-induced climatic changes would have triggered our presence here. Until the beginning of the industrial age some 100 years ago, variations in climate and their associated impacts could be considered as natural events beyond the control of man. In recent years, we have come to appreciate that the activities of humanity can and do affect climate. We now change the radiative processes of the atmosphere and perhaps its circulation by emission of the products of our industrial and agricultural society. We now change the boundary processes between earth and atmosphere by our use of the land.
We are only dimly beginning to understand some of the potential consequences of human impacts on the climatic resources of the world. However, it is difficult to remain complacent. The potential consequences of increasing atmospheric carbon dioxide resulting from fossil fuel combustion are already a major world concern. But evidence continues to accumulate that the growth of human habitations and the consequent destruction of forests reduces the terrestrial reservoir of carbon and further increases airborne carbon dioxide. Recent findings that other gases reinforce and amplify the effects of carbon dioxide further intensify this concern. It is hard to be complacent when we know that the population of the world will need increasingly to turn to nitrogen fertilizers to maintain agricultural production with the potential for releasing nitrogen compounds which can alter the photochemical balance of the stratospheric ozone. The potential effect on stratospheric ozone of the oxides of nitrogen released in supersonic flight, and of chlorofluoromethanes (CFMs) used as refrigerants or propellants also raise the issue of human impact upon climate.
Moreover, it is the future course of these trends that must be a central concern of this Conference. In little more than twenty years, we will celebrate the year 2000. This millennium may very well represent the ending of one era in the relation of humanity to the planet and the beginning of another. The millennium may mark a fundamental change in the ability of the planet to sustain its people or at least in the ways in which this will be done. There are many who will disagree with the timing of this fundamental change but few who will disagree with its likelihood. By any criteria, whether relating to population, food, energy, or the state of the global environment, we are likely to pass to a new world condition around the year 2000. This transition will also signal a new level of importance of climate to society.

- 4 -
Let us look at what the millennium holds. Conservative projections indicate that the population of the world, which in 1970 was approximately 3.5 billion,will increase to approximately 6,5 billion by the year 2000. Projections made by the United Nation's Food and Agricultural Organization indicate that,as a result, world aggregate food demand will rise by about 44 per cent by 1985 and 112 per cent by the year 2000 - a doubling by the millennium, The challenge facing the world to increase its food production by this amount is staggering. Fortunately, surveys of additional land and water potential for agricultural expansion indicate that the developing areas of the world (except in Asia) possess abundant underused land and water resources with great agricultural potential. While it will be costly to bring these virgin land and water resources into production, it can be done if the best in technology and science 1s brought to bear.
Beyond the year 2000, the world will face a different food situation. We will need to move beyond bringing virgin lands into agricultural production. Agricultural scientists will have to look to new strains of crops, crops that can be grown in brackish or salt water, multiple cropping, and other new approaches to meet the situation. However, projections of world food demand and supply indicate a continuing and growing imbalance. In the next twenty years, climatic information and services derived from strengthened climate data bases in the developing world will .be particularly critical to assure the necessary agricultural productivity. Eventually, perhaps by the year 2000, it will become necessary to advise on how agricultural lands of the entire globe and their.characteristic climates can be used in an optimum fashion to maximize the world production of food and fibre. We must therefore begin to think of climate itself as a resource to be allocated wisely.
By the millennium, the world energy situation will be no less ominous. Estimates are that by the year 2000 the desire of the world for oil will have far surpassed world oil production, even with a 50 per cent increase in oil prices. In seeking to meet our energy needs we may pose a threat to global climate with formidable consequences for world society. In the next twenty years, we will see both the introduction of new sources of energy and a growing dependence on coal and nuclear power.
The growing dependence of the world on coal may create the most serious threat to the world's climate. By the addition of carbon dioxide to the atmosphere, we change its fundamental temperature controls. It is estimated that the burning of fossil fuels and destruction of forests - also, incidentally, a source of fuel - have already, in the short span of one half century, increased atmospheric carbon dioxide content over 10 per cent. The implications of further projected increases are uncertain, but the weight of scientific evidence predicts a significant global surface temperature increase. Other energy sources also have important climatic implications. The increasing use of renewable forms of energy derived from the sun, the wind, and the ocean will call for a new level of climatic services and present a new set of challenges to climate science.
As with food, we will need credible projections of consequences by the millennium, if energy policies are to be modified in time to avoid adverse climatic impacts. The implications of the world food and energy outlooks for our science are

- 5 -
clear - we have no time to lose. The complex interplay between climate and man and the environment, as exemplified by food and energy, forces us to realize the degree to which climate is a key element in a global ecological system involving the atmosphere, the oceans, cryosphere, the solid earth and the biosphere. Because no social system,or economic condition of development,renders nations impervious to the physical processes of nature,and because in the modern world environment we are so dependent on one another, it is essential that we join together to consider what we can do collectively and individually about climatic issues in the interest of all.
At the same time, this Conference must take a long view. It must bring to the attention of governments the fact that the problems we are dealing with will not be solved in a day, a year, or even a decade. They are problems for all time and we must address them with fresh concepts.
One important new concept that arises from the material prepared for this Conference is that we should begin to think of climate as a resource. Climate does not conform to our normal idea of a resource. However, its variability in time and space does, in fact, confer upon it many of the characteristics of a resource. For example, on a small scale, farmers and communities located no more than a few kilometres apart may enjoy remarkably different climate assets. The slopes of the Rhine Valley produce fine white wines at northerly latitudes normally hostile to such production. Tea is produced in Soviet Armenia, and the citrus groves along the Mediterranean shores of Egypt enjoy the benefits of the Mediterranean moisture which only a few kilometres inland is non-existent.
Furthermore, while access to climatic resources 1s restricted by notional boundaries and property rights, climate also has some of the characteristics of a common property resource because it can be modified by the remote actions of man. It is the common aspect of the climate resource that will raise the most difficult issues for governments and humanity. For example, while the consequences of a global warming con only be speculated at this time, it is clear that such a change would have vastly different impacts in various regions of the world. There would be winners, and there would be losers. A climate change could be the cause of a major redistribution of wealth, and from the point of view of mankind, quite an arbitrary one.
The possibility that actions by individual nations may influence the climates of others may demand new types of international action. Accords have already been reached in the United Nations to prevent the deliberate use of potential techniques of climate modification as instruments of warfare. However, notions con still proceed unilaterally with a variety of projects in energy, land use, or water resource development that may conceivably affect climate beyond their borders. We thus see emerging a need for some mechanism to develop global environmental impact assessments that will be accepted by all nations. Thus, for certain purposes we must put climate alongside such global commons as the deep seabed and outer space os a concern of mankind for which new international obligations must be derived. Let us hope that this Conference marks the commencement of a new level of collaboration for the protectio~ and productive use of climatic resources.
- 6 -
International concern about the future global condition has been manifest in the remarkable series of World Conferences convened by the United Nations during the past decade. The United Nations Conference on Environment in 1972 in Stockholm was the first occasion on which the world confronted common problems of global concern whose solution could be achieved only by the closest collaboration among nations. Even at this first World Conference, climate impacts were central concerns. Indeed, und:rst~nding climatic fluctuations and their impacts became one of the high priority act~on ~terns. As a result, the United Nations Environment Programme which resulted from this Conference, has maintained a strong interest in climate: Two years later, in 1974, the United Nations World Food Conference recognized the central role of climate in world food production and the need for improved understanding of climatic fluctuations by calling upon the World Meteorological Organization and the Food and Agricultural Organization to establish a climate warning system. In 1976 the United Nations convened a World Water Conference at Mar Del Plato in Argentina. That Conference emphasized the importance of understanding climatic variations and their effects upon water supplies and usage throughout the world. Most recently, at the United Nations Conference on Desertification, the nations unanimously adopted resolutions emphasizing the need to understand climate and the United Nations Economic and Social Council adopted a resolution endorsing the World Meteorologi~al Organization initiation of a World Climate Programme.
The importance of climate, recognized in these Conferences, suggests that the time is at hand to view world affairs through a climatic prism. This is what we will do at this World Conference. We will recognize the central role of climatic processes in the shaping of the world's economic and environmental welfare, its political stability, and even world peace.
The challenge to our science is unprecedented. Indeed, it is a challenge to all of science because the problems we must confront are not strictly meteorological, although they have a high meteorological content. The scientific problems that must be solved involve complex environmental and ecological systems. What other problems of global concern invoke a knowledge of the photochemistry of the upper atmosphere as well as the chemistry of the depths of the ocean? What other problems engage our knowledge of astronomy and solar physics, at the same time they invoke our knowledge of the geophysical and geological structures of the earth and the seabed? What other problems require a knowledge of the interrelation between the processes of the biosphere as they are impacted by human settlements and their effects on the chemical composition of the atmosphere? What other problems engage us in the science of the radiative properties of gases and the dynamics of geophysical fluids? How many scientific problems have the potential for shaping the economy of nations and disrupting the economic and political relations among them?
Thus, this Conference must represent diverse disciplines. We need to be not only atmospheric scientists but geologists and oceanographers and geophysicists. And we need those who are expert in the fields of agriculture, land use, energy, and water resources, those who ore knowledgeable about health and fisheries and marine transport, and economists, geographers and sociologists to assist us in the documentation of the nature of climatic impacts. And because climate is a global problem, it is so important that representation come from all over the world, from countries with different economic and social systems. We believe this "Conference of Experts
- 7 -
on Climate and Mankind" has brought together the diversity of experts who can address the complex issues before us.
To commence the Conference, a number of overview papers have been commissioned by the World Meteorological Organization in association with the other United Nations agencies. These outstanding papers offer assessments of the state of our knowledge and raise the issues we should discuss. We will hear presentations of these papers during the first week of this Conference. They will provide the framework for the Conference as a whole. During the second week, groups of invited experts have been asked to remain to prepare the detailed findings and recommendations of the Conference. This will be a representative group of experts from diverse scientific and technical fields and regions of the world.
The findings and recommendations of this Conference will have a broad impact throughout the world. They will be transmitted to the Congress of the World Meteorological Organization which will be held in this city two months from now, to serve as a basis for decisions by governments on the scope of a new World Climate Programme. They will also be transmitted to other United Nations agencies, to nongovernmental international groups, and to governments.
One potential recommendation is especially important. The Executive Committee of the WMO has specifically asked this Conference to recommend whether a conference at the ministerial level should be convened to take necessary international actions. It is not surprising that, with the uncertainty surrounding questions of climate, governments and others look for guidance. It is important that we inform governments of the best scientific opinion about the future global climate. Even an answer that science is not able with any reliability to foretell the future will be valuable. However, if our assessment is such that we believe there is a high probability of significant change, we should consider recommending broader actions at international political levels.
It is through the World Climate Programme, a programme sponsored by the WMO, and other international governmental and non-governmental bodie~ that the recommendations of this Conference will be most readily and directly translated into programmes of international action. It is important, therefore, to understand the emerging shape of this World Climate Programme because it will set the context within which our deliberations can be most fruitful. The World Climate Programme will be a programme of international action addressing the full range of climatic issues that confront mankind. The World Climate Programme will mount three major interacting streams of international effort.
The first of these will seek to attack the problems of climate science. Through this effort we will seek to improve our understanding of climate change and variability and improve our ability to predict the natural variations in climate and the consequences of man's effects. This research effort will build upon the remarkable achievements of the Global Atmospheric Research Programme launched a decade and a half ago to examine the possibilities of extending the time range of weather forecasts and to achieve an understanding of the dynamics of climate. The Global Atmospheric Research Programme was set in motion in response to the new global observational capabilities of earth-orbiting satellites at the beginning of the space age, and will culminate this year in the most comprehensive international scientific
- 8 -
experiment ever conducted. This experiment, known as the Global Weather Experiment, will see the international deployment of five geostationary and two polar-orbiting satellites, all in simultaneous orbits. It will involve fleets of aircraft to explore the tropical atmosphere and an armada of over forty ships and networks of automatic data buoys distributed throughout the northern and southern oceans to probe the seas. A unique global meteorological data base should result, which can serve as a focus for the study of seasonal and interannual variations in climate.
The second stream of activity of the World Climate Programme will provide a new level of climate data and applications throughout the world. This international effort will seek to improve the climatic services principally in developing nations. Development planning for agriculture, energy, water resources management, human settlement and land use could be markedly improved by more effective use of climatic information. Even the simplest climatic observations are lacking in many parts of the world. Fortunately, this situation is remediable through national and international actions to provide necessary education, training, and technical assistance.
The third stream of activity addresses the need to understand the impacts of climate variability and change upon society. We all appreciate the direct effects of drought upon crops, or cold winters upon energy demand. What we do not understand clearly, and what governments ore concerned about, is the question of the integrated impact of climatic change and variability upon society. Climatic events ore but one element in complex worldwide, regional, and national economic structures. We wish to learn how the chain of interactions that may ultimately result in malnutrition or unemployment or other critical situations is dependent upon climate. Why are some social and economic structures more resilient to climatic events than others? Do these differences depend on factors we can do something about? If so, what can be done about them? The examination of these impacts is the major objective of this Conference.
You may ask, "Why should the climate community extend its concerns so far beyond scientific and technical matters into the realm of economics and social structure?" The answer is clear: Our task is to identify not just what it is that science should do, but what it is that governments should know. Unless there is a better comprehension of the chain of events and the complex interactions that take place, governmental decisions to mitigate the economic, social, and other effects of climatic impacts may very well provide the wrong remedies.
This gathering should be able to advance our understanding of many of these problems. At this meeting we have on opportunity for extensive discussion between scientists and those knowledgeable about economics, industry, agriculture and governmental practice. The uniqueness of this opportunity has been recognized by the World Meteorological Organization, whose Executive Committee has made a special request to this Conference to review and approve an International Plan-of-Action for the study of the impacts of climate upon society. This Conference has before it a draft Planof-Action prepared under the aegis of the Conference Organizing Committee for its review, consideration, and transmittal to the Congress of the World Meteorological Organization.
- 9 -
Ultimately, what we do about climate issues depends upon the state of our scientific knowledge. Only to the extent that we have ynderstanding can we help our governments. Governments wish to know where to focus effort and resources. The international resources that can be made available to deal with climatic problems are limited. This is so not merely because finances are limited, but because the number of scientists capable of working effectively on these problems is limited. Because of this, efforts must be focused on those climatic problems where there is an urgent need for answers, and where the state of our scientific knowledge leads us to believe that it may be possible for science to make a useful contribution. Mere assertions that the socio-economic impacts of climate will be severe will not be accepted by governments confronted with many urgent requests for resources for programmes all directed at improving socio-economic conditions. It is incumbent upon us not just to assert, but to make the case for international investments in climate research and services.
Thus, the challenge is before us. Our governments will weigh the importance of investments in climate problems in terms of economic and social consequences. As scientists we must weigh what we choose and propose to do on the basis of our assessment of whether science can help. This presents us with a dilemma. We must not raise expectations beyond the scientifically reasonable nor raise fears beyond those scientifically warranted. But it is equally our responsibility to ensure that the possible consequences of either natural or man-induced climatic variations and changes are fully appreciated and the potential of science to assist clearly stated.
Our task is to present the essence of our knowledge and our expectations. If this Conference can allay rather than raise fears, it will have achieved much. If, on the other hand, we find it necessary to alert the world to the need for international action, we cannot shirk that responsibility. Our charge is clear, our responsibility great, our task complex. I am confident that this Conference will meet its obligations.
SELECTED REFERENCES
ABELSON, P.H., MALONE, T.F., et al. (1977). Energy and Climate, Studies in Geophysics, U.S. N~tional Research Council, U.S. National Academy of Sciences. Washington, D.C.
BOLIN, B. (1979). Global ecology and man. Proceedings, World Climate Conference. World Meteorological Organization. Geneva, Switzerland.
BOOKER, H.G., et al. (1975). Environmental Impact of Stratospheric Flight, U.S. National Research Council, U.S. National Academy of Sciences. Washington, D.C.
BROWN, H., et al. (1977). World Food and Nutrition Study, U.S. National Research Council, U.S. National Academy of Sciences. Washington, D.C.
- 10 -
CROSSON, P.R., and FREDERICK, K.D. (1977). The World Food Situation, Research Paper R-6, Resources for the Future. Washington, D.C.
KELLOGG, W.W. (1977). Effects of Human Activities on Global Climate, Tech. Note. No. 156, World Meteorological Organization. Geneva, Switzerland.
MACHTA, L. (1976). The Ozone Depletion Problem, MARC Report No. 1, Scientific Committee on Problems of Environment, ICSU. London, England.
WHITE, R.M. (1978). Climate and Public Policy, Annual Report, U.S. National Research Council, U.S. National Academy of Sciences. Washington, D.C.
WHITE, R.M. et al. (1978). Proceedings, International Workshop on Climate Issues, Climate Research Board, U.S. National Academy of Sciences. Washington, D.C.
WILSON, Carroll L. (1977). Energy, Global Prospects 1985-2000, Workshop on Alternative Energy Strategies, McGraw-Hill Book Co., New York, U.S.A.
WORLD METEOROLOGICAL ORGANIZATION. (1978). Abridged report of the thirtieth session of the Executive Committee, WMO No. 514. Geneva, Switzerland.
WORLD METEOROLOGICAL ORGANIZATION. (1975). The Physical Basis of Climate and Climate Modelling, Global Atmospheric Research Programme, GARP Pub. 16. World Meteorological Organization and International Council of Scientific Unions. Geneva, Switzerland.

CLIMATIC CHANGE AND HUMAN STRATEGY
E. K. Fedorov*
1. Introduction
In recent years both the scientific community and the general public have been increasingly concerned about the possibility that irreversible changes may be taking place in the natural environment, especially in regard to climatic change. Is there any scientific basis for such concern about our climate, in a period when scientific and technological progress seems to be making mankind less constrained by the natural environment and, in particular, less vulnerable to unexpected climatic events?
The construction industry, once highly seasonal, is now active all the year round. We can reclaim deserts for agriculture, and can apply urban technology so as to create large and comfortable communities in the Arctic. Despite these and other developments, however, our contemporary way of life requires much more careful and detailed understanding of, and adjustment to, climate and the other elements of the natural environment if a reasonable balance is to be achieved.
The present scale of human activity, as measured both by its size - the magnitude of construction, the fraction of the earth's surface transformed, the amount of mineral resources extracted, the quantity of energy that is developed and utilized, the effects of human activities on the composition of the atmosphere and hydrosphere - and by the duration over which it has taken place, has increased so much that it has become comparable with naturally occurring phenomena. Nowadays we cannot consider the planet on which we live as an infinitely - resilient environment, nor can we consider its resources inexhaustible. Moreover, many of our actions, such as construction or land reclamation, are deliberately intended to last for long periods of time.
In such circumstances any mistakes that we make in our assessment of the present and future states of both the natural and the transformed environments (e.g., in our estimates of mineral resources, average and extreme values of river discharge, precipitation, sea-level, etc.) are liable to lead to very large cumulative errors. If we provide unnecessary safety margins, of strength, size or power, this is very expensive. If, however, our margins are inadequate, the results may be disastrous. Climate is a particularly significant element in such considerations, since practically all forms of economic development must take it into account, and because many forms of human activity have some effect on climate.
It is for these principal reasons that the question of natural or humaninduced climatic change is of such importance. The present paper provides a brief
* U.S.S.R. State Committee for Hydrometeorology and Control of Natural Environment, Moscow, U.S.S.R.

- 12 -
summary of natural and induced climatic changes (both spontaneous and deliberate); of the impact of such changes on economic activity; and of possible future changes and the response which is needed by mankind if we are to avoid the undesirable effects of such changes.
Before discussing changes of climate, however, it is desirable that we should define the concept of climate itself. In our view, it is both a consequence and a demonstration of the workings of complex processes in the atmosphere, the oceans and on land, As a result of the unequal heating of the Earth's surface by the sun, an atmospheric circulation pattern is developed and maintained, In principle this circulation is very straightforward: it is a system in which air is warmed at low levels in the equatorial region, ascends and flows poleward. It is then cooled, descends and flows back towards the Equator. In practice, however, this simple circulation is made much more complex by factors such as the Earth's rotation, smaller-scale circulations developed through land and sea differences, the barriers to the atmospheric circulation provided by major mountain ranges, etc. Nevertheless, the main features of this general circulation when averaged over a substantial period of time (i.e., years or decades) do exhibit some continuity and permanence.
This relative stability of the overall pattern is due to the general con~ stoney of several atmospheric and oceanic parameters, even though the values of these parameters vary from one part of the planet to another. These parameters include mean and extreme temperatures, precipitation amounts, seasonal river discharge, etc. The sum of all these relatively stable characteristics of the atmosphere is, in our view, what is meant by climate. In the past it was thought that the longer the period of observations available, the more accurately the climate of any region of the world could be defined. Nowadays, however, we recognize that the climate itself is liable to change over time, and there is no general agreement on the appropriate period over which climatic data should be generalized. The most common view, with which we agree, is that a period of 10 to 30 years is suitable, although other views will be taken into account later in this paper. We shall then consider climate as the totality of characteristics of the atmosphere generalized over such a time period.
2. Climatic change resulting from natural causes
The results of geological, archaeological and historical investigations all indicate that radical changes of climate have taken place throughout the Earth's history. It is, however, difficult to say much that is meaningful about the climate of any specific geographical region in the remote past, because of continental drift and polar wandering; in other words, any specific region of the planet has not necessarily remained in its present latitudinal (or longitudinal) position throughout geological time. There is, however, good reason to believe that during the last several hundred million years, the normal climate of the Earth as a whole was much more homogeneous than it is at present; there were not the pronounced difrerences in climate between different latitudes that we have today. Over most of this period temperatures in the inter-tropical zone were much as they are today, but in high latitudes the temperatures were much warmer. During the periods when the polar areas were occupied by oceans, these seas were ice-free, and land areas were similarly free of permanent ice.
- 13 -
Several tens of millions of years ago this situation began to change, and the temperatures of high latitudes fell gradually. About two million years ago this process accelerated, and Arctic temperatures dropped sharply. A glacial period ensued, in which repeated advances of ice sometimes reached mid-latitudes, with intervening periods when the ice receded. The last glacial advance ended in the Northern Hemisphere about ten thousand years ago.
Since that time, less marked climatic changes have taken place. For example, approximately one thousand years ago the temperature of the north polar region was higher than it is today, and the limit of sea-ice was further north than it is at present. This, among other things, facilitated voyages from Europe to Greenland, where communities were able to survive for several centuries. Subsequently, however, a fall in temperature and a southward extension of sea-ice prevented such voyages, extended the area of land-ice in Greenland, and ultimatley led to the extinction of the settlements.
The same fall of temperature was experienced in Europe, where it is often described as a "neoboreal" period, or "Little Ice Age". More recently still, climatic changes have also occurred during the last 100-200 years, and temperature changes during that time have been particularly marked in high latitudes. The best-known example of such recent changes is the warming of the Arctic that reached a peak in the 1930s, followed by a gradual fall in temperature during the 1940s and 1950s,
Temperature, however, is not the only indicator of climatic change; precipitation amounts also vary. For example, variations in the winter precipitation in the North European part of the U.S.S.R. have caused changes in the level of the Caspian Sea. During the last four or five hundred years there have been several rises and falls in this level, with a range of about 20 m. At present the level of the Caspian Sea is falling, but this is a result of human as well as natural factors. Climatic change reflects the changes in the general circulation of the atmosphere, and doubtless also the general circulation of the oceans.
There are a number of hypotheses that try to account for climatic change, but as yet there is no adequate physical theory capable of providing a comprehensive explanation of the observed phenomena. For present purposes it is convenient to divide the different hypotheses into two groups: those that try to account for the climatic changes that have taken place over tens or hundreds of millions of years, and those that are concerned with the more recent changes during the last ten or twenty thousand years.
The factors responsible for long-period changes of climate may be either external to this planet or developed on it. External factors might include variations in the quantity of radiation emitted by the sun, or changes in the Earth's orbit around the sun; internal factors include the formation and movement of continental areas, the growth of mountain ranges (orogeny), and volcanic activity of various kinds that produces dust and gases which may alter the transparency and other characteristics of the Earth's atmosphere.
During the last few thousand years, however, climatic change has occurred during a period when the Earth's orbit and its surface structure (location of continents and oceans, mountain ranges, etc.) have been relatively constant, and when it is

- 14 -
probable that the nature and quantity of solar radiation were also constant. This leads to the belief that on the Earth as it is at present there is not one but several equilibrium states of the whole complex of hydrometeorological processes in the atmosphere and oceans, i.e., not one but several possible patterns of world climate. It seems reasonable to conclude also that a change from one of these patterns to another may be caused by relatively insignificant factors. Indeed the complex interactions between the various processes of climate, including feedbacks, make it possible that in some cases the changes are gene!2ted or triggered by the climatic system itself. Calculations made by M.I. Budyko /1/, one of the leading Soviet climatologists, indicate that the present climatic pattern of the Earth, and patterns similar to it, are generally unstable. In his view there are only two inherently stable patterns: the uniformly warm climatic pattern characteristic of the Mesozoic period which, as noted earlier, did indeed maintain itself for several hundred million years, and a complete glaciation of the Earth, for which there is little or no evidence in the geological record.
In the op1n1on of some scientists, the principal cause of both the long-term climatic changes and the relatively rapid succession of Quaternary glaciations is to be found in the changing intensity of volcanic activity and its consequent effects, through volcanic dust, on the Earth's atmosphere. Other scientists emphasfze changes in the Earth's orbit, and so on. It is not the purpose of this paper, however, to analyse or' evaluate the various hypotheses. It seems more important for our prese~t purpose to emphasize the fact that, throughout the history of our planet, the climate has been liable to change in ~esponse to natural factors or causes, and consequently there is no reason to suppose that similar changes are unlikely in the future.
In recent years, in both scientific and popular literature, many papers have appeared that describe a supposed fall in temperature in the northern hemisphere during the 1960s and 1970s; this fall is supposed to have.been both widespread and relatively rapid. It has been attributed to restructuring of the general circulation of the atmosphere, to significant changes in the amount of precipitation received in different regions, etc. It seems worth mentioning at this point that detailed investigations by many scientists, and especially by a large team of Soviet scientists, have found such apprehensions to be groundless. More probably, in our opinion, in the coming decades it seems reasonable to anticipate small climatic changes similar to those that are known to have taken place during the last 100-200 years. In particular, it seems very probable that a warming trend is just beginniAg in the northern hemisphere; as durlng the 1930s, this is likely to be most pronounced in the Arctic.
3. Climatic changes induced by human activity
Human existence, like the existence of other living beings, necessarily has its effects on nature. Human development could not have taken place as it has without simultaneously transforming different elements of the natural environment. In our view, the impacts that are of the most relevance to the subject of climatic change are the following:
(a) The transformation of the land surface of the planet by forest clearance, the ploughing up of the steppes and great plains, land reclamation, the construction of large man-made lakes and reservoirs, ·the conversion of large areas to a puilt-up environment, etc. These transformations alter

- 15 -
the reflectivity of the Earth's surface and its "roughness"; these in turn cause changes in the energy balance and in local atmospheric circulation patterns.
(b) Changes in the water balance, as an increasing proportion of river discharge is used for irrigation or to meet industrial needs. Evaporation over land areas consequently tends to increase, and run-off into the oceans decreases. It is probable that the entire discharge may ultimately be utilized in this way. This will not change the general hydrological cycle on the planet, but it will lead to a different relationship between the various elements of the cycle in different geographical regions. Evaporation, condensation and freezing of moisture are also, it should be noted, significant elements in the energy balance of the atmosphere.
(c) Changes in the energy balance. The earth-atmosphere heat balance can be changed both by alterations in the transparency of the atmosphere (due mainly to carbon dioxide released by combustion of fossil fuels) and by direct release of sensible heat as a result of power generation and the use of all types of energy.
Since the various processes that interact to provide the climate are approximately comparable to the workings of a heat engine, changes in the energy balance, and especially changes of sensible heat, seem to be of major significance for climatic change. At the local scale (10 000 - lOO 000 km2) such human-induced changes in climate are already evident. For example, temperatures tend to be higher within urban areas, and in the vicinity of reservoirs wind speeds are stronger and temperature variation is less. At the present time, however, it is not clear what amount of change in a climatic process is necessary for the effect on climate to be evident at either the local or the global scale, nor can the climatic effects of such changes be accurately predicted.
Most of those who have investigated the problem believe that at present one of the principal effects of man on climate occurs through carbon dioxide emissions resulting from the burning of fossil fuels. These emissions lead to a worldwide increase in the c~ content in the atmosphere, enhancing the so-called greenhouse effect. Budyko L1J, Bolin [17, Baes, Geller, Ollson and Ratty [17, Flohn L±7 and many others suggest that the continuation of current rates of growth in energy use based on fossil fuel will lead to a substantial percentage increase in the atmospheric C02 concentration during the next 50 to lOO years, and that this in turn will raise the temperature of the atmosphere and lead to significant climatic changes.
One frequently sees, in scientific as well as popular literature, 'the belief expressed that such increases in C02 concentration (and also direct release of sensible heat) will result in a more or less uniform rise in temperature in the lower atmosphere. This in turn is presumed to lead to global warming, melting of glaciers, etc. This view seems oversimplified. Increases in temperature are likely to be most pronounced in the Arctic, and consequently the temperature gradient between Equator
- 16 -
and Polar regions would diminish. This implies changes in the general circulation of the atmosphere, reducing, for example, the west-to-east flow of moist air from the Atlantic Ocean over Eurasia. We cannot in fact estimate the character and magnitude of such changes, and the climatic pattern that would result from them in different parts of the world. It is, however, extremely unlikely that the result would be a uniform warming over the whole surface of the globe.
Another statement that is frequently encountered in the literature, and that seems equally groundless, is that changes in climate can be caused only be alterations in the Earth's heat balance that arise from the use of fossil or nuclear fuel. This view implies that the large-scale use of solar energy, or of energy from the wind or running water, can have no effect on climate. Climatic variations, however, can be the result not merely of changes in the global heat balance but also of the geographical redistribution of the elements of the heat balance. The sources and sinks of heat, and their relative growth or decline, are included in this.
This in turn raises the important question whether the known effect of existing major heat sources,on local climate could, if such sources grew in magnitude, become evident also at the ~nal or global scales. If, for example, large industrial regions (e.g., the whole of Western Europe, northeastern U.S.A. and the east-· central coast of Japan) were to increase their use of energy many times compared to the present, would they become significant factors, similar to the natural centres of the circulation of the atmosphere? Some calculations of the consequences of increased heat release from such sources (''heat islands", as they are often called) have been made. Hafele et al. /5/, for example, have examined the probable effects resulting from the construction~f two large centres of energy conversion (e.g., thermonuclear complexes), one located close to the coast of the British Isles, the other in the western Pacific offshore from Canton. They suggest that changes in the atmospheric· circulation would result, in the form of latitudinal shifts in precipitation belts which would lead to frequent droughts in some areas and considerable increases in moisture in others.
Many other papers have appeared recently that contain estimates of the additional heat required to alter the circulntion of the atmosphere on a regional or · global scale. Most of these estimates suggest that regional changes, at least, in the general circulation of the atmosphere can be expected if human activity were to add approximately 1-2 per cent of the heat at present absorbed by the Earth from the sun or if heat were released which led to a temperature rise of several degrees over an area of about one million square kilometres. These and other calculations focus on the growth in human energy use, but it is obvious that other forms of environmental change caused by human activity will also have climatic effects.
Although quantitative estimates are still at best only approximations, our present knowledge of the factors influencing climate does enable us to assert with some confidence that: (a) human activity has already led to noticeable but localized changes in some climatic elements; (b) if energy production were to increase.by two orders of magnitude (which is quite possible during .the next lOO to 200 years) the climate will begin to change on the regional and possibly on global scales as well.

- 17 -
4. Deliberate modification of climate
The feasibility of deliberate alterations to the present climate, and the ways that these might be achieved, have been subjects of scientific debate for a long time and very different viewpoints have been expressed. These questions of feasibility, ways and means, and objectives remain, in our view, of considerable importance.
If we accept that man has in the past been able to alter the climate without intending to do so, then in principle it should be possible to achieve similar changes deliberately. To do this we would require a quantitative theory of climate, in order to design actions on a scale necessary to achieve the desired changes. The development of such a quantitative theory does not appear to be an insuperable scientific task.
As mentioned earlier, the processes that interact to produce world climates can be compared to a heat engine; changes in the workings of such an engine are caused by changes in its internal processes. If we wish to make deliberate changes to the climate, we should therefore seek to make appropriate changes to the mechanism of the atmospheric heat engine. For example, it seems reasonable to believe that the climate could be changed by a redistribution of the sources and sinks of heat over the Earth's surface, which might result from the construction and management of major centres for generating and using energy in specific locations.
It also seems possible to change the albedo over large parts of the world, again affecting the heat balance. It has been suggested, for example, that this might be achieved through the creation of thin films on the ocean surface. (It may be noted that such films are already caused by oil pollution of the sea.) Another approach might attempt to decrease the transparency of the atmosphere to solar radiation by substantially increasing the aerosol content of the upper layers. Independent calculations by different scientists indicate that it would be possible to alter the albedo of large areas of the polar regions and also to change the aerosol content of the upper atmosphere if a substantial number of aircraft could be made available for the necessary period for such a project. It does, however, seem rather irrational to reduce the amount of solar radiation reaching the Earth's surface in order to balance the growth of anthropogenic production of energy.
A rather different approach to climate modification is through interference with the dynamics of the atmosphere or the oceans. We know that existing mountain ranges have significant effects on the climate of both adjacent and distant regions. It may be that it will be possible to design specific structures, which may not be particularly large, that might play a similar role. The creation, for example, of an upward motion in the airflow might in appropriate conditions trigger much greater vertical motion, developing into a self-sustaining process. Similarly in the oceans, we know that spontaneous deviations of ocean currents from their normal track cause significant changes in weather; the variations of the El Nino current off the Peruvian coast are a well-known example. More permanent diversions of flow could be made to occur through the construction of specially designed barriers. They would be thousands of times larger than typical present-day dams, but in principle their construction is feasible.
- 18 -
Other deliberate actions of a similar kind could be suggested. Such major permanent changes in the heat balance, or in atmosphere and ocean dynamics, will necessarily lead to changes in the general circulation of the atmosphere. But another type of change needs to be considered as well. Because the processes that combine to produce world climate are at present probably inherently unstable, it seems reasonable to assume that specific, once-only, actions could produce irreversible changes in the circulation. Thus, for example, according to the work of a number of scientists, if the ice cover of the Arctic Ocean were made to disappear, the atmospheric and oceanic circulation would adjust in such a way that the ice would not be able to re-establish itself. This in turn would lead to considerable changes of climate throughout the world.
Both the evidence for unintentional climatic change already occurring, and the possibility of deliberate modification of climate by man, require that as a matter of urgency we should find out what are the critical values of different meteorological parameters, in order to avoid such irreversible changes.
Social and political issues of some significance arise if we consider the possibility of climatic changes occurring in one part of the globe as a result of actions taken in another region. The question may be posed as follows: might an individual 'country, through actions taken on its own territory, be able to affect the climate of another country in a different part of the world? I believe that this is scarcely possible. Changes of climate (as distinct from weather) on a global scale are likely to require the activities of many countries in different parts of the world.
There are, however, other views on this subject. It may be recalled that, twenty years ago, the well-known American ~ysicist Edward Teller thought it possible to modify climates for military purposes /6/. In this connexion, the proposal made by my own country in 1972 that changes to the natural environment for military purposes should be prohibited by international agreement was very timely. This agreement, which has already been ratified by many countries, must command the support of earth scientists.
In summary, it seems reasonable to anticipate that, in the future, world climate may be modified by deliberate human action. It may well be that such action will seek not to transform our present climatic pattern but rather to stabilise it, since the social and economic life of mankind ~s adapted to the present climate.
5. The effects of climatic change on man
Climate, and climatic changes, have always significantly influenced mankind, and they continue to do so at present. There is general agreement on this, although there are differing views on the precise nature of such influences.
Gerasimov (see his overview paper) considers that climatic changes during the geological past were the principal factor in the evolution of the human species enabling it to become so distinct from other species. The well-known American geographer Huntington believed that the natural environment, and especially climate, determined all the features of economic, technological and cultural life, and that even the social systems of human society reflected this environmental influence.

- 19 -
One example of this has already been mentioned: the failure of the Scandinavian settlements in Greenland due to the onset of the neoboreal period. Similarly the expansion and contraction of desert zones in different parts of the world led to the decay of societiesand civilizations that were, for their time, relatively advanced. The repeated variations in level of the Caspian Sea over a period of 200-250 years have caused significant changes in the living patterns of the peoples along its coasts. Even short-term (1-2 years) deviations of meteorological elements from their norm can lead to severe if not catastropic consequences for many people, The drought in the Sahel may stand as one example.
In addition to what was said at the beginning of this paper about the increasing responsiveness of modern civilization to environmental factors, it should also be kept in mind that scientific and technological progress, resulting in the growth of population, production and consumption, has meant that people nowadays live and work in increasingly extreme environmental conditions. In such circumstances, even quite small changes in the natural environment may have far-reaching consequences. For example, if practically all the discharge of a major river is abstracted for the irrigation of agricultural land, then a naturally-occurring reduction in its flow, say by 15-20 per cent, which is quite feasible, may cause a marked fall in the food production in that region. Our ancestors may have had a lower quality of life but perhaps they were less vulnerable to small changes in climate.
More examples of the impact of climatic change on human activity are scarcely necessary; they are both well-known and very diverse in character, Changes in temperature, cloudiness and precipitation are of primary importance to agriculture; temperature changes in different oceanic areas have major effects on fisheries, and so on. The close links between different sectors of the economy in each country, as well as similar links between countries, means that if any single branch of economic life is affected in this way, there will inevitably follow far-reaching consequences for the economy of a large region and even of the whole world. It follows that the prediction of world climatic conditions for several decades ahead, and the use of such predictions in the planning of future activities are of great importance at the present time. This is increasingly recognized not merely by climatologists but also by politicians, administrators and the general public.
6. A desirable strategy for mankind
Climatic changes wili inevitably occur in the future. They will often be significant and may become irreversible in the decades immediately before us. They may be local, regional or global in their scope.
It is consequently essential that we develop a clear strategy: that we plan a set of long-term actions which will enable man to avoid the adverse consequences of such chan~es. Such a long-term programme may have to be started in the very.near future. Although small local changes may result from activities i~ one part~~ular region, and can be avoided by other measures taken ~n the ~ame reg~on, mor; w~despread or global changes are associated with the general c~rculat~on of ~he Earth s atmosphere. Consequently our strategy to deal with such changes must ~nclude measures taken on regional or global scales.
- 20 -
What are the major elements of such a strategy? The first and most important requirement is certainly a forecast of climatic changes. This is a complex scientific problem, involving the development of a quantitative physical theory of climate and of quantitative estimates of the changes that are likely to be brought about by different causes.
This task, it should be said, is already rece~v~ng priority attention and a rapidly increasing number of scientists is engaged on it. Although the problem itself is extremely difficult, there seem no grounds for pessimism. Science has always managed to find solutions to such urgent problems for mankind. Since a solution to this particular problem is already beginning to take shape, we can be confident of ultimate success, although this may require a substantial amount of time. As well as time, it will require also close international co-operation, since the collection of the global data required, the development of the necessary theories (which will involve the use of the largest computers) and the verification of these theories by experiments on a worldwide scale can all only be achieved through continual international scientific co-operation. Already we have had an example of such co-operation in the "GARP Atlantic Tropical Experiment", and the first global experiment is already under way, as are other- international activities.
The second element of the strategy is an assessment of the consequences of· the different types of natural or man-induced climatic changes. Here the scientific problem is closely related to the socio-economic problem. The impacts of climatic change on economic development, and vice versa, are to be assessed in terms of future conditions. Consequently it is the future economic situation of individual countries that must be used in such an assessment. Estimates must be made for several decades ahead of the probable characteristics of agriculture, water supplies, industry, etc. Only in this way can an adequate assessment be made of the effects of possible climatic change, both natural and man-made. The assessment therefore assumes the existence of long-term plans for national development in individual countries and, at the world scale, for the whole of mankind.
In socialist countries, and also in some developing countries, such plans exist though, naturally, they are not yet perfect. For example, agricultural development may proceed more quickly or more slowly than the plan anticipates. Eventually, however, what is planned is accomplished. Many countries, however, have no overall plans of this kind. Consequently a special type of forecast is required of their future economic activity and of the state of different sectors of the economy.
Such assessments must be evaluated from a specific standpoint; to decide how favourably or unfavourably climatic changes affect different sectors of the economies of countries, regions or the whole world. We have to have some basis for deciding what is "good" and what is "bad". What standpoint should we adopt: that of the individual firm or large corporation, that of the individual citizen, the whole population of a country or, even more widely, on the basis of what is good or bad for all mankind? The objectives as well as the trends and prospects of economic development need to be considered from the standpoint that we adopt, since the achievement of the objectives will be affected by favourable or unfavourable climatic changes. I am not likely to be contradicted if I suggest that the ''prosperity of all mankind" is the goal of scientists. However, this .is a vague phrase and the subject is a very complex and difficult one to resolve.

- 21 -
Several economists and sociologists have recently discussed these questions 1n a series of papers. One such is that written by a group of social scientists led by the well-known American economist Laszlo /7/. This examines the objectives established by different countries of the world, by national governments, various public groups, international organizations, religious bodies and the like. Laszlo is forced to draw what to us is the obvious conclusion that the goals which countries have in regard to economic activity by their governments and people are made explicit in the plans of socialist countries and help to shape their development. In capitalist countries the notion of a goal is absent; there are only desires for fu~ther development, and these vary among different organizations and public groups. Not surprisingly, there are no clear goals established, nor ways to achieve them, in the case of mankind as a whole. Laszlo calls for the development, adoption and pursuit of some rational objectives for all mankind, which he calls "a revolution of goals".
The third element of the strategy is to make recommendations on how to avoid the adverse consequences of climatic change, or to avoid such change altogether. Such recommendations are nowadays being developed and prepared in scientific papers. It is, for example, often suggested that fuel and energy use should be reduced in order to prevent the increase in the C02 content of the atmosphere or increased carbon dioxide absorption by the biosphere. Restriction of energy use is also recommended in order to preserve the planetary heat balance, etc. Some scientists have expressed strongly their fears that, without action of this kind, mankind will be faced by serious climatic changes during the next 50 to lOO years. The majority of such statements or recommendations are aimed at the preservation of the present climate, although there are some who believe it possible to "change it for the better".
But to whom are these recommendations addressed, and who is to implement them? Reference is usually made to politicians or to so-called"decision-makers: In fact, all the papers by scientists in the west who are concerned with this problem end with an appeal to such peopl~ so climatologists are not alone in making such appeals.
The possibility of climatic changes is only one of the so-called global problems that affect mankind. Others include the provision of adequate food for the world's population, reduction of the still-increasing gap betw~en developed and developing countries in economy, technology and other fields, the provision of energy, the rational use of water resources, the use of oceanic and space resources, and so on. Scientific publications increasingly reflect concern for such problems. It is essential that all scientists who are involved in such matters should explicitly arrive at the conclusion that concerted action by many countries is necessary for these problems to be solved adequately and comprehensively on a global scale.
The actions that have been recommended vary. For example in the "Limits to Growth" paper by Meadows' group /8/ it is believed essential to put an end to continued expansion and growth. Me~rovic and Pestel /9/, on the basis of more detailed calculations, conclude that further economic development is acceptable, but that its form needs to be agreed at th~lobal level. The well-known American economist Leontiev and his eo-workers /10/ suggest that, within current natural limits, mankind can develop according to several different "scenarios", but he has nothing to say on what should be done in order to follow any one of them. A large group headed by another economist, Tinbergen /11/ recommends the creation of a new world order,
- 22 -
namely, a system of co-operation among countries on a global scale including control of national economic and other activity by a supranational authority to which each state would transfer part of its sovereign rights. Tinbergen, it may be noted, also mentions decision-makers, whose agreement would enable the desired reconstruction of the world order. He considered that the decision-makers are national governments, international organizations (primarily the UN)and perhaps certain other bodies like multinational corporations.
We shall not here discuss the interesting and important questions of goals, incentives and the management of national economies; let us note merely that such matters depend on a country's social systems. Nevertheless concerted action by states all over the world to lessen, and then to solve, the urgent problems of modern civilization is important now and will become absolutely essential in the coming decades. This can only be achieved through the co-operation of sovereign states on an equal basis for their mutual benefit. Such concerted action and co-operation already takes place in several fields where the interests of different nations coincide. International organizations like the World Meteorological Organization, the World Health Organization and many other similar bodies have functioned for more than a century. Similar co-operation is developing in the field of environmental protection, and agreements banning environmental damage for military or hostile purposes, preventing the pollution of the oceans, etc., have been concluded.
It is very important that, bearing all this in mind, we work towards a similar extension and strengthening of international co-operation. Of course, international co-operation in the solution of such global problems as possible climatic change is immeasurably more difficult to achieve than, say, co-operation in the World Weather Watch. However it is more urgent. And the general relaxation of international tensions (detente) that has taken place during the last decade, despite the efforts of all those opposed to it, leaves us convinced of the feasibility of cooperation in different fields.
To adapt the world economy to new climatic conditions, or to modify the climate on a global scale, so that adjustment of the economy is unnecessary, are each possible, given certain conditions. The vital conditions are:
to prevent world conflict and establish a lasting peace, since only through the peaceful coexistence of countries with different social systems are close co-operation and concerted action possible;
to stop the arms race and promote disarmament, for only by such action will it be possible to afford the great material resources required by such concerted activities.
It is clear that only under such conditions can we hope to solve the global problems of modern civilization.
I doubt whether, at this conference, we shall all agree on how the climate will change during the coming decades, but I hope that we can agree unanimously that mankind should develop an appropriate strategy so that it is prepared for such inevitable changes, and that peace, disarmament and international co-operation provide the foundations for such a strategy.
- 23 -
REFERENCES
/1/ BUDYKO, M.I. (1971). Klimat i zhin (Climate and Life). Gidrometeoizdat, Leningrad, 472 pp.
/2/ BOLIN, B. (1976). Energy and Climate. Secretariat of Future Studies, Stockholm.
/3/ BAES, D. F. et al. (1976). The Global Carbon D:i.oxide Problem. Oak Ridge National Laboratory, U.S.A.
/4/ FLOHN, H. (1977). Man-induced changes in heat budget and possible effects on climate. In: Global Chemical Cycles and their Alterations by Man. Berlin, pp. 207-224.
/5/ HAFELE, W. et al. (1975). Possible Impacts of Waste Heat on Global Climate Patterns. Second Status Report of the IIASA Project on Energy Systems, International Institute for Applied Systems Analysis. Laxenburg, 1976, pp. 134-148.
/6/ PRAVDA, 28 November 1957, p. 4.
/7/ LASZLO, E. et al. (1977). Goals for Mankind. E.P. Dutton, New York.
/8/ MEADOWS, D.M. et al. (1972). The Limits to Growth. N.Y., Universe Books.
/9/ MESAROVIC, M. and PESTEL, E. (1974). Mankind at the Turning Point. N.Y., Reader's Digest Press.
/10/ LEONTIEV, W. (1977). The Future of the World Economy: A United Nations Study. N.Y., O.U.P.
/11/ TINBERGEN, J. et al. (1976). Reshaping the International Order (RIO): A report to the Club of Rome, N.Y., E.P. Dutton.
GLOBAL ECOLOGY AND MAN
Bert Bolin*
1. General features of the biosphere
The characteristics of the biosphere are the result of development over millions of years. The size of the earth, the distribution of land and sea (which has been changing during geologic time), the chemical composition of the earth's crust, water, a primordial atmosphere and the characteristics of solar radiation provided the setting for life to begin. The development of living organisms, which began in the sea, gradually changed the composition of the soil, the oceans and the atmosphere. Oxygen became an important constituent of the atmosphere, and enabled more advanced forms of life to develop. The first primitive ecosystems were successively replaced by more complex ones and the features of the biosphere gradually became very different from the original shell surrounding the proto-earth. This evolution did not only imply the "survival of the fittest" and the development of . more versatile species, but also a mutual interplay of these processes to maintain approximately an overall stability of the global ecosystem and its subsystems while allowing a slow further development.
The activities of man on earth have now reached such a pitch that he significantly influences both regional and global processes within the biosphere. In comparison with the natural rates of change these· impacts are sudden and disturb the natural balances. Adjustments are initiated, but, since these are slow, very considerable imbalances may exist for long periods. The consequences of man's impacts may therefore hardly be noticeable to begin with, and the new quasi-balance towards which the system is striving is usually not well understood, at least for some time.
It is obvious that the present features of the ecosystem on earth are determined to a very considerable degree by the ciimate. The very marked differences between, for example, the tundra, the boreal forest, the savanna and the tropical rain forest are the result of the very different species and their interaction in· characteristic biomes that have developed over millions of years. The living matter on earth is part of the climatic system and we need to consider carefully the role of such matter when we are concerned with changes on time scales of centuries, millennia or longer.
The study of the global coupling of the earth's ecosystems is best accomplished by a careful analysis of the global biogeochemical cycles of the most important constituents present in organic matter, i.e.,water, carbon, nitrogen, phosphorus, sulphur and the key trace metals. The importance of such studies becomes even more obvious when we realize that man is already significantly and directly modifying these cycles, particularly because of the rapidly increasing use of fossil fuels as an energy source.
*Department of Meteorology, University of Stockholm, Sweden.

30
- 25 -
2. The terrestrial biosphere
We may distinguish between s1x major types of land:
(a) Forest;
(b) Grassland;
(c) Woodland (small trees with well developed undergrowth);
(d) Shrubland (coverage of shrubs and other plants generally above 50%);
(e) Semi-desert;
(f) Desert (plant cover generally less than 10%);
These are found in such different environments that several biome types are defined within each.
The transitions from one biome type to another may be abrupt, but are generally gradual. They depend primarily on climate, but also on other environmental factors. Figure 1 describes two such ecoclines as dependent on:
(a) Increasing aridity from rain forest to desert in South America; and
(b) Temperature gradient from tropical seasonal forest northward to Arctic tundra.
:~~~~-~~~~~~~£~~"!'~'-n•~ww~nu~·~·~··· .. ·~·"•..w~u·-~···~·~··•~-~--Oak-Hickory Fores'~woodlands Prairie Dry Grasslands Desert
30
20
10
a.
b.
Figure 1 -- Ecoclines along a gradient of (a) increasing aridity from rain forest to desert in South America (b) decreasing temperature from tropical seasonal forest to the Arctic tundra /1/

in a are, soil
- 26 -
. The relation betwee~ bi~me types and climate can be described schematically d1agram, as repro~uced 1n F1gure 2. The boundaries between the various types of co~rse, approx1mate and depend, for example, on soil types, even though the also 1s a product of the biome itself.
-15
-10
u -5 0 -Ql
0 L.. :J ..... e Ql 5 a. E ~ _. 10 0 :::J c c ~ 15 c 0 Ql
20 ~
25
30 50 100 150 200 250 300 350 400 450 Mean Annual Precipitation, cm
Figure 2 - World biome types in relation to mean annual precipitation and temperature. Boundaries between types are approximate. The dot-anddash line encloses a wide range of environments in which either grassland or one of the types dominated by woody plants may form the prevailing "vegetation" /1/
The existing soil types on earth have been formed in interaction between living communities and a geological substrate. They are mixtures of inorganic and organic substances. The soil contains dead organic matter, living roots, fungi and bacteria. It is in itself a living community.
Soils may be classified as a function of temperature and precipitation, as indicated schematically in Figure 3, in a manner similar to what was shown for the biomes. This implies that there is a general, but by no means unique, relation between biomes and soil type.

Cold
Desert
- 27 -
Alpine Desert, Polar Desert
Forest Brownearth and Brown Latosol
I Forest
Humid
Figure 3 -- Gre~t soil group~ ~n relation to climate. Both non-grass and grass dom~nated commun~t~es occur and form different soils. Those formed in grassland communities are written vertically, those formed in woodland, shrubland or tundra are written on the horizontal. Soils formed on limestone are indicated in brackets ani_those formed with special conditions of water movement in parenthesis /1/
3. The marine biosphere
Life in the oceans primarily develops in the photic zone, i.e., the top few tens of metres, where solar radiation is adequate for photosynthesis. The amount of carbon in the form of carbonate and bicarbonate ions is gene~ally sufficient for phytoplankton to grow if the supply of nutrients, i.e., fixed nitrogen, phosphorus and trace metals, is sufficient. Usually nitrogen and phosphorus limit the rate of primary production by photosynthesis, Zooplankton feed on the phytoplankton and in turn serve as food for higher animals in the predator-prey chain. When plankton and animals die, bacterial decomposition and chemical dissolution begin, whereby nutrients again are supplied to the water and become available for renewed primary production. Dead plankton and fecal pellets that are comparatively large in size sink to deeper strata of the oceans while being decomposed. Their bacterial decomposition requires oxygen. The oxygen transfer to deeper layers (below a few hundred metres) is slow, and for this reason an oxygen minimum is generally found at depths between 500 and 1 500 m. Exchange of water between the cold surface waters at higher latitudes and these intermediate layers of the oceans maintains a flux of oxygen to balance the consumption due to bacterial decomposition. This exchange conversely also brings water enriched in phosphorus and nitrogen (and also carbon) to the sea surface in high latitudes and in areas of upwelling in association with the major ocean currents.

- 28 -
The characteristic times for the various processes described vary greatly. The innermost cycle, i.e., phytoplankton~ zooplankton-7 bacterial decomposition ~ ret_urn of nutrients to the water in the surface layers, takes place in a matter of weeks. The turbulent motions in the surface layers are effectively maintained by winds, heating, cooling and evaporation processes whereby roughly the uppermost lOO m are reasonably well mixed in the course of weeks or a month. The thermohaline circulation involving the intermediate waters has a characteristic time scale of a few decades to half a century, while the deep sea water is renewed in the course of 500 - 1 500 years.
4. Global biogeochemical cycles
An attempt to summarize our present knowledge about the magnitude of the reservoirs (pools) of carbon in nature and the fluxes between (and within) them is given in Figure 4. Units are in 1015 g y-1 (Pg y-1).
At present (1978) the atmosphere contains about 695 Pg (c.330 ppm, parts per million by volume), which is an increase from about 660 Pg (c.313 ppm) during the last 20 years for which accurate observations are available. Figure 5 shows a summary of the measurements during this time period.
The total amount of inorganic carbon in the sea is about 36 000 Pg, of which most is in the form of bicarbonate ions. There is furthermore about 1 000 Pg of carbon in the form of dissolved organic matter. In contrast to these numbers, there is only about 4 Pg at any one time locked in living organic matter.
The exchange of carbon in the form of carbon dioxide between the atmosphere and the sea is rather rapid, the average residence time for a COz molecule in the atmosphere being 5-10 years. This means a gross transfer across the sea surface of about lOO Pg y-1. The primary production in the sea is estimated at about 40 Pg y-1, which implies an average residence time for carbon in living matter in the sea of about 1 month. The corresponding time for carbon in dissolved organic matter is probably considerably more than 1 000 years.
About 800 Pg carbon is stored on land as living organic matter. Of this amount approximately 90% is found in the forests. The net primary production is 50 - 75 Pg y-1. Less than half, about 20 Pg, is assimilated in the forests and roughly half of this amount is transformed into wood. The average transit time for carbon in the living organic pool as a whole is 12-15 years.
The estimates of the total of carbon in the soil vary between 1 000 and 3 000 Pg. The uncertainty largely depends on the different values for the pool of carbon in the form of peat.

ATMOSPHERE DEFORESTATION
1 SOL DECil'IPOSITION
~® 20 1 otFOSSIL FUEL CCMBUSTION
FOR CONSUM"TION
<1
RIVER FLOW
615+@ YEARLY INCREASE@
I .. 11 000 000 I I ~ I 150
PEDOSPHERE GAS-OIL- COAL
5000
HYDROSPHERE
Figure 4
The carbon cycle @. The reservoir inventories ore given in 1olS g = Pg and the fluxes in Pg y-1. The oceans have been divided into 11 reservoirs to permit a more accurate description of the ocean circulation and associated carbon fluxes in the oceans. The three numbers in these reservoirs refer to dissolved inorganic carbon, dissolved organic carbon and carbon in living matter. The double arrows between ocean surface water and intermediate water indicate turbulent exchange. The estimates for the carbonate bottom sediments ore based on the assumption that a layer of about 10 cm can be in exchange with the ocean water due to bioturbation. For the terrestrial biota the net assimilation has been assumed to be 50% of the gross assimilation. The encircled figures show the fluxes caused by man during a single year (Pg y-1). The emissions to the atmosphere by fossil fuel combustion (5 Pg y-1), defore.stotion ( 1 Pg y-1) 1 soil decomposition ( 1 Py y-1), ore partly balanced by increased assimilation (1 - 3 Pg y- ) , dissolution in the oceans (1- 3 Pg y-1) and partly by an increase in the atmosphere (2.5 Pg y-1). Since pre-industrial times the amount in the atmosphere has increased by 80 - 140 Pg. For a discussion of the uncertainty of the figures, ••• [fi.
t
CARBONATE BOTTOM DEPOSITS
~ LYSOCLINE ----
CALCITE COMPENSATION DEPTH
!
SURFACE WATER
----------t
INTERMEDIATE WATER
___ 1_Sj_1000m ____ j _____ f
"' '-0 u 22
2000m
j" 12 JODOm DEEP WATER
J· 4 ·4000m
Li 2
2 I ! -r---'
-c0.1

- 30 -
331.
332 ---- Mauna Loa /'' -South Pole /~ -·- North Pole _,..,
330 ,
/
l I
328 I I
/ , 326 .," I /
/ , I I 321. I
I ./ I , / 322
, , ,/' ~"
320 ,,
,/ .-"' ,. ... ,/ , ... 318 "' ,/ ,
" // ... .. " 316
, ,"
" 311.
Figure 5 -- Seasonally adjusted COD£entrations of atmospheric C02 at Mauna Loa (Hawaii), South Pole /3/ and as measured from commercial aircraft in North Pole regions /4/. The North Polar curve is a second degree polynomial deduced from average annual values which have not been corrected by intercalibration with the two other data series
Man has already modified the carbon cycle by exploiting for agriculture land areas that were previously covered by forests. A net transfer of carbon to the atmosphere has thereby occurred, Extensive agriculture also increases the rate of decomposition of dead organic matter in the soil. Data indicate that of the order of 100 Pg may have been transferred to the atmosphere due to the clearing of forests and the expansion of agriculture. The annual input at present is estimated at between 1 and 5 Pg.
In all, a total of about 140 Pg of fossil carbon has been emitted into the atmosphere during the last 125 years. The annual input has increased at a rate of about 4% per year since the last world war. Observations of the C02 concentration in the atmosphere show an annual increase during these latter years of about 2.2 Pg y-1, i.e~ about half of the output due to fossil fuel combustion. We arrive at the conclusion that the airborne fraction may have been anywhere between 30 and 50% during the last 20 years, the most likely value being 40 - 45%. On the basis of these figures we estimate the concentration of C02 in .the atmosphere before 1800 to have been between 265 and 290 ppm.

- 31 -
The unal emissions to the atmosphere due to man thus seem to have been between 180 and 240 Pg, while the increase in the atmosphere has been between 75 and 130 Pg. A net transfer to the oceans has undoubtedly occurred. The surface layers of the ocean exchange quite slowly with the deep sea. It is not likely that an appreciable amount has been transferred to the deep sea.
Plants assimilate more effectively if the partial pressure of the C02 in the air increases and if there are no other limiting factors for growth. Greenhouse experiments show this effect clearly. It is difficult to assess what these measurements imply for the biosphere as a whole because of the varying environmental conditions that prevail for different biomes. It is likely, however, that some increased assimilation and accumulation have taken place in the biota untouched by man.
Figure 6 is an attempt to summarize the main features of the nitrogen cycle. The uptake of nitrogen into the biomass on land and in the sea is the core of the nitroqen cycle. Thes~ two fluxes are of about the same magnitude, 2 000 · 1012 g y-1 (= Tg y-1 =M tonne y-1). In comparison the pools of fixed nitrogen from which these
fluxes take place are large. In the soil organic matter contains an estimated amount of 300 000 Tg, which yields a mean transit time for nitrogen through this major reservoir of about 100 years. Tropical soils contain comparatively little organic matter and the transit time there is considerably less. The opposite is true for the transit time through soil organic matter in temperate and polar climates. In the oceans soluble inorganic nitrogen compounds represent a major pool, which is probably larger than that of dissolved (dead) organic matter. The mean transit time between these two pools on the one hand and the biomass on the other is of the order of 500 years.
The magnitudes of reservoirs and of fluxes in the atmosphere are generally much smaller and the same is true for the mean transit times through the atmosphere. The natural emissions to the atmosphere are due to the formation of volatile compounds, namely NH3, NO-N02, N20 (and N2) during the process of bacterial decomposition in the soil. In the atmosphere the former two are incorporated into cloud and rain drops as NH4 and N03 ions and are returned to the soil and the sea by precipitation and particle deposition. N20 on the other hand is not significantly dissolved in this way but instead decomposes into NO in the stratosphere where it plays an important role in the chain of photochemical reactions associated with ozone.
Some of the bacterial decomposition, both in the soil and in the sea water, leads to the formation of N2 , which is a loss of fixed nitrogen. This is compensated for by natural fixation amounting to about 140 Tg y-1 by bacteria and algae in the soil and to about 70 Tg y-1, primarily by blue-green algae, in the sea.

20-170
OCEANS
WET & DRY DEPOSITION
LK>HTNING ?
WET & DRY DEPOSITION 35 (20-50)
- 32 -
, ... . . .
~OCKs· ·. -" .·. ·: · ·. · ·>: :· : .. , OO.OOO.Ooo.oOO ."." -:· : -: .. :·.
PEDOSPHERE
§igure 6- The nitrogen cycle~, 6, z?. The estimates of the inventories are given· in 1012 g = Tg and the fluxes in Tg y-1. In many instances attempts have been made to give the range of uncertainty of the estimates, which is then indicated within parenthesis. Man's modification of the nitrogen cycle has been shown by encircled figures. The nitrogen cycle is characterized by a number of chemical transformations and some indication of this fact is given by shadings of the reservoirs.
Key to shading:
Inorganic nitrogen compounds in oxidized form, except N2o (valence 2 2)
Inorganic nitrogen compounds in reduced form (valence ~ -1)
Nitrogen in living matter
lllt==3ll Nitrogen in dead organic matter

- 33 -
The introduction of monocultures with legumes that can fix N2 through symbiosis with certain bacteria probably implies a net increased fixation. On the other hand modern agriculture has increased the rate of decomposition of organic matter in the soil and thus the return of N2 to the atmosphere. About 40 Tg y-1 fixed nitrogen is produced in the form of fertilizers, and high temperature combustion adds another 20 Tg y-1 to the atmospheric pools. This is about 30% of the natural fixation and the rate is increasing rapidly. However, the amount of nitrogen fixed by man annually is still small compared with the existing pools in the soil and oceans. These pools will therefore be influenced only slowly.
The main features of the global sulphur cycle are shown in Figure 7, where the light numbers show the fluxes in Tg y-1 before man intervened and the heavy ones are the fluxes caused by man.
SULPHUR C'< c'--'C.
Figure 7-- The sulphur cycle /8/. The fluxes are given in 1012 g y-1 = Tg y-1. The light figures represent conditions before man significantly influenced the sulphur cycle and the heavy figures show the changes in the fluxes due to man
- 34 -
The major processes in maintaining the sulphur cycle are the inclusion of sulphur in living matter, the bacterial decomposition of dead organic matter, whereby volatile sulphur compounds (H2S, dimethylsulphide) are released to the atmosphere, and weathering in trnsoil. In a global context, the anthropogenic emissions of sulphur are at present of about the same size as those due to natural processes but, in industrial regions, anthropogenic emissions may be more than ten times the size of natural ones,
Emissions to the atmosphere due to man are almost entirely as sulphur dioxide, which is largely oxidized to sulphate and appears as an aerosol, The turnover time for sulphate particles is about three days. The formation of sulphate aerosols implies an acidification of the clouds and rain in major industrial areas. The acid which is thereby added to the soil is still rather small in most areas, but the soils least buffered may have been somewhat modified. We note that so far the fossil fuels containing least sulphur have been used preferentially and that, as yet, merely a few percent of the fuel reserves have been exploited. Significant impacts on the biosphere may ultimately occur in regions with the most sensitive soils.
5. Dynamics of ecosystems and climate
The way climate, primarily temperature and precipitation, determines the characteristics of biota and soil was briefly outlined in section 2. The response of an ecosystem to changing environmental conditions requires a more detailed analysis.
(a) In~t~n!a~e£U~ ~C£S~s!e~ ~e~£n~. Most field studies and ecosystem modelling have aimed at the determination of the rate of assimilation and respiration, i.e., net primary production, as functions of the basic characteristics of the biome (leaf area, canopy structure, etcJ and as dependent on environmental parameters (temperature, humidity, soil moisture, solar radiation, nutrient content of the soil, carbon dioxide concentration in the atmosphere). This work yields important information on limiting factors for growth under various circumstances and on the response of the ecosystem to changing environmental conditions. If the water supply is adequate, most biomes develop enough assimilation foliage (leaves, needles, grass, etc.) to permit them to utilize more than 95% of incident radiation. The rate of assimilation is temperature dependent, even though an appreciable reduction only occurs for rather large departures from the optimum temperature, which differs for the various biomes (compare Figure 2). The response of a given biome to varying environmental conditions can only be assessed by means of rather complex model computations. The tools for such computations are, however, available,
(b) In!e~m~dia!e_r~nge_e£o~y~t~m_r~S£O~s~. If abnormal climate prevails for some years or decades, the biome adjusts to the new environmental conditions by developing a modified climax structure.
- 35 -
(c) ~o~g=t~r~ ~C£sys!e~ Ee~£n~. If a marked climatic change takes place and lasts for a long time (a century or more, i.e., considerably longer than the life time of members of individual species in the biome) a succession to another biome may be initiated. This would most likely happen in the vicinity of a transition between two existing biomes.
6. Some problems of major concern
~s~e~s~e~t_of li~ely_f~t~r~ in£r~a~e_of 2t~o~p~eEi£ £aEb£n_dio~i£e_d~ to man's activities ----------The total fossil fuel reserves have been estimated to be at least 5 000 Pg.
This reservoir is considerably greater than that of living and dead organic matter on land. Any projection of possible future increases of the atmospheric C02 concentration will depend greatly on our assumption regarding the partitioning of the excess carbon dioxide between the terrestrial biosphere and the oceans. If we assume that the terrestrial biosphere will not be a significant sink we deduce that 70-80% of the total emissions due to burning of fossil fuels (5 000 Pg) would remain in the atmosphere because of the buffering effect of sea water. The atmospheric concentration would rise to above 2 000 ppm, see Figure 8.
Another extreme projection envisages a very drastic increase in the amount of carbon in the terrestrial biosphere; it suggests that the increase in the atmosphere would only be temporary (i.e., would last a century or somewhat more) with a maximum concentration of merely 700-800 ppm, as indicated in Figure 8. This projection seems, however, quite unlikely. It seems rather more probable that the carbon pool in the terrestrial biosphere may decrease as a result of continued forest exploitation.
It is likely that until the end of this century, or until the first decade of next century, the increase in the atmosphere will continue to be fairly close to 50% of the fossil fuel releases. An atmospheric C02 concentration of about 365 ppm is expected at the turn of the century. Beyond this time any projection becomes considerably more uncertain. The most likely one would be a development somewhat less spectacular than the dashed curve in Figure 8, but above the dash-dotted one.
Because of the much larger yields in agriculture that are obtained through use of fertilizers the present figure of 40 Tg y-1 fixation of nitrogen for these purposes may well increase by a factor of five or ten during the next fifty years, even though a very much more effective utilization of the nitrogen would be most desirable.
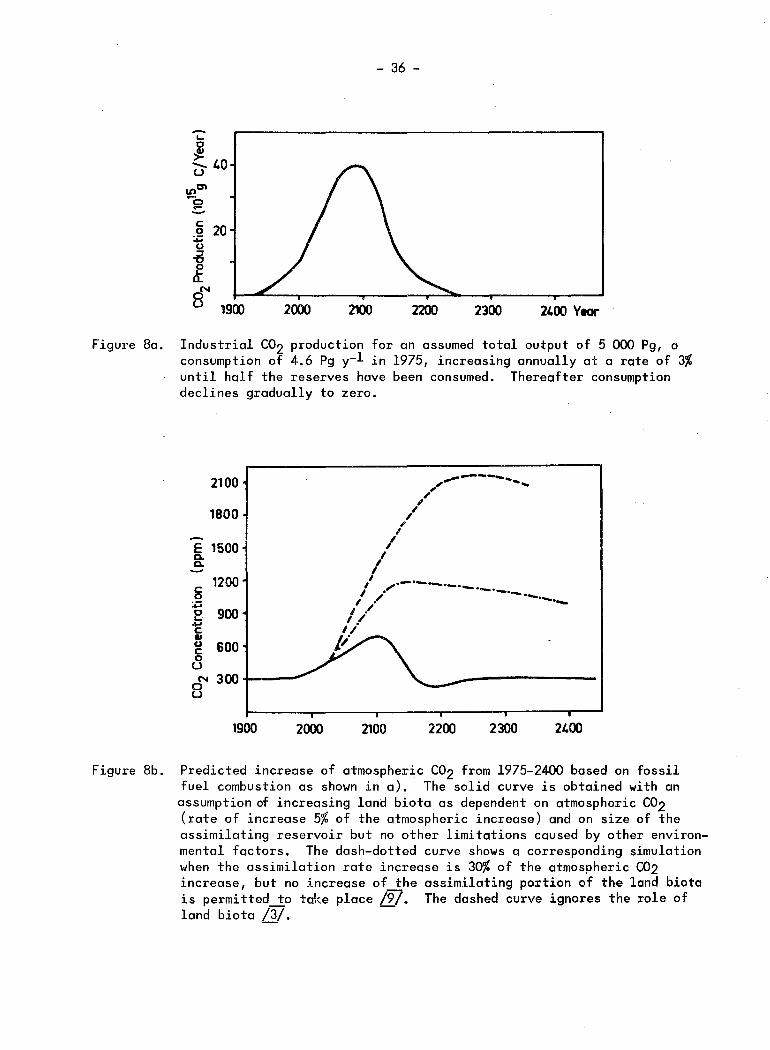
- 36 -
1900 2000 2200 2300 2400 Year
Figure 8a. Industrial C02 production for an assumed total output of 5 000 Pg, a consumption of 4.6 Pg y-1 in 1975, increasing annually at a rate of 3% until half the reserves have been consumed. Thereafter consumption declines gradually to zero.
2100
1800
E 1500 a. a.
c 1200 0
:.J E 900 .. c ., u 600 c 0 u
N 300 0 u
1900 2000
, I , ,
I
I
/~
,--~------ ......... ~,
I • I ,.- .._...._·-·-.. I • ....... .__ . ._ I ./ .............. ....
I / 1/ I/
~~·
2100 2200 2300 21.00
Figure 8b. Predicted increase of atmospheric C02 from 1975-2400 based on fossil fuel combustion as shown in a). The solid curve is obtained with an assumption of increasing land biota as dependent on atmospheric C02 (rate of increase 5% of the atmospheric increase) and on size of the assimilating reservoir but no other limitations caused by other environmental factors. The dash-dotted curve shows a corresponding simulation when the assimilation rate increase is 30% of the atmospheric C02 increase, but no increase of the assimilating portion of the land biota is permitted to take place /97. The dashed curve ignores the role of land biota /3/. --
- 37 -
. Inorganic nitrogen compounds are generally soluble in water, and are fairly qu~ckly transported to lakes and ultimately the sea. To the extent that increased production of organic matter takes place, this transit may be delayed. One can envisage that about one third of the nitrogen applied to the soil is returned to the atmosphere, i.e~ at present 12-15 Tg per year. Maybe about 10% will be in the form of N20. To the extent that such a relatively rapid return of fixed nitrogen to the a~mo~p?ere occurs, the impact on the atmospheric part of the nitrogen cycle may be s~gn~f~cant at the turn of the century, i.e. a few per cent, and may increase further by a factor of five within lOO years.
Experiments with climate models show that the basic characteristics of the general circulation of the atmosphere remain about the same even under different climatic regimes. Features such as the middle latitude westerlies, the polar anticyclone in winter, the subtropical anticyclones or the intertropical convergence zone, however, change in intensity and position.
It is important to emphasize that the decline and destruction of an ecosystem may be much more rapid than the development towards a climax, which only occurs gradually. It follows that a global climatic change will probably be associated with a decrease of global primary production and, for example, a net return of carbon dioxide to the atmosphere, even though more productive ecosystems may develop in some areas. Most ecosystems are, however, quite resilient. Even if equilibria are not established quickly, a first approximation to the change of the land biota as a result of a climatic change can be obtained with the aid of diagrams like those shown in Figures 2 and 3.
Qo~s_m~n_i~f!u~n£e_t~e_g!o£a! £lim~t~ £y_m£difyi~g_t~e_p!a~t_C£V~r_and soil structure on earth?
Local changes of the plant cover have only local effects on climate. These effects are much reduced by the exchange of air and energy with surrounding regions and last only as long as the modified land use is maintained by man. If man leaves the scene, the former conditions are restored fairly quickly.
The last two centuries have witnessed a very considerable expansion of agricultural land, from about 8 · 1012 m2 to 15 • 1012 m£. This still only means an increase from 5 to 10% of the total land area and an increase from 1.5 to 3% of the surface of the globe. This expansion can hardly have been of much direct global influence on the climate, but possible associated changes of albedo and evapotranspiration may have had some consequences regionally in the northern hemisphere.
Irrigation implies that water is supplied more effectively for crop production. The prevention of surface run-off and the exploitation of groundwater reservoirs result in a reduction of the return flow of water from the continents back to the oceans. In the areas concerned evapotranspiration is enhanced with direct implications for the energy budget. Climate models may be used to assess more quantitatively the possible effects but their magnitudes are probably too small to be firmly established at present.
- 38 -
The most pronounced effects of man's interference with the global ecosystem, however, are probably the indirect ones via the global biogeochemical cycles, which hPve been dealt with previously in this overview.
SELECTED REFERENCES
/I7 WHITTAKER, R.H. (1975). Communities and ecosystems. Macmillan Pub!. Co., New York.
/27 BOLIN, B., DEGENS, E.T., DUVIGNEAUD, P. and KEMPE, S. (1978). The global biogeochemical carbon cycle. In SCOPE Report No. 13, BOLIN, B., DEGENS, E.T., KEMPE, S. and KETNER, P. (Eds.), Wiley, London.
/3/ KEELING, C. D. and BACASTOW, R. B. (1977). Impact of industrial gases on climate. In Energy and climate. Stud. Geophys., Nat. Acad. of Sciences, Washington, D.C., pp. 72-95.
/4/ BISCHOF, W. (1977). Comparability of C02 measurements. Tellus, 27, pp. 435-444.
/5/ SODERLUND, R. and SVENSSON, B. (1976). The global nitrogen cycle. In N, P, S Global cycles, SCOPE Report No. 7. Statens Naturvetenskapliga Forskningsrad, Stockholm, pp. 23-74.
/6/ BOLIN, B. and ARRHENIUS, E. (Eds.) (1977), Nitrogen- an essential life factor and a growing environmental hazard. Report from Nobel Symposium, No. 38. Ambio, 6, pp. 96-105.
/7/ CRUTZEN, P. and EHALT, D. (1977). Effects of nitrogen fertilizers and combustion on the stratospheric ozone layer. Ambio, 6, pp. 112-117.
/8/ GRANAT, L., HALLBERG, R. and RODHE, H. (1976). The global sulphur cycle. In N, P, S Global cycles, SCOPE Report No. 7. Statens Naturvetenskap- · liga Forskningsrad, Stockholm, pp. 89-134.
/97 REVELLE, R. and MUNK, W. (1977). The carbon dioxide cycle and the biosphere. In Energy and Climate, Studies of Geophys. Nat. Acad. of Sciences, Washington, D.C., pp. 140-158.
CLIMATIC VARIATION AND VARIABILITY
Empirical Evidence from Meteorological and Other Sources
F. Kenneth Hare*
1. General Statement of Problem
Since 1972, when there were large anomalies of climate in many parts of the world, international attention has been focussed on climatic variability. Several years of drought, abnormal rainfall and cold growing seasons have occurred since then. Fears have arisen that climate may be changing for the worse, and that the recent impacts on food production and prices may continue.
Climate is, in practical terms, the expectation of weather. Large but short-lived weather changes have little impact either on individual people or on the general economy. More prolonged anomalies are likely to cause widespread distress and disruption: the Sahelian drought reminded the world that this was so. To combat such effects, decision-makers need a more realistic expectation of future weather, which cannot yet be forecast beyond a few days or weeks. Instead, one must rely on the evidence of climatic variability and variation revealed empirically by weather records (which go back a century or more), and before that by various forms of proxy evidence. What has happened in the past may clearly happen again.
2. Character of Climate and Climatic Variation
Climate is technically a generalization of weather over a chosen reference period, typically 30 years (though this is arbitrary). The usual measures of climate include (i) estimates of average values (central tendencies) of the main elements; (ii) estimates of measures of variability about these average values. Variability may be strictly periodic, quasi-periodic or non-periodic in nature.
However long the period of averaging, there is always some differe~e between successive reference periods because of large weather fluctuations. In addition, there may be real shifts of the averages, or changes in variability, between reference periods. Th•se real shifts constitute climatic variation or change (the latter term usually denoting larger, longer-term effects).
Weather and climate are mutually distinct. Whereas climate is a generalization over time, weather is the succession of real states of the atmosphere (which are instantaneous and unique, since events never exactly repeat themselves). Weather changes are caused by moving, unstable disturbances which live only a few days or a few weeks. Calculations show that this instability gives the atmosphere a short memory. In the westerly belt of North America and East Asia, weather charts three to five days apart are essentially independent. In some parts of the hemisphere, this period is longer, of order five to eight days. These data show the effective time scales of the weather.
* Institute for Environmental Studies, University of Toronto, Canada.

- 40 -
On the climatic scale, annual seasonal effects are clearly periodic, and there is also a weak quasi-biennial (2 to 2-1/2 years) cycle in many records. On time-scales beyond three decades, quasi-periodic effects are significant over most time-scales. But non-periodic changes often override these quasi-periodic effects on all time scales so that cycles do not offer an easy way of prediction.
The world is at present comparatively warm, and has been so for 10 000 years. To answer questions about true climatic change (such as the risk of a new Ice Age) one must therefore study the remote past, which has relevance to the immediate future.
3. The Climatic System
Climate actually extends into soil, biota, oceans, glaciers, and freshwater systems. The climatic system is the collection of these sub-systems combined with the interactions which link them together. All of them are less variable in behaviour than the atmosphere, and hence retard the latter's variability. Proxy evidence of past climates is derived from materials preserved in these sub-systems. One observes traces of their past interactions with the atmosphere, and interprets them to yield climatic inferences.
4. F6rmer Climates
Ancient climates (before 2 000 000 years ago) are believed to have been generally warmer (by 5-10 degrees) than those of today, though surface temperatures have not changed greatly for 2 thousand million (2 x 10⁹) years. There were at least three ice ages, the oldest proven case being 650 million years ago. The final ice age is still in progress, after a cooling that began 50 million years ago. Human evolution took place entirely within this phase of cooling, and the rise of civilization has been confined to the past 10 000 years, which have been relatively mild.
The past 2 million years (the Quaternary Period) have seen a sequence of glacial epochs (with extensive ice sheets covering much of North America and Eurasia) at about lOO 000 year intervals, with relatively short interg,lacial epochs separating them. We rely mainly on evidence from deep ocean cores for these statements. Antarctica has been beneath an ice sheet for 11 to 14 million years, and the pack-ice covering the Arctic Ocean has probably not melted for most of the past million years. The interglacial climates (including our own) were hence not as warm as the normal geological climate.
Evidence is accumulating that this sequence of glacial-interglacial climates is related to the variability of the earth's orbit around the sun. The glacial epochs have coincided with periods of low eccentricity of the orbit, with a period of near lOO 000 years. Variations in obliquity of the polar axis (period 41 000 years) influence the melting and accumulation of ice, and the precession of the equinoxes (periods 19 000 and 23 000 years) also affects the climate. This evidence is not, however, precise enough to yield a useful forecast for the next few centuries.

- 41 -
The past 10 000 years (the Holocene epoch), the period of man's major expansion and cultural development, began with an abrupt end of the last glacial epoch, and a rapid warming of climate. By 7 000 years ago, temperatures were a little higher than today (a conclusion based largely on the analysis of pollen deposits in bogs or lake sediments). Moreover, the sub-tropical and warm temperate belts of the northern hemisphere, which had seen extensive deserts during the glacial epoch, became generally moister. The rise of North African, Middle Eastern and Indus Valley cultures was encouraged. Agriculture was born, and pastoralists and hunters roamed across what had once been deserts.
About 4 000 years ago (earlier in some areas) a cooling began in many places, at least in the northern hemisphere. High northern latitude climates became harsher. Desiccation occurred over many sub-tropical areas, and the great deserts began to assume their modern aridity. In the Sahara, Arabia and Rajasthan, in particular, many cultures were eclipsed. Neolithic hunters were driven from the Sahara as the savannas turned to desert. The civilization of the Indus Valley was destroyed. This process was in practice not continuous and was complex in pattern. But it was effective in driving the sub-tropical civilizations inwards upon the moister hills and the great river valleys (where irrigation could be practised). It is possible that this desiccation was in part man-induced.
In the past 1 000 years the climate has been fairly stable. There was a warm early mediaeval episode (800 -.1200 A.D.) that encouraged Norse expansion, and a Little Ice Age between 1500 and 1850 A.D. that curbed that expansion, and injured European economies. There were fluctuations of perhaps ± 1.5 deg C from the postglacial norm, chiefly in high latitudes. The southern hemisphere may not have experienced either fluctuation, though comparable changes have been described over some land areas.
5. Recent Climatic Variability and Variation
The age of modern observation is roughly the past century. Observations above ground-level became numerous only after about 1955, extending to 30 km above ground or more. Satellites are now making genuinely world-wide monitoring of the atmosphere possible, but their data are not yet stored and processed fully enough to yield the best climatic information.
Mean surface air temperatures rose from 1880 until about 1938 in the northern hemisphere, the average increase being 0.6 deg C, with largest values in high latitudes. They then fell by about 0.4 deg C into the middle sixties, when the fall appeared to reverse briefly. Very recent analyses show that the fall has actually continued, with 1976 being exceptionally cold. The recent cooling has affected tre whole lower atmosphere and sea-surface temperature, as well as surface air temperature, but appears to have halted in intertropical latitudes where conditions since 1963 have been very variable.
These trends are largely obscured by very striking changes from year to year. Average northern hemisphere temperature in successive years may differ by± 0.4 deg C or more - as much as was achieved by the long-term downward trend between 1938 and 1975.

- 42 -
The southern hemisphere may have behaved differently, though the paucity of observations makes comparison difficult. There is a suggestion of a continued rise of temperature from 1943, at least in middle and high latitudes. Since 1960-64, this rise has been strong, especially in the Australasian sector but not over the hemisphere as a whole.
The slow trends of hemispheric temperature are also small by comparison with strong, persistent spatial anomalies. Mean charts of temperature and pressure over 15-year periods show very large areas of positive or negative anomalies, which tend to be quite different in successive periods. The temperature anomalies are closely related to persistent anomalies of prevailing wind, and are clearly caused by disturbances of the general circulation of the atmosphere and oceans.
These two forms of variability- the large interannual variations, and the extensive and persistent spatial anomalies - are of greater short-term economic importance than the trends referred to above.
Variability of temperature has been thought to be increasing. Several authorities suggest that it usually does so in periods of general cooling, Evidence on these points is conflicting. One major world-wide analysis has established that the place-to-place variation of temperature has been increasing in the past 15 yeais, not only at the surface but in the troposphere above. Another study, for the extratropical parts of the northern hemisphere, finds no evidence for an increase in the time-variations of temperature at fixed points. It has also been shown that over North America and Europe, there is no obvious relationship between mean temperature and variability. Nevertheless, the past decade has seen many extremes of temperature, especially in winter, and there is some evidence that such cold extremes have become more frequent during the post-1938 northern hemisphere cooling.
Accurate and representative precipitation measurement is very difficult, and is almost impossible at sea. Available long-term rainfall and snowfall records show no consistent trend over the past two centuries, though individual stations frequently show both apparent shifts of average and prolonged periods of drought. No clear statement can be made as to world trends of either the amount of precipitation or its variability.
Drought is nevertheless the best-known and most-feared climatic anomaly. Droughts in both food-exporting and food-deficit countries have drastic effects. In the past, they have badly affected such countries as India and China. Severe drought in central North America in the 1930s did immense damage to soils in areas that are now highly productive of wheat. Drought in the 1970s has affected the Soviet Union, north-west Europe, Australia and many other areas - but has fortunately been infrequent in India. There is no clear evidence that these recent droughts have been worse than those further back in history; but they have hit key areas, and have affected larger populations. Such drought is recurrent, especially in the normally dry parts of the world, but it is mainly non-periodic, and hence hard to predict.
The worst recent drought was Ln Sahelian and East Africa, many areas with a slow desiccation in the early 1960s,· the drought 1968-73, with some recurrence in West Africa in 1977. The drought
Beginning in culminated in resembled others

- 43 -
that have affected Africa, but had a bigger economic impact, Higher populations, bigger flocks and herds, and wider cultivation of dry soils, led to widespread desertification, a phenomenon noticeable around many other deserts. In particular, there has been heavy damage to perennial and woody plants, and firewood is now hard to obtain in the affected areas.
It has been speculated that such degradation of the soil and natural vegetation under land-use pressure might increase the surface reflectivity (albedo), and that this in turn might increase atmospheric sinking motion, and hence decrease precipitation still further - a positive feedback loop. Mathematical modelling has confirmed that the effect may be real. Hence land-use control may be necessary in order to prevent further worsening of climate.
Drought, like anomalies of temperature, is a widespread phenomenon caused by abnormal wind patterns and storm development. Much can be done locally to guard against its effects, but it is at root caused by very large-scale atmospheric processes that are unlikely to be controlled. It can be expected to continue to plague mankind.
Most of the foregoing effects seem to be due to internally-generated changes within the climatic system itself. Other variations can be traced, however, to external forcing. Thus the climate of cities has been substantially altered by man's handiwork, chiefly the release of large quantities of heat, which have tended to raise temperatures in the built-up areas. Precipitation over and downwind from cities may also have been affected by the extra particles released.
Volcanic eruptions, like those of Krakatoa in 1883, and of Mt. Agung (Bali, Indonesia) in 1963, also produce measurable effects on atmospheric temperatures, especially in the stratosphere. A sudden increase in the scale of world volcanic activity would very probably produce a marked cooling.
Efforts to show that climate responds to changes or abnormal events on the sun give inconclusive results. The 11-year and longer sunspot cycles have often been correlated with atmospheric responses, but the correlations usually break down with time, and may be illusory. In any case, their effects are small. It has been suggested recently that the passage of the earth through sectors of reversing magnetic sign around the sun has an impact on the circulation of the atmosphere in certain regions. However, no adequate mechanism for such an effect has been demonstrated.
Teleconnexions are provable links over great distances between the behaviour of a climatic element at one spot and its behaviour at another spot - or that of another element at that spot. Sometimes a time-log is involved, implying a possible aid to prediction. Numerical general circulation models suggest that such teleconnexions should exist, These have been known empirically for many years.
Among well-known examples are a negative correlation of temperature and pressure between the Greenland and the Norwegian sectors of the northern hemisphere; a time-lagged correlation between sea-surface temperatures in the Gulf of Guinea (the
- 44 -
equatorial Atlantic) and rainfall in dry north-east Brazil; and many links between the tropical Atlantic and tropical Pacific. The most remarkable case is the Southern Oscillation, a three to seven-year quasi-periodic exchange of air between eastern and western equatorial Pacific areas, coupled with variations in the strength of the trade winds, and with significant rainfall variations in Australasia, Southern Asia and the dry ocean areas west of South America.
This Oscillation is involved, too, in the quasi-periodic variation of seatemperatures off the tropical South American coast, known as El Nino. This is an invasion of normally cold areas by warm equatorial water, with drastic disturbance of marine life, and hence of the vitally important fisheries, especially for anchovies (which go largely into fishmeal). The 1972 El Nino, in particular, largely destroyed the important Peruvian anchovy catch,
6. Conclusion
No simple conclusion emerges from this review of climatic variability and variation over the ages - not even from the most recent epochs, when abundant information is available. Climate is a topic that lends itself to facile generalization, and to warnings of impending disaster. It has a habit of making liars out of those who take such liberties.
A first impression that one gains is of underlying stability. Though the endless variability of climate on all time-scales has been well proven, so also has the atmosphere's ability to return to a state not very different from its longterm condition. This stability rests on a wide range of mechanisms, most of which are negative feedback loops. Thus the present build-up of carbon dioxide in the atmosphere offers an opportunity to the biota to increase its productivity- and hence ultimately to increase the store of carbon in organic materials, at the expense of the atmosphere. And there is much evidence that the source of .nearly all climatic energy, the sun, is quite conservative in behaviour.
But the fact of endless variability about this stable condition remains, mainly reflecting the internal instabilities of the system. This variability would be even greater if the non-atmospheric parts of the climatic system did not exist. In general they act to stabilize the atmosphere. Nevertheless the latter retains much freedom to vary. And there have been external forcing mechanisms at work to add to the variability. Such huge processes as the drift of continents, still in progress, and the raising of mountains by orogenies, have clearly acted in this fashion. So has modern man, who is changing the composition of the atmosphere at a remarkable rate.
This Conference is concerned with the impact of climate on human affairs. Obviously the main impacts have been due to internal climatic variability rather than to profound long-term climatic change. During the past 1 000 years mean annual surface temperatures over the earth have probably varied by less than 1.5 deg C. This is enough to have had some impact, especially on mid-latitude farming. And in high latitudes, where such variations are usually larger, the impacts have been severe. Overwhelmingly, however, the main economic stress of the past decade has
- 45 -
been due to short-term climatic anomalies of precipitation - drought in Africa, Eurasia and Australia; floods in Bangladesh, Pakistan and the United States. The economic apparatus constructed by modern man seems still vulnerable to such variability.
Much might be done to protect the economies of all nations against such anomalies. The first step required is that decision-makers should develop a better and longer memory for climatic stress, and be prepared to deal with it. A year or two after drought has ended, or floods have subsided, many countries lose interest in measures to prepare for the next extreme - which will certainly come. The second step is that atmospheric scientists should make sure that they, too, are fully aware of climatic variability in all its guises, and be prepared to fight hard for its recognition by decision-makers. A third step, hardest of all, is to understand the causes of variability, and from that understanding to extract the great prize of successful prediction. And a fourth - still elusive and perhaps hardly attainable -will be the deliberate attempt to prevent undesirable anomalies by means of climatic control.
these: The main aspects of climatic variability that need to be so recognized are
(a) the direct impact of climate on human affairs arises from its variability, on short-term scales for the most part, but also on long-term variation;
(b) the high variability of temperature and precipitation during the 1970s may not, in fact, have been abnormal; but the major anomalies have hit key areas, such as cereal growing regions, or major pastoral belts. It is reasonable to expect that such harmful anomalies will continue. Since the main effects are non-periodic, exposure of a region to stress does not confer immunity against a renewal, even in the shortest term. Thus severe drought returned to the Sahel after only two or three years of good rains;
(c) the recent trend of atmospheric and sea-surface temperatures has been downward, at a rate of 0.1 to 0.2 deg C per decade, at least in the northern hemisphere. It is not clear whether this will continue. It may be offset by heating due to atmospheric contaminants such as added carbon dioxide, or chemical synthetics (discussed by other overview authors). The general trend of planetary temperature has been downward for 50 million years. The present decline, however, is probably part of a shorter-term fluctuation typical of records of the more recent past;
(d) variability of surface temperatures is highest in middle and high latitudes. Northern countries will be more affected than those of tropical, subtropical and warm temperature zones. Production of spring wheat, hay and dairy produce may be vulnerable to temperature variability. So also may be power demands;

- 46 -
(e) variability of precipitation is widespread, and affects all countries. But its worst effects lie in sub-humid or semi-arid areas, such as the former grassland areas of temperate zones, and the margins of the sub-tropical or warm temperate deserts. Regions dependent on a single rainfall source, such as monsoonal currents, are especially vulnerable. The absence of prolonged droughts from monsoon Asia in recent decades may not continue. There is no sign that the high frequency and great extent of recent African droughts are about to endi
(f) the best defences against climatic anomalies are in all cases to adopt economic practices that take account of their probable return. An enemy of world food production has been our short memory for climatic extremes. In time we may learn to predict or conceivably control some of these anomalies. It is vital that we try to do so, with more resources than in the past. Meanwhile, only cautious farming methods, a further search for tolerant crop varieties, control of dry-land pastoralism, better design of water supply and power systems and similar measures can be advocated.
But theie technical devices need to be coupled with the realization outside the scientific world that climatic variability is one of the key influences o~ human economic performance. That is the lesson that the events of the past few · years should convey. It is one of the messages that should emerge from this Conference.
SELECTED REFERENCES
ANGELL, J.K. and KORSHOVER, J. (1978). Global temperature variation surface to 100mb -an update into 1977. Monthly Weather Review, 106, pp. 755-770.
BUDYKO, M.I. Climatic Changes. Russian edition, Gidrometeoizdat, Leningrad, (1974, not examined). English translation, American Geophysical Union, Washington, 1977, 261 pp.
CLIMAP PROJECT MEMBERS (1976). The surface of the Ice-Age earth. Science, 191, pp. 1131-1137.
FLOHN, H. (1977). Climatic fluctuation in the arid belt of the "Old World" since 10 000 B.P.; possible causes and future implications. MS, paper delivered to Conference on Meteorology of Semi-Arid Zones, Israel and American Meteorological Societies, Tel Aviv. To be published.
GARP (Global Atmospheric Research Programme). (1975). The Physical Basis of Climate and Climate Modelling. GARP Publication Series No. 16, ICSU-WMO, Geneva, 265 pp.
- 47 -
GATES, W.L. (1976). Modelling the Ice-Age climate. Science, 191, pp. 1138-1144.
HARE, F.K. (1977). Climate and desertification. In Desertification: Its Causes and Consequences (U.N. Desertification Conference Secretariat), Pergamon, London, pp. 63-120.
HAYS, J.D., IMBRIE, J. and SHACKLETON, N.J. (1976). Variations in the earth's orbit; pacemaker of the Ice Ages. Science, 194, pp. 1121-1132.
IMBRIE, J., BROECKER, W.S., MITCHELL, J.M.,Jr., KUTZBACK, J.E. and others. (1975). Survey of past climates. Appendix A. In Understanding Climatic Change, U.S. National Academy of Sciences, Washington, pp. 127-195.
KUKLA, G.J., ANGELL, J.K., KORSHOVER, J., DRONIA, H., HOSHIAI, M., NAMIAS, J., RODEWALD, M., YAMAMOTO, R., and IWASHIMA, T. (1977). New data on climatic trends. Nature, 270, pp. 573-580.
LAMB, H.H. (1977). and the Future.
Climate: Present, Past and Future, Vol. 2, Climatic History Methuen, London, 835 pp.
MITCHELL, J.M. Jr. (1976). An overview of climatic variability and its causal mechanisms. Quaternary Research, 6, pp. 481-493.
RATCLIFFE, R.A.S., WELLER, J. and COLLISON, P. (1978). Variability in the frequency of unusual weather over approximately the last century. Quarterly Journal of the Royal Meteorological Society, 104, pp. 243-255,
ROGNON, P. (1976). Essai d'interpretation des variations climatiques ou Sahara depuis 40 000 ans. Revue de Geographie Physique et de la Geologie Dynamique, 18, pp. 251-282.
VAN LOON, H. and WILLIAMS, J, (1976-7). The connection between trends of mean temperature and circulation at the surface. In four parts: I, winter. Monthly Weather Review, 104, pp. 365-380. II, summer. loc. cit., 104, pp. 1003-1011. III (WILLIAMS and VAN LOON), spring and autumn. loc. cit., 104, pp. 1591-1596. IV, comparison of the surface changes in the Northern Hemisphere with the upper air and with the Antarctic in winter. Monthly Weather Review, 105, pp. 636-647.
WHITE, O.R., ed. (1977). The Solar Output at its Variation. Colorado Associated University Press, Boulder, Colorado, U.S.A., 526 pp.
WYRTKI, K., STROUP, E., PATZERT, W., WILLIAMS, R., and QUINN, W. (1976). Predicting and observing El Nino. Science, 191, pp. 343-346.
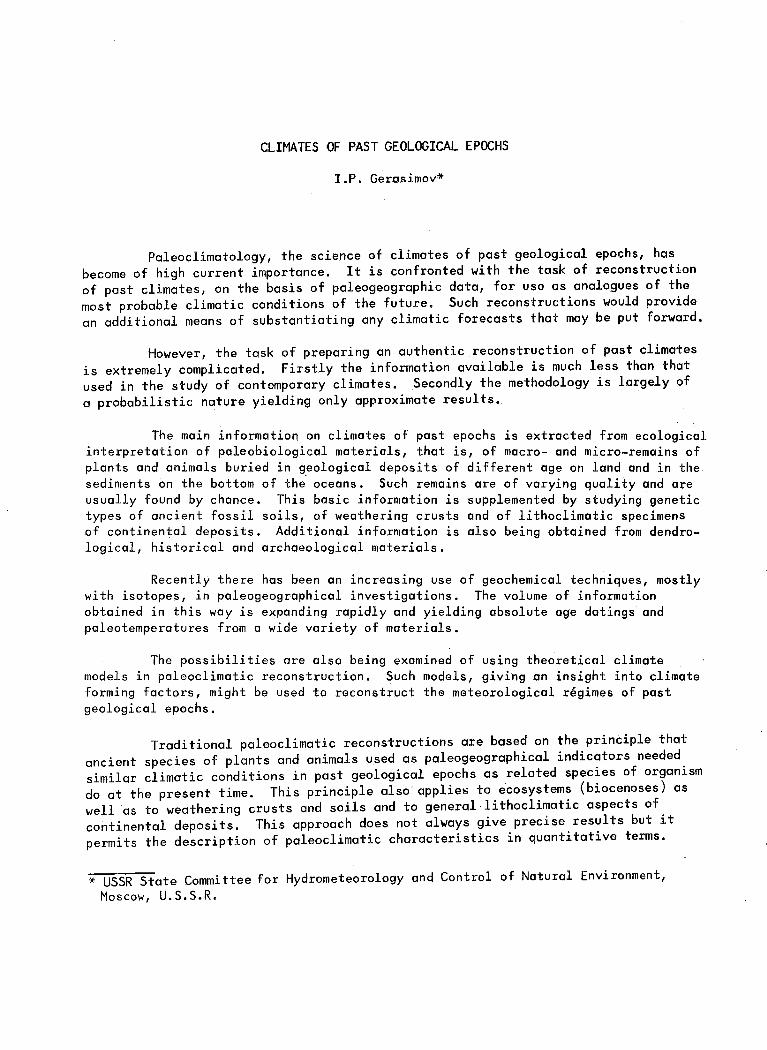
CLIMATES OF PAST GEOLOGICAL EPOCHS
I.P. Gerasimov*
Paleoclimatology, the science of climates of past geological epochs, has become of high current importance. It is confronted with the task of reconstruction of past climates, on the basis of paleogeographic data, for use as analogues of the most probable climatic conditions of the future. Such reconstructions would provide an additional means of substantiating any climatic forecasts that may be put forward.
However, the task of preparing an authentic reconstruction of past climates is extremely complicated. Firstly the information available is much less than that used in the study of contemporary climates. Secondly the methodology is largely of a probabilistic nature yielding only approximate results.
The main information on climates of past epochs is extracted from ecological interpretation of paleobiological materials, that is, of macro- and micro-remains of plants and animals buried in g_eological deposits of different age on land and in the sediments on the bottom of the oceans. Such remains are of varying quality and are usually found by chance. This basic information is supplemented by studying genetic types of ancient fossil soils, of weathering crusts and of lithoclimatic specimens of continental deposits. Additional information is also being obtained from dendrological, historical and archaeological materials.
Recently there has been an increasing use of geochemical techniques, mostly with isotopes, in paleogeographical investigations. The volume of information obtained in this way is expanding rapidly and yielding absolute age datings and paleotemperatures from a wide variety of materials.
The possibilities are also being examined of using theoretical climate models in paleoclimatic reconstruction. Such models, giving an insight into climate forming factors, might be used to reconstruct the meteorological regimes of past geological epochs.
Traditional paleoclimatic reconstructions are based on the principle that ancient species of plants and animals used as paleogeographical indicators needed similar climatic conditions in past geological epochs as related species of organism do at the present time. This principle also applies to ecosystems (biocenoses) as well as to weathering crusts and soils and to general lithoclimatic aspects of continental deposits. This approach does not always give precise results but it permits the description of paleoclimatic characteristics in quantitative terms.
* USSR State Committee for Hydrometeorology and Control of Natural Environment, Moscow, U.S.S.R.
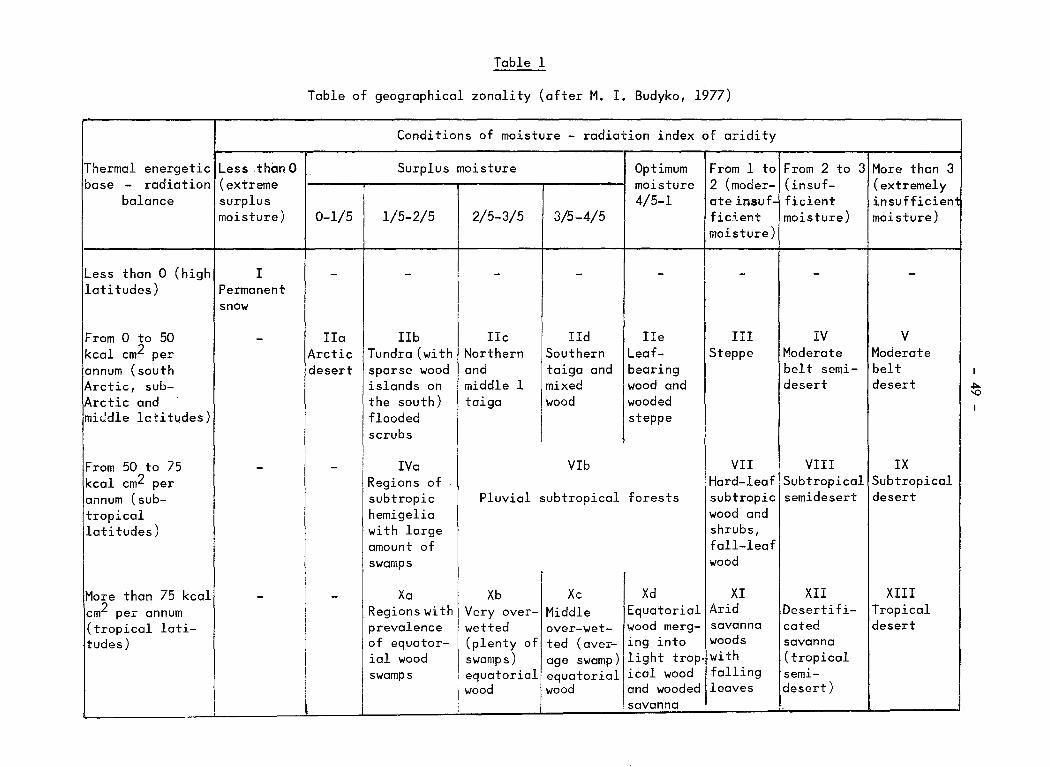
Table 1
Table of geographical zonality (after M. I. Budyko, 1977)
Conditions of moisture - radiation index of aridity
Thermal energetic Less ,thanO Surplus moisture Optimum From 1 to From 2 to 3 More than 3 base - radiation (extreme moisture 2 (moder- (insuf- (extremely
balance surplus 4/5-1 ate insuf- ficient insufficient moisture) 0-1/5 1/5-2/5 2/5-3/5 3/5-4/5 ficient moisture) moisture)
moisture)
Less than 0 (high I - - - - - - - -I
latitudes) Permanent snow
i
From 0 to 50 - IIa IIb IIc IId IIe III IV V
I kcal cm2 per Arctic Tundra (with Northern Southern Leaf- Steppe Moderate Moderate annum (south desert sparse wood and taiga and bearing belt semi- belt Arctic, sub- islands on middle 1 mixed wood and desert desert Arctic and the south) taiga wood wooded
~
miJdle lctitudes) flooded steppe scrubs
From 50 to 75 - - IV a VIb VII VIII IX kcal cm2 per Regions of Hard-leaf Subtropical Subtropical annum (sub- subtropic Pluvial subtropical forests subtropic semidesert desert tropical hemigelia wood and latitudes) with large shrubs,
amount of fall-leaf swamps wood
More than 75 kcal - - X a Xb Xc Xd XI XII XIII cm2 per annum Regions with Very over- Middle Equatorial Arid Desertifi- Tropical (tropical lati- prevalence wetted over-wet- wood merg- savanna cated desert tudes) of equator- (plenty of ted (aver- ing into woods savanna
I ial wood swamps) age swamp) light trop- with (tropical I swamps equatorial equatorial ical wood falling sem~-
! wood wood and wooded leaves desert)
\ l savanna
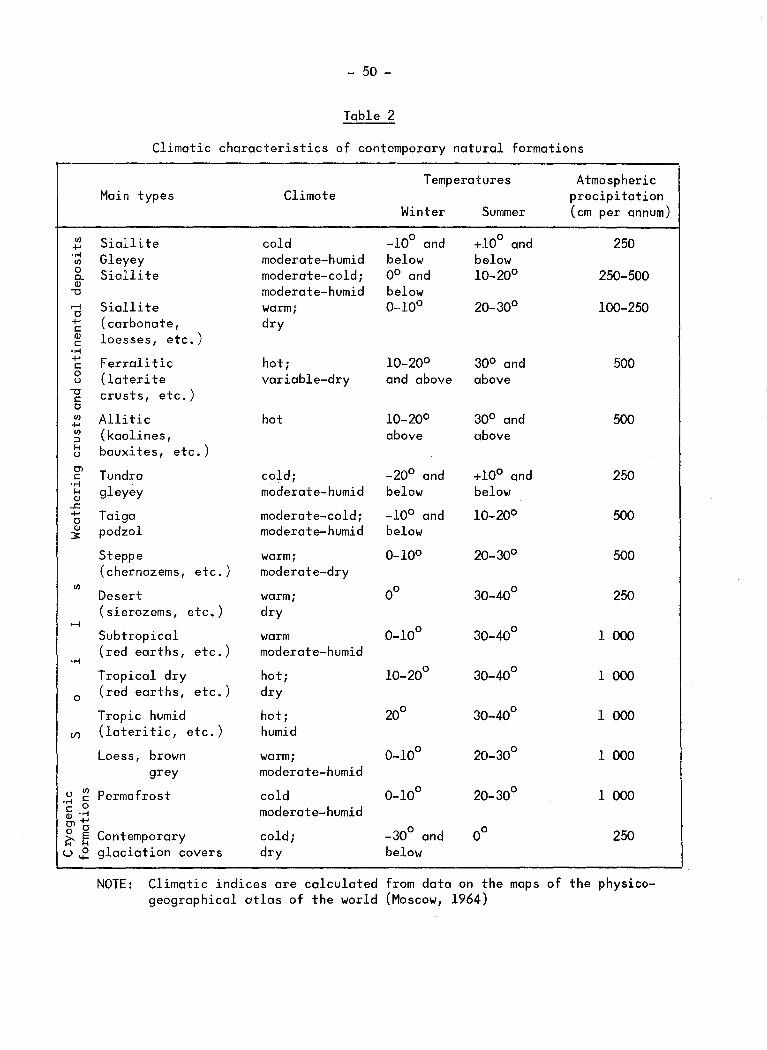
- 50 -
Table 2
Climatic characteristics of contemporary natural formations
Temperatures Atmospheric Main types Climate precipitation
Winter Summer (cm per annum)
1/) Sialli te cold -10° and +10° and 250 ...... •.-l Gleyey moderate-humid below below 1/)
0 Siallite moderate-cold; 0° and 10-20° 250-500 c.. Q)
moderate-humid below "'0
.--! Sialli te warm; 0-10° 20-30° 100-250 0 ...... (carbonate, dry !: <11 loesses, etc.) !:
•.-l ...... Ferrali tic hot; 10-20° 30° and 500 !: 0 (laterite variable-dry and above above u "'0 crusts, etc.) !: 0 1/) Alli tic hot 10-20° 30° and 500 ...... 1/) (kaolines, above above :J 1-< bauxites, etc.) u
O'l Tundra cold; -20° and +10° and 250 !: ·.-l
gleyey moderate-humid below below 1-< <11
..c: ...... Taiga moderate-cold; -10° and 10-20° 500 0 Q) podzol moderate-humid below 3:
Steppe warm; 0-10° 20-30° 500 ( chernozems, etc.) moderate-dry
1/) 00 30-40° Desert warm; 250 (sierozems, etc.) dry
.--!
0-10° 30-40° Subtropical warm 1 000 (red earths, etc.) moderate-humid
·.-l
Tropical dry hot; 10--20° 30-40° 1 000
0 (red earths, etc.) dry
Tropic humid hot; 20° 30-40° 1 000 (/') (lateritic, etc.) humid
Loess, brown warm; 0-10° 20-30° 1 000 grey moderate-humid
u 1/) Permafrost cold 0-10° 20-30° 1 000 •.-l !: !: 0 moderate-humid <11 •.-l O'l ...... 0 0 Contemporary cold; -30° and 00 250 ~~ u 0 glaciation covers dry below ......
NOTE: Climatic indices are calculated from data .on the maps of the physico-geographical atlas of the world (Moscow, 1964)

- 51 -
For example, as illustrated in Table 1, geographical zonality is related to temperature and humidity indices for all major contemporary macro-types of natural ecosystems. Using these relations it is possible to assess values of radiation and of aridity on the basis of geographical zones in the past. With sufficient accuracy
for paleoclimatic reconstructions, use may be made of the main characteristics of the climatesprevailing at the formation of present-time weathering crusts and soils and of general lithogenetic features of continental deposits (Table 2). Using climatic indices relating to the optimum conditions for the existence of individual species of plants and animals, it has been possible to determine the temperature conditions for the existence of contemporary plankton complexes of the world ocean.
All these approaches create a wide base for paleoclimatic reconstructions although caution has to be excercised in the case of certain factors, notably paleobiological indices since a number of present day plants and animals are of fairly recent geological age. Nevertheless, inferences may be drawn by comparing the morphological peculiarities of organisms which have disappeared with the features of appropriate species that exist today.
Modern geochemical techniques provide paleoclimatic data in reliable quantitative form provided that the basic assumptions are valid. For example, data on paleotemperatures derived from the correlation between the amounts of isotopes of oxygen 016 and 018 depend on the assumption that the chemical composition of the oceans does not differ from that of the present time.
As experience is gained in paleogeographical reconstructions there is an increase in precision and the results obtained are similar to those derived from other independent procedures, namely, paleolithological, paleopedological, paleobiological methods, supplemented with geochemical (isotope determination) and geophysical (physical modelling of climate) techniques. It should be emphasized, however, that the detail of paleoclimatic reconstruction and the degree of scientific confirmation decrease as one goes further back into geological time. The reasons for this are the relatively sparse information for the more ancient geological epochs, limitations in the application of the principle referred to in the preceding paragraph and difficulties in the application of theoretical climate models.
Paleogeographic investigations carried out by means of various methods have led to a number of important paleoclimatic generalizations. A major example, concerned with the older geological epochs, is provided by the Mesozoic era and the larger portion of the Cenozoic era (before the Pleistocene) which lasted approximately from 235million to one million years before the present time.
Peculiarities of climate during the Meso~oic period were dependent on two main factors:
(a) a radiation balance which differed from that of the present time by a stronger greenhouse effect, evidently caused by increased carbon dioxide content (Figure 1);
(b) a different location and configuration of continents and oceans as compared with the present day.
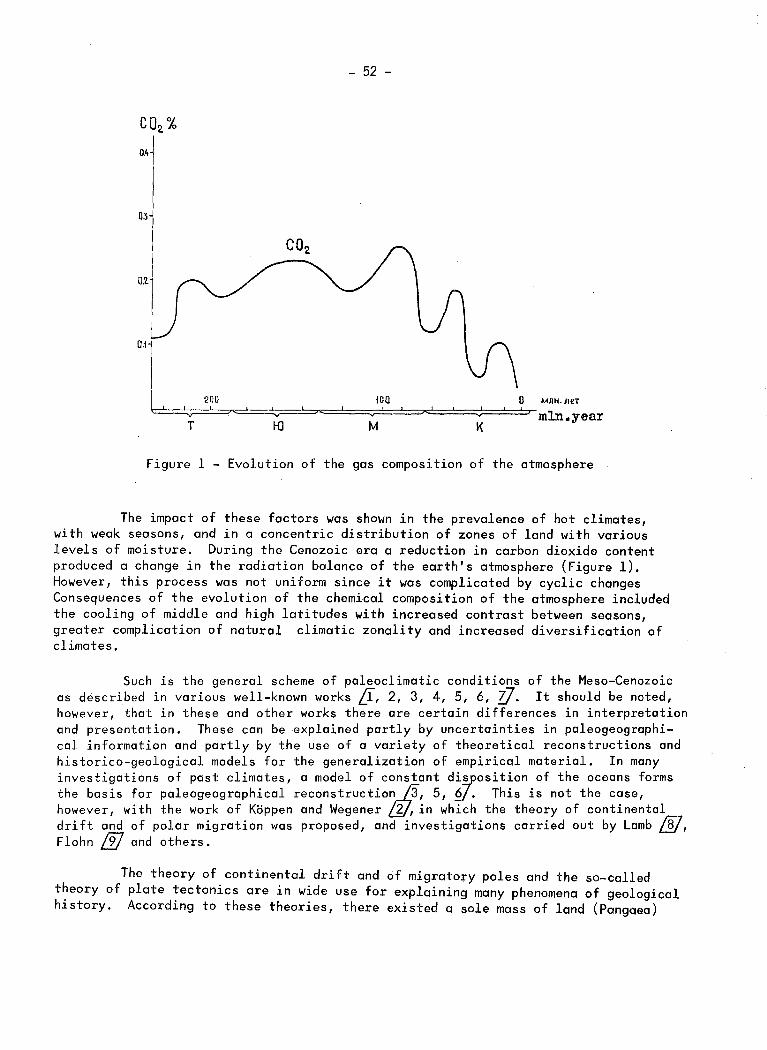
- 52 -
'l iOO 1 200
~~==~·====~~==~~==~·~====~==~~~~'====~~~==~'~, mln.year T ~ M ~
Figure 1 - Evolution of the gas composition of the atmosphere
The impact of these factors was shown in the prevalence of hot climates, with weak seasons, and in a concentric distribution of zones of land with various levels of moisture. During the Cenozoic era a reduction in carbon dioxide content produced a change in the radiation balance of the earth's atmosphere (Figure 1). However, this process was not uniform since it was complicated by cyclic changes Consequences of the evolution of the chemical composition of the atmosphere included the cooling of middle and high latitudes with increased contrast between seasons, greater complication of natural climatic zonality and increased diversification of climates.
Such is the general scheme of paleoclimatic conditions of the Meso-Cenozoic as described in various well-known works Lf, 2, 3, 4, 5, 6, zl. It should be noted, however, that in these. and other works there are certain differences in interpretation and presentation. These can be explained partly by uncertainties in paleogeographical information and partly by the use of a variety of theoretical reconstructions and historico-geological models for the generalization of empirical material. In many investigations of past climates, a model of constant di~osition of the oceans forms the basis for paleogeographical reconstruction_L3, 5, £1. This is not the case, however, with the work of Koppen and Wegener ~in which the theory of continental drift and of polar migration was proposed, and investigations carried out by Lamb~' Flohn L2J and others.
The theory of continental drift and of migrato~y poles and the so-called theory of plate tectonics are in wide use for explaining many phenomena of geological history. According to these theories, there existed a sole mass of land (Pangaea)
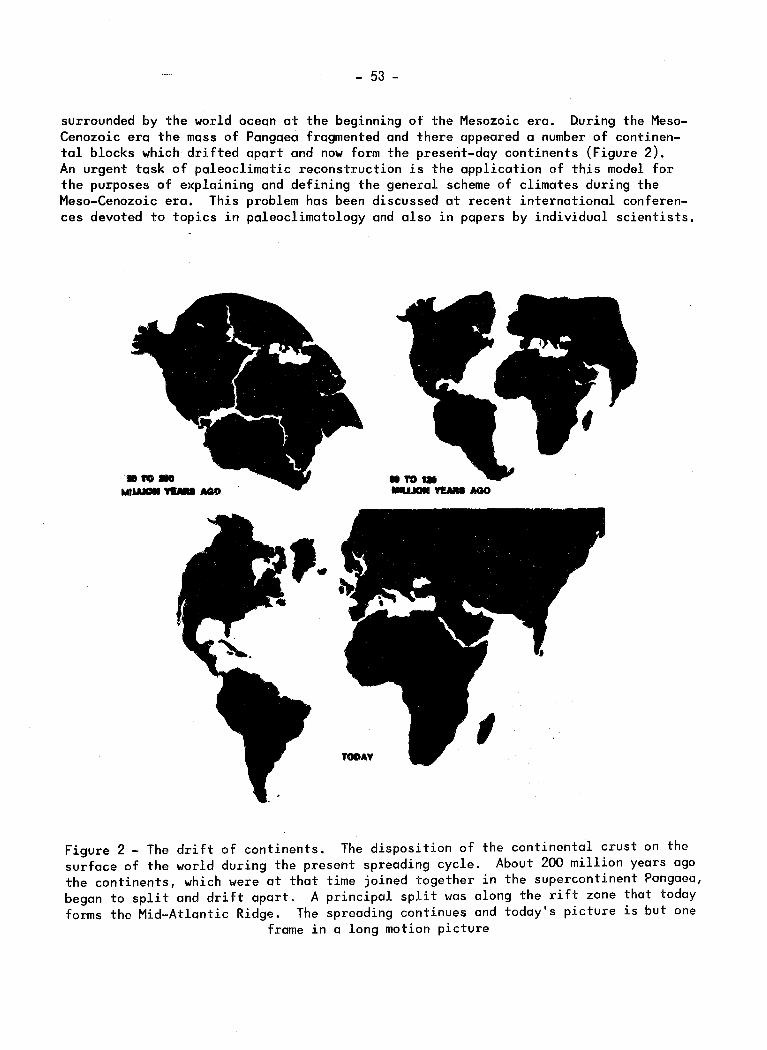
- 53 -
surrounded by the world ocean at the beginning ot the Mesozoic era. During the MesoCenozoic era the mass of Pangaea fragmented and there appeared a number of continental blocks which drifted apart and now form the present-day continents (Figure 2). An urgent task of paleoclimatic reconstruction is the application of this model for the purposes of explaining and defining the general scheme of climates during the Meso-Cenozoic era. This problem has been discussed at recent international conferences devoted to topics in paleoclimatology and also in papers by individual scientists.
Figure 2 - The drift of continents. The disposition of the continental crust on the surface of the world during the present spreading cycle. About 200 million years ago the continents, which were at that time joined together in the supercontinent Pangaea, began to split and drift apart. A principal split was along the rift zone that today forms the Mid-Atlantic Ridge. The spreading continues and today's picture is but one
frame in a long motion picture
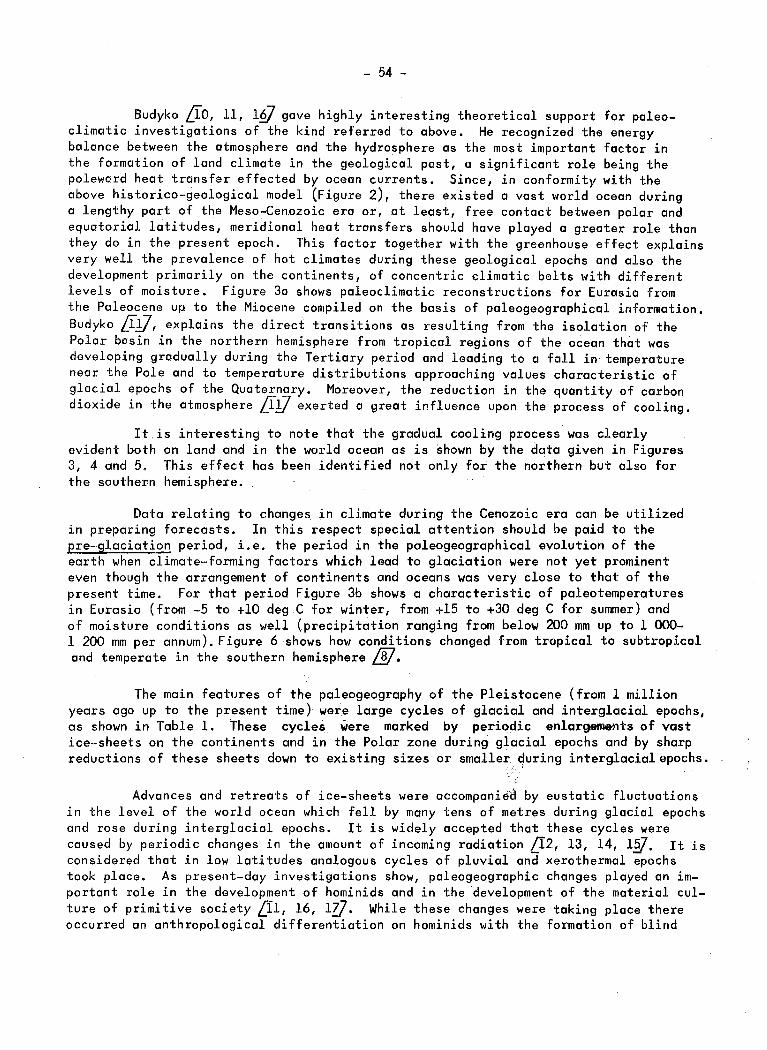
- 54 -
Budyko Lfo, 11, 1~ gave highly interesting theoretical support for paleoclimatic investigations of the kind referred to above. He recognized the energy balance between the atmosphere and the hydrosphere as the most important factor in the formation of land climate in the geological past, a significant role being the poleward heat transfer effected by ocean currents. Since, in conformity with the above historico-geological model (Figure 2), there existed a vast world ocean during a lengthy part of the Meso-Cenozoic era or, at least, free contact between polar and equatorial latitudes, meridional heat transfers should have played a greater role than they do in the present epoch. This factor together with the greenhouse effect explains very well the prevalence of hot climates during these geological epochs and also the development primarily on the continents, of concentric climatic belts with different levels of moisture. Figure 3a shows paleoclimatic reconstructions for Eurasia from the Paleocene up to the Miocene compiled on the basis of paleogeographical information. Budyko Lfl7, explains the direct transitions as resulting from the isolation of the Polar basin in the northern hemisphere from tropical regions of the ocean that was developing gradually during the Tertiary period and leading to a fall in temperature near the Pole and to temperature distributions approaching values characteristic of glacial epochs of the Quaternary. Moreover, the reduction in the quantity of carbon dioxide in the atmosphere Lfi7 exerted a great influence upon the process of cooling.
It.is interesting to note that the gradual cooling process was clearly evident both on land and in the world ocean as is shown by the data given in Figures 3, 4 and 5. This effect has been identified not only for the northern but also for the southern hemisphere.
Data relating to changes in climate during the Cenozoic era can be utilized in preparing forecasts. In this respect special attention should be paid to the pre-glaciation period, i.e. the period in the paleogeographical evolution of the earth when climate-forming factors which lead to glaciation were not yet prominent even though the arrangement of continents and oceans was very close to that of the present time. For that period Figure 3b shows a characteristic of paleotemperatures in Eurasia (from -5 to +10 deg C for winter, from +15 to +30 deg C for summer) and of moisture conditions as well (precipitation ranging from below 200 mm up to 1 000-1 200 mm per annum). Figure 6 shows how conditions changed from tropical to subtropical and temperate in the southern hemisphere ~.
The main features of the paleogeography of the Pleistocene (from 1 million years ago up to the present time) were large cycles of glacial and interglacial epochs, as shown in Table 1. These cycles were marked by periodic enlargements of vast ice-sheets on the continents and in the Polar zone during glacial epochs and by sharp reductions of these sheets down to existing sizes or smaller ~uring interglacialepochs.
Advances and retreats of ice-sheets were accompanied by eustatic fluctuations in the level of the world ocean which fell by many tens of metres during glacial epochs and rose during interglacial epochs. It is widely accepted that these cycles were caused by periodic changes in the amount of incoming radiation ~2, 13, 14, 1§7. It is considered that in low latitudes analogous cycles of pluvial and xerothermal epochs took place. As present-day investigations show, paleogeographic changes played an important role in the development of hominids and in the ~evelopment of the material culture of primitive society Lil, 16, lzJ. While these changes were taking place there occurred an anthropological differentiation on hominids with the formation of blind
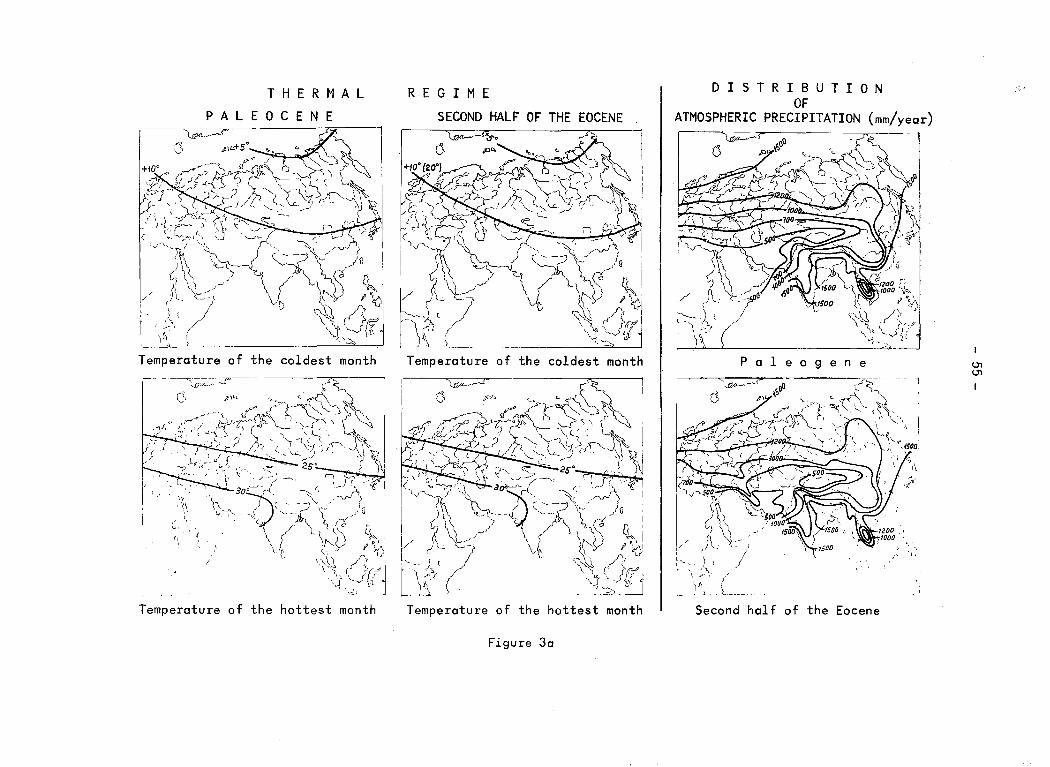
/ /
\ ( .·, .,.,. /
\1\ ~
Temperature of the coldest month ----~ --- ----~~_J?·"--- ~
(', ,n'> V" >'"{;"\'---~--?~~ I ------, <l~(lh'~) -_r?. . \
-.r4 10_!!.-r,· ::..ll ' - ' ' ,, i' ,/ ' _; (_ -, ~) :.\ '0,_ ~
~,-,;, .'_/.·_,-<-0;;. 2;:. ';) \"J,;t \ '*': ' -· ,< I) •., u_,_,J~I
,, I , '/ :, .. 2S' , ' . L,.·~- "'J;' ,-,. ',, r-, I --'it I ---" '.·: \ -_/_/ ___ ' ~), -··-- I' ~- J ~. _--v--1"
'--3o~' _ ~- - ID ( -? \" _,/ 'f\ . ' -~- '(_ (--/ '
·~<: ~ (\_ L \\<' [~\' - 11-P I~'
\ c .. -~\, /?,'r'-"j! '\•-,;> [ J'-, ' '
--~- -~- ~-~
,, '\•,
~ .. ,. J
Temperature of the hottest month
R E G I M E
SECOND HALF OF THE EOCENE
Temperature of the coldest month
Temperature of the hottest month
Figure 3a
)'~ ~200 [(
7000 ·of\-.,
~\ 'IY I'~ '·''--.\!, /:_· ,, \ \,I i'rc-"
'-cj --J li ., ,... • £ _-,
P a 1 e o g e n e
~/,L_..,---...5
6
_/
( :- '- ~ \ ! f -- .. , i -\~-. ( L- ·-"-- ;_ ----
Second half of the Eocene
'.t\!
-, , .... 't!
U1 U1
I
'J~· #
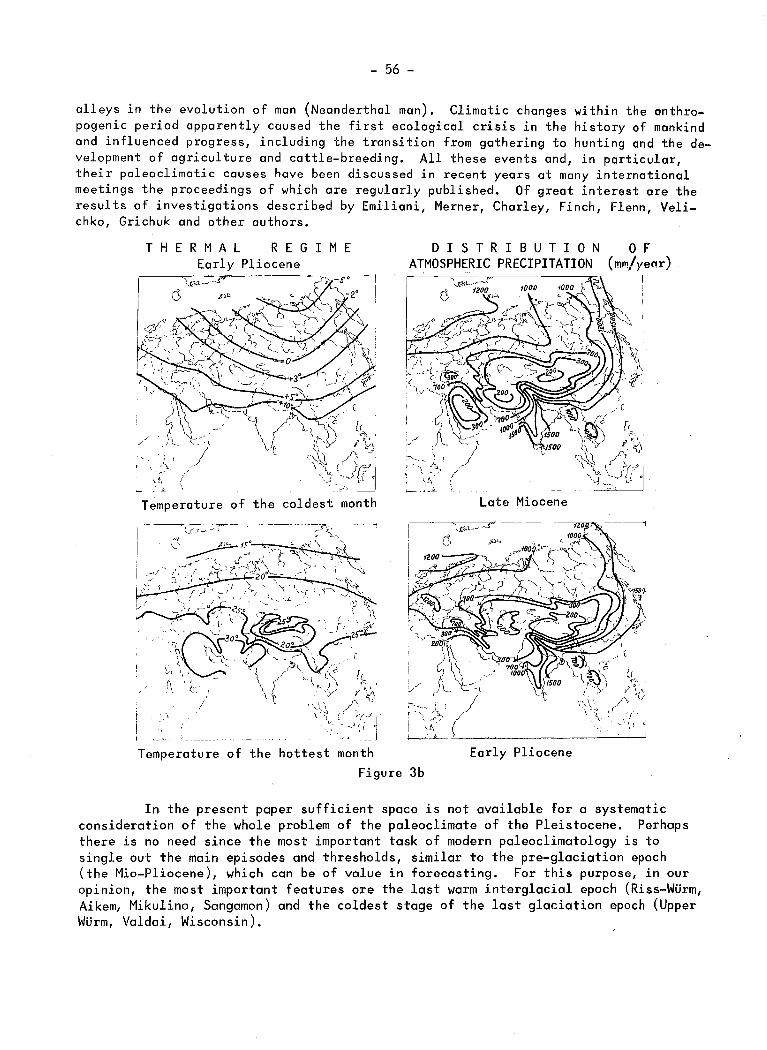
- 56 -
alleys in the evolution of man (Neanderthal man). Climatic changes within the anthropogenic period apparently caused the first ecological crisis in the history of mankind and influenced progress, including the transition from gathering to hunting and the development of agriculture and cattle-breeding, All these events and, in particular, their paleoclimatic causes have been discussed in recent years at many international meetings the proceedings of which are regularly published. Of great interest are the results of investigations described by Emiliani, Merner, Charley, Finch, Flenn, Velichko, Grichuk and other authors.
T H E R M A L R E G I M E Early Pliocene
Temperature of the coldest month
D I S T R I B U T I 0 N ATMOSPHERIC PRECIPITATION
0 F (mm/yeor)
----~~--~------------~--- l
Late Miocene
Early Pliocene
In the present paper sufficient space is not available for a systematic consideration of the whole problem of the paleoclimate of the Pleistocene. Perhaps there is no need since the most important task of modern paleoclimatology is to single out the main episodes and thresholds, similar to the pre-glaciation epoch (the Mio-Pliocene), which can be of value in forecasting. For this purpose, in our opinion, the most important features are the last warm· interglacial epoch (Riss-WUrm, Aikem, Mikulino, Sangamon) and the coldest stage of the last glaciation epoch (Upper WUrm, Valdai, Wisconsin).
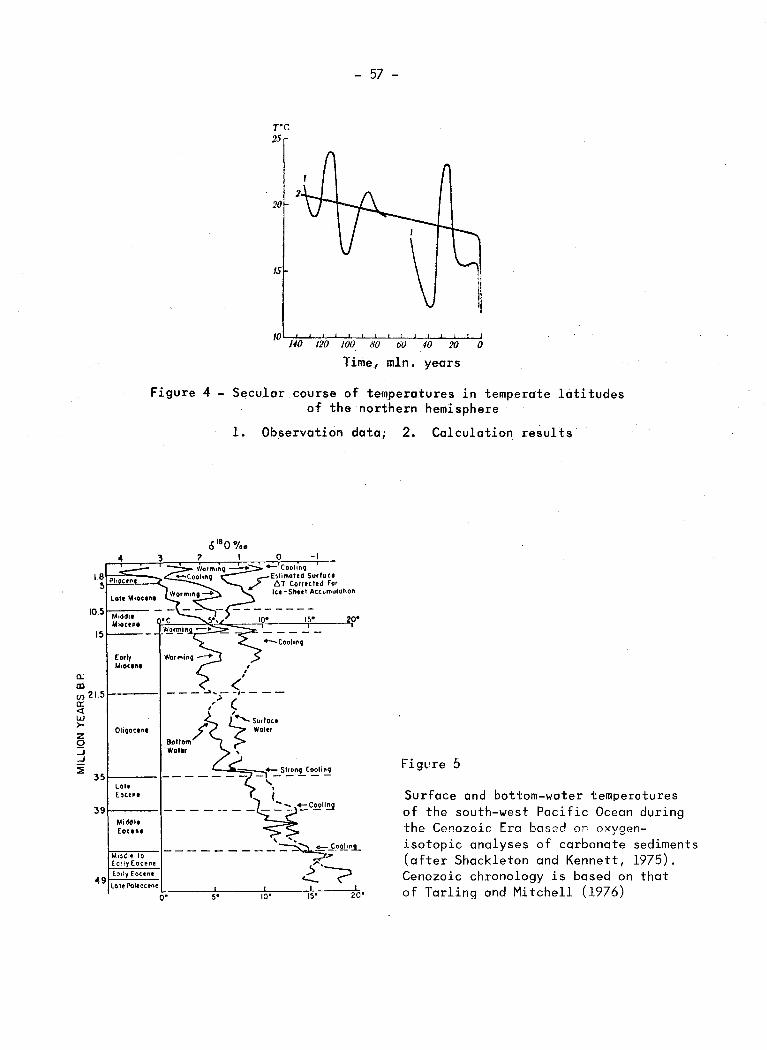
15
a.; a:i (/') 21.5 a: <t w >-z 0 :J .J
~ 35
39
Eorly Mtocent
Oli9octnt
Lah Eoc.ene
Middle Eoceftt
re 25
15
/0 140
- 57 -
120 100 80 6'0 40 20 0
Time~ mln. years
Figure 4- Secular course of temperatures in temperate latitudes of the northern hemisphere
1. Observation data; 2. Calculation results
-I
______ ~+-:_S~n!_C~Ii~
" I ( ______ -~~C~II~
' ... 1-;M~,d,..,C"'Ie-=-ro=----l--- - - ----~o~n.J_
Eody Eoc••• ,.::-·--,
~g E:!rly Eocene --- '
Lo1t Poleocene 0~,----5f:.,:------;i~O';----;'<I5oo ----,z"tr,O'
Surface and bottom-water temperatures of the south-west Pacific Ocean during the Cenozoic Era bassd o~ oxygenisotopic analyses of carbonate sediments (after Shackleton and Kennett, 1975). Cenozoic chronology is based on that of Tarling and Mitchell (1976)
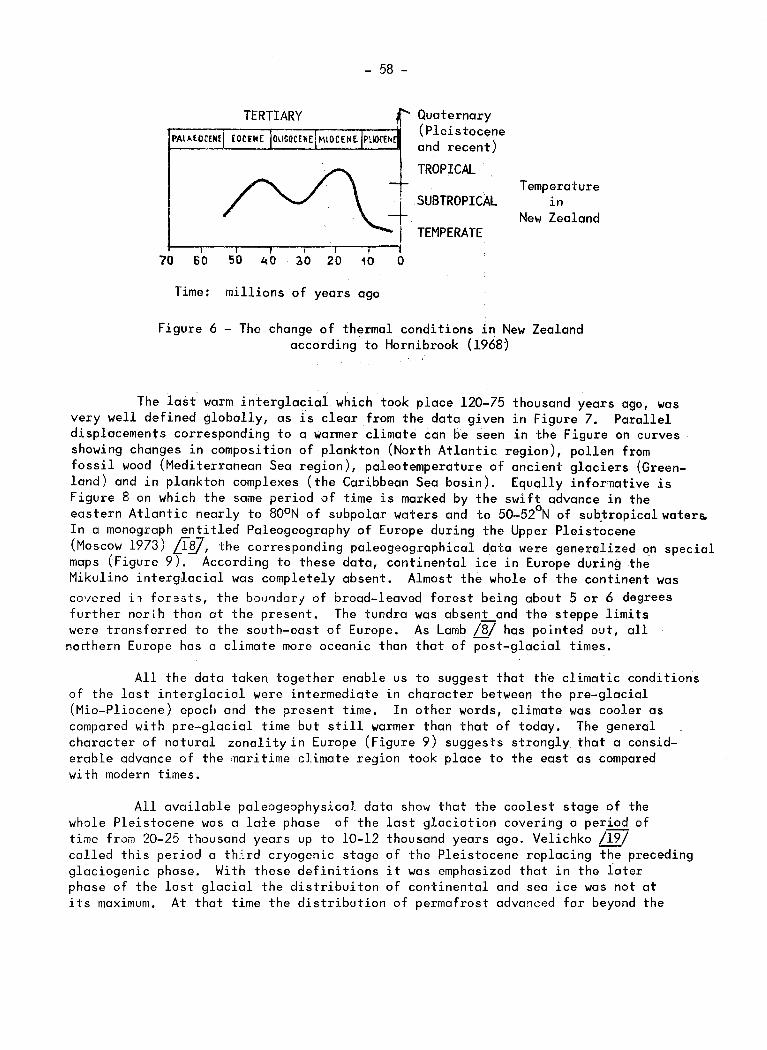
- 58 -
TERTIARY
PAl,..EOCENE
t
70 60 50 40 30 20 0
Time: millions of years ago
Quaternary (Pleistocene and recent)
TROPJCAL
SUBTROPICAL
TEMPERATE
Temperature in
New Zealand
Figure 6 - The change of thermal conditions in New Zealand according to Hornibrook (1968)
The last warm interglacial which took place 120-75 thousand years ago, was very well defined globally, as is clear from the data given in Figure 7. Parallel displacements corresponding to a warmer climate can be seen in the Figure on curves showing changes in composition of plankton (North Atlantic region), pollen from fossil wood (Mediterranean Sea region), paleotemperature of ancient glaciers (Greenland) and in plankton complexes (the Caribbean Sea basin). Equally informative is Figure 8 on which the same period of time is marked by the swift advance in the eastern Atlantic nearly to 80°N of subpolar waters and to 50-52°N of sub.tropical waters. In a monograph entitled Paleogeography of Europe during the Upper Pleistocene (Moscow 1973) [J!iJ, the corresponding paleogeographical data were generalized on special maps (Figure 9). According to these data, continental ice in Europe during the Mikulino interglacial was completely absent. Almost the whole of the continent was covered i1 for:!sts, the bou11dar1 of broad-leaved forest being about 5 or 6 degrees further norih than at the present. The tundra was abseni_and the steppe limits were transferred to the south-east of Europe. As Lamb /8/ has pointed out, all
northern Europe has a climate more oceanic than that of post-glacial times.
All the data taken together enable us to suggest that the climatic conditions of the last interglacial were intermediate in character between the pre-glacial (Mio-Pliocene) epocl1 and the present time. In other words, climate was cooler as compared with pre-glacial time but still warmer than that of today. The general character of natural zonalityin Europe (Figure 9) suggests strongly that a considerable advance of the maritime climate region took place to the east as compared with modern times.
All available paleogeophysical data sho~ that the coolest stage of the whole Pleistocene was a lale phase of the last glaciation covering a period of time from 20-25 thousand years up to 10-12 thousand years ago. Velichko /19/ called this period a third cryogenic stage of the Pleistocene replacing the preceding glaciogenic phase. With these definitions it was emphasized that in the later phase of the last glacial the distribuiton of continental and sea ice was not at its maximum. At that time the distribution of permafrost advanc~d far beyond the
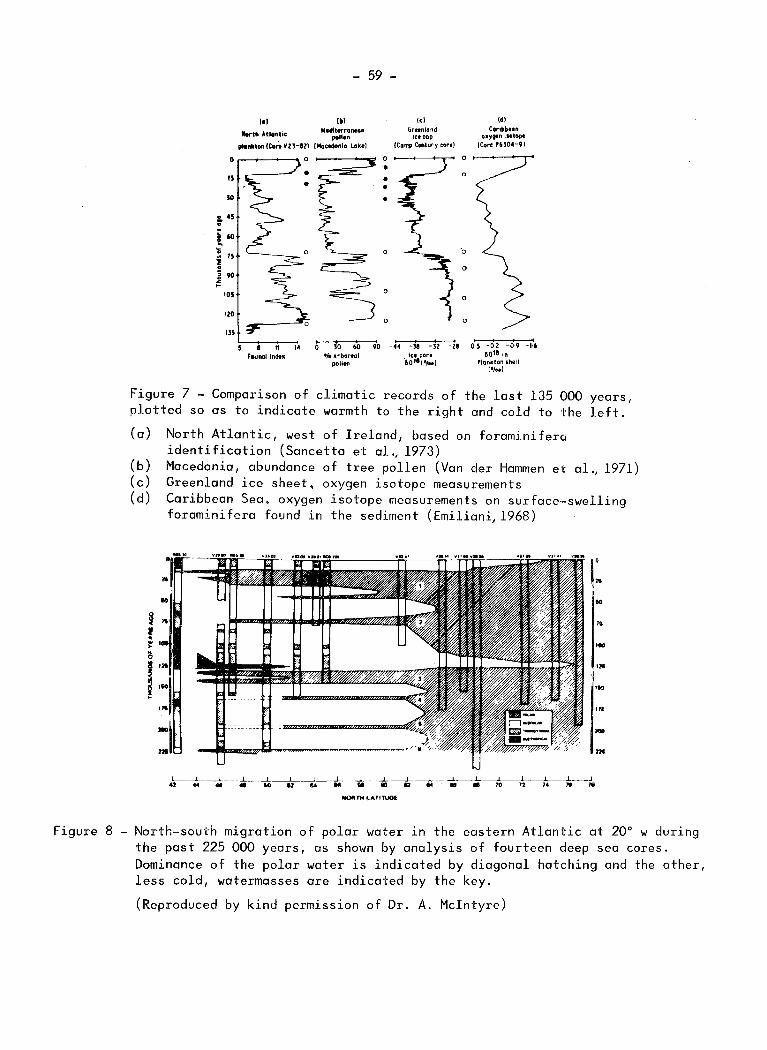
15
JO
0 45 ;'
i60 "' : 75 ~ : ~90
105
- 59 -
.. , hrth Atlantic Mld~~r:~nean
lliankton ICof. Y ZJ-8ZI IMacodonla Lak•l
lO 60 .,. Arboreal
pollen
!cl Grttnland
ICICQp
{Camp Century COI"'t)
0
90 -44 -la -lZ -za let core
·&o"t'lool
0
Id I C.lrt~btan
OIYQIR lSOtopt
!Core P6l04-91
0·5 -O·l -0·9 +t 6018 tn
P'lankton 'httl (•/ .. )
Figure 7 - Comparison of climatic records of the last 135 000 years, plotted so as to indicate warmth to the right and cold to the left.
(a) North Atlantic, west of Ireland, based on foraminifero identification (Sancetta et al., 1973)
(b) Macedonia, abundance of tree pollen (Van der Hammen et al., 1971) (c) Greenland ice sheet, oxygen isotope measurements (d) Caribbean Sea, oxygen isotope measurements on surface-swelling
foraminifera found in the sediment (Emiliani1 1968)
10
:m
L___j___.J_------.L.......__L___l_____l
q w • • 10 u ~ M u • m ~ • • ~ n n ~ ~
NQCIIJTH LATITUOE
Figure 8 - North-south migration of polar water in the eastern Atlantic at 20° w during the past 225 000 years, as shown by analysis of fourteen deep sea cores. Dominance of the polar water is indicated by diagonal hatching and the other, less cold, watermasses are indicated by the key.
(Reproduced by kind permission of Dr. A. Mclntyre)
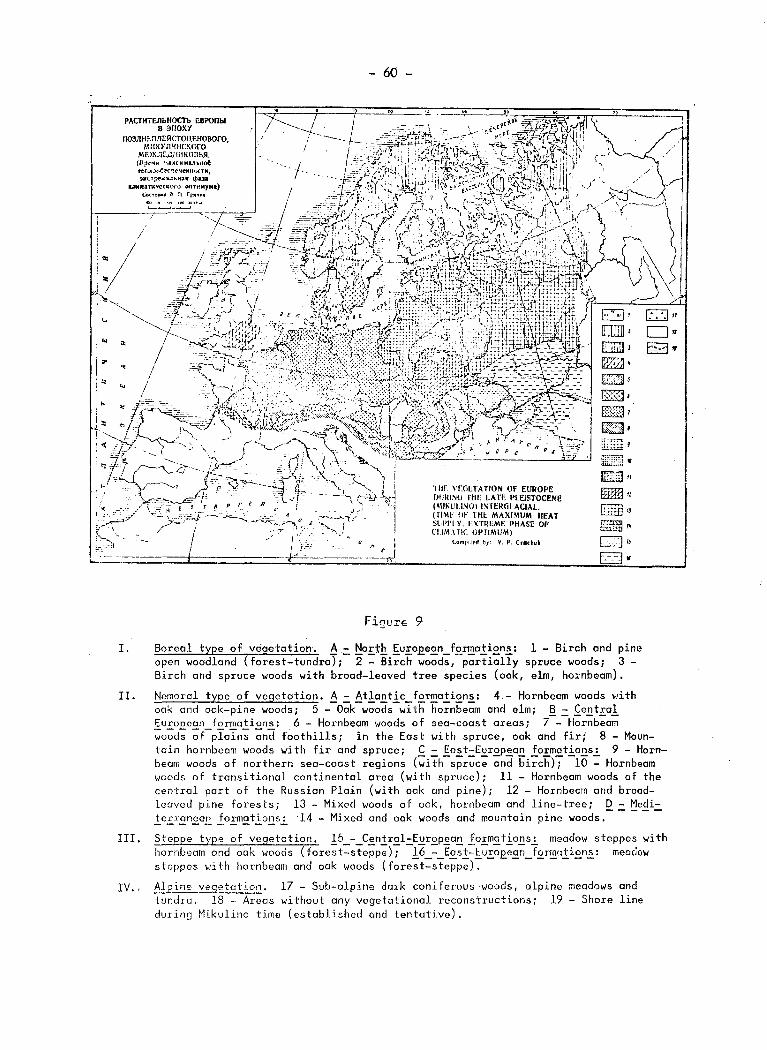
- 60 -
I. Boreal type of veaetation. ~ .,:, !:!o!Jb. SU!,O.P.e~_f£r:~.a!i£n.:!_: 1 - Birch and pine open woodland (forest-tundra); 2- Birch woods, partially spruce woods; 3-Birch and spruce woods with broad-leaved tree species (oak, elm, hornbeam).
II. Nemoral type of vegetation.~.:. ~tla~tlc_f9_rmations: 4.- Hornbeam woods with oak and oak-pine woods; 5- Oak woods with ho~nbe~m and elm; B- Central Eurooean formations: 6 - Hornbeam woods of sea-coast areas; 7---H~r-;:;b-;:;-a-;;:; -;:;o-;;d"'; -;;f-plain-; ~nd foothills; in the East with spruce, oak and fir; 8 - Mountain hornbeam woods with fir and spruce; f.:. ~a2.t.:.E~r9_p~a~ £o!.m£tlo~s~ 9 - Hornbeam woods of northern sea-coast regions (with spruce and birch); 10- Hornbeam woods of transitional continental area (with spruce); 11- Hornbeam woods of the central part of the Russian Plain (with oak and pine); 12- Hornbeam and broodleaved pine forests; 13 - Mixed woods of oak, hornbeam and line-tree; Q.:. ~e~i.:. ,!e_E?'.9_n_£a~ £o.E.m.9_tlo~s~ ·14 - f1ixed and oak woods and mountain pine woods.
III. Steppe type of vegetation. 15 - Central-European formations: meadow steppes with hornbeam and oak woods ( fore-;t:stepp-;)"; l_6_: _J.9.;.!:~-;;E.-;;.P.-;.9.-;:;_f,£r!E_n.!i£n.:!.: meadow steppes with hornbeam and oak woods (forest-steppe).
IV., Alpine vegetation. 17 - Sub-olpine dark coniferous ·woods, alpine meadows and tundro. 18 - Areas without any vegetational reconstructions; 19 - Shore line during Mikulino time (established and tentative).
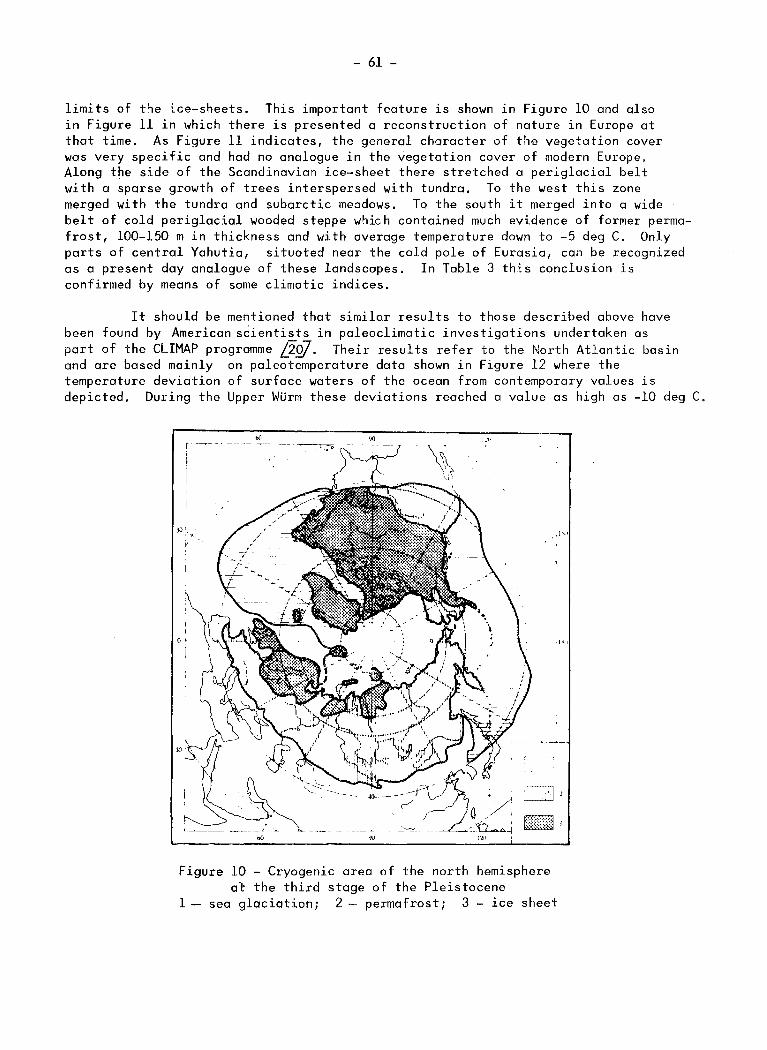
- 61 -
limits of t1e ice-sheets. This important feature is shown in Figure 10 and also in Figure 11 in which there is presented a reconstruction of nature in Europe at that time. As Figure 11 indicates, the general character of the vegetation cover was very specific and had no analogue in the vegetation cover of modern Europe. Along the side of the Scandinavian ice-sheet there stretched a periglacial belt with a sparse growth of trees interspersed with tundra. To the west this zone merged with the tundra and subarctic meodows. To the south it merged into a wide belt of cold periglacial wooded steppe w~ich contained much evidence of former permafrost, 100-150 m in thickness and with average temperature down to -5 deg C. Only parts of central Yahutia, situated near the cold pole of Eurasia, can be recognized as a present day analogue of these landscapes. In Table 3 this conclusion is confirmed by means of some climatic indices.
It should be mentioned that similar results to those described above have been found by American scientists in paleoclimatic investigations undertaken as part of the CLIMAP programme liQJ. Their results refer to the North Atlantic basin and are based mainly on paleotemperature data shown in Figure 12 where the temperature deviation of surface waters of the ocean from contemporary values is depicted. During the Upper WUrm these deviations reached a value as high as -10 deg C.
Figure 10 - Cryogenic area of the north hemisphere at the third stage of the Pleistocene
1- sea glaciation; 2- permafrost; 3- ice sheet

- 62 -
Figure 11
EXTENT OF THE PEPIIUROSl AREA \Nil RELIC PERIGLAUAI. FEATURES DUlliNG LATE-GLACIAL TIME.
Cornpl!f'd by: .\. A. Veu~·llll.o, V. V. 8erthdll9\' and V. f". Ne-ldlayev.
CJro
1 - Southern boundary of the present-day permafrost zone; ~ - Southern bcundcrv of the permafrost zone of late-glacial time; 3 - Southern boundary of the former zo~e of deep seasonal freezing; 4 - Boundaries of the former permafrost areas; 5 - Bcu:-~
daries of the former permafrost provinces; 6 - Permafrost zone of the type transitional from Siberian to Atlantic; 7 - Permafrost zone of the Siberian type; 3 -Areas of frozen grounds, assumed; 9 - Areas with former season permafrost; 10 -Mountain areas of former seasonal freezing with features of frost weathering; 11-Late-glacial ice-sheet; 12- The limit of the late-glacial ice-sheet; 13- Lateglacial shore line.
fo~p!e~ £f_cEY£9£nlc_f£o!uEe~: 14 - Wedge-like features, 2.0 to 5.0 m 1~ide polygons, 20.0 to 40.0 m in diameter; 15 - Ground wedges, 1.0 ~ w.icle polyguns, 2.0 to 3.0 m in diameter; the wedges reach the bottom of the active layer. 16 - Cryoturbations and other ostructural features; 17 - Solifluction features.
f.eEm£fEo~t_pEo.Y_i_I2C£s..:.. A - West European; B - CentrcJl European; C - West Russian; D - East Russian
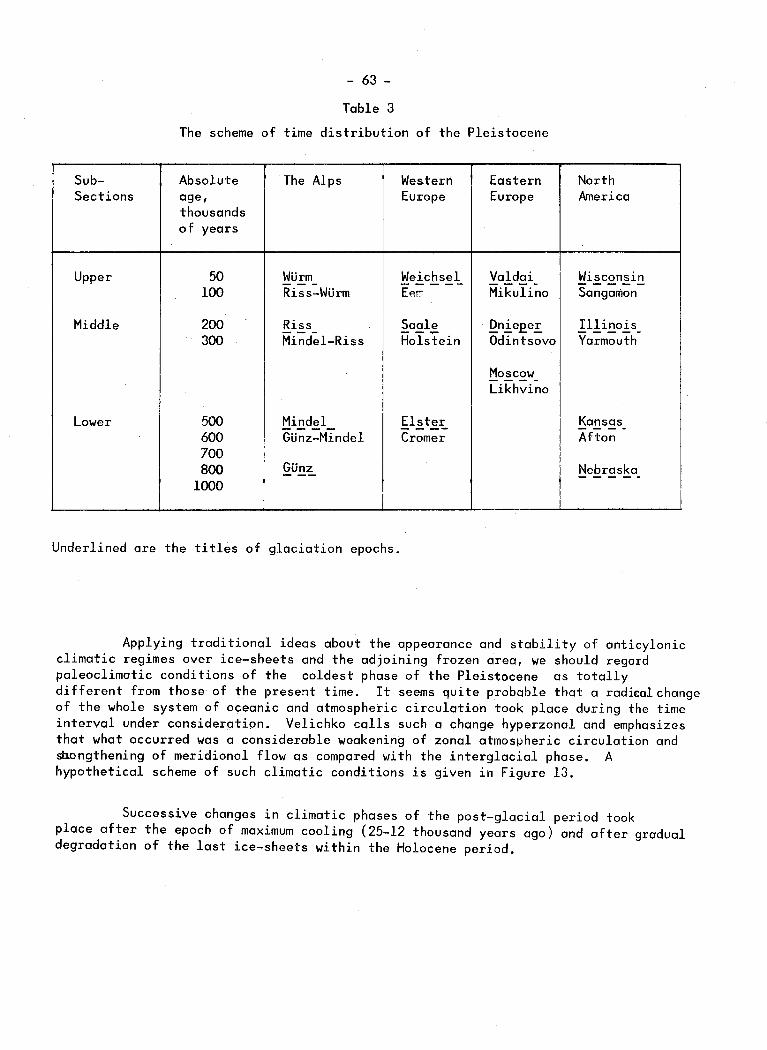
- 63 -
Table 3
The scheme of time distribution of the Pleistocene
Sub- Absolute ·The Alps Western Eastern North Sections age, Europe Europe America
thousands of years
Upper 50 WUrm !!ei_cb.s!:.l. Valdai Wisconsin --- Mikuli~o -----lOO Riss-WUrm Eer Sangamon
Middle 200 Riss Sa ale Qni_e.E_e.E Illinois 300 Mindel-Riss Holstein Odintsovo Ya-;m~uth-
Moscow ----Likhvino
Lower 500 Mindel Elster I
Kansas ---- ---- ----600 GUnz-Mindel Cromer Afton
I
I
700 I 800 GUnz Nebraska --- -----
1000
Underlined are the titles of glaciation epochs.
Applying traditional ideas about the appearance and stability of anticylonic climatic regimes over ice-sheets and the adjoining frozen area, we should regard paleoclimatic conditions of the coldest phase of the Pleistocene as totally different from those of the present time. It seems quite probable that a radical change of the whole system of oceanic and atmospheric circulation took place during the time interval under consideration. Velichko calls such a change hyperzonal and emphasizes that what occurred was a considerable weakening of zonal atmospheric circulation and ~engthening of meridional flow as compared with the interglacial phase. A hypothetical scheme of such climatic conditions is given in Figure 13.
Successive changes in climatic phases of the post-glacial period took place after the epoch of maximum cooling (25-12 thousand years ago) and after gradual degradation of the last ice-sheets within the Holocene period.

- 64 -
Figure 12 - Sea surface temperatures prevailing at the last maximum of glaciation about 15 000 -17 000 years ago, as departures (°C) from today's values. (a) In winter, (b) in summer

- 65 -
Figure 13
A working scheme of the changes in the system of circulation in troposphere during the maximum last glaciation as compared with the present.
E systems with the predominance of an eastward transfer of air,
W - the same of a westward transfer.
The broken line shows a zone of probable expansion of anticyclonic masses of air in the cold time of the year of the Late Pleistocene climatic minimum; within North America the ice sheet of the Late Pleistocene is shown
Some years ago the possibility was put forward of a correspondence between ·the post-glacial (Holocene) period, which began 11-12 thousand years ago, and the interglacial epochs. From such an assumption it follows that the Holocene, like the interglacial period, is characterized by a definite cycle of climatic changes from initial coolness to climatic optimum nearly 5 thousand years ago, then again to new cooling - a forerunner of new glaciation. This presenta±ton, shown in Figure 14, is being checked for the central part of the Russian Plains with the help of paleobotanic data. In this Figure the course of climatic changes during the last interglacial is compared with that of the Holocene. The result of such a comparison leads to the view that historical times and the contemporary period can be regarded as a transition from a postglacial climatic optimum (the At1antic phase) to cooler climate levels, thus foreshadowing a new glacial epoch. Such a transition, of course, would not be gradual, It would be complicated by periodic epochs of warming and cooling, similar to the so-called Little Ice Age. The general tendency to progressive cooling clearly follows from paleogeographical data.
On the basis of these data it is possible to make an approximate calculation of the speed of cooling. From Table 4 it follows that distinct signs of the beginning of a new glacial epoch may appear within the next thousand years (Figure 15).
However, there is no reason to conclude this paper with such a pessimistic forecast. Even if we consider the above natural trend of~ological change in climate for the forthcoming periJd is supported by good evidence, we cannot be guided entirely by this trend. For one reason, contemporary changes in climate are being more and more determined by anthropogenic influences upon climate-forming factors.
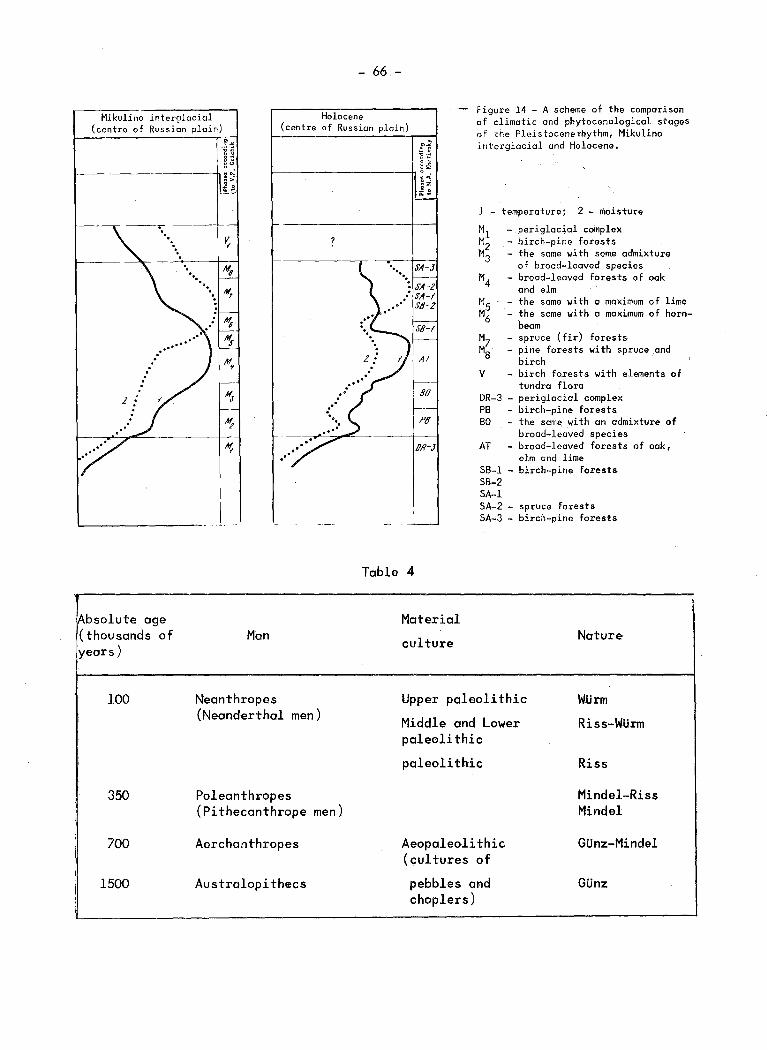
- 66 -
Holocene Mikulino interglacial (centre of Russian plain) (centre of Russian plain)
Figure 14 - A scheme of the comparison of climatic and phytocenological stages of the Pleistocenerbythm, Mikulino interglacial and Holocene.
z
I L----------- _l
Absolute age (thousands of years)
lOO
350
700
1500
Man
Neanthropes (Neanderthal men)
Poleanthropes (Pithecanthrope men)
Aerchanthropes
Australopithecs
Table 4
Material
culture
J. - temperature; 2 - moisture
- periglacial complex - birch-pine forests - the same with some admixture
of broad-leaved species - broad-leaved forests of oak
and elm the same with a maximum of lime
- the same with a maximum of hornbeam spruce (fir) forests
- pine forests with spruce .and birch
V - birch forests with elements of tundra flora
DR-3 - periglacial complex PB - birch-pine forests BO - the same with an admixture of
broad-leaved species AT - broad-leaved forests of oak,
elm and lime SB-1 - birch-pine forests SB-2 SA-l SA-2 - spruce forests SA-3 - birch-pine forests
Nature
Upper paleolithic
Middle and Lower paleoli thic
WUrm
Riss-WUrm
paleoli thic
Aeopaleolithic (cultures of
pebbles and choplers)
Riss
Mindel-Riss Mindel
GUnz-Mindel
GUnz
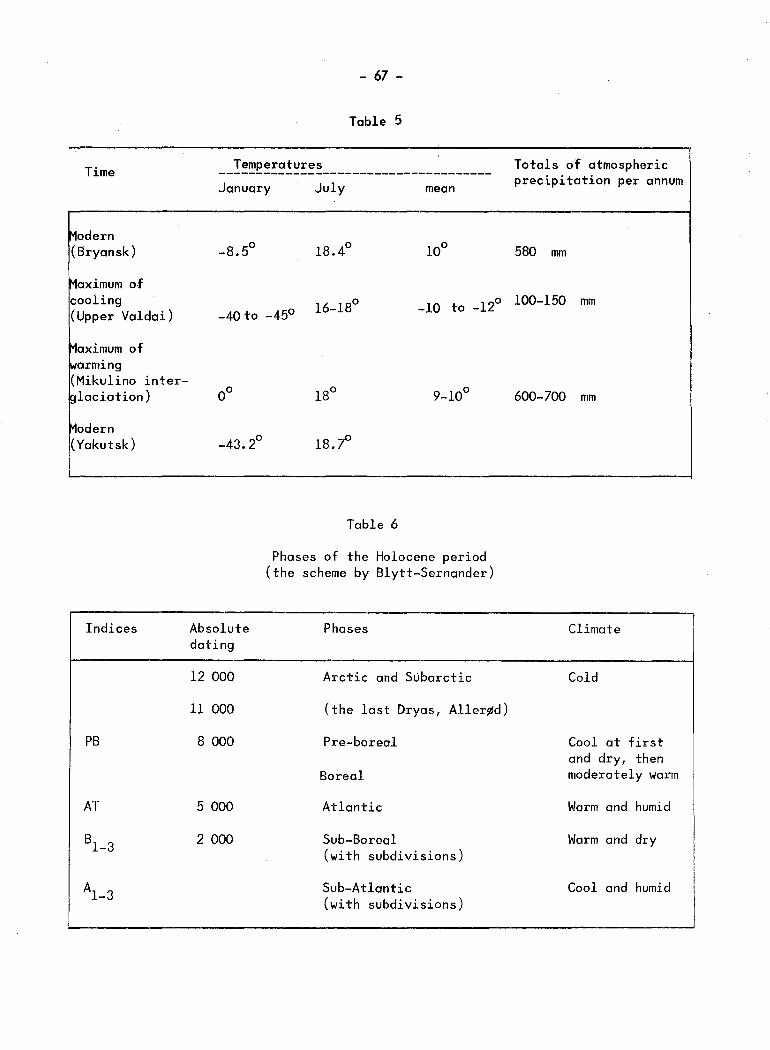
Time
Modern (Bryansk)
Maximum of cooling (Upper Valdai)
Maximum of ~arming (Mikulino inter-~laciation)
Modern (Yakutsk) I l
Indices
PB
AT
81-3
Al-3
- 67 -
Table 5
__ !!~e!:~!~==~-----------------------January July mean
-8.5° 18.4° 10°
-40 to -45° 16-18° -10 to -12°
00 18° 9-10°
-43.2° 18.7°
Table 6
Phases of the Holocene period (the scheme by Blytt-Sernander)
Absolute Phases dating
12 000 Arctic and Subarctic
11 000 (the last Dryas, Allerj11d)
8 000 Pre-boreal
Boreal
5 000 Atlantic
2 000 Sub-Boreal (with subdivisions)
Sub-Atlantic (with subdivisions)
Totals of atmospheric precipitation per annum
580 mm
100-150 mm
600-700 mm
Climate
Cold
Cool at first and dry, then moderately warm
Warm and humid
Warm and dry
Cool and humid

- 68.-
GLACIAL
1000CLIMATE I NTERGL ACI AL
CLIMATE
w 0: :::> 5 100
!::; (f) 0: <[ 10 w >-
10
j:: 100 (f) <[
~ (f) 1000 0: <[ w >-
10,000
100,000
? ?
T 0 D
"Lifl/1! JCI! or;es" { (N~or;tociolion/
Poslq/ociol oplirrwo- ~
Vlisconsin Glcc:olion
Figure 15 - Climatic variability during the past million years, and possible future short-term climatic trends
As this paper shows and taking a forward look, paleoclimatology can offer a choice from a complete set of climates of past geological epochs. Based on geological history, the possible climatic regimes that could recur range between the following:
(a) Very warm and humid, rather uniform over vast areas, i.e., the climate of the pre-glaciation period (Mio-Pliocene);
(b) Less warm but with greater spatial variations, i.e., the climate of the inter-glacial epoch;
(c) The very severe cold and arid climate of the last glacial epoch.
The majority of investigators of anthropogenic changes in climate consider that under the influence of increasing carbon dioxide concentrations as well as other factors, there will occur in the next few decades a rapidly progressive change

- 69 -
in climate in the direction of warming. This would point first to (b) and then to (a) of the above regimes.
It is to be hoped that ways and means of influencing climate may be found so that action may be taken to prevent any undesirable cha~ges resulting from mankind's economic activities.
REFERENCES
/1/ HUNTINGTON, E. and VISHER, S.S. (1922). Climatic changes. Their nature and causes. New-Haven, Yale Univ.
/2/ KOPPEN, W. and WEGENER, A. (1924). Die Klimate der geologischen Vorzeit. Berlin.
/3/ BROOKS, C.E.P. (1950). Climate through the age!s S. Benn. London. pp. 395.
/4/ KERNER-MARILAUN, F. (1930). Palaoklimatologie. Berlin.
/5/ STRAKOV, N. M. (1948). Foundations of historical geology. Part II. (In Russian: Osnovy istoricheskoi geologii. Chast II).
/6/ SCHWARZBACH, M. (1950). Dos Klima der Vorzeit. Stuttgart. pp, 211.
/7/ SINITSYN, V.M. (1965-66). Ancient climates of Eurasia. (In Russian: Drevnije l'o,aty Evrasoo). 1-2, izd. Len.Gos.Univ.
/8/ LAMB, H.H. (1977). Climate: present, past and future. Vol.2. Methuen & Co. Ltd. London. pp. 835.
/9/ FLOHN, H. (1969). Ein geophysikalisches Eiszeit-Modell, Eiszeit-alter und Gegenwart. 20:204-231
/10/ BUDYKO, M.I. (1974). Climate and life. (Ed. D.H. Miller) Academic Press, New York and London, pp. 508.
/11/ BUDYKO, M.I. (1977). Global ecology. (In Russian: Globalnaya ekologiya. M. Mysl.
/12/ MILANKOVITCH, M. (1930). Mathematische Klimalehre und astronomische Theorie der Klimaschwankungen. Berlin.
/13/ FLINT, R.F. (1967). Glacial geology and the Pleistocene epoch. London
/14/ GERASIMOV, I.P. and MARKOV, K.K. (1939). Glaciation period of the territory of the USSR. (In Russian: Lednikovyi period na territorii SSSR. Izd. AN SSSR. M.-L.)
- 70 -
/15/ ZEUNER, F. (1959). The Pleistocene period. Hutchinsson. London. pp·. 447.
/16/ BUDYKO, M.I. (1974). Climate change. (In Russian: Izmeneniye klimata. L. Gidrometeoizdat).
GERASIMOV, I.P. (1977). Anthropogenic period and its main problem. (In Russian: Antropogen i ego glavnya problema. Izv. AN SSSR. ser,geogr.Nr.4.
Paleogeography of Europe in the Upper Pleistocene. (In Russian: Paleogeografiya Evropy v pozdnem pleistotsene. Opytnyi maket atlasamonografii. M. (1973).
VELICHKO, A.A. (1973). Natural process in the Pleistocene. (In Russian: erirodnyi protsess V pleistotsene. M. Nauka.
CLIMAP Project Members. The surface of the Ice Age Earth. Science, vol. 19 1131, (1976)
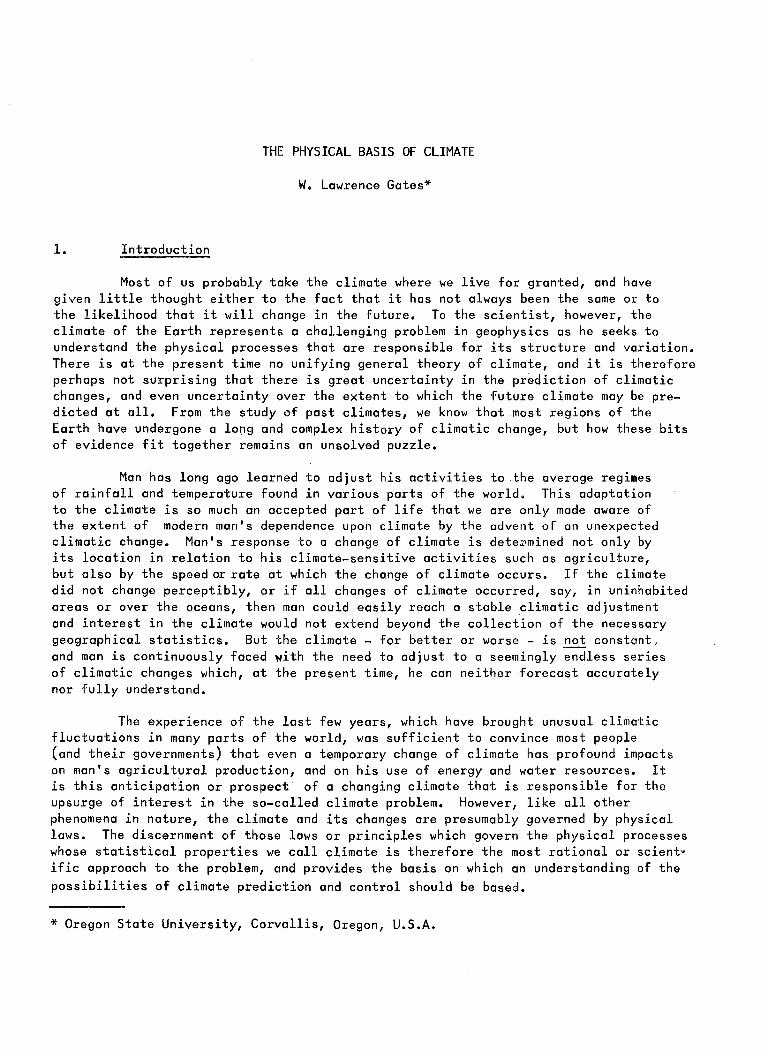
THE PHYSICAL BASIS OF CLIMATE
W. Lawrence Gates*
1. Introduction
Most of us probably take the climate where we live for granted, and have given little thought either to the fact that it has not always been the same or to the likelihood that it will change in the future. To the scientist, however, the climate of the Earth represents a challenging problem in geophysics as he seeks to understand the physical processes that are responsible for its structure and variation. There is at the present time no unifying general theory of climate, and it is therefore perhaps not surprising that there is great uncertainty in the prediction of climatic changes, and even uncertainty over the extent to which the future climate may be predicted at all. From the study of past climates, we know that most regions of the Earth have undergone a long and complex history of climatic change, but how these bits of evidence fit together remains an unsolved puzzle.
Man has long ago learned to adjust his activities to the average regimes of rainfall and temperature found in various parts of the world. This adaptation to the climate is so much an accepted part of life that we are only made aware of the extent of modern man's dependence upon climate by the advent of an unexpected climatic change. Man's response to a change of climate is dete~mined not only by its location in relation to his climate-sensitive activities such as agriculture, but also by the speed or rate at which the change of climate occurs. If the climate did not change perceptibly, or if all changes of climate occurred, say, in uninhabited areas or over the oceans, then man could easily reach a stable climatic adjustment and interest in the climate would not extend beyond the collection of the necessary geographical statistics. But the climate - for better or worse - is not constant, and man is continuously faced with the need to adjust to a seemingly endless series of climatic changes which, at the present time, he can neither forecast accurately nor fully understand.
The experience of the last few years, which have brought unusual climatic fluctuations in many parts of the world, was sufficient to convince most people (and their governments) that even a temporary change of climate has profound impacts on man's agricultural production, and on his use of energy and water resources. It is this anticipation or prospect of a changing climate that is responsible for the upsurge of interest in the so-called climate problem. However, like all other phenomena in nature, the climate and its changes are presumably governed by physical laws. The discernment of those laws or principles which govern the physical processes whose statistical properties we call climate is therefore the most rational or scient~ ific approach to the problem, and provides the basis on which an understanding of the possibilities of climate prediction and control should be based.
* Oregon State University, Corvallis, Oregon, U.S.A.

- 72 -
The popular notion of climate as the average weather, supplemented perhaps by some information on the occurrence of extreme or unusual events, is also used by the scientist. But while weather is concerned with the daily progress of such familiar events as wind, clouds, rainfall and temperature, the climate is concerned with their longer-term statistics. The climate in a particular location therefore depends upon the time interval used to average the weather, and is generally not the same, for example, over every year, decade or century. In a general sense, therefore, the physical basis of climate includes the physical basis of weather, but in addition to the average behaviourof the atmosphere, the scientific definition of climate also includes the average behaviour of the oceans, the b~haviour of the world's ice masses, and the condnion or state of the land surface and its associated vegetation. Each of these elements is linked together in a worldwide climatic system with changes in one part generally affecting the behaviour of other parts, and setting in motion a chain or sequence of effects which may either reinforce or cancel the original change. The range of the possible mechanisms causing changes of climate is therefore rather broad, and the observed variations of past climate represent the attempts of the entire system to reach an equilibrium. Because the ocean, however, changes much more slowly than does the atmosphere, while the ice fields and the character of the Earth's land surface change even more slowly, it appears that the climate never reaches a steady state, and is destined forever to oscillate between one extreme and another over long periods of time. Although these changes are so slow as to be almost imperceptible compared to the daily changes of weather, over hundreds and thousands of years they can produce climates as different as the present summer and winter. The spectrum of climatic change is made even broader by the influence of conditions normally considered to be outside the climatic system, such as astronomical changes in the radiation from the sun and changes in the distribution of the Earth's oceans and continents over geological time.
The climate and its change hang in the balance among such processes, and it is therefore understandable that a variety of climatic changes may be occurring simultaneously in different parts of the world. Unravelling the course of these changes and organizing their characteristics in terms of physicai causes form the scientific challenge of the climate problem. In this paper I shall attempt to describe the nature of the physical basis of climate in more detail, and to summarize both the origins and limitations of our present understanding of the physical basis of climatic change.
2. The Climatic System
Having noted that the climate involves, in addition to the atmosphere, the oceans and other surface waters, the world's ice masses, the surface soil and vegetation, and the geophysical features of the Earth itself and its relation to the sun, these physical entities may be conveniently grouped into the five components of what we may call the climatic system. Thus, the complete climatic system consists of the atmosthere (comprising the Earth's gaseous enve~e and its aerosGls), the hydrospherecomprising the liquid water distributed on or beneath the Earth's surface), the cryosphere (comprising the ice and snow on and beneath the surface), the surface lithosphere (comprising the rock, soil and sediment of the Earth's surface), and the biosphere(comprising the Earth's plant and animal life,. and, by e~tension, man himself). Each of these components has quite different physical characteristics, and i& linked to the others by a wide variety of physical processes.
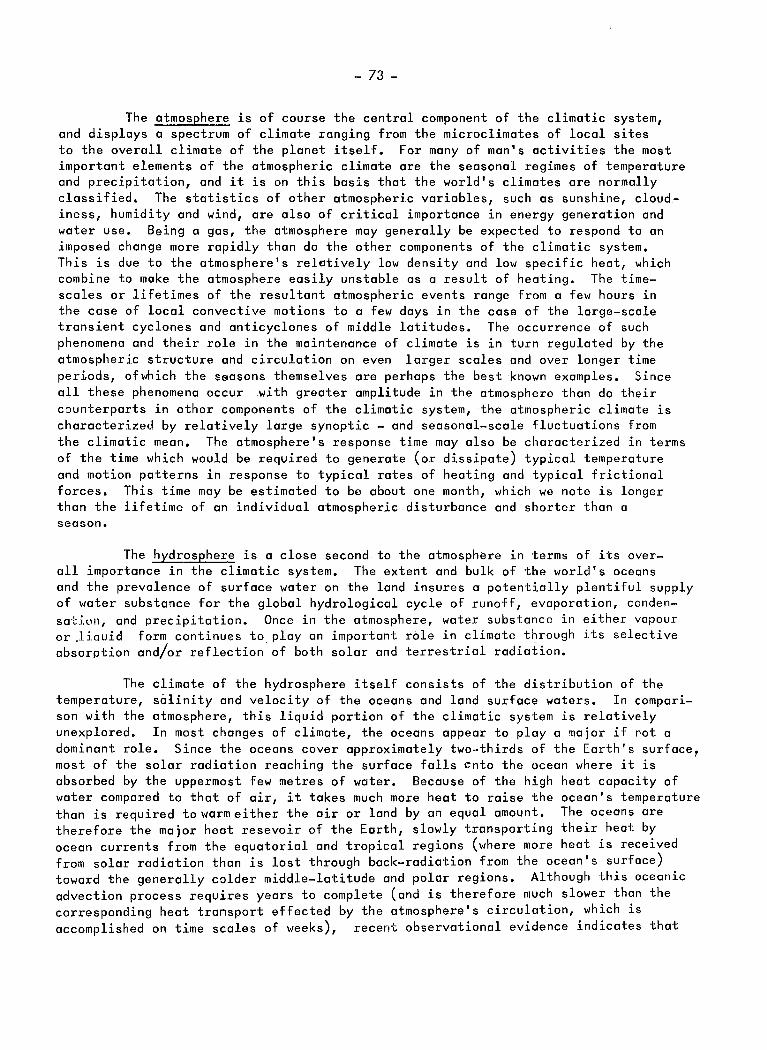
- 73 -
The atmosphere is of course the central component of the climatic system, and displays a spectrum of climate ranging from the microclimates of local sites to the overall climate of the planet itself. For many of man's activities the most important elements of the atmospheric climate are the seasonal regimes of temperature and precipitation, and it is on this basis that the world's climates are normally classified. The statistics of other atmospheric variables, such as sunshine, cloud~ iness, humidity and wind, are also of critical importance in energy generation and water use. Being a gas, the atmosphere may generally be expected to respond to an imposed change more rapidly than do the other components of the climatic system. This is due to the atmosphere's rel~tively low density and low specific heat, which combine to make the atmosphere easily unstable as a result of heating. The timescales or lifetimes of the resultant atmospheric events range from a few hours in the case of local convective motions to a few days in the case of the large-scale transient cyclones and anticyclones of middle latitudes. The occurrence of such phenomena and their role in the maintenance of climate is in turn regulated by the atmospheric structure and circulation on even larger scales and over longer time periods, ofwhich the seasons themselves are perhaps the best known examples. Since all these phenomena occur with greater amplitude in the atmosphere than do their counterparts in other components of the climatic system, the atmospheric climate is characterized by relatively large synoptic - and seasonal-scale fluctuations from the climatic mean. The atmosphere's response time may also be characterized in terms of the time which would be required to generate (or dissipate) typical temperature and motion patterns in response to typical rates of heating and typical frictional forces. This time may be estimated to be about one month, which we note is longer than the lifetime of an individual atmospheric disturbance and shorter than a season.
The hydrosphere is a close second to the atmosphere in terms of its overall importance in the climatic system. The extent and bulk of tbe world's oceans and the prevalence of surface water on the land insures a potentially plentiful supply of water substance for the global hydrological cycle of runoff, evaporation, ccndensati011, and precipitation. Once in the atmosphere, water substance in either vapour or .liauid form continues to play an important role in climate t~rough its selective absorption and/or reflection of both solar and terrestrial radiation.
The climate of the hydrosphere itself consists of the distribution of the temperature, salinity and velocity of the oceans and land surface waters. In comparison with the atmosphere, this liquid portion of the climatic system is relatively unexplored. In most changes of climate, the oceans appear to play a major if not a dominant role. Since the oceans cover approximately two-thirds of the Earth's surface, most of the solar radiation reaching the surface falls cnto the ocean where it is absorbed by the uppermost few metres of water. Because of the high heat capacity of water compared to that of air, it takes much more heat to raise the ocean's temperature than is required towarmeither the air or land by an equal amount. The oceans are therefore the major heat resevoir of the Earth, slowly transporting their heat by ocean currents from the equatorial and tropical regions (where more heat is received from solar radiation than is lost through back-radiation from the ocean's surface) toward the generally colder middle-latitude and polar regions. Although this oceanic advection process requires years to complete (and is therefore much slower than the corresponding heat transport effected by the atmosphere's circulation, which is accomplished on time scales of weeks), recent observational evidence indicates that
- 74 -
the oceans actually transport more heat than does the atmosphere. Much of the heat stored in the ocean's surface water is released to the atmosphere on seasonal time scales through direct conduction in those regions where the ocean is warmer than the overlying air, and through evaporation. Longer time scales (of the order of decades to centuries) are introduced by the relatively slow rate of communication between the ocean surface layers and the deeper waters, and by the large thermal and mechanical inertia of the oceans themselves.
The cryosphere, like the hydrosphere, consists of pertions closely associated with the sea and po~tions associated with the land. The importance of the cryosphere to the climatic system lies more in connexion with the highly reflective character of~ow and ice than with its thermal properties or fresh water storage. When a~ow surface is present over land, or when a layer of sea ice is present over the ocean, the surface albedo is greatly increased, which in turn tends to favour a colder lo~al climate through the reduction of surface heating. In the Northern Hemisphere a considerable portion of the land is covered by snow and ice each winter, while in the Southern Hemisphere the ice pack surrounding Antarctica undergoes a dramatic wintertime expansion. In addition to these seasonal cryospheric changes, significant variations also occur over much longer periods. In response to gravity, the ice in a mountain glacier moves slowly downward and outward, and over a century or so may either greatly expand its area or disappear altogether, depending upon the local snow accumulation and temperature. Such glaciation also occurs on continental dimensions, and the ice sheets now covering much of Greenland and Antarctica, and those which have covered parts-of Europe and North America in time past, have lifetimes measured from tens of thousands to millions of years, depending upon whether the climate (which the ice sheets themselves help to determine)was favourable or unfavourablefor their growth a,d maintenance. Extensive ice masses may also have an indirect irifluence on climate by lowering the level (and hence reducing the area) ~f the sea during periods of extensive glaciation.
The surface lithosphere, in contrast to the atmosphere, hydrosphere and cryosphere, is a relatively passive component of the climatic system. The distribution of surface rock, soil and sediment serves to regulate the temperature of the land surface on diurnal and synoptic time scales, and is usually taken as a fi~ed element in the determination of the climate. On a time scale of hundreds to thousands of years, however, the character of the land surface is itself determined to some extent by the regimes of surface temperature, rainfall and wind. The topography of the Earth's surface, including the distribution of mountains and the distribution of the oceans and continents themselves, is determined by geological processes over tens to hundreds of millions of years. The climate on these time scales must have been profoundly affected by the changing shape of the world's ocean basins as a~sult of sea-floor spreading and continental drift. The periods of major glaciation during the Earth's history are also periods when the continents were beneath the Earth's rotational poles, and may also have been periods of major volcanic activity.
The final component of the climatic system--the surface biosphere-- interacts with the other components primarily on time scales which are characteristic of the life cycles of the Earth's vegetative cover. Most prominent among these is the seasonal cycle of plant growth in response to the seasonal variations of solar radiation, temperature and rainfall. The trees, plants and ground cover in turn modify

- 75 -
the surface radiation balance and the surface heat and moisture fluxes, and play a major role in the seasonal variations ~local surface hydrology. Such biospheric effects are at a minimum in dese~±regions, although there is evidence that the stability and lateral extent of the deserts themselves are influenced by the vegetation in the surrounding areas. Over time scales of hundreds to thousands of years, the surface biomass is known to be closely linked with the prevailing atmospheric and hydrospheric climate, and the record of fossil species as preserved in soils and sediments serves to document the progression of ancient climatic regimes.
Although sometimes not considered as part of the climatic system, many of man's activities have signifcantly altered the Earth's vegetative cover, and hence interfered with the natural biospheric component of climate. Over time scales of hundreds to thousands of years, man's land clearing, and agricultural and grazing activities have changed the character of large p~ions of the Earth's surface, and may have had a greater effect on climate than has the more recent (and more publicized) industrialization.
3. The physical processes of climate
The response times of each component of the climatic system discussed above are the result of the dominamprocesses which characterize the physical behaviour of that component. In the case of the atmosphere and ocean--the more mobile components of the system--these include the transfer of fluid properties such as momentum, temperature, and suspended or dissolved constituents by both large-scale organized motions (advection) and small-scale turbulent motions (diffusion), vertical overturning as a result of hydrostatic instability (convection), the selective absorption and emission of radiation, and (in the case of the atmosphere) the release of latent heat accompanying condensation. The occurrence of these processes in the ocean and atmosphere is in turn regulated by the dynamical motions characteristic of the atmosphere and ocean, such as thermally-direct convective circulations, inertial-gravity waves, and planetary waves. These motions are the fluid's natural responses to the forcing represented by the sources and sinks of momentum and heat and their amplitude is controlled by the distribution of mass, momentum and temperature and by the dimensions and physical properties of the fluid. Together with the rotation of the Earth, these properties basically determine whether the climate is dominated by convective circulations (as in lower latitudes) or by transient baroclinic disturbances (as in middle and higher latitudes). In this sense we may regard the local distribution of the oceans and water sources (hydrosphere), land and sea ice (cryosphere), continental topography (surface lithosphere) and surface vegetation (biosphere) as combining with the larqescale atmospheric properties to determine the climate on specific continefital and regional scales.
The physical processes responsible for the maintenance of climate may also be viewed in terms of those which act between the various components of the climatic system. Of particular importance among such coupling or interaction processes are those between the atmosphere and ocean. As noted previously, the surface layers of the oceans absorb most of the solar radiation reaching the Earth's surface, and in turn transfer much of this heat to the atmosphere. The larger part of this ocean-atmosphere heat exchange occurs as evaporation, which represents a latent heat transfer
- 76 -
from the ocean to the ai~ heat which is subsequently realized at the site of condensation. This flux is effected by the turbulent motions in the lower atmosphere, and is dependent upon the surface air's humidity (or low-level vertical moisture gradient) and the surface wind speed. Depending upon the temperature of the surface air in relation to that of the surface itself (or low-level vertical temperature gradient) these same turbulent motions also effect a transfer of sensible heat between the surface and the overlying air. There are similar transfers of heat and moisture between the atmosphere and land surfaces as a function of the land surface character, roughness and vegetative cover, and between the atmosphere and snow-and ice-covered surfaces. These processes represent the principal interactions between the atmosphere, surface lithosphere and cryosphere.
The transfer of momentum among the climatic system's components consists primarily of turbulent frictional transfers from the atmosphere to the underlying surface. In the case of land and ice surfaces, this surface frictional drag represents the principal mechanism for the dissipation of the atmosphere's kinetic energy, while in the case of the oceans it represents the major driving force for the system of large-scale currents. Although these currents represent a major resevoir of fluid momentum, this is generally not made available to the atmosphere and the ocemn currents are generally regulated by processes within the oceans themselves.
The complete climatic system may be regarded as a single physical system whose behaviour is subject to a. set of geophysical conditions outside the system. From this viewpoint, the external boundary conditions of the climatic system are the astronomical variations of solar radiation at the top of the atmosphere, the compo~ sition of the atmosphere, the size, shape and rate of rotation of the Earth, and the topography of the Earth's crust, includingth~distribution of mountains and the geometry of ocean basins. These external conditions have themselves changed markedly over the course of the evolution of the planet Earth, with a consequently profound influence on the evolution of climate over the Earth's history. Without the oceans, the Earth's atmosphere would probably not have evolved into its present oxygen-rich state, nor would the atmosphere contain the water vapour necessary to provide nourishing amounts of rainfall. Recent studies have shown that the other planets have not been as fortunate: the atmosphere of Venus, for example, consists largely of carbon dioxide gas at very high termperatures and pressures, with an almost complete cover of sulphuric acid cloud, while the thin and cold atmosphere of Mars is also principally carbon dioxide with large amounts of suspended dust. These climates, like the Earth's have evolved over billions of years, and, again like the Earth's, may either ameliorate or assume further harshness in the course of time.
For a given configuration of external boundary conditions, it is convenient to assume that there is a uniquely corresponding climate, although the climate may depend upon the time evolution of the external conditions as well. The evidence of the Earth's climates over the last several hundred million years or so comes from a variety of biological and geological sources. The deposits of coal and oil, and the existence of many species of prehistoric animals, are clear evidence of ancient climates which were somewhat warmer and wetter than those now observed. This evidence coincides with the period during which the oceans assumed their present locations through the process of sea-floor spreading (or continental drift), as a result of
- 77 -
which the Earth's climates must have undergone substantial changes even though the atmosphere itself was then approximately the same as now. During the last million years or so (the so-called Pleistocene epoch), evidence of the nature of past climates comes from the layered records laid down in the sediments on the ocean floor and in the semipermanent ice sheets of Greenland and Antarctica. By analyzing the distribution of surface-dwelling micro-organisms found in the layers of ocean sediments, paleontologists have been able to reconstruct the record of temperature variations at the ocean surface over the last several hundred thousand years~ while the distribution of oxygen isotopes found in ancient ice layers provides a record of the variations of the total volume of ice present, These sources combine to yield a picture of past climate which is dominated by the occurrence of relatively cold ice ages about every lOO 000 years~ Recent studies have indicated that this 100 000-year cycle, as well as shorter ones of about 40 000 and 20 000 years' length, are related to variations in the distribution of solar radiation caused by astronomical changes of the Earth's orbit about the sun and of the orientation of its axis of rotation. From this viewpoint, the Earth has been in an interval between ice ages (or interglacial) for the last several thousand years, and will be for several thousand years more unless other factors intervene (see overview papers by Hare, Gerasimov and Flohn).
Because of the complexity of the climatic system, it has proven convenient to focus on one portion of the internal system at a time while regarding the other portions as fixed or as part of the external system. Thus, over time scales of seasons the atmosphere is commonly considered as the sole internal component of the climatic system, with the properties of the ocean, ice and land surface treated as boundary conditions. When the time scales of interest extend over interonnual ranges, the atmosphere and ocean are considered together as the internal components, while over longer periods, the ice and land surface character must also be treated as variable rather than fixed portions of the system. Aside from simplifying the mathematical treatment, this procedure leads to the identification, as possible causes of climatic change, of each of the conditions or processes that influence the climatic system. Many of these effects are in reality linked to longer-term variations within the total system, and therefore cannot be regarded as fundamental causes of climatic changes under all circumstances. If we extend this reasoning to those factors which are truly external to the system, then we may be unable to identify any of them as fundamental causes of climatic change in the sense that the Earth has necessarily undergone a unique climatic history.
In the analysis of the climatic system, it is also convenient to develop a scientific definition of climate. From the above discussion, it is clear that such a definition should be applicable to any or all components of the system over a wide range of time scales. A logical defirJtion of climate would therefore be the complete description of the statistical state of the internal climatic system over a specified time period, together with a description of the boundary conditions. Such a description may be called a climatic state, and includes not only the time averages of the various physical variables, but the variances and higher order statistics as well. We may thus identify individual monthly, seasonal or annual climatic states of the atmosphere, for example, in terms of the averages, variances and other statistics of the various atmospheric variables over these periods, with the accompanying oceanic, cryospheric and land surface data regarded as boundary conditions. The conventional 30-year climatological averages are therefore a special
- 78 -
case of such a climatic state for the atmosphere, although even here many of the statistics needed in order to define the state completely are unavailable over many regions of the world. The climatic state of the whole climatic system requires similar data for the hydrosphere, cryosphere, land surface and biosphere as well, and such statistics have generally not been assembled in a systematic fashion.
This interpretation of climate permits us to define a climatic variation or change as simply the difference between two climatic states of the same kind, such as the difference between two Januaries or between two decades. Since the description of each climatic state includes information on the means, variances and other statistics for the particular time period selected, a climatic variation will generally include a change of the variance and of other statistics as well as the change of the time-averaged variables themselves. In some cases a change of the variance of temperature during spring, for example, may be a more important aspect of a climatic variation than a change of the average temperature itself. We may also introduce the concept of a climatic anomaly (defined as the departure of a particular climatic state from the average of a number of such states, such as the climatic anom~ly of a particular January) and the concept of climatic variability (defined as the variance among a number of climatic states of the same kind, such as the variability of January climates) (see overview paper by Hare for a slightly different usage).
These definitions of the climate's behaviour over arbitrary time periods (of a month or longer) are especially useful in practical climatic work. Since our observations of the atmosphere, ocean and other parts of the system are necessarily made aver specific time periods, the assembly and analysis of these data in terms of the corresponding states are both convenient and natural. We may also note that the simulated climatic data furnished by physical and mathematical climate models also usually apply to specific time periods, and each soch solution or integration therefore defines particular climatic states.
Regardless of how the climate is defined, the notion that the Earth has a single and unchanging climate must be abandoned. Both modern observational data and the increasing store of indirect or proxy paleoclimatic data assembled from such sources as ocean sediments, soil ~nd ice structure, and tree rings, for example, show that the climate is constantly changing. Hence, while climate generally has a simpler distribution in space than the weather from which it is derived, it has a more complex structure in time. From a physical point of view the climate is therefore just os complicated a system as is that of weather, and, like the weather, may possess only limited predictability.
4. The problem of climatic change
From the preceding discussion it may be seen that the physical processes responsible for the maintenance of climate ore also those responsible for climatic variations. While our understanding of the physical basis of climate may be described as reasonably satisfactory (in the sense that we can at least identify the various processes involved), we hove only limited knowledge of how or why certain of these processes interact to produce a climatic change. The methods by which climatic change has been studied are the analysis of observational data and the use of

- 79 -
mathematical models designed to simulate the system's behaviour. The observational approach is the source of our knowledge of the distribution of present climate5 over the Earth, and has yielded much empirical information on the nature of past climates as well. In terms of the past behavio~of the climate, these data may also be used to estimate the statistical likelihood or probability of future climatic changes, although we have no firm reason to expect that the past will be prologue. The modelling approach, on the other hand, seeks to reconstruct the relationship among the variables of the climate in terms of the physical laws believed to govern the system. The resulting models may then be solved on modern computers, and used to prepare a numerical forecast of the system's future behaviour from which a future climatic state may be extracted. Used in this way, a number of climate models have shown considerable skill in reproducing the present climate of the Earth, as well as that at selected times in the past. It is interesting to note that if man's increasing alteration of the environment results in the introduction of previously unknown influences on the climate, the modelling approach ~s the only method which can be used to predict the course of future climate.
The complexity of the climatic system and the large number of interrelated physical processes acting at different rates within and between its various components make the identification of the cause of a climatic variation a difficult task. It seems likely that there is no single cause in most instances, and that the relative importance of different effects depends strongly on the time and space scales of the climatic states being considered. For example, interannual differences in sea surface temperature and total heat stored in the ocean may be related to the year-to-year variations of atmospheric circulation, while the interannual differences in the extent of mountain glaciers are probably not. On the other hand, changes of continental glaciation are probably related to variations in the Earth's orbital parameters over periods of tens to hundreds of thousands of years, and therefore related to changes of sea-surface temperature over similar time periods. Climatic variation may also occur as the result of a change in the effective internal driving mechanism~ with no change in the external conditions. The inherent irregularity of the weather itself is sufficient to ensure that the atmospheric driving mechanisms will not operate in a perfectly smooth or cyclic way, thus yielding the typically irregular records of climate noted earlier.
The physical mechanisms involved in climatic changes characteristically involve a coupling or mutual compensation among two (or more) variables of the system. Such interactions or feedback mechanisms may either act to amplify the value or anomaly of one of the interacting variables (positive feedback) or to damp it (negative feedback). Of the many such feedback processes in the climatic system, some of the better known ones involve the heat balance at the Earth's surface. For example, the snow-cover albedo-temperature feedback is a positive feedback process, in which an increase of snow (or ice) extent increases the surface albedo, and thereby contributes to a lowering of the surface temperature. This in turn (all else being equal) may lead to a further increase of the extent of snow or ice, reinforcing the initial anomaly. Another familiar example of a positive feedback process is the water vapour-temperature feedback, in which an increase of the amount of water vapour (or absolute humidity) increa~es the absorption of long-wave radiation, and thereby contributes to a warming of the atmosphere. This in turn may result in an increase of evaporation and an augmentation of the initial humidity anomaly even though the
- 80 -
relative humidity may remain nearly constant. This positive feedback operates virtually continuously in the atmosphere, and (along with C02) is responsible for the well-known greenhouse effect.
An example of a negative feedback is the coupling between sea surface temperature and the surface circulation in both the ocean and atmosphere. In this sea surface temperature-circulation feedback an initial warm anomaly of sea surface temperature induces a local atmospheric warming and lowering of the atmospheric surface pressure. This in turn induces a local cyclonic atmospheric circulation which serves to deflect the surface water outward and away from the initial anomaly through the action of surface wind friction. An upwelling or Ekman pumping effect follows, in which generally colder water beneath the surface is brought upward to replace the diverging surface water, with the result that the initial warm surface temperature anomaly tends to be dissipated.
While we know of many such feedbacks in the climatic system, it is likely that there are others yet to be identified. All such feedbacks, however, represent a considerable simplification of the operation of the actual physical system, and the key phrase in their description is "all else being equal." In a system as complex as climate, this is usually not the case, and an anomaly in one part of the system may be expected to set off a whole series of adjustments, depending on the nature, location and size of thein~ial disturbance. The difficulty of tracing such adjustments makes the net effect of individual feedback processes notoriously uncertain in most cases, although they often serve os the basis of more quantitative diagnostic or modelling studies. In any event, we recognize that any positive feedback must be effectively checked at some level by the intervention of other processes, or the climate would exhibit a runaway behaviour. Climatic change may therefore be viewed in terms of a continuous adjustment among compensating feedbacks, each of which behaves in a characteristically nonlinear fashion. The fact that the Earth's climate has varied between what are actually relatively narrow limits is testimony to the efficiency (and delicacy) of the feedback processes.
Our knowledge of the physical basis of climate and climatic variation is most usefully andcomprehensively organized in terms of the physical laws which govern the system's behaviour. For the atmosphere, these laws are expressed by the set of conservation equations which describe the changes of the air's velocity, temperature, pressure and moisture content--the so-called primitive atmospheric equations. In brief, these equations state that the rate of change of the wind speed is determined by the law of conservation of momentum, in which the effects of the air's horizontal and vertical movement are considered, together with the effects of the Earth's rotation and the forces of pressure, gravity and friction; that the rate of change of the air's temperature is determined by the law of conservation of heat energy, in which the effects of horizontal and vertical motions and the existing temperature distribution are considered, together with the effects of diabetic heating due to radiation, conduction and latent heat release; that the rate of change of the air's pressure is determined by the low of conservation of mass, in which the effects of the horizontal and vertical transports of air are considered; and that the rate of change of the air's moisture content is determined by the law of conservation of water substance, in which the horizontal and vertical transports of water vapour are considered, together with the effects of evaporation, sublimation and condensation. A similar
- 81 -
set of dynamical equations describes the behaviour of the oceans and ice masses, while the surface lithosphere and biosphere are usually represented by more empirical relationships.
These mathematical equations are basically the same as those which are routinely used in numerical weather prediction, except that in their application to climate more attention must be given to the representation of the slowly-varying sources and sinks of momentum, heat and moisture which may be relatively unimportant on the time scales of weather. Since it has previously been noted that these processes occur over a wide range of space scales, and since it is impossible to observe (or to calculate) these effects on those smaller scales where the behaviour is essentially turbulent, the governing equations are usually specialized for the larger scales of atmospheric behaviour, i.e., those occurring over horizontal and vertical distances of several hundred kilometres and a few thousand metres, respectively. The processes on smaller (and hence unresolved) scales are therefore represented or parameterized in terms of variables on these larger resolved scales.
Once the necessary boundary conditions are assigned (which in the case of the atmosphere, for example, may be taken as the distribution of sea surface temperature the surface elevation and albedo, and the solar radiation at the top of the atmosphere), these equations and their associated parameterizations presumably are capable of describing the changes of the larger scales of climate if they can be successfully integrated over the necessary periods of time. Because these equations are so complex, however, it has been necessary to introduce further simplifications. The resulting formulation is commonly referred to as a climate model , and includes the approximations generally necessary to solve the equations by numerical methods. Because of these approximationsj a climate model inevitably introduces distortions of the true physical processes of the climatic system, and therefore distorts the portrayal of any simulated climate and climatic change (see overview papers by Mason and Marchuk).
The most complete and detailed climate models are known as general circulation models (or GCMs), of which there are perhaps a dozen significantly different versions for the atmosphere and/or ocean. When used with modern boundary conditions, the typical atmospheric model is capable of satisfactorily simulating almost all of the large-scale features of the climate as now observed, including the average distribution of pressure, temperature and wind both near the surface and aloft. The models simulate observed patterns of those variables associated with small-scale processes such as the cloudiness and rainfall with less accuracy, although even here the models' skill is unmistakable. More important, however, is the fact that such models are able to reproduce the seasonal changes of climate from summer to winter; this annual display of the atmosphere's and, to a lesser extent, the ocean's sensitivity to the sun's radiaton is the best-documented climatic change we have, and provides an excellent model calibration. These models have been less successful, however, in reproducing the variance and higher order statistics of the atmospheric climate on interannual time scales.
Since the atmospheric general circulation models are able to reach climatic time scales only by a cumulative step-wise numerical integration during which the behaviour of individual mid-latitude atmospheric cyclones and anticyclones is simulated

- 82 -
in some detail, the climatic states and hence any climatic variation derived from such integrations inevitably contain a sampling error due to to the presence of disturbances. Unless an integration is carried out for a relatively long,time or unless a number or ensemble of experimental realizations is available, a climatic variation of physical origin may remain undetected within these essentially statistical fluctuations. The separation of a possibly significant climatic change signal from such essentially unpredicatable climatic noise is therefore an important aspect of climatic research with such models.
In spite of the power and generality of the GCMs, at least certain aspects of the climatic system can be successfully depicted with models of considerably less sophistication. These simplified models are usually based upon a one- or two-dimensional representation of the energy balance of the climatic system, for example, or upon a zonally-averaged version of a more complete three-dimensional model. Such statistical-dynamical models do not attempt to simulate the detailed behaviour of synoptic-scale disturbances, and are therefore capable of economically simulating long-term climatic states with little or no climatic noise. This ability is achieved, however, at the price of possibly unsatisfactory distortions of critical climatic processes and a consequent misrepresentation of climatic variations simulated by such models. Depending upon how such simplifications are introduced, it is also possible for such models to yield more than one solution for the climate under the same boundary conditions. Whether this lack of uniqueness is also shared by the more comprehensive models has not yet been established, but the mere possibility of such an indeterminancy in the climate suggests an inherent limitation to climate prediction.
Even the best model, however, is not yet able to predict the change of the average climate over the next year, decade or century, or even the change from, say, one winter to the next. This is partly the result of error~ and inadequacies ift the models themselves (not the least of which is their neglect of the coupling between the atmosphere and the ocean), and partly due to an inherent lack of predictability in the atmosphere and oceans themselves. Recent theoretical and numeri~al studies have shown that the detailed behaviour of the atmosphere cannot be predicted by any method for longer than about two weeks' time, a limit, we may note, which current weather forecasts have certainly not yet reached. Beyond this time, our inability to observe and follow every part of the atmosphere in minute detail eventually destroys whatever ability our models may have in predicting the local sequence of the weather over longer time periods. As we have already noted, however, this circ~mstamce does not prevent us from calculating the statistical properties of the climate under conditions such as have occurred in the past or may occur in the future, even though we may not be able to trace the detailed course or time evolution by whi~h such a past or future climate evolves. S~ch ~ ~alculation is sometimes called a climatic scenario, and is like taking a snapshot of a supposedly equilibrium climate without knowing how or at what rate that particular climate came into being.
Even though the limits of the predictability of climatic change are not yet fully understood, the calculation of future climates can still be made by the scenario method discussed above. Some of the most challenging scenarios we can produce with our climate models are those concerned with the possible effects of man's activities on the future climate, of which the problem of the effects of
- 83 -
carbon dioxide in the atmosphere is perhaps the most important. Since the industrial revolution began in earnest in the mid-nineteenth century, man has consumed increasing amounts of coal, oil and natural gas as part of his accelerating industrialization and rising standard of living. Part of the carbon dioxide which results from this combustion of fossil fuels is taken up by the Earth's surface vegetation, arid port is absorbed by the surface waters of the ocean and slowly mixed downward into the deeper water. The rate of C02 production, however, has overwhelmed these natural removal processes, and the amount of C02 resident in the atmosphere has increased steadily since about 1880. At the present time the atmosphere contains about 15 per cent more C02 than it did only a century ago. The importance for the climate of this seemingly small change lies in the effect C02 exerts on the atmosphere's temperature through its strong absorption of the long-wave or infrared radiation emitted by the Earth as part of the planetary radiation balance. This absorption serves to maintain the temperature in the lower atmosphere at a somewhat higher level than would otherwise be the case. With increasing C02, the atmosphere's temperature tends to rise even further.
If the atmospheric C02 continues to increase at the nearly exponential rate indicated by recent measurements, it is estimated that its concentration will nearly double its present value sometime early in the next century. Should this circumstance occur, as seems inevitable from current and projected fossil fuel usage, preliminary model calculations indicate that the average temperature near the surface will rise by several degrees C. Such a change is sufficierit to have a serious impact on the yields of the world's major agricultural regions, and could trigger other, as yet unforeseen, changes of climate. This prospect is made even more serious by the projections that a second doubling of atmospheric C02 concentration may occur as early as the middle of the twenty-first century if present trends continue~ in which case the global warming may amount to a climatic catastrophe. Although the slow removal processes of the ocean would eventually come to our rescue, the Earth would enter a period of warmth greater than it h~s e~er experienced, and which would, moreover, last for several hundred years. If further research confirms this scenario, the C02 -climate problem appears destined to become the major environmental crisis of the future, and its resolution will be a prime factor in the world's future energy strategy (see overview papers by Munn, Flohn, Bolin, Fedorov and Baumgartner).
The need for intensified research on the dynamics of climate is underscored by our ignorance of the possible .near-term climatic effects of many other processes, both natural and man-made. In addition to the effects of solor radiation mentioned earlier, these include the effects of both surface and volcanic dust, chemical contamination of the atmosphere, and large-scale land clearing, irrigation and urbanization on the all-important heat balance of the Earth. The needed research should also include efforts to collect and analyze additional observations of the actual behaviour of the global atmosphere and ocean, especially those now possible from satellites, and to develop improved models of the coupled ocean-atmosphere system. With such tools, a systematic exploration of past, present and possible future climates may be undertaken in a physically consistent manner. Plans for such a long-range programme are now being considered by various governments and by
- 84 -
the World Meteorological Organization, and an undercurrent of renewed interest in the age-old question of climate is evident in the world's research community. The almost incalcuable value which an understanding of the physical basis of climate and its changes would have for man's year-to-year agricultural and industrial activities, and for his longer-range welfare and resource planning, justifies our best efforts toward this goal.
SELECTED REFERENCES
Lorenz, E.N. (1967). The Nature and Theory of the General Circulation of the Atmosphere, World Meteorological Organization, Geneva, 16lpp.
Gates, W.L. (1975). Numerical modelling of climate change: A review of problems and prospects. Proc. WMO/IAMAP Symposium on Long-term Climatic Fluctuations (Norwich, 18-23 August 1975), WMO No. 421, World Meteorological Organization, Geneva, pp. 343-354.
Global Atmospheric Research Pr~gramme, 1975: The Physical Basis of Climate and Climate Modelling (report of the International Study Conferenae in Stockholm, 29 July-10 August 1974). GARP Publications Series No. 16, World Meteorological Organization - International Council of Scientific Unions, Geneva, 265 pp.
MODELLING OF CLIMATIC CHANGES
and
THE PROBLEM OF LONG-RANGE WEATHER FORECASTING
G.I.Marchuk*
1. Introduction
When studying climate it is essential to know what changes or fluctuations have occurred in terms of the characteristic time scales that are involved, i.e. thousands, hundreds or tens of years. We are therefore concerned respectively with epoch-long climate, century-long climate or so-called "locally-temporal" climate.
Each of the climates has its own temporal and spatial averageing scales for meteorological characteristics and its own statistical fluctuations and correlations. Thus, for epoch-long climate the century-long changes are statistical fluctuations; for century-long climate the corresponding fluctuations are locallytemporal changes; for locally-temporal climate the statistical fluctuations are annual and seasonal weather changes. For estimations of tendencie~ in climate, century-long and locall~temporal climate changes are naturally of major importance. But locally-temporal fluctuations of climate, i.e., changes over decades, represent the most urgent problem involving climate forecasting for individual large regions of the globe over periods of twenty years or more. Studies of natural locally-temporal climatic fluctuations of recent occurrence may be undertaken with the actual data for direct verification of forecasts of climatic fluctuation.
In the Report of the International Study Conference on "The Physical Basis of Climate and Climate Modelling" it is emphasized that "the physical processes responsible for climate include those involved in weather. Primary among these processes is the rate at which heat is added to the climatic system, the ultimate source of which is of course the sun's radiation. The atmosphere and the ocean respond to this heating by dev~opfug winds and currents, which in turn serve to transport heat from regions where it is received in abundance to regions where there is a thermal energy deficit".
However, in the physical proce~ses that produce the ~arth's climate, the factors regulating weather conditions are not manifested in explicit ways and are even more obscure in the processes responsible for climatic changes.
Internal interactions in the atmosphere over time scales ranging from 10-l to 10 days are connected basically with weather phenomena, whereas oceanic processes over time scales from a month to 103 years are generally related to climatic
* Central Computing Centre, Siberian Academy of Sciences, Novosibirsk, USSR.

- 86 -
variations. Estimates show that pole ward -directed heat transports in the atmosphere and ocean are comparable in value. This means that the world's oceans play an important role in forming climate and its changes~
The problem of developing a hydrodynamic model of climate capable of explaining and predicting atmosphere-ocean interaction is of enormous complexity.
The empirical studies by 8 j erknes, _ Wyrtki, and Namias of the influence of persistent sea surface temperature anomalies on the atmospheric circulation are of the greatest importance. These anomalies are relevant to the practice of long range weather forecasting which may be regarded as a preliminary approach to problems of climate and climatic change. Further efforts by sqientists are required in order to obtain a fuller understanding of ocean-atmosphere interactions and their effects on climate. In these studies an important part may be played by diagnostic methods.
At the Computing Center of the Siberian Branch of the USSR Academy of Sciences techniques have been developed for determining active atmosphere-ocean exchange zones on the basis of non-stationary influence functions which are solutions to hydrodynamic conjugate equations. The influence functions make it possible to define the most important parts of the world's oceans responsible for developing mean temperature anomalies for different continents of the globe in any season of the year. According to Kurbatkin, climate arising as a result of the atmosphere-ocean interaction may be described a~ an alternation of seasonsi the characteristics of which are the result of processes occurring in the atmosphere or the ocean as well as in the northern or southern hemispheres. Some of the processes that take place in the oceans generate disturbances in the atmosphere and vice versa; other processes are effective mainly in their own medium,ocean or atmosphere.
Application of complex climate models in studies of possible climatic changes several years ahead is possible only if the models simulate with sufficient accuracy the present mean asymptotic state of the atmosphere. It should be also noted that man's activities pose a problem of climatic change of immediate importance. Practical aspects of the problem can be studied by means of hydrodynamic models with suitable uclimatic sources'' incorporating nonlineor statistical correlations. Actual data covering many years are used in the computations. In practical use these models with their "climatic sources" show that forecasting skills can be reached which are nearly as. high as those attained with the help of the most complex, high resolution models. Though this does not resolve the most important questions of the physical basis of climate, the use of actual data on the state of the atmosphere and the world's oceans over the previous more or less long period allows us, in fact, to carry out extrapolation of climatic changes some time ahead, In this sense the problem of estimating climatic changes on the basis of actual data becomes somewhat closer to that of the long-range weather prediction.
2. Climate models
In the past two decades, beginning with a nume~ical experiment by Phillips, we have witnessed an explosive development of ideas and of methods of numerical modelling
- 87 -
of the three-dimensional atmosphere. Phillips showed that, in spite of essential simplifications made in the original model, one can obtain solutions which give o qualitatively correct description of the fundamental characteristics of the atmospheric circulation. In the last 20 years we have gained basically an understanding of the physical processes that have to be described in the first place so as to simulate more or less correctly the basic characteristics of the atmosphere. In this respect fundamental contributions have been made by Smagorinsky and Manabe, Mintz and Arakawa, Leith, Kasahara and Washington in their works on mathematical simulation of the atmosphere's general circulation as well as by Charney, Thompson, Lorenz, Phillips, Gates, Obukhov, Monin, Miller, Kurbatkin, Kondratiev and many others who have studied the physics of large-scale circulations. The problem of describing the ocean thermodynamics and the atmosphere-ocean interaction processes has become the focus of attention of researchers in recent years.
Below we will discuss the most typical approaches to the solution of the above problems. To describe the atmosphere, practically all models use as a base primitive hydrodynamic equations in quasistatic approximation written in different co-ordinate systems. Numerical (finite-difference and spectral) schemes applied in this case ore, as a rule, constructed so as to conform with those conservation laws on the basis of which the original system of differential equations has been built. Among the variety of schemes being used we ought to single out Arakawa's scheme which under certain circumstances possesses two quadratic invariants and also uses finite-difference schemes which deal with the problem of nonlinear instability.
While the first numerical experiments with general circulation models were concerned with qualitative simulation of the basic properties of the atmospheric circulation, the objective now is to deal with quantitative simulation of climatic characteristics of the atmosphere and ocean.
One can construct a hierarchy of moJels to be used for modelling of climate and its variations on the principle of description of a system's dynamical characteristics. The simplest models, (i.e.those of ''zero" dimension) are models describing the atmospheric temperature, based on thermodynamical equations of energy balance (Budyko, Sellers, Schneider and others). Simple as they ore, "zero dimension" models can be used in studies of paleoclimate. More sophisticated one-dimensional models, the so-called models of convective radiative balance, allow the introduction of vertical distribution of atmospheric characteristics (Manabe, Wetherald and others) and, in our opinion, such models provide a possibility of simulating specific features ofcentury-long climate and also make it possible to study the effects due to the dynamics of the upper layer of the ocean.
Since it is impossible to simulate changes of the atmosphere's climate without describing the ocean dynamics we are confronted with the task of developing coupled atmosphere-ocean models. Simulations of coupled atmosphere and deep ocean circulation requires powerful computer facilities since the ocean itself, having large characteristic relaxation times, possesses a lesser deformation radius than the atmosphere, which in turn sets severe constnints on spatial resolution.
- 88 -
General ideas of the ocean dynamics simulation problems were influenced by the studies of Stommel, Sarkisian, Lineikin, Robinson, Veronis, Welander and others. By the present time a number of numericol models of the ocean general circulation have been developed on the basis of the equations of heat or density transport, momentum and salinity transport (Bryan, Sarkisian, Kochergin and others). However, even special finite-difference schemes do not completely remove the abovementioned difficulties associated with the ocean simulation,
As a further step for a class of problems it is reasonable now to develop models of coupled circulation of the atmosphere and the upper active layer of the ocean.
3. Estimation of climatic changes and the problem of sensitivity
At present mainly two approaches to the problem of climatic change are in the forefront. The first one presupposes the possibility of substantial changes of the century-long and locally-temporal climates due to weak stability of atmospheric processes, Under these conditions even comparatively small variations of parameters can produce very substantial climatic changes. Quantitative forecastingof possible climate changes in this case requires very precise models that are only now being formulated, Therefore one can only consider a possible realization of one or another qualitative picture of climate changes. This presents researchers with new problems of studying the physical mechanisms that create climate and of designing mathematical models of the climate system, rather than solves them.
The second approach is based on the hypothesis of relative stability of climate in respect to variations in parameters of the climatic system. This approach assumes that quantitative estimations of climatic changes may be derived from the theory of perturbations and thus lead to experiments in forecasting climate trends for the next few years using variations of parameters.
The above approaches to the study of climatic variations can be considered on the basis of theoretical studies of the sensitivity of mathematical climate models to modifications of input parameters. Sensitivity studies of a climate system should be directed towards investigating the performance ofclimate models in space and time when various (realistic) values of imput parameters are introduced. Sensitivity determines the degree of the system's stability with respect to variations of external stimuli and to changes of the internal structure of the models. Man's activities should be regarded as one of the factors of the climate system together with factors of natural origin.
Studies of climatic variations under the impact of human factors and factors of natural origin require that special mathematical techniques be developed for studying sensitivity of models to small perturbations of basic parameters which determine the state and the behaviour of the climate system. Methods of numerical simulation and the perturbation theory with the use of conjugat-e equations of the atmosphere and ocean circulation consititute the basis ~f such techniques.

- 89 -
The sensitivity of climate models is revealed by influence functions used in the solution of the problem being studied or by the functional form of the solution. In mathematical terms, the development of a sensitivity function reduces to the calculation of partial derivatives with res~ect to the solution being tried or sought or to the functions corresponding to the parameters of the model in the vicinity of unpertu~ values. The use of sensitivity functions makes it possible:
(a) to carry out qualitativeonalysis of climate models in order to assess the relative importance of physical factors and to plan numerical experiments;
(b) to formulate new problems concerned with the analysis and forecasting of hydrometeorological characteristics;
(c) to develop efficient and stable algorithms for estimation of the effects of small variations of parameters;
(d) to formulate and solve a number of inverse problems of identification of model parameters;
(e) to evaluate spatial and time scales of the effects of parameter perturbations.
An important question is to examine the resulting variations of solutions when input data and various functions are subjected to small perturbations. It has been found to be convenient to use equations obtained from the initial nonlinear system by means of linearization in the neighbourhood of unperturbed values of the input data.
In many cases, however, in order to estimate variations of functionals of the solution, it appears possible to use di~ect relations between variations of input data and of functionals. This relation is realized through sensitivity functions. To define sensitivity functions one uses data on unperturbedvalues of the fields and parameters being modelled, and the solution of the conjugate problem corresponding to a given functional.
It will be emphasized that perturbation theory formulae ought to be used when the required data are obtained on the basis of information about main climateforming sources, diagnostically calculated by means of meteorological and hydrophysical observations, using hydrothermodynamic equations, rather than from the solution~ the mathematical model of climate. This constitutes, we believe, the importance of the theory of perturbations in relation to the assessment of climatic changes.
4. Long-range weather forecasting and climate
The problem of weather forecasting up to two weeks in advance has been studied fairly thoroughly. The main active factors here are initial hydrothermodynamic fields in the atmosphere and the thermal state of land and oceans. Of great importance to the development of hydrodynamic long-range weather forecasting methods was a paper
- 90 -
by Blinova published in 1943, where an attempt was made to formulate a problem of long-range forecasting for a barotropic atmosphere, using a linearized vorticity equation. Analysis of the vorticity equation helped to define spectra of wave motions in the atmosphere and to construct the first hydrodynamic model of climate.
Essential in forming modern conce~tions of long-range weather forecasting methods were studies by the American meteoroLogists Smagorinsky, Leith, Mintz and Lorenz devoted to modelling of the general circulation of the atmosphere. Though these studies were not concerned with weather forecasting, they allowed some important conclusions to be made about: predictability of meteorological characteristics, fluctuations of the atmospheric system, relaxation times of periodic processes in the atmosphere, etc.
Further investigations by meteorologists, notably by Marchu~ and Adem, showed that more general formulations of the hydrodynamic weather forecasting problem were possible, which to some extent could ensure weather forecasting up to a season in advance. The mathematical theory of this approach, based on the use of conjugate hydrodynamic equations and on a specially constructed theory of perturbations, was developed at the Computing Center. The subject of these studies is long-range forecasting of monthly mean temperature anomalies averaged over large regions of the Earth and ranging from one month to a season. The aim of such a forecast is to determine the sign of the mean temperature anomaly. The thermal behaviour of the land and the hydrothermodynamics of the oceans become the main active factors of long-range weather forecasting.
Indeed, in a number of cases heavy warming of continents by direct sun's radiation and their subsequent cooling result in considerable temperature contrasts leading to important dynamical processes in the atmosphere and giving rise to remarkable weather anomalies. However, as a rule, these two factors do not act longer than two weeks. Thus, the problem of investigation of atmosphere-continent. interaction is closely connected with the forecast up to a month in advance. That is why the role of oceans increases as the forecasting range becomes longer, because they possess high thermal and mechanical inertia, whereas the atmosphere has low inertia. It seems that the most important initial condition of long-range weather forecasting is the temperature field in the active layer of the world ocean. As to the initial state of the atmosphere, its influence on processes of such a scale 1s usually insignificant.
Having processed a great amount of data some researchers, e.g., Namias, Musaeljan, established asynchronous relations between existing anomalies of the cloudiness field over some parts of the worlds ocean and anomalies of the temperature field developing over some continental regions after definite periods of time (sometimes of the order of several months).
The algorithm of long-range forecasting of the mean temperature anomaly of a region, based on integration of conjugate equations of atmospheric and oceanic hydrothermodynamics, makes it possible to define some of the above-mentioned asynchronous relations. Solution of the conjugate problem is an influence function of
- 91 -
space and time based on the meteorological data imput with respect to the temperature anomalies being predicted.
In contrast to the problem of the pre-calculation of climatic changes, information on the present state of the atmosphere and oceans, rather than climatic information on necessary parameters and imput data of the problem is now used to solve conjugate equations. Therefore, for any meteorological situation in the atmosphere and for any hydrophysical situation in the oceans, it is necessary to calculate the influence function characterizing the contribution of each of the processes for lesser or greater periods of time.
The purposes of long-range forecasting create special requirements for hydrometeorological information particularly in regard to data on the thermal and hydrodynamic state of the ocean, the thermal behaviour of land, boundaries of ice and snow cover, cloudiness, etc. Without such information long-range weather forecasting, even in its simplest form, when given the sign of mean temperature anomaly of the region, proves to be practically impossible.
To a still greater extent this applies to an estimation of climatic changes, which are closely connected with long-range developments, usually caused by largescale hydrothermodynamic transformations occurring in the world's ocean.
Under these conditions the establishment of a service of hydrophysical data on the state of the world's ocean, based on comprehenmve studies, using information from satellites of various kinds, automatic buoys, ships and aircraft, becomes a problem of paramount importance.
ADEM, J. (1975). temperatures.
SELECTED REFERENCES
Numerical-thermodynamical prediction of mean monthly ocean Tellus, 27, No. 6, pp. 541-551.
ARAKAWA, A.,and MINTZ, Y. (1974). The UCLA atmospheric general circulation model. Dept.of Meteorology, UCLA, L.A.
BJERKNES,J. (1966). A possible response of the atmospheric Hadley circulation to equatorial anomalies of ocean temperature, Tellus,28. PP• 820-829.
BLINOVA, E.N. (1943). Hydrodynamic theory of pressure waves and atmosphere centers of action. DAN SSSR, 39, No.7, pp. 284-287.
BUDYKO, M.I. (1972). Man's Impact on Climate. Hydrometeorological Publishing House of the USSR, Leningrad.
CHARNEY, J.G. (1971). Geostrophic turbulence. J.Atmos.Sci.28, pp. 1087-1095.
- 92 -
KASAHARA, A. and WASHINGTON, W. (1967). NCAR Global General Circulation Model of the Atmosphere. Mon.Weath.Rev., 95, No.7, pp. 389-402.
KOCHERGIN, V.P. (1978). Theory and calculations techniques of oceanic currents. M., Nauka, p. 124.
KURBATKIN, G.P. (1972). Ultralong atmospheric waves and a long-range forecasting. Tellus, XXIV, 6, pp. 499-513.
KURBATKIN, G.P. (1977). On the influence of the ocean on the climate. Novosibirsk.
LINEIKIN, P.S. (1957). Principal problems of the dynamic theory of baroclinic sea layer. M., Gidrometeoizdat, p. 139.
LORENZ, E.N. (1967). The Nature and Theory of the General Circulation of the Atmosphere. World Meteorological Organization.
MANABE, S and BRYAN, K. (1969). Climate Calculations with a Combined OceanAtmosphere Model. J.Atmos.Sci., 26, pp. 786-789T
MARCHUK, G.I. (1974). Numerical solution of problems of the atmosphere and o~ean dynamics. L., Gidrometeoizdat, p. 303
MARCHUK, G.I. (1975). Formulation of the theory of perturbations for complicated models. Part I: The estimation of the climate change. Geofisica International, PP. 103-156.
MARCHUK, G.I. and KURBATKIN, G.P. (1978). Physical and mathematical aspects of weather analysis and forecast. Meteorology and Hydrology, No. 11.
MONIN, A.S. and OBUKHOV, A.M. (1954). Basic properties of turbulent mixing in the atmosphere boundary layer. Trudy Geofiz.instituta AN SSSR, No. 24, pp. 163-187.
MUSAELJA~ Sh.A. (1974). The problem of parameterization of solar radiation energy transfer to'the system ocean-atmosphere and long-range weather forecast. Meteorology and Hydrology, No. 10, pp. 9-19.
NAMIAS, S. (1976). Negative ocean-air feedback systems over the North Pacific in the transition from warm to cold seasons. Mon.Wea.Rev., 104, No. 9, pp. 1107-1121.
OBUKHQV, A.M. (1962). On the dynamics of the laminar fluid. DAN SSSR. 145, No.6 pp. 1239-1242.
PHILLIPS, N.A. (1956). The general circulation of the atmosphere. A numerical experiment. Q.J. Roy.Met.Soc., 82.
ROBINSON, A.R. (1975). The variability of ocean currents. Rev.Geophys. and Space Phys., 13, No. 3, pp. 598-601,
SARKISIAN, A.S. (1966). Introduction in theory and calculation of oceanic currents. L., Gidrometeoizdat, pp. 123.

- 93 -
SELLERS, W. D. (1973). A new global climatic model. J.Atm.Sci., 12. pp. 241-254.
SMAGORINSKY, J. (1974). Global Atmospheric Modelling and the Numerical Simulation of Climate in W.N.Hess, ed., Weather and Climate Modification, Wiley and Sons, New York, pp. 633-686.
STOMMEL, H. (1965). The Gulf Stream. Univ.California Press, pp. 243.
WMO/ICSU (1975). The physical basis of climate and climate modelling. GARP Publ. ser., No. 16, p. 265, Geneva.
WYRTKI, K. (1975). El Nino - the dynamic response of the Equatorial Pacific Ocean to atmospheric forcing. S. Phys.Oceanogr., 5(4), pp. 572-584.
CLIMATE MONITORING AND CLIMATIC DATA COLLECTION
SERVICES FOR DETERMINING CLIMATIC CHANGES AND VARIATIONS
Monitoring Data Relevant to Climate
Ju. A. Izrael *.
1. Introduction
The establishment of climate monitoring and climatic data collection services is essential for the study of climate and its potential changes and variations, for the the application of climatological information to the development of national economies and for making the most favourable use of the interactions between mankind and nature. The World Meteorological Organization and a large number of national Meteorological Services have over many years collected data on climate and encouraged the utilization of such data in human activities. The Executive Committee of the World Meteorological Organization (WMO) considered climate monitorin~nd climatic data services as the first objective of the World Climate Programme L1J.
Monitoring the environment is understood as a comprehensive programme aimed at the observations of the state of the environment as a whole. However, monitoring is often understood as an observing system which serves the purpose of identification of changes of the state of the biosphere caused by anthropogenic factors (2). According to this definition, climate monitoring includes observations, assessment and forecast of anthropogenic changes and investigations into the sources and reasons fur such changes.
In order to understand climatic change and variation, the data required concern. no~ merely the state of the atmosphere but the state of the whole climatic system cons~st~ng of atmosphere-ocean-cryosphere-land surface-biota. A comprehensive study of ~atural climatic variability should be undertaken to show separately the anthropogen~c changes and the variations of climate.
2. Basic problems and objectives
The solution of numerous problems in agriculture, energy production, constructi?n and other fields of man's activity requires a great deal of information on cl~mate. For such purposes climatic data collection services appear essential and should probably have the highest priority.
A large body of information concerning the individual characteristics of the biosphere:s ele~ents and the proces~es governing climatic variability is necessary for study~ng cl~mate change and var~ations and understanding these changes. The assessment of.the impact of global pollution on climate is acknowledged by UNEP as one of the ma~n purposes of the Global Environmental Monitoring System (GEMS). Thus,
* U.S.S.R. State Committee for Hydrometeorology and Control of Natural Environment Moscow, U.S.S.R. '

- 95 -
climate monitoring and climatic data collection can be used for solving various problems, such as, determination of the space-time variations of the climate; acquisition of real climatic data to be used in different areas of human activity; analysis and assessment of natural and anthropogenic space-time changes and variations of climate (including the study of past climates); changes of the climatic system's state; and prediction of possible climatic variations and changes. Considering the above, a wide range of problems of monitoring and data collection relevant to potential climatic changes and variations can be divided into categories as follows:
(a) measurements of basic meteorological elements, of atmospheric phenomena and of processes characteristic of the relevant weather regime (climate);
(b) monitoring the state of the climatic system and collecting data referring to the response of the climatic system and its elements to natural and human impacts;
(c) monitoring factors (internal and external) and their sources affecting the state of the climatic system, including the monitoring of anthropogenic factors;
(d) monitoring potential environmental changes caused by climatic change and variation, and monitoring indirect indices of climatic variability;
(e) obtaining additional data required for a co~prehensive analysis of the environment and for climate modelling.
3. Monitoring basic meteorological elements
Meteorological data obtained as a routine by national Meteorological Services include measurements of temperature, humidity, pressure, wind speed and direction, rainfall and cloudiness. Additional data are obtained for use in different areas of human activity- agriculture, construction, transport, etc. Other measurements include hydrological data, soil-moisture, snow cover and depth of freezing of the soil.
One of the main objectives of WMO's World Weather Watch (WWW) is the international exchange of basic hydrometeorological data. The worldwid~noptic network includes 4 000 surface stations, nearly 2 000 upper air stations /3, 4/ and, in addition, each day about 2 600 ship reports and 1 700 aircraft report~ are globally exchanged •
The total number of climatological stations is at present about 40 thousand and it is estimated that there are 140 thousand rainfall measuring stations /5/.
Monthly climatic reports of surface data are available on the international exchanges from about 1 500 stations and aerological climatic data from over 500 upper air stations /3, 4/.
Satellite information and data obtained by rocket soundings of the atmosphere are transmitted regularly.
- 96 -
Observations of the composition of the atmosphere are also made, especially of those constituents, e.g., carbon dioxide and ozone, which are subject to varying concentrations that can markedly affect the climate. About 80 stations monitor ozone and a relatively small number of stations (only four) monitors the concentration of carbon dioxide.
4. Monitoring the state of the climatic system
This aspect of monitoring is concerned with those interactions and effects which may be directly involved in climatic change. The properties of principal importance are the state of the underlying surface, energy and mass exchange processes between the atmosphere and the surface, ice-cover on seas,. rivers and lakes, sizes of glaciers, permafrost zones, water equivalent and distribution of snow cover, biomass and surface of the vegetation cover, desertification areas, water content in soil and vegetation, the ocean circulation and the pressure and general structure of the atmosphere.
The state of the ocean is monitored by measurements of sea surface and subsurface temperatures, salinity and chemical composition, waves and also currents at different depths.
The study of atmosphere-ocean interaction is based on measurements of air and water temperatures, dew point, wind speed and direction, waves and bathythermograph measurements of subsurface temperatures of the ocean.
The amount of information usually increases during regional experiments, such as GATE, and is expected to increase greatly during the First GARP Global Experiment ( FGGE).
5. Monitoring factors affecting the climate
Of great importance is the monitoring of factors affecting the state of the climatic system and climate and the sources of impact factors. Those factors can be external (with respect to the Earth's climatic system) and internal.
The effects of the Sun and cosmic radiation are considered external in this study. Among the factors of the solar effect, the principal focus should be on solar radiation within a wide spectral range including ultraviolet radiation, high-energy electromagnetic radiation, corpuscular fluxes of various energies and the magnetic field.
Measurements of solar radiation are carried out by the world actinometric network consisting of more than 900 stations /3/. Direct, scattered and reflected solar radiations are measured; tctal atmospheric transparency and albedo of the underlying surface are determined; total solar radiation, balance of short-wave and long-wave radiations are calculated.
Measurements of ultraviolet radiation are carried out at ozone stations; X-ray and high-energy radiations as well as fluxes of corpuscular solar radiation are measured by satellites. Cosmic radiation data are obtained by special stations and satellites.
- 97 -
Under the category of internal factors affecting the climatic system and climate we place the discharge of different substances and heat into the biosphere.
Changes of the properties of the climatic system's elements can be climateforming factors.
Measurements of the background level of atmospheric pollution are carried out at the WMO background network consisting of 160 stations. Seventy-five of them transmit data on the chemical composition of precipitation and 60 stations obtain information on the turbidity of the atmosphere /3/.
6. Monitoring consequences of climatic changes and variations
Climate change and variations may greatly affect human activity.
It is obvious that certain effects occurring in the biosphere as a result of climatic change and variation (changes of water balance, total amount of biomass in ecosystems, etc.) may intensify or weaken the action of other factors (resulting from a positive or negative feedback).
Changes of the climatic system's elements, and ecological consequences of climatic changes themselves, may serve as sensitive indices of the occurrence of climatic changes. Especially sensitive are the biosphere's elements pertaining to high latitudes (polar ice, tundra ecosystems), desertification zones and lakes in arid zones. The indirect indices of climate . change are as follows: variations of sea, river and lake levels; of coastlines and natural zone boundaries, of annual sedimentation layers in lakes, of annual layers in glaciers; variations of snow lines and snow accumulations in the mountains and glaciers. Some ecological data also come under this category such as changes of the vegetation cover, biomass, insect populations, microfauna and microflora of seas, and the spread of plant and animal diseases. In the establishment of observations of such features it is necessary to exclude other local anthropogenic impacts, for example, decrease of river or lake levels resulting from the withdrawal of a part of water storage for irrigation.
7. Priorities and accuracy of measurements
Priorities of observations of elements and factors relevant to climate and the accuracy of these observations depend upon the purposes for which the information is required.
The selection of variables which are necessary, in the first instance, for solving various applied problems, and the required accuracy of measurement are determined for each problem by taking into account its specific features, technical level and regional characteristics. This work is performed, as a rule, by national Meteorological Services usually within the WMO framework.
Of great importance is the selection of variables and determination of priorities for the purposes of climate monitoring. The results of an analysis carried out within the framework of GARP are presented in the publication under /7/ which lists the following very important variables with the required and desirable accuracies:

- 98 -
(a) Earth-atmosphere radiation balance
(b) Clouds
(c) Sea surface temperature
(d) Heat content of active ocean layer
(e) Surface albedo
(f) Precipitation
(g) Soil moisture and run-off
(h) Soil and ice surface temperature
(i) Gas constituents : total ozone carbon dioxide
(j) Wind stress over the oceans
Accuracy
-2 2-15 Wm
amount within : 5%
0.5-1.5 deg C
-2 1-3 Kcal. cm
0.01-0.03
-1 1-3 mm.day
10% of field capacity
1-3 deg C
1-5% ~ 0.1 ppm
-2 0.1-0.4 dyne.cm
(Snow and ice extent, aerosols, and turbidity: Accuracy still unspecified)
The classification is in fact the formulation of requirements for the accuracy of measurements of the developing observational system, which may undoubtedly be used not only for climate modelling but for other purposes as well.
The required resolution presented in /7/ is comparatively uniform with respect to the time-space measurements all over the globe,
It seems, however, that priorities should also be established in the selection of space-time resolution. For example, zones of the oceans of the world having a profoun~effect on the climate of a particular region, as shown in a paper by Marchuk /8/, should be given the highest priority of observation,
Observations of changes occurring in the state of biospheric elements most sensitive to climate change (at the global and local scale) should be selected for determining possible climatic changes, including anthropogenic ones.
A number of climatic change indices are presented in the preceeding section. To detect ~uman impacts, o~servations should be ~ade with the highest accuracy; this accuracy can be determined with the aid of modelling.
The development of the climate monitoring system and climatic data collection services should be based upon the available observation system - national climato·· logical observational networks, the World Weather Watch (WWW) and various observational systems being developed. The development of new technical means of observations (especially remote sensing techniques), including those using radars and lasers, will also be required, as well as automatic data processing systems. The synchronising of surface-based and satellite observations is most desirable.

- 99 -
8. Role of satellites in climate monitoring
The current observations from satellites provide information on most important meteorological elements, such as cloud and wind fields, air temperature and humidity at different altitudes, sea-surface temperature, sea-ice extent (boundaries) and seasonal snow cover distribution, vegetation-covered areas and their characteristics, plankton-covered areas of the ocean, soil moisture, precipitation, and basic components of radiation balance (see, for example /7, 9, 10/).
The satellite sub-system is a part of the WWW Global Observing System; data are transmitted from near-polar orbiting satellites and geostationary satellites. Satellite observations may be used to obtain data on a number of the climatic system's elements and other parameters subject to anthropogenic impacts.
Anthropogenic impacts may affect atmospheric turbidity, increase the C02 amount and create pollution having an effect on the ozonosphere (freons, nitrogen oxides).
Dust layers are identified using satellite pictures of the Earth's limb and by satellite measurements of angle distribution and plarization of the scnttered solar radiation.
The total amount of gaseous components of the atmosphere, such as water vapour, carbon dioxide and ozone, can be determined using the spectrometry of the absorption bands of reflected solar radiation and the emitted heat radiation.
The detection of oil films interfering with the mass exchange between the ocean and the atmosphere is possible with the aid of multispectral satellite images.
The use of satellite data makes it possible to estimate changes of vegetation cover due to felling or desertification and changes in the character of agricultural crops. All this will explain the reasons for changes of surface albedo. Large irrigational structures and the redistribution of water resources influence the water balance and the Earth's surface albedo. All these data may be obtained by the interpretation of satellite images (in different intervals of the visible and infrared ranges).
Components of the radiation balance including those subject to human impact are determined from satellites with high accuracy. Anthropogenic changes in the nearEarth cosmic space, for example, artificial radiation belts, can also be observed from satellites.
9. Conclusion
The existing viewpoints on climate monitoring and climatic data collection services expressed by experts from different countries and international organizations are described in this report /5-7, 10-12/.
Special emphasis is laid on the need to select out of a vast number of variables and influential factors, those of primary importance for studying the problems of climatic change and climatic variability and the separation of the effects of human

- lOO -
influences from natural processes. Measuring changes in the biosphere that are relevant to climatic change is a new trend in monitoring.
The next step is the development of a monitoring scheme for the above purposes. This scheme should be as detailed as that developed for the purpose of climate modelling Lz/.
A detailed monitoring system should ~ogetherwith climate modelling) be aimed at identification of those natural and man-made climatic changes which would seriously affect the biosphere so that effective measures may be taken to prevent undesirable or even disastrous climatic changes.
REFERENCES
/1/ ·~ (1978). Thirtieth session of the Executive Committee. Abridged report with Resolutions. WM0 No. 514, Geneva.
/2/ IZRAEL, Ju. A. (1972). Global Observing System. Forecasting and Assessment of the State of the Natural Environment. Fundamentals of Monitoring. Meteorologiya i Gidrologiya, No. 7, pp 3-8.
/3/ WMO (1978). Annual Report of WMO, 1977. WMO No. 502, Geneva.
/4/ WMO (1977). Basic Synoptic Networks of Observing Stations. WMO No. 217, Geneva.
/5/ UNEP/WMO (1978). Background Paper on Climate-related Monitoring. Document for UNEP/WMO Gov. Expert Meet. Geneva, Apr. 1978.
/6/ MUNN, R. E. (1975). Global Atmospheric Monitoring Systems. Appendix 11.2, GARP Publ. Ser. No. 16, Geneva, WMO/ICSU.
/7/ WMO/ICSU (1975). The Physical Basis of Climate and Climate Modelling. GARP Publ. Ser. No. 16, Geneva.
MARCHUK, G. I. (1975). Complicated Models, 15 (3), pp. 169-182,
Formulation of the Theory of Perturbations for Geofisica International, 15 (2), pp. 103-156,
Mexico.
/9/ VETLOV, I. P. and JOHNSON, D.S. (1978), The Role of Satellites in WMO Pro-grammes in the 1980s. WWW Planning Report No. 36, WMO, Geneva.
/10/ SUOMI, V.E. (1977). The Need for Climate Monitoring. Energy and Climate. Nat. Acad. Sci., Washington, pp. 128-132.
/11/ NATIONAL ACADEMY OF SCIENCES (1978). Elements of the Research Strategy for the United States Climate Program. Nat. Acad. Sci., Washington, D.C.
/12/ IZRAEL, Ju. A. (1977). Monitoring the State of the Biosphere and Climate. Report at the Soviet-American Symposium on Climatic Changes, Leningrad, June 1977.
HUMAN ACTIVITIES THAT AFFECT CLIMATE
R.E. Munn* and L. Machta**
1. Introduction
Mankind has been modifying the environment for several thousand years. These modifications affect climate in three ways:
(a) by changing the composition of the atmosphere, including changes 1n the concentrations of water vapour;
(b) by releasing heat into the atmosphere;
(c) by changing the physical and biological properties of the underlying surfaces.
There is no doubt that these processes produce local climatic anomalies; for example, construction of a reservoir changes the surface radiation and energy balances, and reduces the frictional wind drag. In addition, however, there has been growing speculation since the 1930s that climate modification might be taking place or might someday become significant on the global scale. This implies that local and regional perturbations collectively could influence weather patterns in other parts of the world, and/or that climate change could take place globally in the first instance, as would be the case in the stratosphere.
Climate varies so much that it is difficult to answer the question: what would contemporary conditions be like if mankind did not exist? Even in the case of local anomalies, this is sometimes a troublesome question. Many cities are located in irregular terrain (on coastlines, in river valleys, etc.) which results in complex local climatic patterns; moreover, these cities were built long before the first weather observations were taken. As a consequence, the investigator has no reference state with which to compare current conditions. In the case of global climate, the non-impacted reference state is even more difficult to estimate.
A second complication is that mankind often modifies the geometry of the surface of the earth, changes the surface water budget, and releases particles, gases and heat into the atmosphere all at the same time. The associated time lags may be different in each case. Furthermore, there may be in~ractions, in which one of these factors amplifies or dampens the magnitude of another. For example, over-grazing may affect the radiative properties of an area, modifying the heat and water budgets, and changing the rate of re-entrainment of soil particles into the atmosphere. Unfortunately, there is little possibility of performing controlled geophysical experiments in
* Institute for Environmental Studies, University of Toronto, Toronto, Canada. ** Air Resources Laboratories, National Oceanic and Atmospheric Administration,
Washington, D.C., U.S.A.
- 102-
which all but one or two of the factors affecting climate are kept constant. An alternative approach is through the use of models, discussed by Gates, Marchuk and Mason at this Conference.
The subject of this paper is clearly of very wide scope and accordingly it 1s presented in two main parts as follows:
Part I. By Munn, consists of Sections 2-7 and covers the main human impacts on climate, excluding mankind's interference in the atmospheric carbon dioxide (C02 ) balance.
Part II. By Machta, consists of Section 8 and deals comprehensively with those aspects of climatic change which are related to the carbon dioxide balance. The subject has many important ramifications and is also referred to in the overview papers of Baumgartner, Bolin, Flohn, Gates, Mason and Williams et al.
2. Human impacts on the composition of the atmosphere, and mechanisms for climatic effects
Mankind modifies the atmospheric concentrations of trace substances in the following ways:
climate:
(a) by emitting gases and particles from towns and industrial areas;
(b) by agricultural burning of stubble etc., and by forest and grassland fires started accidentally;
(c) by ploughing and over-grazing, resulting in dust being lifted up into the atmosphere during dry, windy weather. The Northeast Trade Winds carry dust from North Africa to the West Indies, for example.
These modifications in the chemical composition of the atmosphere may affect
(a) by changing the atmospheric radiation balance, modifying the thermal and dynamic structure of the atmosphere;
(b) by upsetting the stratospheric photochemical ozone budget, modifying the thermal and dynamic structure of the stratosphere;
(c) in the case of particles, by disturbing the condensation nuclei populations, with a possible effect on cloudiness and precipitation processes.
Gases
The trace gas that has been most widely suggested as a cause of climatic change is C02 (see Section 8) but other gases such as water vapour, the chlorofluoromethanes, carbon tetrachloride, methane, nitrous oxide and ammonia, contribute to the

- 103 -
so-called greenhouse effect. In the absence of clouds, the sun's short-wave radiation passes downward through the atmosphere with little attenuation. However, the earth's long-wave radiation is absorbed selectively in several infra-red bands by these gases. This warms the lower atmosphere, all other factors remaining constant. When clouds are present, the radiative transfer processes are more complicated but the same greenhouse principle applies. The phrase, all other factors remaining constant, is important. In fact, a change in temperature modifies the dynamics of the atmosphere, and there is no possibility of performing a laboratory or simple outdoor experiment to study the various feedbacks that may exist.
Although concentrations of greenhouse gases are highest in towns and industrial areas, the local climatic influences are rather small. The main effect is global involving the total depth of the atmosphere. Estimation of the magnitude of the warming to be expected, if the concentration of a trace gas were to increase by a designated amount, can only be obtained from numerical models of the atmosphere. Because current simulations do not include the level of detail to be found in the real atmosphere, the absolute values of the greenhouse effects are somewhat uncertain. Nevertheless, the predicted potentials of various gases may be compared on a relative scale, and this shows that C02 is the most significant, but that the other gases mentioned above should not be ignored.
For most of these gases, there have been upward trends in recent years in both industrial production and in atmospheric concentrations. For CFCl3 (trade name Freon 11), for example, measurements from Cape Grim, Tasmania show an average increase of 15 per cent per year during the period 1976-78 despite the fact that global production of this substance has decreased since 1974.
Particles
The average residence time of a particle in the lower atmosphere is a few days. The highest concentrations of suspended particulate matter are therefore located within 1 000 km of source regions, as is evidenced by a rapid droff-off of particulate concentrations downwind of continents. Because the exchange time between the northern and southern hemispheres is about 1 year, the two hemispheres can be considered as independent with respect to particulate loadings. However, in the stratosphere, the average residence time of a particle is at least a few months, so that stratospheric particles become of global significance.
Mankind has been contributing significantly to the particulate loading of the atmosphere for many centuries through agricultural and urban/industrial activities. Changes in particulate concentrations in London have been estimated recently by Brimblecombe, who finds a deterioration in the 17th and 18th centuries and an improvement in the 20th. This behaviour is probably quite typical of many European cities. A wood shortage beginning near the end of the 16th century led to the use of coal for home heating and cooking and, in consequence, a major rise in particulate concentrations in the 17th century.
Although the black smoke above and downwind of urban/industrial areas has disappeared in Europe and North America, it has been replaced by brown haze which sometimes covers very large areas indeed. Urban emissions of photochemically active

- 104-
gases and hydrocarbons have been increasing, leading to increases in sulphate hazes, sometimes 500 to 1 000 km distant from source regions, particularly in Western Europe and eastern North America. In these regions there are many personal testimonies to the fact that frequencies of occurrences of exceptionally high visibilities have declined during living memory.
Away from industrial regions, natural and agricultural sources contribute significantly to the particulate loading of the atmosphere. Even over the central oceans the air is not entirely free of particles that originated over the land.
The effects of particles on the atmospheric radiation balance depend on a number of factors:
(a) the s~ze distributions of the particles;
(b) the shapes of the particles;
(c) the scattering, reflection and radiative properties of the particles (carbon particles behave differently from quartz particles);
(d) the vertical distributions of particles;
(e) the relative humidity (some particles are hygroscopic, for example);
(f) time variabilities in all of the above factors.
Most data sets are incomplete but K. Ya. Kondratyev has organized CAENEX (the Complete Atmospheric Energetics Experiment) which has yielded information on conditions over a desert, over water and over a city.
The sun's radiation is attenuated as it passes through the atmosphere. Part of the solar beam is absorbed by gases, particles and clouds (to be re-radiated as long-wave radiation), another part is scattered and reflected upward to space and downward to the earth's surface as diffuse radiation; the remainder reaches the ground directly. Some of the direct and diffuse radiation striking the earth's surface is reflected upward (this fraction is called the surface albedo). The remainder is avaimbre to heat the ground, melt ice, and evaporate water.
An increase in the particulate loading of the atmosphere leads to:
(a) a change in the amount of solar radiation scattered back to space (causing the mean atmosphere/earth temperature to change);
(b) more absorption of solar radiation in the atmosphere (causing atmospheric temperatures to increase);
(c) less solar radiation reaching the surface of the earth, (causing ground temperatures to decrease);

- 105 -
(d) an increase in the ratio of diffuse to direct solar radiation (this has been found experimentally to lead to an increase in surface albedo, and thus to surface cooling).
Solar radiation absorbed by the atmosphere and the earth's surface is re-radiated as long-wave radiation, which criss-crosses the atmosphere in many directions. An increase in particulate matter therefore produces long-wave greenhouse warming. For a sharplycapped haze layer or a cloud, there would, however, be cooling at the upper surface.
The net effect of suspended particulate matter on the radiation balance of the lower atmosphere is difficult to assess even on a single cloudless day. To simplify the problem, many models ignore long-wave radiation, which is known to be small compared with solar radiation during the day, although it cannot be ignored at night. In general terms, each major source region should be examined separately, the radiative effects being different over Western Europe from those over North Africa. A model which uses an average particulate composition for the entire globe is not a realistic one.
Early studies of global climate emphasized the fact that particulate matter increased the scattering of solar radiation backward into space, resulting in a net cooling of the atmosphere/earth system. More recently, Flohn, Kellogg and Mitchell have challenged this view. Kellogg, for example, believes that the albedo ~s an important variable; the higher its value, the more likely that an increase in particulate concentrations will warm rather than cool the earth/atmosphere system. Because the highest albedo values are over the continents where the atmospheric particulates are concentrated, differential warming of areas such as Western Europe and Eastern North America is likely. (The possibility is not excluded, of course, of cooling over the oceans although there is need for more theoretical and experimental studies.) As a simple illustration of this principle, a plume of black smoke would increase the albedo over a water surface and thus cause cooling whereas the same plume would decrease the albedo over a snow surface and cause warming.
3. Special considerations relating to the stratosphere
The stratosphere requires special consideration because it is chemically as well as dynamically active. Ozone absorbs solar radiation, heating the stratosphere and generating large-scale wind fields. Thus a change in the rate of photochemical production or destruction of global ozone ought to be associated with a modification in the dynamics of the stratosphere.
Several natural and man-induced mechanisms for perturbing the stratosphere have been suggested:
(a) Natural mechanisms (volcanoes; extra-terrestrial events such as solar flares or explosions of supernovae) ;
(b) Man-induced mechanisms: Stratospheric releases (aircraft emissions; nuclear explosions); Ground-level releases (chlorofluoromethanes; N
20 from fertilizers and/or nitrogen-fixing vegetation; other green
house gases such as C02
and methane).
- 106 -
In each case the stratospheric radiation budget might be affected:
(a) directly through changes in the concentrations of particles or greenhouse gases; or
(b) indirectly through changes in the rate of photochemical production or destruction of ozone.
A recent analysis of ozone trends by Angel! and Korshover provides no evidence for a human impact between 1958 and 1976. There seems to be an 11-year solar cycle as well as an apparent connexion with volcanic eruptions, but this latter effect may be instrumental; the Dobson spectrophotometer observations are degraded by the presence of stratospheric dust veils.
Turbidity measurements made at high-altitude observatories over several decades reveal the persistence of dust from volcanic eruptions. The most widely cited example, the eruption of Krakatoa in the last century, produced a readily detectable dust veil and brilliant sunsets lasting several years. When the effects ~f volcanic eruptions are removed from long series of turbidity measurements, there remains no strong evidence for trends. One possible exception is turbidity (as measured by a pyrheliometer) at Mauna Loa, Hawaii; winter values have returned to the levels existing prior to the volcanic eruption of Mount Agung in 1963 but summer values remain slightly depressed.
There is little information on stratospheric concentrations of other trace substances and no information on trends. One of the complicating factors is that the abundance of a trace substance could change merely because of changes in photochemical destruction or production rates; this could occur through dynamic processes, in which the substance was transported to levels where the photochemical processes were more (or less) active.
~t_Ea .. !,o~p.!:!.e.Ei.£ .E_h_2t£c.!:!.e!!:!i~t,Ey
The classical photochemical explanation for the ozone layer given by Sidney Chapman in 1930 has had to be modified several times since 1960 with the recognition of additional chemical and meteorological mechanisms. The most recent views are summarized in the Proceedings of a 1978 WMO Symposium. Uncertainties in the values of the photochemical rate constants have now been mainly eliminated and values to within ~25% have been determined independently by two or more laboratories in most cases. There remains the problem of knowing whether all of the important reactions have been included in present sets of equations. There is also the difficulty of modelling a large number of photochemical reactions in a dynamically active stratosphere. The present generation of models predicts that:
(a) Continued use of chlorofluoromethanes and· nitrogen fertilizers could cause a small long-term depletion in stratospheric ozone;

- 107 -
(b) the net effect of SST aircraft might result in a small increase in stratospheric ozone, rather than a decrease as previously predicted;
(c) because of feedback relations, an increase in C02 concentrations could have a significant effect on stratospheric ozone, but the sign of the effect is still uncertain;
(d) an increase in CO concentrations would cause a decrease 1n stratospheric ozone;
(e) an increase in concentrations of the oxides of nitrogen would cause an increase in stratospheric ozone.
Above-average ozone concentrations are associated with below-average temperatures; the winter of 1976 was cold in the northern hemisphere, and ozone values were high. However, the above-average ozone concentrations did not ''cause'' the cold weather in any direct way. There is in fact no easy method of predicting the climatic effects induced by perturbations in the ozone layer, although the example is frequently given of the eruption of Mount Agung. Temperatures at heights of 18 and 20 km over Australia rose as much as 5 deg C and took as long as four years to recover to normal values.
4. The release of heat into the atmosphere
When averaged over the globe, the heat generated by human activities is a trivial fraction of the net solar radiation at the earth's surface. A comparison of the magnitudes of several energy sources is as follows:
Solar radiation at outer edge of atmosphere
Net solar radiation at the earth's surface
1970 energy production distributed evenly over the globe
1970 energy production distributed evenly over the continents
Annual continental net photosynthetic energy
Annual global energy flow from the earth's interior
Heat from major United States cities
-2 350 W m
-2 160 W m
-2 0.016 W m
-2 0.054 W m
-2 0.016 W m
0.06 w -2 m
20 to 40 W m-:2
(summer) 70 to 210 W m (winter)
Compared with other energy sources, the sun predominates on the global scale. However, the heat generated by human activities can sometimes be of the same order of magnitude a~ or even exceed, the net solar radiation locally or even regionally.
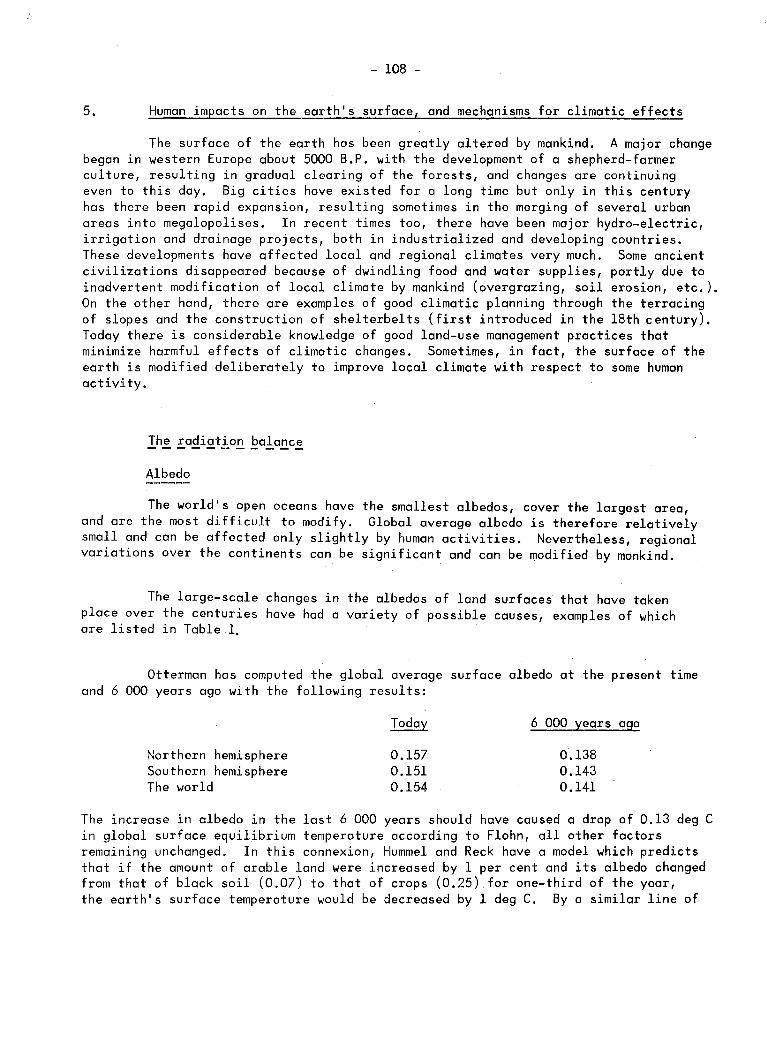
- 108 -
5. Human impacts on the earth's surface, and mechanisms for climatic effects
The surface of the earth has been greatly altered by mankind. A major change began in western Europe about 5000 B.P. with the development of a shepherd-farmer culture, resulting in gradual clearing of the forests, and changes are continuing even to this day. Big cities have existed for a long time but only in this century has there been rapid expansion, resulting sometimes in the merging of several urban areas into megalopolises. In recent times too, there have been major hydro-electric, irrigation and drainage projects, both in industrialized and developing countries. These developments have affected local and regional climates very much. Some ancient civilizations disappeared because of dwindling food and water supplies, partly due to inadvertent modification of local climate by mankind (overgrazing, soil erosion, etc.). On the other hand, there are examples of good climatic planning through the terracing of slopes and the construction of shelterbelts (first introduced in the 18th century). Today there is considerable knowledge of good land-use management practices that minimize harmful effects of climatic changes. Sometimes, in fact, the surface of the earth is modified deliberately to improve local climate with respect to some human activity.
Albedo
The world's open oceans have the smallest albedos, cover the largest area, and are the most difficult to modify. Global average albedo is therefore relatively small and can be affected only slightly by human activities. Nevertheless, regional variations over the continents can be significant and can be modified by mankind.
The large-scale changes in the albedos of land surfaces that have taken place over the centuries have had a variety of possible causes, examples of which are listed in Table 1,
Otterman has computed the global average surface albedo at the present time and 6 000 years ago with the following results:
Northern hemisphere Southern hemisphere The world
0.157 0.151 0.154
6 000 years ago
0.138 0.143 0.141
The increase in albedo in the last 6 000 years should have caused a drop of 0.13 deg C in global surface equilibrium temperature according to Flohn, all other factors remaining unchanged. In this connexion, Hummel and Reek have a model which predicts that if the amount of arable land were increased by 1 per cent and its albedo changed from that of black soil (0.07) to that of crops (0.25) for one-third of the year, the earth's surface temperature would be decreased by 1 deg C. By a similar line of

- 109 -
reasoning, the man-made lakes and reservoirs (estimated to cover 300 000 km2) may have increased the surface temperature by 0.4 deg C. However, albedo changes are concentrated in only a few regions of the earth (perhaps only 10 per cent of the earth's surface) so that climatic effects would in the first instance be regionalized.
Table 1
Causes of large-scale changes in land surface albedo
1.
2.
3.
4.
5.
Processes that cause increases in albedo
Desertification
Overgrazing semi-arid regions
Burning of grass-land in semiarid regions (slight)
Ploughing of fields (slight)
Clearing of forests
6. Addition of biological films to water surfaces
~~~~~~~~!l
1.
2.
3.
4.
5.
Processes that cause decreases in albedo
Overgrazing in regions with moderate to heavy rainfall
Man-made lakes and irrigation (slight)
Construction of towns (slight)
Snow removal
Deposition of particles on snow
Emissivity is a measure of the degree to which a surface behaves like a perfect long-wave radiator. In principle, a decrease (increase) in surface emissivity would decrease (increase) the long-wave radiative loss from the surface. Because quartz particles have a rather low emissivity, an increase in the area of the world's deserts would therefore reduce the long-wave radiative loss, all other factors remaining unchanged.
Human activities may change the amount of available radiant energy at the earth's surface as well as the way in which it is partitioned. A quantity that is used in this latter connexion is the Bowen ratio, the ratio of heat losses by convection and by evaporational cooling. The numerical value of this quantity is small over oceans and tropical rain forests, and is large over deserts. Table 2 gives examples of man-made processes that change the Bowen ratio.

- llO -
Table 2
Man-made processes that change the Bowen ratio
Processes leading to an increase in Bowen ratio
Deserti fication
Clearing of forests
Drainage of swamps
Urban growth (in moist climates)
Processes leading to a decrease in Bowen ratio
Irrigation
Man-made lakes
Urban growth (in dry climates)
Land cultivation may increase or decrease the Bowen ratio, depending upon the type of crop, its stage of growth, climatic region, etc. Locally, a slightiy hotter and drier climate results in an increase in Bowen ratio. A decrease in daytime temperatures and increase in humidity reduces the Bowen ratio. These local changes may collectively encompass much of a region.
Mankind has also been changing the thermal properties (conductivity and heat capacity} at the earth's surface, mostly on the local and urban scales, by constructing roads and buildings, and by ploughing fields. Solar energy is stored during the day and released slowly at night by concrete and cement.
6. Changes in the hydrologic cycle resulting from human activities
Mankind has been modifying the hydrologic cycle, both inadvertently and deliberately, for a long time. Locally, the most dramatic visual example is the cold-weather ice fog which sometimes blankets cities like Edmonton, Canada and Fairbanks, Alaska, and which is caused by moisture released from the combustion of natural gas and from automobile exhausts. Regionally, the hydrologic cycle is changed by forest clearing, forest regeneration, swamp drainage, irrigation projects, dam construction, river diversion, ground-water withdrawal and urban growth. On an even larger scale, mankind has influenced the hydrologic cycle over whole continents. The annual evaporation of water to the atmosphere has increased by about 3,5 per cent (2 500 km3) due to man's activities, although as pointed out by Flohn, "the ocean is still the great buffer of the water budget, smoothing man-made variations on land".
7. The impact of local and regional changes on global climate
A question of great importance is whether a regional anomaly can affect world climate. This problem can be studied in three ways:
(a) with numerical simulations;
(b) by examination of the larger-scale effecis of naturally-occurring local and regional anomalies, due for example to the presence of an island or lake;
- 111 -
(c) by examination of the downwind impacts of a man-made anomaly such as a city or an irrigated area.
As an example of the second approach, the Great Lakes are major sources of heat and water vapour in the winter and are known to affect the motions and intensities of low and high pressure areas moving by. However, the energy involved is about 500 W m-2 as compared with 10 W m-2 for a megalopolis. Another useful analogy is given by the cloud bands sometimes to be seen downwind of tropical islands. When observed on satellite photographs, these clouds resemble the von Karman vortices downwind of a blunt body in a wind tunnel. By comparing the energies involved with those proposed for a large industrial power park, an engineering estimate of the likely regional effects might therefore be obtained. Finally, there is the third approach, namely, to make experimental measurements around existing man-made anomalies. For example, the St. Louis urban plume containing heat, moisture and pollutants can sometimes be detected 200 km downwind.
There remains the question of providing practical advice on whether major development projects will have significant impacts on climate not only locally but also on surrounding territories. Here it is appropriate to repeat the recommendation made in 1971 by SMIC: "We recommend that an international agreement be sought to prevent large-scale (directly affecting over one million square kilometres) experiments in persistent or long-term climate modification until the scientific community reaches a consensus on the consequences of the modification". This recommendation should also apply to land-use changes that may lead to inadvertent and practically irreversible impacts on climate.
As for existing engineering works such as the Aswan Dam, the James Bay power development in Quebec and the diversion of rivers flowing into the Arctic Ocean, climatic impact assessments should be undertaken and the results should be widely promulgated in order to assist in the assessment of similar kinds of proposals in other parts of the world. Some of the assessments are available nationally but they are rarely scrutinized internationally.
8. The carbon dioxide problem
The C02 problem merits special attention for several reasons:
It is global in nature.
There is unequivocal evidence of increasing atmospheric C02
•
Much or all of the problem arises from man's use of fossil fuel for energy.
It may be difficult to alter this source of energy easily or quickly should a change be required.
Numerical models of climate suggest that a doubling in C02 will cause warming of the lower atmosphere although the impact will be uneven with some regions possibly experiencing cooling.

- 112 -
Valid predictions of the reality of significant C02 impact on climate will be needed in a few decades or less.
The C02 problem has several components, all of which need to be pursued before the implications of increasing C02 are clarified:
Rate of introduction of C02 into the atmosphere from fossil fuel combustion.
Rate of deforestation.
Modelling of the global biogeochemical cycle of carbon.
Prediction of atmospheric levels of C02 for various scenarios of future input of C02.
Prediction of climatic changes due to increased atmospheric C02.
Analysis of the impact of the climatic change and the enhanced C02 on the biosphere and on human activities.
Engineering and socio-economic studies of technological fixes.
The combustion of fossil fuels, the production of cement, and the flaring of natural gas release C02 into the atmosphere. The latter two sources are only a few per cent of the first. The fossil fuels include coal, oil, natural gas (mostly methane), and lignite. Information on the consumption of fossil fuels obtained from United Nations Statistical Reports has been used by Keeling and by Ratty to produce the estimates shown in Figure 1. The average growth rate of C02 (world fossil fuel energy usage) broken by wars and periods of world economic recessions amounts to between 4 and 5 per cent per annum. It had been expected by some economists that after the recession and energy price rises of 1973-75, the growth rate would slow down to perhaps 2 per cent per annum because of fuel costs and conservation. The reported data indicate no such retardation. Although two years is too short a period of time for trend analysis, there is still no indication in these data that the growth of the world fossil fuel usage is slowing down.
Deforestation
Growing vegetation removes C02 from the atmosphere, Globally, the removal rate may be decreasing, with many reports that world forests are being cut down by man but only a few reports of deliberate and natural reforestation. Estimates of the effects of deforestation on C02 have ranged from virtually zero (or even negative values if the increasing atmospheric C02 fertilizes the biosphere) to many times the C02 released from fossil fuels during the past 50 to 100 years. The techniques for estimating

22,000
20,000
- 113 -
ANNUAL PRODUCTION OF C02 FROM FOSSIL FUELS AND CEMENT
Kuli11g, lf16f? -1!149; RDff)', 1!150-1977
(4,000 l22,000
-jzo,coo l
: :::::r ~ 14,000r
... liO,OOO
j 116,000
i :4,000
a: ~ 12,000~ .· l
112,000
l a 10,000~ -· ... ~ 10,000
i ..J ..J
t 8,000 t-
6,004 .. ... I ~.
4 0004- • . ••• • •
2:000~ ........................ - ....... .
l •••••••o•••._ .....
. . . j
l • ~ l
r _ ............ .. 01 ·- r" ..... I ··- L .•• - .L -1-._.J. --1. --.1.-- L ___ l ·--'··--.
8,000
6,000
4,000
2,000
0 1&50 1860 ill7Q 1880 1890 1900 • 1910 1920 1930 1940 19~ 1960 1970 l9oJO 19!)0
YEAR
Figure 1
The annual release of carbon dioxide to the atmosphere by the combustion of fossil fuels, cement production and the flaring of natural gas. The last point on the curve gives the 1977 emissions. The 1973-75 levellingoff period was presumably due to price rises in oil and the world economic slowdown
the changes in the biosphere are two-fold; first, through satellite or other aerial monitoring, making a physical estimate of changes over the globe (augmented by ground truth to determine actual changes in carbon); second, using changes in atmospheric content of the isotopic carbon or the change in oxygen concentration of the atmosphere. Neither method is easy and neither necessarily guarantees a successful result. Even after much research and effort, the global biosphere contribution to atmospheric C02 may still be unknown.
Deforestation is mainly a phenomenon of the developing countries today whereas fossil fuel emissions are concentrated in the industrialized countries. For example, the United States with less than 10 per cent of the world population emits over 25 per cent of the world fossil fuel C02. On the other hand, the developing countries release less than 15 per cent. This situation may change,however. Rotty has suggested that the largest future growth in fossil fuel emissions is likely to come from the developing countries. This provides another argument for global interest in the C02 problem.
- 114 -
Estimates of the total recoverable fossil fuels are uncertain. In large part, this is due to the possibilities of new technology for economic recovery of oil shales, tars, etc., and unexpected major new fossil fuel discoveries. Most present estimates of recoverable fossil fuels expressed in equivalent carbon content are close to 5 x 10¹⁸ gr carbon.
It should be noted that coal produces more C02 than does oil or natural gas for the same energy production: 87, 71 and 51 metric tons, respectively, per 1012 joules for coal, oil and gas. Since in the long term it is almost certain that fossil fuel energy, if it is used, will favour coal in increasing proportions (85 per cent of the known recoverable fossil fuel energy is in coal), the C02 released to the atmosphere will be greater than the present mix even with the same energy production.
The range of predictions of energy consumption and the proportion of the energy contributed by fossil fuels is large. Williams et al. offer two possible scenarios in their overview paper at this Conference. The 30 Terrawatt nuclear and solar scenario virtually eliminates fossil fuel early in the next century. The 50 Terrawatt fossil fuel scenario places complete reliance on coal after about 50 years. While there are many other uncertainties in the C02 problem, it is evident that should the world greatly reduce or avoid its dependence upon fossil fuels, the C02 problem would disappear.
If deforestation has been significant compared to fossil fuel sources or even if it is now relatively small, the trend in the near future may be toward increasing rates of deforestation. This is because of increasing population, rising fuel costs, and economic growth based on forest products.
Predictions of future atmospheric C02 due to man's activities are obtained through an application of our understanding of the carbon cycle, i.e., the exchanges of carbon and its compounds in nature. Reservoirs of carbon which possess carbon lifetimes measured in many thousands of years or more are neglected (unless man's disturbances shorten the lifetime) as are reservoirs which are very small. Unfortunately, in many cases, the exchange rates and reservoir sizes are known imperfectly; this ignorance is often used, incorrectly, as an excuse for neglecting them.
Figure 2 illustrates one of the simpler models simulating the reservoirs and exchanges of carbon. Note that there are three major reservoirs; the atmosphere, the biosphere and the oceans. In most models, each of the three major reservoirs is usually further subdivided, e.g., the atmosphere into a troposphere and stratosphere, the oceans into an upper mixed layer and a deep ocean layer, and the biosphere into short and long lived biota. The greater complexity undoubtedly produces better approximations but demands information on size and transfer rates which are often lacking or poorly known.
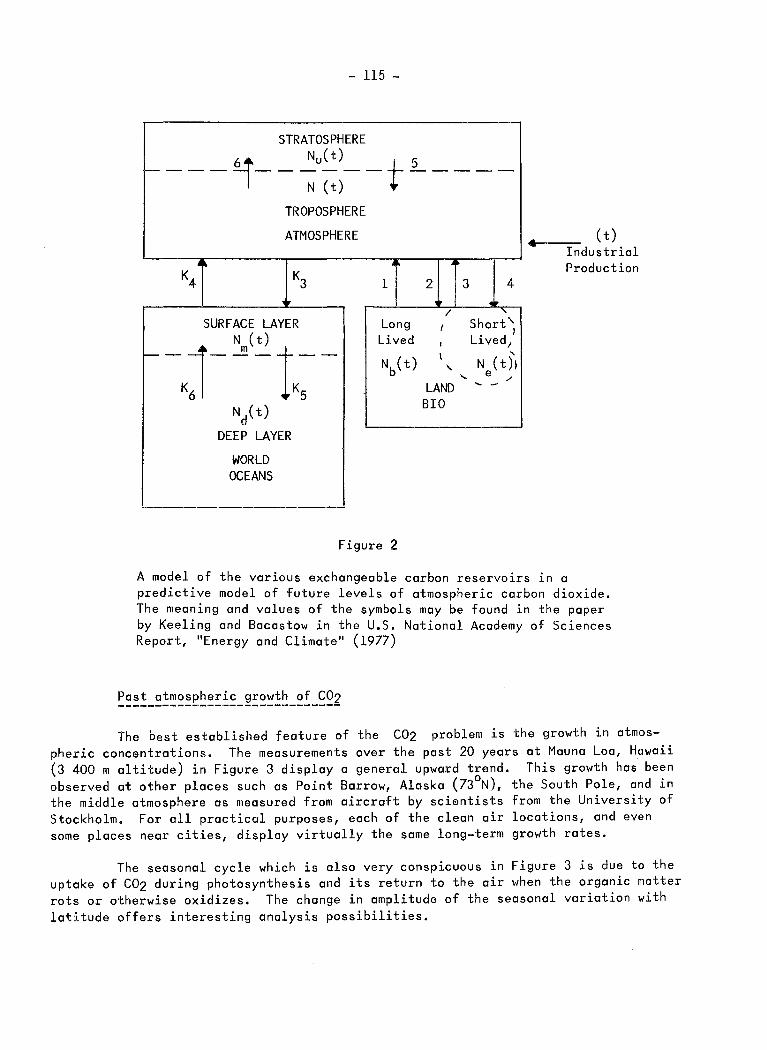
- 115 -
STRATOSPHERE
~---~--~~--t~----TROPOSPHERE
ATMOSPHERE
jr. K4 K3
SURFACE LAYER
f---Kj- Nm(~ t~-N/t)
DEEP LAYER
WORLD OCEANS
-j
1
Long Lived
Nb(t)
Figure 2
2 3 4
/ ' I Short'
• 1 I L1ved 1
\ ' \. N ( t)l
... e .., LAND ..... -
BIO
(t) 4
Industrial Production
A model of the various exchangeable carbon reservoirs in a predictive model of future levels of atmospheric carbon dioxide. The meaning and values of the symbols may be found in the paper by Keeling and Bacastow in the U.S. National Academy of Sciences Report, "Energy and Climate" (1977)
The best established feature of the C02 problem is the growth in atmospheric concentrations. The measurements over the past 20 years at Mauna Loa, Hawaii (3 400 m altitude) in Figure 3 display a general upward trend. This growth has been observed at other places such as Point Barrow, Alaska (73°N), the South Pole, and in the middle atmosphere as measured from aircraft by scientists from the University of Stockholm. For all practical purposes, each of the clean air locations, and even some places near cities, display virtually the same long-term growth rates.
The seasonal cycle which is also very conspicuous in Figure 3 is due to the uptake of C02 during photosynthesis and its return to the air when the organic matter rots or otherwise oxidizes. The change in amplitude of the seasonal variation with latitude offers interesting analysis possibilities.

d) j:::
- 116 -
2 0
~335 .D
E ft
(Based on Scripps 1974 mcnomelric: cclibrat!on) NOAA MAUNA LO~,HAWA/l BASELINE STATIOt-f. J\.335
, ___ {~
{
325
320
'-•o · · --1.-J ' • 3'0 A I ~· 1958 1959 1960 1961 1962 JS63 1964 1865 /966 1967 1968 1969 1970 197i 1972 1973 1974 19751976 1977
1
";~~ ;,~tQt -.lO.CI) O.S~ O.GO O.eG 0.4G (0.64) (O.GS) O.GO 0.70 0,67 J,9(1 1.31 1.04 !,IS 2.19 0,54 0,51 1.00 J,S8
Figure 3
The mean monthly atmospheric carbon dioxide concentrations at Mauna Loa, Hawaii (l9°N, 3 400 m altitude). The dashed horizontal lines are the mean annual concentrations and the numbers below the years are the year-to-year changes in the mean annual concentrations
During the 20-year period from 1958 to 1977, one can estimate the increase in atmospheric C02 from actual observations such as those in Figure 3. The increase amounts to slightly over one-half of the amount of C02 added to the atmosphere by fossil fuel combustion. This 55 per cent airborne fraction of fossil fuel C02 input to the air has been used to calibrate the rates of exchange in many of the carbon cycle models; the bulk or all of the remaining 45 per cent is presumably taken up by the world oceans. If deforestation is contributing a significant additional amount of C02 to the air, then t~is would also have to be put in the oceans.
Box model simulations
As an example of a recent simulation of future levels of atmospheric C02, Keeling and Bacastow used the box model shown in Figure 2. A number of their results deserve comment:
- 117 -
The model assumptions lead to a doubling of pre-industrial atmospheric C02 concentrations sometime in the early to mid-part of the next century.
The long-term decline of elevated concentrations to pre-industrial levels would take many centuries because of the slow interchange between surface and deep ocean waters.
Viewed in a very broad long-term perspective, it does not make much difference which of several scenarios on energy consumption is used in the calculations; the timing and peak concentrations are not very different.
Siegenthaler and Oeschger have formulated a box model of the carbon cycle in which the exchange between the mixed layer of the ocean mixes with and through the deep ocean via diffusion. The transfer still remains one-dimensional, i.e., only in the vertical. For C02 inputs into the atmosphere similar to those of Keeling and Bacastow, the box-diffusion model yields substantially the same results. Siegenthaler and Oeschger have used their model in the following way. If the limit of allowable concentration were to be set at 50 per cent above the pre-industrial level of 300 ppmv (e.g., 450 ppmv), for example, the resulting world-emission rate could be estimated from their model. Thus if sufficient information about all components of the C02 problem becomes available and if continued release proves to be objectionable, it may be possible to estimate acceptable or allowable world use of fossil fuels (and/or deforestation).
New doubts about carbon cycle models have arisen in the last several years because of a realization that there are potentially large past and current sources of biospheric C02. Calibration of the models via an airborne fraction is therefore not possible. Second, models of oceanic exchange between surface thermocline and deep waters have not been validated by long-term tracer studies. To follow transient oceanic tracers for a decade or two is inadequate when the postulated exchange times are measured in hundreds of years or more. The role of biospheric transfer (e.g., settling of fecal pellets), the dissolution of carbonates, and the special role of estuaries, large lakes and coastal waters raise further speculations. Thus, it cannot be said that carbon cycle modelling is on a firm footing.
The quantitative basis for predicting future climates from a modification of atmospheric properties has been the subject of several of the papers of this Conference. Here it seems appropriate to emphasize those aspects unique to the C02 problem.
The growth of atmospheric C02 is assumed to be relatively gradual. Thus far, the calculations have treated two discrete cases; one with pre-industrial C02 concentrations and a second with a larger amount, usually twice the first. Each is assumed to be in steady state. Ultimately, it will be necessary to perform calculations simulating the transient intermediate state to test whether the atmosphere behaves differently at such times.

- 118 -
The computations of climatic change assume that the entire atmosphere contains the same C02 concentration (by mass or volume). This assumption appears to be justified.
There are two potential feedback mechanisms unique to the C02 climate predictions. The warmer lower atmosphere created by the greenhouse effects may heat the waters as well. Warmer ocean water will release more C02 to the air and slow down the uptake of C02 from the air. This possible process could therefore provide a positive feedback and accelerate the atmospheric increase of C02• The warming would also melt ice which might also add its entrapped C02 to the atmosphere but this is likely to be less significant.
The biospheric carbon is dependent on atmospheric C02. Deforestation contributes to atmospheric C02, but higher concentrations of atmospheric C02 increase the rate of photosynthesis. In either case albedo and ground roughness would be altered by deforestation.
A number of investigators have examined the C02 problem by one-dimensional (vertical direction only) climate models. Only the paper by Manabe and Wetherald in 1975 uses a three-dimensional model. Despite the range of complexity, the estimates of global warming have been surprisingly similar, as shown in Table 3. It is likely that even more realistic simulations would not change the likely order of magnitude of the global temperature changes.
But this optimistic assessment (which remains to be proven) must be tempered by the need for more than global temperature changes. More particularly, other climatic parameters, especially precipitation, and at least regional differences ore necessary to evaluate environmental impacts. To date, the three-dimensional model of Manabe and Wetherald only hints at a few of the kinds of regional climate changes one might expect. For example, in their winter simulation (the only one published), the polar front was shifted poleward whenC02 concentrations were doubled. This would imply less frontal precipitation in areas from which the polar front had moved. The retreat of the snow-line in northern arctic regions fed back to an even greater warmth since the albedo dropped markedly. This positive feedback was augmented by the lowlevel stability of the winter arctic. The result was a northern hemisphere highlatitude low-level temperature increase of as much as 10 deg C whereas global warming in the same computer run was less then 3 deg C.
There has been some effort to study regional conditions during past periods of warm climate. There is no doubt that this approach should be pursued but in itself it will not necessarily be convincing. One invariably asks for evidence that earlier warm periods were created by a similar greenhouse process.
There are tremendous difficulties in simulating climate with sufficient fidelity to be confident in a forecast of climate changes due to increased C02. It may well be that within 5 or 10 years, governments could come to a crossroad on long-term future energy and land-use policies, and that the climate simulations will still leave much to be desired. As with other current environmental threats and difficult problems, there will be need for socio-economic impact analysis in which the various risks and benefits to mankind are assessed.
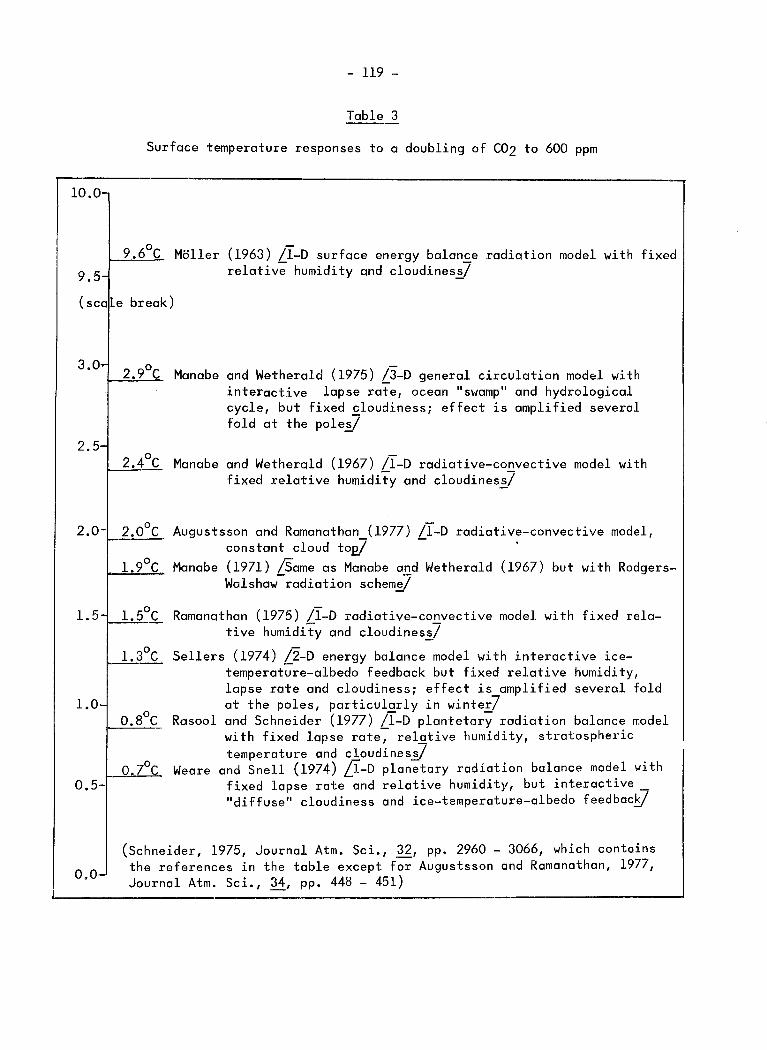
10.0 ,-
- 119 -
Table 3
Surface temperature responses to a doubling of C02 to 600 ppm
9.6°C Moller (1963) LI-D surface energy balan£e radiation model with fixed relative humidity and cloudines~ 9.5
(se aLe brea k)
3.0 1..-
2.5 ,_
2.0
1.5 -
1.0 -
0.5 -
o.o -
2.9°C
2.4°C
2.0°C
1.9°C
l.5°C
l.3°C
0.8°C
0 7°C
Manabe and Wetherald (1975) L3-D general circulation model with interactive lapse rate, ocean "swamp" and hydrological cycle, but fixed cloudiness; effect is amplified several fold at the pole~
Manabe and Wetherald (1967) LI-D radiative-convective model with fixed relative humidity and cloudines~7
Augustsson and Ramanathan (1977) /I-D radiative-convective model, constant cloud to£7 -
Manabe (1971) /Same as Manabe and Wetherald (1967) but with RodgersWalshaw-radiation schemi/
Ramanathan (1975) /I-D radiative-convective model with fixed relative humidity and cloudines~7
Sellers (1974) /2-D energy balance model with interactive icetemperat~re-albedo feedback but fixed relative humidity, lapse rate and cloudiness; effect is amplified several fold at the poles, particularly in winter/
Rasool and Schneider (1977) /I-D plantetary radiation balance model with fixed lapse rate~ relative humidity, stratospheric temperature and cloudines~
Weare and Snell (1974) LT-D planetary radiation balance model with fixed lapse rate and relative humidity, but interactive _ "diffuse" cloudiness and ice-temperature-albedo feedbacy
(Schne the r
ider, 1975, Journal Atm. Sci., 32, pp. 2960 - 3066, which contains eferences in the table except for Augustsson and Ramanathan, 1977,
Journal Atm. Sci., 34, pp. 448 - 451)

- 120 -
Some of the environmental impacts which one speculates may result from greenhouse warming are:
Altered precipitation and evaporation regimes. Although the locations cannot be forecast, it is very likely that there will be regional differences and that some areas may show a decrease in precipitation even if the global average increases.
Recession of snow-lines and recession or even disappearance of mid-latitude glaciers.
Except for the possibility that the warming might develop some dynamic instability in the West Antarctic ice cap, most meteorologists do not foresee rapid land-ice melting and consequent sea-level rise. The yearround absence of arctic sea ice remains a possibility and this may produce secondary climatic effects (such as more snow) especially in neighbouring arctic land masses.
Warming of arctic surface waters could disturb the oceanic circulation with consequent reduction in the upwelling process. The upwelling waters are important to fisheries.
There is laboratory evidence that with adequate nutrients, water, and sunlight, photosynthesis and hence agriculture and forest productivity will increase with increasing atmospheric C02 concentrations. The benefits to agriculture and forestry vary from species to species and, in some cases, may be negligible. More importantly, a C02-induced climate change need not necessarily be unfavourable.
Should research demonstrate a high likelihood that fossil fuels and deforestation will produce serious environmental threats, the world has a number of choices.
Substitute alternate energy sources for fossil fuels. The lead time for such a transition will be many decades; each alternative must itself be examined for potential environmental impacts.
Removal of C02 from major sources or from the air itself by chemical and cryogenic methods. The C02 must then be stored. The energy demands for removal may exceed the amount of energy derived from the burning of fossil fuels.
Increase the mass of the biosphere by planting more trees. For projected C02 growth, the number of trees to be planted is prohibitive; when cut, the wood must be sequestered in "permanent". non-exchangeable reservoirs.

- 121 -
Accelerate oceanic uptake by fertilizing the oceans.
Counteract climate changes by another form of human interference. The addition of dust or aerosols over the oceans has been suggested. Also, one might reduce the atmospheric content of another greenhouse gas with a much smaller content which might be easier to remove. Alternatively, the net radiative balance with increased C02 might also be returned to pre-industrial values by increasing the ground albedo.
The first proposal, to use a source of energy other than fossil fuels, presents the world with a potentially difficult and costly problem. The other suggestions are speculative; in most cases the engineering feasibility has not been fully thought out. There is therefore a sense of urgency in determining whether there is likely to be any real environmental or socio-economic threat from growing atmospheric C02.
Many scientists believe that: "The continued fossil fuel usage (and possibly deforestation) presents a potential threat to the environment". However, there are many uncertainties in the scenarios, and arguments have been advanced to suggest that the C02 problem may have been exaggerated.
The world surface temperature has been cooling since 1950 while the C02 has been growing fastest; doesn't this cast doubt on greenhouse warming of the atmosphere?
The world will, for other reasons, turn to new energy sources (e.g., nuclear or solar): the scenarios of major increases in fossil fuel consumption will prove to be wrong. (This is not a valid argument for ignoring the threat.)
If deforestation has been significant, the sink of C02 in the oceans (or elsewhere) must actually be much greater than present models admit; are the predictions of future C02 concentrations much too high?
Nature can take up the extra fossil fuel C02; the forests will grow faster; when the arctic ice melts, the oceans will be able to absorb more C02.
The atmosphere is resilient. The presumed stability of the climate for the past thousands of years argues that perhaps negative feedback mechanisms can adequately cope with the greenhouse warming; for example, a small increase in low cloudiness over the world can balance a sizeable increase in C02.
There are predictions for naturally-occurring cooling trends during the next few decades; the C02 greenhouse warming would then be welcome.

- 122 -
The environmental effects will be gradual and man can easily adjust to the changes.
Atmospheric warming may be advantageous to many areas and only marginally worse to others; for example, sub-polar countries might welcome a warmer climate.
At worst, man can remove the C02 from the air; alternatively, man can undertake technological fixes to prevent or reverse the climatic effects.
Some of these arguments may suggest that climate predictions are still too uncertain to provide a basis for making recommendations about energy policies. However, there is still a sense of urgency connected with the task of studying C02 impacts on climate and thus on society. The development of an integrated global research strategy would be a useful forward step in this direction.
9. Conclusion
There is ample evidence that local and regional climate can be modified by mankind. In addition, the chemical composition of the atmosphere is changing on the local, regional and global scales due to human activities (e.g., concentrations of C02 and chlorofluoromethanes are increasing). There is, however, no experimental evidence to demonstrate that global climate has been affected by human activities, although modifications might conceivably exist, remaining undetected because of the great natural variability of climate.
Of the various mechanisms that could affect global climate, the greenhouse problem should be given the highest priority in national and international research and planning activities. In essence:
The best current estimate argues that there is a potential problem of warming of the lower atmosphere due to increasing concentration of the greenhouse gases.
There are, however, outstanding uncertainties in simulations of future atmospheric concentrations and of the resulting impacts on climate.
Few predictions call for significant climatic effects before 2000 AD.
Research may be able to resolve many of the uncertainties.
There are doubts about the significance of the greenhouse problem over and above the uncertainties.
There are no currently known feasible alternatives to reduction in the release of C02 should the C02 problem prove to be real and the impact unacceptable.
Few, if any, scientists believe the C02
problem in itself justifies a curb, today, in the usage of fossil fuels or deforstation.

- 123 -
Studies of the climatic impacts of an increase in the concentrations of greenhouse gases, and of the resulting impacts on society, should be pursued internationally with great vigour. In these studies, joint climatic impacts, including, for example, those due to regional changes in albedo, Bowen ratio and particulate concentrations, should be given high priority.
SOME RESULTS OF CLIMATE EXPERIMENTS WITH
NUMERICAL MODELS
B. J. Mason*
1. Introduction
Climate is the synthesis of weather over a period long enough to establish its statistical characteristics (mean values, variances, probabilities of extreme events,etc), and climate prediction is concerned with how the statistics will change in the future.
Although the processes involved in the maintenance of the Earth's present climate are broadly known, those responsible for climatic fluctuations are largely unknown. Climatic changes involve not only the atmosphere but also the world's oceans, ice masses, the global land surface and its biomass. The complete climatic system therefore embraces the atmosphere, hydrosphere, cryosphere and the Earth's surface and all the interactions which occur among them over a wide spectrum of space and time scales. In addition the whole climatic system is subject to external influences, notably the incoming solar radiation and, increasingly, to man's activities.
Predictions of the extent and duration of climatic changes are not possible at present and must await greater !~nowledge and understanding of the underlying causes whether internal or external to the atmosphere. The first priority is to understand the physical basis of the presently observed climate, which requires the development of numerical models to represent the essential climatic processes and interactions.
2. Model simulation of the present global climate
Despite their deficiencies, the best of the general circulation climate models (GCMs) L1-i7 successfully simulate the major features of the global atmospheric circulation and of the present world climate, at least as far as the average conditions are concerned. In particular they have been remarkably successful in simulating:
(a) the presently observed global patterns of surface pressure, wind, temperature and rainfall and their seasonal changes;
(b) the various components of the global heat, momentum and hydrological balances and the contributions made to these balances by the various modes of transport;
* Meteorological Office, Bracknell, U.K.

- 125 -
(c) the observed net surface fluxes of heat, momentum and moisture;
(d) the seasonal shifts of circulation and rainfall including important regional changes such as the monsoons.
Figures l(a) and (b), produced by the UK Met. 0. 5-level model L2,3,~, show the computed global distribution of surface pressure for January and July reproducing high-pressure systems over the continents (e.g. the Siberian anticylone) and low-pressure systems (e.g. the Icelandic and Aleutian lows) over the oceans in winter. The situation is reversed in the summer with the Azores and Pacific anticyclones becoming prominent features. The corresponding wind fields, represented by computed grid-point values in Figures 2(a) and (b), reproduce the middle-latitude westerlies, the trade-winds and doldrums together· with the N.E. monsoon over Asia and East Africa in winter and replaced by the S.W. monsoon in summer. The chain of low pressure centres off Antarctica, greatly intensified during the local winter, and the enhancement of the middle-latitude westerlies in the winter, are also well simulated. The January and July distributions of global rainfall shown in Figures 3(a) and (b), while not accurate in detail, reproduce the major features of the monsoon and tropic0.l rain belts and the desert and semi-arid regions quite well. The fact that the computed values of precipitation and evaporation, averaged over latitudinal zones, agree quite well with observed climatological values as shown in Figures 4 and 5 is particularly encouraging.
The most unrealistic features of this model are that the surface pressures in the polar regions are too high and the monsoon circulation istoo weak.
Some of the defects of the 5-level model have been corrected or improved in the Met.O. 11-level model L§7 which has higher resolution, more detailed parameterizations of surface exchanges and boundary-layer fluxes of heat, moisture and momentum, and an interactive ground hydrology in which soil moisture is computed as the difference between rainfall and dew, run-off and evaporation. The power of this model may be demonstrated by its ability to simulate the detailed features of the Asian monsoon which results largely from the differential heating (sensible and latent) experienced by the atmosphere over the oceans and over the land. Figure 6 shows theinput of sensible heat minus the radiational cooling into theoo~~dary layer with strongest heating over the desert regions of Arabia, N.W. India and the Indian sub-continent and cooling over the oceans, particularly over the western half of the Arabian Sea.
Figures 7, 8 and 9, taken from Gilchrist ~ show the model simulation for July with the solar declination set at the mid-July value and the sea-surface temperatures held at their average July values. The model monsoon circulation, especially the N-S pressure gradient, is now rather too strong but otherwise the surface pressure field is well simulated with the trough correctly placed over the Bay of Bengal. The general direction of the surface winds, with a direct current on to the southern slopes of the Himalayas, is well represe~~d although the southwest winds off the Arabian coast are too strong. Many important aspects of the rainfall distribution are well simulated, notably. the extensive dry area over the western Arabian sea, and the heavy rains over the Himalayas and Western Ghats of India due to the air rising over the mountain slopes. However rainfall over the Ganges valley and northern India is underestimated largely because the model fails to simulate the meso-scale monsoon depressions that originate over the Bay of Bengal.
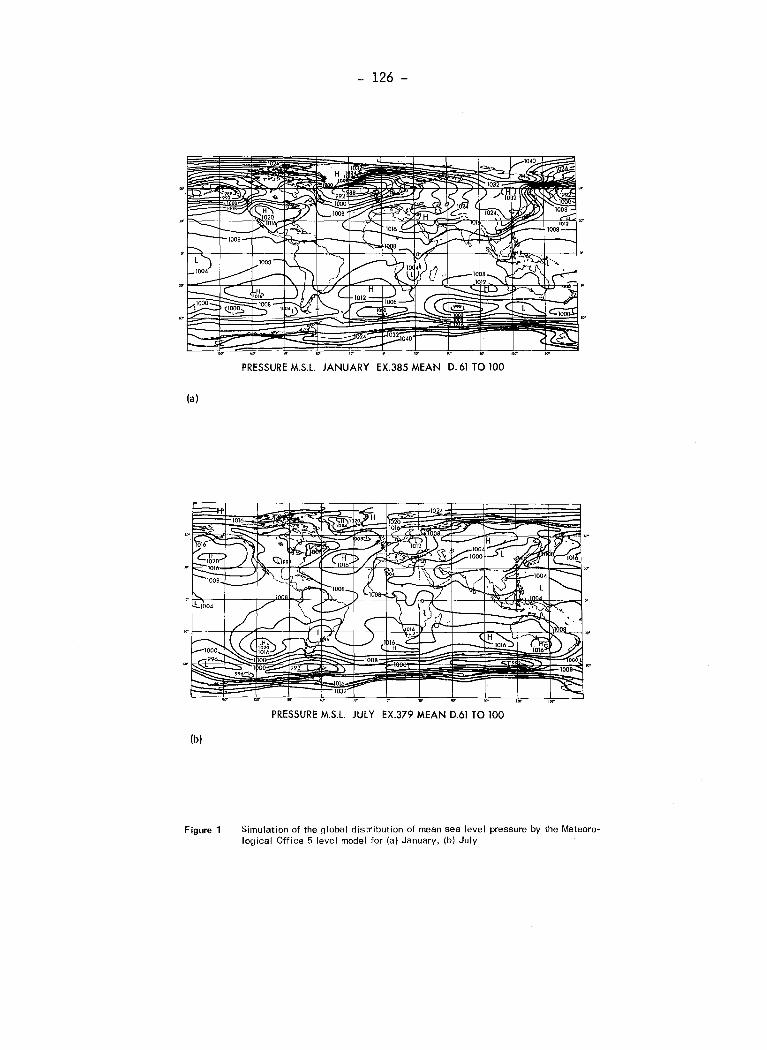
(a)
(b)
Figure 1
- 126 -
PRESSURE M.S.L. JANUARY EX.385 MEAN D. 61 TO 100
PRESSURE M.S.L. JULY EX.379 MEAN 0.61 TO 100
Simulation of the global distribution of mean sea level pressure by the Meteorological Office 5-level model for (a) January, (b) July

- 127 -
• 9 SIGMA LEVEl WINDS EX. 385 VAN) D 61 TO 100 MEAN
(a)
• 9 SIGMA LEVEl WINDS EX. 379 QUL Y) D 61 TO 100 MEAN
(b)
Figure 2 Simulation of global winds for (a) January, (b) July
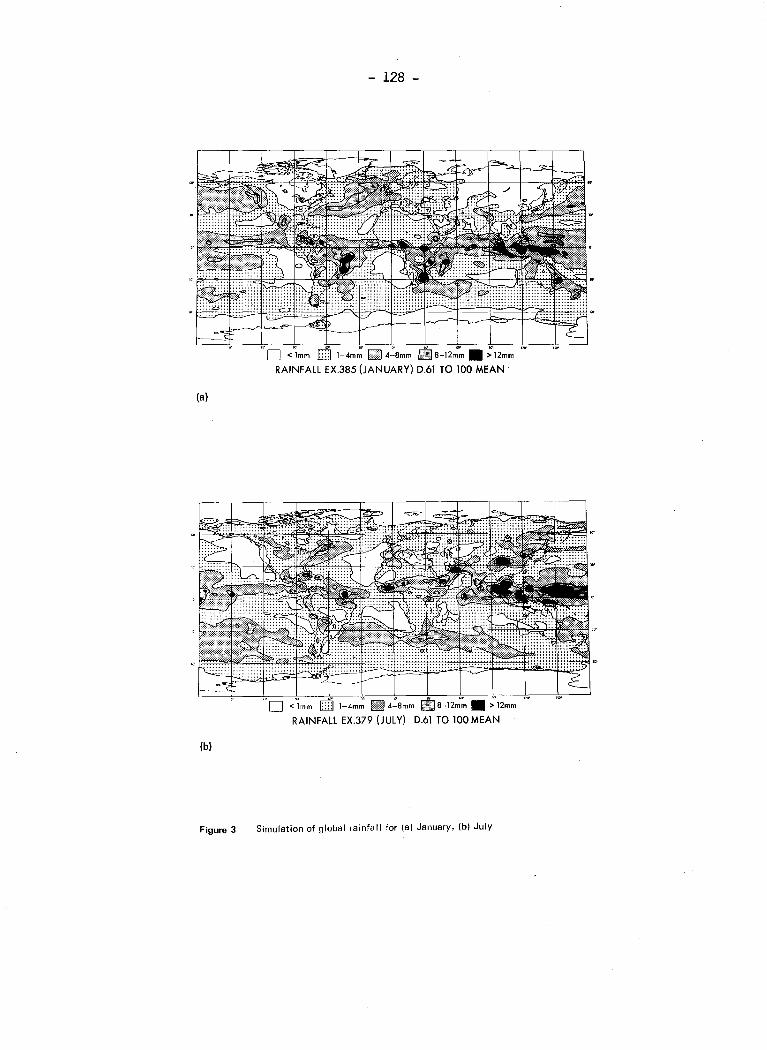
- 128 -
l-4mm Fil£14-Bmm 8-12mm • > 12mm
RAINFALL EX.385 (JANUARY) 0.61 TO 100 MEAN
(a)
; l-4mm I§§ 4-Bmm 8-12mwm • > 12mm
RAINFALL EX.379 (JULY) 0.61 TO 100MEAN
(b)
Figure 3 Simulation of global rainfall for (a) January, (b) July
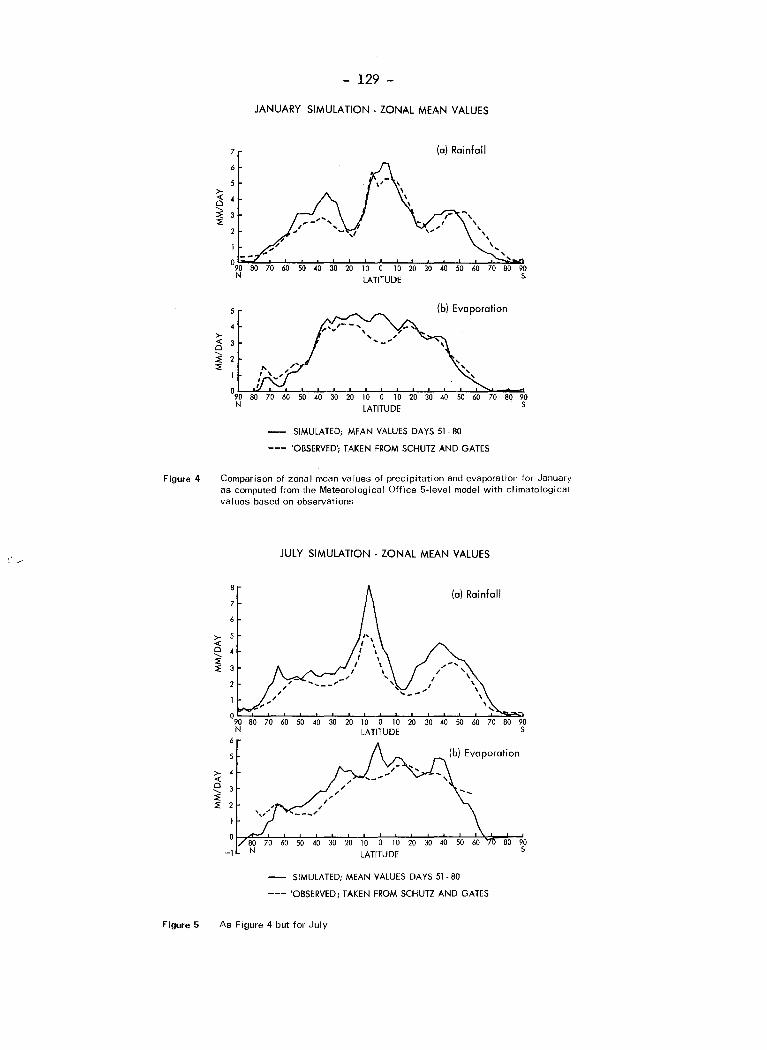
Figure 4
Figure 5
><( 0
' ::E ::E
- 129 -
JANUARY SIMULATION- ZONAL MEAN VALUES
(a) Rainfall
~,
' ' ' \ ' ...
' 09o so 10 60 so .eo Jo 20 10 o 10 20 Jo 40 so 60 70 s~ 90 N LATITUDE s.
(b) Evaporation
09~0~~~~~5~0~4~0~30~~20~1~0--0~~10~2~0~3~0~4~0~~~~7~0--8~0~90 N LATITUDE 5
SIMULATED; MEAN VALUES DAYS 51-80
'OBSERVED'; TAKEN FROM SCHUTZ AND GATES
Comparison of zona I mean values of precipitation and evaporation for January as computed from the Meteorological Office 5-level model with climatological values based on observations
><( 0
' ::E ::E 2
-1
JULY SIMULATION- ZONAL MEAN VALUES
(a) Rainfall
50 40 30 20 10 0 10 20 30 40 50 LATITUDE
10 0 10 LATITUDE
SIMULATED; MEAN VALUES DAYS 51-80
--- 'OBSERVED'; TAKEN FROM SCHUTZ AND GATES
As Figure 4 but for July
90 5
80 90 5

Figure 6
Figure 7
- 130 -
Sensible heating of the Boundary layer of Model B (11 layers)
-·-·--50 ----50
--0 -·-·-100
The net input of sensible heat into the lowest layer of the Meteorological Office 11-level model over the region of the Asian summer monsoon in July
11 -layer Model Surface Pressure
The computed mean sea level pressure distribution over the monsoon region for July

Figure 8
Figure 9
- 131 -
11- layer Model Winds at a = ·987
The computed average low-level flow (stream lines) at the lowest level (p/p5 ~ 0.987)
of the 11-level model for July
11- level model Rain
---- 1 -·-·-10 2 -·-·- 20 mm/day
············ 5 ----30
Computed average monsoon rainfall distribution in millimetres/day for July
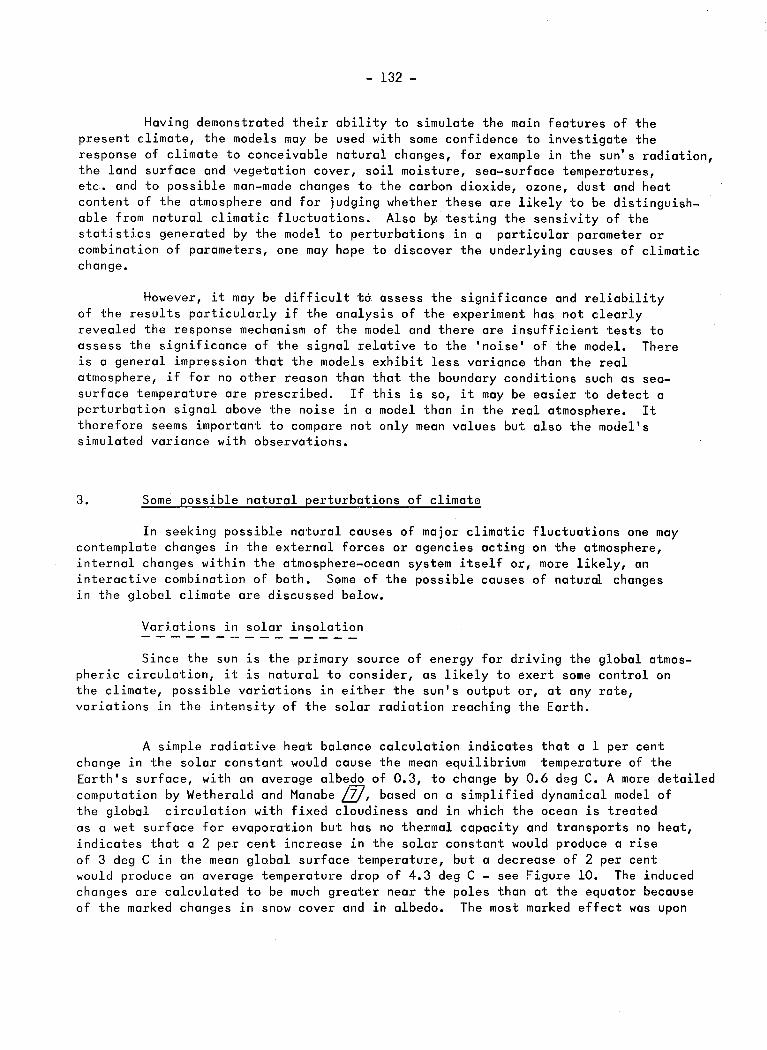
- 132 -
Having demonstrated their ability to simulate the main features of the present climate, the models may be used with some confidence to investigate the response of climate to conceivable natural changes, for example in the sun's radiation, the land surface and vegetation cover, soil moisture, sea-surface temperatures, etc. and to possible man-made changes to the carbon dioxide, ozone, d~st and heat content of the atmosphere and for judging whether these are likely to be distinguishable from natural climatic fluctuations. Also b~ testing the sensivity of the statistics generated by the model to perturbations in a particular parameter or combination of parameters, one may hope to discover the underlying causes of climatic change.
However, it may be difficult to assess the significance and reliability of the results particularly if the analysis of the experiment has not clearly revealed the response mechanism of the model and there are insufficient tests to assess the significance of the signal relative to the 'noise' of the model. There is a general impression that the models exhibit less variance than the real atmosphere, if for no other reason than that the boundary conditions such as seasurface temperature are prescribed. If this is so, it may be easier to detect a perturbation signal above the noise in a model than in the real atmosphere. It therefore seems important to compare not only mean values but also the model's simulated variance with observations.
3. Some possible natural perturbations of climate
In seeking possible natural causes of major climatic fluctuations one may contemplate changes in the external forces or agencies acting on the atmosphere, internal changes within the atmosphere-ocean system itself or, more likely, an interactive combination of both. Some of the possible causes of natural changes in the global climate are discussed below.
Variations in solar insolation
Since the sun is the primary source of energy for driving the global atmospheric circulation, it is natural to consider, as likely to exert some control on the climate, possible variations in either the sun's output or, at any rate, variations in the intensity of the solar radiation reaching the Earth.
A simple radiative heat balance calculation indicates that a 1 per cent change in the solar constant would cause the mean equilibrium temperature of the Earth's surface, with an average albedo of 0.3, to change by 0.6 deg C. A more detailed computation by Wetherald and Manabe LZ7, based on a simplified dynamical model of the global circulation with fixed cloudiness and in which the ocean is treated as a wet surface for evaporation but has no thermal capacity and transports no heat, indicates that a 2 per cent increase in the solar constant would produce a rise of 3 deg C in the mean global surface temperature, but a decrease of 2 per cent would produce an average temperature drop of 4.3 deg C - see Figure 10. The induced changes are calculated to be much greater near the poles than at the equator because of the marked changes in snow cover and in albedo. The most marked effect was upon

- 133 -
the precipitation where a 6 per cent change (from-4per cent to +2 per cent) in the solar constant produced a 27 per cent increase in the area-mean rates of precipitation. This particular model almost certainly exaggerates the changes in the mean surface temperature and precipitation but, even so, the implications are that a 1 per cent change in solar constant would change the surface temperature by only 1-2 deg C and the rainfall by around 5 per cent.
Since the solar output appears to change by a good deal less than 1 per cent, even during solar flares, it is not surprising that weather or climatic events show little correlation with the sunspot cycle.
However, on much longer time scales, the intensity of the solar radiation incident on the top of the atmosphere varies due to secular changes in the Earth's orbit with periodicities of about 96 000, 40 000 and 20 000 years. These fluctuations are much larger than any observed variations in the solar output. Ten thousand years ago, the incoming annual solar radiation was about 1 per cent greater at 65 deg N latitude than at present and 25 000 years ago it was 2 per cent less than at present.
The seasonal effects are even greater; for example at 10 000 BP (Before Present) the radiation received by the northern hemisphere in the summer half year was 4 per cent greater at all latitudes than at present whilst at 25 000 BP it was about 2 per cent less. Mason ~ showed that these deficiencies/excesses of radiative heating are sufficient to account for the major advances and recessions of the ice sheets in the northern hemisphere during the last half million years (see also L27 ).
Additional support comes from an experiment with the 5-level Met.O. model in which the effects of variations in the Earth's orbital parameters on global temperatures around the northern summer solstice were assessed by running two integrations, each for 60 days, one representing the solar insolation for the present day and the other for conditions prevailing 10 000 years ago. The model, in this experiment, contained an interactive radiative scheme with three cloud layers and, to avoid its thermal structure being determined by the initial sea-surface temperatures, the ocean was given a depth of 2 metres. Figure 11 shows the computed differences in zonal temperatures, averaged over the last 10 days of June, the atmosphere being warmer everywhere 10 000 BP when the Earth received about 7 per cent more solar radiation in June than at present, with surface temperatures 6 deg C higher in the Arctic basin and 4 deg C higher at 30°N.
Since, on average, the Earth's land surface reflects back about 15 per cent of the solar radiation, but with variations from about 8 per cent for dark green vegetation, to about go per cent for freshly fallen snow, widespread changes in vegetation, ice/snow cover or soil moisture could produce a significant change in the heat balance of the earth and hence in climate. On the whole man's activities tend to raise the Earth's reflectivity and so reduce the fraction of solar radiation available to warm the land surface. Simple calculations indicate that a 10 per cent change in the reflectivity of the land surface would change the mean global surface temperature by about 1 deg C.
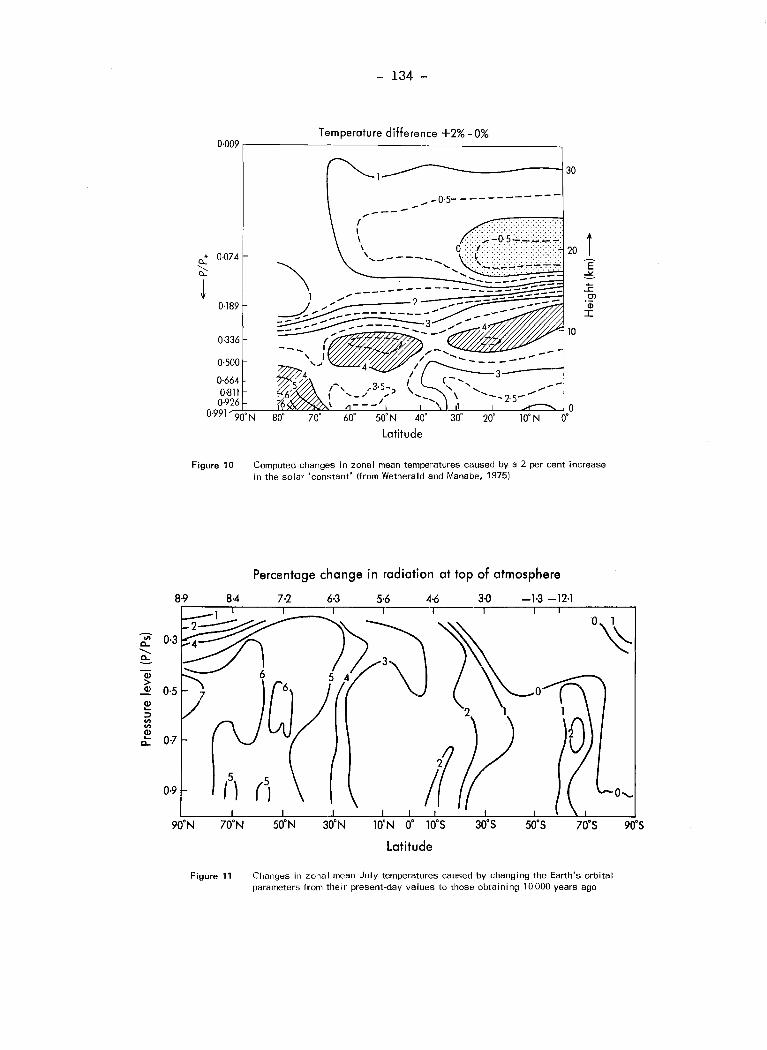
en c.. ......... c..
Q)
> Q)
~ ::> V> V>
~ c..
8·9
0·7
0·9
- 134 -
Temperature difference +2%- 0% 0·009 r---------------------~
. 0{)74 a.. 6::
! 0·189
0·336
0·500
0·664 0·811 0·926
0·991 90"N
\
_..- 0·5------------
50"N
Latitude
20 i E ~
..E .!::?' Q)
J:
Figure 10 Computed changes in zonal mean temperatures caused by a 2 per cent increase in the solar 'constant' !from Wetherald and Manabe, 1975)
Percentage change in radiation at top of atmosphere
8·4 7·2 6·3 3{) -1·3 -12·1
0~
/5) (5) If o..,_
90"N 70"N 10"5 so·5 70"5 90"5
Latitude
Figure 11 Changes in zonal mean July temperatures caused by changing the Earth's orbital parameters from their present-day values to those obtaining 10 000 years ago

Figure 12
Figure 13
- 135
Changes in northern hemisphere surface temperatures produced by replacing the polar ice by water at 0°C (from Newson, 1973}
Changes in surface pressure in millibars produced by introducing the observed anomaly of high sea surface temperature (broken lines} into the Meteorological Office 5-level model

- 136 -
In an experiment with the Meteorological Office 5-level model, reported
by Newson LIQ7, the Ar~tic sea ice was assumed to melt and be replaced by a water surface held at 0°C. The major effects of removing the ice, apart from the obvious one of warming the polar regions, were to weaken the intense polar anti-cyclone, to diminish the strength of the middle-latitude westerlies and their associated depressions, and to produce a significant cooling of up to 8 deg C in middle latitudes especially over the United States, eastern Siberia and western Europe as shown in Figure 12. This latter, rather unexpected result, serves to illustratethe limitations of intuitive judgements in dealing with such highly interactive, non-linear systems.
A similar lesson emerges from a numerical experiment in which Manabe
and Hahn L1I7 compare the simulations of the atmospheric circulation in the GFDL 11-level model using modern and ice-age boundary conditions. The surface conditions for 18 000 years ago, the peak of the glacial maximum, have been reconstructed by the CLIMAP Project ~in terms of sea-surface temperatures, land- and sea-ice, surface albedo and topography. Earlier opinion held that the extensive ice cover must have strengthened the meridional temperature gradient, intensified the Hadley circulation and therefore increased the tropical precipitation. However the model experiments indicate quite a different pattern.
The total global rainfall was 10 per cent lower in the ice-age simulation, the reduction over land being 31 per cent but only 1 per cent over the oceans. The global average surface temperature fell by 5.4 deg C the average drop over land being 7.7 deg C but only 4.4 deg C over the oceans. The increased albedo of the continents during the ice age, due to extensive ice sheets and sparse vegetation, produced lower tropospheric temperatures and higher surface pressures relative to the surrounding oceans. The resulting land-sea pressure gradients strengthened the outflow of continetal air accompanied by enhanced sinking and drying out of the air over the continents, reduced precipitation and increased aridity. This tendency was particularly marked over the tropical continents in conformity with recent geological evidence of drier conditions in tropical Africa and South America during the Pleistocene. The model results suggest some compensating increase of precipitation over the tropical and sub-tropical oceans.
Effect of surface albedo and soil moisture and desertification
Stimulated bv the interest and concern over the recent droughts in the Sahel region of Africa, Walker and Rowntree ~ carried out model experiments to investigate the regional effects of changing the soil moisture of the Sahara · using a limited-area and simplified version of the Meteorological Office 11-level model. Comparisons were made between one set of simulations in which the Sahara desert, placed between moist zones representing the North African coastal strip and the savanna region to the South, was made initially dry with no soil moisture, and another series in which the Sahara region was made initially wet with 10 cm of soil moisture. In the first series, shallow depressions crossed the region but
- 137 -
produced little precipitation because there was no surface moisture to feed and maintain them. In the second case the surface temperatures over the wet ground fell by as much as 20 deg C, cooling extended up to heights of 5 km, and major depressions developed producing widespread rain, heavy in places, which persisted during the 20 days of the experiment. It appears that once an area of this size becomes wet it tends to maintain itself in this state.
In fact rainfall anomalies in this part of Africa do tend to persist once they become established early in the season, and also tend to persist from year to year to give groups of wet and dry years. The reason may well be that both dry and wet regimes tend to be self sustaining through the positive feedback effects of soil moisture assisted by changes in vegetation cover and albedo. Lack of vegetation will result in higher surface albedo and the consequent radiation deficit in the lower atmosphere would, according to Charney Ll4, 1i7, require a sinking motion end mid-tropospheric inflow of air to maintain the heat balance and this, in turn, leads to additional warming and drying and therefore maintenance of desert conditions.
There is evidence both from model experiments and from direct observations to suggest that large-scale, persistent anomalies in ocean-surface temperatures, produce anomalies in the atmospheric circulation. Forcing of the atmosphere by the ocean is especially noticeable in the tropics but the influence of tropical seasurface temperature anomalies sometimes spreads into m~ddle latitudes.
During the winter of 1962/3, the coldest in Britain for 250 years, a large area of the eastern tropical Atlantic Ocean was up to 2.5 deg C warmer than normal as shown in Figure 13. Rowntree ~ found that when this anomaly was inserted into the Meteorological Office 5-level model it produced an area of low surface pressure with a deficit of 7 mb centred west of the Bay of Biscay and an extensive area of high pressure with rises of up to 13 mb centred just east of Greenland. The modified circulation resulted in a strong easterly flow over the British Isles reminiscent of that which produced the very cold winter of 1962/3.
4. Some possible man-made perturbations
Since the total sensible heat generated by human activites is at present about 0.01 per cent of the total solar input to the atmosphere and Earth, the global effects are well below a level that can be either calculated or detected. However, over the next 50 years the world consumption of energy may well increase fourfold to 30 TW (lol2w = 1 TW) and much of this may be released as waste heat into the atmosphere and oceans from very large nuclear power plants. Such plants may be concentrated in large floating parks over the oceans where the heat can be most easily dispersed. The possible impact of such energy parks on the global climate has been investigated using the Meteorological Office 5-level model. A total output of 300 TW was divided equally between two sites of area 400 000 km 2 , one off southwest Ireland, and the other off Japan. The average heat flux of
- 138 -
375 W m-2 was about five times the local solar input. The result was th~t the model climate was altered significantly over most of the northern hemisphere. With half this heat output, the response was less but still large and .widespread •. Since 150 TW is about 20 times the present world consumption of energy,it may well be that the climatic effects of waste heat during the next 50 years will be much less than in these experiments.
The concentration of carbon dioxide in the atmosphere has increased by about 15 per cent during this century and is currently rising at about 0.3 per cent per annum due largely to the burning of fossil fuels. Since it strongly absorbs the long wave radiation emitted by the Earth's surface, higher concentrations of carbon dioxide should produce higher temperatures in the troposphere by the so called ·greenhouse effect but, because the C02 in the stratosphere emits more infrared radiation to space than it absorbs, there should be a corresponding cooling of the stratosphere. This is confirmed by the model calculations of Manabe and Wetherald LIZ7 using a limfred area version of the model described in [Z7 with no seasonal variations. Starting from an isothermal atmosphere at rest, the model equations were integrated over a period of 800 days, the results being averaged over the last lOO days to give an equilibrium climate both for the present concentration of carbon dioxide and for double this concentration.
Doubling the carbon dioxide content everywhere raises the temperature of the model troposphere and cools the stratosphere as shown in Figure 14. The increase in the average global surface temperature is 3 deg C, with a maximum of 10 deg C in polar regions caused partly by the retreat of the highly reflecting ice and snow surfaces and partly by the thermal stability of the lower troposphere limiting convective heat transfer to the lowest layers. In the tropics this warming is spread throughout the entire troposphere by intense moist convection and so the temperature rise is smaller. Doubling the carbon dioxide also increases the intensity of the model's hydrological cycle, the average annual evaporation and precipitation both being increased by about 7 per cent.
However it is important to stress that, because of the deficiencies of such a simple model, these results shouilid be regarded as indicative rather than definitive and of only qualitative value. Since the cloudiness in the model is fixed and the ocean is represented by only a wet surface incapable of storing or transporting heat, the predicted changes are almost certainly exaggerated. Even so, they indicate that the 15 per cent increase in carbon dioxide since 1900 AD has probably not increased overage global surface temperatures by more than a few tenths of a degree and polar temperatures by more than 1 deg C. A doubling of carbon dioxide, on the other hand, could well cause average global surface temperatures to rise by 2 deg C with considerable regional and local variations and rises in polar regions of perhaps 5 deg C with an uncertainty factor of two either way. The timing of such changes is a matter of debate with estimates depending heavily on projections for the future rates of fossil fuel consumption and the take up of carbon dioxide by the oceans and the biosphere. Should the atmospheric carbon dioxide continue to increase at the present rate the concentration will double by about the year 2050 AD but some projections put it as early as 2030 AD.
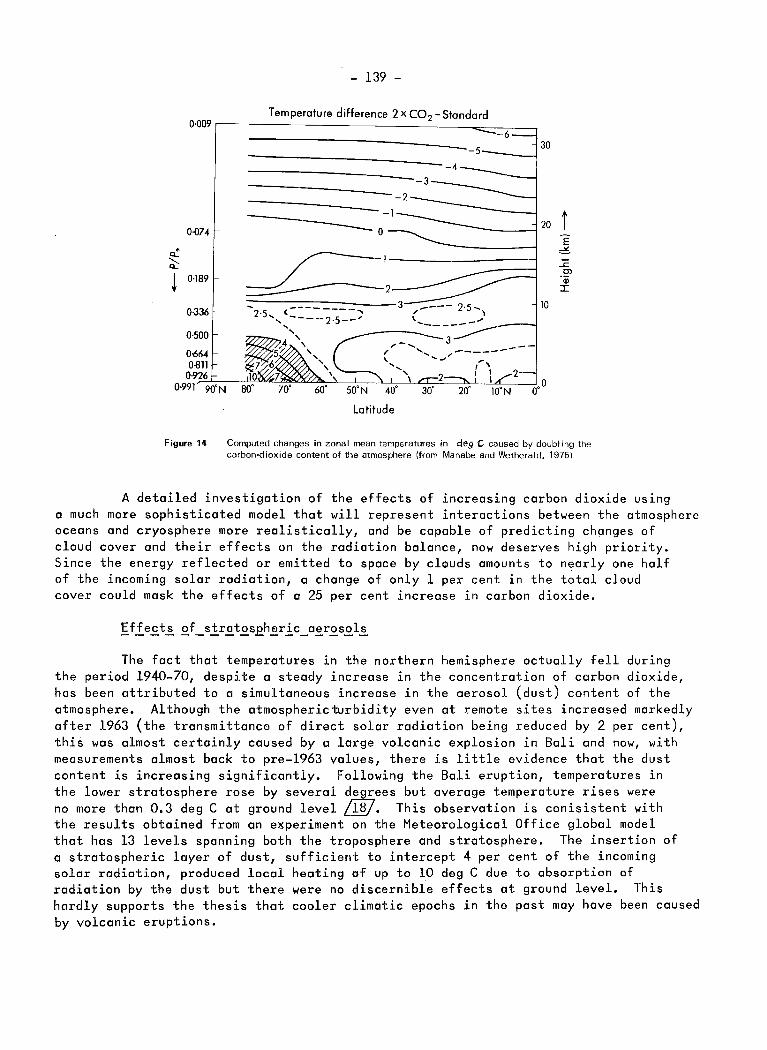
~ ;:;:.
!
- 139 -
Temperature difference 2 x C0 2 - Standard 0·009r---------------=:___--=---;----,
-----0
-1
0·074
0·189 ~', 0·336
0·500
0-664 0-811
0·926 0·991 90'N
Latitude
30
20 t E ~
.1: 0>
'Qi I
10
Figure 14 Computed changes in zonal mean temperatures in de9 C caused by doubling the carbon-dioxide content of the atmosphere (from Manabe and Wetherald, 1975)
A detailed investigation of the effects of increasing carbon dioxide using a much more sophisticated model that will represent interactions between the atmosphere oceans and cryosphere more realistically, and be capable of predicting changes of cloud cover and their effects on the radiation balance, now deserves high priority. Since the energy reflected or emitted to space by clmuds amounts to nearly one half of the incoming solar radiation, a change of only 1 per cent in the total cloud cover could mask the effects of a 25 per cent increase in carbon dioxide.
The fact that temperatures in the northern hemisphere actually fell during the period 1940-70, despite a steady increase in the concentration of carbon dioxide, has been attributed to a simultaneous increase in the aerosol (dust) content of the atmosphere. Although the atmosphericturbidity even at remote sites increased markedly after 1963 (the transmittance of direct solar radiation being reduced by 2 per cent), this was almost certainly caused by a large volcanic explosion in Bali and now, with measurements almost back to pre-1963 values, there is little evidence that the dust content is increasing significantly. Following the Bali eruption, temperatures in the lower stratosphere rose by several JegJees but average temperature rises were no more than 0.3 deg C at ground level 18 • This observation is conisistent with the results obtained from an e~periment on the Meteorological Office global model that has 13 levels spanning both the troposphere and stratosphere. The insertion of a stratospheric layer of dust, sufficient to intercept 4 per cent of the incoming solar radiation, produced local heating of up to 10 deg C due to absorption of radiation by the dust but there were no discernible effects at ground level. This hardly supports the thesis that cooler climatic epochs in the past may have been caused by volcanic eruptions.
- 140 -
5. Depletion of stratospheric ozone
Ih~ Eo1e_of ~i1r£g~n_o~i~e~ 2 !h~ fo~C£r~e_pEo£l~m
Johnston L2/ suggested that the injection of nitrogen oxides NOx into the stratosphere by supersonic aircraft would cause additonal destruction of the ozone and that there might also be significant climatic effects. The early calculations were based on inadequate knowledge of the natural concentrations of NOx in the stratosphere, of the reaction rates of many of the chemical processes, and largely ignored the role of the air motions in distributing the NOx from the aircraft exhausts through the stratosphere.
However, as a result of a recent intensive research prog~amme (Murgatroyd et al) LlQ?, co-ordinated by the Meteorological Office, and similar programmes in the United States and in France, considerable progress has been made in measuring many of the chemical species from high-level balloons and aircraft, including Concorde itself; in studying the potentially importantchemical reactions in the laboratory; and in building complex models of the stratospheric air motions and photo-chemistry to calculate both the natural concentrations and distribution of ozone and their possible perturbations - see, for example, Tuck ~ and Thrush ~.
Although many details remained to be settled and new chemical reactions were continually being suggested, there was in 1975 a general consensus of opinion that 500 Concordes each flying an average of 5 hours per day would reduce the total ozone by no more than 1 per cent and that such a small reduction could not be distinguished from the much larger natural fluctuations. However, since then 1
Burrows et al.L117 discovered that NO is converted to nitric acid much faster than was first thought and is therefore a much less powerful destroyer of ozone. Indeed, according to Thrush~' the overall effect of the emission of nitrogen oxides by Concordes flying below 18 km might be a small increase rather than a small depletion of, ozone. In any case, the small number of supersonic transport aircraft likely to fly during the next decade will have no detectable effect on the ozone or the climate.
Ih~ ~e£l~tio~ £f_o~o~e_by ~h1oEo£l~oEo~aEb£n~
In 1974 Rowland and Molina ~ suggested that clorofluorocarbons, when released into the atmosphere from aerosol canisters, refrigerators and air-conditioning units, would be carried up into the stratosphere where they would be decomposed by ultraviolet radiation to produce free chlorine atoms that would catalyse the destruction of ozone.
The most recent calculations, using simple one-dimensional models in radiative equilibrium and no dynamics, suggest that the depletion of total ozone by chlorofluorocarbons is likely to be about twice that of earlier estimates. Thus if the annual global production were to be held at the present rate of 700 000 tonnes (to which the United Kingdom contributes about 6 per cent) their concentration would b~ild up cumulatively over mony years and reach a steady state at about 10 times the present level by the year 2100 and reduce the total ozone by about 14 per cent,
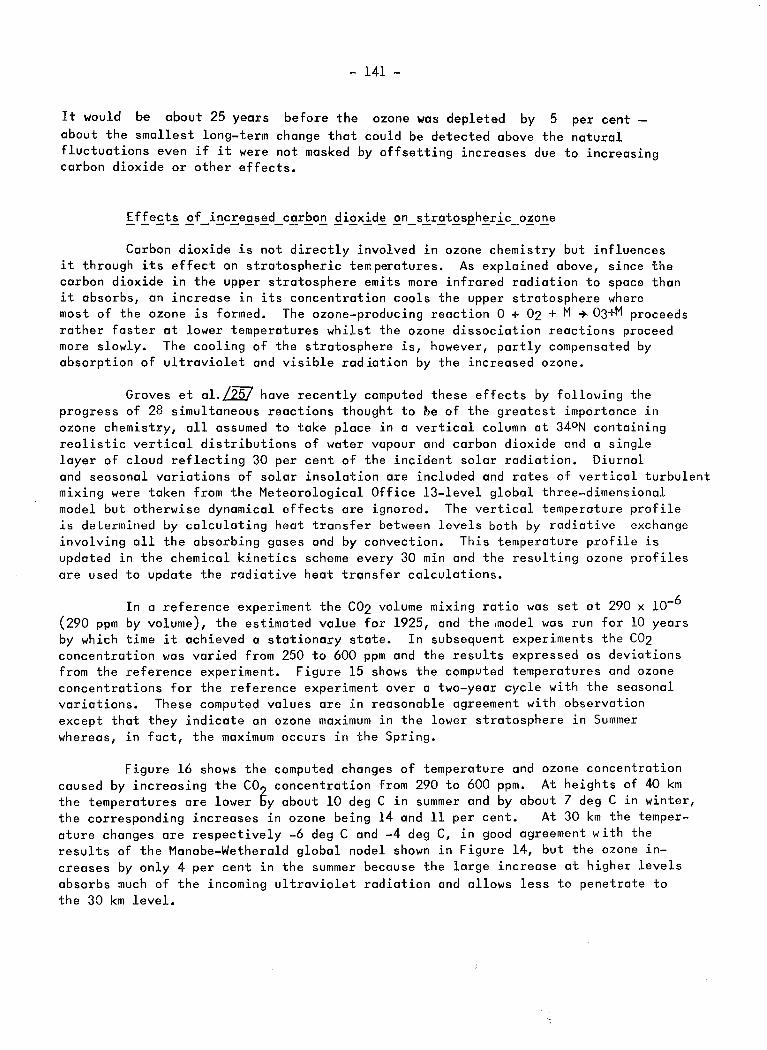
- 141 -
It would be about 25 years before the ozone was depleted by 5 per cent -about the smallest long-term change that could be detected above the natural fluctuations even if it were not masked by offsetting increases due to increasing carbon dioxide or other effects.
Carbon dioxide is not directly involved in ozone chemistry but influences it through its effect on stratospheric temperatures. As explained above, since the carbon dioxide in the upper stratosphere emits more infrared radiation to space than it absorbs, an increase in its concentration cools the upper stratosphere where most of the ozone is formed. The ozone-producing reaction 0 + 02 +M +03+M proceeds rather faster at lower temperatures whilst the ozone dissociation reactions proceed more slowly. The cooling of the stratosphere is, however, partly compensated by absorption of ultraviolet and visible radiation by the increased ozone.
Groves et al.~ have recently computed these effects by following the progress of 28 simultaneous reactions thought to be of the greatest importance in ozone chemistry, all assumed to take place in a vertical column at 34°N containing realistic vertical distributions of water vapour and carbon dioxide and a single layer of cloud reflecting 30 per cent of the incident solar radiation. Diurnal and seasonal variations of solar insolation ore included and rotes of vertical turbulent mixing were token from the Meteorological Office 13-level global three-dimensional model but otherwise dynamical effects ore ignored. The vertical temperature profile is determined by calculating heat transfer between levels both by rodiotive exchange involving all the absorbing gases and by convection. This temperature profile is updated in the chemical kinetics scheme every 30 min and the resulting ozone profiles ore used to update the radiotive heat transfer calculations.
In a reference experiment the C02 volume mixing ratio was set at 290 x 10-6
(290 ppm by volume), the estimated value for 1925, and the .model was run for 10 years by which time it achieved a stationary state. In subsequent experiments the C02 concentration was varied from 250 to 600 ppm and the results expressed os deviations from the reference experiment. Figure 15 shows the computed temperatures and ozone concentrations for the reference experiment over a two-year cycle with the seasonal variations. These computed values ore in reasonable agreement with observation except that they indicate an ozone maximum in the lower stratosphere in Summer whereas, in fact, the maximum occurs in the Spring.
Figure 16 shows the computed changes of temperature and ozone concentration caused by increasing the C02 concentration from 290 to 600 ppm. At heights of 40 km the temperatures ore lower by about 10 deg C in summer and by about 7 deg C in winter, the corresponding increases in ozone being 14 and 11 per cent. At 30 km the temperature changes are respectively -6 deg C and -4 deg C, in good agreement with the results of the Manabe-Wetherald global nodel shown in Figure 14, but the ozone increases by only 4 per cent in the summer because the large increase at higher levels absorbs much of the incoming ultraviolet radiation and allows less to penetrate to the 30 km level.
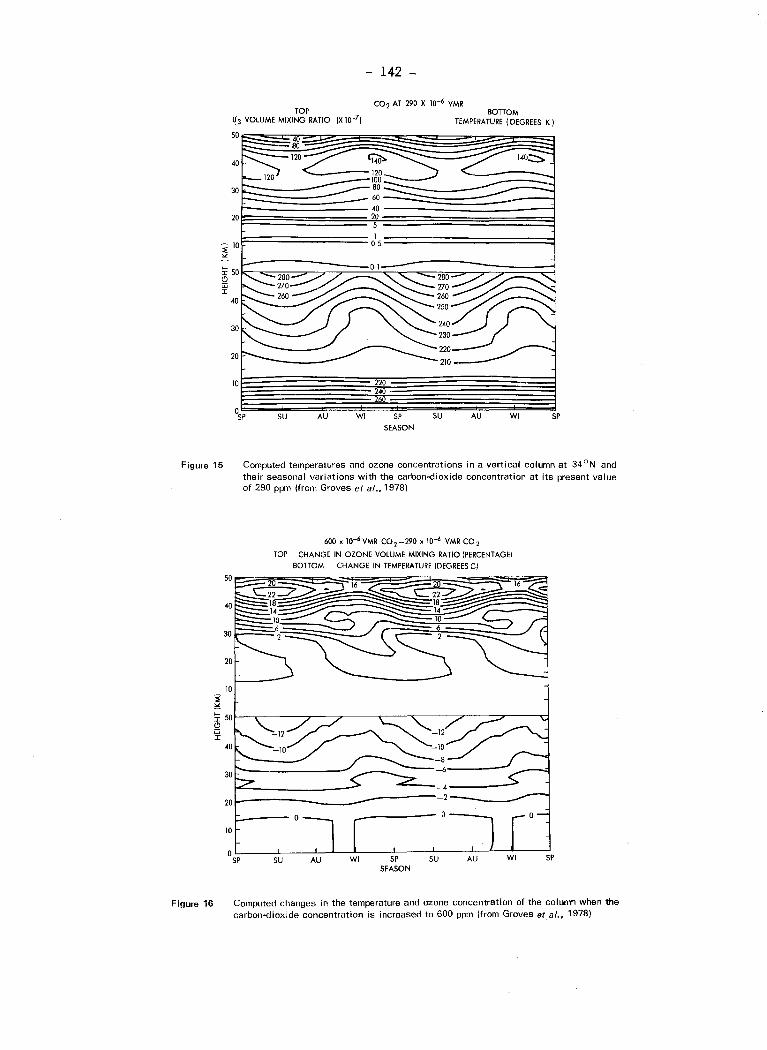
Figure 15
Figure 16
10
TOP 03 VOLUME MIXING RATIO (X w-7)
- 142 -
C02 AT 290 X w-6 VMR BOTTOM
TEMPERATURE (DEGREES K)
10~~~~220~~~~~ ~ 240
0sP SU AU Wl SP SU AU Wl SP
SEASON
Computed temperatures and ozone concentrations in a vertical column at 34 °N and their seasonal variations with the carbon-dioxide concentration at its present value of 290 ppm (from Groves et al .. 1978)
600 x 10-6 VMR C0 2 -290 x 10-6 VMR CO 2
TOP CHANGE IN OZONE VOLUME MIXING RATIO (PERCENTAGE)
BOTTOM CHANGE IN TEMPERATURE (DEGREES CJ
1:.-----0
0sLP ______ SLU----~ALU~L_-WJ_I _____ SiP ______ SLU ______ ALU __ L-~WLI-----JS"P
SEASON
Computed changes in the temperature and ozone concentration of the column when the carbon-dioxide concentration is increased to 600 ppm (from Groves et al .• 1978)
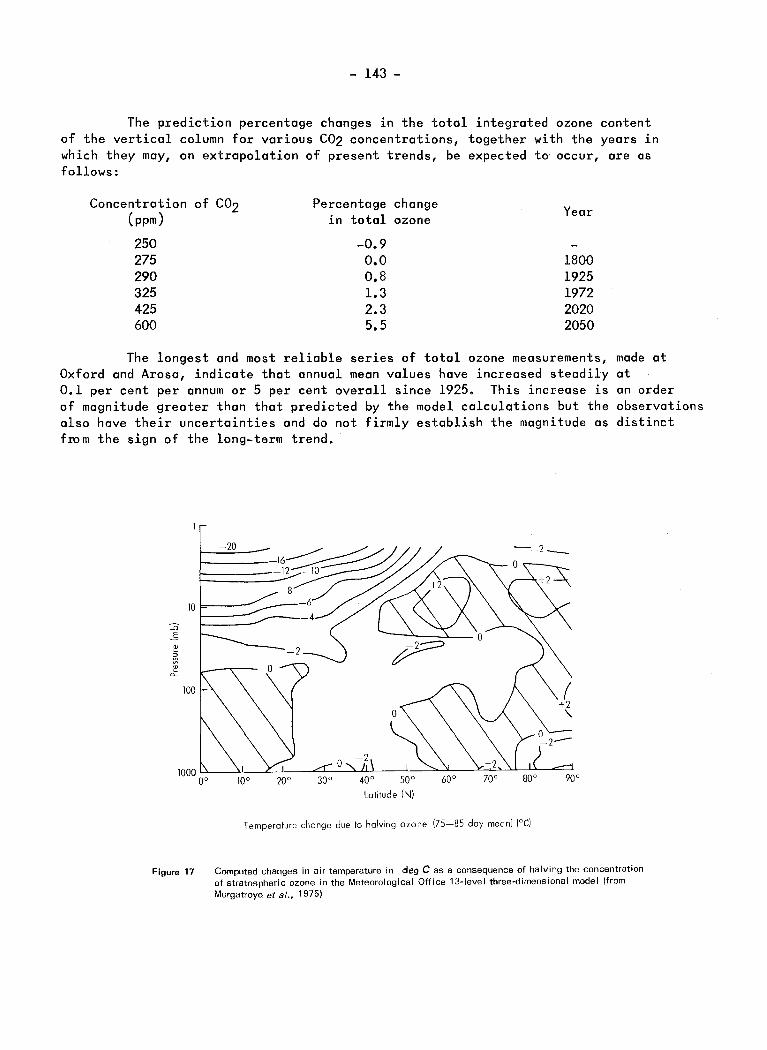
- 143 -
The prediction percentage changes in the total integrated ozone content of the vertical column for various C02 concentrations, together with the years in which they may, on extrapolation of present trends, be expected to occur, are as follows:
Concentration of C02 Percentage change Year (ppm) in total ozone
250 -0.9 275 o.o 1800 290 0.8 1925 325 1.3 1972 425 2.3 2020 600 5.5 2050
The longest and most reliable series of total ozone measurements, made at Oxford and Arosa, indicate that annual mean values have increased steadily at 0.1 per cent per annum or 5 per cent overall since 1925. This increase is an order of magnitude greater than that predicted by the model calculations but the observations also have their uncertainties and do not firmly establish the magnitude as distinct frum the sign of the long-term trend.
-20
10
::0 .5 ~ => :;: ~
0-
lOO
lOOOo~o~--~lOLo--~~20-o--~3~0-o~~4nO~o----5~0-o~~6~0-o--~~~~~~~
Latitude (N)
Figure 17
Temperature change due to halving ozone (75-85 day mean) (°C)
Computed changes in air temperature in deg Cas a consequence of halving the concentration of stratospheric ozone in the Meteorological Office 13-level three-dimensional model !from
Murgatroyd et al., 1975)
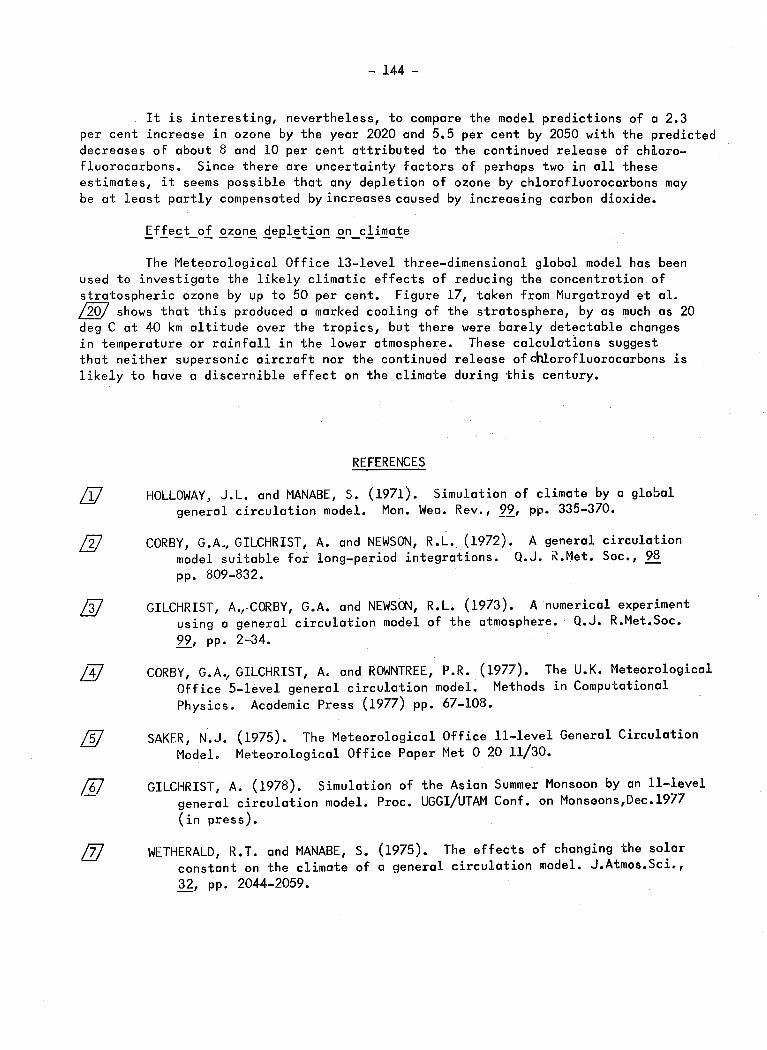
- 144 -
It is interesting, nevertheless, to compare the model predictions of a 2.3 per cent increase in ozone by the year 2020 and 5.5 per cent by 2050 with the predicted decreases of about 8 and 10 per cent attributed to the continued release of chiorofluorocarbons. Since there are uncertainty factors of perhaps two in all these estimates, it seems possible that any depletion of ozone by chlorofluorocarbons may be at least partly compensated by increases caused by increasing carbon dioxide.
The Meteorological Office 13-level three-dimensional global model has been used to investigate the likely climatic effects of reducing the concentration of stratospheric ozone by up to 50 per cent. Figure 17, taken from Murgatroyd et al. L1Q7 shows that this produced a marked cooling of the stratosphere, by as much as 20 deg C at 40 km altitude over the tropics, but there were barely detectable changes in temperature or rainfall in the lower atmosphere. These calculations suggest that neither supersonic aircraft nor the continued release ofchlorofluorocarbons is likely to have a discernible effect on the climate during this century.
!J]
REFERENCES
HOLLOWAY, J.L. and MANABE, S. (1971). Simulation of climate by a global general circulation model. Mon. Wea. Rev., 99, pp. 335-370.
CORBY, G.A., GILCHRIST, A. and NEWSON, R.L. (1972). A general circulation model suitable for long-period integrations. Q.J. ~.Met. Soc., 98 pp. 809-832.
GILCHRIST, A.,.CORBY, G.A. and NEWSON, R.L. (1973). A numerical experiment using a general circulation model of the atmosphere. Q.J. R.Met.Soc. 99, pp. 2-34.
CORBY, G.A./ GILCHRIST, A. and ROWNTREE, P.R. (1977). Office 5-level general circulation model. Methods Physics. Academic Press (1977) pp. 67-108.
The U.K. Meteorological in Computational
SAKER, N.J. (1975). The Meteorological Office !!-level General Circulation Model. Meteorological Office Paper Met 0 20 11/30.
GILCHRIST, A. (1978). Simulation of the Asian Summer Monsoon by an !!-level general circulation model. Proc. UGGI/UTAM Conf. on Monsaons,Dec.l977 (in press).
WETHERALD, R.T. and MANABE, S. (1975). The effects of changing the solar constant on the climate of a general circulation model. J.Atmos.Sci., 32, pp. 2044-2059.

- 145 -
MASON, B.J. (1976). Towards the understanding and prediction of climatic variations. Q.J. R.Met.Soc., 102, pp. 473-498.
HAYS, J.D., IMBRIE, J. and SHACKLETON, N.J. (1976). Variations in the Earth's orbit: pacemaker of the ice ages. Science, 194, pp. 1121-1132.
NEWSON, R.L. (1973). Response of a general circulation model of the atmosphere to removal of the Arctic ice-cap. Nature, 241, No 5384 pp. 39-40.
MANABE, S. and HAHN, D.G. (1977). Simulation of the tropical climate of an ice-age. J.Geo.Res., 82, pp. 3889-3911.
CLIMAP Project Members (1976). The surface of the ice-age earth. Science 191 pp. 1131-1138.
WALKER, J. and ROWNTREE, P.R. (1977). The effect of soil moisture on circulation and rainfall in a tropical model. Q.J. R.Met.Soc. 103. pp.29-46.
CHARNEY, J.G. (1975). Dynamics of deserts and drought in the Sahel. Q.J. R.Met.Soc. 101, pp. 193-202.
CHARNEY J.G., QUIRK, W.J., CHOW, S.H. and KORNFIELD, J. (1977). A comparative study of the effects of albedo change on drought in semiarid regions. J.Atmos. Sci., 34, pp. 1366-1385.
ROWNTREE, P.R. (1976). Response of the atmosphere to a·tropical Atlantic ocean temperature anomaly. Q.JI. R.Met.Soc., 102, pp. 607-625.
MANABE, S. and WETHERALD, R.T. (1975). The effects of doubling the C02 concentration on the climate of a general circulation model. J.Atmos. Sci., 32, pp. 3-15.
ANGELL, J.K., and KORSHOVER, J. (1978). Global temperature variationsurface to 100mb: an update into 1977. Mon.Wea.Rev., !~~' pp. 775-770.
JOHNSTON, H.S. (1971). Reduction of stratosp~eric ozone by nitrogen oxide catalysts from supersonic transport exhausts. Science, 173, pp. 517-522.
MURGATROYD, R.J. et al. (1975). Report of Committeee on Meteorological Effects of Stratospheric Aircraft, Meterological Office, Bracknell, pp. 485-506.
TUCK, A.F. (1978). A comparison of one, two and three-dimensional model representations of stratospheric gases. Phil.Trans.Roy.Soc., A. (in press)
THRUSH, B.A. (1978). Aspects of the chemistry of ozone depletion. Phil. Trans. Roy.Soc., A. (in press).

- 146 -
~ BURROWS, J.P., HARRIS, G.W. and THRUSH, B.A. (1977). Rates of reaction of H02 with HO and 0 studied by laser magnetic resonance. Nature, 267, pp. 233-234.
~ ROWLAND, F.S. and MOLINA, M.J. (1974). Stratospberic sink for chlorofluoro-methanes: chlorine atom-catalyzed destruction of ozone. Nature, 249, pp. 810-812.
/25/ GROVES, K.S., MATTINGLEY, S.R. and TUCK, A.F. (1978). Increased carbon dioxide and stratospheric ozone. Nature 273, pp. 711-715.
A SCENARIO OF POSSIBLE FUTURE CLIMATES - NATURAL AND MAN-MADE
H. Flohn*
1. Introduction
Neglecting minor effects, cooling on a global scale could be produced by a sequence of heavy volcanic eruptions, by a hypothetical decrease of the extraterrestrial solar radiation, or perhaps by a large scale surge of the west Antarctic ice-sheet. Warming could be the result of a hypothetical increase of solar radiation, of a lull in volcanic activity or of an increase of the greenhouse effect of infrared absorbing gases (carbon dioxide, nitrous oxide, etc.). Other effects are referred to in the overview papers by Gates and Munn.
Internal feedback mechanisms within the climatic system lead to cooling or warming in the polar regions at a rate about three times the global average. No model is available to simulate all significant feedback mechanisms between ocean, ice and snow; the atmosphere and biota; and clouds and radiation. Rational patterns of a cooler or warmer climate can therefore best be described by using historical examples of such climates. In each case, however, it is necessary to discuss the changes of the boundary conditions - such as displacements of the coastline, changes of the surface albedo due to ice or vegetation and even changes in the heights of the mountains.
Regarding the case of a possible warming, it is necessary to add some consideration of the role of man-induced changes in the composition of the atmosphere. In addition to the role of carbon dioxide (C02 ), the effect of other infrared-absorbing gases can be approximately expressed in terms of a virtual C02 content. Taking into account the future increase of nitrous oxide (N20), methane (CH4), ammonia (NH3) and the chlorofluoromethanes (see overview papers by Munn and Mason) the greenhouse effect of C02 must be increased considerably. It is proposed to add 50% (or -probably less realistically - lOO%) to the C02 increase above the present level (330 ppm) and to define this value as virtual C02 content. Excluding the polar regions, the relationship between temperature increase and the virtual C02 content can be described by a model of Augustsson and Ramanathan. This is used in Table 1 to relate representative temperature changes of some historical examples of warmer climates to equivalent levels of the virtual and real C02 content. Two extreme versions of the Augustsson-Ramanathan model give the estimates entered in the second column but only the higher figure is related to the last two columns. As an example, the data given here indicate that the stage of the Eem Interglacial could possibly be reached with a (real) C02 content of about 500-550 ppm.
* Meteorological Institute, University of Bonn, Federal Republic of Germany.

- 148 -
Table 1
Paleoclimatic warm episodes, temperature increase (~T), equivalent virtual and real C02 level.
6T Virtual C02 Real C02 (ppm) +50%
Mediaeval warm phase + l.0°C 432
(900-1050 AD) 420-490
Holocene warm phase + l.5°C 475-580 492
( "-"6000 BP)
Eern Interglacial + 2.0°C 530-670 555 ( "" 125 000 BP)
Ice-free Arctic Ocean + 4.00C 780-1150 878 (12 - 2.5 Ma BP)
* i.e. with a 50% (lOO%) contribution of trace gases to the increase of virtual C02. Ma = 106 years
2. Warm episodes in climatic history
level* +lOO%
405
450
495
740
In the following paragraphs the examples selected in Table 1 are described, together with some of their implications.
This period was characterized by a lack of sea-ice in the East Greenland Current and by a distinctly more hospitable climate in Scandinavia, Iceland, Greenland and the Canadian archipelago. Warm and dry summers prevailed in Europe, but severe winters have also been reported; similar conditions apparently prevailed also in Eastern Asia. The Caspian and Dead Seas were low; interior California and SW Colorado were also warmer and drier than now, while parts of the Sahara were apparently less arid. These and other data suggest a shift of the cyclone tracks by a few hundred km towards the north, with frequent blocking situations.
After the melting of the Scandinavian ice-sheet (about 8000 BP), large portions of the North American ice remained until about 6500 BP, while the Labrador ice finally melted but not before 4500 BP. Between these dates a quasi-stationary trough-ridge situation developed, with a distinct warm period in parts of Europe, Asia and Africa (around 6000 BP, ~T = +l.5°C) and in North America west of about 100°W, while eastern North America remained rather cool. During the cooler season, polar air frequently invaded central and eastern Europe, producing increased rainfall
- 149 -
in the Mediterranean and North Africa. Somewhat later (after 4500 BP) the arctic sea-ice retreated to its central core, and subarctic forests advanced about 300 kms beyond their present poleward limits to the northernmost parts of Norway, of the Taimyr Peninsula, and of the Mackenzie delta, including Banks Island (74°N). Permafrost retreated in eastern Siberia (and probably also in North America) several hundred kilometres north of its present boundary. Nearly everywhere the climate was somewhat wetter than now, except for some limited areas of Wisconsin and Illinois and of SW Siberia.
The most remarkable feature was an extended moist period in the whole arid belt of the Old World, extending from West Africa to Rajasthan in NW India and lasting from about 10 000 BP until a marked desiccation simultaneous with the final melting of the American ice-sheet. Even in the arid centre of the Sahara the annual rainfall has been estimated at 250-400 mm~ompared with less than 5 mm now); Lake Chad rose more than 40 m and reached the size of the Caspian Sea, with an overflow to the Benue-Niger catchment. Widespread grasslands were extensively utilized by cattle-raising nomads, and cereals were cultivated without irrigation in some now arid areas of the Near and Middle East, including Rajasthan. The early high civilizations between Nile and Indus started at the end of this relatively wet period and had to combat the gradual desiccation after about 5000 BP. Simultaneously with this moist period, only a few areas in the belt 35°-40°N experienced more arid conditions, as evidenced in interior California and Nevada, in eastern Anatolia and Iran. Simultaneous rainfall increase on both flanks of the arid belt - subtropical winter rains and tropical summer rains - has been observed in Australia, though in southern Africa evidence for more arid conditions has been found. The tropical circulation was weakened, with the consequence of decreasing oceanic upwelling along the equator, and off some coasts, leading to higher evaporation and higher rainfall.
A critical evaluation of these facts reveals a distinct change in boundary conditions: the existence before 5000 BP of ice-sheets in Labrador and adjacent areas, and a closed vegetation cover in the Sahara and adjacent areas, with a lower albedo. In the near future formation of a permanent snow-cover over Labrador is highly imp~obable. The extent to which the slow but detrimental feedback of desertification -7 albedo increase ~increasing subsidence -7 less rainfall ~ extended desertification can be interrupted and reversed depends on socio-economic conditions, which should allow for protection of the natural vegetation. However, a direct effect of this mechanism on present rainfall (since about 1900) has not yet been demonstrated. A return of such benign conditions to the whole arid belt seems to be unlikely. However, it is possible that the frequency of dro~hts in the Sahel could decrease.
In the sequence of at least 17 glacial and interglacial epochs during the last 2 million years, the last interglacial (between about 130 000 and 75 000 BP) apparently enjoyed the warmest climate. It was split by two short, quite abrupt cool episodes with a near-glacial climate. The warmest conditions (~T~+ 2-2.5°C) prevailed during theearliestof the three warm phases, defined by European glacial geologists as the Eemian, ~ stricto (around 125 000 BP). While the core of the Arctic drift-ice never disappeared, the ice-sheets over West Antarctica (and perhaps
- 150 -
Greenland) may have been smaller than now; the sea stood about 5-7 m higher, isolating Scandinavia, and penetrating deeply into western Siberia. Forests with warmthloving trees prevailed in middle latitudes. Hippopotamus, forest elephants and lions lived in warm-temperate forests in England, and the germafrost boundary in Eastern Siberia retreated to Lat. 57°N (it is now about 50 N). Some evidence for a long humid phase similar to that of the Holocene exists along the West African coast, and in the Djibouti area of East Africa; equatorial and coastal upwelling were reduced, and the climate was in many areas more humid than now. The end of this warm period was indicated by a quite abrupt coolin~ probably on a time-scale of less than lOO years.
Any serious change of the sea-level could only be expected after a more or less rapid deglaciation of western Antarctica, where the rock basement of the ice is largely below sea-level; the possibility of a surge at the end of this period cannot be considered as proven. Drifting sea-ice from both Arctic and Subantarctic Ocean is in floating equilibrium. Any change of its area leaves the sea-level undisturbed, like the melting of an ice cube in a glass of whisky.
Ice-free Arctic versus Glaciated Antarctic Continent --------------------------The most challenging problem of future climatic evolution is the possibility
that the thin pack-ice, with its thickness varying between 0.5 and 6 m, may eventually disappear, after a substantial increase of the virtual or real C02 content (Table 1). Melting from above (mid-June to end of August) and freezing from below currently amounts to about 50 cm per year; the life-time of an ice crystal in an ice floe is therefore only 5-10 years. Budyko has estimated that with a global warming of the order~T~+4°C the whole Arctic pack-ice cover, annual average area lOxl06 km2, amount of open leads (polynyas) between 3percent in winter and 15-20 per cent in summer, could disappear quite suddenly.
In contrast to Greenland and West Antarctica, the bulk of the East Antarctic ice-sheet is extremely stable, with annual surface temperatures below -50°C. New evidence from the Deep-Sea Drilling Programme has veriffed that it has existed in its present extent since at least 12-14 million years (Ma), much longer than the Arctic drift-ice (about 2.3 Ma) or than the whole sequence of glacials and interglacials over the northern continents (except for some local mountain glaciers in Alaska and Iceland). The highest peak of the Antarctic ice was reached 5-6 Ma ago, with a total ice volume 50 per cent greater than now, at the same time as a remarkable desiccation of the whole Mediterranean Sea. As a matter of fact, for 10 Ma or more the earth's climate was controlled by a highly asymmetric distribution of ice: a completely glaciated Antarctic continent coexisted with an ice-free Arctic Ocean. Even today the heat budgets of the two polar regions are quite different and lead, over the Antarctic, to an average annual tropospheric temperature ll°C colder than that above the interior Arctic; with an open Arctic Ocean this difference could have increased
0 to nearly 20 C.
This temperature difference must have been responsible for a marked asymmetry of the atmospheric (and oceanic) circulation in both hemispheres, together with a drastic displacement of the present climatic belts. The position of the northern
- 151 -
subtropical anticyclonic belt should have been displaced from Lat. 37°N (annual average) to Lat. 43-45°N, whereas its southern counterpart remained in the same position (31°S). Though today the meteorological equator (the axis of the average position of the equatorial belt of all-year rain) is situated near 6°N, its position during this period can be estimated at 9-l0°N. This would probably have restricted the seasonal shifts of the equatorial rain belt to the latitude belt 0-20°N, while the subtropical arid belt of the southern hemisphere should have extended to the vicinity of the equator. This is evidenced by paleobotanical studies: the southern Sahara was covered with humid (or semihumid) tropical forests, and southern Africa and the Zaire basin were dry, sometimes fully desert. In many regions of the world, the mountains now controlling the rainfall distribution existed during the late Tertiary only in a rudimentary form: in these cases - e.g. the monsoon belt of southern Asia, and western North America - the patterns of past climates would be quite misleading in a scenario.
Geological evidence for the northward displacement of the arid zone of the northern hemisphere is well-known - salt deposits extended farther north, over many areas of southern and eastern Europe, and reached the vicinity of Vienna. Since the temperature change above an ice-free Arctic Ocean would be much greater during winter than during summer, such a development would drastically reduce the present areas of subtropical winter and spring rains in the northern hemisphere, to be replaced by a more or less arid climate.
During the cold half-year, the immediate vicinity of an ice-free ocean and a snow-covered subarctic continent should have led to increased cyclonic activity and precipitation, probably with increased snowfall along the coasts. During this time, temperate and boreal forests extended up to the coasts (which were situated several hundred kilometres farther to the north); no evidence of tundra or of permafrost has been found in sediments of this age in northern Siberia. During summer, anticyclonic conditions should have prevailed. The fate of Greenland under conditions such as these is difficult to assess. It would probably be affected by increased winter snowfall and summer-time melting; even in the worst case any potential melting of the 1200m thick ice would be a slow process, lasting several millennia, accompanied by a sea-level rise of the order 2-3 mm per year, in addition to the present rate of 1.2 mm per year.
Table 1 suggests that the probability of this quite unexpected type of climate (with many hitherto unknown regional anomalies) rises considerably if the real C02 content is allowed to reach 750-900 ppm (assuming an appreciable role of trace gases). If C02 alone were responsible for warming, a level of 800-llOOppm might represent the critical threshold.
3. Cold episodes in climatic history
Since all possible natural effects producing global cooling are at present unpredictable, it is necessary also to discuss a representative example of past cold climates. The evidence available for the so-called Little Ice Age (about 1550-1850, with some forerunners around 1190, 1310-1330 and 1430 in Europe) is now fairly complete, at least in middle and subpolar northern latitudes.

- 152 -
In several areas, especially in the British Isles, available evidence permits Q
an estimate of the temperature drop during this period as ~T~-1.0 or -1.5 C. This may seem insignificant, but the frequency of adverse weather extremes was much higher than during the period 1920-60: there were frequent cold snowy winters lasting far into spring, cool and very wet summers (some of them with snowfall in mountains above 800 m), interrupted by a few unusually warm or dry seasons, leading to advances of all mountain glaciers. The Arctic drift-ice frequently infested Iceland and in some years reached the Farces and even the Norwegian coast, with a marked drop of water temperatures, These anomalies caused severe and repeated famines and very high food prices, as well as drastic decreases of fish catch; social unrest, epidemics, loss of population and abandonment of rural settlements characterized the situation after catastrophic years, for example around 1316, 1430, 1600, the 1690's and 1780's. The revolutions of 1789 and 1848 occurred after such years with bad harvests and high prices. The most severe climatic and economic conditions were reported in the years following some of the heaviest volcanic eruptions 1 e.g. after 1766, 1783, 1815 and 1883. Frequently groups of 3-5 years with harvest failures and famines occurred simultaneously in Europe, North America and Japan; in Japan the impact of cool wet summers on the rice harvest was particularly strongly felt. Some of these periods were accompanied, on both flanks of the Sahara, by wet and fertile years, while in other periods famines prevailed - here no convincing coincidence with high-latitude events could be found.
During the Little Ice Age the area of permanent ice fields on Boffin Island increased from 37 000 km2 now to about 140 000 km2: this is an area where the nucleus of a new ice-sheet can be most easily formed. Recent model studies indicate that a small initial cooling would indeed be sufficient to let the existing ice-fields grow, until they reached Labrador and the eastern coast of Hudson Bay. But the initiation of such a development lasts almost certainly much longer than a century: the probability of a new glaciation (possibly triggered by a group of exceptionally heavy eruptions) during the next lOO years is small, apparently below 0.1%. This is especially true since the variations of the earth's orbital elements are at present unfavourable for a glaciation; only about 10 000 years from now can a situation favouring northern hemisphere glaciation be expected.
4. Conclusion
Small changes of the global average temperature are apt to be misleading, since they do not express the often remarkable changes in rainfall and the frequency of all kinds of extreme weather situations. The possible occurrence of a sudden cooling, perhaps triggered by series of heavy volcanic eruptions (after the lull between 1912 and 1948), cannot be ruled out.
Disregarding such an occurrence, the probability of a gradual global warming around the turn of the century is certainly much higher. The use of examples of past climates for estimating future climates is limited, because of the role of changing

- 153 -
boundary conditions, By far the most interesting example is the Late Tertiary (about 12 to 2.5 million years ago) during which a fully glaciated Antarctic, together with an ice-free Arctic Ocean, with only some local glaciers,controlled the atmospheric and oceanic circulation. The probability of a disappearance of the thin Arctic packice rises rapidly if the (real) C02 content cannot be stopped from rising above 750-900 ppm. Extensive investigations based on more sophisticated models designed to simulate the essential interaction between atmosphere, ocean, ice and biosphere are necessary, as well as careful and critical evaluation of the available evidence from past climates.
ENERGY AND CLIMATE
A Review with Emphasis on Global Interactions
J. Williams, W. Hafele, W. Sassin*
1. Introduction
This paper considers the interaction between energy and climate; an interaction which operates in both directions. The byproducts of the production and consumption of energy can influence climate, while, on the other hand, climate can influence the demand for and sup£!y of energy. The former aspect has recently received increasing attention, /1/-/3/, as awareness of man's potential to alter the earth's climate has developed and a;-observations of the changes already being made on a local scale have been reported /4/.
The impact on climate of the production and use of energy can be on a local, regional or global scale. At the present time, no observed global climatic change can be attributed to energy conversion but possible changes on this scale in the future are of concern. Though the major part of the paper discusses the potential impact on climate of three main energy sources (solar, nuclear and fossil fuel), the impacts of climate on the supply of and demand for energy are also discussed.
2. Energy Systems
World primory energy consumption in 1975 was at an average rate of about 8 TW (1 TW = l012W). Growth in energy demand is stimulated by many factors. Predominant among these are world population growth, the development of less advanced countries and continued industrialization in developed countries. A detailed assessment of future energy demand, to be published by the IIASA Energy Systems Program, indicates that the order of magnitude of energy demand fifty years from the present is likely to be 25-40 TW. Most of the present energy supply is from fossil fuels (coal, oil and gas) and in the future non-conventional fossil fuels (secondary and tertiary oil recovery, low grade coal, tar sand~ etc.) could be used. A second supply source is nuclear energy. Hydropower and localized renewable resources, although important on local and regional scales, have been considered /5/ to make only small contributions to a global energy supply of 25-40 TW. A further energy source to be developed during the next 50 years is large-scale centralized solar energy conversion. Realistically one has to expect energy supply systems consisting of a mix of the above-described sources. Indicative numbers are: 15 TW of fossil fuel supply, up to 8 TW of nuclear supply, 3 TW for localized renewable resources, up to 1 TW for hydropower and possibly up to a few TW from large-scale centralized solar energy conversion.
* International Institute for Applied Systems Analysis, Laxenburg, Austria

- 155 -
3. !he Impact of Energy Systems on Climate
With reference to a projected demand of 25-40 TW in the year 2030, the impact on climate of large-scale deployment of three energy supply sources (nuclear, fossil fuel and solar) must be considered. These energy systems influence climate through the ejection of waste heat, by changing concentrations of atmospheric constituents or by large-scale changes in the characteristics of the earth's surface /6/.
Climate is a complex system with many interacting processes and feedback mechanisms between the components. It is the potential of energy systems to interfere with natural climatic processes so as to produce global climatic changes that has received increasing attention. It should be emphasized, however, that it is not the possibility of a globally-averaged climatic change that is the central issue but rather the inevitable regional shifts in climatic patterns which would result from a perturbation of the climatic system.
4. The Impact of Waste Heat on Climate
On a global basis the total amount of heat released by mankind's activities 1s only slightly more than one ten-thousandth of the solar energy absorbed at the surface /7/. An extreme projection of 20 billion people with a per capita demand of 20 kW, would lead to a total heat release of about 0.5% of the solar energy absorbed and could give rise to a surface temperature increase of 1 deg Cif one considers the energy balance of the global system. However, energy consumption is not and will not be distributed evenly over the surface of the earth and it is the concentration of waste heat in certain areas that has the potential to alter global climate patterns. Tl1is potential could be realized with a total waste heat release less than that in the extreme projection above. It has been estimated /8/ that natural climatogenic processes producing global-scale climatic changes involve an e~ergy gain or loss of order 100-300 TW. Thus man-made perturbations of this magnitude could produce globalscale climatic changes.
The maximum amount of electric power generated currently at a single thermal power station is about 3 000 MW and the atmospheric effects of heat dissipation rates are not serious problems /9/. It is suggested however that waste heat release from power parks generating 10 000-50 000 MW would increase cloudiness and precipitation in the area and possibly act as a trigger for severe weather /9/.
The impact of waste heat on global climate has been studied using numerical models of the atmospheric circulation. The formulation of these models and their application in the study of human impacts on climate are discussed in the overview papers of this conference by Gates, Marchuk, and Mason.
Washington /10/ used the general circulation model (GCM) developed at the National Center for Atmospheric Research (NCAR) to investigate the response of the model atmosphere to an addition of 24 W m-2 over all continental and ice regions. Results showed a 1-2 deg C increase in global average surface temperature with an 8 deg C increase over Siberia and northern Canada. A more realistic input of heat was used in further studies /11/ which assumed a per capita energy usage of 15 kW and a population of 20 billion. The energy was released according to present population density distribution. It was concluded that the thermal pollution effects were no
- 156 -
greater than the inherent noise level of the model. In a further experiment with the NCAR GCM, waste heat of magnitude 90 W m-2 was added to an area extending from the Atlantic seaboard of the U.S. to the Great Lakes and to Florida /12/. It was concluded that the heating had little effect above the surface layer~d downwind from the source region.
Within the IIASA Energy Systems Program and in co-operation with the U.K. Meteorological Office a series of experiments has been carried out with the GCM developed by the Meteorological Office /13/ in order to investigate the sensitivity of the atmospheric circulation to waste heat released from point sources in ocean areas. One reason for considering such point sources was that with a waste heat input of 150-300 TW, a significant response of the simulated atmospheric circulation was only likely if the input was concentrated in a small area. One may or may not give some technological meaning to such point sources. The concept of energy islands was considered by Hafele /14/ in terms of the necessity of "embedding" energy systems within the atmosphere, hydrosphere, ecosphere, and sociosphere. Embedding within the atmosphere is considered with reference to the constraint of waste heat release. Embedding of energy systems into the hydrosphere is considered in terms of, among other things, the amount of water available in continental runoff for the disposal of waste heat. Embedding of enery systems in the ecosphere and sociosphere involve consideration of pollution and the concept of risk respectively.
Five experiments have been made with the Meteorological Office GCM to examine the impacts of point sources of waste heat input /15/-/17/. In each experiment the impact of 150 TW or 300 TW was investigated. These high values of energy input were used because the earlier experiments of Washington /11/ had also used 300 TW and because input of large perturbations ensures a response in the simulated atmospheric circulation.
The waste heat was inserted at one or two point sources which were located 1n the midlatitude Atlantic Ocean south-west of the British Isles, in the tropical Atlantic Ocean off the west coast of Africa and in the Pacific Ocean south-east of Japan. In four of the experiments heat was added only as sensible heat to the atmosphere, while in the fifth experiment the heat was added to a 10 m deep ocean box simulated beneath each area of waste heat input.
The results of the experiments have been described in detail elsewhere /15/-/17/. It is found that the response of the simulated atmospheric circulation to the input of large amounts of waste heat at point sources is not just in the area of input. The response varies according to the location, amount and :nethod of heat input. A further experiment /18/ has investigated the response to 300 TW waste heat input distributed over six continental regions in the northern hemisphere. In general there were still significant meteorological effects but they were smaller and less consistent than when the heat input was concentrated at two energy parks.
The results of the GCM experiments must be viewed with a recognition of the model shortcomings, su:h as absence of a coupled atmosphere-ocean system, poor treatment of clouds, hydrological and sub-grid scale processes. The results suggest that waste heat is a "non problem" on a global scale in that it is unlikely to perturb
- 157 -
the global average climate state in the foreseeable future. Only when extremely large amounts of heat (of the order of several hundred TW) were inserted in special modes, such as point sources, could significant changes in the atmospheric circulation be determined. However, with an energy consumption level of 25-40 TW there appears to be little or no ground for world-wide concern regarding the climatic impact of waste heat release.
5. The Impact of Fossil Energy Conversion on Climate
Fossil fuel energy conversion produces, in addition to waste heat, certain gaseous and particulate substances which can interact significantly with the climate system. The release of carbon dioxide by fossil fuel consumption has received considerable attention recently and is discussed further in the overview papers of this conference by Bolin and Munn and in the next section of this paper. State-of-the-art climate models estimate that a doubling of the atmospheric carbon dioxide concentration would lead to an increase of 1.5°C - 3.0°C in the globally averaged su~face temperature. These numbers could be high or low because of feedbacks omitted or wrongly incorporated in the models. It is also likely that the polar areas would be more sensitive than the global average and that regional shifts in climatic patterns would occur. The release of particles has also been considered /7/ and some interest has focussed on releases of sulphur and nitrogen compounds, which will probably not have as large an impact as the above substances. It seems that most anthropogenic particles exist over land where they are formed and are sufficiently absorbing to cause a warming of the earth-atmosphere system /7/. However no quantitative evaluations of the interaction of particles with the radiation field and with the condensation/precipitation process are available due to the lack of observed data on the nature and distributions of the particles and lack of models including the relevant feedbacks etc.
6. The Impact of Carbon Dioxide on Climate - Implications for Energy Strategies
In order to assess the future atmospheric carbon dioxide concentration and its implications, three models are required. An energy model is used to estimate the future use of fossil fuels and thus the input of fossil fuel C02 into the atmosphere, The proportion of C02 that remains in the atmosphere is then given by a model of the carbon cycle, as described in the overview paper by Bolin. The effects of an increased atmospheric C02 concentration can be assessed using a climate model, as discussed by Mason. At the present time uncertainties must be attached to the results of each of these models so that the future use of fossil fuels and implications thereof canhot be reliably predicted. Nevertheless the model results can be used to assess the magnitude of the problem. An example of the combined use of an energy model, a carbon model and a climate model is given in a study by Niehaus and Williams /19/. This study showed that with an energy strategy in which consumption reaches a level of 30 TW by the year 20§0 with the use of fossil fuels peaking at around the year 2000 and energy being largely supplied after that date by solar and nuclear sources, then the atmospheric C02 concentration is modelled to reach a maximum of 400 parts per million (ppm) by volume in about 2020 and the mean surface change is less then 1 deg C. On the other hand, if the energy consumption reaches 50 TW in 2050 and the supply is
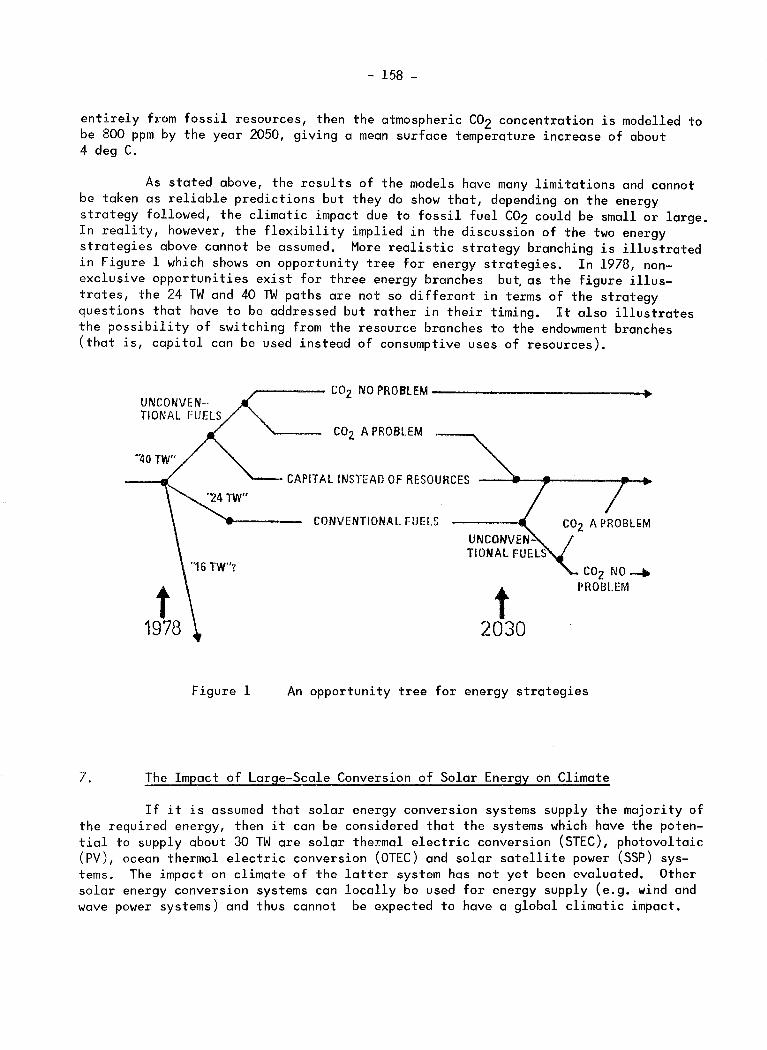
- 158 -
entirely from fossil resources, then the atmospheric C02 concentration is modelled to be 800 ppm by the year 2050, giving a mean surface temperature increase of about 4 deg C.
As stated above, the results of the models have many limitations and cannot be taken as reliable predictions but they do show that, depending on the energy strategy followed, the climatic impact due to fossil fuel C02 could be small or large. In reality, however, the flexibility implied in the discussion of the two energy strategies above cannot be assumed. More realistic strategy branching is illustrated in Figure 1 which shows an opportunity tree for energy strategies. In 1978, nonexclusive opportunities exi~t for three energy branches bu~ as the figure illustrates, the 24 TW and 40 TW paths are not so different in terms of the strategy questions that have to be addressed but rather in their timing. It also illustrates the possibility of switching from the resource branches to the endowment branches (that is, capital can be used instead of consumptive uses of resources).
,..---- COz NO PROBLEM------------+
COz A PROBLEM
CAPITAL INSTEAD OF RESOURCES
CONVENTIONAL FUELS
COz NO .......
t PROBLEM
2030
Figure 1 An opportunity tree for energy strategies
7. The Impact of Large-Scale Conversion of Solar Energy on Climate
If it is assumed that solar energy conversion systems supply the majority of the required energy, then it can be considered that the systems which have the potential to supply about 30 TW are solar thermal electric conversion (STEC), photovoltaic (PV), ocean thermal electric conversion (OTEC) and solar satellite power (SSP) systems. The impact on climate of the latter system has not yet been evaluated. Other solar energy conversion systems can locally be used for energy supply (e.g. wind and wave power systems) and thus cannot be expected to have a global climatic impact.

- 159 -
The possible climatic impact of large-scale deployment of solar energy__ systems has received little attention. A workshop was held at IIASA in 1976 /20/, which discussed the physical characteristics of the systems, assessed their impact on boundary conditions of the climatic system and discussed the climatic implications of such impacts.
Large scale deployment of STEC systems would lead to regional changes in the surface heat balance, surface roughness and hydrological characteristics. The STEC systems do not really change the magnitude of the net heat flow from the surface to the atmosphere but the mechanism of transfer is changed; the significantly lower heat release from the surface is compensated by a release of waste heat from cooling towers upon energy conversion.
Since heliostats are several meters tall, the arrays would influence the surface roughness. A few GCM studies have been made of the impact of a change in roughness but no specific studies of the impact of STEC (or PV) systems have been carried out. Similarly no specific studies of the potential climatic impact of large-scale changes in hydrological characteristics due to these systems have been made, but model and observational studies indicate that large-scale changes in surface wetness can significantly influence climate /20/.
OTEC systems use the vertical temperature gradient in the ocean to generate electricity. Even harvesting a small fraction of 30 TW could cause impacts due to lowering of the ocean surface temperature and to diverting the flow pattern through the discharge of extremely large volumes of cold, deep ocean water required for cooling purposes. Both observational and model studies have indicated that ocean surface temperature anomalies can influence climate /20/. Further impacts of OTEC systems could arise because of the upwelling of wate~through albedo changes, for example, but these have not been investigated in detail /20/.
8. Implications for Energy Policy of the Climatic Constraint
At the present time there are many uncertainties about the specific climatic impacts of large-scale deployment of any of the major energy sources. It seems likely, however, that the global impacts of waste heat and changes in surface conditions will be felt at a more distant point in time than those from changes in concentratio~ of carbon dioxide and CP.rtain other infrared-absorbing gases. In recent years, much concern has centred on the C02 issue. The question is whether present knowledge of the carbon cycle, the climatic system and energy strategies justifies changes of energy policy. The IIASA Workshop on Carbon Dioxide, Climate and Society /21/ discussed this question and concluded, firstly, that mankind needs and can afford a period of between 5 and 10 years for vigorous research and planning to narrow uncertainties sufficiently to be able to decide whether a major change in energy policy is called for. With reference to the state-of-knowledge on the C02 problem a number of policy statements were formulated. These statements can in general be applied to the issue of the interaction between energy policy and climate research at the present.
- 160 -
Because of uncertainties regarding the rate of increase of C02 and of other infrared-absorbing gases in the atmosphere, and the climatic implications, it is premature at this time to implement policy measures requiring the reduction of the use of fossil fuels. However, policies that emphasize the use of fossil fuels are equally unjustified at present and it is most important to maintain flexibility in energy supply policies at this time. Climatological impact assessments of escalating energy use must be performed in greater depth than in the past. The possibilities of energy supply systems that allow ready environmental amelioration should also be considered. Such systems would have to be either non-polluting (or very nearly so) or lead to environmental effects which can be easily mitigated. Several possible systems could satisfy these condition~ e.g., a solar or hydroelectric hydrogen system, energy supply fuelled largely by synthetic methanol manufactured at energy islands or systems employing a short-time recycling of carbon through the atmosphere.
9. The Impact of Climate on Energy Supply and Demand
Consideration of the impact of climate on energy supply can influence research and exploration for energy sources. Exploratory drilling for oil, for example, entails quite different climatic problems in the Gulf of Mexico and on the North Slope of Alaska. Selection of sites for power stations also requires climatic consideration and the evaluation of climatic resources is of particular significance in the case of solar, wind and hydropower sources. Local climate can also influence the method, materials, timing and costs of construction of energy supply facilities and also the transportation of energy /22/.
The impact of climatic variation on supply is mainly through the impact on renewable resources, such as wind and solar systems, although transportation of other energy sources can be affected by anomalous climatic conditions. Droughts have been noted to influence hydropower supply. For example in the drought of the northeastern U.S. in 1961-66, New York City reservoir levels were reduced to 40% of their capacity 1n 1965 /23/.
As far as the impact of climatic variability on demand is concerned, it has been shown, for the U.S. at least, that the increasing use of air conditioning and heating in homes has increased the sensitivity of energy demand to temperature changes. A study by Mitchell et al. /24/ showed for the United States, on the basis of seasonal total heating degree-days from 1931-32 to 1972-73, that in one year out of lOO years one should expect a national total demand for heating fuel to exceed the long-term average demand (with constant economy) by as much as 10%. The probable extreme deviations are larger when regions are considered, especially in the southern and Pacific states. It has been estimated, for example, that in February 1936 large areas of the northern United States and Canada would have had an increased fuel consumption of 50% or more.

- 161 -
10. Concluding Remarks
The main points to be drawn from this review of energy and climate interactions are as follows:
(a) Energy and climate interactions are in both directions: the by.products of the conversion of energy can influence climate, while, in the other direction, climate can influence the demand for and supply of energy.
(b) Detailed considerations of energy demand suggest that of the order of 25-40 TW of energy will be required in the year 2030.
(c) To supply energy to satisfy this magnitude of demand, three large-scale sources are available: solar, nuclear and fossil fuels. Realistically one can expect a combination of these sources to supply the total energy requirement.
(d) Each of the sources can influence the climatic system: by the emission of waste heat, by changing concentrations of atmospheric constituents or by changing surface conditions.
(e) Model experiments suggest that emissions of waste heat would have to be extremely large (of order lOO TW) to perturb the global average climatic state. However, waste heat can be handled intelligently or non-intelligently as far as the engineering systems are concerned and thus the climatic impact could be diminished or amplified. Likewise, changes in surface characteristics, such as albedo, roughness or wetness, would have to be on a large scale to influence global climate. This is not to say that such perturbations due to energy systems would not influence climate on a local or regional scale.
(f) The impact of increasing atmospheric C02 concentrations is perceived as the greatest risk at the present time. However, uncertainties in our knowledge of the carbon cycle and of the climatic system are so large that we certainly cannot predict the consequences of increasing use of fossil fuels and a prudent energy policy would maintain flexibility at the present time while a period of 5-10 years is devoted to intensive research. Policies which actively encourage or discourage the use of fossil fuels are not justified at the present.
(g) The impact of climate on energy supply can be considered in terms of the long-term assessment of the solar and hydropower resources. Climate will also influence factors in energy supply such as exploration (for oil in particular), choice of site for power plants, design and construction, transportation and storage. Climatic variability will also influence supply, particularly of the renewable resources.
- 162 -
(h) The impact of climatic variability on demand is mainly through the effect of temperature changes on heating or air-conditioning requirements. The sensitivity is quite large. For the U.S. as a whole a variability of 10% in seasonal requirements has been attributed to climatic variability, but regionally the requirements vary more.
(i) In order to devise energy policies that take into account the climatic constraints, more detailed information on the impacts will be required - in particular, model results showing regional changes to be expected from different perturbations and scenarios of possible future climatic states. In this regard it is clear that major uncertainties still exist regarding the many feedbacks within the climaticsystem and thus it appears that even basic theoretical research is required in order that prudent energy policies, in which energy-climate interactions are considered, can be devised and used.
Acknowledgements
The Energy and Climate Subtask of the IIASA EnergySystemsProgram is supported by the United Nations Environment Programme. We would like to thank Paul Basile for most helpful criticism of earlier drafts of the paper. We are also grateful to W.W. Kellogg and H. Flohn for their comments and to Ingrid Baubinder for assistance in preparing the paper.
REFERENCES
SMIC (1971). Inadvertent climate modification. Report of the study of man's impact on climate. The MIT Press. Cambridge, Mass.
/2/ BOLIN, B. (1976). Energy and climate. Secretariat of Future Studies. Sweden.
/3/ NAS (1977). Energy and climate. National Academy of Sciences. Washington, D.C.
LANDSBERG, H.E. (1975). Man-made climatic changes. In The Changing Global Environment, S.F. SINGER (Ed.), D. Reidel Publ. Co. Dordrecht, Holland.
HAFELE, W. (1977). Dos Klima als Randbedingung fUr globale Energie-systeme. In Grosstechnische Energienutzung und menschlicher Lebensraum, K. STRNAD and H. PORIAS (eds.), International Institute for Applied Systems Analysis. Laxenburg, Austria.
WILLIAMS, J. (1978). The effects of climate on energy policy. Electronics and Power, 24, pp. 261-268.
- 163 -
/7/ KELLOGG, W.W. (1978). Global influences of mankind on the climate. In Climatic Change. J. GRIBBIN (Ed.), Cambridge University Press, Cambridge, England.
/8/ FLOHN, H. (1975). History and intransitivity of climate. In The Physical Basis of Climate and Climate Modelling. GARP Publications Series No. 16, WMO, Geneva.
/9/ HANNA, S. and GIFFORD, F. (1975). Meteorological effects of energy dissipation at large power parks. Bull. Amer. Meteor. Soc., 56, pp. 1069-1076.
/10/ WASHINGTON, W.M. (1971). On the possible uses of global atmospheric models for the study of air and thermal pollution. In Man's Impact on the Climate. W.H. MATTHEWS et al. (Eds.), The MIT Press, Cambridge, Mass.
/11/ WASHINGTON, W.M. (1972). Numerical climatic change experiments: The effect of man's production of thermal energy. J. Appl. Meteorol., 11, pp. 763-772.
/12/ LLEWELLYN, R.A. and WASHINGTON, W.M. (1977). Regional and global aspects. In Energy and Climate. National Academy of Sciences. Washington, D.C.
/13/ CORBY, G.A., GILCHRIST, A. and NEWSON, R.L. (1972). A general circulation model of the atmosphere suitable for long period integrations. Quart. J. Ray. Meteor. Soc., 98, pp. 809-832.
/14/ HAFELE, W. (1974). A systems approach to energy. Amer. Scient., 62, pp. 438-447.
/15/ MURPHY, A.H., GILCHRIST, A., HAFELE, W., KROMER, G. and WILLIAMS, J. (1976). The impact of waste heat release on simulated global climate. RM-76-79. International Institute for Applied Systems Analysis. Laxenburg, Austria.
/16/ WILLIAMS, J., KROMER, G. and GILCHRIST, A. (1977). Further studies of the impact of waste heat release on simulated global climate: part 1. RM-77-15. International Institute for Applied Systems Analysis. Laxenburg, Austria.
/17/ WILLIAMS, J., KROMER, G. and GILCHRIST, A. (1977). Further studies of the impact of waste heat release on simulated global climate: part 2. RM-77-34. International Institute for Applied Systems Analysis. Laxenburg, Austria.
/18/ KROMER, G., WILLIAMS, J. and GILCHRIST, A. (1978), Impact of waste heat on simulated climate: A megalopolis scenario. Research Memorandum (in preparation). International Institute for Applied Systems Analysis. Laxenburg, Austria.

- 164 -
/19/ NIEHAUS, F. and WILLIAMS, J. (1978). Studies of different energy strategies in terms of their effects on the atmospheric C02 concentration. J. Geophys. Res., (in press).
/20/ WILLIAMS, J., KROMER, G. and WEINGART, J. (1977). Climate and solar energy conversion. CP-77-9. International Institute for Applied Systems Analysis. Laxenburg, Austria.
/21/ WILLIAMS, J. (Ed.) (1978). Carbon dioxide, climate and society. Pergamon Press. Oxford, England.
/22/ CRITCHFIELD, H.J. (1978). Climatology in a comprehensive energy policy. Conference on Climate and Energy: Climatological Aspects and Industrial Operations. American Meteorological Society. Boston, Mass.
/23/ BELTZNER, K. (Ed,) (1976). Living with climatic change. Science Council of Canada. Ottawa, Canada.
MITCHELL, Jr., J.M.1 FELCH, R.E., GILMAN, D.L., QUINLAN, F.T. and ROTTY, R.M. (1973). Variability of seasonal total heating fuel demand in the United States. National Oceanic and Atmospheric Administration. Washington, D.C.
1. Introduction
CLIMATE VARIABILITY AND THE DESIGN
AND OPERATION OF WATER RESOURCE SYSTEMS
John C.Schaake, Jr* Zdzislaw Kaczmarek**
Climate variability is important to the design and operation of water resource systems, because social benefits derived from these systems are direct functions of the reliability of system operations. This in turn depends on the proper understanding of the nature of climatic variability. Historically, water resource systems have been designed and operated on the assumption that future climatic variations might be expected to be similar to those observed within the past lOO or at most 200 years. This historical approach has worked reasonably well and is likely to continue unless there is some clear way to use information not presently being used. Therefore, it seems worthwhile to examine the way in which climatic information is used in water resources management, to consider what impact this has on society, and to consider what might be done differently in the future if the appropriate climatic studies were undertaken.
Improved use of climatic information in water resources will involve an improved understanding of the relationships between climatic variables and water resource variables. This is most important in arid areaswhere the effects of climatic variability on the hydrologic cycle are greatly magnified. What is needed are improved climatic transfer functions for relating climatic variables and water resource variables.
2. Water resources variability and its impacts on society
Measurement of streamflow in rivers of the world is limited to a rather short period of recent history. This means that the long-term behaviour of wet and dry periods of streamflow cannot be known with great reliability. Nevertheless, practical water resources problems focus on streamflow variations that might be expected in the relatively near future, or, within the next 100 or at most 200 years. It is conventionally assumed that this future period will experience the same characteristics of climatic and natural hydrologic variations as was experienced for the last 100 to 200 years. (Later other approaches will be discussed;)
* Hydrologic Services Division, National Weather Service, National Atmospheric Administration, Silver Spring, Maryland, U.S.A.
** Institute of Meteorology and Water Management, Warsaw, Poland.
Oceanic and

- 166 -
Streamflow variations throughout the world during the past 150 years were analysed by Yevjevich Ll, 2, 3_/ • Two large samples of annual river flow data, one on a global and the other on a continental sampling scale, were studied. Yevjevich applied techniques of correlation analysis and spectral analysis. He concluded that the results of his study "may give some comfort to those in practical fields of endeavour, who plan systems and make decisions, drawn on the conclusions from the best data of the past, assuming that the future will be similar to the past. Those who doubt this approach are invited to place themselves at the year 1390 (with some in~umentally obtained data of about 85 years long, available at that time), and project the behaviour of those phenomena for the period 1890-1975. How surprised they would be at the accuracy of their projection based on the temporary stationarity of annual precipitation and annual runoff data".
A general picture of the geographical variation in mean annual runoff throughout the United States is presented in Figure 1. This picture shows there are large geographical variations in the occurrence of streamflow. The amount actually available in any year varies from year to year, and there are even larger variations of daily rates during the year. The nature of streamflow variability var~es with size of drainage area as well as with the time interval of interest.
One measure of streamflow variability is the ratio of the maximum flow of record to the mean flow. This ratio varies with drainage area. Larger ratios are observed for sw.aller areas. This is illustrated for the upper Ohio River basin (U.S.A.) in Figure 2. See Linsley, Kohler and Paulus, /4/. This ratio varies also geographically and with basin shape, geolog» and climate. High ratios are generally located in arid regions withlow normal annual streamflow - which implies the well known fact that societies in arid areas are most vulnerable to climate variability. This is illlistrated in Figure 3 for lOO 000 square mile drainage basins in the U.S.
Frequency distributions of peak streamflow rates tend to be highly skewed, but average rates of streamflow over periods of a year or two are more nearly normally distributed and less skewed. The appropriate mathematical 'form for such distributions is still being debated.
Because great variations in streamflow occur over relatively short periods, it is difficult to judge if there are long term underlying trends or cycles involved. Nevertheless, one way to judge if there are long term factors is to consider the time series of annual runoff volumes. From his analysis of large samples of streamflow data on global and continental scales, Yevjevich concluded there was no statistical evidence that cycles exist in river flow time series beyond the astronomical cycle of the year. But there did appear to be some time dependence in series of annual river flow. This time dependence occurs because of the storage from year to year in ground water systems. The distribution of the log-one annual serial correlation coefficient among 140 basins throughout the world is illustrated in Figure 4. One way to describe mathematically this time dependence is through the use of stochastic hydrologic models.

- 167 -
100r-------------,-----------------------~--~--------~===-~
Cl)
w .... < .... VI 80 0 w .... z :::> u. 0 < w
"' < ..... < .... 0 40 J-
u.. 0 .... z w u 20
"' w c.
!AVERAGE RUNOff FOR U.S.•8.7 1Nl
!AVERAGE RUNOff FOR WORLD•IO.SINI
OL-------------~----------------------~~------------------~ 0.25 1.0 10.0 MEAN ANNUAL RUNOFF llNI
80.0
Figure 1 - Geographical distribution of mean annual runoff for the United States
0 ;::
1000~~----~--~--~--~--~------~---~--r---~--,---.----r--.
500
200
/MAXIMUM FLOW OF RECORD+' MEAN FLOW
100
50
•• ~ 20 •
• 10
s
JLI---2L----s~~,~0--2~0----~so---,~o-o--2~o-o---s~o-o_J_oLo-o~~--~-~-o~.o-o-o~----~~~oo~.ooo
AREA IN SQUARE MILES
Figure 2 - -Ratio of maximum flow of record to mean flow for stations in the Upper Ohio River Basin /4/

50 I
I
3:
~ 0 1/) _,
;:l u.. :.:: z -<:;: w ~0 0 20 • ..J ·'( CJu.. w z 0 ow u::0 -< o-< 0::
u~ Q
UJ w u::> _,
-< ::! 10 ;-Vl-'
LU LU <{ <? "" <( LUZ ;:l z 04'.:: 0
\/)
tLO 0 5 or- 0
0 0 0 1- 0
-< c.<
2 5
Figure 3 ·- Illustration
o.<O I ~ 0 _, u..
I _, < z
0.40 r z < u. 0 z 0 1-
< _, L:J <>: £Y. 0.20 0 u _, < "' IJJ
V>
u. 0 ,_ z 0.0 IJJ
u u.. u. !.!.J
0 u
-0.20 2
-168-
0
~ 0 }'-?~
·~
of
'tv~
~~
0
0
50
~ .
100
0 0 0
ANNUAL AV~RAGE FLOW !1000 CFSl
tendency for dry climates to have more I I
0
0
0
0
0
0
M!=AN .. 0.178
5 10 25 50 75 90 95
PER CENT OF RIVERS THROUGHOUT THE HORLD Figure 4 - Distribution of serial correlation coefficient of
500
variable stream flow ,e
I 0 !
98 99
annual flow /2/
- 169 -
During the past two decades hydrologists recognized the need to develop a stronger scientific basis for analysing the effects of climatic variability in the design and operation of water resource systems. Emerging from this recognition has been a new science of stochastic hydrology.
Concern for a scientific basis for diagnosing climate variability in hydrology is not new. Significant contributions to the fundamental theory of probability and statistics can be traced during the last century to many outstanding hydrologists and engineers throughout the world. One manifestation of the development in stochastic hydrolgy is the growing use of streamflow models to compute synthetic series of streamflow which resemble historical data and which are used as input to simulation models of water resource sy~tems. ·
Although it is beyond the scope of this paper to consider in detail any of the stochastic models used in hydrology, it is appropriate to examine basic assumptions underlying the development and application of these models. Moreov-er. applications of stochastic models in hydrology are not limited just to streamflow, but they may apply to the description of other climatic variables such as precipitation and temperature.
are: Some of the problems inherent in using stochastic process theory in practice
(a) selecting the appropriate mathematical model of streamflow as a stochastic process;
(b) selecting the appropriate parameters for a given stochastic model on the basis of historical information;
(c) accounting for the effects of uncertainty in model selection and parameter estimation that arise because available historical information is always limited and never sufficient to completely remove such uncertainty.
One of the primary issues in water resources is to further strengthen the theoretical scope of stochastic hydrology and, more importantly, to find improved practical ways to translate the existing theory into present practice. The major obstacle to more widespread practical use ofdeve~ped concepts of stochostic hydrology is the lock of adequate mechanisms for transferring the technology into practice. Essential to improved technology transfer is better understanding of the limitations of various stochostic models and of practic61 implications of the fact that "true" parameter values for any given stochostic model con never be known with lOO per cent certainty.
the most but also
Stochastic models hove been used in hydrology for a common is to generate streomflows - usually for a for daily, weekly, seasonal and annual intervals.
variety of purposes, monthly time interval Such generated series

- 170 -
most often are used in simulation models to assess the performance of water resource systems ranging in complexity from a single water supply reservoir to muti-purpose systems involving many interconnected reservoirs, Other practical applications of stochastic models in hydrology include the generation of point rainfall values which are used as input to hydrologic models to translate the rainfall to streamflow, By varying parameters representing human activities such as urban development, farming practices, irrigation ,and ground water development, the effects of these activities on streamflow variability may be assessed. Stoohastic models of precipitation and temperature can be used conjunctively with deterministic models of physical hydrologic processes to make very thorough assessments of the impact of climatic variations on human activities affected by water.
Climate varies throughout climate varies locally with time. result in floods or droughts.
the world from very arid to very humid. And Extremes of temporal climate variations often
A very wide range of human adjustments to floods and droughts is possible. Alternative human adjustments to flooding may be grouped into two categories: structural and non-structural. Structural alternatives include construction of flood control reservoirs, levees, and stream channel impro~ements. Non-structural alternatives include flood plain management, flood proofing of property susceptible to flood damage, flood warning, and flood insurance. Other structural and nonstructural alternatives are also possible.
Alternatives for human adjustment to drought also include structural and non-structural possibilities. The main structural alternative is to construct reservoirsand water transmission facilities to provide water supply for municiple, industrial, agricultural and other uses. There are two principal non-structural alternatives. The first is water conservation, which reduces the amount needed for a given purpose. Conservation practices may be taken in the short run during drought periods, but ~hey may also be taken in the long run to reduce the need for structural adjustments. A second non-structural adjustment is to defer economic development and its greater water demand if structural alternatives are too costly.
Many human adjustments to flood and drought involve some form of action and some process to decide when it is appropriate to take that action. For example, reservoirs used for water supply and hydroelectric power production must be operated according to some type of operating policy. An important problem is to recognize a serious drought situation as early as possible so that appropriate conservation and demand reduction measures may be taken to reduce the risk of emptying the reservoir. Therefore, one of the important needs for climatic information is to establish intelligent reservoiroperating policies that recognize the types of streamflow variations that can be expected in the future.
A key issue is how much information on climatic variability (and streamflow variability in particular) is needed for society to take the best actions in the water resources area. Some insights into approaches for addressing this issue are suggested in the following sections.

- 171 ·-
In the design of water supply systems an important consideration is the risk of failute to meet a given level of water demand. This risk depends on streamflow characteristics, on reservoir storage capacity, and on the required demand and variation of demand during the year. The relationship between storage, demand level and risk is known in hydrology as the storage-yield-ris.k (or simply storageyield) relationship.
The storage-yield relationship for a particular reservoir site can be determined if historical streamflow data have been gathered. This involves using historical data to simulate operation of various reservoir capacities to meet various demands, and the risk of failure to meet the given demand in any given year can be estimated from the simulations.
A comparison of storage-yield relationships for a few rivers throughout the world is offered in Figures 5 - 7. Each figure presents the yield lor each river as a function of risk for a given reservoir capacity. Each figure has been scaled to that yield (or demand) is expressed as a proportion of themeanannual flow rate, and storage capacity is ecpressed as a proportion of mean annual streamflow volume.
30
~ RESERVOIR CAPACITY .. 0%
0 ..J ..... _, <( ::J z z <(
20 u.. 0 1-z
0 Ul
...J u w "" ;;::: UJ
"-VI <(
Cl z <(
::::!: 10 Ul Cl .... <( ::J z z <(
OL-------------~-----------_J----------------~~------~ 0.5 I 2 5 10
PER CENT ANNUAL R)SK OF FAILURE TO SUPPLY PEMAND
RISK
Figure 5 - Yield-risk relation with no storage

- 172 -eo 400
RESERVOIR CAPACITY"' 20% OF MEAN ANNUAL FLOW >-
l-3: 0 0 < c.. u.. <(
-' u
"' ·:( 0 ::J
z > "' z UJ
<( 70 350 V> UJ
u.. "' G IJ..
0 l-
l-z z UJ UJ Cl u u .....J "" "' L!.J w w
"-
>= 0..
V> V> <( <(
0 0 z z <(
<( :::;: 60 300 w :::;: 0
w ..... 0 <( ..... ::> <( z z ::J
<( z z <
SOL----------~----------J_--------------~--------~250 1 5 10 . 0.5 2
PER CENT ANNUAL RISK OF FAILURE TO SUPPlY DEMANP
'RISK Figure 6 - Yield-risk relation for storage = 20 per cent of mean annual flow
100~----------~----------~--------------~-----------,
RESERVOIR CAPACITY.., 100%
OF MEAN ANNUAL FLOW
BOL----------L----------L-----------~~--------~ 0.5 2 5 .10.
PER CENT ANNUAL RISK OF FAILURE TO SUPPLY DEMt-\ND
RISK
Figure 7 - Yield-risk relation for storage = lOO per cent of mean annual flow

- 173 -
Although the storage-yield relationship is an important tool for translating the effect of climatic variability into a required storage to meet a given demand at a given risk level, its practical application is limited to analysis of reservoirs in headwater catchments of complex river systems. When more than one reservoir is involved, the simple concept of the storage-yield relationship does not strictly apply and more complicated water resource systems analysis techniques must be used to assess the effects of climatic variability.
Some inferences for the collection and analysis of climatic information may be drawn from the example storage-yield relationship in Figures 5- 7. If the re~oir is very small (Figure 5), the statistical characteristics of the streamflow govern the safe yield. This situation often occurs when a large river is used for water supply. Enough data are needed to define low flow distributions. Extreme low flows depend as much on the geology of the basin as on the climate. Therefore, mathematical models of the basin hydrology may reduce the length of record needed to make good investment decisions.
If the reservoir is of moderate size (Figure 6), substantial increases in yield can be gained. Annual yields are 3 to 4 times the reservoir capacity and from 3 to 20 times the yield possible at the same risk level without the reservoir. This situation frequently occurs in upland basins in humid regions. The critical streamflow parameter becomes the mean annual flow. Other flow properties are of comparatively minor importance.
If the reservoir is very large (Figure 7), the reliable yield is nearly equal to the reservoir capacity. This situation frequently occurs in arid and semi arid regions. Again, the critical streamflow parameter is the mean annual flow. But, now there is a subtle twist to the nature of the risk. Risk in Figure 7 applies to any future year taken completely at random. In most years, the reservoir will refill at the end of the wet season and the risks will be less than in Figure 7.
But, in some years the reservoir will not fill. The risks, then, become unacceptably high and it becomes necessary to plan and limit the releases from the reservoir to control the risks. This causes occasional water shortages which are not unusual in arid and semi-arid regions.
There is a great need for accurate climatic information during the dry years. Two types of information would be useful. First, historical information on low flow characteristics is needed to judge how much to restrict reservoir releases. Second, probabilistic climatic forecasts for the next several months to a year could improve the risk assessment.
Storage-yield relationships are estimated on the basis of historical data. Because the time relationship is unknown, there is some uncertainty in each of . Figures 5- 7. The effect of this uncertainty is to increase the true risks; in other words, the true risks are greater than shown in Figures 5 - 7. The amount of uncertainty decreases as the length of historical record increases.
- 174 -
Uncertainty in stG~age-yield relationships can be assessed with the aid of stochastic hydrologic models. Although the best procedure to do this is an important matter for future consideration, the idea is to recognize that the historical record is only one series (i.e., a sample) from a large ensemble of series that potentially could have occurred. By chance the others did not occur, but one of these will occur in the future. The problem is to yudge how much can be known about the entire ensemble from the available data. This is a problem of statistical inference.
!m£oEt~n£e_o£ ~a!eE Ee~o~r£e~ ~aEi~bllltx foE Ee~i£n~ ~i!h_dlf£eEe~t
~y~r£1£glc_a~d_e£O~o~i£ con~i!i£n~ ~- ~C£n£mlcL ln~tlt~tlo~al,_a~d
le~al £O~sld~r~tlo~s
As a general rule, climate variability is most important where uses of water are large relative to the supply. This type of situation tends to occur in large metropolitan areas, especially in arid regions but also in humid regions. Arid regions are especially susceptible because not only must municipal and industrial needs be met from limited water supply but irrigation needs must be met as well.
Perhaps the most difficult to understand are the social impacts of water resource variability which occur in developing countries. This is because the social, economic, and political factors vary from one developing country to another, and it becomes essential to consider climatic impacts in the particular ~ocioecomonic system in which they occur. Such socio-economic systems often have geographical boundaries that extend beyond the region of the physical climatic variation and may include, for example, the entire system of world food prices os well. In assessing the impact of climatic variability on one segment of society, it is essential to understand how that segment of society interrelates with the rest of society on local, regional, national, and international scales. Because these interrelationships are very different for developing and developed countries, the effects of climatic variability also are very different.
Economic consideration - an example -------------------------------------An interestinG exa~ple of the economic effect of climatic variability is
offered by a hydroelectric power devciop~ent in Brazil. On the Grande River, Brazil, there is a cascade of power plants. Located at the upstream end of the cascade, at Furnas, there is a large reservoir having a storage capacity of 15 billion cubic meters. The Grande River at Furnas drains approximately 54 thousand square kilometers. The Furnas Reservoir is very important because if the reservoir were emptied according to some simple rule, the water stored would account for 22 770 megawatt months of energy. This is roughly 50 per cent of the total energy produced in the region. Figure 8 shows the storage-yield relationship for Furnas, but there is some uncertainty in this relationship. Two curves are given for the same risk level. One curve was derived from the historical records, the other was derived with the aid of a simple stochastic (Markov) model of streamflow having statistical parameters estimated from the historical streamflow record.
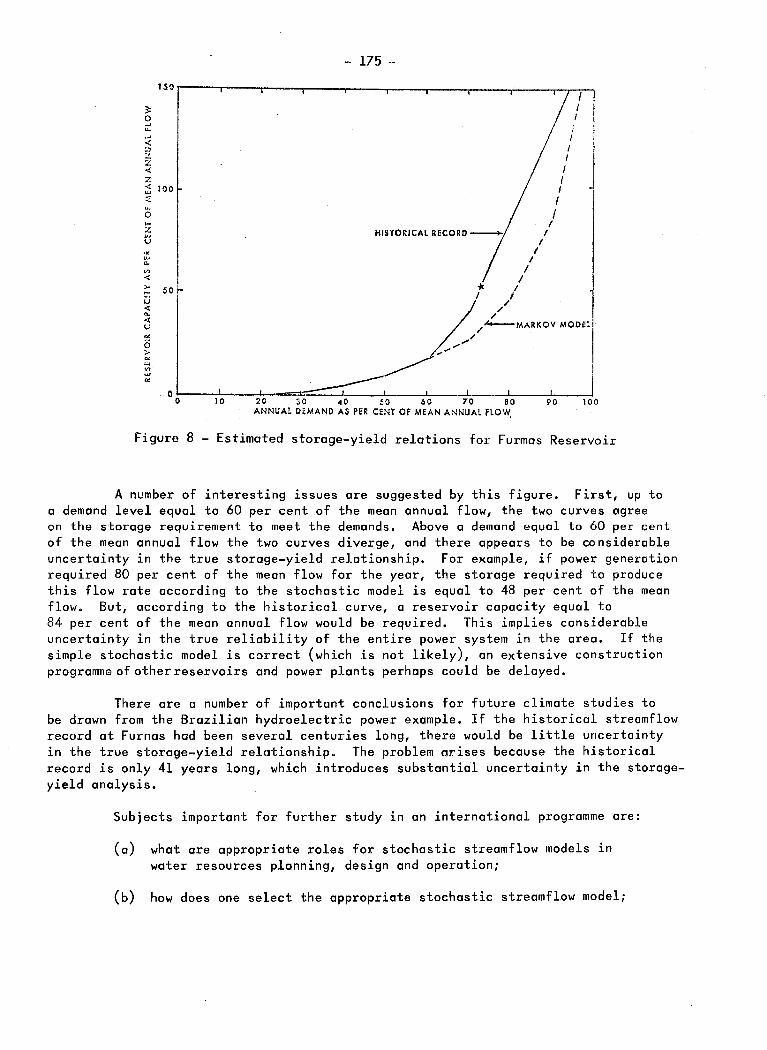
15.0 I 3:
~ I ~ l z
~ 100 f ... 0 ,_ z U< V
·~ w "... <:
- 175 -
I I
I I
'// . I I I I I I I I
I I
I
i "f t /
I
_-//'--•mo• Moo<el
o~--~~~----~'~-===~==--J·----~·----~~----~'~---L•-----L'----~~ 0 10 20 :lO <40 SO 60 70 80 90 lOO
ANNUAL DEMAND AS PER CENT OF MEAN ANNUAL FLO~
Figure 8 - Estimated storage-yield relations for Furmas Reservoir
A number of interesting issues are suggested by this figure. First, up to a demand level equal to 60 per cent of the mean annual flow, the two curves agree on the storage requirement to meet the demands. Above a demand equal to 60 per cent of the mean annual flow the two curves diverge, and there appears to be considerable uncertainty in the true storage-yield relationship. For example, if power generation required 80 per cent of the mean flow for the year, the storage required to produce this flow rate according to the stochastic model is equal to 48 per cent of the mean flow. But, according to the historical curve, a reservoir capacity equal to 84 per cent of the mean annual flow would be required. This implies considerable uncertainty in the true reliability of the entire power system in the area. If the simple stochastic model is correct (which is not likely), an extensive construction programne of other reservoirs and power plants perhaps could be delayed.
There are a number of important conclusions for future climate studies to be drawn from the Brazilian hydroelectric power example. If the historical streamflow record at Furnas had been several centuries long, there would be little uncertainty in the true storage-yield relationship. The problem arises because the historical record is only 41 years long, which introduces substantial uncertainty in the storageyield analysis.
Subjects important for further study in an international programme are:
(a) what are appropriate roles for stochastic streamflow models in water resources planning, design and operation;
(b) how does one select the appropriate stochastic streamflow model;
- 176 -
(c) how should one estimate the parameters of such a model from the limited historical data;
(d) how can one account for or estimate the uncertainty introduced because of the limited period of historical record of streamflow;
(e) is it possible to reduce this uncertainty through the use of correlation between the historical streamflow series and other hydrologic related "proxy" series such as tree rings or mud varves?
Legal and institutional considerations
Legal and institutional aspects of climatic variability and its effects on water resources planning and operation are difficult to assess in a general way throughout the world. Never~heless, a few general statements may be made, because one function of water law is to ~ive stability to institutions and predictability to the results of action. According to Trelease [§} the ~.elution to legal problems created by climatic variability are either engineering or economic. A law that facilitates such solutions must paradoxically combine features of both certainty and flexibility -- certainty to encourage investments in projects and flexibility to permit shifts of water between users and uses.
In c6nsidering the possible effects of a climatic change or continuing climatic trend on the water supply system of the northeast United States, Schwarz @ noted there are two major ways in which a climatic change can affect water supply. One is the effect it may have on demand, such as lawn irrigation. The second is the effect on water sources, such as streamflow or ground water recharge. In the northeast United States the second is likely to be far more important in metropolitan water management.
Schwarz noted that the most ideal approach to evaluate the effect of climatic change would be to project the trend and magnitude of such change (if known), to translate this into streamflow records, and then to use these records to analyse the response of the present and projected future major water supply systems to the "forecasted" change. Unfortunately, this straight-forward approach is not feasible, except in a limited probabalistic sense, mainly because the magnitude and timing and even the trend of possible climatic changes in specific locations of the world are largely unknown.
Schwarz suggested three feasible possibilities to evaluate the effect of climatic change in the northeast United States. These were:
(a) to review individual cases and on the basis of their previous response to short-term climatic variations and on the basis of questioning some of the water managers, speculate on the response to climatic and streamflow change;
(b) to select certain broad criteria of water supply systems and speculate on the effect changes in streamflow statistics might have on each;
- 177 -
(c) to select a method of synthetic streamflow generation and, using generated streamflow as a surrogate for climate, systematically vary the parameters and observe the effects of these variations on the safety of the systems to be developed from this streamflow record.
Schwarz attempted each of these approaches and arrived at some instructive results using the second one,
3. Climate and water resources
A basic physical mechanism governing the relationship between climate and water resources i~ the principleof conservation of water. This means that the rate of inflow in the form of precipitation minus the rate of outflow in the form of evapotranspiration and runoff is equal to the rate of change of storage of water in stream, soil, and ground water systems. If averages are taken over a period of a "water year", beginning and ending during the driest part of the year, the change in catchment storage will be small relative to total precipitation, evapotranspiration, and runoff. In a given year, however, there will be some change in storage of water owing to year-to-year climatic variability. Averaged over many years the expected change in storage becomes negligible. The relationship between average annual precipitation, evaporation, and runoff is referred to as ''the annual wat~r balance".
If the effects of climatic characteristics on the water balance are to be understood or classified, some form of transfer function or model relating climate and the water balance is needed. One of the essential principles that must be represented in any transfer function is that runoff is a residual. It is left over after evapotranspiration takes place and after appropriate changes in storage occur os well.
Anotherd~minant factor affecting the water balance is evapotranspiration. Evapotranspiration is the return of water to the atmosphere by evaporation from lakes, soil surface, and through transpiration of water by vegetation. In order for evapotranspiration to occur over the land, water must be available in the soil. In humid regions water usually is available and evapotranspiration rates tend to be close to the maximum possible rate known as "potential evopotranspiration rate''. The potential evapotranspiration rate is approximately the rate that water would evaporate from a large lake surface under the prevailing meteorological conditions. Evapotranspiration in humid regions is closely related to temperature os shown in Figure 9, Langbein et al. [J}
The general balance between annual precipitation, runoff, and evapotranspiration (actually, temperature) is illustrated in Figure lO,Langbein et al. LZJ.
Because runoff is a residual, annual variations and geographical variations in precipitation and evapotranspiration tend to be magnified in their effect on streamflow variability. For large geographical areas of a given size, those producing the smallest amounts of runoff per unit area are shown to have the most variable streamflow characteristics. Evidence of this appears in Figure 3. A significant
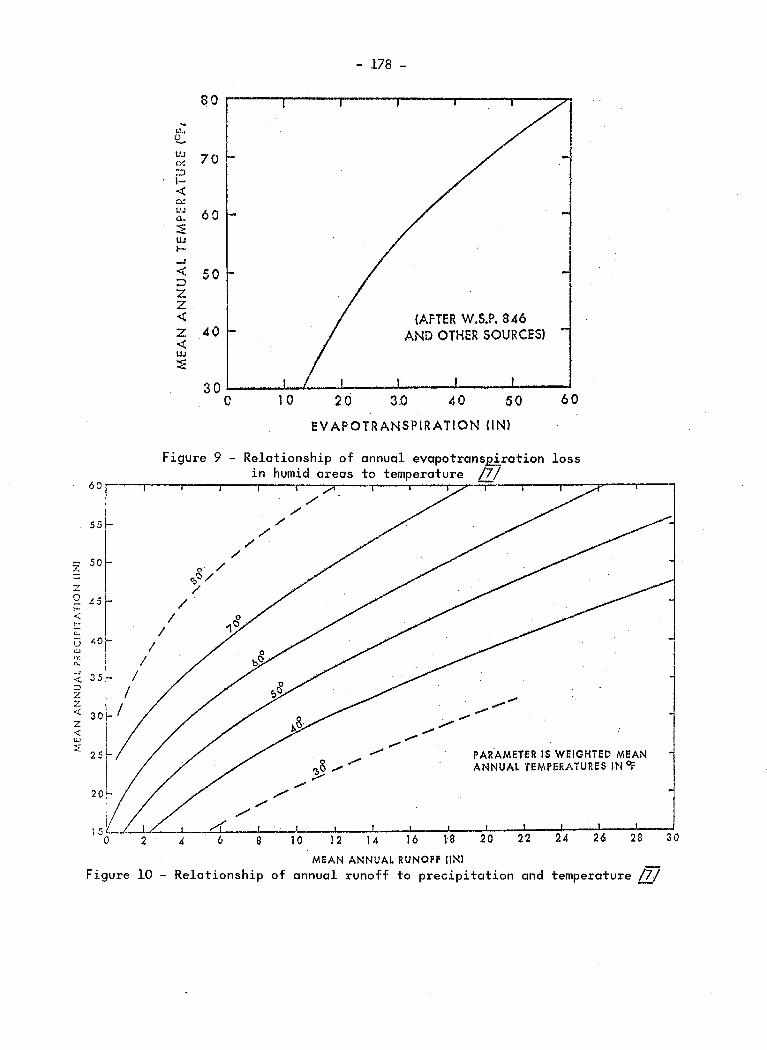
i sol U.J 70 I-D'.: ::> 1-~ ~
L'.J a. ~ UJ I-
-J
<( ;:::)
z z ~
z 40 <( UJ
~
- 178 -
7' J
(AFTER W.S.P, 846 AND OTHER SOURCES)
EVAPOTRANSPIRATION !IN)
i
Figure 9 - Relationship of annual evapotrans£iration loss in humid areas to temperature /7/
60r----r---.----~---r----r---~--~----r----r~~=---~---.--~~--,----,
55~
ZJ z I ~ ~51 < >-· "-u 40r ~ I
~ I < 35;-~ f z f
< 30 z < U-1
:E 25
I I
I
I
2
I I
I
/
4
o· / o.,<:J/ /
6
/ /
/ /
8
/ /
10 12
_ ... -__ ..... _ ..... / .....
,.,.. PAR.AMETER IS WEIGHiED MEAN ANNUAL TEMPERATURES IN Of
14 16 18 20 22 24 26
MEAN ANNUAL RUNOFF !1Nl Figure 10 - Relationship of annual runoff to precipitation and temperature /7/
- 179 -
corollary of this for climate studies is that longer historical records of streamflow are needed in arid areas to get the same relative accuracy as in humid areas.
Transfer functions for relating climate characteristics to water resources values may be classified into three general categories: Statistical, analytical, and numerical. Underlying ea9h must be some degree of physical theory, although the theoretical base tends to become more complete as one moves from the statistical through the analytical to the numerical transfer functions.
Statistical transfer functions tend to be empirical relationships between climate-related variables such as tree ring indices, mud varves, and measures of drought or glacial activity ~.
·Analytic-al transfer functions are based.on simplified physical principles that can be expressed mathematically as a system of simultaneous equations. These equations represent thebclance between precipitation, evapotranspiration, runoff, and ch-anges of storage in soil moisture, the ground water -system, and the stream channel network !fl.
Numeric~l transfer functions· may take the form o'f a conceptual hydrologic model, which allows more detailed physical consideration than in the analytical model. Numerical transfer functions also require digital computers for their application. They typically have parameters that must be estimated from historical data because some parameters may depend on the current climate. Conceptual hydrological models could be most valuable for ~ssessing the effects of incremental change~ in the climate.
There are three main technical factors that ultimately limit the application of any climate transfer function, including conceptual hydrologic models. These are the inherent accuracy of the model, the degree to which model parameters depend upon the climatic condition for which the model wascalibrated and the accuracy of the available input data to the model.
At the present time there is very little information on the specific nature of each of these three potential error sources. Future climatic studies should attempt to deal explicitly with each of them. Studies that previously have been made of errors in conceptual hydrologic models have been more concerned with representing specific historical events and with minimizing the total combined error induced by all three of these factors. No systematic attempt has been made to sort out the individual error sources. Climatic studies are less concerned with specific individual events than with the distribution of events. They, therefore, are much less sensitive to certain types of errors - provided the range of variability of the climatic variables is large compared to model and measurement errors.
Perhaps the most notable study to under~tand the error properties of conceptual hydrologic models was conducted by WMO in its inter-comparison of conceptual models used in operational hydrologic forecasting LIQ?. The intercomparison involved

- 180 -
the testing of 10 conceptual models on 6 standard data sets and included the subsequent evaluation of the discharges simulated by the models. The resulting differences between simulated and observed discharges represent the compounded effect of the inherent model error and the measurement errors associated with the input precipitation data and the observed streamflow data. No attempt was made in the WMO study to define the accuracy of either the mean area! precipitation estimates derived from the original point precipitation measurements or the accuracy of the discharge measurements. More importantly, no attempt was made to determine the effects of such errors on the differences between simulated and measured discharges. Therefore, it is not possible to use the results of the ~odel intercomparison testing to estimate the inherent model error as distinct from the simulation e~rors. This is an-important distinction because if a conceptual hydrologic model were to be used to test the effect of incremental changes in a climate variable such as precipitation, only the inherent model error and not precipitation measurement errors· would limit the value of the model.
As future climatic studies begin to explicitly assess the individual components of conceptual model errors, a conceptual model of the errors themselves will be needed. A potentially useful theoretical framework.for such errors already exists, and is known as Kalman filter theory. Applications of this t~eory·to conceptual hydrologic modelling are needed to assess the ultimate limitations of conceptual~models.as .climatic transfer functions.
4. Potential usefulne~s of climatic information for water management
Three categories of climatic information are potentially useful for water management:
(a) historical measurements and statistics of climatic variables such as temperature, precipitation, and potential evapotranspiration;
(b) paleoclimatic information which might be used through climatic transfer fun~tions to improve estimates of the statistical behaviour of s treamflow;
(c) forecast probabilities of future variation in climatic variables.
Climatic statistics are needed in the design of water resource systems and in the development of water resource system operation plans and policies. Where reservoirs are involved, the most important climatic statistic tends to be the mean annual streamflow. Where reservoirs are not involved, statistics of high and low streamflow extremes are needed. In arid areas the streamflow tends to be more variable than in humid areas, and longer historical records are needed to get statistics of comparable accuracy.
Paleoclimatic information, such as tree rings and mud varves are potentially useful because of thelong historical period provided by these proxy data. But improved quantitative methods are needed to assure that climatic transfer functions faithfully produce improved estimates in streamflow statistics, than otherwise can be estimated.

- 181 -
This will involve modeling of the relationship between the streamflow data and the paleoclimatic indicator. It will also involve modelling the noise or error structure inherent in the transfer function.
Climatic forecasts of precipitation, temperature and evapotranspiration need not be in the form of an accurate deterministic prediction of future events. Water managers have always made decisions under uncertainty and are developing improved technology to do this. Any information on future climatic fluctuations that would tend to reduce uncertainty would be useful. Recognizing this, the U.S. National Weather Service has already begun a programme of forecasting long-range streamflow in probabilistic terms. This involves simulating for each forecast a number of probable sequences of precipitation, temperature and potential evapotranspiration. If more is known than is implied by the historical record on the possible occurrence of the future sequences, then that ~nformation can be used to influence the sequences used in the simulation. Additional climatic studies are needed to consider improved ways of using probabilistic climatic forecast in extended streamflow prediction.
REFERENCES
YEVJEVICH, V. (1963). Fluctuations of Wet and Dry Years, Part I. Research Data Assembly and Mathematical Models, Colorado State University, Hydrology Paper 1.
YEVJEVICH~ V. (1964). Fluctuations of Wet and Dry Years, Part II, Analysis by Serial Correlation, Colorado State University, Hydrology Paper 4.
YEVJEVICH, V. (1977). Fluctuations of Wet and Dry Years, An Analysis of Variance Spectrum, Colorado State University, Hydrology Paper 94.
LINSLEY, R.K., KOHLER, M.A. and PAULHUS, J.l.H •. (1958). Hydrology for engineers. McGraw-Hill, New York, p. 79.
TRELEASE, F.J. (1977). Climatic Change and Washington, D.C.
Climatic Change and Water Law, Chapter 4 in Climate, Water Supply. U.S. National Academy of Sciences.
SCHWARZ, H.E. (1977). Climatic Change and Water Supply: the Northeast? Chapter 7 in Climate, Climatic Change U.S. National Academy of Sciences, Washington, D.C.
How Sensitive is and Water Supply.
LANGBEIN, W.B. et al. (1949). Annual Runoff in the United States, U.S. Geological Survey, Circular 52.

- 182 -
~ MATALAS, N.C. and FIERING, M.B. (1977). Water Resource Systems Planning, Chapter 6 in Climate, Climatic Change and Water Supply. U.S. National Academy of Sciences, Washington, D.C.
LZ/ EAGLESON, P.A. Climate, Soil and the Water Balance: A Framework for their Analytical Coupling. M.I.T. Press (in press).
World Meteorological Organization, (1975). Intercomparison of Conceptual Models Used in Operational Hydrological Forecasting. WMO Report No. 429.

CLIMATE, HEALTH AND DISEASE
Wolf H. Weihe·M-
1. Introduction
The interrelationship between man and his atmospheric environment has been recognized since the foundation of western medicine was laid by Hippocrates. Serious scientific study of the multiple pathways by which the interrelationship takes place began in the last century and has shown a remarkable acceleration since World War II. All aspects of the medical sciences which are related to the atmospheric environment are now covered by the interdisciplinary science of human biometeorology.
Human biometeorology deals with both the fit, healthy man free of disease and the physically weak or sick man who has to cope with the given climatic conditions of the area where he lives. It also considers ecological aspects such as the dangers imposed on man by vector-insects, favoured by a particular climate, that transmit disease-causing parasites.
Climate
Climate is a generalization of the manifold weather conditions from day to day throughout the year. This generalization is commonly expressed in mean values over reference periods. They allow a rough estimate of whether in a given area the climate is cold, temperate, hot-dry, or hot-humid. With regard to man this basic classification of climate is important, as it gives some idea of the strain imposed on populations in any one of these climates.
Much more strain, however, results from the continuous meteorological changes expressed as variations around the mean condition. The variability of the atmospheric conditions in an area is of paramount importance for man. Two types of variability can be classified:
periodic changes, occurring with regular frequency and amplitude, such as day and night or summer and winter;
non-periodic or aperiodic changes, occurring during a single day or successive days, months, or years within a reference period.
Such variability is reflected in changes of all meteorological factors. The most important biotropic factor is air temperature; other factors are of importance as they relate to temperature. Water vapour pressure and relative humidity affect the heat content and heat capacity of the air. Wind acts mainly through enforced convection, which is favourable for man in the heat and unfavourable in the
*Biological Central Laboratory, University Hospital, Zurich, Switzerland.
- 184 -
cold. Solar short-wave and terrestrial long-wave radiation act as powerful heat sources. Furthermore, air pressure becomes important at high altitudes because of the reduction of partial pressure of oxygen. Light acts through length of photoperiod and intensity. Ultraviolet radiation has very specific biotropic actions on the skin.
Other meteorological factors generally not included in the list of measurements for recording climate have little or no direct biotropic action on man. Among them are lightning discharges in the troposphere, electromagnetic fields and air ionization. Their action is still under investigation in the laboratory.
Man and the atmospheric environment are two closely linked systems. Man as a highly organized biological system depends on and has to adjust to the given conditions of the atmospheric system in order to live and survive. The ability to adjust is the result of the evolution of man to his present stage of development through mutation and selection by trial and error. With regard to adaptive capacity man is the the most successful species of all, because he is the only species that has managed to settle permanently in every climatic zone between the equator and the polar regions.
The genetic adjustment of the human system to the atmospheric system is so close that it has developed congruent periodic variations in many physiological functions. The regular changes within the body are known as "biological rhythms", of which the .dail;•· 1 c_icr.adian) and annual rhythm are synchronized with meteo-rological and astronomical factors. Environmental factors such as light and temperature act as time-givers for the endogenous clock.
While the periodic changes in the atmosphere are more a challenge than a strain for man because his body is geared to them, the aperiodic changes are likely to cause strain because a particular short-term or long-term adjustment is required. Adjustment takes place by means of a concerted regulation of all bodily functions directed towards the mainte~ance of nearly constant conditions inside the body. This complex regulation is known as homeostasis. The most vital role in this is played by thermoregulation involvin9 all metabolic functions to maintain homeothermia at a mean body temperature of 37 deg C over a wide range of low and high ambient temperatures. ~omeothermia is based on the heat balance equation: it states that the storage of heat results from the rate at which the body generates and exchanges heat with the environment. The exchange of heat takes place through evaporation, radiation, convection and conduction. The heat generated by the body stems from the maintenance metabolism and work.
There is a certain ambient temperature range within which an optimal heat balance for the body exists based only on the heat generated by the maintenance metabolism. This range, about 21 - 24 deg C, is known as "the comfort zone". The upper and lower limits are called "critical temperatures". Below the lower critical temperature either the insulation of the body has to be improved or more heat has to be generated to avoid a negative balance. Adjustment of physical activity and insulation are the most important responses of man at temperatures below and above the comfort zone. It covers a wide range of measures from wearing clothing to all

- 185 -
sorts of shelters and homes with heating and cooling. All measures are collectively considered under the term "behavioural thermoregulation". They serve the principal purpose of maintaining a thermoneutral environment close to the body surfaces.
Man shows two principal forms of adaptation: genetic and acquired. Genetic adaptation has developed with evolution and shows characteristic morphological and physiological features and adaptive capacities in races native to tropical, temperate or polar climates. Acquired adaptation develops within the limits of the inherited adaptive capacities during an individual's lifetime with exposure to particular climatic conditions such as high altitude or with change from one climate to another. More correctly this is called "acclimatization". If acclimatization is required early in life, it will be more stable and efficient than if acquired after adulthood is reached. There are also less pronounced forms of adaptation such as seasonal acclimatization, and even shorter forms of acclimatization, depending on the climatic conditions where the individual lives.
The adaptive capacity of man sets the limits within which his adaptability can operate. Adaptability provides a buffer for the body against the changes in the ambient atmosphere. The adaptability is age dependent, being very limited in infants up to 1 year of age and elderly people. The curve of human adaptability rises steeply after the age of 10 years, is at its maximum between 20 and 40 years of age, and declines steadily from then on. Hence, the impact of climate is strong during those phases of life when the adaptability is limited and is negligible during the prime phase of life with maximum adaptability.
2. Climate and health
f.e!.f£r!!!.a.!:!.C~ _£aE,a_£i jy
The physical and mental performance capacity of man is c~imate.d~penden~. The dissipatio~ of the additional heat produced by physical work 1s fac1l1tated 1n cool and hampered in hot climates. Therefore maximum working capacities of m~n are favoured in cool and impeded in hot climates. In extreme cold, however, work1ng capacity is limited because of the heavy clothes required for insulation. Sporting activities which depend on as little restriction as possible of the body by cl~thes are therefore limited to warm climates for summer sports and temperate cold cl1mates for winter sports. High altitudes are not suitable for sport performances because of the reduced availability of oxygen for oetabolism.
Short-term changes from one climate to another can put great strain on man. The extent of this strain depends on both the difference between the two climates and the adaptability of the individual. A healthy, fit man with high adapt~ve cap~cities can afford to move from one climate to another without much effect on h1s work1ng capacities. Particularly fit individuals are even able to intrud~ into ~xtreme. climates hot or cold or high altitudes. Population groups can m1grate 1nto cl1mates that are
1
quite different from their native climate, but only the in~ividuals wi~h. high adaptability will settle down in the new climate permanently w1thout a str1k1ng reduction of their performance and reproductive capacity.
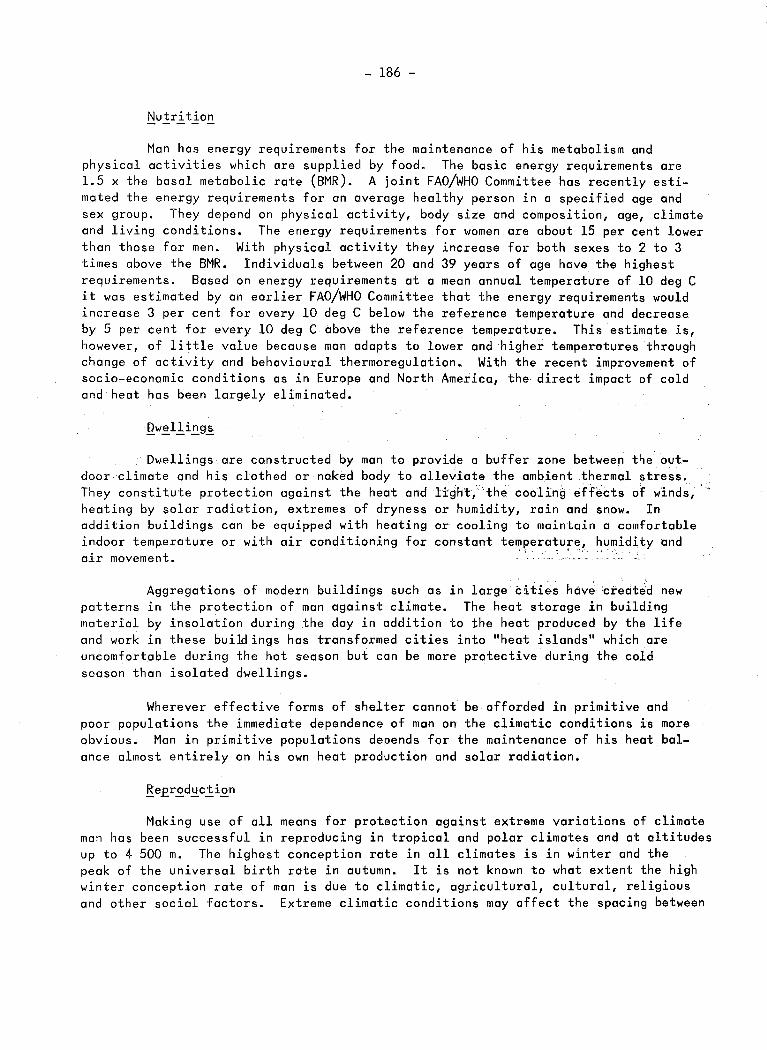
- 186 -
Nutrition
Man has energy requirements for the maintenance of his metabolism and physical activities which are supplied by food. The basic energy requirements are 1.5 x the basal metabolic rate (BMR). A joint FAO/WHO Committee has recently estimated the energy requirements for an average healthy person in a specified age and sex group. They depend on physical activity, body size and composition, age, climate and living conditions. The energy requirements for women are about 15 per cent lower than those for men. With physical activity they increase for both sexes to 2 to 3 times above the BMR. Individuals between 20 and 39 years of age have the highest requirements. Based on energy requirements at a mean annual temperature of 10 deg C it was estimated by an earlier FAO/WHO Committee that the energy requirements would increase 3 per cent for every 10 deg C below the reference temperature and decrease by 5 per cent for every 10 deg C above the reference temperature. This estimate is, however, of little value because man adapts to lower and higher temperatures through change of activity and behavioural thermoregulation. With the recent improvement of socio-economic conditions as in Europe and North America, the direct impact of cold and heat has been largely eliminated.
Dwellings are constructed by man to provide a buffer zone between the ~utdoor climate and his clothed or naked body to alleviate the ambient thermal stress. They constitute protection against the heat and light, 'the cooling effects of winds, heating by solar radiation, extremes of dryness or humidity, rain and snow. In addition buildings can be equipped with heating or cooling to maintain a comfortable indoor temperature or with air conditioning for constant te~pera~u~e, humidity ~nd a~r movement.
Aggregations of modern buildings such as in large cities hav~ created new patterns in the protection of man against climate. The heat storage in building material by insolation during the day in addition to the heat produced by the life and work in these bui~ings has transformed cities into "heat islands" which are uncomfortable during the hot season but can be more protective during the cold season than isolated dwellings.
Wherever effective forms of shelter cannot be afforded in primitive and poor populations the immediate dependence of man on the climatic conditions is more obvious. Man in primitive populations depends for the maintenance of his heat balance almost entirely on his own heat production and solar radiation.
Making use of all means for protection against extreme variations of climate man has been successful in reproducing in tropical and polar climates and at altitudes up to 4 500 m. The highest conception rate in all climates is in winter and the peak of the universal birth rate in autumn. It is not known to what extent the high winter conception rate of man is due to climatic, agricultural, cultural, religious and other social factors. Extreme climatic conditions may affect the spacing between

- 187 -
conceptions, which is longer at the low oxygen tension of high altitudes than in temperate climates. The birth rate in dry and humid tropical climates is high but infant mortality in most populations living there is also high. This high mortality 1s due more to poor hygiene, under-nutrition and infection than to the direct impact of climate.
Growth rate and development depend chiefly on the supply of foodstuffs and little on climate so long as this is not extreme. Where climate extremes exist, such as at high altitude, growth is slowed down and sexual dichotony is delayed. Menarche in the female is earlier in hot climates and later in temperate and cool climates as is sexual maturation of the male, but the length of the reproductive period is not affected by climate. Also life expectancy appears to be the same for populations in every climate if high health standards including high quality nutrition can be achieved together with elimination of premature death due to communicable diseases or accidents.
3. Climate and disease
Direct effects of climate
Diseases can result from the direct action of climatic factors when conditions are so extreme that either the body is not given enough time to adapt or the strength of the stimulus exceeds its adaptive capacity. Therefore these groups of diseases are considered to be expressions of injuries or maladjustment and are classified according to the external climatic causes.
Maladjustment is observed in hot climates as heat disorders such as heat stroke, circulatory deficiency heat exhaustion, water deficiency heat exhaustion, chronic heat fatigue, prickly heat, anhydrosis and sunburn. Maladjustments at high altitude are acute and chronic mountain sickness, and in the cold frostbites and chilblains. Furthermore, people with non-pigmented skin (generally native to temperate regions) are succeptible to development of skin cancer with repeated exposure to the kind of intense solar ultraviolet radiation that occurs in the tropics or at high altitude.
In the industrialized countries with a high standard of health, where premature death from epidemics due to improper hygiene has disappeared as in Europe and North America, monthly mortality rates are highest in winter and lowest in summer.
According to the ''disease calendar'', which is the monthly distribution of morbidity and mortality in a geographical area or climatic zone, the majority of the diseases with high morbidity rates occur during the cold months of the year. These diseases are cardiovascular diseases, acute and chronic bronchitis, influenza and pneumonia. Only gastrointestinal virus infections show a high summer morbidity. The incidence of death from neoplasm (morbid new growth, or tumours) shows no change
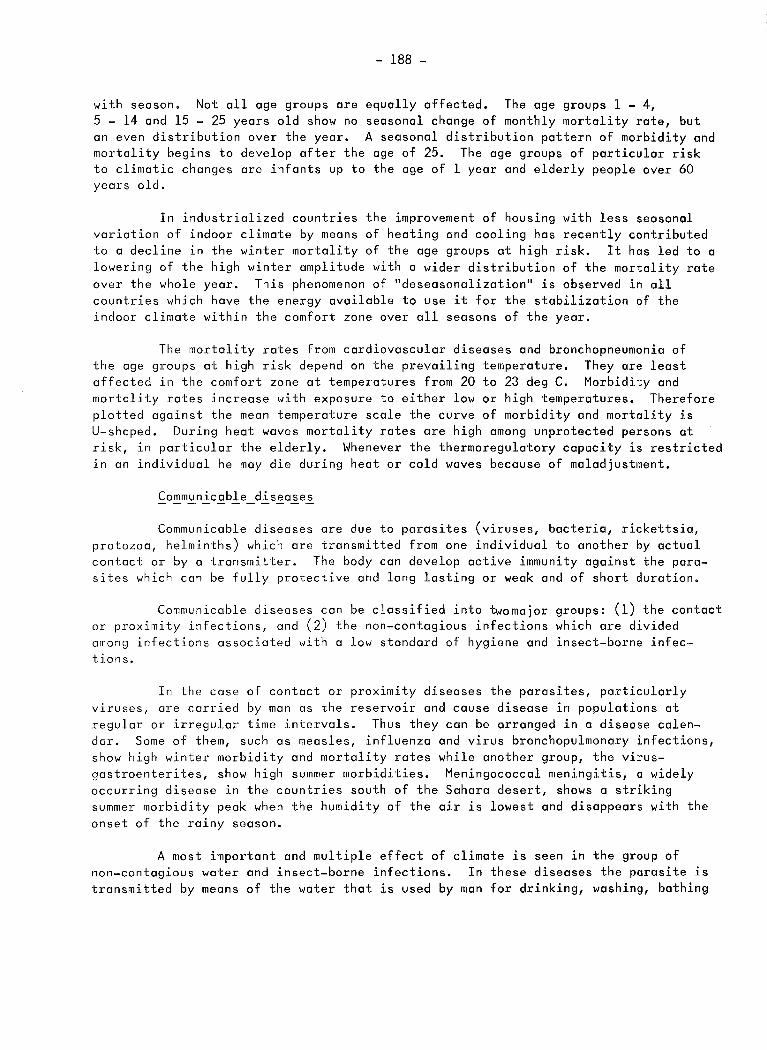
- 188 -
with season. Not all age groups are equally affected. The age groups 1 - 4, 5 - 14 and 15 - 25 years old show no seasonal change of monthly mortality rate, but an even distribution over the year. A seasonal distribution pattern of morbidity and mortality begins to develop after the age of 25. The age groups of particular risk to climatic changes are infants up to the age of 1 year and elderly people over 60 years old.
In industrialized countries the improvement of housing with less seasonal variation of indoor climate by means of heating and cooling has recently contributed to a decline in the winter mortality of the age groups at high risk. It has led to a lowering of the high winter amplitude with a wider distribution of the mortality rate over the whole year. This phenomenon of "deseasonalization" is observed in all countries which have the energy available to use it for the stabilization of the indoor climate within the comfort zone over all seasons of the year.
The mortality rates from cardiovascular diseases and bronchopneumonia of the age groups at high risk depend on the prevailing temperature. They are least affected in the comfort zone at temperatures from 20 to 23 deg C. Morbidity and mortality rates increase with exposure to either low or high temperatures. Therefore plotted against the mean temperature scale the curve of morbidity and mortality is U-shaped. During heat waves mortality rates are high among unprotected persons at risk, in particular the elderly. Whenever the thermoregulatory capacity is restricted in an individual he may die during heat or cold waves because of maladjustment.
Communicable diseases
Communicable diseases are due to parasites (viruses, bacteria, rickettsia, protozoa, helminths) which are transmitted from one individual to another by actual contact or by a transmitter. The body can develop active immunity against the parasites which can be fully protective and long lasting or weak and of short duration.
Communicable diseases can be classified into twomajor groups: (1) the contact or proximity infections, and (2) the non-contagious infections which are divided among infections associated with a low standard of hygiene and insect-borne infections.
In the case of contact or proximity diseases the parasites, particularly viruses, are carried by man as the reservoir and cause disease in populations at regular or irregular time intervals. Thus they can be arranged in a disease calendar. Some of them, such as measles, influenza and virus bronchopulmonary infections, show high winter morbidity and mortality rates while another group, the virusgastroenterites, show high summer morbidities. Meningococcal meningitis, a widely occurring disease in the countries south of the Sahara desert, shows a striking summer morbidity peak when the humidity of the air is lowest and disappears with the onset of the rainy season.
A most important and multiple effect of climate is seen in the group of non-contagious water and insect-borne infections. In these diseases the parasite is transmitted by means of the water that is used by man for drinking, washing, bathing

- 189 -
or irrigation, or by arthropods. In many diseases the parasite has to complete a developmental phase of the life cycle in a vector arthropod before it is infectious. As long as the parasite is not harboured by other homeothermic hosts, such as rodents or wild game animals, it is entirely dependent on the given climatic conditions in the soil, water or inside an arthropod vector. The insect is an isothermic temperature-conforming organism and depends for breeding and development on particular climatic conditions of temperature and humidity. The majority of the non-contagious infections, such as yellow fever, malaria and trypanosomiasis, occur in tropical climates where the vector insect finds suitable life support conditions. An exception is epidemic typhus, which is transmitted by the human louse. This louse requires heavy clothing and poor human hygiene. The disease occurs in cold climates where thick clothing is needed or in warm climates during cold periods.
4. Conclusion
The adaptability of man to a wide range of climates is more highly developed and more manifold than in any other living species. This has enabled him to establish permanent communities on land in every climatic zone as long as there is a vegetation growing period of at least a few months. Desertification of land in tropical and polar regions will force him to adopt a nomadic life and then to retreat from such areas entirely because of inability to adapt to the climatic extremes and hunger.
Man develops his highest physical and mental performance capacities in temperate climates. In these climates the thermal conditions which impose the least strain on his thermoregulation system are more frequent than in other climates. But these climates have cold winter and hot summer seasons. In the beginning of his cultural history man constructed simple dwellings for protection against these transient temperature extremes. In the more recent technological age man has improved his dwellings and, favoured by the increasing availability of energy, he has equipped them with sophisticated insulation against heating and cooling from outside and installations for maintaining a comfortable temperature inside.
The resulting gain in health and life expectancy is high, though the price paid for this and other luxuries is colossal. Man is using up the world's energy reserves at an increasing rate and has to deal with the mounting problems arising from the disposal of waste products.
How can man deal with the major climatic changes in the near future that may occur as unwanted byproducts of his struggle for health, safety, physical comfort, material goods, mobility and other luxuries exceeding his basic needs? There are two principal possibilities for man if climatic conditions should become extreme or intolerable in his native area:
(a) he can move away from these areas towards those where climatic conditions are closer to his comfort needs and where foodstuffs are available;

- 190 -
(b) he can try to improve and extend the areas of comfortable artificial climate inside his dwellings. This effort may well be impeded because the demand for energy will be high and his capital means limited.
It is an illusion to hope that man can change and develop a new, more appropriate personal adaptability to climatic conditions to which he is not genetically adapted today. What has been achieved in nature through evolution over thousands of years cannot be improved in one or two generations of man. If climatic changes in an area exceed his adaptive capacity man will succumb. However, in his intellect man has the most powerful tool for dealing with his environment. He can protect himself by creating artificial environments that are liveable, and at the same time he is free to use it to prevent his own exploitation of the earth and distur~ance of the atmosphere.
SELECTED REFERENCES
ASSMD, F. and BORECKA, I. (1077). ~ine-year study of I..IHO virus reports on fatal virus infections. Bull. Wld. Hlth. Org., 55, pp. 445-453.
BAKER, P.T. and LITTLE, M.A. (Ed) (1976). Man in the Andes. Dowden, Hutchinson and Ross, Strondsburg, 432 pp.
BULLA, A. and HITZE, K.L. (1978). Acute respiratory infections: a review. Bull. Wld. Hlth. Org. 56, pp. 481-498.
DAVEY, T.H. and WILSON, T. (1971). Davey and Lightbody's The Control of Disease in the Tropics. 4th Ed., Lewis, London, 438 pp.
DUBOS, R. (1965). Man Adapting. Yale University Press, New Haven and London, 527 pp.
FANGER, P.O. (1972). Thermal Comfort. McGraw-Hill, New York, 244 pp.
ELLIS, F.P. (1972). Mortality from heat illness and heat-aggravated illness in the United States. Env. Res. 5, pp. 1-58.
McK. KERSLAKE, D. (1972). The Stress of Hot Environments. Cambridge University Press, Cambridge, 316 pp.
MONTOYA-AGUILAR, C. (1977). A note on the relationship between climate and infant mortality. Courrier (Paris), 27, pp. 1-9.
SARGENT II, F. and TROMP, S.W. (Ed) (1964). A survey of human biometeorology. Tech. Note No. 65, WMO-~o. 160, 113 pp.
WORLD HEALTH ORGANIZATION. (1973). Energy and Protein Requirements. Report of a Joint FAO/WHO ad hoc Expert Committee. Wld. Hlth. Org. Techn. Rep. Ser. No. 522.
WYNDHAM, C.H. and FELLINGHAM, S.A. (1978). Climate and disease. S. Afr. Med. J. 53, pp. 1051-1061.
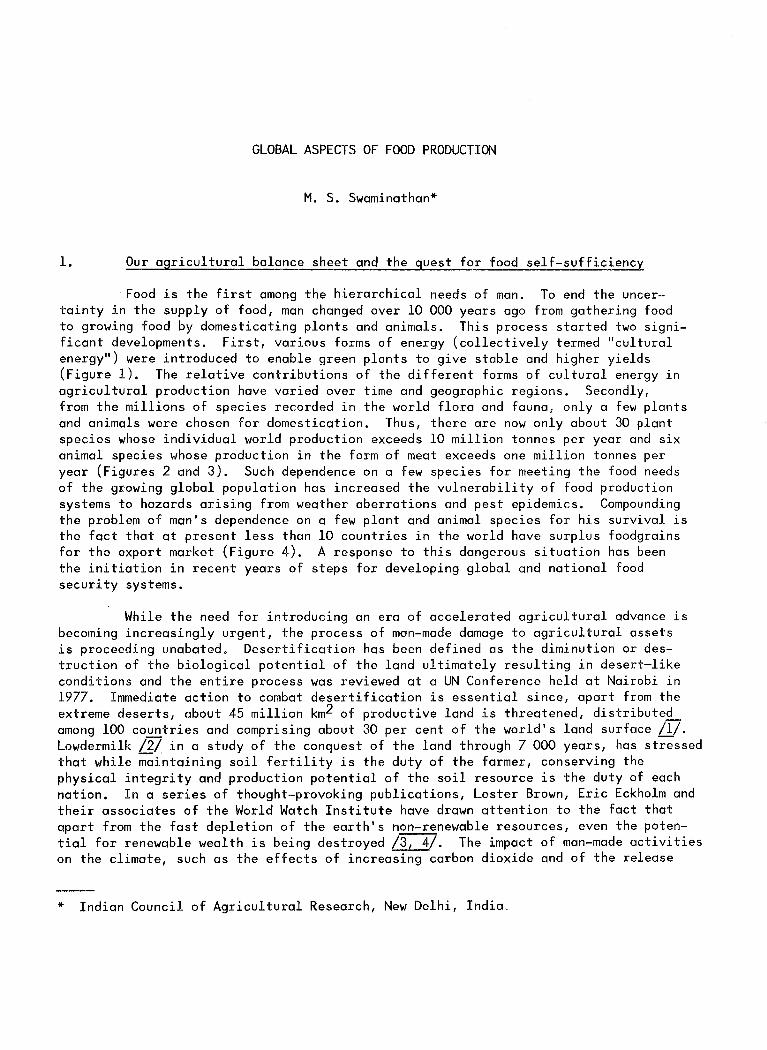
GLOBAL ASPECTS OF FOOD PRODUCTION
M. S. Swaminathan*
1. Our agricultural balance sheet and the quest for food self-sufficiency
Food is the first among the hierarchical needs of man. To end the uncer-tainty in the supply of food, man changed over 10 000 years ago from gathering food to growing food by domesticating plants and animals. This process started two significant developments. First, various forms of energy (collectively termed "cultural energy") were introduced to enable green plants to give stable and higher yields (Figure 1). The relative contributions of the different forms of cultural energy in agricultural production have varied over time and geographic regions. Secondly, from the millions of species recorded in the world flora and fauna, only a few plants and animals were chosen for domestication. Thus, there are now only about 30 plant species whose individual world production exceeds 10 million tonnes per year and six animal species whose production in the form of meat exceeds one million tonnes per year (Figures 2 and 3). Such dependence on a few species for meeting the food needs of the growing global population has increased the vulnerability of food production systems to hazards arising from weather aberrations and pest epidemics. Compounding the problem of man's dependence on a few plant and animal species for his survival is the fact that at present less than 10 countries in the world have surplus foodgrains for the export market (Figure 4). A response to this dangerous situation has been the initiation in recent years of steps for developing global and national food security systems.
While the need for introducing an era of accelerated agricultural advance is becoming increasingly urgent, the process of man-made damage to agricultural assets is proceeding unabated. Desertification has been defined as the diminution or destruction of the biological potential of the land ultimately resulting in desert-like conditions and the entire process was reviewed at a UN Conference held at Nairobi in 1977. Immediate action to combat desertification is essential since, apart from the extreme deserts, about 45 million km2 of productive land is threatened, distribute£_ among lOO countries and comprising about 30 per cent of the world's land surface /1/. Lowdermilk /2/ in a study of the conquest of the land through 7 000 years, has st~ssed that while ~intaining soil fertility is the duty of the farmer, conserving the physical integrity and production potential of the soil resource is the duty of each nation. In a series of thought-provoking publications, Lester Brown, Eric Eckholm and their associates of the World Watch Institute have drawn attention to the fact that apart from the fast depletion of the earth's n~newable resources, even the potential for renewable wealth is being destroyed /3, 4/. The impact of man-made activities on the climate, such as the effects of increasing carbon dioxide and of the release
* Indian Council of Agricultural Research, New Delhi, India.

- 192
I ~ q>, 45% OF ENERGY SPECTRUM PHOTO-
[CULTURAiE~~~~:::THETICir USEFUL o'.~orr2_ ~~~~ ~~:~-~~~:~~'6fJ~~Ag~ ~·>-·.r()\ \7 0~/ \ 2 PIRATION
--~ "DJ- t=' .ol', (:;!;;:.\ ,~ ~~~ )~.e \::;::~;),, ; ~<1'·-1/- -;/'o AN
1-iUMMI 2-5"/. PHOTO~XNTHETICA- O"L'( 11. OF PHOTO- .... M 1""1-a
,_-,_-- LLY ACTIVECNERGY CAP- SYNTHETICALLY ACTIVE ..,~ "' ·' '•\ TURED -;·- ENEI<GY HARVESTED a ~--=
. ii/0j-- =/ ~~h. ' /)AS FOOD J J w~ -~~~:@AL l ~ ~'_r.~_~ .. /')~ -· CONVERSION i~ fff ~ lr.l"' EFFICIENCY 0"-3·0). <>,0 ANIMA~J''J
_;:;) , HEAVY ENERGY LOSS DUE FARM MACHINERY§' ·r, ' ~- <:" TO INEFFICIENT CONVER-Qf I! >-Z.>--"' SION OF FOOD ENERGY
@ -- n '=1%~-v-1< ~~~~ILl- ® ~ 0-?~~~~
0 \!!9 ~ 0-AGRlCU:..TuRAL VIATEf-l 01--
CHEMICALS
Figure 2-Annua1 production of the world's major food crops (1976) (Source: FAO Production Year Book, 1976)

- 193 -
BEEF
PORK
POULTRY
LAMB
BUFFALO
HORSE
5 10 IS 20 25 30 35 40 45
PRODUCTION (MILLION METRIC TONNES)
Figure 3 - Annual production of the world's major animal products (Source: FAO Production Year Book 1976)
NORTH AMERICA
WESTERN EUROPE
U. S.S.R. AND EASTERN EUROPE
CH IN A
JAPAN
OTHER ASIA
AUSTRALIA AND NEW ZEALAND
AFRICA AND MIDDLE EAST
LATIN AMERICA
1969-1972 Average 1975-1976
45·7
·30-20-10 0 10 20 30 40 50 60 70 -30-20-10 0 10 20 30 40 50 60 70
NET GRAIN TRADE (MILLIONSOFMETRICTONSl
50
Figure 4- World's increasing dependence on the grain exports of a few countries; U.S.A. and Canada supply most of the grain
(Source: U.S. Department of Agriculture /18/)
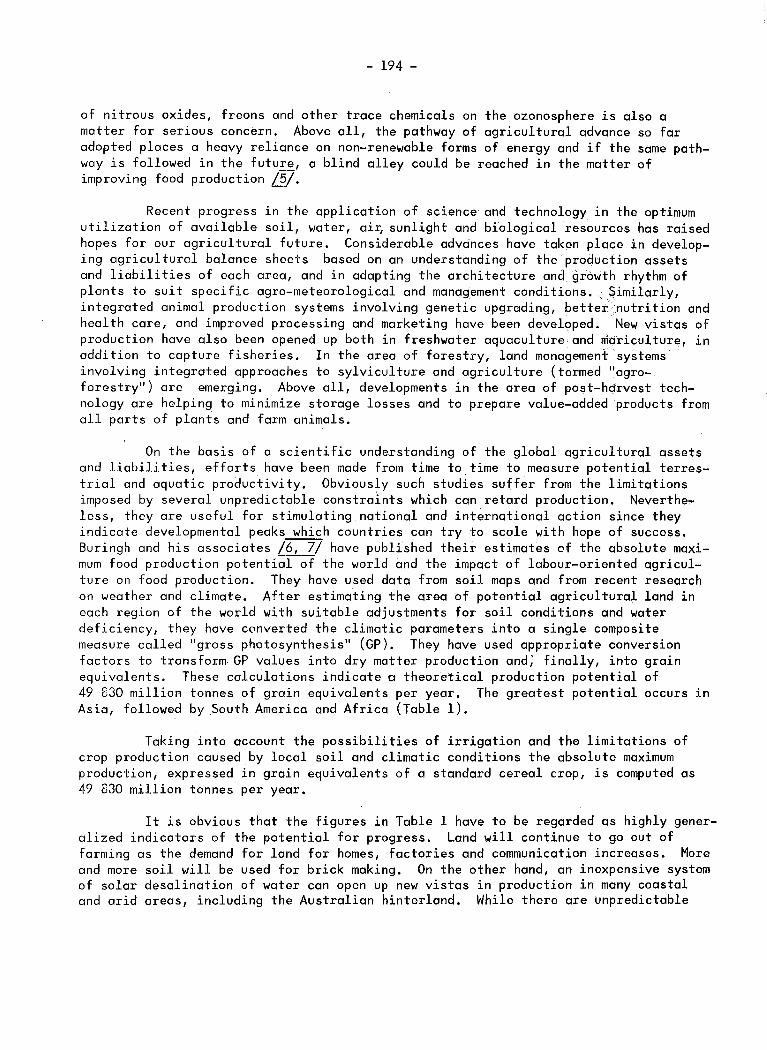
- 194 -
of nitrous oxides, freons and other trace chemicals on the ozonosphere is also a matter for serious concern, Above all, the pathway of agricultural advance so far adopted places a heavy reliance on non-renewable forms of energy and if the same pathway is followed in the futu~, a blind alley could be reached in the matter of improving food production /5/.
Recent progress in the application of science and technology in the optimum utilization of available soil, water, ai~ sunlight and biological resources has raised hopes for our agricultural future. Considerable advances have taken place in developing agricultural balance sheets based on an understanding of the production assets and liabilities of each area, and in adapting the architecture and growth rhythm of plants to suit specific agro-meteorological and management conditions. Similarly, integrated animal production systems involving genetic upgrading, bette~~nutrition and health care, and improved processing and marketing have been developed. .New vistas of production have also been opened up both in freshwater aquaculture and ~g~iculture, in addition to capture fisheries. In the area of forestry, land management'systems involving integrated approaches to sylviculture and agriculture (termed "agroforestry") are emerging. Above all, developments in the area of post-hdrvest technology are helping to minimize storage losses and to prepare value-added products from all parts of plants and farm animals.
On the basis of a scientific understanding of the global agricultural assets and liabilities, efforts have been made from time to time to measure potential terrestrial and aquatic productivity. Obviously such studies suffer from the limitations imposed by several unpredictable constraints which can retard production. Neverthe~
less, they are useful for stimulating national and international action since they indicate developmental peaks which countries can try to scale with hope of success. Buringh and his associates /6, 7/ have publlshed their estimates of the absolute maximum food production potential of the world and the impact of labour-oriented agriculture on food production. They have used data from soil maps and from recent research on weather and climate. After estimating the area of potential agricultural land in each region of the world with suitable adjustments for soil conditions and water deficiency, they have converted the climatic parameters into a single composite measure called ''gross photosynthesis'' (GP). They have used appropriate conversion factors to transform. GP values into dry matter production and; finally, into grain equivalents. These calculations indicate o theoretical production potential of 49 830 million tonnes of grain equivalents per year, The greatest potential occurs in Asia, followed by South America and Africa (Table 1).
Taking into account the possibilities of irrigation and the limitations of crop production caused by local soil and climatic conditions the absolute maximum production, expressed in grain equivalents of a standard cereal crop, is computed as 49 830 million tonnes per year.
It is obvious that the figures in Table 1 have to be regarded as highly generalized indicators of the potential for progress. Land will continue to go out of farming as the demand for land for homes, factories and communication increases. More and more soil will be used for brick making. On the other hand, an inexpensive system of solar desalination of water can open up new vistas in production in many coastal and arid areas, including the Australian hinterland. While there are unpredictable
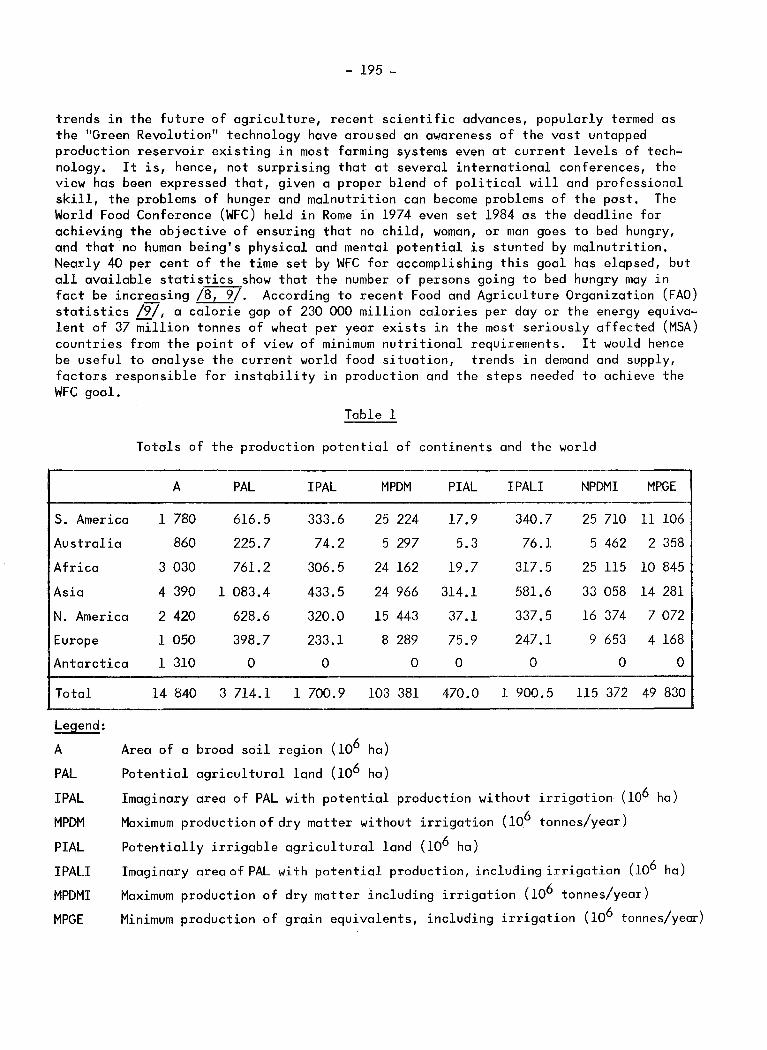
- 195 -
trends in the future of agriculture, recent scientific advances, popularly termed as the "Green Revolution" technology have aroused an awareness of the vast untapped production reservoir existing in most farming systems even at current levels of technology. It is, hence, not surprising that at several international conferences, the view has been expressed that, given a proper blend of political will and professional skill, the problems of hunger and malnutrition can become problems of the past. The World Food Conference (WFC) held in Rome in 1974 even set 1984 as the deadline for achieving the objective of ensuring that no child, woman, or man goes to bed hungry, and that no human being's physical and mental potential is stunted by malnutrition. Nearly 40 per cent of the time set by WFC for accomplishing this goal has elapsed, but all available statistics show that the number of persons going to bed hungry may in fact be incr~sing /8, 9/. According to recent Food and Agriculture Organization (FAO) statistics /9/, a calorie gap of 230 000 million calories per day or the energy equivalent of 37 million tonnes of wheat per year exists in the most seriously affected (MSA) countries from the point of view of minimum nutritional requirements. It would hence be useful to analyse the current world food situation, trends in demand and supply, factors responsible for instability in production and the steps needed to achieve the WFC goal.
Table 1
Totals of the production potential of continents and the world
A PAL !PAL MPDM PIAL IPALI NPDMI MPGE
S. America 1 780 616.5 333.6 25 224 17.9 340.7 25 710 11 106
Australia 860 225.7 74.2 5 297 5.3 76.1 5 462 2 358
Africa 3 030 761.2 306.5 24 162 19.7 317.5 25 115 10 845
Asia 4 390 1 083.4 433.5 24 966 314.1 581.6 33 058 14 281
N. America 2 420 628.6 320.0 15 443 37.1 337.5 16 374 7 072
Europe 1 050 398.7 233.1 8 289 75.9 247.1 9 653 4 168
Antarctica 1 310 0 0 0 0 0 0 0
Total
Legend:
A
PAL
!PAL
MPDM
PIAL
IPALI
MPDMI
MPGE
14 840 3 714.1 1 700.9 103 381
Area of a broad soil region (106 ha)
Potential agricultural land (106 ha)
470.0 1 900.5 115 372 49 830
Imaginary area of PAL with potential production without irrigation (106 ha)
Maximum production of dry matter without irrigation ( 106 tonnes/year)
Potentially irrigable agricultural land (106 ha)
Imaginary area of PAL with potential production, including irrigation (lo6 ha)
Maximum production of dry matter including irrigation (106 tonnes/year)
Minimum production of grain equivalents, including irrigation (106 tonnes/year)

- 196 -
2. The current world food situation
Several international and national agencies, particularly the Food and Agriculture Organization of the United Nations, the International Food Policy Research Institute (IFPRI) and the US Department of Agriculture have been issuing from time to time reports on the world food situation /9, 10, 11/. Based on these documents, the situation on the food production front can be summarized as follows.
World production of cereal grains (about 1 200 million metric tonnes) needs to expand by about 25 million tonnes per year to meet rising demand, since population increases by about 75 million annually, and one tonne of grain feeds on an everage three people. In 1972, however - for the first time in twenty years - world output actllally declined by about 33 million tonnes because of adverse weather. (Since 1972, output has fluctuated - rising in 1973, declining in 1974 and rising again from 1975 onwards.)
World food demand is expected to grow at a rate of about 2.4 per cent a year until 1985, while the production growth rate is expected to average about 2.5 per cent a year. In the developing countries, however, the anticipated increase in demand is 3.6 per cent. These projections are based on past trends and exclude serious crop failure, major changes in government policies or relative prices and qualitative improvement in diets.
Since demand in the developing countries continues to grow faster than production, the deficit of cereals is expected to increase from an average of 16 million tonnes per year from 1969 through 1972 to around 85 million tonnes per year by 1985. This prospect is made all the more awesome by the fact that the average cost per tonne of cereals has more than doubled in the last few years.
In 1972, even before the oil-price rise and the related fertilizer-price increase, world cereal prices rose steeply. In spite of good 1973 harvests, prices reached even higher levels by early 1974. Although these increases were offset to some extent by greater earnings from exports, the profits were unevenly shared; the countries that suffered the most gained the least.
Before World War II, Asia, Africa and Latin America, as regions, were net exporters of foodgrains. During the period 1934-38, an average of 12 million tonnes of cereal grains used to be exported from these regions. However, largely due to a rapid increase in population size, these regions became importers of food. The annual imports were of the order of 5 million tonnes during 1948-52. This figure became 19 million tonnes in 1960, 36 million tonnes in 1966, 47 million tonnes in 1973 and 60 million tonnes in 1975.
As a result of these developments, increased numbers of people, now totalling an estimated 25 to 30 per cent of the population in Africa and South Asia, suffer from malnutrition or undernutrition. Malnutrition appears to affect around 460 million people in the developing world and this is a conservative estimate. Even in countries with a substantial grain reserve, like India, inadequate purchasing power, arising from unemployment and under-employment results in undernutrition among the economically handicapped sections of the community. In several MSA countries, emergency
- 197 -
situations ar1s1ng from national calamities like flood and drought aggravate problems of unemployment and undulations in production. Hence, direct State intervention in organizing food and health relief operations often become necessary. Guidelines are now available for organizing such relief measures effectively /12/.
3. Aquatic production
Before considering how this challenge can be met, it would be useful to consider the trends in aquatic productivity, since with growing pressure of population on land, the fisherman and the sea will have to receive as much attention as the farmer and the soil. This will be particularly true for countries with a long coastline, since with the declaration of a 200 mile "Exclusive Economic Zone", the ocean surface available to them for scientific management and use may be substantial. For example, the area of the ocean space available to India under the "Exclusive Economic Zone" principle, would be about 2 million km2 as compared to the total land area of 3,28 million km2.
According to the recent FAO projections issued in June, 1978 /13/, the cur·· rent position with regard to world fisheries production and consumption is as follows.
Since 1971 the rate of growth of world fisheries production has declined sharply. In the fifties it grew at almost 7 per cent per annum, in the sixties at a little under 6 per cent but in the seventies the rate of increase has fallen to less than 1 per cent. The principal cause of this decline has been the collapse of a number of important fisheries exploited largely for the production of fish meal and oil. Among these, the most important has been the southeast Pacific anchoveta fishery which in 1976 yielded some 4 million tonnes compared with 12 million tonnes in 1970, but other fisheries, e.g., the Atlanto-Scandian herring, of less absolute size have shown similar proportional declines. Total landings of fish for reduction delivered to fishmeal plants which reached a peak of 26.5 million tonnes in 1970 had by 1973 declined to 18.5 million tonnes and although production has since recovered, it is still well short of the 1970 level.
In contrast to the actual fish harvests, theoretical estimates of potential productivity at various tropic levels reveal a vast untapped production reservoir. For example, the total fish biomass for the world as a whole has been put at 640 x 106 tonnes, assuming that the harvest is taken at the second stage of carnivores with a 15 per cent ecological efficiency factor. The krill resources alone have been estimated to range between 750 and 1 350 million tonnes with an annual harvestable yield of lOO to 150 million tonnes from the Southern Ocean. Out of this, only about 20 000 tonnes are being harvested.
In addition to the potential for capturing additional quantities of fish through improved technology, there is vast scope for culture fisheries both in inland and coastal waters. Modern fish farming techniques are as exciting as recent developments in crop or animal husbandry. By appropriate integrated strategies of capture fisheries, the availability of fish products both for human and animal consumption can be increased considerably.
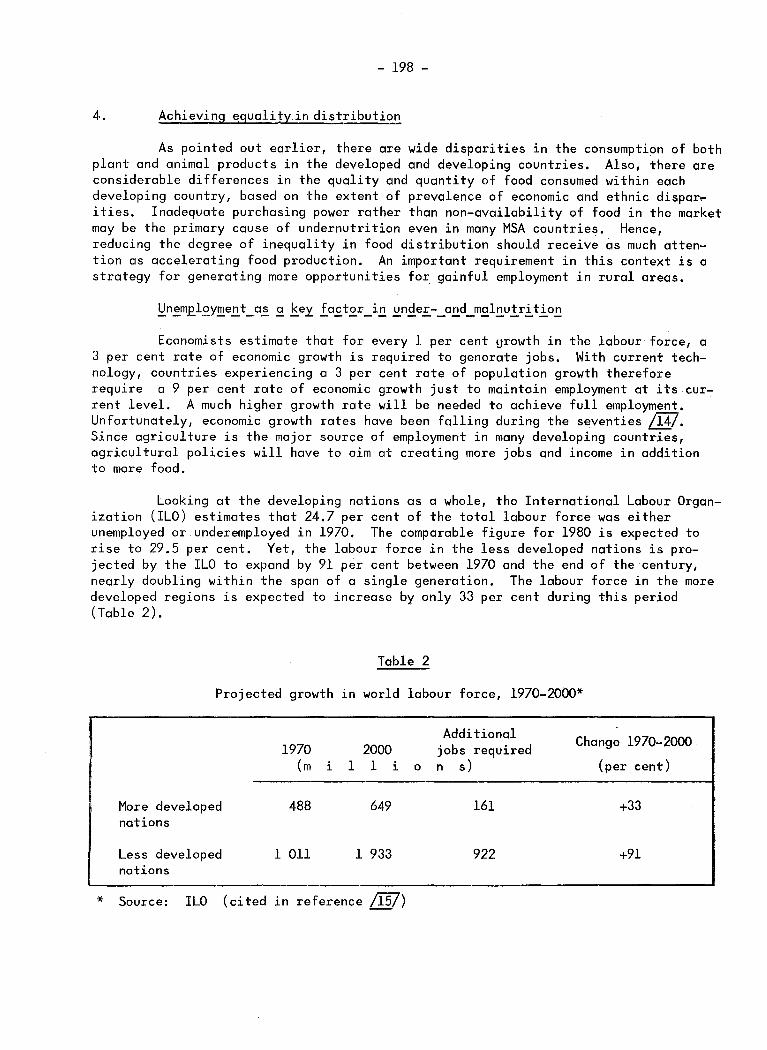
- 198 -
4. Achieving equality in distribution
As pointed out earlier, there are wide disparities in the consumption of both plant and animal products in the developed and developing countries. Also, there are considerable differences in the quality and quantity of food consumed within each developing country, based on the extent of prevalence of economic and ethnic dispar~ ities. Inadequate purchasing power rather than non-availability of food in the market may be the primary cause of undernutrition even in many MSA countries. Hence, reducing the degree of inequality in food distribution should receive as much attention as accelerating food production. An important requirement in this context is a strategy for generating more opportunities for gainful employment in rural areas.
Economists estimate that for every 1 per cent growth in the labour force, a 3 per cent rate of economic growth is required to generate jobs. With current technology, countries experiencing a 3 per cent rate of population growth therefore require a 9 per cent rate of economic growth just to maintain employment at its current level. A much higher growth rate will be needed to achieve full employment. Unfortunately, economic growth rates have been falling during the seventies /14/. Since agriculture is the major source of employment in many developing countries, agricultural policies will have to aim at creating more jobs and income in addition to more food.
Looking at the developing nations as a whole, the International Labour Organization (ILO) estimates that 24.7 per cent of the total labour force was either unemployed or underemployed in 1970. The comparable figure for 1980 is expected to rise to 29.5 per cent. Yet, the labour force in the less developed nations is projected by the ILO to expand by 91 per cent between 1970 and the end of the century, nearly doubling within the span of a single generation. The labour force in the more developed regions is expected to increase by only 33 per cent during this period (Table 2).
*
Table 2
Projected growth in world labour force, 1970-2000*
1970 2000 (m i 1 1 i 0
More developed 488 649 nations
Less developed 1 Oll 1 933 nations
Source: ILO (cited in reference /15/)
Additional jobs required n s)
161
922
Change 1970-2000
(per cent)
+33
- 199 -
Further aggravating the problem, the number of persons requ1r1ng nonagricultural employment in developing economics will increase from 342 million in 1970 to a projected 1 091 million in the year 2000, a staggering increase of 219 per cent in one generation. Few, if any, developing countries have the kind of investment capital needed to generate new jobs at such a fast pace. Thus, a massive effort is needed to generate jobs both in the agricultural and non-agricultural sectors. The vast dimensions of this problem and the lack of adequate resources for the effective utilization of the available manpower necessitate the development of employment generation policies based on the scientific utilization of local resources. Without such an approach it will be difficult to initiate self-replicating and self-propelling systems of rural development.
Depending on the extent and quality of unemployment, technologies appropriate to the socio-economic conditions of each country should be developed and disseminated. A good example of appropriate technology under conditions of rural unemployment and underemployment is the development of hybrid cotton in India based on seed produced by hand emasculation and pollination. A one-hectare hybrid seed production unit in cotton may provide jobs for 80 women for 100 days. Creation of opportunities for gainful employment of women is particularly important since rural women tend to remain underpaid or unpaid for most of the jobs they currently perform.
In view of the linkages among poverty, unemployment and hunger, there is need for subjecting all developmental projects to impact analyses from the ecological, economic, employment and nutritional viewpoints. The criteria used for measuring the likely social impact of a new technology must include employment. It is also essential that the impact analysis is designed to measure the implications of new projects on the economic and nutritional well-being of women and children, if the goal of ensuring their physical and mental potential is not to be frustrated by malnutrition. An impact analysis of this kind can help to correct distortions in priorities which may arise if human needs are overlooked. For example, supplies of fish available for direct human consumption in several MSA countries have remained practically stagnant, while exports of fish products have grown.
5. Risk and uncertainty in food production
The three major factors which influence variations in yield and food production are weather, pest epidemics and public policies.
!m£a£t_o£ ~e~t~eE £n_t~rEe~tEi~l_a~d_agu~tic_pEo~u£tivitx
According to an analysis of the U.S. Department of Agriculture /11/, there is a positive correlation between the effects of weather in one place and those in another. An analysis of yield trends and variations in 25 regions covering the world's major grain producing areas indicates that when grain yields decline because of adverse weather in one part of the world, the chances are better than even that they will be lower in many other parts of the world too. Unfavourable weather conditions played a dominant role in causing major declines in food production in 1964-66

- 200 -
and 1972-74. Conversely, good weather tends to be experienced also at the same time in many parts of the world. However, the analysis did not reveal the existence of weather cycles or trends during 1950 to 1973.
An analysis of variation in grain yield in several parts of the world during 1950-73, sjowed that the weather in one year out of three could be expected to produce a deviation greater than 21 million tonnes from trend production in the 25 regions studied (Table 3).
Grain
Wheat
Rice
Corn
Barley
Oats
Sorghum-millet
Rye
Table 3
Changes in grain production due to weather in
25 major world grain producing regions
(data from reference /11/)
Without With covariation(l) covariation(2)
(million metric tons)
11.59 13.28
4.58 4.81
5.68 6.24
5.13 5.42
1.95 2.23
2.06 2.23
0.91 1.03
Coarse grains (incl. rye) 8.22 10.04
All grains (incl. rice) 14.74
(1) Assumes that yield fluctuations are not related
(2) Includes interrelation between yield fluctuations
21.08
Per cent difference
+15
+5
+10
+6
+14
+8
+13
+22
+43
There has been considerable interest in recent years on climate in relation to production, in view of reported changes in climatic trends. Several scenarios .. have been constructed. A recent study organized by the National Defense University of the United States, for example, considered five different possibilities inc!uding largely global cooling, moderate global warming, large global warming /15/.

- 201 -
The derived climate scenarios manifest a broad range of perceptions about possible temperature trends to the end of this century, but suggest as most likely a climate resembling the average for the past 30 years. Collectively, the respondents tended to anticipate-a slight global warming rather than a cooling. More specifically, their assessments pointed towards only one chance in five that changes in average global temperatures will fall outside the range of -0.3 deg C to +0.6 deg C, although any temperature change was generally perceived as being amplified in the higher latitudes of both hemispheres. The respondents also gave fairly strong credence to a 20- to 22-year cycle of drought in the High Plains of the United States but did not agree on its causes.
The question of temperature change was also discussed in detail at a Conference held in Bellagio in Italy in June, 1975. The following conclusions were drawn /16/.
Climate variability, region by region and from year to year in particular regions, is and will continue to be great, resulting in substantial variability ln crop yields in the face of increasing global food needs and short supplies.
There is some cause to believe, although it is far from certain, that climatic variability in the remaining years of this century will be even greater than during the 1940-1970 period.
The implications of the undulations in food production caused by climate have been examined at several international conferences, More recently, the climate-food output relationships have assumed importance in relation to the grain reserves necessary for building global and national security systems /17, 18/. Waiters /17/ has stressed the need for utilizing the surplus wheat of some 40 to 50 million tonnes available during 1977-78 for building a grain reserve, either an insurance reserve of 20 to 30 million tonnes or a major stabilization reserve of 50 to 60 million tonnes. While the building of such grain reserves at the global, regional and national levels is exceedingly important for off-setting the shortages caused by weather aberrations, it is also essential that steps are taken to insulate agricultural fortunes from the vagaries of climate to the extent possible. The following are some of the major steps needed for this purpose.
Wherever possible, steps for increasing the area under assured irrigation should receive the highest priority. This is particularly important in the tropics and sub-tropics where (a) the rainfall distribution is often skewed, (b) the evapotranspiration rates may be high throughout the year and (c) the period of maximum insolation often coincides with the period of minimum precipitation. Without assured water supply, fertilizer application becomes risky and yields tend to remain low. In rice, which is the second major crop_of the world, there is in Asia a strong positive correlation between the proportion of area under irrigation and average yield (Figure 5). In India, studies by the India Meteorological Department reveal that variation in climate resulting in drought, floods, high evapotranspiration, etc., may account for more than half the variation in the yield of crops. Also it is not just total rainfall but rainfall during critical stages in the growth of the plant such as
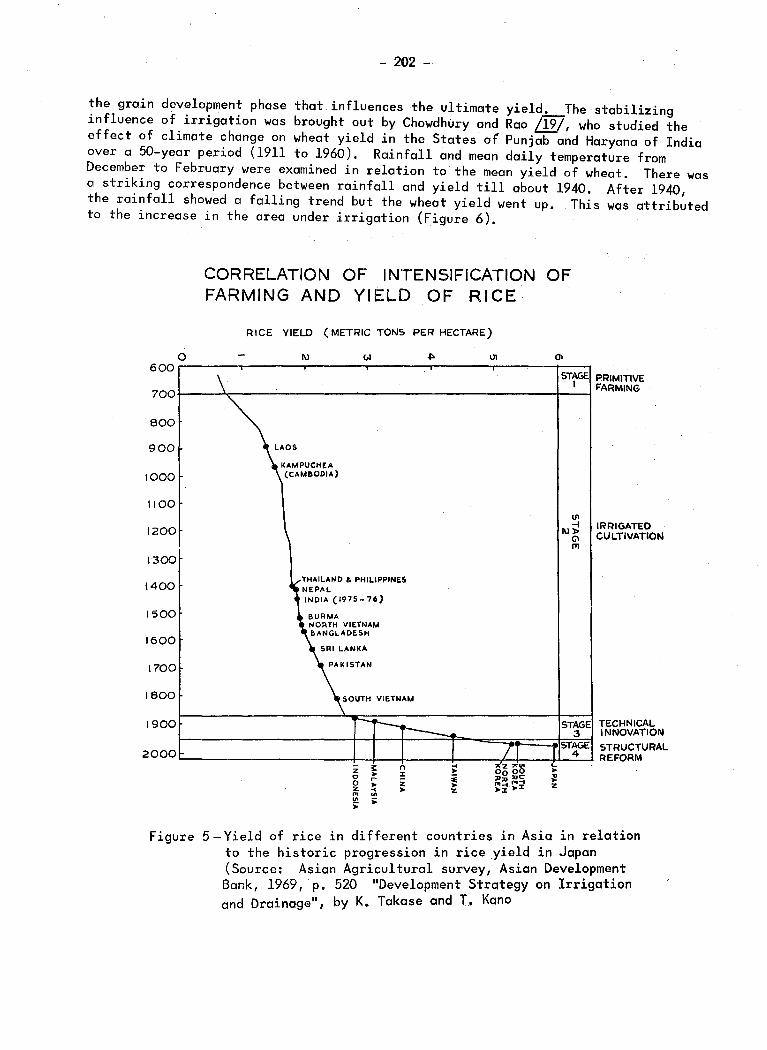
- 202 -
the grain development phase that influences the ultimate yield. The stabilizing influence of irrigation was brought out by Chowdhury and Rao /19/, who studied the effect of climate change on wheat yield in the States o( Punjab and Haryana of India over a 50-year period (1911 to 1960). Rainfall and mean daily temperature from December to February were examined in relation to the mean yield of wheat. There was a striking correspondence between rainfall and yield till about 1940. After 1940, the rainfall showed a falling trend but the wheat yield went up. This was attributed to the increase in the area under irrigation (Figure 6).
0 600
700
600
900
1000
1100
1200
1300
1400
1500
1600
1700
1600
1900
2000
Figure
CORRELATION OF INTENSIFICATION OF FARMING AND YIELD OF RICE·
\
RICE YIELD (METRIC TONS PER HECTARE)
1\)
LAOS
KAMPUCHEA (CAMBODIA)
\
~THAILAND & PHILIPPINE& NEPAL
j INDIA (1975-76)
BURMA NORTH VIETNAM BANGLADESH
SRI LANKA
PAKISTAN
SOUTH VIETNAM
r-r----,1'----.
n J:
z ).
J
STAGE I
Ill -i
1\))>
G'l
"'
STAGE 3
/I STAGE
4
" """ L.
PRIMITIVE ARMING F
I RRIGATED CULTIVATION
TECHNICAL INNOVATION
STRUCTURAL REFORM
5- Yield of rice in different countries in Asia in relation to the historic progression in rice yield in Japan (Source: Asian Agricultural survey, Asian Devel~pme~t Bank, 1969, p. 520 "Development Strategy on Irngahon and Drainage", by K. Takase and T.. Kano

- 203 -
VARIATIONS IN WHEAT YIELD & RAINFALL
E u
_j _j <( i.L. z -<l: 0:
....,.
...... (J) ~ '-
0 -l w >-
10 RAINFALL
8
6
4
2
YIELD
900
800 1915 20 35 40
YEARS
I I 45' 50 55 1960
Figure 6 - Relationship between rainfall and wheat yield in northwest India showing the impact of irrigation on enhancing and stabilizing yield /19/
The availability of a large irrigated area also makes the initiation of additional production programmes in such areas in years of drought or floods possible. Such compensatory programmes in irrigated areas could form an important part of the strategy for minimizing the adverse impact of aberrant weather. The U.S. Department of Agriculture has computed the production needed to build adequate stocks in "good" years to maintain consumption in "bad" years /18/. This study also reveals that the largest potential for yield increases is in coarse grain, particularly corn and sorghum.
The technological approach to imparting greater stability to production in rainfed and semi-arid areas involves above all measures to conserve the available moisture under a given set of weather variables. By studying the rainfall pattern in detail, including the probable date of commencement of the sowing rain and the likely inter-spell duration between two rains, it is possible to develop more stable cropping systems taking into account the moisture-holding capacity of the soil and the evapotranspiration data /20, 2~/. It is also possible to develop contingency plans and alternative cropping strategies to suit different weather probabilities in areas prone to drought and floods. To implement the contingency plans it will be necessary to build seed reserves of the alternative crops. In areas characterized by wide ~nnual fluctuations in rainfall pattern, it is desirable to make the seed reserves necessary for implementing alternative cr£££ing strategies an integral part of the national seed production and storage system /22/.
- 204-
If surplus water can be stored in the watersheds of rainfed areas, a crop life-saving irrigation can be given if the rainfall stops abruptly at the time of grain development other crop life-saving techniques are also now available /23/. While the solution both to excess and shortage of water is largely an engin;;;ing one, genetic approaches are possible through the development of varieties possessing greater resilience to environmental variables. Thus, Ganga Prasad Rao and eo-workers /24/ have shown that early maturing hybrids and varieties of sorghum do better during both scanty and abundant rainfall years. Early seedling vigour~ hybrid vigour for root growth and quick maturity are attributes which confer on the plant stability of performance in drought prone areas. The cropping strategy for flood-prone areas will have to rely heavily on making the flood-free season the maj?r cro~~ing season.
. .
When meteorologist~ are able to develop reliable early warning systems of monsoon behaviour, it will be possible to further refine the contirig~ncy plans for different weather possibilities and implement them more effectively. Through an integrated approach to efficient water and .soil conservation and mqnagement in each watershed area, crop planning based on both yield and stability characteristics, introduction of crop life-saving techniques when neceisary, and preparedness for introducing alternative land use strategies according to weather conditions, it is now possible to both elevate and stabilize crop production to a greater extent than was considered possible some years ago.
Besides weather aberrations, the incidence of pest epidemics has been a major factor in causing instability and risk in crop production. Both weather conditions favourable to the pest as well as man-made causes like unscientific crop planning, cultivation of large areas with a single strain of a crop and improper or inadequate plant protection measures can result in widespread pest epidemics. The following are some of the major famines or food losses associated with pest epidemics in the past:
(a) The Irish famine of the 1840s due to the potato late blight epidemic;
(b) The wheatless days of 1917 in the U.S.A. due to stem rust epidemics;
(c) The Bengal famine of India in 1943 associated with the Helminthosporium brown spot disease of rice;
(d) The devastation of all Victoria-derived oats in the mid 1940s in the U.S.A. due to a fungus causing the Victoria blight disease;
(e) The southern corn blight epidemic caused by Helminthosporium maydis on all U.S.A. maize hybrids carrying the T-type cytoplasmic male sterility during 1970-71;
(f) The rapid shift from brown planthopper biotype 1 to biotype 2 during 1974 to 1976 when large areas in the Philippines and in Indonesia were planted to a few semi-dwarf strains of rice.
(g) Downy Mildew epidemic in pearl millet caused by Sclerosphora graminicola in India in 1973.

- 205 -
Whereas uniformity within a crop leads to genetic vulnerability, reinstating genetic diversity is~e of the most effective means in providing protection against such vulnerability /25/. On the other hand, the sequential release of resistant varieties based on major gene-controlled vertical resistance could lead to the "boom and bust" cycles. Hence, an integrated pest management strategy will have to be developed for each major crop and agro-climatic region. Studies on the relationship between weather and pest epidemics and the establishment of pest survey and surveillance systems at the national and regional levels (as for example, the FADsponsored Locust Warning System) can help in taking timely action against pest epidemics. Varietal diversification, gene deployment and other pest containment strategies can be very effective in the control of important diseases like wheat rusts. Satellite photographs of cloud movements also provide a basis for predicting the zone of early establishment of stem rust of wheat in India /26/.
Countries in the tropics and sub-tropics face more serious pest problems since there are crops and vegetation throughout the year serving as alternative hosts for many pests. Also, temperature, sunlight and moisture conditions promote continuous multiplication of pests without interruption, unlike in the temperate areas where the severe winter is a restraining factor. Tropical countries will hence have to devote considerable research and developmental attention to insulating crops from severe devastationbypests. For developing reliable disease forecasting procedures, the integration of meteorological data with field survey data is essential. Such an approach could lead to other beneficial results. For example, healthy seed potato is now being produced in the plains of North India as a result of the finding that during certain months of the year, aphids which serve as vectors of several virus diseases are absent /27/.
In the ultimate analysis, farmers grow food or other crops to earn income, 1n addition to satisfying their home needs. Hence, except in countries where land use planning 1s controlled by the State, farmers' choices of crops is largely based on the net returns per hectare as well as the extent of risk involved. High yield potentialcum-low risk crops will hence receive much greater acceptance than high yield poten-tial-cum-high risk crops. To sustain agricultural progress at a desired level, it is necessary to support a package of economically viable technology with appropriate packages of services and public policies. Though the production technology associated with dwarf and·fertilizer-responsive varieties of wheat and rice itself does not possess built-in seeds of social discrimination, small farmers will be able to derive economic benefit from such technology only if their inherent handicaps in mobilising the necessary inputs and in taking risks are removed through the provision of appropriate services including credit. The public policy package will have to include appropriate land reformmeasures, integrated input and output pricing policies and effective marketing, storage and distribution.
Price incentives can stimulate rapid advances in production, as happened in Japan in the case of rice. However, unduly high grain prices will defeat the very purpose for which more food is produced, namely to feed the hungry. Hence, other compensatory benefits may have to be given to small farmers so as to enhance their income without making prices unreasonable to the consumer. Also, it will be desirable to
- 206 -
develop an agricultural credit insurance system, which can protect farmers from weather risks such as hailstormst typhoons, floods and drought. For developing an effective credit insurance programme for different farming systems, there will be need for joint research between meteorologists and agricultural scientists.
It is well known that the success of fish catch in any particular year depends on the effective recruitment during the previous seasons through proper spawning and survival of the young. The influence of climate on the breeding of many fishes in the tropics is seen from the spurt of spawning activity and a general increase in the number of fish eggs in the marine plankton soon after the first outbreak of the rains. Such intensive spawning associated with climatic changes is even more pronounced in freshwater fishes whose spawn occur in abundance durinq the floods. There is, however, need for intensive research on the relative role of different environmental parameters in determining the size of fish stocks if reliable systems of forecasting are to be developed. The quantitative relationship between temperature and fish yield also needs to be elucidated under different enviornmental conditions. Interrelated systems like the Peruvian anchovy and El Nino and the oil sardine and the monsoons in the Indian Ocean provide opportunities for multi-disciplinary research.
Besides research on the methodology for early warning and yield-forecasting services, it is necessary that more detailed knowledge is developed on the management of both ocean and freshwater resources. The scientific management of aquatic resources based on principles of ecology and economics is as important in fisheries as i.he scientific management of soil, water and air resources in crop and animal husbandry. If this is not done, aquatic desertification leading to the destruction or diminution of the biological potential of water caused by pollution, over-fishing and other man-made processes can occur.
6. Global food production: challenges and opportunities
The relentless growth in population, particularly in poor nations, following rapid advances in preventive and curative medicine in recent years (Figure 7) poses the greatest challenge not only for producing the needed quantity and quality of food for the existing and expanding population, but also for generating the economic growth rate essential for full employment. Agricultural growth will have hence to be viewed not merely in terms of the production of certain quantities of food but also in terms of employment and income generation in the rural areas.
Another major challenge is the preservation of the renewable nature of our renewable resources. This can be done only if the entire community in each country co-operates in ensuring that there is no depreciation in basic agricultural assets. Unfortunately, this awareness is yet to become widespread.
A third major challenge is in the area of energy supply and management in agriculture and aquaculture. Technologies will have to be developed and promoted which involve organic recycling principles and integrated approaches to pest management and nutrient supply. When solar power becomes economically attractive, new vistas in production can be opened up by c~mbining the use of solar energy for a variety of purposes during the production and post-harvest phases with techniques like no-tillage or minimum-tillage and other methods of minimizing the energy input needs.

8·0
Ill 7·0 z 0
::J 6·0 tXl
~ 5·0
z 0 4·0
~ ....1 :::> n. 0 n.
3·0
2·0
- 207 -
tt' 2015 I I I I I I I I I I I I I I
~1975 I I I I I r
0 1935 I
I I I I I
o~. ------~------~r=,t,,c·~===r=-=-=-~-~~-=-=--=-=.= .. =,;~~~~~'===;,======~1~6~5~0~·~-+-+)-.,--sooo 7000 6000 1000 I BEGINNING ()F I 1000 \2000 ~C BC BC BC l CHRISTIAN : AD 1 A 1J
:ERA I I :
~--- ----------. I BEGINNING I
loF : l AGRICULTURE : L-------------~
~- -- ---------~ reiE:'GiN;;,;;t-;c;;; :oisc-ovE:R'vo_F __ ; :MODERN : I MODERN DRUGS: L~_E_~~~I!J_~_J I SULFA :
I & :·
L __ ~!'::: 1!l.!9!~C:~:
YEAR
figure 7- Trends in population growth
A fourth area of considerable significance is the development of croplivestock integrated production systems. While livestock production has assumed importance in rich countries to meet the dietary preferences of people, the integration of animal husbandry with agriculture has become essential in many MSA countries since this is the only immediately feasible method of enhancing the income of small farmers and reducing under-employment among landless labour. How can this situation be reconciled with the much higher energy needs of the plant-animal-man food chain to which a reference was made earlier? Obviously, technologies of livestock management based on a complementary relationship between animal and man need to be developed. Mixed farming has always been a way of life with farmers in many developing countries. The ruminating animal is ideal for such a symbiotic production system, since all cellulosic material which cannot be digested by man can be suitable fortified and converted into nutritious animal food. Crop-livestock-fish integrated production s1!!ems offer even greater opportunities for achieving high energy input-output ratios /28/.
A fifth area of immediate relevance to the food problem is the initiation by governments of appropriate programmes for deriving benefit from the untapped yield reservoir existing at current levels of technology. This will call for massive efforts in education, organization of relevant services based on constraints analysis and above all, in introducing public policy measures which would stimulate both production and consumption.

- 208 -
Finally, governments will have to grapple with the challenge of distribution. As would be evident from the data presented earlier, the world food production is sufficient to feed the millions who are malnourished today provided there is equitable distribution. The deadline of 1984 set by the World Food Conference for ensuring that no human being goes to bed hungry can be advanced even to 1979, if a new age of humanism can be superimposed on the era of science and technology. Unless this happens, global action to meet man's need for food, energy and other basics may not be forthcoming. Until all global planning for the future and all development of technology are subjected to the one test prescribed by Mahatma Gandhi, "Will this benefit the poorest men?", it is unlikely that an international food security system will come into existence (Figure 8). The prevailing condition where with every rise in Gross National Product, the poorest nations and income groups within nations suffer more due to the increased demand for food by wealthier nations and wealthier groups within nations can be altered only by public policies designed to bring about equitable distribution /29/. How can each nation proceed to build a national food security system which can insulate the people of the country from hunger arising from weather-induced crop failures and/or inadequate purchasing power?
M 11. t~o1 etric Tons
160 __ .., .... _- --..... ..,-. -- -.... - .......... _ .....
140
120
100
Minimum ........... Securitlj Levels
~~--~--------~----~---- 1- L 1970 19711972 19731974 1975 1976
0\t vVheat coarse grains
A Estimated
& Milled rice
l 1977 A.
Figure 8 - World carry-over stocks and m1n1mum security levels (excluding U.S.S.R. and People's Republic of China) (Source: FAO)
- 209 -
While available projections of population, per capita income and demand for food on the one hand and production and marketable surplus of food on the other, reveal a possible global food gap of about 45 million tonnes by 1985, the encouraging sign is the growing awareness among developing countries that agriculture needs and deserves over-riding priority. National, regional and global efforts in agricultural research and development are growing. The Consultative Gro~p on International Agricultural Research sponsored by FAO, UNDP and IBRD and supported by many nations, banks and foundations is financing a global grid of research centres designed to advance the pace of technology development in major food crop and livestock production systems in developing countries. Analysis of gaps and constraints in major crop production systems in several MSA countries has shown that while the gap between poten-tial and actual farm yields is high, the constraints can be remedied fairly speedily. Global weather monitoring programmes sponsored by WMO are also making rapid progress and agro-meteorology is emerging as a major science. Yield forecasting techniques are being perfected. Weather satellites and remote sensing techniques have added a new dimension to research in this area. Hence, reliable early warning systems of likely food shortage can be developed if there is adequate international co-operation. The time is therefore appropriate for governments to launch a programme to build strong national food security systems. Once national food security systems are developed, it will be relatively easy to build an international food security system.
The following are some of the major components of an effective national food security system:
(a) Ecological security;
(b) Technological security;
(c) Building up food reserves;
(d) Social security.
If the ecological infrastructure necessary for sustained agricultural advance is not preserved and strengthened, desertification processes will damage both agriculture and aquaculture. Nothing should be done which will cause unfavourable changes in the macro- and micro-environment. To achieve this, there is need for a national movement in every country for promoting economic ecology /30/. Economic ecology, unlike strictly conservation ecology, is intended to maximize the economic benefits from a given ecological milieu and to minimize the risks and hazards characteristic of that environment. Guidelines for achieving ecological security along with agricultural progress will have to be drawn up by an inter-disciplinary team of scientists for each area.
- 210 -
Technology development should be tailored to specific ecological, economic and social conditions. It should be ensured that the technology does not possess built-in seeds of social discrimination. The major aim of technology in countries with very little scope for bringing additional land under cultivation should be to increase continuously the economic yield per hectare of land or water surface without detriment to the long term production potential of soil and water, Also, productivity improvement has to be brought about without increasing heavily the consumption of nonrenewable forms of energy. The improvement of yield should not also be at the cost of stability of production. Where the probability for weather-induced instability in yield due to causes like flood and drought is high, alternative cropping strategies and crop life-saving techniques should be developed to suit different weather models. Post-harvest technology should receive as much attention as production technology so that both the farmer and the consumer derive full benefit from the products marketed.
An area of technological security which is yet to receive adequate attention 1s the introduction of a systems approach in R and D efforts. The following are a few of the major farming systems which need attention particularly in countries where land 1s a limiting factor in expanding production,
(a) Multiple cropping systems in irrigated areas;
(b) Rainfed farming;
(c) Orchards and garden land cropping;
(d) Mixed and inter-cropping;
(e) Kitchen gardening
(f) Agro-forestry
(g) Mixed farming involving blends of crop and animal husbandry and agriculture and aquaculture.
Every MSA country should try to build a grain reserve which can help it to meet the anticipated shortfall in a bad year as well as to run an effective public distribution system. Countries which are not normally self-sufficient in their food requirements will obviously have to maintain adequate stocks by imports so that in years when the production is adversely affected by weather in the traditional food exporting countries, prices are not allowed to rise abnormally. Every country will have to devise an appropriate grain reserve policy based on ecological, economic, logistic and other considerations. The reserve may not be only of cereals but may include millet, grain legumes, oilseeds and other crops depending on needs and availability. Such a buffer stock operation can also help to ensure that prices of farm produce do not fall below an economic level. In addition to maintaining a basic
- 211 -
reserve and sufficient operational stocks, it will be prudent to always keep in readiness plans for increasing the production from irrigated areas during years characterized by widespread drought. Thus, an integrated grain reserve policy and a programme for the efficient use of the reserve in production potential during emergencies on the basis of early warning from crop-weather watch groups should help to launch every country on the path of self-reliance in food.
A mismatch between the ability to grow food and the ability to purchase and consume it on the part of large numbers of people could lead to a situation where a country may have large grain reserves but many children, women and men may still go to bed hungry. Hence, social security measures which ensure that everyone has his daily bread are important. Depending on social conditions, such measures could take the form of ''Food for Work'', employment guarantees, minimum wage, etc. Social security measures should not be based on dole and patronage concepts but should aim at providing opportunities for earning a minimum wage. Under conditions of sudden disasters, relief and nutritional intervention programmes will be essential /12/. Social security measures should not only cover consumers but farmers also. Through integrated pricing policies, farmers should not only be assured a fair price for their produce but also articles of daily consumption in rural areas at a fair price. Small farmers will also have to be insulated against risks arising from aberrant weather through an appropriate insurance system.
7. Conclusions
Future developments in solar energy utilization, genetic engineering and weather forecasting and modification could open up altogether new vistas of terrestrial and aquatic productivity. However, while working and waiting for such breakthroughs, no time should be lost in building dependable and effective national and international food security systems based on known knowledge and technology. Given appropriate political decisions and resource back-up, this task can be accomplished by 1984, the target year set by the World Food Conference held in Rome in 1974 for banishing hunger from the earth. The finite resources of the "spaceship earth" (to quote Buckminster Fuller) can provide food, clothing and shelter for all provided the resources are conserved and utilized by all countries in a manner that will generate synergy and symbiosis /31/. This will call for a highly co-operative interaction between those who serve science and those who move society as well as both among scientists belonging to different disciplines and social leaders belonging to different political ideologies.
REFERENCES
UN CONFERENCE ON DESERTIFICATION (1977). Desertification - its causes and consequences. Edited by the Secretariat of the UN Conference on Desertification, Pergamon Press 448 pp.
LOWDERMILK, W.C. (1953). Conquest of the land through seven thousand years. Agriculture Information Bulletin No. 99, U.S. Dept. of Agric., 30 pp.
- 212 -
/3/ BROWN, LESTER R. (1978). The twenty-ninth day - A World Watch Institute Book, W. W. Norton and Company, Inc., New York, 363 pp.
/4/ ECKHOLM, E.P. (1976). Losing ground- Environmental stress and world food prospects - World Watch Institute, W. W. Norton and Company, Inc., 223 pp.
/5/ PIMENTAL, D. and KRUMMEL, J. (1977). America's agricultural future. Ecologist VII, pp 254-261.
/6/ BURINGH, P., YEN HEEMST, H.D. and STARIN~ G.J. (1975). Computation of the absolute maximum food production of the world. Dept. of Tropical Soil Science, Agricultural University, Wageningen, 55 pp.
/7/ BURINGH, P. and YEN HEEMST, H.D. (1977). An estimation of World Food Produc-tion based on labour-oriented agriculture. Centre for World Food Market Research, Wageningen, 46 pp.
/8/ UNITED NATIONS WORLD FOOD CONFERENCE (1974). The world food problem -proposals for national and international action. 237 pp.
/9/ FOOD AND AGRICULTURE ORGANIZATION OF THE UNITED NATIONS (1977). The fourth food survey. 128 pp.
/10/ INTERNATIONAL FOOD POLICY RESEARCH INSTITUTE (1977). Food needs of develop-ing countries, projections of production and consumption to 1990. Washington, 157 pp.
/11/ UNITED STATES DEPARTMENT OF AGRICULTURE (1975). The world food situation and prospects to 1985 - Foreign Agricultural Economic Report No, 98, Washington, 90 pp.
/12/ PROTEIN-CALORIE ADVISORY GROUP OF THE UNITED NATIONS SYSTEM (1977). A guide to food and health relief operations for disasters. 206 pp.
/13/ FOOD AND AGRICULTURE ORGANIZATION (1978). Fishery products: Supply, demand and trade projections. Rome, 10 pp.
/14/ BROWN, LESTER R., McGRATH, P.L. and STOKES, B. (1976). Twenty-two dimen-sions of the population problem. World Watch, Paper 5, 83 pp.
/15/ NATIONAL DEFENSE UNIVERSITY. (1978). Climate change to the year 2000, Washington, 109 pp.
/16/ THE ROCKEFELLER FOUNDATION. (1976). Bellagio Conference on climate change, food production, and interstate conflict, 71 pp.
/17/ WALTERS, H.E. (1978). International food security; the issues and the alter-natives - International food policy issues. U.S. Department of Agriculture. Foreign Agricultural Economic Report No. 143, pp. 91-99.
- 213 -
U.S. DEPARTMENT OF AGRICULTURE (1978). Alternative features for world food in 1985. Volume 1, World Gal. Model Analytical Report. U.S. Dept of Agriculture, Foreign Agricultural Economic Report, No. 146, 137 pp.
CHOWDHURY, A. AND APPA RAO, G. (1976). Climatic changes and the wheat yield in northwestern parts in India. Climatological Note 19, Symposium on recent climatic change and the food problem, (4 - 8 October 1976). 42 PP·
RAMAN, C.R.V. (1975). A new approach to rainfall climatology over Maharashtru State for agricultural planning. Science Today, July, Bombay.
/21/ INDIAN COUNCIL OF AGRICULTURAL RESEARCH (1977). Crop planning in drought and flood prone areas. 27 pp.
SWAMINATHAN, M.S. (1972). Can we face a widespread drought again without food imports? Rajendra Prasad Memorial Lecture of Indian Society of Agril. Statistics, India, 25 pp.
INDIAN COUNCIL OF AGRICULTURAL RESEARCH (1976). Crop life-saving research -ICAR-IDRC Seminar Proceedings, published by Indian Council of Agricultural Research, New Delhi, 130 pp.
RAO, N.G.P., SUBBA RAO, S. and VIDYASAGAR RAO, K. (1975). Rainfall fluctuations and crop yields, Current Science, 44: 19: 694-697.
NATIONAL ACADEMY OF SCIENCES. (1972). Genetic vulnerability of major crops. National Academy of Sciences, Washington, U.S.A. 307 pp.
NAGARAJAN, S. and HARDEV SINGH (1976). Preliminary studies on forecasting wheat stem rust appearance. Agril. Meteorol. 17: 281-289.
/27/ PUSHKARNATH (1976). Potato in sub-tropics. Orient Longman, New Delhi, 289 pp.
/28/ THE INTERNATIONAL RICE RESEARCH INSTITUTE (1977). Constraints to high yields on Asian rice farms- an interim report., Manila, 235 pp.
/29/ RUSH, H., MARSBRAND, P. and GRIBBIN, J. (1978). World futures: Growth with redistribution? Food policy, May. 1978: 114-126.
/30/ SWAMINATHAN, M.S. (1973), Agriculture on spaceship earth, Coromandel Lec-ture No. 3., New Delhi, 31 pp.
/31/ BUCKMINSTER FULLER, R. (1975). Synergetics, Macmillam Publishing Co., Inc., 876 pp.
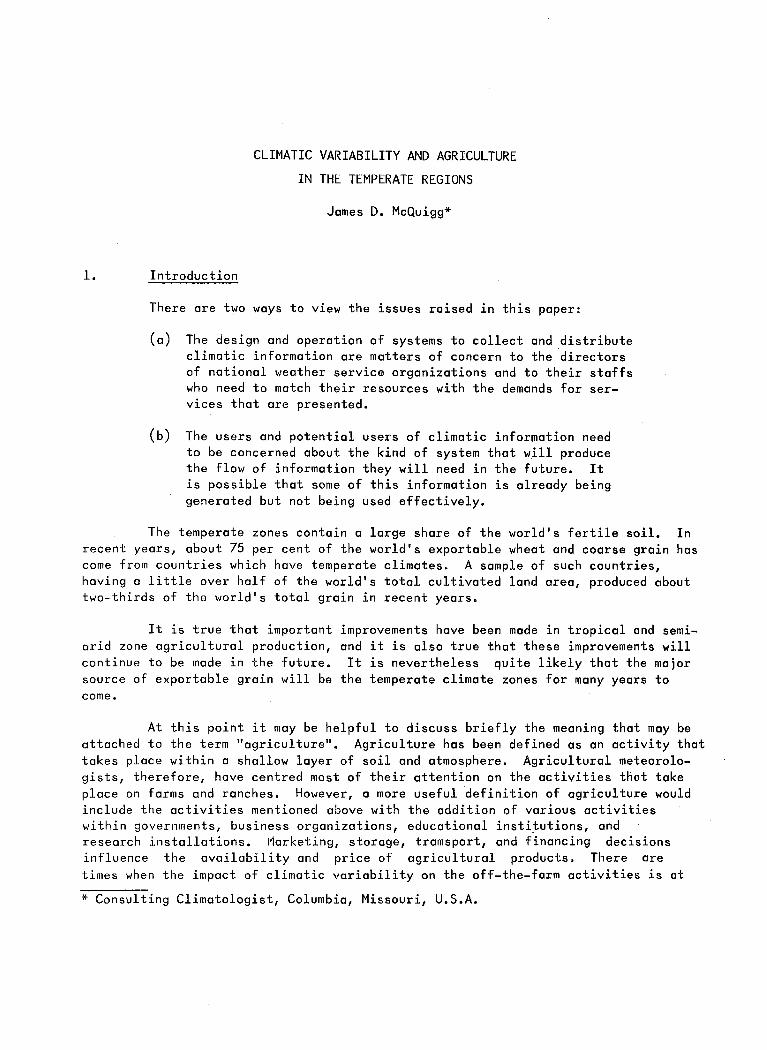
CLIMATIC VARIABILITY AND AGRICULTURE
IN THE TEMPERATE REGIONS
James D. McQuigg*
1. Introduction
There are two ways to view the issues raised in this paper:
(a) The design and operation of systems to collect and distribute climatic information are matters of concern to the directors of national weather service organizations and to their staffs who need to match their resources with the demands for services that are presented.
(b) The users and potential users of climatic information need to be concerned about the kind of system that will produce the flow of information they will need in the future. It is possible that some of this information is already being generated but not being used effectively.
The temperate zones contain a large share of the world's fertile soil. In recent years, about 75 per cent of the world's exportable wheat and coarse grain has come from countries which have temperate climates. A sample of such countries, having a little over half of the world's total cultivated land area, produced about two-thirds of the world's total grain in recent years.
It is true that important arid zone agricultural production, continue to be made in the future. source of exportable grain will be come.
improvements have been made in tropical and semiand it is also true that these improvements will It is nevertheless quite likely that the major
the temperate climate zones for many years to
At this point it may be helpful to discuss briefly the meaning that may be attached to the term "agriculture". Agriculture has been defined as an activity that takes place within a shallow layer of soil and atmosphere. Agricultural meteorologists, therefore, have centred most of their attention on the activities that take place on farms and ranches. However, a more useful definition of agriculture would include the activities mentioned above with the addition of various activities within governments, business organizations, educational institutions, and research installations. t1arketing, storage, tramsport, and financing decisions influence the availability and price of agricultural products. There are times when the impact of climatic variability on the off-the-farm activities is at
* Consulting Climatologist, Columbia, Missouri, U.S.A.
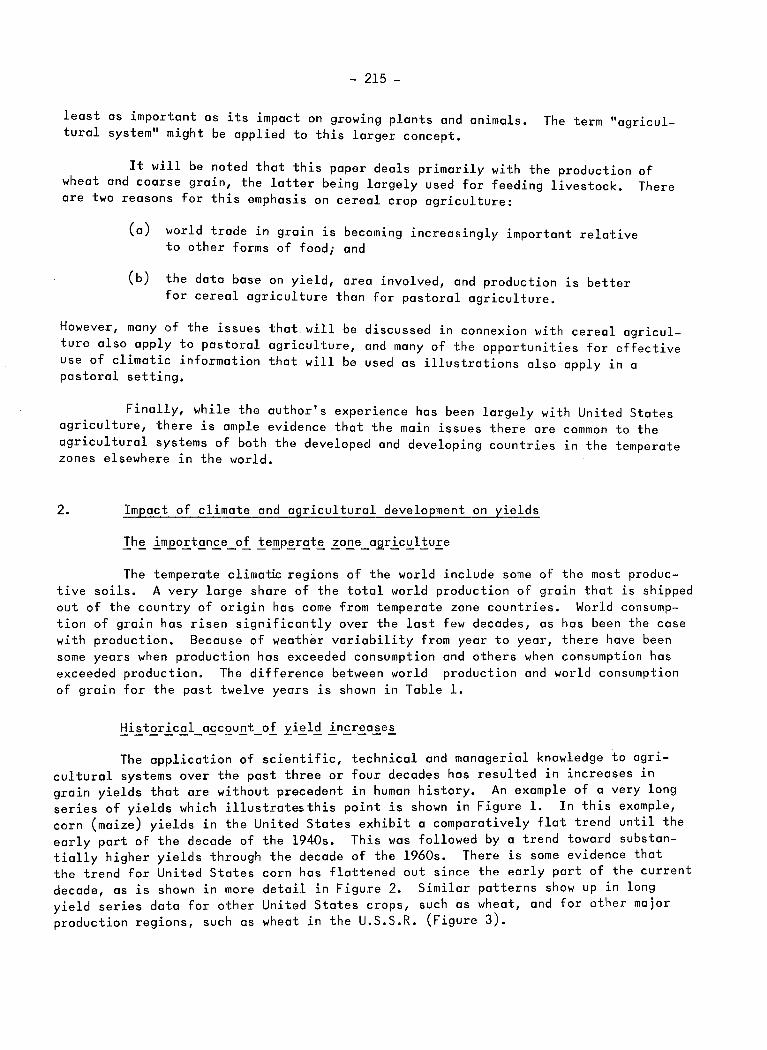
- 215 -
least as important as its impact on growing plants and animals. The term "agricultural system" might be applied to this larger concept.
It will be noted that this paper deals primarily with the production of wheat and coarse grain, the latter being largely used for feeding livestock. There are two reasons for this emphasis on cereal crop agriculture:
(a) world trade in grain is becoming increasingly important relative to other forms of food; and
(b) the data base on yield, area involved, and production is better for cereal agriculture than for pastoral agriculture.
However, many of the issues that will be discussed in connexion with cereal agriculture also apply to pastoral agriculture, and many of the opportunities for effective use of climatic information that will be used as illustrations also apply in a pastoral setting.
Finally, while the author's experience has been largely with United States agriculture, there is ample evidence that the main issues there are common to the agricultural systems of both the developed and developing countries in the temperate zones elsewhere in the world.
2. Impact of climate and agricultural development on yields
The temperate climatk regions of the world include some of the most productive soils. A very large share of the total world production of grain that is shipped out of the country of origin has come from temperate zone countries. World consumption of grain has risen significantly over the last few decades, as has been the case with production. Because of weather variability from year to year, there have been some years when production has exceeded consumption and others when consumption has exceeded production. The difference between world production and world consumption of grain for the past twelve years is shown in Table 1.
The application of scientific, technical and managerial knowledge to agricultural systems over the past three or four decades has resulted in increases in grain yields that are without precedent in human history. An example of a very long series of yields which illustratesthis point is shown in Figure 1. In this example, corn (maize) yields in the United States exhibit a comparatively flat trend until the early part of the decade of the 1940s. This was followed by a trend toward substantially higher yields through the decade of the 1960s. There is some evidence that the trend for United States corn has flattened out since the early part of the current decade, as is shown in more detail in Figure 2. Similar patterns show up in long yield series data for other United States crops, such as wheat, and for ot~er major production regions, such as wheat in the U.S.S.R. (Figure 3).
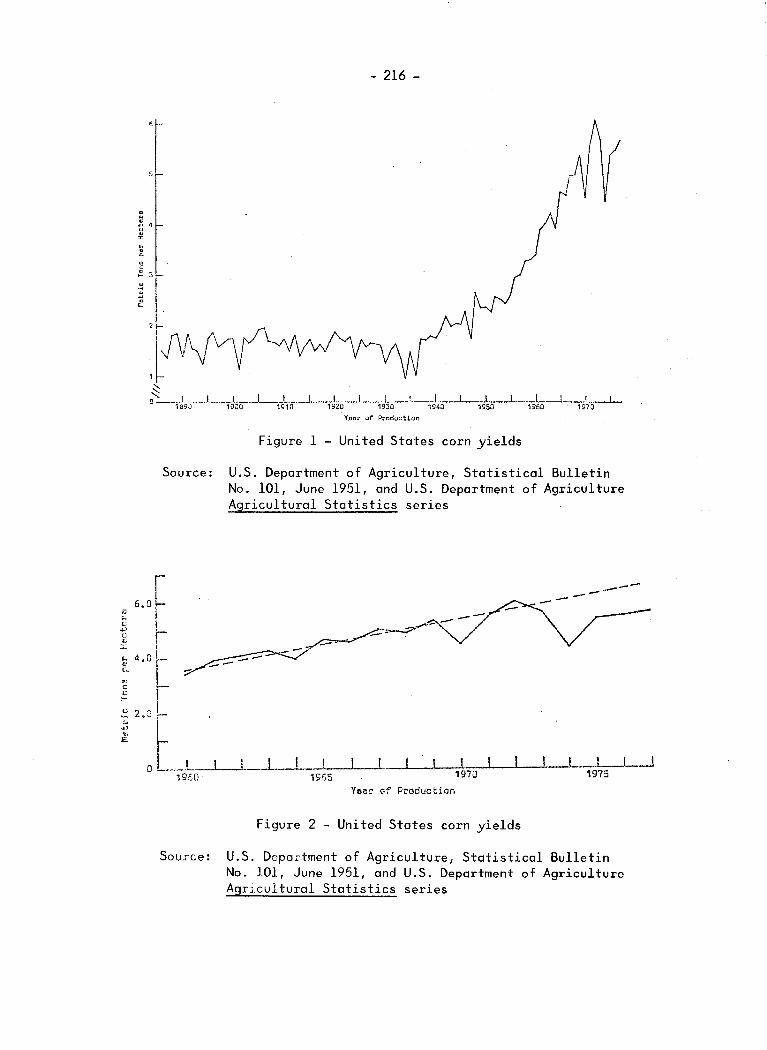
.,
... " ~' 0
1: ,, ~· G.
"' <: 0
u ~
" ., '{j
£
- 216 -
1930
Year or Production
Figure 1- United States corn yields
Source: U.S. Department of Agriculture, Statistical Bulletin No. 101, June 1951, and U.S. Department of Agriculture Agricultural Statistics series
'·'~ I !--I
' ·t 1 j
2.J :-I
01 1950 1965 1970 1975
Year of Production
Figure 2 - United States corn yields
Source: U.S. Department of Agriculture, Statistical Bulletin No. 101, June 1951, and U.S. Department of Agriculture Agricultural Statistics series
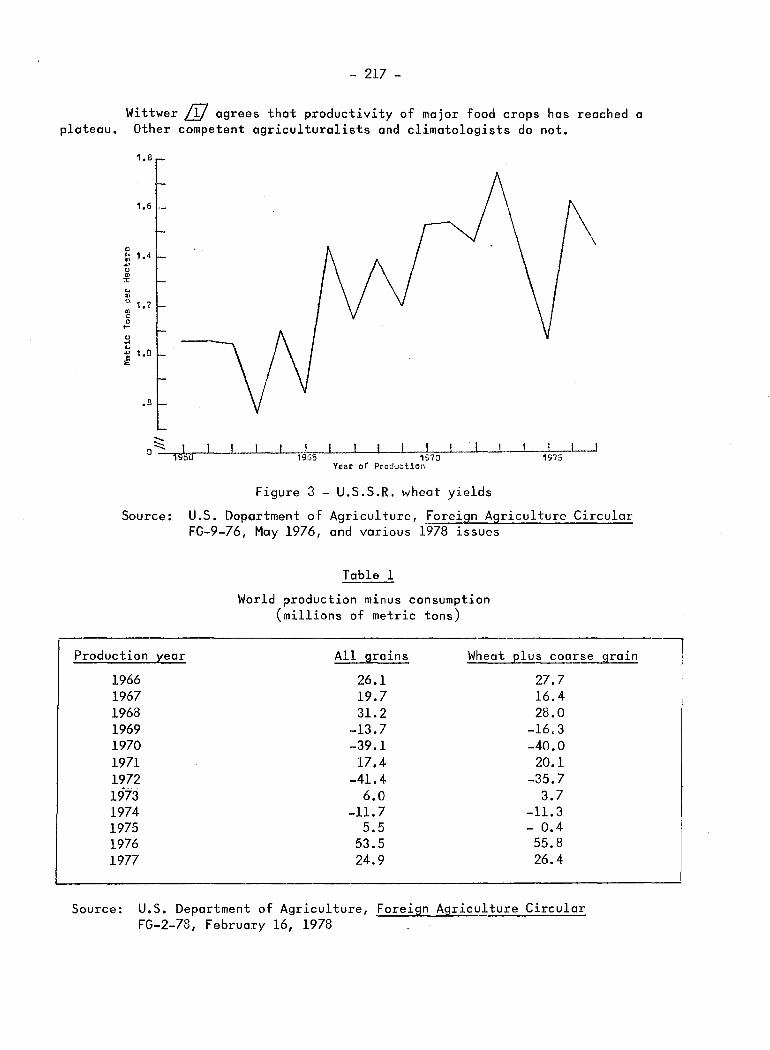
- 217 -
Wittwer LI7 agrees that productivity of major food crops has reached a plateau. Other competent agriculturalists and climatologists do not.
1.8
1.6
"' ~ 1.4 ..., 0 m :I:
" .. 0. 1. 2
"' c 0
1--
0 .... " : 1.0
.a
..._ '::::::: I I I O --nffi~O~--~--L--L-.1~95~5-J--~--L-~~1*-97~0~--~~--~~1~S7~5~~
Year or Production
Figure 3 - U.S.S.R. wheat yields
Source: U.S. Deportment of Agriculture, Foreign Agriculture Circular FG-9-76, May 1976, and various 1978 issues
Production year
1966 1967 1968 1969 1970 1971 1972 1973 1974 1975 1976 1977
Table 1
World ?reduction minus consumption (millions of metric tons)
All grains Wheat
26.1 19.7 31.2
-13.7 -39.1 17.4
-41.4 6.0
-11.7 5.5
53.5 24.9
2lus coarse
27.7 16.4 28.0
-16.3 -40.0
20.1 -35.7
3.7 -11.3 - 0.4 55.8 26.4
Source: U.S. Department of Agriculture, Foreign Agriculture Circular FG-2-78, February 16, 1978
grain

- 218 -
There have been increases in the amount of land devoted to crops in recent years, and there will no doubt be additional land brought into production in years to come. But, as is shown in Table 2, the increases in grain production that have occurred in the last decade or more have come largely as a result of yield increases. This is likely to be true of any future increases in production. It is therefore important that we understand the mechanisms through which yield increases have been obtained, and through which they may be possible in the future.
Year
1960 1961 1962 1963 1964 1965 1966 1967 1968 1969 1970 1971 1972 1973 1974 1975 1976 1977
Source:
Table 2
Wheat yield, harvested area & production indexes
(Canada, United States, U.S.S.R., China, France, Australia, Argentina, West Germany, United Kingdom, Spain)
Average of 1960-64 period = 1.00
Yield Production Area
1.023 .983 .973 .998 .899 .980 .906 1.025 .999 .965 .945 .993
1.106 1.148 1.055 1.006 1.042 1.054 1.256 1.316 1.061 1.123 1.188 1.076 1.247 1.321 1.078 1.206 1.209 1.021 1.298 1.234 .967 1.405 1.342 .967 1.381 1.279 .941 1.489 1.471 1.001 1.356 1.347 1.011 1.264 1.304 1.050 1.539 1.625 1.075 1.423 1.487 1.063
U.S. Department of Agriculture, Foreign Agriculture Circular May 1976, and Forei9n A9riculture Circular FG-2-78, February
FG-9-76, 16, 1978.
Projections of future yield and production of grain that are just linear extensions of the trend that was observed over the past three decades are likely to be seriously in error if one or both of the following statements are true:
- 219 -
(a) Yields of grain have reached a plateau, and major developments must take place in the agricultural system before the trend will again be significantly positive.
(b) There is reasonable evidence that a run of years with favourable crop weather coincided with some of the increases in yields that did occur in the 1950s and 1960s. Haigh ~ has presented such evidence for Iowa and Illinois maize and soybean yields. During these decades there was a trend toward cooler and wetter July-August weather. He ascribes part of the increase in yields during that time to this trend in summer weather.
Year-to~year variability in grain production, which can be largely attributed to year-to-year weather variability, can range from as little as 1 per cent to as much as 10 per cent above or below a trend value. When beginning stocks of grain get down close to the 10 per cent level, as was the case from 1973 to 1976, then the impact of production variability on grain prices is very strong.
3. Variability in crop season weather
Again using the long series of corn yield data from the United States, as shown in Figure 1, there is a period beginning early in the decade of the 1950s and ending with the late 1960s when the fluctuations around the trend line were very small. It was during this period that many agriculturalists believed that they had witnessed the development of a crop management system that was less sensitive to the vagaries of weather. This belief was not confined to that one example but persists even today for other regions and other crops.
If it were true that a "weather-proof'' agricultural system had been developed, then all of the concern about future climate that has become so widespread in recent years would be much ado about nothing. I share the belief of a number of agriculturalists and climatologists that the current grain producing system of the world is still highly sensitive to the occurrence of large climatic anomalies.
Haigh ~ has written, "The yields observed in a given year are a combination of climatic, economic and institutional factors. Crop carry-over levels influence government acreage set-aside programs and therefore the number of acres planted. (This has been the case with the 1978 United States maize and wheat crops.) In years of high planted acreage marginal land will be used, making yields more susceptible to weather. Resource prices relative to expected crop prices influence not only planted acreage but also the resource mix adopted by the farmer, and therefore the technology applied to the crop. This also influences the sensitivity of yields to weather. The 1970s have seen an increase in planted acreage and an increase in relative resource prices, both of which will tend to increase the variability of yield, given weather conditions.".
- 220 -
Haigh argues further that there are other forces at work in the agricultural system which seem to be working against a further decline in the impact of weather variability on grain yields. There appears to be evidence that modern monoculture practices have increased soil erosion and reduced the organic matter in the soil. Insects have become immune to some chemicals, while environmental concern has led to the prohibition of the use of other chemicals with the result that it is more difficult to control infestations. Costs of some agricultural inputs have increased to levels that make certain technological-managerial practices less attractive.
There is the further possibility that the year-to-year variability of crop weather has increased, compared with the variability observed during the 1950-1960 decade. Some interpret such a statement as a claim that there is a true climate change in progress. I prefer to approach this question as a problem in sampling. What sample of previous years should be drawn to provide a statistical estimate of the variability of crop season weather for the coming one to two decades?
The two decades which saw most of the technological/scientific/managerial changes in the agricultural production systems of the temperate zone countries (the 1950s and 1960s) were also a period with relatively favourable crop weather from year to year. If the simultaneous occurrence of rapid technological advances and favourable weather happened to be a coincidence, then it is probably a mistake to assume that this will be the case in the coming decades. This assumption is less attractive when a much longer period of record is used to estimate the year-to-year variability of yields, as was pointed out by McQuigg and Thompson ~.
4. Climatic information systems
However the future state of agricultural technology and management turns out, the agricultural system of the future will continue to be sensitive to year-toyear climate variability~ L±7.
Agriculturalists, business managers and government officials have a problem that can be phrased as follows: "We have to project production and demand and estimate costs and income for our part of the agricultural system on a time scale well beyond the traditional day-to-day weather forecast. You meteorologists tell us that you do not yet have the ability to forecast for a season or a year or several years in advance. What kind of information can you generate that will help us make our projections?"
My answer to questions such as this is: "There are a number of kinds of information that meteorologists and climatologists can provide that can be used to help you make your projections."
The past two winters in the United States Corn Belt provide examples of such information. The winter of 1976-1977 in this region was very dry and very cold. By late January and February, it was already apparent that the recharge of soil moisture that usually takes place during the winter would not be adequate. Based on the knowledge of what had actually happened and on knowledge of the statistical probabilities, it was possible to issue statements that the 1977 crop season in the United
- 221 -
States Corn Belt would begin with inadequate soil moisture reserves, that the 1977 crop season would probably begin with few difficulties with soil trafficability, and that the planting season would probably proceed earlier than usual.
The fall of 1977 and the winter months of early 1978 were comparitively wet and very cold. The subsoil moisture that had been depleted the previous crop season was replenished. Snow remained on the ground and soil temperatures remained comparatively low as winter same to an end and spring got underway. As of late January and February of 1978, it was possible to make some statements that were potentially very useful to managers of various components of the agricultural system. For one thing, it could be stated that subsoil moisture would not be a problem into the main part of the summer growing season. It was also possible to state that the 1978 growing season would probably get off to a late start. The application of anhydrous ammonia fertilizer, which is usually accomplished prior to planting corn, would proceed at a very slow pace.
These last two statements were useful to formers, who were making last minute plans for the beginning of the growing season on their own land. The statements were also useful to managers of seed corn companies and fertilizer companies, to suppliers of fuel for farm machinery, and to officials of the Deportment of Agriculture. Early in the winter there had been some doubt about how many farmers would sign up for the acreage reserve programme. Later in the spring, as the planting season did indeed turn out to be later than usual, more farmers than had been expected signed up land that was still too wet for maize planting, putting it into the government acreage reserve.
In addition to providing climatic information for use in traditional agricultural activities, it is possible to generate information that can be used in new agricultural enterprises. Currently, there is much discussion of the possibility of introducing new crops. Some plant varieties that hod traditionally been regarded as academic curiosities are now viewed as possible sources of energy through the production and use of biomass products. In many sub-humid regions, such as the United States Corn Belt, farmers ore beginning to use large irrigation systems. There is no long-standing body of conventional wisdom concerning the management of these systems, as there has been for generations in some of the arid zone agricultural regions. Design of the water supply systems, choice of equipment type and size, and scheduling the day-to-day operation of irrigation equipment in an agricultural region that is subject to. considerable year-to-year variation in water need is creating a demand for climate and weather information that did not exist a decode ago.
With world grain reserves at lower levels and with the demand for groin increasing, there is a growing concern with the impact of year-to-year climate variability on grain prices and on the availability of exportable grain or on apparent surpluses of grain in some years. At the same time that the need for better, more timely information about climate variability is increasing, we are in the midst of a major change in the capacity and speed of computer data processing and communications systems, together with significant reductions in the cost of these systems.
- 222 -
It may well be that the scientific/technological/managerial breakthrough of the coming decade in agriculture will not take place in the fields of biology or engineering but in improvements in the way management information about climate and the impact of climate can be made available. Along with this improved data handling capability will come significant improvements in the way information is used as a tool in the agricultural system as a whole.
REFERENCES
L!7 WITTWER, S.H. (1978). Editorial. Science, 199(4327), editorial page.
HAIGH, P.A. (1977). Crop Production. Far Hills Avenue,
Separating the Effects of Weather and Management on Report to the Charles F. Kettering Foundation, 5335 Dayton, Ohio 45429.
~ McQUIGG, J.D. et al. (1973). The Influence of Weather and Climate on United States Grain Yields: Bumper Crops or Droughts. Report to the Administrator, National Oceanic and Atmospheric Administration, United States Department of Commerce.
l17 JENSEN, N.F. (1978). Limits to growth in world food production. Science, 201, 317-320.
CLIMATIC VARIABILITY AND AGRICULTURE
IN TROPICAL MOIST REGIONS
Hayao Fukui*
1. Climatic input required for assessing the impact of climatic changes on agriculture
This wide subject, climatic variability and agriculture is covered by three overview papers of this Conference, one concerned with temperate regions, another with semi-arid regions and the third, the present paper, with tropical moist regions. In order to aim at completeness, the discussion in my paper will deal with the entire region that is warmer and/or wetter than the temperate and semi-arid regions. The discussion will therefore not be restricted to the equatorial zone, where rainfall is plentiful throughout the year, but will also include, indeed with main emphasis, the climatic zone with a distinct dry period. The latter is the area of greatest population concentration whereas the equatorial zone is still only sparsely populated.
Among various climatic parameters, rainfall is of greatest concern to farmers in the humid tropics as a whole. It will be through change in rainfall that changes in a climate regime have impact on agriculture in the moist tropics.
The trend and long-term periodicity of rainfall become discernible only after we smooth out the year-to-year fluctuations, and the result is shown in terms of a shift of the normal. This is the usual manner in which information on climatic change is handed over from meteorologists to agriculturists. In order to evaluate this climatic change from an agricultural point of view, however, it is not adequate to present it merely as a shift of normals.
Year-to-year fluctuation is an inherent characteristic of climate. Therefore, adaptation of an agricultural system to a given climate is, more precisely, adaptation to a certain range of climatic parameters. In years or seasons during which climatic parameters remain within a tolerable range, agriculture is not seriously affected, while it will suffer serious setbacks in other years of anomalous climate. Therefore, it is more desirable for evaluating the impact of climatic change on agriculture to express the change not only in terms of the shift of normal but also in terms of the change in the expected range of rainfall.
Before amplifying the above remarks, it should be explained that rainfall amounts often show a distribution that is far from normal or Gaussian, especially in arid zones or when periods shorter than a year or a season are analYsed. However, let us assume that the annual rainfall amount has a Gaussian distribution with mean, x, and variance, ~2 It is also assumed that agriculture is not adversely affected
* Center for Southeast Asian Studies, Kyoto University, Japan.
- 224 -
so long as the rainfall amount of any particular year is within the range of (x ± k) (Figure la). Now, climatic changes involve changes in either x orQ"' 2 or both. Therefore three types of climatic change are conceivable. In the first type, x changes but aL remains as before (Figure lb), Since the agricultural system is well adapted to the climate before the change and it usually takes many years, decades or perhaps centuries to adapt itself to the new climatic regime, the tolerable range, (x ± k), does not change, at least immediately. The concomitant changes in probability that the agricultural system may suffer from anomalously deficient or excessive rainfall are shown by the areas marked with plus or minus signs in Figure 1. In the second type of climatic change,cr2 changes but x does not (Figure le). Ifcr 2 becomes larger than before, the increased risk of both deficient and excessive rainfall will result. Both x and~ change in the third type (Figure ld).
If only the shift of normals is indicated, its impact on agriculture could be assessed only when a certain relationship between the shift of normals and the changes in frequency distribution is recognized. Furthermore, the second type of climatic change in which only 0'2 changes but x remains as before might not be detected if one pays attention only to the trend and periodicity of normals, although this type of climatic change might be of greater significance to agriculture than one with a small shift of x without a change in 0'2.
Certainly it is impossible to make an accurate assessment of the impact of future climatic changes until more reliable projections are made. However, the uncertainty of future climatic changes does not necessarily preclude the possible role of agricultural scientists in assessing their impact. As an agronomist, therefore, I want to emphasize the need, fo~ agricultural purposes, to present climatic changes in terms of the shift of normals as well as changes in frequency distribution. Once this climatic input becomes available, climatic changes can be expressed by reference to various secondary or derived parameters which have been proven to be of significant importance to agriculture.
2. The vulnerability of agriculture in tropical moist regions to variable (:limate
Once information on climatic changes is brought to agriculturists in terms of the shift of normals and changes in frequency distribution, it is the task of agricultural scientists to assess their impact on agriculture. The most powerful tool we can use to make this assessment is our knowledge of year-to-year fluctuations in agricultural production, which are caused mainly by year-to-year fluctuations in climate.
However, it is not an easy matter to use past experience to assess probable future impact, primarily because agricultural systems vary widely according to region and to the time period studied. In other words, the k value in Figure 1 is not a constant. For instance, where crops are grown in the climatically marginal region (small k), even a minor climatic change may affect them seriously, while the effect may not be so serious in a more favourably situated region (large k). To make things
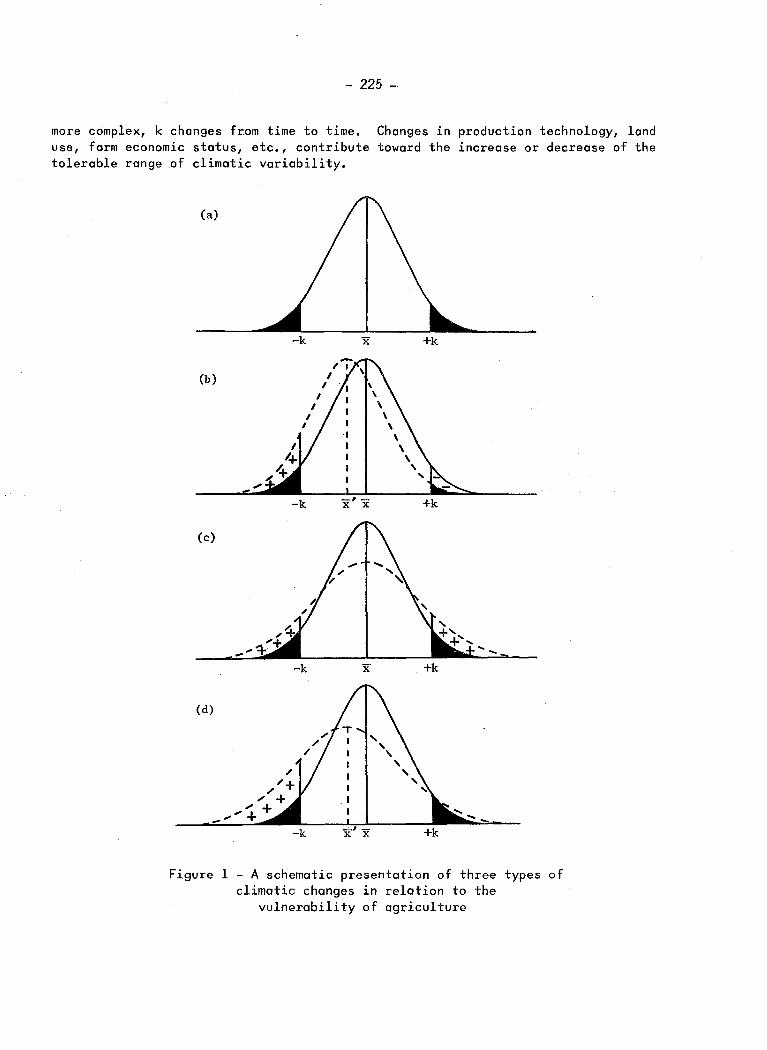
- 225 -·
more complex, k changes from time to time. use, farm economic status, etc., contribute tolerable range of climatic variability.
(a)
(b)
(c)
-k
(d)
Changes in production technology, land toward the increase or decrease of the
+k
Figure 1 - A schematic presentation of three types of climatic changes in relation to the
vulnerability of agriculture

- 226 -
Thus, in order to assess the impact of climatic changes on agriculture, we require on the one hand, climatic input in adequate terms, and on the other hand, information on spatial and time variations in vulnerability of different agricultural systems to climatic variability. In other words, we need the expected values of all of x, ~2, and k in Figure 1. If the expected change in k is relatively small, the magnitude of climatic changes will be the main factor in producing impacts. However, if the change in k is large, its new value will demand greater attention than the climatic cha~ges.
;J " "' Oo-1
1j.,.., 0 ...
...;(I) o~
u
Figure 2 - Means and lower quintiles of monthly precipitation at 20 stations
It is often pointed out that precipitation in the tropics is unreliable and that this is the reason for large annual fluctuations in agricultural production. But it is not a simple matter to compare rainfall variability in different regions because there seems to be no adequate measure of the relative variability of rainfall. Percentage departures from normal L17 and coefficients of variation (CV) are the most common measures far relative variability of rainfall but their usefulness is limited. With this in mind, reliability of rainfall of the moist tropics was compared with that of the moist temperate zone. The result reveals that rainfall is not necessarily more unreliable in the former than the latter.

- 227 -
Differences between the amount of rainfall and the amount of water required are more directly related to agriculture than rainfall amount alone, since drought is a "supply and demand phenomenon" @. The requirement for water varies widely according to kinds of crops, cultivation methods, soil conditions and many other factors. However, the moisture balance assuming the most dema~ding crop could be an index of the agricultural potential of regions in terms of moisture availability. The amount of water required by the most demanding crop could be estimated by the amount of potential evapotranspiration (PET).
In view of this, differences between precipitation (P) and potential evapotranspiration, (P-PET), were calculated on a ~onthly basis for 20 stations, ten each in the tropics and in the temperate zone for each year during the period 1941-1970. PET was estimated by Thornthwaite's formulae. Figure 2 and Figure 3 show the means and lower quintiles of P and P-PET. Note that except for the three stations in the equatorial climate, the apparently great advantage of the humid tropics over the temperate zone when judged only from rainfall a~ounts (Figure 2) almost completely disappears when we look at the balance (Figure 3).
800
600
400
200
0
-200
so or
"' " " 600
" ..-j~ '2 H-<: 0 "' OUl
"'"' :le ~"' o>-, OJ f-<•'-" z
400
-200
'"" "~ o..: :><Ul
::0 :>~ CJ z
"'~ .., "' .j...J ·rl
""' u " ri H
"'~ u
" ..,~
"' "' .-< " p.. 'M .., .-< " "' " "' M
H ><<!I ~'-" ;:;.
;:;-" " " -;;- "' 0
'"" .....
-m •cl 0 ·r<
"' ·" ~ M " 00
E " c ~ "' "' "'
~ •r< .-< ~
"' "' "' " H u "' .... " .0 "' " "' "'" 'M h
•ri<l! """' H~ "'~
"' .,..
0 ,, •r! ~ r.
"' c ·r< rl ~ "' '"" 0 ~ :;::; r. .,-; ~' ; . > "" ~ " w ~ ... ,,
" " .0 " " " 0 '" " " "' ~ > u c "' " 5 " " ~ •r< ~ ,, "' :X: "" "'
-;;-?-,•rl ~
" "' ~ " " " "' 0 "' ~
..a-o .-< ..., '" ~
"' 0 "' '" " Ul 'M~ "
.., 0 ,, """ rl~ EH H u c.o~
"~ o~ 0'-" ~'-" ~ f-< "'
Figur~ 3 _ Means and lower quintiles of monthly differences between precipitation and potential evapotranspiration (P-PET) at 20 stations
- 228 -
It can be concluded that:
(a) rainfall reliability is not necessarily less in the tropical moist regions as a whole than in the temperate zone;
(b) it may not be correct, therefore, to say that large year-to-year fluctuations in agricultural production in the tropical moist regions in spite of much greater mean rainfall amounts is primarily due to greater variability of rainfall;
(c) in terms of water balance, the tropical moist regions have no advantage over higher latitudes, and the major part of the tropics, i.e., regions with a distinct dry season, is hydrologically marginal when the seasonal pattern of rainfall is considered in relation to suitability for annual crops, and
(d) unstable agricultural production, especially of annual crops in some parts of the moist tropics, is considered to be due basically to the region being hydrologically marginal rather than to large but unstable rainfall.
In Table 1, the composition of the crops on arable land in the humid tropics is compared with that in the rest of the world. As we see, cultivation of annual crops other than rice, particularly of upland grain crops, is the norm of agriculture outside of the humid tropics, while other types of agriculture are also of great significance in the humid tropics.
It is well known that due attention should be paid to the rapid leaching of nutrients and the great risk of erosion in humid tropical agriculture. This is especially so when a short-term upland crop is cultivated.
Although various risks and uncertainties appear to discourage the cultivation of annual crops other than rice in the tropical moist regions, Table 1 shows that in 1974, more than half of the total arable land was actually planted in them. Furthermore, changes in crop composition between the years 1954 and 1976 indicate that the relative importance of upland annuals tended to increase (Table 2). Does this imply that the vulnerability to climatic variability of humid tropical agriculture as a whole ~s increasing, that is, that the k value (see Figure 1) is becoming smaller?
A substantial portion of the acreage planted in annual crops other than rice is under the shifting or slash-and-burn cultivation system. This system is one of the examples of adaptation of indigenous agriculture to environment, because the risk of land deterioration can be minimized by this method. However, it is very important to note that this risk is minimized only when population density falls below a certain level.

Table 1
Harvested area of different crops in tropical moist regions
(million hectares)
Annual flowering c)ops Short-term other than ricel Rice vegetative crops2) Total
Africa 37 (67) 3) 4 ( 7)3) 14 (25) 3) 55 (100) 3)
Americas 10 (50) 5 (25) 5 (25) 20 (lOO)
Asia and Oceanic 75 (50) 66 (44) 10 ( 7) 151 (lOO) I'V I'V '0
Tropical moist regions, total 122 (54) 74 (33) 29 (13) 226 (lOO)
Rest of the world 670 (86) 63 (8) 43 (6) 775 (lOO)
1) Cereals other than rice, pulses, oil seeds, and cotton.
2) Roots and tubers, sugarcanes, and fibre crops.
3) Percentage of each of three crop-groups, assuming their sum to be 100 per cent. These crops account for approximately 30 per cent of the total arable land.
(Data Source: FAO Production Yearbook 1974.)

Table 2
Changes in short-term crops' acreage in tropical moist regions during 1954-1976 1
(million hectares)
Annual flowering ~Jops other than rice Rice
Short-term 3) vegetative crops Total
Africa 1954 16.9 (70) 4) 1.7 ( 7)4) 5.4 (23) 4) ?.3.9 (100) 4)
1976 31.2 (77) 2.8 ( 7) 6.6 (16) 40.5 (lOO)
Americas 1954 15.5 (65) 3.0 (13) 5.5 (23) 24.0 (100) 1976 34.8 (68) 8.0 (16) 8.6 (17) 51.4 (lOO)
Asia and Oceanic 1954 6.6 (23) 20.4 (69) 2.4 (8) 29.5 (lOO) 1976 12.5 (28) 27.3 (61) 4.8 (11) 44.6 (100)
Tropical moist 1954 39.0 (50) 25.1 (32) 13.3 (17) 77.4 (100) regions 1976 78.0 (57) 38.1 (28) 20.0 (15) 136.6 (100)
1) The area of the tropical moist regions is basically the same as in Table 1. But the comparable figures for 1954 and 1974 are not available for some countries and territories, particularly in Africa. In Asia, the whole of India was deleted because the state-wise crop statistics for each state for 1954 were not on hand. All of Brazil was included, though more than half of its arable land is not in the moist tropical zone.
2) Cereals other than rice, pulses, oil seeds, and cotton.
3) Roots and tubers, sugarcanes, and fibre crops.
4) Percentage of each of three crop-groups, assuming their sum to be 100 per cent.
(Data source: FAO Production Yearbooks)
I
1\:) w 0

- 231 -
If shifting cultivation is to be practiced without causing irreversible deterioration of land, a long fallow period must be guaranteed, which means that a small group of cultivators must command a large territory and, hence, groups have to live sparsely scattered over a large area. Such a settlement pattern is detrimental to national unity and modernization. Therefore, various schemes for resettling shifting cultivators have been initiated.
The spontaneous movement of population sometimes causes overpopulation in a certain area. Such movements are often motivated by better chances for education, medical care and use of other modern facilities, as well as opportunities to get additional cash income. In some places, better political security may be a strong motivation. Thus, development and modernization seem to make the life of the shifting cultivators in remote areas less and less attractive than before.
The above discussion leads me to the following conclusions:
(a) Only if we accept the condition in which a large proportion of a country's population remains scattered in remote areas and can neither benefit from nor participate in the nation's development and modernization, can shifting cultivation be practised without irreversible deterioration of land assets.
(b) However, this is not a realistic long-term policy. Therefore, the method of cultivation should be altered, since the shifting cultivation method seems to be incompatible with the concentration of population in a limited area, an apparently necessary condition for modernization.
Then, what sort of cultivation system or systems should replace the shifting cultivation method? Could sedentary cultivation of upland grain crops be an adequate form of agriculture? The fact that increasingly shorter fallow periods eventually force farmers to abandon their land suggests great difficulty for sedentary agriculture in the tropical moist regions. However, modern fertilizer and soil conservation technologies might be able to overcome this difficulty. Althuugh such technologies certainly exist, a more important consideration is whether they, together with the necessary inputs, could be used by the majority of peasants.
The second type of cultivation of annual crops other than rice in the humid tropics is the continuing cultivation of these crops on the same plot of land year after year; much of the produce is simply eaten by the cultivators. In Asia, rice is almost always preferred as a staple food. But the scarcity of suitable land for lowland rice cultivation has pushed less fortunate peasants from fertile valley bottoms to dry uplands. Their dietary habits are not necessarily due to their preference for upland crops. Therefore, their consumption of rice increases when either its price becomes lower or their income increases.
Thus, the second type of upland crop cultivation will not persist if enough rice is produced to feed the whole population, or if extra income from other sources enables the cultivators of these crops to purchase rice. But unfortunately it is unlikely that this will happen in the near future. Instead this type of cultivation
- 232 -
will most probably continue to increase, and thus more and more marginal areas will be used by this type of agriculture. And I believe that this will be the form of tropical agriculture most sensitive to climatic variability.
The third type of upla~d crop cultivation in tropical moist regions is the cultivation of feed crops primarily for the export market. The demand for these crops is and will continue to be great because of increasing consumption of animal rather than vegetable food in higher income countries.
The production of maize in Thailand was very much affected by the notorious 1972 weather. In 1972, rain was very scanty in May but normal in June. In July and August it was also less than normal in some places. Cassava is another Thai export crop. The cassava growing area is not so far from the maize area. At three stations in the cassava area, rainfall was as scanty as in the maize area in May, July and August of 1972. But the cassava production seems to heve been hardly affected. As the above example demonstrates very well, annuals are very susceptible to short-term water stress, while root crops are quite resistant to it.
Most of the residual soils of reasonable fertility and resistance to erosion in the humid tropics are formed in areas of neutral to basic rocks. The sedentary cultivation of upland crops in the humid tropics is mainly distributed in these soil areas. The Mekong Committee has proposed a long-term land use plan for the Lower Mekong Basin (Figure 4). As we see, areas suitable for three major kinds of land use are delineated on the map. The first are the areas principally suitable for paddy fields. The second mainly in the mountains, are the areas designated as nature reserves. The third areas are those in which rain-fed upland crop agriculture should be feasible. The third areas are regions whose soils are derived from neutral or basic rocks and riverine levee material. The remaining vast area for which no land use designation has been proposed may be topographically suited to agriculture, but either inferior soil conditions make it impracticable to cultivate upland crops on a sustained basis, or poor hydrological conditions make cultivation of lowland rice difficult.
Three types of cultivation of short-term upland crops in the humid tropics have been discussed above. In all cases, there are strong reasons to continue or even to expand such risky types of cultivation. On the other hand, technology to prevent land from deterioration may be available, but various social, economic and cultural factors make its application difficult. Therefore, these types of cultivation are likely to expand to more marginal regions without proper measures to prevent land deterioration. This implies that vulnerability to climatic variation will not diminish but that it will probably increase in the foreseeable future.
What can be done to prevent land deterioration? It is evident that greater efforts should be directed toward research in and dissemination of technology that would achieve such an end. However, I personally feel that it might be unrealistic to expect the development of prosperous rural communities based on the sustained cultivation of short-term upland crops. I feel rather that this kind of agriculture should be totally replaced by other systems of agriculture which have already been proven to be better adapted to tropical moist regions, i.e., cultivation of lowland rice and other crops on paddy lands and/or perennial crops on upland.

- 233 -
- upland crops
principally rice
111111111111111 parks and reserves
--·1·0·0--2-00iliiiiiiliiiiiiiiii-(km)
FiQure 4 - Tentative land use model for the Lower Mekong Basin (simplified) (Source: Mekong Committee, 1976)
- 234 -
The cultivation of root crops has been well adapted to the moist tropics, and, hence, these crops are less vulnerable to climatic variability. However, root crops have other difficulties. Among other things, they are bulky and perishable unless processed. This may be no drawback in a subsistence economy, but it will become a great disadvantage if these crops are to be staple food for an urbanized society. Proper methods for processing, storage, marketing and cooking of root crops for direct consumption as food by city dwellers have yet to be discovered.
Trees are also considered to be less vulnerable to climatic variation. However, that does not mean that trees not not at all affected.
In the case of oil palm in Malaysia, the period between the initiation of primordia a~d the harvest of bunches is from 33 to 36 months, and during this period there are several growth stages which are highly sensitive to rainfall deficiency. A severe drought affected the oil palm area for much of the years 1976-1977. At the end of 1977 the effect of the drought on production was already estimated at a loss of some 50 000 tons. (In 1976, figures for the total production of palm oil and palm kernel were 1 250 000 and 275 000 tons, respectively).
Serious frost damage to the Brazilian coffee crop followed by the price jump in 1975 is still fresh in many memories. It is known that a period of six hours below -2°C is sufficient to kill the leaves and that further exposure to cold could cause serious damage in the stems of coffee plants. Although frost may cause some damage to coffee on an average of once every three years, the impact of the frost that occurred on 17 July 1975 was very serious. But the damage was serious only in two out of the four major coffee-growing states of Brazil, those in the cooler southern area.
During the colonial period, a few big political powers commanded vast undeveloped territories in the moist tropics. It was possible to introduce largescale plantation agriculture anywhere within their territories where environmental conditions were suitable. Thus, the most suitable areas were developed while the less suitable ones were left unused. Under such political and economic conditions, one major role of ogro-environmentol research was to find the most suitable area for a particular plantation crop. Research in agro-climatology was no exception,
After many of the tropical countries gained their independence and their populations increased explosively, the emphasis in such research shifted from a search for the best agricultural conditions to an attempt to make the best possible use of available resources. In most newly independent countries, development of only the most suitable areas is an unacceptable luxury. This means that many crops, including tree crops, are now being planted in less than favourable environments in terms of soil, topography and climate. Though trees are in general less vulnerable to climatic variability than other short-term crops, particularly the annual grain crops, it is anticipated that t~e propagation of tree crops to marginal areas will adversely affect their production stability os well.
- 235 -
3. Vulnerability of lowland rice cultivation to climatic variability
Lowland rice cultivation differs in various ways from rain-fed upland crop agriculture as well as from irrigated agriculture in the arid zone. The difference is particularly noticeable in the mode of the supply of water to plant roots. Therefore, the vulnerability of rice agriculture to rainfall variation is expected to differ substantially from that of other types of cultivation.
It has been repeatedly mentioned that the eventual degradation of land makes upland crop cultivation highly risky in the moist tropics, Rice cultivation is almost completely free from such land deterioration. First, the depletion of plant nutrients in the soil is compensated by the extra supply of nutrients through peculiarities of paddy cultivation. Second, the levelled paddy plots surrounded with bunds are nearly immune to water erosion.
factors: The stability of rice production can be explained by the following two
(a) Water ponded by bunding would otherwise be lost as run-off. Therefore, the bunds increase the amount of water available to the plant over that retained by the water-holding capacity of soil;
(b) A substantial portion of rice land is irrigated.
Thus, rice agriculture, in general, can be characterized by high and stable productivity. However, this may not always be the case when one looks into the actual situation of rice production. Certainly rice production in such cou~tries as the U.S.S.R. and U.S.A., where all rice is irrigated, is much more stable than the production of any other crop. But it is not the case in tropical Asian countries where irrigated rice is only a small portion of all the rice produced.
In Japan, nearly all rice lands are irrigated and for this reason droug~t is no longer a problem affecting lowland rice. Under such circumstances, therefore, various crop-weather analyses of rice reveal the relationship between rice yield and climatic parameters other tha~ rainfall.
It is natural that variations in rainfall do not directly affect variations in yield when water is controlled. This can be seen not only in rice cultivation but also in any other type of irrigated agriculture. What is important to rice agriculture's vulnerability to rainfall variability is the extent a:'d the rate at which irrigation facilities are implemented.
Irrigation of rice in the traditional Asian rice zone and that in the arid zone may be basically quite different. Some peculiar features of the irrigation for rice are discussed below.
Figure 5 shows the percentage of irrigated and rice acreage of 76 countries. Group I in the figure consists of 46 countries where less than ten per cent of the arable land is irrigated and less than ten per cent is planted in rice. These coun-
- 236 -
tries are found in non-Mediterranean Europe, the Americas and Africa south of the Sahara, where rain-fed upland crop agriculture is dominant.
Group II comprises 14 non rice-growing countries, in which irrigated lands exceed ten per cent of the total arable land -area. These countries are in the Mediterranean region, North Africa, the Middle East and parts of South America, where irrigated agriculture is practised in a substantial portion of the countries' arable land.
The countries with more than ten per cent rice area are shown in the wide space at the right hand side of the figure. Four countries among them, i.e., Egypt, China, India and Pakistan, differ from the other rice-growing countries in that irrigated agriculture as seen in the arid zone of the Group II countries is dominant in large areas. Therefore, the relatively high percentage of irrigated area in these four countries does not necessarily indicate a high percentage of irrigated rice area. In the rice-growing countries other than these four, most of the irrigated area is devoted to rice. In the ten countries forming this group, the percentage of irrigated rice land ranges from eight in Khmer to 56 per cent in Japan. This widevariation is not related to rainfall whereas rainfall is the decisive element determining the percentage of irrigated area in the group I and II countries.
Assuming that there is no irrigation, the water balance of rice fields can be estimated by some conventional method such as Thornthwaite's. An example of such a calculation applied to tropical Asia reveals that "the greater part of the rice lands in Pakistan, India, Thailand and Cambodia are either prohibitive or marginal for rice cultivation unless the land is artificially irrigated or naturally inundated due to physiographic conditions". fiJ It is these countries (except for Pakistan) rather than those in more moist insular Southeast Asia that form the core region of the Asian rice zone.
To understand these seemingly contradictory features and other peculiarities of rice cultivation, a comparison with other types of agriculture will be useful. In terms of water use, three types of agriculture can be distinguished. The first type is rain-fed upland crop agriculture, the most dominant form of agriculture on the earth. In this type, water supplied to crops is derived solely from rain water falling precisely on each patch of the fields, in other words, direct rainfall. Water supply by irrigation or use of groundwater is unusual. Therefore, apart from rainfall itself, the dominant factors governing the supply of water to plant roots are evaporation, water-holding capacity and permeability of the soil,etc.
The second type is irrigated agriculture in the arid zone, in which direct rainfall has no significance. Most, if not all, of the water supplied to crops is carried from distant places where precipitation is abundant. Therefore, the dominant factorsdeterminin~water supply are primarily of an engineering nature and involve some agronomic qualities of soil.
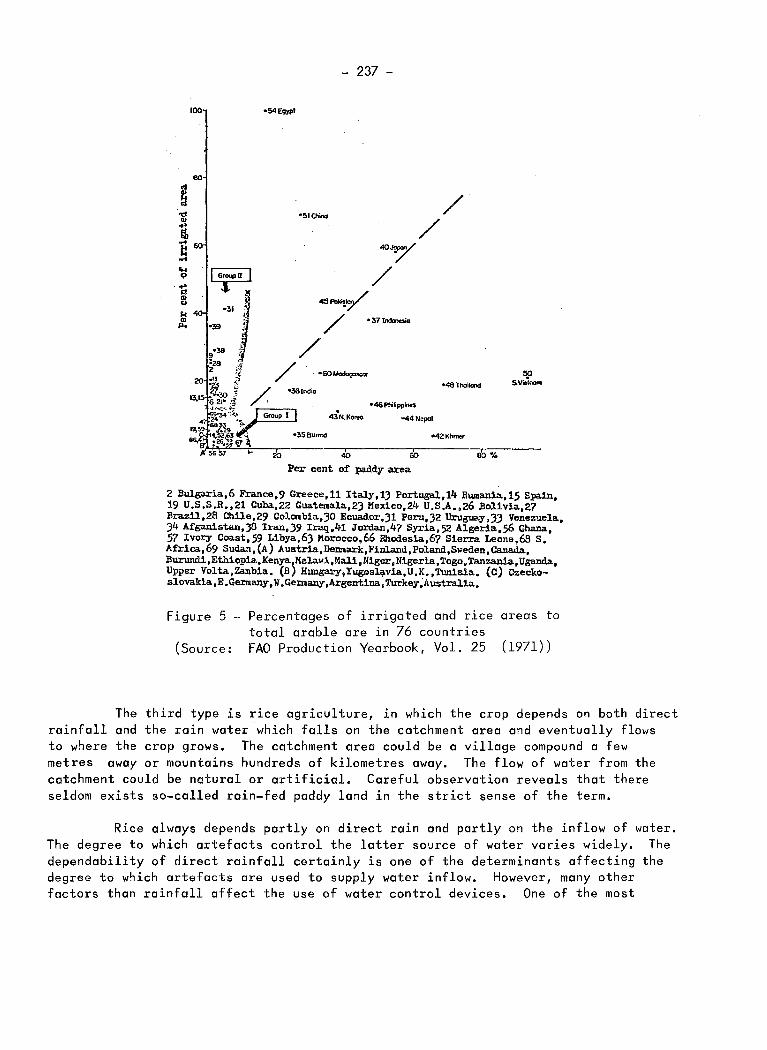
lOO
eo ... 5 't:l
"' i .... ~ .... .... 0
~ 0:: .. ... k ..
Po
- 237 -
•51 China
• 371ndonesia
/ /
•48 Thailond
•46 Philippkles
-44Nepol
20 40 60
Per cent of paddy area 60 .,.
2 Bulga.ria,6 France,9 Greece,11 ItaJ.y,1J Portugal,14 Rwuan1a,15 Spain, 19 U.S.S.R.,21 Cuba,22 Guatemala,2J Mexico,24 U.S,A.,26 Bolivia,2? Brazil,28 Chile,29 Colanbia,)O Ecuador,Jl Peru,J2 Uruguay,)) Venezuela, )4 Afga..nista.n,)B Iran,J9 Iraq,41 Jordan,4? Syria, 52 Algeria,56 Ghana, 5? Ivory Coast,59 Libya,6) Morocco,66 Rhodes1a,6? Sierra Leone,68 s. Africa, 69 Sudan, {A) Austria,De11:11ark,Finland,Poland,Sweden,ca.na.da, Burundi,Ethiopia,KenyatMelawi,Mali,N1ger,N1geria,Togo,Tanzania,Uganda, Upper Volta,Zambia. (BJ Hungary*Yuggsl~via,U.K.,Tun1sia. (C) Czeckoslovak1a,E.Germany,W.Germany,Argentina,Turkey~Australia.
Figure 5 - Percentages of irrigated and rice areas to total arable are in 76 countries
(Source: FAO Production Yearbook, Vol. 25 (1971))
The third type is rice agriculture, in which the crop depends on both direct rainfall and the rain water which falls on the catchment area and eventually flows to where the crop grows. The catchment area could be a village compound a few metres away or mountains hundreds of kilometres away. The flow of water from the catchment could be natural or artificial. Careful observation reveals that there seldom exists so-called rain-fed paddy land in the strict sense of the term.
Rice always depends partly on direct rain and partly on the inflow of water. The degree to which artefacts control the latter source of water varies widely. The dependability of direct rainfall certainly is one of the determinants affecting the degree to which artefacts are used to supply water inflow. However, many other factors than rainfall affect the use of water control devices. One of the most
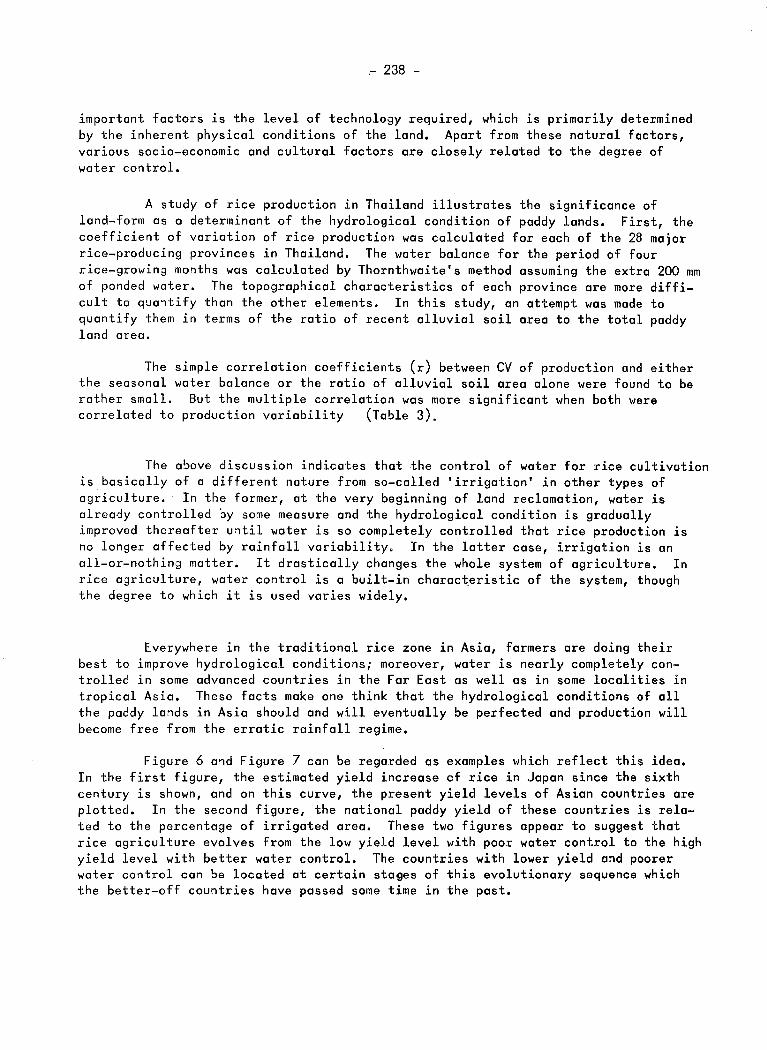
~ 238 -
important factors is the level of technology required, which is primarily determined by the inherent physical conditions of the land. Apart from these natural factors, various socio-economic and cultural factors are closely related to the degree of water control.
A study of rice production in Thailand illustrates the significance of land-form as a determinant of the hydrological condition of paddy lands. First, the coefficient of variation of rice production was calculated for each of the 28 major rice-producing provinces in Thailand. The water balance for the period of four rice-growing months was calculated by Thornthwaite's method assuming the extra 200 mm of ponded water. The topographical characteristics of each province are more difficult to qua1tify than the other elements. In this study, an attempt was made to quantify them in terms of the ratio of recent alluvial soil area to the total paddy land area.
The simple correlation coefficients (r) between CV of production and either the seasonal water balance or the ratio of alluvial soil area alone were found to be rather small. But the multiple correlation was more significant when both were correlated to production variability (Table 3).
The above discussion indicates that the control of water for rice cultivation ~s basically of a different nature from so-called 'irrigation' in other types of agriculture. In the former, at the very beginning of land reclamation, water is already controlled by some measure and the hydrological condition is gradually improved thereafter u1til water is so completely controlled that rice production is no longer affected by rainfall variability. In the latter case, irrigation is an all-or-nothing matter. It drastically changes the whole system of agriculture. In rice agriculture, water control is a built-in characteristic of the system, though the degree to which it is used varies widely.
Everywhere in the traditional rice zone in Asia, farmers are doing their best to improve hydrological conditions; moreover, water is nearly completely controlled in some advanced countries in the Far East as well as in some localities in tropical Asia. These facts make one think that the hydrological conditions of all the paddy lands in Asia should and will eventually be perfected and production will become free from the erratic rainfall regime.
Figure 6 and Figure 7 can be regarded as examples which reflect this idea. In the first figure, the estimated yield increase of rice in Japan since the sixth century is shown, and on this curve, the present yield levels of Asian countries are plotted. In the second figure, the national paddy yield of these countries is related to the percentage of irrigated area. These two figures appear to suggest that rice agriculture evolves from the low yield level with poor water control to the high yield level with better water control. The countries with lower yield and poorer water control can be located at certain sta9es of this evolutionary sequence which the better-off countries have passed some time in the past.

- 239 -
Table 3
Correlation of cross-province variation of
rice production's year-to-year fluctuation
with climatic and topographic parameters1)
Mean rainfall total in four rice-growing months
CV of the above
Mean of sum of monthly
CV(4R)
water balanc~ in the same 4W four months3)
Median of the above
Percentage of recent alluvial soil area to total paddy land area
Rate of increase of paddy area
4W(M) and o<
4W(M),o<and H
4W(M)
H
Simple correlation coefficient (r) between CV of pr~duction in each of 28 provinces, CV(PR0)2J, and seasonal water balance
-0.284
0.297
-0.434
-0.429
-0.465
0.425
Multiple correlation coefficient (R) between CV(PRO) and seasonal water balance
0.583
0.645
1) The period for which calculation was made varies from one province to another depending on availability of consistent data. It ranges from 15 to 30 years.
2) CV(PRO) is based on the de-trended production data.
3) Water balance was calculated according to Thornthwaite's method assuming the extra 200 mm of ponded water.
(After; Fukui, Uchida and Kobayashi, unpublished.)

........ aJ
""' Cil ,1-J CJ QJ
..c::
""' QJ p..
- 240 -
Sta~r-1-T--------------------2------------------~-3-+~4~ :I pan
5
S uth Korea N rth Korea
~ 4 0
,1-J
1
~o~o--~--so•o--~-1-o~o-o--~-12~o~o--~-1-4~o-o~~-16~o-o--~-1-s~oo--~~2~ooo
Figure 6 Correlation of intensification of farming and yield of r~ce (based on historical progress of rice production in Japan)
(from: Report of the Trilateral Food Task Force /4/)
In Table 4, the present, projected, and potential irrigation areas of the tropical Asian countries are compared with the 'adequately irrigated rice areas' and 'rain-fed rice areas' which are designated for doubling rice production by 1990. The table indicates that the eventual completion of water control for most, if not all, of rice lands in Asia is not too unrealistic.
In rain-fed upland crop agriculture, it is inevitable that production should be substantially affected by the year-to-year variation of rainfall. Even where production technology is most advanced, the coefficient of variation of grain production ranges from eight to 20 per cent. Progress in technology, mainly in genetic improvement, soil conservation, and, perhaps, weather forecasting, might further stabilize production, but to a limited extent.

Paddy yield ('t/ha)
6
5
4
3
- 241 -
Country name I"'~ !>Cl 1966 ADB Regional Survey
~~~ 1971 FAO Regional Office
!()! 1974 ADB. Statistic Unit
'"'
Group No.II
Group No.I · (98%, 6 t/ha)
(70%, · 4 t/ha) ~
10 20 30 40 so 60 70
.. , 11()1
I I / I 'x 1 Pakistan ,_,. .
so 90 Irrigation rate (~)
Figure 7 - Relation between irrigation rate anc paddy yield (from: Okita and Takase, 1976 L2/)
I I lXI ,_,
lOO
On the contrary, rice production could be stabilized to a much greater extent by improvement of the hydrological condition. However, whether or not this potential stability can actually be realized depends on:
(a) the rate of implementation of water control facilities, and
(b) the rate of expansion of the rice area to increasingly marginal lands.
The rate of expansion of rice land as well as that of lands under other agricultural systems will depend very much on the increase of productivity per unit area on the land now in use.
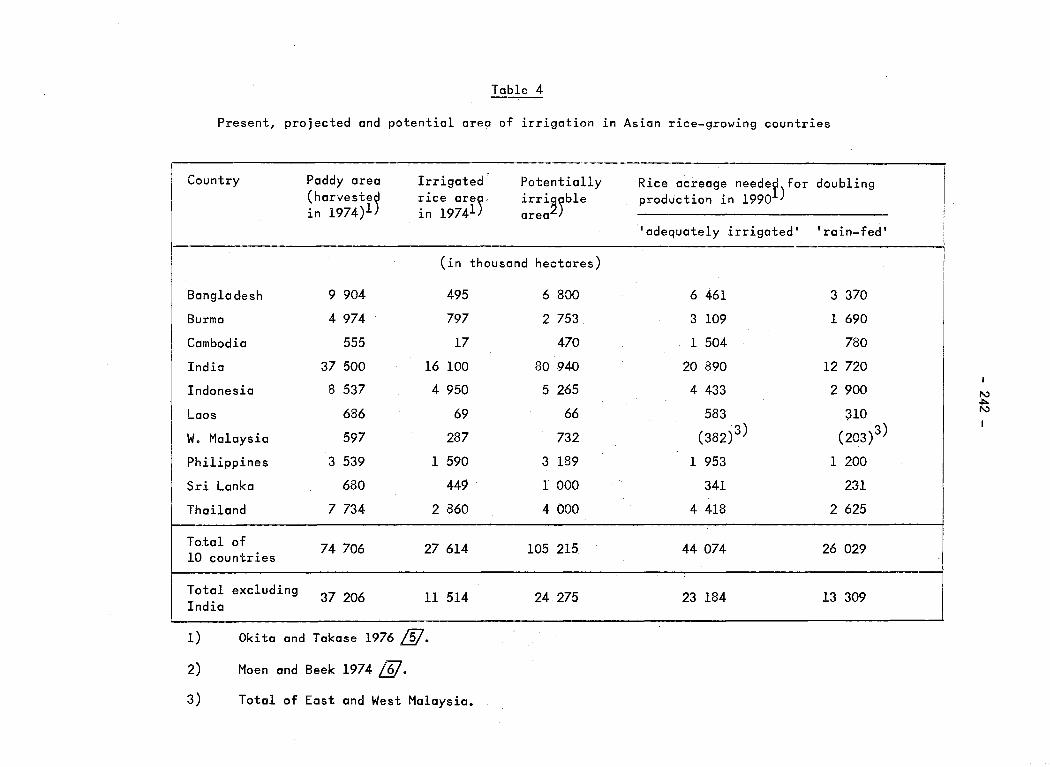
Table 4
Present, projected and potential area of irrigation in Asian rice-growing countries
Country Paddy area Irrigated Potentially Rice acreage needed)for doubling (harveste~ rice are) irri2)ble production in 19901 in 1974)1 in 19741 area
'adequately irrigated' 'rain-fed'
(in thousand hectares)
Bangladesh 9 904 495 6 800 6 461 3 370
Burma 4 974 797 2 753 3 109 1 690
Cambodia 555 17 470 1 504 780
India 37 500 16 lOO 80 940 20 890 12 720
Indonesia 8 537 4 950 5 265 4 433 2 900 I "' .j:>..
Laos 686 69 66 583 :;no "' W. Malaysia 597 287 732 (382) 3) (203) 3)
Philippines 3 539 1 590 3 189 1 953 1 200
Sri Lanka 680 449 1 000 341 231
Thailand 7 734 2 860 4 000 4 418 2 625
Total of 74 706 27 614 105 215 44 074 26 029 10 countries
Total excluding 37 206 11 514 24 275 23 184 13 309 India
1) Okita and Takase 1976 1§7. 2) Moen and Beek 1974 L§l. 3) Total of East and West Malaysia.
- 243 -
According to Grigg LZ7, "Between 1870 and 1930 most of the new arable land (in the world) came in the mid-latitude temperate grasslands •••• However, in the 1930s the expansion of this frontier came to a halt," first because "the attraction for migrants was no longer the land but the cities" and, secondly because of ''a major agricultural revolution in western countries •••• Since then (the 1940s) the increase in population •••• has led to a remarkable increase in the ora~le area" in China, India, Africa and Latin America. This was because "the need for extra food was naturally met by reclaiming new land .••• To what extent the rapid expansion of the arable area .••• will continue, it is difficult to say. Continued population increase and the expansion of a landless rural proletariat favour further increases in arable land. On the other hand, the first sign of intensification in Asian agriculture - the Green Revolution -and the steady drift to the towns suggest that the new frontier of the underdeveloped world may well close before the end of the century, and before the supply of cultivable land runs out."
As long os agricultural land is expanding at a great rote, the vulnerability of agriculture to rainfall variation will remain great or tend to increase no matter what crops are cultivated. Only when people begin to divert their efforts toward intensification of cultivation, will production be stabilized. But the sustained production of upland crops appears to be much more difficult in tropical moist regions than in the temperate zone. Perhaps intensive rice cropping will be the only alternative in larger ports of the moist tropics, including those countries where rice cultivation is not common at present.
4. Conclusions
(a) In order to assess the impact of climatic changes on agriculture, data concerning not only the changes in means of climatic parameters but also the changes in their distribution pattern are required.
(b) The impact of climatic changes on agriculture depends on both the amplitude of such changes and agriculture's vulnerability to climatic variability. This vulnerability varies according to the regio~ where cultivation is practised, and also changes over time; such variations might sometimes be more relevant than climatic changes themselves. Agricultural scientists shouldplaya major role in assessing the impact of climatic changes on agriculture by analysing the spatial and time variations of the vulnerability of different agricultural systems to climatic variations.
(c) Agricultural production in tropical moist regions is affected by the year-to-year variations of rainfall, though the zone receives a great amount of rainfall. The reason for this is not necessarily the great variability of annual rainfall there. Rather, it is primarily due to the great amount of evapotranspiration in the economically most active parts of the moist tropics.
- 244 -
(d) Cultivation of annual grain crops is highly risky in the moist tropics because of the great risk of eventual land deterioration and susceptibility to rainfall variability. Cultivation of these crops under the shifting cultivation system does not necessarily cause land deterioration as long as the population density is below a certain level. However, a sparsely scattered population in remote areas is detrimental to the nation's development and modernization. Therefore, the shifting cultivators tend to concentrate in certain areas either spontaneously or under some resettlement scheme and this makes their agricultural production riskier. Sedentary cultivation of upland field crops by peasants is always expanding to marginal regions because of the scarcity of land suitable for cultivation of crops which are better adapted to the moist tropical environment. The recent development of feed crop cultivation for the export market is similarly risky. The technology needed to grow these crops on a sustained basis may be known, but it does not seem that the majority of peasants will utilize it in the near future. Nonetheless, it is necessary to continue to grow these crops in regions under any of the three systems of cultivation mentioned above. Therefore, the vulnerability of agriculture in these regions to rainfall variations will remain great or even increase for many years to come.
(e) Root crops are well adapted to the moist tropics and hence their cultivation is less vulnerable to rainfall variations than are many other crops. However, root crops are not suitable as staple food for urbanized society unless they are processed properly. The technology for processing these crops for urbanized society will affect the future trend of root crop agriculture.
(f) Tropical tree crops are, in general, less vulnerable to rainfall variability than are short-term crops. But in recent years, they have tended to be grown in increasingly marginal lands. Therefore, one should not be too optimistic about the vulnerability of the cultivation of these crops to rainfall variations.
(g) Lowland rice cultivation is the agricultural system best adapted to moist tropical conditions. Its vulnerability to rainfall variations could be decreased further by better water control. Water control for rice is basically different from the conventional concept of irrigation in the arid zone. In rice agriculture, not only the vertical movement of water, (that is, direct rainfall, evapotranspiration and percolation) but also its horizontal movement play an important role. The latter is controlled by man to a certain degree of efficiency. The degree to which artefacts control the horizontal movement of water varies widely according to physical conditions and human elements. Since human elements are significant determinants of the hydrological condition of rice land, such a condition is highly time-dependent. Rice agriculture evolves step by step from a low level of production with poor water

- 245 -
control to a higher level with better water control. It is not too .unrealistic to expect that all rice lands in Asia will eventually be equipped with adequate water control facilities and that rice production will be unaffected by rainfall variability. However, rice cultivation is also expanding to increasingly marginal areas. The vulnerability of rice agriculture as a whole to rainfall variations will be affected oy the rate of expansion of the area cultivated on the one hand and, on the other hand, the rate of improvement of water control.
(h) In the whole moist tropical zone, population has been increasing at a high rate since the 1930s. The ever increasing need for food could Je met by either the expansion of the area of cultivated land or an increase in yield per unit area by intensifying cultivation. So far, the former occurs more often than the latter. So long as this trend continues, the vulneraSility of agriculture to rainfall variability will increase in the moist tropics. Therefore, the impact o~ future agriculture of a greater frequency of anomalously dry years due to climatic changes would oe greater than the impact in the past and present.
REFERENCES
BIEL, E. (1929). auf der Erde.
Die Veranderlichkeit der Jahressumme des Niederschlages Geogr. Jahresbericht aus Oesterreich, 14/15. pp. 151-180.
GIBBS, W.J. (1975). Drought - its definition, delineation In: Drought. WMO Special Environmental Report No. 5. (WMO-No. 403).
and effects. pp. 1-39.
KYUMA, K. (1973). Soil water regime of rice lands in south and southeast Asia. The Southeast Asian Studies, 11, No. 1. pp. 3-13. (The Center for Southeast Asian Studies, Kyoto University).
TRILATERAL FOOD TASK FORCE. (1978). Expanding food production program in developing countries: rice production in south and southeast Asia. Discussion draft. (mimeo.).
OKITA, S. and TAKASE, K. (1976). Doubling rice production program in Asia. OverseasEconomic Cooperation Fund (of Japan). (mimeo.).
MOEN, H.J. and BEEK, K.J. (1974). Literature study on the potential irrigated acreage in the world. International Institute for Land Reclamation and improvement (of The Netherlands). (mimeo.).
GRIGG, D.B. (1974). land 1870-1970.
The growth and distribution of the world's arable Geography, 59, Part 2. pp. 104-110.
CLIMATIC VARIABILITY AND AGRICULTURE
IN THE SEMI-ARID TROPICS
Franceso Mattei*
1. Introduction
The semi-arid lands may be defined in agroclimatic terms as the territories where, although some precipitation deficit usually occurs, simple cropping systems are however possible. The equilibrium of the agrosystems in the semi-arid lands is generally fragile and their fragility increases with increasing conditions of aridity. Furthermore, basic diversity may be found by examining semi-arid lands in temperate or tropical climates. In the latter, the shortness of the rainy season, the limitations due to high temperature and evapotranspiration rate, and the persistent warm and humid conditions during the possible growing season represent the main constraints for traditional rainfed agriculture. These are also the factors which keep crop yields at lower levels than in temperate zones. Moreover, in tropical zones the climatic variability has a more consistent impact on agriculture and land use than elsewhere.
2. Background
For a satisfactory understanding of the relations existing between climate and agrosystems, the conventional climatic classifications are inadequate, A useful tool in explaining land use and crop management in tropical areas seems to be the agroclimatic classification based on the analysis of the parameters of water balance, or potential evapotranspiration (PET) and rainfall. (See also Section 2 of the paper prepar~d by H. Fukui for this Conference).
On this basis the tropical semi-arid zone• have been identified according to the length of possible growing season and the number of days in which rainfall exceeds PET. The general characteristics and the boundaries of the semi-arid zones, as well as the features of the sub-zones, are shown in Table 1.
* Ufficio Centrale di Ecologia Agraria (UCEA), Rome, Italy.
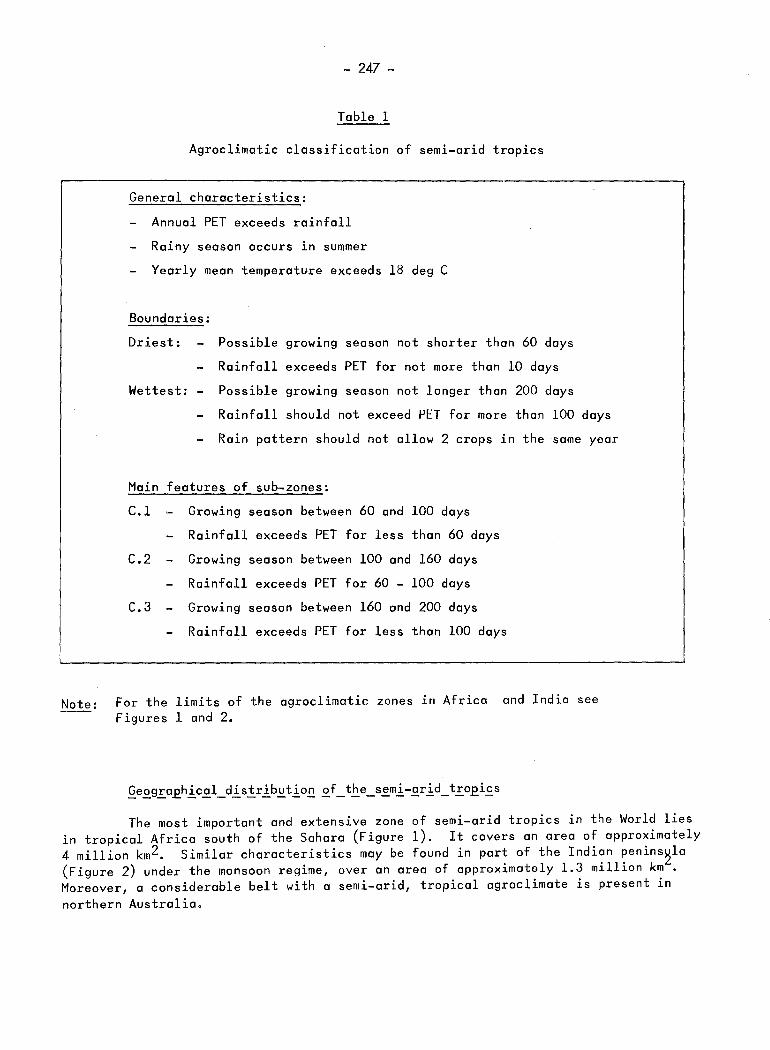
- 247 -
Table 1
Agroclimatic classification of semi-arid tropics
General characteristics:
Annual PET exceeds rainfall
Rainy season occurs in summer
Yearly mean temperature exceeds 18 deg C
Boundaries:
Driest:
Wettest:
Possible growing season not shorter than 60 days
Rainfall exceeds PET for not more than 10 days
Possible growing season not longer than 200 days
Rainfall should not exceed PET for more than lOO days
Rain pattern should not allow 2 crops in the same year
Main features of sub-zones:
C.l Growing season between 60 and 100 days
Rainfall exceeds PET for less than 60 days
C.2 Growing season between 100 and 160 days
Rainfall exceeds PET for 60 - lOO days
C.3 Growing season between 160 and 200 days
Rainfall exceeds PET for less than lOO days
Note: For the limits of the agroclimatic zones in Africa and India see Figures 1 and 2.
The most important and extensive zone of semi-arid tropics in the World lies in tropical Africa south of the Sahara (Figure 1). It covers an area of approximately 4 million km2. Similar characteristics may be found in part of the Indian penins~la (Figure 2) under the monsoon regime, over an area of approximately 1.3 million km . Moreover, a considerable belt with a semi-arid, tropical agroclimate is present in northern Australia.

Figure 1:
- 248 -
o 400 eoo Scale: l...i b1 b-1 bi I ~m
200 600
AGROCLIMATIC ZONES OF TROPICAL AFRICA SOUTH OF THE SAHARA
A - Desert B - Arid
C I - Semi arid I C2- Semi arid D:
C3 - Semiarid m 0 - Humid
The main crops of traditional rainfed agriculture in the semi-arid tropics are sorghum, millet, maize, cowpea and sesame as food crops, and cotton and groundnuts as cash crops. Other crops, such as rice or sugar-cane, can only be cultivated under irrigation. Temperate crops such as wheat or barley cannot be cultivated during the rainy season because of high temperatures.
The above-mentioned crops are widespread in the semi-arid tropics but they show various adaptations to local climate conditions. Photosensitivity and length of life cycle appear to be the main physiological mechanisms of adaptation to the diverse patterns and length of the rainy season. In fact, the early growth of some varieties of millet and cowpea (and partly of sorghum) makes them suitable for the more arid areas where the rainy season is short.
In more humid areas, where the length of the growing season is longer (lOO 200 days), some species, such as sorghum, show a photosensitivity which allows them to overcome negative aspects of climate (in particular, too wet or too dry conditions) during some of the more sensitive phases of the plant's life, such as flowering and grain filling. These mechanisms allow plants to fit the average conditions (that is to say, climate) but not necessarily the weather patterns of a given year.
In general, the traditional crops of the semi-arid tropics are well adapted to average conditions of weather but they are very sensitive to its variations, a point that will be discussed in Section 3.
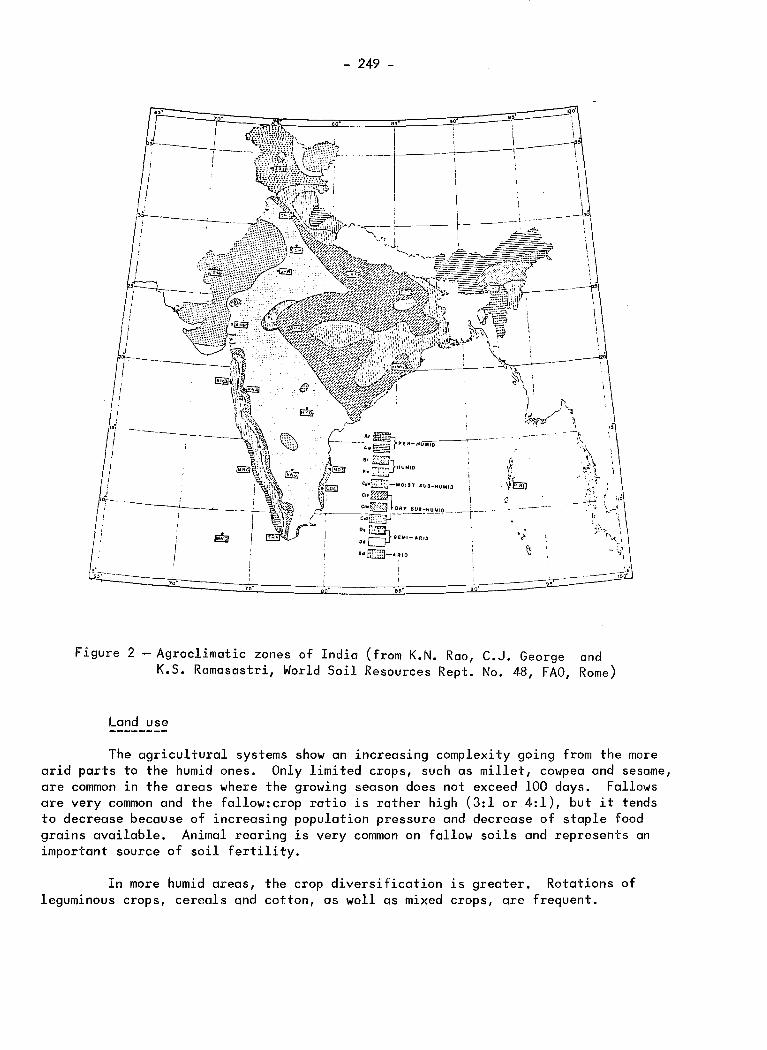
- 249 -
i I I :
-~"' -· ;_; ------t -----·-· ,_., J. '
.. _!.. -......r ........ ,
Figure 2 -Agroclimatic zones of India (from K.N. Rao, C.J. George and K.S. Ramasastri, World Soil Resources Rept. No. 48, FAO, Rome)
Land use
The agricultural systems show an increasing complexity going from the more arid parts to the humid ones. Only limited crops, such as millet, cowpea and sesame, are common in the areas where the growing season does not exceed lOO days. Follows are very common and the fallow:crop ratio is rather high (3:1 or 4:1), but it tends to decrease because of increasing population pressure and decrease of staple food grains available. Animal rearing is very common on fallow soils and represents an important source of soil fertility.
In more humid areas, the crop diversification is greater. Rotations of leguminous crops, cereals and cotton, as well as mixed crops, are frequent.

- 250 -
All cultural practices in the tropics are linked with the pattern of rains and their variability. For this reason, sowing is one of the most critical times in the more arid zones, whereas excess rains during the more humid months may give rise to negative effects on crops and soils.
Irrigation is a fundamental technique for cultivation of crops with high water requirements, such as rice and sugar-cane, and for temperate crops in wintertime. The main climatic constraint for irrigated crops is hot and cool waves for temperate and tropical crops respectively.
The traditional cultivation of low-lying areas along the rivers after flooding has great economic importanceinthe tropics. This form of land use is strongly linked with the seasonal pattern of the rains in the catchment area of the river concerned.
3. Climatic variability and agriculture
The variability of climate in the semi-arid tropics hasanimportant influence on crop behaviour. This influence is greater than in other climatic zones of the world.
In general, the inter-annual variability of climatic factors and elements in the tropics is limited during the dry season, whereas it substantially increases in the summer rainy season. Furthermore, the existence of two well-separated seasons does not permit a unified definition of climatic variability to be used. In the present paper, which deals mainly with rainfed agriculture, the inter-annual variability of rain patterns has been taken as a reference parameter for discussing the influence on traditional agriculture.
The main elements of the rain pattern whose variability may have a consistent impact on agricultural practices and crop development are the following:
(a) behaviour at the beginning and end of rainy season;
(b) duration and occurrence of dry spells;
(c) time-dependent variations of water balance.
Fluctuations of the occurrence of first and last "useful rains"
It is usually considered that 30 mm of rainfall in one ten-day period is suitable for sowing most of the rainfed crops. Nevertheless, the occurrence of dry spells after this time may induce in seedlings or young plants stress of varying degrees. The occurrence of dry spells at the beginning of the growing season is frequent in the tropics.

- 251 -
Consequently, there are two aspects of variability which affect crops to a great extent: the variability of occurrence of the first 30 mm of rain and the occurrence of relatively long dry spells after that time.
Delay in sowing generally induces a reduction in yield for most crops; the negative effect of exceptionally long dry spells often leads to repeated sowing, insufficient growth, death of seedlings, all with negative effects on final yields. Variability of the end of the rains is also important, because it can affect the occurrence of pests and diseases as well as the grain filling during the ripening processes.
During the rainy season the occurrence of dry and humid spells may influence crop growth in different ways according to local climatic conditions.
In more arid parts, prolonged dry spells during the peak months are always detrimental for crops. In more humid areas they may influence crop growth positively because of the increase of solar radiation, the reduced leaching of nutrients from the soil and decreased danger of pests and diseases. The nature of the soil is also important in this respect: dark clay soils may benefit from lower rain intensity and relatively long dry spells.
The negative and positive aspects of increasing length of dry spells are summarized in Table 2, according to agroclimatic sub-zones and the part of the rainy season.
Rainfall regimes
Beginning
Increasing
Peak
Decreasing
End
Table 2
Effect of increasing length of dry spells
according to the time of rainy season
Sub-zones
C.l C.2 C.3
Always negative for seedlings and first phases of growth
Negative
Negative
Negative
Negative
Negative or indifferent
Indifferent*
Indifferent
Negative
Indifferent
Positive
Indifferent
Indifferent
* or positive in clay soils

- 252 -
Pattern of the water balance
The quantitative analysis of the water balance throughout the rainy season 1s a useful means of assessing the "agroclimatic fragility" of the tropical agrosystems. An analysis of the water balance carried out in Mali, Upper Volta and Niger for the year 1972 (the worst of the Sahelian drought) shows that in an adverse year the agroclimatic zones underwent a southward shift of 150 - 200 km (see Figure 3). Furthermore the following aspects have been emphasized:
(a) the sub-zone C.l. practically disappeared from its average position;
(b) in a rather wide belt, although the possible growing season was close to the average in the normal C.l zone, no period with rainfall greater than PET occurred there. This seems to be the most important element in explaining the crop failure of 1972;
(c) the conditions and the position of the more humid sub-zone (C.3) were not greatly different from normal.
The final yields of crops are usually related to the total amount of rains in the more arid areas only. The complex mechanisms which link the pattern of the rainy season with the growth and development of crops do not permit easy and valuable cor·· relations between yearly rainfall and yields to be made. Furthermore, national agricultural statistics are not easily manageable for this purpose.
The areas which can be submitted to cultivation along riverbeds are strongly influenced by the amount of rain in the catchment basin. It has been calculated that only one-tenth of the surface normally cultivated along the rivers Senegal and Niger was cultivated during 1972.
The inter-annual variability of river flow is usually very high and consequently it may be suspected that the possible surfaces suitable for cultivation are subjected to considerable variation in different years. The scarcity of reliable data on this matter prevents further conclusions. The utilization of remote sensing techniques in thJs respect will surely help the understanding of the correlations between river flow and crops.
The most important climatic factor influencing crops under irrigation during the dry season is temperature, Timely sowing, essential for temperate crops, may be retarded by hot temperatures in autumn (November). Moreover, the occurrence of heat waves late in winter may give rise to difficulties in flower fertilization and disequilibrium of water uptake for some crops, such as rice and wheat. Cold waves in February, on the other hand, may reduce the growth of some tropical crops under irrigation, such as sorghum. Crop water requirements are also affected by variations in temperature.

e Kidal
• TomboYCtou
eGaa
NORMAL 0 200 400 Scale: Km. 1912
Figure 3-Shift of agroclimatic zo~es of Mali ard Upper Volta in 1972
e Kidal
eGao
1\J U"l w

- 254 -
4. Conclusions
Tropical crops and crop systems are more sensitive to climatic variability than elsewhere. This is due both to the characteristics of tropical environments and the low level of technology usually involved in the agrosystem management.
A tendency towards drier or wetter climate leads to several consequences for the agroclimate and agricultural activities in the tropics, as summarized in Tables 3 and 4. However, the positive or detrimental effects of variability are different if more arid or more humid parts of the tropics are considered. Over-simplified generalizations of the results should therefore be avoided.
In the more arid parts, the effect of an increase of rainfall is generally positive, since the main limiting factor is the amount of water; however, in the more humid parts, the concentration of 30 per cent of annual rainfall (or more) in one single month (usually August) is unfavourable for the stability of agrosystems. A decrease in the concentration of rainfall in these parts might have a beneficial effect. On the other hand, the high variability at the rains' onset may have a detrimental effect on the establishment of good crop stands.
The improvement of the present low level of technology involved in traditional rainfed agriculture in the semi-arid tropics seems essential in order to overcome some of the negative effects of climatic variability. Nevertheless, the introduction of new technologies should be gradual and in accordance with the local situation. The most advisable improvements in agricultural technologies at present are:
the replacement of hand soil work with animals in order to improve soil water storage;
a correct use of fertilizers;
a diffuse activity of plant breeding and crop improvement, according to local agroclimates.
A summary of the possible suggestions for overcoming the effects of climatic variability is shown in Table 5.

- 255 -
Table 3
Consequences of climatic variability for agriculture
Tendency towards:
Drier climate
In the zone C.l, no positive consequences since water is always a limiting factor
Neg. - Unsuccessful and repeated sowings
- Limited growth
- Insufficient grain filling
- Yield reduction
Greater soil erosion during dry season
- Damage of natural vegetation
- Decrease in animal stocking carrying capacity of pasturelonds
In the zones C.2 and C.3,
moderate decrease of rains implies:
Pos. - Less soil leaching
- Less danger of water logging
- Less danger of diseases at ripening stages
Neg. - Higher risk of failure at sowing
- Higher risk of decrease of groin filling
- Negative effects of higher temperatures on some crops (groundnuts, cowpeo)
Wetter climate
In the zone C.l, it is always positive except in the case of increasing intensity of single showers (soil erosion may be severe)
In the zones C.2 and C.3,
increase of rains means:
Pos. - Higher water availability at the beginning and end of growing season
- Lower air temperatures
Neg. - Higher leaching of soil nutrients
Higher soil erosion
- Lower photosynthesis (due to lower radiation)
- Higher risks of disease
Greater difficulty in ripening and harvest processes

- 256 -
Table 4 -----Consequences of the increase of climatic variability
for traditional rainfed agriculture
1. Greater risks of unsuccessful sowings 2. More frequent and consistent soil erosion 3. Great risk of crop failure 4. Tendency towards desertification
Effects of variability of temperatures during the dry season
Tendency towards:
Lower minima
Pos. Better development and growth of temperate crops (wheat, barley)
Neg. Risk of stoppage in the growth of tropical crops
Higher maxima
Neg. For temperate crops: Too fas~ ripening and maturation; disequilibrium in water uptake
Neg. In general: Increase of crop water requirements
Table 5
Criteria for land and crop management for improving the agrosystem's resistance to climatic variability
r------------------- --------------------------------------------------------------------, Tendency towards:
Drier climate
Plart improvement:
Selectior and utilization of non-photosensitive and drought-resistent varieties
Timely soil preparatior:
Deeper soil ploughing for increasing storage of water
Take into consideration the possibility of rep~ated sowings (with mechanization) Strict control of stock-carrying capacity of pasture-lands and follows
Wetter climate
Plant improvement:
Photosensitive pest-resistent varieties
Improvement of soil drainage systems (mainly in the C.2 and C.3 sub-zones)
Increase of cattle rearing 1n the fallow soils Timely sowing for faster soil cover and to avoid losses of soil nutrients Increase the use of fertilizers mainly in the C.2 and C.3 sub-zones
------------------------·-----------------------------------------'

- 257 -
The improvement of agroclimatological knowledge is an essential pre-requisite for a better understanding of crop-climate relationships in the tropics. Furthermore, the extension of crop monitoring systems on the basis of weather information, as already undertaken by FAO and WMO, seems an important step in the improvement of the early assessment of the influence of year-to-year variability on production of major food crops in the semi-arid tropics.
Another aspect which deserves attention is the progressive re-orientation of the meteorological services and networks towards agriculture and land management. This implies, however, the presence of expert personnel and the strengthening of the links between meteorological and agricultural services.
STUDY ON THE CLIMATIC CHANGE AND EXPLOITATION
OF CLIMATIC RESOURCES
IN CHINA
Chang Chia-cheng~ Wang Shao-wu**
Cheng Szu-chungt
Agriculture is the basis for the development of the national economy in China. It is a major task for our meteorological departments at different levels to serve the agricultural production. Research into climatic changes and better exploitation of climatic resources are other facets of rendering good service to the agricultural production.
We have numerous historical writings. Even two thousand or more years ago, there were writin~ describing climatic anomalies relevant to the harvests. Professor Chu Ko-chen L1J made a study on the climatic fluctuations during the last 5 000 years in China. According to him, during most of the first 2 000 years of the last 5 000 year period, the annual temperature was about 2 deg C higher than that of the present. After that came a series of fluctuations of 2-3 deg C, with minima occurring at approximately 1000 B.C., 400 B.C., 1200 A.D. and 1700 A.D. The climate was rather warm in the Han and Tang Dynasties (206 B.C. -- 220 A.D. and 618 -- 907 A.D.).
Recently Chinese meteorologists, having processed and analysed historical climatic materials for the last 500 years, tried to convert the descriptions in the historical writings into climatic grades by a classification procedure, so that 2harts showing the distribution of grades of dryness and wetness for the last 500 years and a temperature series for the same period were prepared. From the analysis of'the variations of the cold and warm winters for the last 500 years in the tropical and sub-tropical regions of China, it was found that there were three pronounced alternations of cold and warm periods, the cycle being about 170 years. Using the statistical relations between the Shanghai winter temperature and the dryness-wetness grade series, the latter was converted to 10-year temperature means for the last 500 years, which shows a maximum fluctuation of about 2 deg C. In the recent 20 or 30 years the temperature is lower than in the 1940's, but the decrease does not exceed 1 deg C, which still lies within the range of variation for the last 500 years.
* Academy of Meteorological Science of Central Meteorological Service, Peking, China. ** Peking University, China. t Geographical Institute, Academic Sinica, Peking, China.
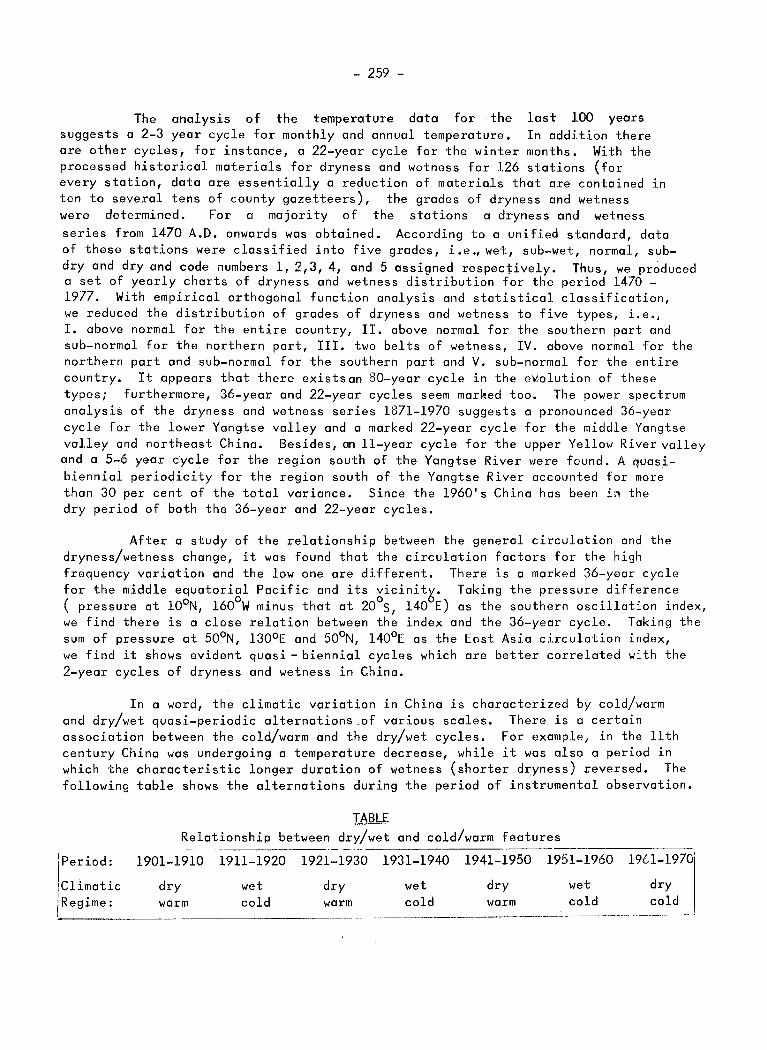
- 259 -
The analysis of the temperature data for the last lOO years suggests a 2-3 year cycle for monthly and annual temperature. In addition there are other cycles, for instance, a 22-year cycle for the winter months. With the processed historical materials for dryness and wetness for 126 stations (for every station, data are essentially a reduction of materials that are contained in ten to several tens of county gazetteers), the grades of dryness and wetness were determined. For a majority of the stations a dryness and wetness series from 1470 A.D. onwards was obtained. According to a unified standard, data of these stations were classified into five grades, i.e., wet, sub-wet, normal, sub-dry and dry and code numbers l, 2,3, 4, and 5 assigned respectively. Thus, we produced a set of yearly charts of dryness and wetness distribution for the period 1470 -1977. With empirical orthogonal function analysis and statistical classification, we reduced the distribution of grades of dryness and wetness to five types, i.e., I. above normal for the entire country, II. above normal for the southern part and sub-normal for the northern part, III. two belts of wetness, IV. above normal for the northern part and sub-normal for the southern part and V. sub-normal for the entire country. It appears that there existsan 80-year cycle in the e~olution of these types; furthermore, 36-year and 22-year cycles seem marked too. The power spectrum analysis of the dryness and wetness series 1871-1970 suggests a pronounced 36-year cycle for the lower Yangtse valley and a marked 22-year cycle for the middle Yangtse valley and northeast China. Besides, an 11-year cycle for the upper Yellow River valley and a 5-6 year cycle for the region south of the Yangtse River were found. A quasibiennial periodicity for the region south of the Yangtse River accounted for more than 30 per cent of the total variance. Since the 1960's China has been i~ the dry period of both the 36-year and 22-year cycles.
After a study of the relationship between the general circulation and the dryness/wetness change, it was found that the circulation factors for the high frequency variation and the low one are different. There is a marked 36-year cycle for the middle equatorial Pacific and its vicinit~. Taking the pressure difference ( pressure at l0°N, 160°W minus that at 20°s, 140 E) as the southern oscillation index, we find there is a close relation between the index and the 36-year cycle. Taking the sum of pressure at 50°N, l30°E and 50°N, l40°E as the Eost Asia circulation index, we find it shows evident quasi- biennial cycles which are better correlated with the 2-year cycles of dryness and wetness in China.
In a word, the climatic variation in China is characterized by cold/warm and dry/wet quasi-periodic alternations_of various scales. There is a certain association between the cold/warm and the dry/wet cycles. For example, in the 11th century China was undergoing a temperature decrease, while it was also a period in which the characteristic longer duration of wetness (shorter dryness) reversed. The following table shows the alternations during the period of instrumental observation.
1
1Period:
Climatic /Regime:
TABLE Relationship between dry/wet and cold/warm features
--------------------------1901-1910 1911-1920 1921-1930 1931-1940 1941-1950 1951-1960
dry warm
wet cold
dry warm
wet cold
dry warm
wet cold
-------------·--------·-------------------
19Ll-l970'
dry cold

- 260 -
Climatic change and variation have much to do with exploitation of climatic resources. According to descriptions in the historical literature, there once were two crops of paddy rice a year in the Lower Yangtse. Now we are transforming the cropping system in China for a better utilization of climatic resources, which hence is more susceptible to the impact,of climatic changes. Therefore consideration has to be given to climatic changes to avoid their adverse effect and to make a stable utilization of climatic resources.
China is rich in climatic resources. According to a rough estimation, the annual rate of sunshine utilization is, on the average, below one tenth. We have comparatively stable sunshine in China, but it might be very deficient in some months. For instance, in March, 1970, the sunshine duration in the Szechwan basin did not reach 20-50 per cent of the normal amount. We have not yet made full use of water resources. The precipitation varies greatly from year to year. Even 10-year running means show a fluctuation of more than lOO mm, which affects seriously the utilization of water. Water conservancy projects may compensate to a certain degree.
The annual temperature range is also great. In summe~ high temperature, high humidity and strong radiation are favourable to agricultural production. As the temperature in winter months is low in many parts of our country, we have to conduct the agricultural production in the relatively warm seasons. When planning the transformation of the cropping system we must take into account the duration of growing period and the accumulated temperature, which are influenced by climatic changes. For example, during 1876-1895 there were 11 years in Shanghai with annual mean temperatures below 15.1 deg C and no years above 15.8 deg C, while during 1936-1955 there were 12 years above 15.8 deg C and no year below 15.1 deg C. It is obvious that, under such striking conditions of temperature difference over periods as long as 20 years, the cropping system should be modified so that climatic resources could be fully used for a high and stable yield.
Capital construction on the farm land is one of the important measures to maintain high and stable yield under climatic fluctuation. The peasants in the Tachai Production Brigade managed to creQte spongy fields on their terraced land. The measurement in July, 1972, a year of bad drought, showed that the soil moisture content in the spongy fields was 1 800 - 3 500 kg/mu (1 mu equals 1/15 hectare) more than in the ordinary plot~ corresponding to 3-5mm of rainfall. According to measurements made in Heilungkiang Province, soil amelioration could increase soil temperature by about 1 deg C, thus helping reduce damage by cold injury.
The rotation of grain crops and green manure may contribute to an increment of nitrogen content and organic matter in the soil and help pig raising and provision of more dung. The proportional development of agriculture, forestry and animal husbandry should lead to establishment of optimum agricultural eco-system, which in turn may alleviate the impact of climatic fluctuations and stabilize the exploitation of climatic resources.

- 261 -
If reliable prediction of the climatic scale (or regime) can be made, it should be possible to adapt the cropping system to the changing conditions to ensure high and stable yield. Since the variation of rainfall is composed of quasiperiodic alternations of dryness and wetness, it is possible to estimate the future trend by analysing the present phase in the cycle. For exa~ple, in 1972, a year of severe dryness, a good forecast was modefor Shanghai on the trend towards rainfall increase by analysing the 36-yeor and the 2-5 year weather cycles and the solar activity cycle. We hove also obtained inspiring results in making tentative predictions on the trends of dryness and wetness for the 1960's and 1970's.
The assessment of climatic resources varies with the development of agricultural production. Only when we hove a good understanding of the lows governing climatic change con we tap the full potential of climatic resources and ovoid the adverse impact of climatic change, and thereby ensure good harvests under changing climate.
REFERENCE
LI7 CHU, Ko-chen. (1973). A preliminary study on the climatic fluctuations during the last 5 000 years in China, Scientia Sinico, Vol. 16, No. 2.
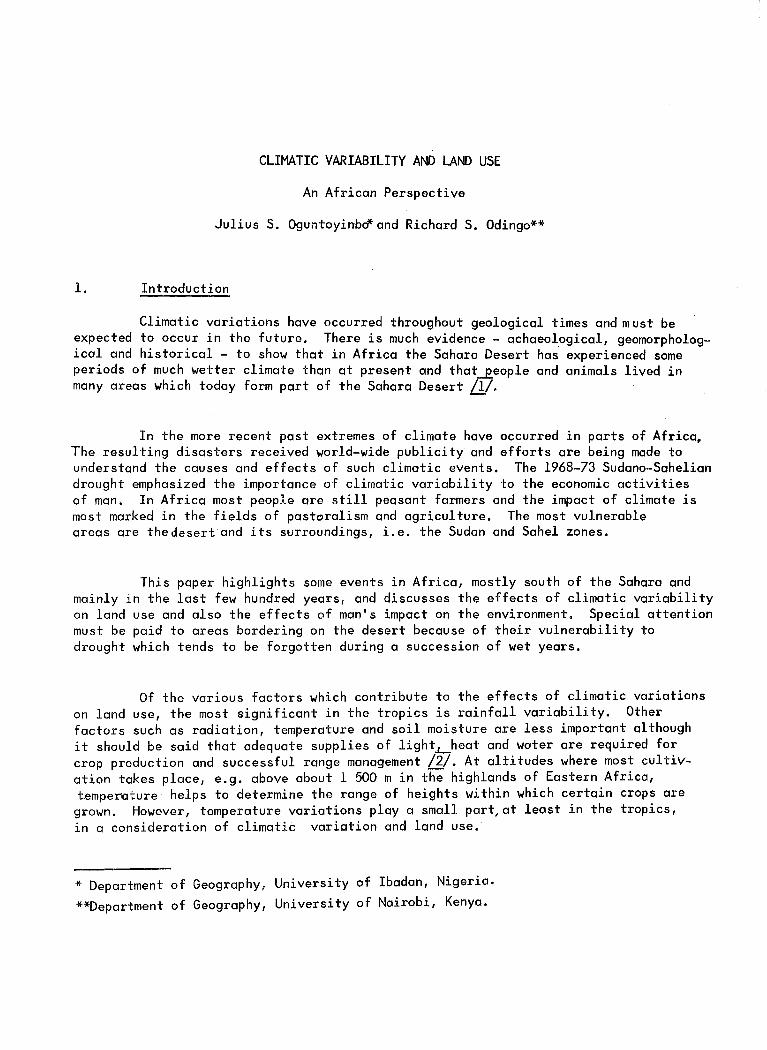
CLIMATIC VARIABILITY AND LAND USE
An African Perspective
Julius S. Oguntoyinb~and Richard S. Odingo**
1. Introduction
Climatic variations have occurred throughout geological times and must be expected to occur in the future. There is much evidence - achaeological, geomorpholog~ ical and historical - to show that in Africa the Sahara Desert has experienced some periods of much wetter climate than at present and that_£eople and animals lived in many areas which today form part of the Sahara Desert /1/.
In the more recent past extremes of climate have occurred in parts of Africa, The resulting disasters received world-wide publicity and efforts are being made to understand the causes and effects of such climatic events. The 1968-73 Sudano-Sahelian drought emphasized the importance of climatic variability to the economic activities of man. In Africa most people are still peasant farmers and the impact of climate is most marked in the fields of pastoralism and agriculture. The most vulnerable areas are thedesert and its surroundings, i.e. the Sudan and Sahel zones.
This paper highlights some events in Africa, mostly south of the Sahara and mainly in the last few hundred years, and discusses the effects of climatic variability on land use and also the effects of man's impact on the environment. Special attention must be paid to areas bordering on the desert because of their vulnerability to drought which tends to be forgotten during a succession of wet years.
Of the various factors which contribute to the effects of climatic variations on land use, the most significant in the tropics is rainfall variability. Other factors such as radiation, temperature and soil moisture are less important although it should be said that adequate supplies of lightL-heat and water are required for crop production and successful range management /2/. At altitudes where most cultivation takes place, e.g. above about 1 500 m in the highlands of Eastern Africa, temperoture helps to determine the range of heights within which certain crops are grown. However, temperature variations play a small part,at least in the tropics, in a consideration of climatic variation and land use.
* Department of Geography, University of Ibadan, Nigeria.
**Department of Geography, University of Nairobi, Kenya.
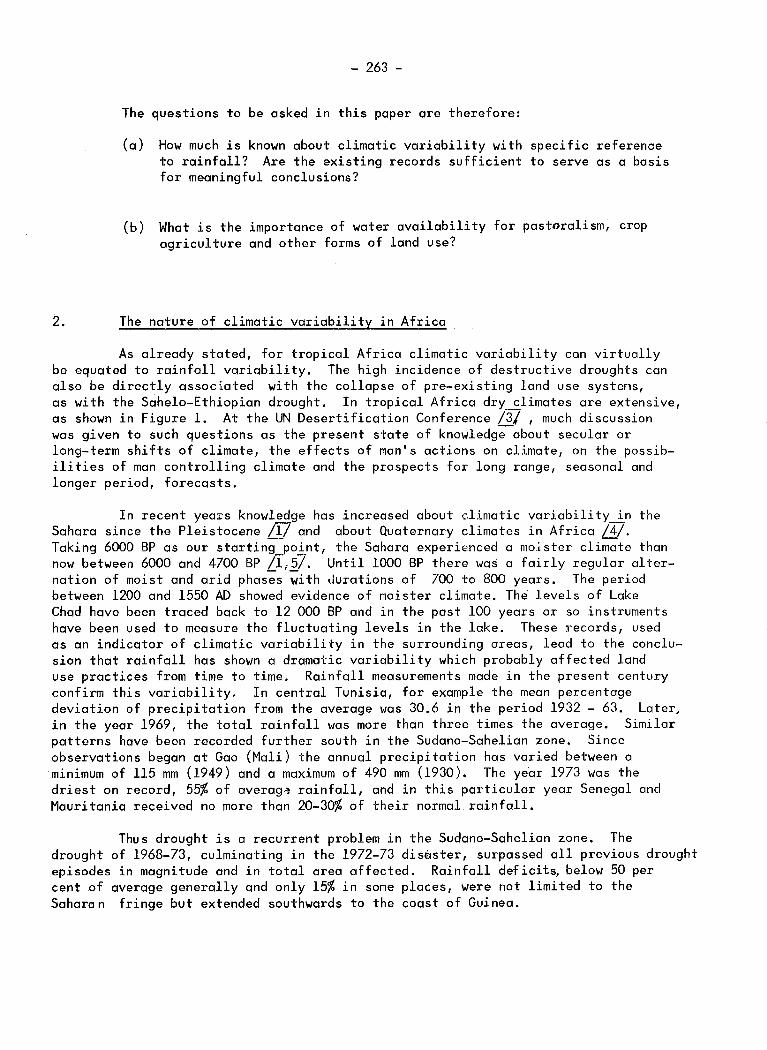
- 263 -
The questions to be asked in this paper are therefore:
(a) How much is known about climatic variability with specific reference to rainfall? Are the existing records sufficient to serve as a basis for meaningful conclusions?
(b) What is the importance of water availability for pastoralism, crop agriculture and other forms of land use?
2. The nature of climatic variability in Africa
As already stated, for tropical Africa climatic variability can virtually be equated to rainfall variability. The high incidence of destructive droughts can also be directly associated with the collapse of pre-existing land use systens, as with the Sahelo-Ethiopian drought. In tropical Africa dry climates are extensive, as shown in Figure 1. At the UN Desertification Conference /3/ , much discussion was given to such questions as the present state of knowledg;-about secular or long-term shifts of climate, the effects of man's actions on climate, on the possibilities of man controlling climate and the prospects for long range, seasonal and longer period, forecasts.
In recent years knowledge has increased about climatic variability_in the Sahara since the Pleistocene /1/ and about Quaternary climates in Africa /4/. Taking 6000 BP as our startingpoint, the Sahara experienced a moister cli~te than now between 6000 and 4700 BP /l,5/. Until 1000 BP there was a fairly regular alternation of moist and arid phas;s ;ith durations of 700 to 800 years. The period between 1200 and 1550 AD showed evidence of moister climate. The levels of Lake Chad have been traced back to 12 000 BP and in the past lOO years or so instruments have been used to measure the fluctuating levels in the lake. These records, used as an indicator of climatic variability in the surrounding areas, lead to the conclusion that rainfall has shown a dramatic variability which probably affected land use practices from time to time. Rainfall measurements made in the present century confirm this variability. In central Tunisia, for example the mean percentage deviation of precipitation from the average was 30.6 in the period 1932 - 63. Later, in the year 1969, the total rainfall was more than three times the average. Similar patterns have been recorded further south in the Sudano-Sahelian zone. Since observations began at Gao (Mali) the annual precipitation has varied between a minimum of 115 mm (1949) and a maximum of 490 mm (1930). The year 1973 was the driest on record, 55% of averag~ rainfall, and in this particular year Senegal and Mauritania received no more than 20-30% of their normal rainfall.
Thus drought is a recurrent problem in the Sudano-Sahelian zone. The drought of 1968-73, culminating in the 1972-73 dis~ster, surpassed all previous drought episodes in magnitude and in total area affected. Rainfall deficits, below 50 per cent of average generally and only 15% in some places, were not limited to the Saharan fringe but extended southwards to the coast of Guinea.
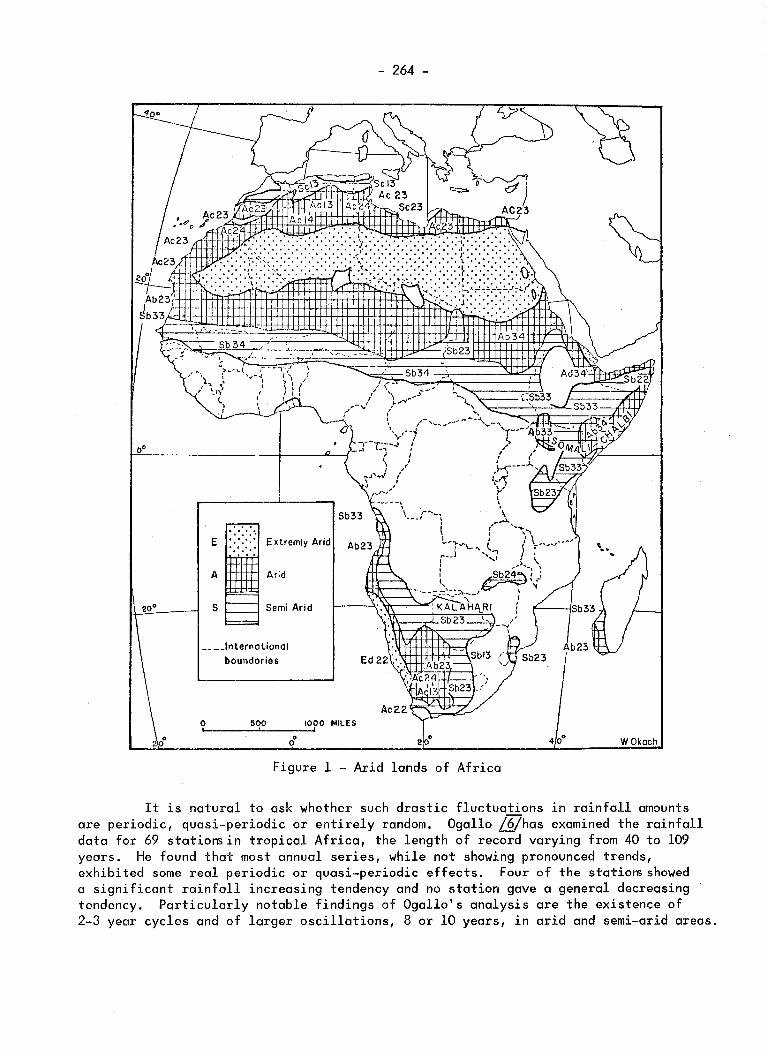
E Ex tremly Arid
A Arid
s Semi Arid
____ lnternotionol
boundaries
0 500
- 264 -
Figure 1 - Arid lands of Africa
W Okoch
It is natural to ask whether such drastic fluctuations in rainfall amounts are periodic, quasi-periodic or entirely random. Ogallo /6/has examined the rainfall data for 69 statio~in tropical Africa, the length of record varying from 40 to 109 years. He found that most annual series, while not showing pronounced trends, exhibited some real periodic or quasi-periodic effects. Four of the statiornshowed a significant rainfall increasing tendency and no station gave a general decreasing tendency. Particularly notable findings of Ogallo's analysis are the existence of 2-3 year cycles and of larger oscillations, 8 or 10 years, in arid and semi-arid areas.

- 265 -
An example of average and smoothed curves for rainfall ~s shown in Figure 2 which is based on data for Addis Ababa.
From this and similar studies the variability of rainfall in many parts of Africa is now fairly well understood. For example, in some areas of Kenya a localized rainfall failure can be expected every two years and a more widespread regional drought every four to five years although this latter is not a regular cycle. In the high potential agricultural districts, a failure of the rains at least once every four years is shown less in total failure of crops thon in reduced yields, Once every ten to fifteen years there is the equivalent of a countrywide drought of which the Sahelian occurrence was an example. This drought has the potential of a disaster since it may result in total crop failure and widespread livestock mortality.
Ul w
2700~
I
ADDIS ABABA
Cl: 2300 I-W ::.E
-' -'
"'
-' -' «
1900
Or'iginal series ... . ·---
Smoothed series.···-------
~ 1500
« er
-' < ~ 1100 z «
0 900 1700 2500 3300 4100 4900 5700 TIME XI0-2 (YEARS ,1902-74)
Figure 2- Rainfall variability (after Ogallo /6/)
6500 7300
The implications for land use of the observed variability of rainfall may be summarized as follows:
(a) For regions relying on annual crops, seasonal fluctuations of rainfall are of major importance.
(b) The high frequency, 2-3 years, of certain cycles suggests that land use should be suitably adapted, e.g. by tree crops and by irrigation. In the absence of irrigation, frequent crop failures can lead to the disappearance of crop agriculture and its replacement by livestock keeping, perhaps on a nomadic basis.

- 266 ....
(c) In a few cases in East Africa perennial crops lik~ coffee or sisal can fit into the shorter cycles within the 2-3 year oscillations. Dry farming techniques have been practised in a few countries by using during one year the conserved rainfall of the preceding two to three years.
(d) The longer period oscillations of rainfall pose the most serious threat because they disrupt long established systems and lead to disasters of Sahelian type requiring the import and distribution of food on a a large scale.
3. Climatic impacts in West Africa south of the Sahara
Rainfall in West Africa is highly seasonal and erratic. Vegetation ranges from scrub to Guinea Savanna and human activity from pastoral nomadism to seasonal crop cultivation. Crops are grown under rain fed conditions except in oases and river valleys where-irrigation is possible. In a sequence of wet years activities would extend into the desert, a practice which makes disasters probable if a series of dry years occurs.
Before the advent of colonialism the principal societies of the Sahel -nomads, farmers, pastoralists - had developed land use and associated systems which successfully took into account the constraints imposed by their environment LZ7. Agriculture depended on the availability of water and , in the southern margins of the Sahelian zone, was to be found among the valleys in dry seasons and in the uplands in wet seasons. ~mong the Hausa farmers the social system was based on the family whose head allocated labour and divided the land into cultivated and fallow areas. By there and other means the family provided for the maintenance of land resources and for the protection of people from droughts and plagues.
Soil fertility was maintained not only by following but also by the migratory practices of the pastoral nomads who moved south in the dry seasons and retreated to the north ahead of the rains for the wet seasons. As with the farmers, the nomads had developed social systems which safeguarded economic activity and minimized the risks of drought and disease. Animal husbandry allowed numbers to increase during the wet years as an insurance against the losses anticipated in dry years ~. The whole organization was complex with a degree of interdependence between the nomads and the farmers. However, some nomads, notably the Fulani, gave special emphasis to mobility in their pattern of life and aimed at subsistin~entirely from their herds, the numbers of which were kept as high as possible L2f. Mobility was reflected in the social organization, in which families would band together to share limited grazing resources but would break up into individual units if it became necessary to escape disease or find new pastures.
4. The influence of European colonization
The social and economic changes introduced by European colonization modified the indigenous cultures and disrupted the xelationships which had been established among the socio-economic grou~in the region. Colonization had beneficial impacts in regard to education, medical and veterinary facilities and in other ways. However,
- 267 -
an expansion of cultivated areas took place at the expense of better watered grazing lands and of much of the brushland, which was traditionally part of the pastoralists' grazing land.
Colonialism therefore disturbed the balance between the farmer and the herder and also changed the mechanisms designed to maintain productivity and minim~ze the effects of drought and disease.
5. Ecological disturbance by man; the 1968-73 drought in the Sahel
Deforestation and the burning of the steppes and savannas diminish the natural vegetation cover that protects the soil against water and erosion. The population of the steppes of Africa use wood as a fuel and each year the production of 15 million hectares of land is consumed. The steppes have not always been treeless but that impression is easily formed today.
Another problem arises from over-grazing of the deserts and the neighbouiing areas in association with the cultivation of the steppes. The departure of the nomads from parts of the steppes has, on the one hand, caused deterioration of the sparse vegetation in the surrounding semi-deserts and, on the othe~ led to disturbance of the ecological balance of the cultivated steppes. Serious consequences also folJow the ploughing of dry soils. In the arid zone of Africa immense quantities of fine sediment are transported into the Atlantic by the trade winds each year. In 1969 these dust masses were estimated at 6 million tonnes LIQ7.
Salinity of the soil is a problem for agriculture both in the oases and in the river valleys of the arid and semi-arid zones. In the present century irrigation has been intensified through the construction of dams and deep borings but the extraction of underground water has tended to lower water tables and dry out traditional wells and oases.
The recent Sudano-Sahelian drought affectad a population of 60 million in an area of 5.2 million km2 stretching from the Atlantic to the Red Sea. Historical evidence and oral tradition indicate that Nigeria bas experienced severe drought conditions in the past. Droughts accompanied by famine occured in the 1890s and in 1913-14, 1927, 1934-35, and 1942-48. Rainfall records for Nigeria show that the 1972-73 drought excelled all previous droughts in area and in severity. In 1973 rainfall deficits ranged from 10% of the average to over 50%. The rain in that year arrived late and ended early. In KQno, for example, planting which normally starts in late May could not begjn until July. The rains ended in some parts as early as August. Many crops were destroyed and there was considerable loss of livestock as herds moved northwards to seek a rainy season which hardly materialized. Groundnut production was badly affected and exports were stopped. Food prices rose by more than 200%. The drought caused major damage to the Nigerian economy. An example is provided by the following table of groundnut output, based on figures issued by the Federal Office of Statistics, Lagos.

- 268 -
Table
Estimate of groundnuts graded in the northern states of Nigeria
Year
1968/69 1969/70 1970/71 1971/72 1972/73
Output (tons)
765 000 650 000 400 000 250 000 25 000
Other evidence of the severity of the drought and its impact on land use can be gleaned from Borno State in the extreme northeast of Nigeria. Borno has a population of nea~ly 2 million with more than 1.5 million livestock and has a mean annual rainfall ranging from lOO mm to 1 000 mm. The grain crop depends on rivers which, in 1972/73 and 1973/74, flowed only for a short time or not at all. Over-grazing, a common feature of the region, became much worse in 1972/73 owing to the influx of herds from elsewhere. Losses in livestock amounted to about 400 000 and losses in food crops exceeded 1.1 million tons, about 50% of the average annual production LII7.
The case studies presented to the UN Conference on Desertification ~ included one referring to the Sahelian parts of the Republic of Niger, covering an area about lOO 000 km2 mostly arid or semi-arid. The annual rainfall averages 100-350 mm falling during 2-3 months in th~ summ0~. The area is largely devoted to pastoralism with some rainfed agriculture in the southern, wetter districts. The livestock numbers were not excessive for the region but importantsoci~economic changes had occurred before the Sahelian drought. These changes were encouraged by above average rainfall in the preceding decade and included a breakdown in control of the movements of pastoralists and grazing animals, an increase in population and livestock, an extension of agricultural land and the development of deep wells and bore holes. The Sahelian drought arrived and produced a livestock mortality of 80% or more. The whole land use system collapsed, partly as a result of rainfall failure and partly because some faulty planning decisions had been made in earlier years.
6. The impact of rainfall variability in East Africa
It seems clear that man and his destructive ways must bear the main share of the blame for the adverse effects on land use of climatic fluctuations in general and rainfall variability in particular. Man-made changes are physically real and may be irreversible. On the other hand, natural systems are self-regulating and hence stable but they may contain potential instabilities which can be triggered by man's actions []7.
- 269 -
Just as natural ecosystems exhibit resilience against climatic variability, so also should the accompanying land systems. However, many of the agricultural and pastoral systems that have been introduced into fragile ecosystems have not adjusted to climatic variation but have tended to hasten the process of ecosystem destruction. What must be regarded as continued rangeland misuse is causing numerous problems such as the reduction in plant cover and biomass, increased erosion, lower productivity and the disappearance of forage species and wildlife L
- 270 -
(a) Effective control of soil erosion by the use of soil conservation measures;
(b) The early or even dry planting of crops (which has been encouraged in East Africa for the last twenty years) to make the best use of the rain;
(c) The use of quick maturing or "Drought escaping" crops like sorghum (Sorghum vulgare), bulrush millet (Pennisetum typhoideum), Toff (Eragrostis Teff) or the new short growing maize varieties, such as have been introduced into the semi-arid areas of Kenya (Katumani Maize) or similar areas in Tanzania (Tabora or Dodoma Maize); or the encouragement of legumes like cowpeas (Vigna sinensis), gram, or various types of quick maturing bean varieties;
(d) The encouragement of affected families to plbnt famine crops like cassava (Mannihot utilissima) to provide for times of real food shortage;
(e) The use of animal and artificial fertilizers to accelerate crop growth as well as increase yields in years of adequate rainfall.
It is nor~ally found that the soihof semi-arid zones are, if anything, more fertile than the soil of the forest zones. Most important is careful planning of land use as well as the choice of appropriate crops. During droughts such as those recently reported for Ethiopia the cultivators who had not adapted their land use to the environment suffered more heavily than the pastoralists who maintained their activities until losses of livestock exceeded 80%.
In the final analysis it is not easy to make categorical statements about the effects of climatic variability and, especially, rainfall variability on land use. Agriculture is the meeting point of various physical, economic, social and even political factors. It may be said, however, that several seasons or yeaxs of very low rainfall totals result in the decline of crop yields or even the complete disruption of the various agricultural and pastoral land use systems.
8. Summary and conclusions
The foregoing discussion provides a basis for some generalizations on the climate and land use in Africa, notably in reference to the areas bordering the Sahara Desert and to the regions of variable rainfall in East Africa. All these areas experience variations of climate and accordingly suitable land use strategies are required.
Before the advent of Europeans in West Africa, the natives in the various zones, whether farmers or pastoral nomads, developed a symbiosis which ensured effective land management. However, the pattern was disrupted, with conseqaent pressure upon land use, by the introduction of cash crop systems and of various

- 271 -
social amenities, educational and medical and vete~inory services. The effects of this pressure are most apparent in the marginal areas at times of crisis as, for example, in the 1968-73 Sahelian drought. Overpopulation, excessive grazing and cultivation lead to soil erosion anddesert~ication. It appears, therefore, that in Africa the impact of man on the land's productivity has reached a level comparable with that due to natural climatic fluctuations. Moreover, we may be on the fringe of anthropogenic changes on a global or hemispheric scale.
Though events in East Africa differ in detail from those in West Africa, there is a common basic principle, namely, that the impact of climate arises from climatic variability rather than from a pro1onged change towards greater aridity. Overall, the effects are produced by the interactions of injudicious land use and of interventions by modern technology with periods of drought. Lingering jn the background is the possibility of global anthropogenic climatic fluctuations. The major handicap to effective planning over all aspects of land use is a lack of adequate knowledge of climatic vagaries. Since the areas of concern will continue to be occupied given their potentialities under normal years, there is a need to intensify research on the measures that can be taken to ensure that the land use characteristics in those marginal zones conform as m~ch as possible to climatic realities.
REFERENCES
/l7 GEYH, M.A. and JAKEL, D. (1974). Soatpleistozane und 1~alozane Klimageschichteder Sahara auf Grund zuganglicher C-daten. Zeitschrift fUr Geomorphologie, N.F., 18, pp.82-98.
FAO/Unesco/WMO (1969). climatology of the Organization, Rome.
Technical Report on the Study of the AgroHighlands of Eastern Africa. Food and Agriculture
HARE, F.K. (1977). Climate and Desertification. In Desertification: Its Causes and Consequences (U.N. Desertification Conference Secretariat). Pergamon, London, pp. 63-120.
VAN ZINDEREN BAKKER, C.M. (1962). Botanical evidence for Quaternary climates in Africa. Anne Cape Museum, II, pp. 16-31.
BUTZER, K.U. (1957). The recent climatic fluctuations in the lower latitudes and the general circulation of the Pleistocene. Geografiska Annaler, Stockholm. 39, pp. 10:-113.
OGALLO, L. (1977). Rainfall in Africa. Paper presented to IFIAS Workshop on Climate and Man, the 1972 Case Study. Geneva. See also unpublished M.Sc. thesis, University of Nairobi.

m - 272 -
BERRY, L.C. CAMPBELL, D.J. and EMKAR, I. (1977). Trends in Man-Land Interaction in the West African Sahel, in DALBY, D. , HARRISON-CHURCH,R.J. and BEZZA FATIMA. (eds). UNEP-IDEP-SIDA, London.
SWIFT, J. (1975). Une economie nomade sahelienne face a la catastrophe. Le Tuareg de l'Adrar des Iforas (Mali). In COPANS, J. (ed) Secheresses et Famines du Sahel.· Maspero, Paris, II, Chapter 4.
STENNING, D.J. (1957). Transhumance migratory drift migration: patterns of pastoral Fulani nomadism. Journal of the Royal Anthropological Institute, 87, pp. 57-73.
RAPP, A. (1974). A Review of Desertification in Africa: Water, Vegetation and Man. Secretariat for International Ecological Studies, Stockholm.
KHALIL, I.M. (1974). North Eastern State Report on Long Term Measures to Combat Drought. Ministry of Natural Resources, Maiduguoi, Nigeria.
UNITED NATIONS (1977). Synthesis of Case Studies, Conference on Desertification, Nairobi, Kenya.
RAPP, A. LE HOUEROU, H.N. and LUNDHOLM, B. (1976). Can Desert Encroachment be Stopped? Swedish National Science Research Council, Ecological Bulletin No. 24.

CLIMATIC VARIABILITY AND FORESTRY
A. Baumgartner*
1. Principal aspects
The relationship of forest to climate has two main aspects: forests react to fluctuations of climate and climate reacts to changes of forest cover. Correspondingly one has to differentiate between the influence of climate on the forest and the influence of the forest on the environment.
It is of importance in this respect to be aware that trees from seedling to maturity have a lifetime much longer than one generation of man. Tree growth integrates or compensates the influences of climatic fluctuations. However, there are critical phases in the tree life open to serious impacts of extreme meteorological events. Thus the problem of climatic variability in relation to forests has a rather specific note compared with the other topics discussed at this conference.
The importance of climate to forests, or of forests to the environment, has to be evaluated according to the fraction of the earth's surface that is forested and with consideration of the functions of forests within the biosphere. About 50 x 106 km2, or 10 per cent of the globe, are covered with forests, including closed forest and open woodland such as savanna, chaparral or shrubs. Without open woodland the forest area is reduced to about 44 x 106 km2. As regards land surfaces, the forests cover about 50 x 106 km2 , or 33 per cent of the continents. The photosynthetic production of plant matter by forests is 65 x 109 tonnes, which is 42 per cent of the global total, or 65 per cent of the production on land. Forest is therefore the main organic system in the biosphere.
Forest is a productive and a protective cover for the earth with many functions. For man, no doubt the primary role is as a producer of wood. The whole stock of plant matter in forests is about 2 x 10¹² tonnes, the annual matter production is about 65 x 109 tonnes per annum and the annual removal of wood out of 2.8 x 10⁹ hectares of accessible forest, is around 1.45 x 10⁹m3. The cut has an economic value approximately 50 x 109 US$. The demand for wood is rapidly increasing. In spite of this fact climatic fluctuations, whether by warming, cooling or by moisture changes, will not greatly disturb the world supply of wood. Decreasing yields in one climatic zone of the earth may be compensated by increased yields in other zones or by better use of the stock.
* Department of Bioclimatology and Applied Meteorology, University of Munich, Federal Republic of Germany.

- 274 -
Forests improve the quality of life. They protect men, animals, plants, soils, historic monuments, etc. The value of forests and trees for such purposes as protection, air purification, recreation, aesthetic appreciation, and hydrological functions for water flow and quality, has proved very difficult to measure and to express in terms comparable to those of wood production.
2. Specific properties of forests
Forests develop by their structure specific climatic, hydrological and hygienic properties.
On 9 per cent of the globe forests are earth-atmosphere interfaces. The high leaf area ensures that tree surfaces are in very good contact with the air, absorbing and intercepting radiation, precipitation, aerosols and momentum of air very efficiently.
Energy processes in a forest take place over its entire volume and for this reason forests do not overheat greatly even when the ambient air temperature is very high. Because of high absorptivity of short wave radiation and low emission of long wave radiation, the net radiation over forests is relatively high. Thus for energy exchanges, forests are the most active elements of the land cover.
Although forests consume more water than other earth covers, forested catchments are the most important sources for drinking water on account of the favourable water balance at the sites and the good water quality. The intensive use of water by forests can be viewed differently according to whether the climate is arid or moist. In arid areas, where water is precious, tree plantations may be luxuries and they are extremely susceptible to small decreases of precipitation. In moist areas, however, where water is in surplus, trees are welcome users of water and are relatively stable against changes of water supply. The dependence of water exchange on the type of forest cover is also of high importance for the energy balance since changes of forest cover alter the runoff-ratio, the flow of latent heat and the Bowen ratio.
The crown or upper surface of a forest is aerodynamically the roughest earthatmosphere interface. The surface drag, energy dissipation and turbulent exchange of air are proportional to the roughness. It therefore follows that the forest cover affects the vertical turbulent mass transfer, the cleaning of polluted air, the development of the pressure field and the circulation of air.
Forests are sources or sinks of energy, matter and of air constituents. From the total solar energy flux on the globe, of 2 150 x 1021 J annually, about 2 880 x 1ol8 J are fixed in plant matter, of which forests account for 1 200 x 10l8 J. For the formation of a mass unit of plant dry matter (DM) 1.83 mass units of C02 have to be provided, and 1.32 mass units of 02 are released. The decomposition of primary plant matter at and in the soil is a function of temperature and forms a source of C02 and a sink of oxygen. Not unimportant for atmospheric processes is also the release of hydrocarbons. Through the lack of anthropogenic emissions of sulphur, fluorine, etc., in their vicinity, forests entrain polluted air of the environment and act as passive sinks.
- 275 -
Forests are very efficient in the global carbon dioxide balance. From the 285 x 109 tonnes C02, assimilated by vegetation annually, 118 x 109 tonnes per annum (t a-1), or 42 per cent, are used by forests. Compared with the total of C02 in the atmosphere, 3 x 1ol2 t, the ratio of exchange by forests to the storage in the atmosphere is 4 x lo-2 . There is considerable uncertainty on the buffering potential of C02 in wood mass above and organic matter below ground. The progressive deforestation in tropical zones may rapidly influence the carbon and nitrogen content of atmosphere. The annual release is assumed to be a C02 source of 17 x 109 t a-1, i.e., of the same order as the global release of C02 by burning fossil fuels. In the managed forests of temperate or boreal climates, however, the interruption of growth by tree cutting, before reaching a succession state, and the removal of wood, results in a C02 sink of about 7.5 x 10⁹ tonnes C02 annually. The net effect of land use by forestry is a release of about 10 x 109 tonnes C02 annually.
3. Sensitivity of tree growth to ~eteorological factors
The vulnerability of forests to changes in climate or to extreme weather events in the scenario of climatic fluctuations needs to be examined separately for different phases of the individual tree's life, and for forestry operations. Seeds and natural reproduction depend strongly on climatic fluctuations. Flowering and fruiting of trees differ from year to year. The germination and production of seedlings depend often on chance events in growing conditions.
The establishment of artificial forests, in the form of a plantation, is part of a long-term strategy in forestry. It involves climatic risks of many kinds. For example, plantations of so-called exotic or fast growing trees from foreign climates are very sensitive to climatic variability, as are monocultures generally.
Tree growth, wood quality and yields are products of climatic influences over a long series of years. Tree ring width, wood density, physical wood parameters and wood-quality characteristics, such as branch numbers, inclusions, shape of stem, cross section, etc., are closely correlated with climate. The diversity of tree species as well as the vertical and horizontal composition of a tree community, or the stability of a forest biome are in dynamic equilibrium and determined partly by atmospheric conditions.
The development of diseases and insect attacks depends primarily on the thermal and moisture characteristics of the environment and on the atmospheric transport of germs and insects. The population dynamics of insects can be causally related to climatic fluctuations. The weather-related outbreaks of pests and of insect attacks are primary or secondary causes of large scale mortality of specific species.
There are many types of abiotic risks in forestry which are governed by climatic conditions such as frost, win~ drought, wetness, hail, snow and ice, Such risks have important ecological and economic aspects.
The environmental influences of polluted air on assimilation, on plant tissues or on soil-water-acidity are very important for wood production. However, these influences have not been sufficiently investigated and quantified in relation to climate.

- 276 -
4. Forestry planning
Forestry planning has an unusual time scale, compared with other forms of social, political and economic planning. The time scale comprises one tree life and more. Forest establishment, management and infrastructure development are normally based on the assumption that existing climate will continue. Changes of environmental factors occurring during growth-periods cannot be corrected without economic consequences.
The establishment of a man-made forest on the assumption that active growth will be maintained over a long period involves a risk in relation to climate. The successor failure of the project would depend partly on any changes of climate that take place during the period of growth. A knowledge of climatic trends at the planning stage would therefore be of the highest value.
Climate and climatic trends must also be taken into account in many other aspects of forest management, an important example being the methods of protection against biotic and abiotic hazards.
It may be mentioned that the role of forests in protecting man's environment was among the subjects considered at the UN Conference on the Human Environment (Stockholm 1972).
5. Effects of climatic changes or fluctuations
The development of a forest normally proceeds steadily except for variations in annual growth rates caused to some extent by climatic changes or fluctuations. Further evidence of the impacts ofclimate on forests is to be found in changes in forest area, stand structure, plant sociology, species selection and tree habit. Forest evolution since the last glacial epoch provides a good example of climatic impact, with successions to a so-called climax vegetation, regional movements and retreats of distinct types of forest and of the forest areas themselves. Small, hardly detectable but permanent trends in climate show their greater influences in the movement of treelines horizontally and vertically.
Correlation analysis with recent yield data has shown strong dependence of productivity on meteorological parameters. From the regressions it follows that global cooling or warming have different effects in cold and warm climates. Hence climatic fluctuations may have differing significance in the different parts of the world.
Classifications of climate can be based on the relationship of climatic parameters to existing vegetation types. If climatic trends alter the conditions, the forest can adapt to the new environment, change its area of distribution, its stand type or die and disappear. Monitoring of forests by continuous mapping or by remote sensing geobotanic surveys is useful for detecting climatic impacts.
6. Impacts of climatic fluctuations on forest at endangered limits
Impacts of climatic fluctuations on individual trees or stands are possible in all forest regions, but are most noticeable at the spatial limits of specific tree species or of stands at sites with high risk.

- 277-
At the spatial limits of specific tree species small shifts of m1n1mum values or continued extreme events, such as droughts or severe winters, may be sufficient to start retreat or extension of the species over great areas. Seed and seedlings are most affected directly but mature trees are objects of secondary diseases, The relatively mild climate in the temperate zone during the last century favoured the cultivation of fast growing exotic trees in plantations far outside their original homes. To avoid errors in investment, therefore, it is important to know the trends of future climate.
Borders of high risk are the arctic tree-line of the Boreal forest and the upper timber line in the mountains. In northern latitudes natural regeneration occurs only in favourable years, and plantations are endangered by sequences of severe winters and short unfavourable summers. Of specific importance is the effect of cooling in the mountains. Depressions of the timber line cause loss of soil protection and lead to increased erosion, land slides and avalanches, falling rocks and torrential flooding.
The arid sub-tropical zones are apt to be extreme for tree growth because of water deficiency, excess heat and drifting sand. New plantations have to be protected and, even so, they can be destroyed in a short time. More than elsewhere, forestry in extreme zones needs information on the extent and time of climatic fluctuations.
7. Feedback of forest operations with the climate
The conservative at the site. regional or,
specific properties of forests explain that any forest management or destructive exploitation, have feedbacks
Depending on the scale of operations, these feedbacks exceptionally, global scales.
operation, whether with the climate may also be on
Conservative management of virgi~ or man-made forests does not disturb the functions of forests at the site, although energy and water balance or air exchange processes will be altered. Since this type of management only affects parts of the forested area, and reforestation is practised, no real feedback can be observed.
However, destructive forest operation such as the clearance of fairly large areas changes the energy, water and biogeochemical cycle. The connexion between the energy and the water balance means that removing the forest cover and exposing the soil leads to greater dryness and an increased convective heat transfer to the atmosphere. More heat at the earth's surface amplifies the system, more water damps it.
Economic and population pressure accelerate rapidly the exploitation of tropical forests, mostly with use of fire. In the next 20 to 30 years land use will affect meteorological and edaphic processes at least on about 1.2 to 1.5 x 10⁹ hectares of tropical land. The possible climatic impacts have been investigated in several models. Destroying forests will initially increase the surface albedo and temperature, reduce absorbed solar radiation at the active surface, change the heat and vapour convection, wind and temperature profiles, cloudiness and precipitation. The extent of the feedback is worldwide. It is assumed that the meridional transport of heat, moisture and carbon dioxide out of equatorial regions is reduced. An
- 278 -
increase of precipitation in the tropics and a decrease in the temperate zone, a global cooling and an increase of the carbon dioxide content of the atmosphere is assumed.
It is of theoretical interest to consider, what would happen, if the globe were totally deforested. The average albedo of the globe would increase from 16.7% to 17.3%for the year. The roughness parameter should decrease from the global average of 14.9 cm to 3.0 cm. Changing surface drag will shift the angle between surface wind and the isobars, influencing the pressure field and with it the general atmospheric circulation of the globe.
8. Consequences for forest management and operations
The results of these studies convince us that for many reasons mankind should try to maintain the existing forest cover on the earth. It is possible to manage the forests without drastic consequences for energy, water, and biochemical balances, but the area of forest should not be diminished to any great extent before we have enough knowledge to assess what the consequences would be.
With regard to ecological aspects, forests are mosaics that are needed for the stabilization and aesthetics of a landscape and as part of macro-scale ecology. The local and environmental influences of forest are protective for men, plants and animals. They are the favourite areas for the protection of natural biomes and wildlife.
On the economic side, wood, a renewable resource, is reproduced in acceptable amounts, quality and diversity of species only in stable, intact forests. Timber requirements are rising. Climatic fluctuations may disturb local markets but not international supply in the next decades.
Turning to social aspects, forests have a social significance because of their protective capability and because of their usefulness in a variety of ways, including recreation. Pressure of population and the problem of food production are powerful influences tending to reduce the total of forested areas but considerable thought and care should be exercised before any such reductions are carried out. Climatic change and fluctuations can be compensated much more effectively if forests cover a great part of the earth's surface, with a good regional distribution and in balance with the other requirements of mankind.
SELECTED REFERENCES
ASHTON, P.S. and BRUNIG, E. F. (1975). The variation of tropical moist forest in relation to environmental factors and its relevance to land-use planning. Mitt. B. F.-A. f. Forst- u. Holz-wirtschaft Hamburg Nr. 109, 59-86.
BAUMGARTNER, A. (1966). Energetic basis for differential vaporization from forests and agricultural lands. In: Forest Hydrology, 381-389, Pergamon Press, Oxford.
- 279 -
BAUMGARTNER, A. (1970). Water and energy balances of different vegetation covers. Ass. Sci. Hydro!. Proc. Reading Sympos.
BAUMGARTNER, A. (1971). Einfluss energetischer Faktoren auf Klima, Produktion und Wasserumsatz in bewaldeten Einzugsgebieten. IUFRO, 15. World Congr. Gainsville, USA, Proc. pp. 75-90.
BAUMGARTNER, A. (1976). Tropical forests and the biosphere. Unesco,to be published
FOOD AND AGRICULTURE ORGANIZATION (1976). World forest inventory 1958, Rome.
FOOD AND AGRICULTURE ORGANIZATION (1972). Environmental aspects of natural resources management: Forestry. Basic Doe. Stockholm, Agenda Item II (a) ii.
FRITTS, H.C. (1977). Tree rings and climate. Acad. Press, London and New York, pp. 568.
KIRCHNER, M. (1977). Anthropogene EinflUsse auf die Oberflachenalbedo und die Parameter des Austausches an der Grenze Erde/Atmosphare. Wiss. Mitt. Meteor. Inst; MUnchen 1977.
LIETH, H. (1974). der Pflanzen.
Basis und Grenze fUr die Menschheitsentwicklung: Umschau, Frankfurt, Vol. 74, 6, pp. 169-174.
Stoffproduktion
MIKOLA, P. (1971). Reflexion of climatic fluctuations in the forestry practices of northern Finland. Rep. Kevo Subarctic Res. Stat. Vol. 8, pp. 116-121.
MOLION, L.C.B. (1975). A climatonomy study of the energy and moisture fluxes of the Amazon basin with considerations of deforestation effects. Diss. Univ. Wise., USA, Met. Dept.
NEWELL, R.E. (1971). The Amazon forest and the atmospheric general circulation. In: W.H. Matthews, W.W. Kellogg, G.D. Robinson (Eds.) Man's impact on the climate. Cambridge, Mass. MIT Press, pp. 457-459.
POTTER, G.L., ELLSAESSER, H.W., MacCRACKEN, M.C. and LUTHER, F.M. (1975). Possible impact of tropical deforestation. Nature, Vol. 258, pp. 697-698.
WILLIAMS, J. (1977). Experiments to study the effects on simulated changes in albedo, surface roughness and surface hydrology. In: Proc. IIASA Workshop, Dec. 76 CP 77-9 Laxenburg, pp. 59-67.
CLIMATIC VARIATION AND MARINE FISHERIES *
D. H. Gushing**
1. Introduction
A fish population comprises a stock of adult mature animals aged from two, three or five years to five, ten or twenty years. It is augmented each year by a recruiting year class which replaces the annual deaths in the stock. The variability of recruitment is high (about an order of magnitude or more) but the variation in stock is much less because the differences in year class strength ore reduced by the number of age groups in the stock.
Fishermen have been aware that weather affects fishing and that climate affects stocks. They expect stocks of herring-like fishes to appear or disappear witbin the lifetime of a man, but they expect stocks of cod-like fishes to persist. Fisheries biologists have attempted to relate the annual variation in year class strength, in recruitment, to climatic factors, but in general they have not been successful.
2. The observed link between climate and fisheries
There ore two important observed links, albeit on a relatively small scale, between fisheries and climatic changes. Ottestad L!/ correlated differences in the magnitude of year classes recruiting to the Arcto-Norwegian cod stock, which spawn in the Vestfjord in northern Norway, to differences in the widths of tree rings on pines (pinus silvestris) that grow in the area. As index of recruiting year classes, catches were lagged by seven years (the mean age of recruitment) to the year of hatching. In the tree ring material, four periods were detected which were added after adjustment of scales and the curve constructed in this way was fitted to the lagged catch data by least squares for eighty-five observations (i.e. for nearly a century). Zupanovich ~has carried out a similar analysis on the Adriatic sardine. Thus there is a general but unspecified link between annual recruitment and annual differences in climate or weather.
Templeman ~examined the recruitments to ten stocks of cod and herring between 1902 and 1962 and classified them on an arbitrary scale. He found that OIJtstanding year classes in certain years were common throughout the North Atlantic. For example, the 1904 year class of the Norwegian herring, with which the recent Norwegian period started (see below), was also an outstanding one for the ArctoNorwegian cod and the Icelandic haddock. In 1950 all stocks of cod-like fishes and herring in the North Atlantic except the Georges Bank haddock yielded outstanding
* Attached to this paper as an appendix is a contribution on "The Effects of Climatic Change on Inland Fisheries" by R. L. Welcomme.
ir* Fisheries Laboratory, Ministry of Agriculture, Fisheries and Food, Lowestoft, Suffolk, U.K.
- 281 -
year classes. The common year classes across the North Atlantic suggest that the annual differences in climate and weather as affecting the fish stocks are pervasive on an oceanic scale.
3. Where is the link effective during the life history of fishes?
Eggs are spawned on the same ground year after year, usually in the midwater, but sometimes on the seabed. The numbers of eggs are a function of stock and it is difficult to see how physical factors can affect them for they are strong enough to resist the stresses of turbulence. The larvae drift from fixed spawning ground to fixed nursery ground in temperate waters and grow into the production cycle or the spring outburst of plankton, as shown by Cushing Li7 for the herring populations in the northeast Atlantic. The spring outburst varies each year in amplitude, sprend and time of onset L[7 due to annual differences in wind strength and direction~ and in solar radiation IJ]. Hence the larval drift is a period during which physical factors could affect the numbers that survive.
The magnitude of recruitment of a number of fish species is probably determined during th~ first year of life or so (Young Fish Surveys of the International Council for the Exploration of the Sea); indeed such quantities are used in the working groups of that Council to estimate the TACs (Total Allowable Catches) for each stock in the northeast Atlantic. It is possible that the magnitude of recruitment is determined not entirely during the larval drift, but also during the phase after metamorphosis on the beaches or on banks in relatively shallow water. But there the effect of physical factors is harder to discern. In the larval drift, variation in time of onset of the spring outburst due to well-defined physical factors may be linked to annual differences in available food. Thus, taking a preliminary view, the larval drift is considered to be the period in the life histcry when the magnitude of recruitment might be determined.
4. The recent warm period
The recent warm period is conveniently shown LQ7 in the trend of mean anomalies of surface air temperature in the northern hemisphere as deviations from the mean of five-year periods between 1880 and 1969. The anomalies increased to a maximum of 0.4 deg C in about 1945 after which they declined. The decline is associated with weakened westerlies and long waves in that wind-system.
The period of warmth was associated with the movement of some of the larger and more conspicuous animals into higher latitudes. Subtropical animals appeared off California, in the Bay of Fundy, off the British coast and as far north as the F~roe Islands and Iceland; boreal forms were found off West Greenland, north and east of Iceland, off Svalbard and off the Murman coast. Most of the records date from the decade 1925-35.
The most dramatic invasion during the period of warming was the rise and fall "f the West Greenland cod fishery. Cod larvae spawned off southern Iceland, drift in the Irminger current towards the East Greenland current and as post-larvae or 0-group

- 282 -
fish are carr1ed round Cape Farewell to West Greenland; some mature cod migrate back to Iceland f~m West Greenland to spawn and remain there until they die. A proportion of the stock remains off West Greenland as the stock was in the process of isolating itself from the Iceland one from which it originated and which sustained it.
During the late nineteenth century no cod were found on the offshore banks on various exploratory voyages. In 1908-10, a few were found there on the Tjalfe expedition and in 1912, 24 tons were caught. Annual catches were recorded in a northerly progress as follows: Julianehaab, (60°N), 1917; Godtihaab (64°N), 1919; Sukkertoppen (65°N), 1922; Holsteinsborg (66°N), 1927; Disko (68°N), 1931; 72°45'N, 1936. The stock was established off West Greenland with a series of strong year classes, 1917, 1922, 1926, 1934, 1936 and by the thirties annual catches had built up to 70 000 tons. Later year classes, 1945 and 1949, increased the stock again until catches in the fifties and early sixties reached as much as 450 000 tons. The last good year class appeared in 1963 and the last significant one in 1968. In recent years catches have been banned off West Greenland.
The distribution derived by Schmidt of cod eggs off Iceland in the first decade of the century may be compared with that found in the early sixties during the Norwestlant expedition. The later distribution is much more extensive, either because the stock was larger or because the Irminger current was stronger. As the Iceland stock was sustained by Greenland migrants, the stockmaywell have been smaller in Schmidt's time and the Irminger current stronger during the period of warming because of the the strengthened westerlies across the North Atlantic. The decline of the West Greenland stock may be illuminated by some discoveries of Dickson et al /9/. Between the decades 1930-39 and 1956-65, a shift of the Icelandic low south of Greenland generated easterly winds across the Denmark Strait. But by the later decade 1966-75, the Icelandic low shifted again, generating notherly winds in the Denmark Strait and the cod larvae could no longer travel to West Greenland.
The life of the West Greenland cod fishery between 1920 and 1970 represents the most dramtic movement of animals into high latitudes as a result of a succession of closely spacedyear lasses. Collapse was relatively sudden and the older fish were left to survive. There may be a connexion between the meteorological and oceanog~hic events. The Irminger current may, for example, have strengthened and weakened. Perhaps the brooder scales of migration are explicable in the same sort of way.
5. Long-term periods
Some fisheries flourish in periods of about a century. The presence or absence of the Norwegian herring alternates with that of the Swedish herring, as do periods of high and low catches of the Japanese sardine. The periods are not strongly defined. However, it seems clear that those of the Norwegian herring and Japanese sardine are periods of warming as incidentally are those of the Adriatic sardine. TheSwedish herring periods are periods of cooling when the Baltic froze. No such periodicity can be detected in the long term material on the Hokkaido herring. The ratio of numbers of scales of anchovy to those of sardines from anoxic sediments
- 283 -
off California show that the sardine period might have corresponded to the period of warming indicated by the Norwegian herring period. Similarly catches of sardines off Japan, California, Spain and Yugoslavia between 1905 and 1960 /2/ all reflect the period of warming associated with the Norwegian herring. An index of recruitment for cod-like fishes /10/ based on all stocks in the North Atlantic again shows the period of warming which reached a peak in 1950 after which it declined, but was succeeded by the gadoid outburst in the North Sea which started in 1962 and which still continues.
Such secular records betray a periodicity of about a century or so. The recent period of warming, which can be shown by atmospheric temperature anomalies in the northern hemisphere or by the distribution of westerlies across the British Isles, appears to be indicated very clearly by fluctuations in fisheries. Sometimes the f~uctuations are shown as presence or absence, and sometimes merely in catches. The climatic fluctuations are not of great amplitude, but those in the fisheries are, as if there were a rectifier in the circuit.
The theoretical dependence of annual recruitment on parent stock forms a convex or dome-shaped curve. Normally any perturbation, or annual recruitment, will tend to return the stock to the point of stabilization at which the curve cuts the bisector. If, however, there is a sequence of low recruitments below the bisector at low stock or high ones above it at high stock, the stock can decrease or increase by orders of magnitude. This mechanism provides the rectification of climatic change that seems to be observed. The shape of the curve appears to differ, dome-shaped in cod-like fishes and slightly convex in herring-like ones; the former are resilient and can withstand environmental changes, whereas the latter must respond to such changes, thus giving the rectifying character to the herring periods.
Between 1925 and 1935 a series of changes occurred in the ecosystem 1n the Western Channel which reversed in 1965-1975, the Russell cycle. In 1930-1 macroplankton was reduced by a factor of four, the winter phosphorus was reduced by one third; subsequently the numbers of spring spawned larvae were reduced, as were those of summer spawners in 1935. A local herring population lost its recruiting year classes from 1926 (the year of hatching) onwards and was replaced by a pilchard population by 1935 (Cushing /11/). Such changes were very sharp and show the same character of rectification observed amongst fish catches for very long time periods. Therefore the mechanism proposed in the form of the stock recruitment relationship may apply not only to single populations but also to ecosystems, which after all are no more than groups of populations. The period observed in the Russell cycles was, of course, that of the recent warm period.
6. Short-term periods
Short-term periods include annual fluctuations within decades or parts of decades. Series of recruitments to a number of well-known fish stocks for some decades are now available, Most are estimated by cohort analysis; that for the Norwegian herring was calculated by the method of virtual populations, i.e. the sums of catches by age groups, and that for the Karluk river salmon was estimated from the escapements (i.e. the stock that is about to spawn) /12/. All three methods estimate stock in one way or another. In general the variation in recruitment is
- 284 -
about an order of magnitude, although that of the salmon is less and that of the Norwegian herring is greater. There are upward or downward trends for herring and salmon, but those for cod fluctuate about a mean. In other words as indicated by the shapes of the stock/recruitment curves, the salmon and herring are responding to climatic change from decade to decade, but the cod populations are not.
Another form of short-term periodicity is illustrated in the appearance of El Ni~o, the development of the anchoveta fishery and its subsequent collapse. The bird population survived the El Nino of 1967-8, i.e. the population recovered, but after that of 1965, it was reduced from 18 m~llion to 4 million and after that of 1972-3, it was further reduced to 1 million. Thus the birds have suffered in competition with the fishermen. An interestrg point is that recruitment in the period 1965-70 increased by a factor of 1.6 as compared with 1960-4,i.e., after the 1966 El Nino when the bird population was first reduced. This suggests that the recruiting anchoveta were eaten by young birds which remained in Peru when the adults had migrated after the breeding season. Thus El Nino affects a predator-prey relationship with a periodicity of between five and ten years.
Changes in various components of the plQnkton in the North Sea and the North Atlantic have been recorded between 1948 and 1972. The time of onset of the spring outburst has been delayed by up to a month and the numbers of copepods or zooplankton biomass have been reduced considerably, suggesting that a fundamental change in the production processes took place in the early sixties which is when the gadoid outburst in the North Sea occurred.
In temperate waters fish tend to spawn at a fixed season; the peak date of spawning has a standard error of about a week. The production of fish lorvae may .be matched or mismatched to that of their food. The production of larval food is highly variable in time because it depends on the time of onset of the spring outbu~st. The production of larval fish is inversely proportional to a power function of temperatur~i.e. development is accelerated a little in warm water but is considerably delayed in cold water. If production of larvae is matched to that of larval food there is much overlap between the two distributions and they are mismatched when the overlap is reduced. Thus the variability in recruitment could be accounted for by the degree of match or mismatch. At high stock for the same degree of mismatch, the overlap is greater which may account for the reduced variability in recruitment at high stock as compared with low stock.
If this hypothesis is true, the climatic factors involved would be wind strength, wind direction and solar radiation.
7. Conclusion
The match-mismatch hypotheses would account for the annual fluctuations in recruitment, its variability of about one order of magnitude. The upward or downward trends are accounted for in the shape of the stock-recruitment curve as indicated above. The rectification of climatic periods in the long term is probably associated with a succession of very poor or very rich year classes as decribed above.

- 285 -
REFERENCES
L!/ OTTESTAD, P. (1960). Forecasting the annual yield in sea fisheries. Nature, London, 185, 4707: 183.
/2/ ZUPANOVITCH, S. (1968). Causes of fluctuations in sardine catches along the eastern coast of the Adriatic Sea. Anali Jadranskog Instituta IV. 401-489.
~ TEMPLEMAN, W. (1965). Relation of periods of successful year closes of haddock on the Grand Bank to periods of success of year classes for cod, haddock and herring in areas to the north and east. Spec. Publ. ICNAF ENV. Symp. 6: 523-533.
/4/ GUSHING, D.H. (1967)., The grouping of herring population, J, Mar. Biol. Ass. UK. NS 47 193-208.
L§/ COLEBROOK, J.M. (1965). On the analysis of variation in the plankton, the environment and the fisheries. Spec. Publ. Int. Comm. NW. Atl. Fish. 6. 291-302.
/67 STEELE, J. H. (1958). Plant production in the northern North Sea. Mar. Res. Scot. 1958. 7. 36 pp.
/7/ DICKSON, R.R. (1971). A recurrent and persistent pressure anomaly pattern as the principal cause of intermediate scale hydrographic variation in the European Shelf Sea. Dt. Hydrogr" Z 24 (3) 97-119.
/8/ GUSHING, D.H. and DICKSON, R.R. (1976). The Biological Response 1n the Sea to Climatic Changes. Adv. Mar. Biol. 14: 1-22.
/9/ DICKSON, R. R., LAMB, H. H., MALMSBERG, S. A. and COLEBROOK, J. M. (1975). Climatic reversal in northern North Atlantic. Nature, London, 256. 5517. 479-82.
/10/ TEMPLEMAN, W. (1972). Year class success in some North Atlantic stocks of cod and haddock. Spec. Publ. Int. Comm. NW Atl. Fish. 8. 223-239.
/11/ GUSHING, D. H. (1961). On the failure of the Plymouth herring fishery. J. Mar. Biol. Ass. UK. NS 41 799-816.
/12/ ROUNSEFELL, G. A. (1958), Factors causing decline in sockeye salmon of Karluk River. Alaska US Fish and Wildlife Service. Fish. Bull. 58 (130) 83-169.
*
* *
- 286 -
A P P E N D I X
THE EFFECTS OF CLIMATIC CHANGES ON INLAND FISHERIES
R. L. Welcomme*
1. Introduction
The fisheries of inland waters are mostly located on relatively small bodies of water, or on water courses that are sensitiv~ to changes in climate~ Lakes can increase or decrease in size, and rivers may be swollen by floods or reduced by droughts to the advantage or detriment of the fish species contained therein. Many such changes have taken place during the last few decades and the corresponding effects on the fish populations have been observed. The severity of some of these changes, such as those that took place in the Sahelian rivers of Africa in the early 1970s have given cause for concern and future policies for the development and management of this region rest heavily on assumptions as to future climatic patterns. Fisheries are not the only users of the world's inland waters, and the increasing demand for water for a great variety of purposes is creating a situation where the equilibrium of supply is increasingly liable to be upset by even minor rihanges in any one of a number of climatic parameters. Some of the information available has been assembled in this paper in order to assist in assessing the impacts of recent changes in climate on inland fish production.
2. Effects of Climatic Factors on Fish
Various climatic factors may operate upon fish, either directly through their physiology, or indirectly through modifications to the ecosystem. Most notable, perhaps, of the direct reactions are those resulting from changes in temperature. The growth of individual fish is closely allied to the temperature of the water. Improved growth in warmer water arises both from the higher primary productivity of waters at higher temperatures and from the internal physiological processes of the fish which proceed at a faster rate. Cold season checks to growth are well known in species from temperate waters, and with reason; the warmer the water and the longer the duration of the warm period, the better the growth of the fish. Temperature is also closely linked with breeding behaviour. Many species will not breed until the water warms beyond a certain point; others require a drop in temperature to come to maturity and reproduce. Other climatic factors, such as the degree of insolation, are influenced by cloud cover, or climate-dependent environmental variables, s0ch as changes in water quality and quantity associated with rainfall. These factors can act as physiological stimuli, particularly for the timing of the onset of reproduction. Fish have poor breeding success in years in which the appropriate conditions are not fulfilled and if several bad years are bunched together, as they often are, longer term changes in the abundance or even the distribution of the species can result.
* United Nations Food and Agriculture Organization, Rom~ Italy.
- 287 -
Indirect effects, where the climatic factor influences the environment in which fish live, are more numerous. The principal factors are those which determine the area of water or living space available to the fish. Many lakes in the tropics are well known for their periodic expansions and contractions. Such fluctuations in level can change not only the productivity of the water bodies in terms of fish catch, but also the whole structure of the fish community which lives in them. Most riverine fish populations depend on the floodplains associated with the river for feeding and breeding during the wet season. The catch of fish in the flood zones has been directly correlated with the intensity of the floods in_£revious years, higher floods in one year giving better catches a year or two later /1/. The response of fish to flood conditions is not only dependent on the quantity of the flood, but also on the form of the flood curve and its timeliness. Even slight changes in rainfall patterns can sufficiently disturb the pattern of flooding as to create differences in the effectiveness of reproduction. There are indeed many species that either fail to breed or where the young fail to survive in years of delayed or insufficient flooding. This, together with the ability of other species to adapt to changes in conditions, can lead to quite extreme changes in species composition within the fish community. Conversely effects have been observed in lakes as well as in floodplains or swamps where higher than normal floods have produced a surge of production. In these cases there is, of course, an increase in general productivity because of the nutrients released from the newly flooded land, but there is also an increase in new habitats, lack of which may have been limiting to some species as nurseries or breeding grounds.
Needless to say, long-term climatic change (over millennia) has been implicated in speciation and in the disappearance or extinction of many stocks of fish. Equally, climate-induced changes in vegetation cover can alter the whole nature of a river system, changing it, for example, from a forested river to one of savanna type. Fish communities inhabiting the two types of system are very different, not only in terms of their species composition, but also their productivity patterns. Such arguments may seem of only intellectual interest, but in fact, there is much doubt as to the suddenness with which such climatic changes occur.
3. Case Histories
As examples of the ways in which these mechanisms, work, let us take two cases from Africa. Here the fish communities concerned form the basis for important fisheries, and the waters, in some cases, are needed for other purposes such as irrigation; there is therefore a considerable human pressure on the fish stock which aggravates the climatic effect.
The Sahelian Zone covers a large part of three major basins, the Senegal River, the Niger River and the Lake Chad-Chari/Logone River complex. The estimated fish catch from the Sahelian part of these three systems together was 220 000 t in 1971. However, since 1962 there has been a progressive decline in precipitation over much of the region. The level of Lake Chad itself was progressively lowered, and the floods were below average in several years from 1968 onwards. Recruitment failed in
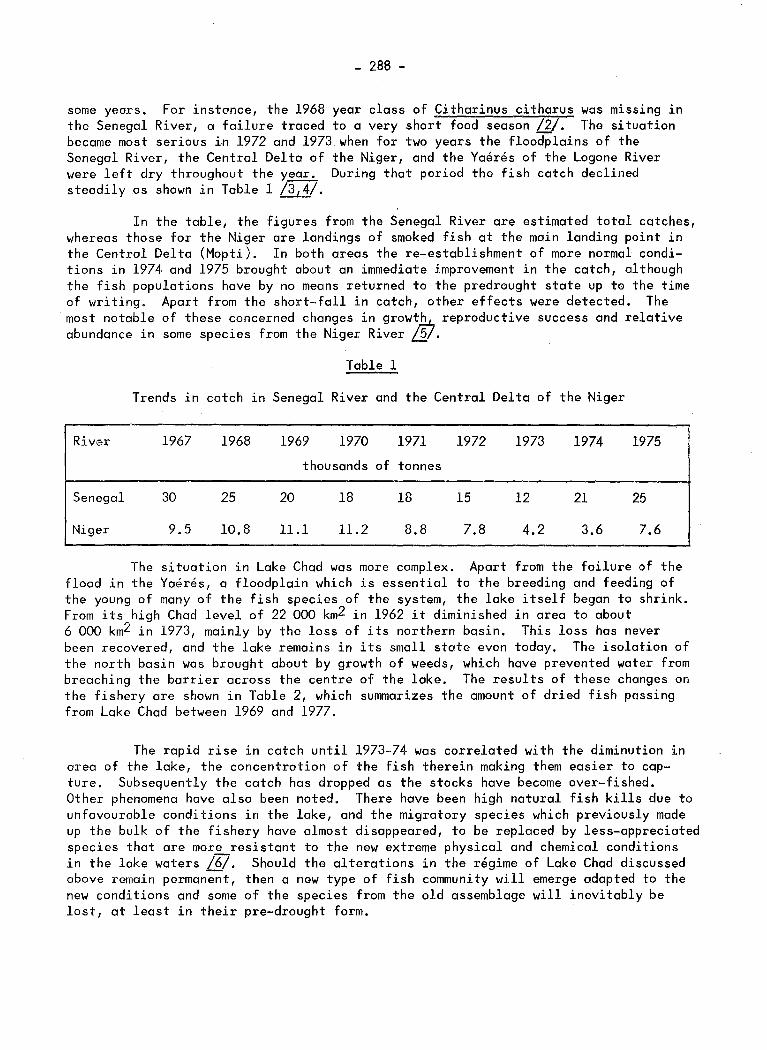
- 288 -
some years. For instance, the 1968 year class of Citharinus citharus was missing in the Senegal River, a failure traced to a very short food season /2/. The situation became most serious in 1972 and 1973 when for two years the floodplains of the Senegal River, the Central Delta of the Niger, and the Yaeres of the Logone River were left dry throughout the year. During that period the fish catch declined steadily as shown in Table 1 /3,4/.
In the table, the figures from the Senegal River are estimated total catches, whereas those for the Niger are landings of smoked fish at the main landing point in the Central Delta (Mopti). In both areas the re-establishment of more normal conditions in 1974 and 1975 brought about an immediate improvement in the catch, although the fish populations have by no means returned to the predrought state up to the time of writing. Apart from the short-fall in catch, other effects were detected. The most notable of these concerned changes in growt~ reproductive success and relative abundance in some species from the Niger River /5/.
Table 1
Trends in catch in Senegal River and the Central Delta of the Niger
River 1967 1968 1969 1970 1971 1972 1973 1974 1975
thousands of tonnes
Senegal 30 25 20 18 18 15 12 21 25
Niger 9.5 10.8 11.1 11.2 8.8 7.8 4.2 3.6 7.6
The situation in Lake Chad was more complex. Apart from the failure of the flood in the Yaeres, a floodplain which is essential to the breeding and feeding of the young of many of the fish species of the system, the lake itself began to shrink. From its high Chad level of 22 000 km2 in 1962 it diminished in area to about 6 000 km2 in 1973, mainly by the loss of its northern basin. This loss has never been recovered, and the lake remains in its small state even today. The isolation of the north basin was brought about by growth of weeds, which have prevented water from breaching the barrier across the centre of the lake. The results of these changes on the fishery are shown in Table 2, which summarizes the amount of dried fish passing from Lake Chad between 1969 and 1977.
The rapid rise in catch until 1973-74 was correlated with the diminution in area of the lake, the concentration of the fish therein making them easier to capture. Subsequently the catch has dropped as the stocks have become over-fished. Other phenomena have also been noted. There have been high natural fish kills due to unfavourable conditions in the lake, and the migratory species which previously made up the bulk of the fishery have almost disappeared, to be replaced by less-appreciated species that are mor£_resistant to the new extreme physical and chemical conditions in the lake waters /6/. Should the alterations in the regime of Lake Chad discussed above remain perman~t, then a new type of fish community will emerge adapted to the new conditions and some of the species from the old assemblage will inevitably be lost, at least in their pre-drought form.

- 289 -
Table 2
Dried fish passing control points leading from Lake Chad
Year
1969-70
1970-71
1971-72
1972-73
1973-74
1974-75
1975-76
1976-77
East Africa ------
Total Dried Fish
tonnes
8 760
11 939
20 722
28 535
34 840
26 862
14 483
13 422
The changes in the level of Lake Chad are by no means unique. In East Africa, a rise in the level of Lake Victoria of over 1 m occurred in 1959-60. The new level has been maintained ever since. The availability of extensive favourable habitats at the margins of the lake, led to a rise in abundance of certain species of fish, but in subsequent years there appeared to be a return to pre-rise conditions. In some cases the change itself seemed to be more significant than the relatively stable stocks on each side. From a fisheries point of view, tlte rise in lake level of Mweru-wa-Ntipa, from 1962-1964, of 6 m was a significant event in Zambia, quadrupling the average commercial harvest. The lake has also a long history of variability, having been nearly dry in 1949-50 (with mass mortalities of fish, hippopotami and crocodiles). It dried up previously in 1931, 1918-19 and in 1895-96 insofar as recorded observations indicate. The present catch is some 15per cent of the total fish catch of Zambia, hence an assessment of the probability of a return to lower levels is of considerable interest to the country.
Another case in the region noted for variations 1n level is Lake Chilwa, Malawi. The lake has a very low diversity of fish species, 13 species having been recorded, with only three of sufficient abundance to be of commercial interest. As in Lake Mweru-wa-Ntipa, such low diversity is evidently one result of the fluctuation in level, while the physiological tolerance to environmental changes of these species appears also to be high. Unlike Mweru-wa-Ntipa, Chilwa has no obligate predator (the important catfish Clarias has broad food habits) a factor which was to help recovery of the populations following a period of severe desiccation. However, from a development point of view, the important feature is the extreme fluctuation in harvest ranging from almost 10 000 t (40percent of catches, Malawi) at high water (1965) to lOO t at extreme low water (1968), when the lake dried up completely. At the latter

- 290 -
time, the fish move up into the feeder river or perhaps burrow in the mud, and recovery is remarkably fast, though by no means immediate, with return of the water. Acceleration of the recovery of the lake appears to be possible through stocking, though it is somewhat doubtful that the occasional restocking needed would indeed be economic. Many of the fishermen are migrants and, for the more permanent ones, fishing is a catch crop supplemented by farming and other activities.
4. Conclusions
It may be concluded that fluctuations in the catch of fish in most inland waters have been associated with climatic changes for many years. Indeed the various climatic manifestations appear as a major regulator of fish populations in all but the largest bodies of water. Furthermore, where a fish stock is under severe stress from other sources, such as overfishing or pollution, even slight variations in climate may have considerable impacts on the species composition of fish ~ommunity and ultimately on its yield patterns.
REFERENCES
/1/ WELCOMME, R.L. (in press), Fisheries Ecology of Floodplain Rivers. London, Longman. (to appear December 1978).
/2/ REIZER, C., (1974). Definition d'une politique d'amenagement des resources halieutiques d'un ecosyst~me aquatique complex pour l'etude de son environnement abiotique, biotique et anthropique. Docteur en Sciences de l'Environnement. Dissertation Arlon, Fondation Universitaire Luxembourgeoise, 4 vols: 525 pp.
/3/ KONARE, A., (1977). Collecte, traitement et commercialisation du poisson en plaines inondables. In CIFA Working Party on River and Floodplain Fisheries, Contributions~y members of the Working Party, pp. 32-45 (mimeo).
SENEGAL, Direction des Eaux, For&ts et Chasses. (1976). La piche continentale: preparation du Ve plan de developpement economique et social. Dakar, p. 10 (mimeo).
DANSOKO, D., BREMAN, H. and DAGET, J. (1976). Influence de la secheresse sur les populations d'Hydrocynus dans le delta central du Niger. Cah.ORSTOM (Hydrobiol), 10(2):71-6.
QUENSIERE, J., (1976). Influence de la secheresse sur les picheries du delta du Chari (1971-1973). Cah.ORSTOM (Hydrobiol.), 10(1):3-18.
CLIMATIC VARIABILITY, MARINE RESOURCES AND OFFSHORE DEVELOPMENT
T. F. Gaskell*
L Introduction
The oceans, occupying more than double the land surface area of the earth, naturally affect the world's climate and weather, The sea, particularly the shallow continental shelf zones, are potential sources of supply of raw materials for a rapidly expanding world population. The h~rvesting of mineral wealth from·the oceans is affected to a large extent by the climate and by weather. In turn, the operations involved in extracting minerals may conceivably, if carried out on a large enough scale, upset the balance of heatreceived and emitted and so affect the climate locally or regionally, or even, by some remotely possible triggering action, change the world climate.
The search for offshore oil is already extending to polar areas, and the problems of navigation in ice-infested waters, which have been relevant to world trade for centurie~ are becoming increasingly important. If adequate planning for world energy supplies is to be made twenty or more years ahead, it is desirable to know whether any significant change in the extent of ice-sheets is liable to occur so that optimum decisions may be made when several different strategic courses are possible. The increases in population and in individual wealth call for extensive increases in the number of ports and harbours and recreational facilities in the coastal zones, especially in what have until recently been remote, semi-explored regions where little study has been made of the extremes of climate or weather. In choosing where to carry out new dev~ments, it is desirable to take advice from those who have gained experience in the already industrialized parts of the world and to take note of the best meteorological knowledge that can be applied.
Marine resources, apart from fisheries which are treated in a separate paper, can be taken to inciude offshore oil production, metallic nodules, rich brines, sediments on the sea bed and chemicals from sea water. The location and use of these marine resources are affected by the change in climate in two ways, which are at the extreme ends of the time scale. The formation of oil and rich sea-floor nodules, and the chemical constituents of sea-water, are the result of geological processes that have continued for hundreds of millions of years. From what has been learnt about the formation of these minerals, it is clear that each has its own particular set of environmental conditions which have been conducive to formation and concentration into what are today deposits which can be produced economically. On the other hand, the difficulties that beset the production engineer and the scientist who explore and extract the mineral wealth, are associated with wind and waves which are short term weather effects for which accurate forecasts are needed.
*Oil Industrylnternational Exploration and Production Forum, London, U.K.
- 292 -
The climatic variations being described at this Conference are of importance both to the meteorologist who is continually trying to upgrade his ability to explain them and to the long-term needs of the explorer who understands past geological conditions through observations of what is happening today. A further more direct application of the mechanisms of change of variables such as temperature and wind-patterns is in the planning of offshore structures and coastal engineering works, which must be designed to stand for peiiods ranging from decades to centuries in spite of any changes of climate. In general, the geographical spread of mineral concentrouons is world wide, and creates a wide range of climate in which operations such as those of the oil industry must be carried out. Techniques and people must both be adaptable to wide variations of climate. For puroses of planning, suitable knowledge of the likely fluctuations of climate is necessary. These climatic variations ore considered by the oil industry at all times and in this sense are different from probl~ms such os the El Nin~ which affects the fisheries industry in one particular region (off South America's west coast) over a spread of years.
2. Mineral formation
Geophysics forms the main discovery tool in offshore oil exploration, but a preliminary geological assessment, based portly on consideration of past geographical
environments which should hove been suitable to oil formation and accumulation, is essential. It is in this port of the exploration programme that the knowledge of climauc variation and, especially, the mechanisms that determine climatic change ore valuable to the oil geologist.
The North Sea provides a recent example of how past climates have affected the rock strata and hove provided conditions suitable for the laying down of gas and oil deposits. During the past few hundred million years, when today's rock series were being formed, the climate was not only affected by world-wide changes, but the wind-pattern at the earth's surface and the current distribution in the oceans were revolutionized by the lateral drifting of continents.
The drifting apart of continents, such os is taking place to form the Atlantic Ocean, has a direct consequence in the Red Sea in the production of potentially valuable deposits of minerolly enriched brines and sediments. The Red Sea is similar to the mid-Atlantic rise in being an active zone where 'plates' of crystal rock are being forced apart by upward pushing of hot volcanic material. This heat has produced the mineral concentrations that are observed at the sea-bed, and an understanding of the processes that are in progress should make it possible to locate similar mineral-rich zones in other parts of the world.
Over a hundred years ago, oceanographers discovered vast deposits of manganese nodules on the floor of the deep oceans in many parts of the world. These nodules contain iron and manganese, which have been deposited fna·m sea water in suitable conditions of water acidity and temperature; small quantities of nickel, copper and cobalt have been added to the main deposit, and the nodules form a valuable source of these minerals. The latterwillone day become very expensive when land-based concentrations are used. The formation of the nodules and particularly the variations of the valuable metallic constituents, depend on climatic conditions and for a better understanding of the depositional processes a continuing association of chemistry, geology and climatology is needed.

- 293 -
Other minerals that are extracted from the sea-bed include gravel, tin and diamonds whose location is near shore and is related to the adjacent geology on land and to the rivers that provide the alluvial deposits.
The sea contains vast quantities of minerals, but few are extracted, on account of the extreme dilution in which they are present. At the present time, salt (sodium chloride), fresh water, magnesium, bromine and iodine are obtained commerciall~ The oceans have been thoroughly stirred in the course of geological time so that climatic changes have no effect on the average composition of sea water, although it is, of course, the climatic cycle of water circulation between land, sea and air, with the accompanying erosion of the land, that accounts for the mineral content of sea water. Although these other minerals do not require the detailed climatic know-
ledge that is so useful in oil exploration, their production may raise problems concerned with the weather and climate. If fresh water may truly be considered as a marine resource, some knowledge of trends in climatic variation may be important when de-salination plants for the production of fresh water are being planned.
3. Mineral production
For the fundamental design criteria of offshore drilling vessels, the structural engineer calls for wave height and period, in particular the largest wave that may occur in a period of 50-100 years. The oil industry has followed and initiated much work both in measuring wave characteristics in operational areas such as the North Sea, and in assessing the relative merits of various methods of extrapolation used in estimating 50 or lOO year waves. In the North Sea, different wave criteria were used by government supervisory bodies in Norway and Britai~ and one aspect of international discussions of the climatic impact on various types of human activity could usefully be an agreed set of figures in any particular area. The same need arises for standardization applied to wind speed maxima to be used in design.
Offshore oil may exist in almost any continental shelf area of the world, and lessons may well be provided by North Sea experience to those who have to operate in other parts of the world. The North Sea work was preceded by extensive oil production in the Gulf of Mexico and in the Persian Gulf. In both instances, the weather was generally less severe than in the North Sea, since, although hurricanes occur a few times a year in the Gulf of Mexico, they cover a comparatively narrow damaging track and are not so harassing to the oil industry as in the almost continuous winter storm weather of the North Sea. In the Gulf of Mexico, many government recording stations provided a good backlog of climatic data on which design plans could be based. In the Persian Gulf, the weather is not so severe, and there is a limited fetch, so that very long waves do not occur; but there was very little past observation twenty years ago when operations started, and the oil companies have now collected a useful coverage of pressure, wind and temperature measurements at about thirty reporting stations. Engineering design in this rapidly developing area can now be based on a reasonable sample of weather conditions. The only way to obtain such a sample of weather is to make the observations, and countries should be encouraged as early as possible to collect meteorological and oceanographical data.

- 294 -
For several years, offshore oil prospects have been considered in areas where ice presents a problem. Drilling has taken place off the Labrador coast, off Greenland and in the southwest of Alaska in the Beaufort Sea and in the Canadian Arctic islands. Expert knowledge is needed in any particular area to tell the designer of drilling and producton structures what is the ice-thickness, when the ice occurs, whether forecasts can be made of future ice behaviour and if possible the long-term trends. For example, observati~ns are published at times which suggest that glaciers are receding and a warm period is approaching for the northern temperate zone. If such a trend could be accurately demonstrated, it would be of invaluable help, not only in deciding which is the best of several possible operating techniques, but also in planning reserve strength of structures for future severe conditions, or vice-versa. The Viking settlements which were established in Greenland around 1 000 years ago, when the northern hemisphere was enjoying warmer weather than today, were abandoned in the fourteenth century when the 'Little Ice Age' set in and it was impossible to sail to supply the colonists. Some years ago, the Arctic ice advanced on Iceland, and has subsequently receeded. Are climatic variation studies well enough established to provide forecasts for several years ahead of how the ice-fronts will behave? Even if forecasts are only of a statistical nature, planning will be assisted if the behaviour of ice, together with fluctuations from the average, can be given, so that the mean length of the operating season over a period of years can be used in the economic assessment of the situation.
A considerable amount of work along these lines has been done by the Canadian Government Department of Fisheries and Environment in the course of their excellent Beaufort Sea project. This practical and theoretical investigation prQvides a fine example to governments of the world in collectingoceanographicaland meteorological information of practical use not only to the oil industry but also to other potential users of Arctic areas. The Ice Climatology study is based upon such data as twenty years of observation of ice-sheet movement in the North Canadian Sea areas. A summary of these results shows that a useful approach can be made in predicting the length of the operating season of free~ open water, from the weather pattern of the previous summer. Presumably similar correlations may be found for other parts of the world, especially ifkmMledge of meteorological models in Arctic regions is developed in association with the increasing research into climatic variation,
Although short-term forecasting of wind and waves is not strictly part of what is normally accepted as climatic variation, the accuracy of forecasts does depend on a good understanding of the mechanisms of climate, and as forecasts for longer periods are always being requested by oil operators, the importance of climatic models will increase. In addition to design criteria, which are needed also when planning new ports and recreational shore facilities, the oil industry is dependent on accurate forecasts of weather to ensure safety during critical operations such as the moving of exploration drilling platforms from one location to another or the laying of sub-sea pipelines. The forecasts need to be very good for 12 hour periods and good for 24 and 48 hours, and it is hoped that the improvements that have, been made in the past years will continue, so that reliable 3-day and 6-day forecasts may be available. In the Gulf of Mexico, the North Sea and the Persian. Gulf, the oil industry has found that close personal liaison between the forecaster and

- 295 -
the operations manager is essential for good working and in order to make the most of weather opportunities as they arise. Some government meteorological departments are providing oil comp~ny forecast services as well as collecting the basic data on which the forecasts are made, and one advantage of international discussion of the climatic impact on operations is to let meteorological offices throughout the world know the particular requirements of the oil industry, which differ, for example, from those of the air transport industry.
Wave forecasting was developed for war-time landing operations by Commander Southerns of the UK Royal Navy and by Professor Sverdrup at Scripps Institute of Oceanography. When offshore oil exploration began in the Gulf of Mexico, adequate knowledge was available to provide forecasts for long-term structural design and for day-to-day operations by specialized commercial organizations. In the Persian Gulf, it was necessary to provide the basic meteorological data before it was possible to make forecasts and oil companies in the Gulf area established some thirty reporting stations, some on land and some on offshore structures, which together with a ~uitable communication network have given twenty years good weather coverage. As a by-product the Oil Companies Weather Co-ordination Scheme (OCWCS) has produced several publications describing the conditions in the Gulf, and is hoping that the newly formed regional seas convention will rapidly take over the processing of the twenty years of accumulated wind speed, pressure and temperatllre data.
Weather forecasts are desirable for operating supply boats, and the 12 to 24 hours forecasts which are normally sufficient for critical operations such as moving drilling rigs or pulling out drill-pipe, need to be extended to several days when the distance from base to platform is over lOO miles. Some of the models being produced by national meteorological offices show promise of achieving long-term predictions. These may lead to a considerable saving in areas where rough weather is prevalent such as the North Sea, and may make it possible to pick out ahead of time the few days of calm 'weather windows', and thus avoid the cost of keeping expensive equipment such as floating cranes on station for weeks without doing any useful work. In this respect, forecasts of good seasons a year ahead, as appears to be possible with Arctic ice may be of great help in planning movement of the giant offshore structures that are being used for fixed production platforms. In all cases of forecasting for critical operations it is necessary for the design engineers to assess the vulnerability of their structures to wave forces and to give the forecaster the average and maximum wave height which can be tolerated with safety.
Some drilling has taken place during the past few years off the east coast of Canada, where there is a hazard from icebergs floating down from glaciers in Greenland. It is possible to nudge these menaces off collision course with offhsore structures, and any assistance from lo~term forecasts uf the probable frequency of ice~ergs will assist in planning stand-by tugs, etc. Short-term forecasts of potential ice formation and movement will be valuable in all offshore Arctic and Antarctic operations, and the industry needs advice on what parameters to measure at regular intervals to assist in this work.
The use of recently developed technical aids such as observation from satellites and by radar and the processing of data by computer is employed in oil
- 296 -
industry offshore work when these methods can provide useful supplementary information. An essential part of the forecast system is the method of communication which must be such that information is sent to operating bases with as little delay as possible. There is a fear that the modern trend towards centralization of information may make it difficult to obtain data where it is required in time for operational use. Direct links, especially with local reporting stations, could be important in providing rapid information rather than waiting for the same information to be broadcast hours later after compilation by a central collective. An allied concern is with the security of data. Traditionally, civil meteorological and Oceanographic data have been exchanged with the minimum of security cover and at no cost, and this has been essential to the development of adequate forecast services. There has been a tendency lately to regard collected data as being saleable amongst offshore users. Some data may reflect company interests or ~ctions, but generally routine observations do not fall into this category and free exchange of data should be required without restriction ar added cost. This particular problem may require more pressure from users, more co-ordination by government agencies and probably the injection of official funds in order to ensure that, as with the Beaufort Sea example provided by the Canadian Government, the best information needed for safety and environmental considerations, together with rapid development of national mineral resources, is forthcoming.
4. Ports and oil terminals
New ports, oil terminals and recreation beaches are rapidly growing in places where little in the way of topographical or oceanography survey or in meteorological and oceanographic measurements have been made. Although much of the information needed to plan this type of development is concerned with currents and movements of beach material, climatic considerations are most important. This is especially so, when it is remembered that, while oil installations may be required only for a few tens of years, ports and harbours tend to be used for centuries, and any long-term trends in climate may be of vital importance in a design that is to be adequate for the future.
One of the most active regions of the world at the present time is the Persian Gulf where there are many new oil installations of various types for exporting crude oil. As a consequence of the profit made from the oil, many new harbours are needed to export merchandise from industrialized countries and equipment to develop roads, housing and new manufacturing industry. Fortunately, in this area. as was noted in the discussion on weather forecasting, there are now available twenty years of good meteorological data. Although only a portion of this material has been worked up in a critical form able to be used by design engineers, the analysis is being carried out by the oil company group who have collected the data. For such places as Kharg Island, where some years ago a tanker loading terminal was built, the results have been used to guide the choice of site. It is important, when catering for the very large crude carriers that are used mday, to site the loading jetties so that the prevailing winds assist rather than hinder tankers coming alongside in order to luad. In the early days of reporting weather data, the OCWCS group was interested mainly in providing forecasts for purposes of critical movements of mobile

- 297 -
offshore drilling units, and the tanker side of the oil business co-operated fully in providing this information from their existing loading points. Now that a lengthy period of data collection has been achieved, the designers of terminals and har~urs are reaping the benefit of their early co-operation. Since many non-oil coastal works are now in progress or are being planned for the future, it is probably an opportune moment to speed the working up of the twenty years of data to make it available to all construction engineers and consultants. The opportunity exists now that a technical plan is being developed for the Regional Marine Meteorological Programme and also in view of the fact that a Convention has been agreed for the Protection and Development of the Marine Environment and the Coastal Areas of Bahrain, Iran, Iraq, Kuwait, Oman, Qatar, Saudi Arabia and the United Arab Emirates. Since the movement of oil slicks on the sea surface is mainly controlled by the wind, the weather data over as long a time as possible will be needed in order to calculate the probable ultimate landing place of oil that persists long enough to reach a beach. The action plan of the environmental programmes has already been agreed with a budget of US $6 320 000 for the next two and a half years and one of the most useful tasks that could be undertaken, without any delay since all the records are available and people to process them can be found by the consultant firm which holds the data, will be to finish the analysis and thus provide basic information needed for other work and at the same time demonstrate the activity and efficiency of the new organization.
It is only in the exceptional coastal regions of developing countries that data as comprehensive as that in the Persian Gulf are available. All efforts should be made for newly established meteorological offices to establish reporting points so that some idea of climatic parameters can be built up. This work will be assisted by observations from satellites and by co-operation through the World Meteorological Organization. For the purposes of holiday beaches, consideration of beach pollution and of coastal protection, information is needed of the prevailing wave direction and size at various seasons. In places where only a few years' measurments are available, help may be provided by improved climatic models and by analogy with areas of similargeographical situation.
5. Sea transport
For some years, ships have been routed across the Pacific Ocean, with the help of forward weather forecasts. The objectives are to save time and to avoid discomfort and ship damage by selecting a course around rather than th:ough . areas of severe storms. The technique has proved successful both to the sat1sfac!1on of captains of US Navy supply ships and more recently in saving money for commerc1al ship owners. It is clear that both short-term forecasting and long-term planning are involved in this type of work. In addition to avoiding loc~l storms~ seasonal changes may favour one particular route rather than an alterna~1ve, and 1n the longer term even changes in terminal points of the voyages m~y be a~v1~able. F~r the.latter, an understanding of the underlying forces that determ1ne var1at1on of cl1mate 1s valuable, even if only to give guidance of a statistical nature of the preference for one route over another.
- 298 -
One particular aspect of ship.>routeing which is becoming of increasing importance is concerned with voyages through ice-infested waters. It is here that trends in dlimate variation can influence planning decisions many years ahead, and also where long term forecasts can allow great saving by arranging ship passages at the optimum seasons. It is of course possible to tackle the ice problem in a direct manner by using large modern ice breakers and strengthened ships as• demonstrated by the USSR in their epic voyage through the Arctic ice to the North Pole. However, this does not mean that advantage should not be taken of climatic knowledge when planning operations in Arctic areas.
The Arctic Ocean may become as important as southern Alaska for the oil industry. The discovery at Prudhoe Bay and the exploration activity in the Beaufort Sea and in the North Canadian islands and in Siberia indicate that the land surrounding the Arctic Ocean could be one of the world's large oil producing areas. For offshore work, and for transporting oil, improved navigation of Arctic waters will be needed. The USS Manhattan experiment some years ago demonstrated the possibility of large tankers using the historical Canadian North West passage, and tankers may be a better solution than pipe lines in the Hudson Bay region. The increased knowledge of ice movement which is made possible by observation from satellites leads some meteorolog-
ists to forecast that in five years' time a sufficient advance will have been made in understanding ice movement in the Arctic and its correlation with measured weather pattern to produce a large computer model of the ice drift both in relevant regions and for the Arctic as a whole.
The Great Lakes of Canada and the USA provide an excellent example of the use of climate knowledge for inland water navigation. The US Coast Guard has been providing ice breaking services on the Great Lakes to meet the needs of commerce at least since World War II. Winter ice usually exceeds 90 per cent cover on Lake Erie, while Lake Superior, which is further north, is often less than 60 per cent ice covered during a normal winter. It is obvious that factors such as depth of the lakes, input from rivers that feed the lakes and actions of currents, winds, waves, etc., will affect the large ice floes that infest the waters. The usual work of collecting information of extent of seasonal ice-cover and the local weather pottern is being carried out by a combined operation funded by the riparian nations. It is hoped that this type of work will be followed by countries in all other parts of the world so that, firstly, a lead can be given by the good work being done by industrial countries, and secondly, the rest of the world will appreciate the value of the collection of weather information as soon as possible, so that when the need arises for the information, an adequate supporting back-log of data will be available.
Some of the schemes being considered in addition to the actual ice-breaking entail the use of air bubblers to stop ice formation by circulating warm bottom water and the use of booms which will deflect the ice-flow and protect the navigable channel. The strategic placing ~f nuclear power plants could assist in keeping the passage open by virtue of their warm water effluent. In planning for and deciding on the relative merits of these expensive projects a forward prognostication of climate trends is invaluable. There are conflicting interests between navigation and water intake for power plants which call for climate and weather information and increased
- 299 -
knowledge of ice formation~ For example, if heat from power stations is used to combat ice, it must either be controlled so as to permit forming of an ice cover upstream of hydroelectric plants or else must be massive enough to stop formation of 'frazil' ice, which is damaging to hydro plants. A report on the Lake Michigan ice cover in 1976-77, which was one of the four coldest winters in the past 80 years, demonstrates how any planning for navigation or plant sites must be based on the extremes of ice variation that can occur. It is interesting to note that extensive ice coverdevelops on Lake Michiqan only when the southern sub-region of the lake experiences a severe winter. Improvements in the use of radar methods for measuri.ng ice type and thickness from aircraft will allow more of this type of correlation to be established and will help in day-to-day and seasonal operations.
6. Climate and oil spills
The total production of oil in the world is around 2 500 - 3 000 million tons, equivalent to a volume of 4 to 5 cubic kms (about 1 cubic mile). The volume of the oceans is 360 million cubic miles (1 400 million cu. kms) so that provided sufficient mixing takes place, the small percentage of oil that is spilt (0.1%) becomes sufficiently diluted for it to get lost by natural processes. Since oil is formed in a marine environment from the decay of animal and plant matter, there are always hydrocarbons of a petroleum-like nature associated with recent sediments on the sea-bed, and there do not appear to be any animal or plant chains of life that concentrate hydrocarbons as is the case in some instances with heavy metals. However, oil normally floats on water, and it is possible that the average albedo of the earth could be significantly altered if a large proportion of the sea or ice of the world were covered with a thin film of oil.
The area of the seas is 370 million km2 so that the total annual production of oil would be needed to produce a 1 mm cover of the oceans. With an annual output to the sea of a few million tonnes, including tanker accidents, land-based effluents, tank washings, blow-outs and natural seepages, only a fraction of the sea surface will be covered to a thickness that forms a black patch which might increase the heat absorbed from the sun. Thinner films, such as the slicks which are the only sign of many oil spills, cover large local areas but are very short lived. The experiments made by government research departments such as the UK Warren Springs Laboratory indicate that in the North Sea, 10-ZO% of oil at ~he su:-fa•:e is mixed with the underlying water each 24 hours. The experience of blow-outs such as that in Norwegian waters a few years ago demonstrates that the oil slick disappears entirely in rough weather after a few days. The total oil pollution to the sea per year is therefore not the right figure to take when considering changes to the reflecting power of the sea, but rather the average spill for a few days or one hundred thousandth of the annual production. It is possible that more persistent oil slicks may obtain in ice bound regions, and these will be considered later in the light of experiments made in the Arctic Beaufort Sea.
The contribution from offshore oil production operations is about 60 000 tons a year, which is only 1-2% of the total oil spill from other sources. The figure for oil introduced into the sea from natural seepages is possibly greater than from other causes and is often underestimated because only those seepages close to the

- 300 -
shore have been identified. In cases where seepages have existed throughout historical times, there is no observable effect on the fauna and flora. Oil spills in the sea are probably more a nuisance value to human beings than a harmful agent to other animals or to the climate.
During discussions .on civil liability, it became apparent that there was a need to illustrate effectively and realistically the combined effects of clean-up activities and natural spill-reducing phenomena, and so predict the quantities of oil that could reach the shore. Estimates have been made of the amount of oil that might be emitted in a platform blow-out and the duration of the emission before the wells were brought under control. The known rate of evaporation from the surface film of oil and estimated amounts of oil that could be contained and picked up by booms, skimmers, etc., were fed into the analysis. The movement pf the oil slicks is determined by the wind speed and for this purpose the computer sel~cted random weather from determined meteorological data over the past three years. The weather conditions which, if severe, could hamper containment operations, would increase the loss of oil slick by natural mixing with the sea water. The removal of oil from the surface in this way was included in the programme based on rates of mixing determined by the UK Government research station at Warren Springs.
Although the SLIKTRAK programme is designed for random accidents to production wells in the North Sea sector, it can be readily adapted to other areas, and with smQll modification to replaying real incidents with actual weather data. The recent Ekofisk Bravo incident in the North Sea, where the total oil spilt was less than a quarter of the Torrey Canyon spills, and where the point of spill was more than 100 miles from shore, shows that the SLIKTRAK prognostications are on the right lines and if anything overrate the civil liability costs. The Bravo spill was, like accidents in the airline industry, due to a combination of human errors and fallibilities, and was put right by the opposite facet of human abilities, bravery, ingenuity and experience in adversity.
The computer programme provides not only a useful yardstick for legislation in other parts of the world, where extensive offshore oil production may develop but also shows on what beaches spills are likely to arrive, and the size of the cleanup problem that may be posed. It is probable that more experimental figures for evaporation and mixing of oil with water will be required for different climates, but, provided the meteorological data are available, the general lines of thought of the SLIKTRAK programme are applicable.
Considerable thought has been given by the Canadian Department of Fisheries and Environment to the effect of oil spill during oil exploration and production operations in the Beaufort Sea. This work extends the thinking underlying the SLIKTRAK programme. Because of the short summer drilling season, it is probable that no relief well could be drilled for more than a year, and so the blow-out may last longer than in, say, the North Sea. If oil is discovered in the Arctic, the intensive, development in the area will increase the possibility of oil spills, and the special conditions may call for exceptional clean-up and containment treatment.

- 301 -
The movement from an oil slick will be controlled by wind forces as in the SLIKTRAK model, but will be modified by the ice. Oil could be driven under an ice pack and carried considerable distances before being released. It is expected that mu~h thicker oil films will be produced in the presence of ice than in the open sea. The spreading of oil on the ice surface is usually retarded by snow cover and since the albedo of oiled snow is about one-third that of clean white snow, meltingwill be accelerated. The oil tends to form pools in depressions in the melting snow. 2 An expected blow-out in the Beaufort Sea expl~ration area could contaminate 7 700 km ~f ice. However, ''the amount of weathered oil which would be dispersed from a single well blow-out running wild for a year would be unlikely to have any effect whatsoever on global or even local climate. While it is certain that oiled ice will melt much faster than clean ice, natural fluctuations in the yearly ice-cover would mask the extremely small changes which would be caused by oil in the volumes assumed'' (Tech. Report no. 39- Beaufort Sea Project, Department of· the Environment, 1230 Government Street, Victoria, B.C.). Even if the blow-out ran for se·veral years, expert opinion does not believe that there will be an observable effect on climate, although there may be substantial environmental and social impacts.
CLIMATE AND ECONOMIC ACTIVITY
Ralph C. d'Arge*
1. Introduction and Summary
Man's fundamental dependence on climatic variation is well understood by every human being. His adaptability of being able to live in extremely different atmospheric environments is perhaps one of the striking characteristics distinguishing man from other animals. As Edholm (1966) has pointed out, man without clothing, heat, shelter and specifically cultivated food supplies, would be highly restricted to a very few world climatic zones. The pattern of human settlements, location and intensity of agric0lture and industry, mental and physical h~alth,'vlgour of the economy, and even distinct social pursuits among cultures, are partially the result of climate and its variability. Natural adaptive mechanisms such as body size, shape, and skin pigmentation have played vital roles. But man through learning and bringing together various combinations of resources such as clothing, design of structures, and energy conversion processes, has been able to ameliorate the effects of climatic variation in both geographical and time (seasonal, cyclical) dimensions.
Until several decades ago, man's image of the climate was one of an almost immutable force. That is, no human activity could possibly influence the climate or its natural variation, with the possible exception of air pollution episodes around large human settlements. Quite rapidly, this image has been altered. With steadily rising populations, energy-intensive economies, and new technologies, it is now recognized that man may not only have a significant influence on localized climate but also on regional and global climatic patterns. Li, 2, i7. This potential dependence and feedback is depicted in Figure 1.
It is the central purpose of this paper to review and summarize the rather meagre evidence on the impact of climatic changes on various economic sectors of some nations. The discussion is not meant to be exhaustive by country or sector, but suggestive of the magnitude of economic impacts and potential dependence of various economic sectors on climate. It is reported, for example, that the economic cost to the United States of a 1 deg C reduction in average temperature may be as much as seven billion U.S. dollars per year when one examines about 60 per cent of the economy Ll7. However, this estimate only contains costs for urban and forest sectors. It does not consider the implied regional modifications in agriculture, industrial siting, and perhaps city location. In addition, it does not include indirect effects on the United States from similar climatic change occurring elsewhere. For example, a simultaneous cooling effect in other nations will substantially alter how efficient the United States is relative to other nations in growing various agricultural crops. A global cooling effect may increase the U.S. efficiency in growing wheat and rice and reduce its efficiency in oranges, vegetable crops, and certain fruits relative
* University of Wyoming, Laramie, Wyoming, U.S.A.
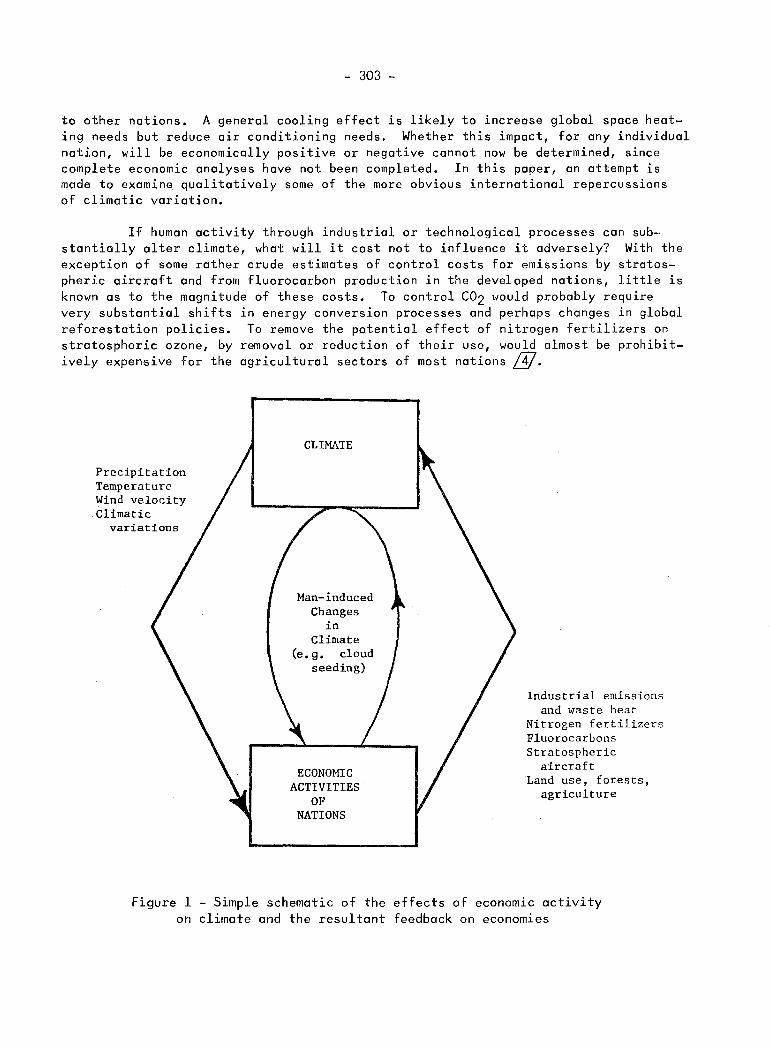
- 303 -
to other nations. A general cooling effect is likely to increase global space heating needs but reduce air conditioning needs. Whether this impact, for any individual nation, will be economically positive or negative cannot now be determined, since complete economic analyses have not been completed. In this paper, an attempt is made to examine qualitatively some of the more obvious international repercussions of climatic variation.
If human activity through industrial or technological processes can substantially alter climate, what will it cost not to influence it adversely? With the exception of some rather crude estimates of control costs for emissions by stratospheric aircraft and from fluorocarbon production in the developed nations, little is known as to the magnitude of these costs. To control C02 would probably require very substantial shifts in energy conversion processes and perhaps changes in global reforestation policies. To remove the potential effect of nitrogen fertilizers on stratospheric ozone, by removal or reduction of their use, would almost be prohibitively expensive for the agricultural sectors of most nations [17.
Precipitation Temperature Wind velocity .Climatic
variations
CLIMATE
Man-induced Changes
in Climate
(e.g. cloud seeding)
ECONOMIC ACTIVITIES
OF NATIONS
Industrial emissions and waste heat
Nitrogen fertilizers Fluorocarbons Stratospheric
aircraft Land use, forests,
agriculture
Figure 1 - Simple schematic of the effects of economic activity on climate and the resultant feedback on economies
- 304 -
While direct scientific evidence of global climatic change induced by emission of C02, NOx and other by-products of industrial activities is not yet obtainable, there appears to be sufficient indirect evidence through experiments and historical observation to suggest that these emissions could significantly alter world climate. It has been proposed that the net effect in 50 to 200 years may be a global warming of several deg C with perhaps greater rainfall. However, the possibility of a net cooling effect when all potential stratospheric pollutants are considered cannot be ruled out. It is also the purpose of this paper to examine the potential economic costs and benefits of man-induced and natural global climatic changes over the next 50 to 100 years.
The stratospheric pollution problem from an economic perspective differs little from other types of pollution problems. The stratosphere, being a common property resource utilized by all nations but owned by none, is likely to be inefficiently managed as a sink for pollutants. To achieve economic efficiency, stratospheric emissions need to be regulated and, in simple economic terms, emissions controlled to the point where global marginal costs of regulation equal global marginal damages associated with remaining emissions. However, this simple rule cannot be applied for a number of reasons. To apply it accurately requires four well-defined empirically verified relationships: Jl) a complete and concise damage estimate relating global damages to atmospheric changes for various rates and types of pollutant emissions; (2) relationships between costs of pollutant control and regulation, and rates of pollutant emissions; (3) empirically valid relationships between rates of pollutant emissions and atmospheric effects; and (4) knowledge of how various types of stratospheric pollutants interact and how this interdependence influences tropospheric climate .. The central problem for stratospheric regulation is that none of these relationships is known with a high degree of certainty in t~rms of either sign or magnitude. Estimates to date on the third relationship suggest sufficient aircraft emissions will tend to reduce stratospheric ozone and thereby alter global temperature patterns. Best estimates to date indicate that on balance a global cooling and reduction in ozone will be costly to society, while a slight global heating may be economically beneficial or harmful. ~-
The direct cost of regulating some pollutants, such as SOx, have been estimated with some degree of precision, while for others including NOx, suggested methods of control embody redesign of jet engine combustors where accurate estimates of actual costs are not now obtainable. Thus, control costs are likely to be highly uncertain depending on the set of existing technologies, most of which were developed without cognizance of stratospheric pollution problems.
Given the inherent uncertainties and possibilities for large errors in measurement, how should the stratospheric pollution problem be analysed from an economic perspective? First, one might characterize the major distinguishing attributes for the upper atmosphere as follows:
(a) There are large uncertainties (both in sign and magnitude) in the climatic effects of various levels of emission into the stratosphere, of oxides of nitrogen, sulphur oxides, particulates, carbon monoxide, and water vapour and their effects on surface climate but there appears to be some degree of concensus on the temperature effect of
- 305 -
increased C02 in the stratosphere. Whether this will be counterbalanced by other types of pollutants and to what degree is not known with any degree of accuracy. Some changes may involve irreversibilities in the natural environment, although no substantive evidence of this is now available.
(b) There are extremely large uncertainties in the translation of tropospheric climatic changes into quantitative biological effects.
(c) There are very high uncertainties as to how social communities and the economic system adjust to large-scale climatic changes or even to long-term but small climatic shifts in the biosphere.
(d) None of these substantial uncertainties are likely to be reduced to accurate estimates of effects in less than one or two decades.
The essential problem is that the relationship between predicted cause and effect is extremely uncertain at this time, but a process of learning over time can be anticipated. The decision process is sequential: decisions made in the next decade can be continued or revoked in future times, and not all decisions on the utilization of the stratosphere need be made at one point in time. Also, impacts of both biological and social consequences may be observed for one or even many human generations after perturbation of the stratosphere. The monitoring and emissionscontrol costs range from low-cost current techniques such as fuel desulphurization to potentially very high-cost methods of reducing emissions (e.g., removal of C02) and of detecting subtle man-induced climatic changes.
These various facets of both extreme uncertainty on climatic effects and relative indecision on actual climatic changes induced by man should lead to, in my opinion, rather simple conclusions on global public policy:
(a) No large-scale controls affecting human society should be considered for at least 10 years. There just is not enough evidence yet. Possible scenarios of future impacts should be delineated by the academic communities of all nations, however.
(b) Extensive, multilateral co-ordinated studies of both-natural climatic variations and man's impact on climate should proceed immediately, with emphasis on the current and potential future effects of industrial activity. A reasonable historical examination should also be made as to how man has been constrained by and has adapted to relatively severe long-term climatic changes, and how he might adapt in the future.
(c) Each culture or nation must be able to understand how it can or cannot adapt to rather substantial changes in climate and what economic and social safeguards are necessary both within itself and globally to protect its existence and to limit potential social and economic stresses due to undesirable climatic effects.

- 306 -
(d) A small research-oriented global policy unit needs to be established within the United Nations to provide leadership among notions in ensuring the long-term welfare of all countries as related to climate change, global effects, and human well-being. This group should have the freedom to identify activities causing waste in developed notions which directly or indirectly Influence climatic balance and to suggest changes. It also must provide guidelines to the developing nations in protecting climates.
2. Nature of economic impacts
Economic adaptation to climatic change is almost unlimited in scope and variety Ll7. Agricultural crops are planted late or harvested early, and are partially stored for use during exceptionally severe periods of drought or cold. Through genetic selection, hardier or heat-resistant varieties of crops are obtained and applied. Farm operators plant a mixture of crops to protect against climatic extremes and thereby the possible loss of a single weather sensitive crop. Energyintensive machinery is utilized to reduce the time for seeding or harvesting. Housing is insulated to reduce heat loss or reduce heat absorption. Industries stockpile row materials to avoid shortages due to reduced deliveries during inclement weather. Reservoirs are constructed to reduce flooding and provide water during periods of low stream flow or drought. Employers hire additional workers and adjust working hours to reduce production stoppages due to employee illness or inability to travel to work during periods of extreme climate. Special snow removal equipment is purchased and stored in case of severe storms. Individuals purchase medicines, warmer clothes, snow tyres, tyre chains, windshield de-icers, and a multitude of other goods and services in order to adapt to changes in seasonal climate. Thus, a substantial amount of the production of any economy is directly or indirectly used to offset or negate the economic effects of climatic variation. Considering only the purchases by consumers in the northern hemisphere above 40° latitude, the amount spent may be as high as 10 per cent of per capita income LZ7. In addition, almost all planning of future activities depends to some degree on climatic predictions. The economy's short-term productivity depends on the accuracy of such predictions. Thus, natural climatic variation and inaccuracies in predicting climate are costly to the productive and consumption activities of any economy.
A significant shift in climate over time, either natural or man-made, will induce a different combination of goods and services used to offset the ''new" climate. This combination may be less or greater in cost depending on the various elements identifying the climatic change. With higher average temperatures, one might expect that less agricultural machinery investments would be made for reducing seeding and harvesting time intervals. Likewise, there would be a reduction in winter clothing expenditures, snow removal equipment purchases, and other commodities related to cooler temperatures. Alternatively, increased resources may be devoted to cooling systems, refrigeration of foods and perishables, supplemental irrigation applications, and prevention of temperature-sensitive air- and water-borne diseases.

- 307 -
The net economic effect on any one nation will clearly depend on how the mix of resources used to adapt to climatic variation will be altered and how the cost of these resources will change in response to a new climate regime. From a regional and national perspective, both the losses and gains may be spread among areas with very different micro-climates and adaptive abilities of local populations in compensating for the climatic change.
These preliminary remarks hopefully provide cautionary qualifications on the global or regional results to be presented in what follows.
Economists and other social scientists have long been preoccupied with how human values manifest themselves, and whether these values are measureable among individuals, groups of individuals, or entire societies. One measure of some degree of validity is the concept of gross domestic product (GDP), or the price valuation of all new goods and services produced by an economy in one year. In essence, GDP measures what is produced at current prices, but not what should be produced at socially relevant prices. The GDP, by strict identity, measures costs of producing all market goods and some non-market goods in society. In recent years, the validity of this measure for assessing human values has been severely questioned. There have been recent criticisms of whether all societal costs are expressed in the paymentsfor-resources side of the GDP account, or whether payments (resource costs) accurately reflect either the appropriate combination of resources or socially desirable magnitude of payments among types of resources. Nevertheless, it appears appropriate, as an initial effort, to value gains and losses due to climatic change in terms of the relative values expressed in current market prices. For non-market goods, value imputations of decisions must, because of a lack of a better measuring device, also be based on these current prices. All economic costs and benefits calculated in this paper are based on recent international price levels of goods, inputs, and services in 1974.
In past decades, a large number of alternative measures of costs and benefits have been proposed by economists, including "weighted" costs and benefits depending on social or income class incidence, payment to minimally compensate the individual so that he is indifferent between the current state and an altered climatic state, and others. Each of these measures attempts to approximate the social loss or gain of a beneficial or adverse event.
There are three basic evaluation principles that have historically evolved in western economics to determine the magnitude of collective and individual gains and losses:
Alternative cost
Opportunity cost
Willingness-to-pay
Other more advanced valuation principles for evaluating social change have been proposed [j}.

- 308 -
The alternative-cost principle basically asks what would be the m~n~mum cost of providing a service or a substitute for a service without consideration of secondary effects, such as substitution possibilities or other indirect adjustment mechanisms. For example, supplemental irrigation water and other resources could be provided to maintain present vegetation if natural precipitation is reduced. If there are no alternative ways to compensate for changes, then the alternativecost principle provides a reasonable approximation of cost.
A second important set of measures can be derived from the so-called opportunity-cost principle. This involves an application of the alternative-cost principle. In addition, however, it attempts not only to assess the gross loss to society in terms of alternative provisions of services, but also to consider substitution possibilities, so that a net loss in terms of either income or some other reasonable measure is obtained. For example, a different type of vegetation could be created to compensate for reduced precipitation. The critical measure here is to assess the incremental cost to society of providing completely substitutable vegetation (or other resources) at least cost. Another way of expressing opportunity cost is to derive the minimum amount individuals would accept to be subjected to a given climatic change. Both the alternative cost and opportunity cost measures depend upon existing valuation in markets for various resources.
The willingness-to-pay principle involves the determination of what individuals, collective groups, or both would pay not to be subjected to the climatic change. This principle not only involves the current cost of resources, but also intrinsic preferences or preferences not currently expressed in markets by individuals.
These principles offer at least a first approximation of a reasonable market-oriented mechanism for the value or loss of climatic perturbation. Other measures of changes in social cost are available, but almost all other measures depend directly or indirectly on specifying gains and losses among groups within and between nations involving arbitrary decisions on weights. Consequently, this paper will apply more traditional measures of gains and losses, which are directly related to international prices as an indicator of value or loss. Different valuation methodologies are employed in an attempt to describe best the actual costs for each sector identified. While the types of impacts selected span most categories of anticipated effects, the listing is far from comprehensive in any one category. For these reasons, the measures cannot be summed to obtain global impact measures, and uncertainties in global effects remain.
The following estimates of economic costs associated with prescribed climatic changes were developed under the auspices of the Climatic Impact Assessment Program, U.S. Department of Transportation. They are highly preliminary and subject to substantive qualification. However, they do provide a rather rough approximation of the sensitivity of various sectors of the global, regional and U.S. economy to
- 309 -
particular climatic changes. For illustrative purposes, changes in mean global temperature of -1 deg C and +.5 deg C were examined along with plus or minus 12.5 (or 6.25) per cent change in global mean annual precipitation. Costs or benefits are presented in terms of "present values". In simple terms, "present value" is the amount that would have to be deposited in a bank (in the present) to pay for all future costs. Finally, hypothetical climatic change was presumed to occur over a thirty-year interval, 1990 through the year 2019.
Recorded in Table 1 are a set of preliminary estimates of the temperature effects with precipitation and other climatic variables held constant. These studies for the most part were completed by independent researchers under a grant from the U.S. Department of Transportation.
The estimates reported in Table 1 ore highly speculativecand depend on a large number of assumptions regarding the economic sectors studied. They do, however, indicate roughly direct economic costs or benefits of a change in climate as represented by a long-term shift in mean annual temperature. The magnitude of these economic costs are sizeable but do not constitute a very significant component of either world or U.S. gross product. In addition, these estimates do not represent the very likely large-scale differences in effects among nations because of climatic change.
In Table 2, estimates of the change in present value costs resulting from a mean annual temperature cha,ge and also a positive or negative change in precipitation are presented. The 12.5 per cent (6.25 per cent) increase or decrease in precipitation examined in Table 2 is entirely arbitrary but is applied to indicate the degree of sensitivity of a combined effect of temperature and precipitation change. In Table 2, there are many question marks on estimates of the present value cost of various combinations of temperature and precipitation changes. Unfortunately, there appear to be no existing studies that allow quantitative estimates to be made at this time.
If wages at least in part reflect cost of living differentials between various climatic regions of a nation, then it should be anticipated that additional direct costs to the consumer should approximately be equal to wage differences observed among different climate regimes. In Table 3 is a comparison for the United States of wage differences between different climatic zones when other factors affecting wa~es are netted out. In addition, some of the differences in additional direct costs to consumers are listed. Of course, some types of indirect costs to consumers including preferences for good weather, types of recreation activity, etc., are not included. It is striking in terms of results presented in Table 3 that the magnitude of costs associated with climate expressed by wage differences in the United States and cost of living differences os represented by some categories of direct costs are so close. This provides some degree of verification of at least the order of magnitude of costs-of-living differences associated with cha1ges in climates. The estimates in Table 3 can be interpreted as indicating the approximate additional cost to consumers of living in a climate which is 1 deg C colder.
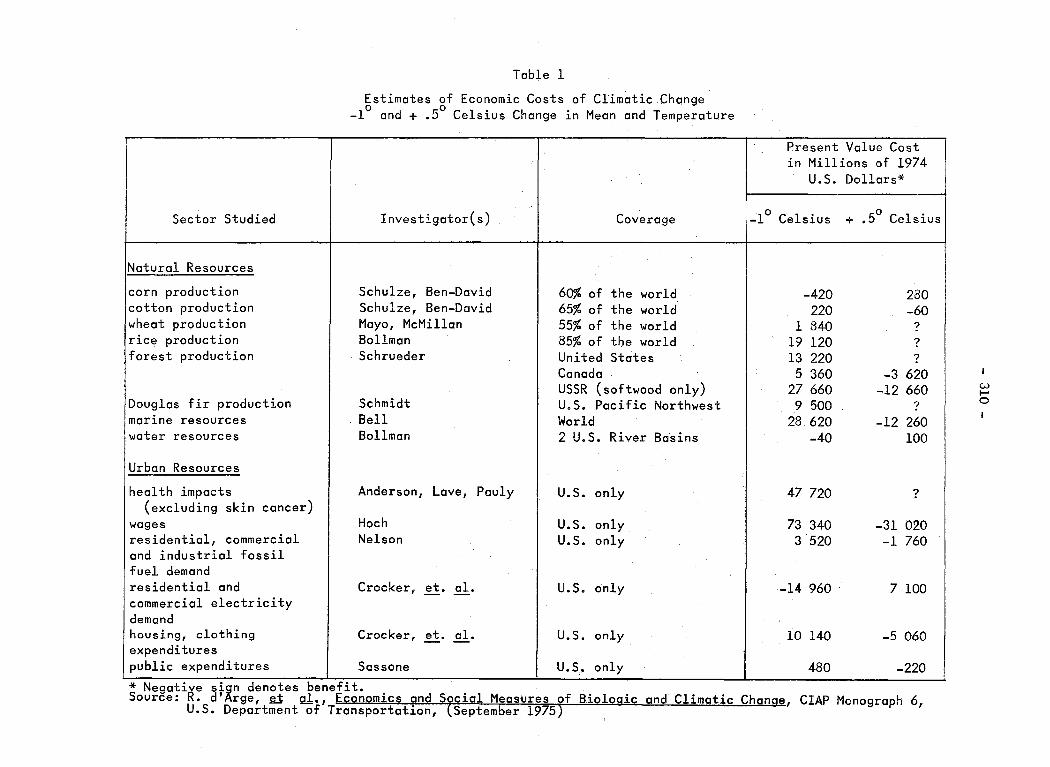
Sector Studied
Natural Resources
corn production cotton production wheat production rice production forest production
Douglas fir production marine resources water resources
Urban Resources
health impacts (excluding skin cancer)
wages residential, commercial and industrial fossil fuel demand residential and commercial electricity demand housing, clothing expenditures public expenditures
Table l
Estimates of Economic Costs of Climatic Change -1° and + .5° Celsius Change in Mean and Temperature
Investigator(s) Coverage
Schulze, Ben-David 60% of the world Schulze, Ben-David 65% of the world Mayo, McMillan 55% of the world Bollinan 85% of the world Schrueder United States
Canada USSR (softwood only)
Schmidt U.S. Pacific Northwest Bell World Bollman 2 U.S. River Basins
Anderson, Love, Pauly U.S. only
Hoch U.S. only Nelson U.S. only
Crocker, et. al. U.S. only
Crocker, et. al. u.s. only
Sassone I U.S. only * Negative sign denotes benefit.
Present Value Cost in Millions of 1974
U.S. Dollars*
-1° Celsius + .5° Celsius
-420 230 220 -60
l 840 ? 19 120 ? 13 220 ?
5 360 -3 620 27 660 -12 660 9 500 ?
28 620 -12 260 -40 lOO
47 720 ?
73 340 -31 020 3 520 -1 760
-14 960 7 lOO
10 140 -5 060
480 -220
Source: R. d'Arge, ~ al., nomics and Social Measures of U.S. Department-of Transportation, September 1975
ic and Climatic Chanae, ClAP Monograph 6,
I w ...... 0

Sector Studied*
Natural Resources
corn production I cotton production
wheat production rice production forest production (U.S. only) Douglas fir production marine resources water resources
Urban Resources (U.S. only)
health impacts (excluding skin cancer, U.S. only)
wages residential, co~merciol
and industrial fossil fuel demand residential electricity demand commercial electricity demand
., housing, clothing expenditures public expenditures
I
* .
Table 2
Sensitivity of Economic Costs to Precipitation Change Selected Economic Sectors
Present Value Cast in Millions of 1974 U.S. Dollars**
-1° Celsius Mean Annual Temperature
No Change in Precipitation
-420 220
1 840 19 120 13 220
9 500 28 620
-40
47 720
73 340 3 520
-14 960
10 140 480
12.5% Increase 12.5% Decrease in Precipitationlin ,Precipitation
-400 -420 200 180
? ? 21 660 18 360
? ? 7 300 11 660
35 720 48 680 200 2 100
129 700 37 920
37 220 108 900 3 520 3 520
? ?
? ? 720 300
11
+ .5° Celsius Mean Annual Temperature
No Change in Precipitation
280 -60
? ?
? , -12 260
100
?
-31 020 -1 760
7 lOO
-5 060 -220
I
6.25% Increase 6.25% Decrease in Precipitation! in Precipitation
280 300 -80 -60
? ? ? ?
?
I ?
-14 lOO -1 176 1 080 120
? ?
-31 000 -31 040 -1 760 -1 760
? ?
? ? -340 -120
Sectors correspond with those identified in Table 1.
** Negative sign denotes benefit.
I w ~ t-
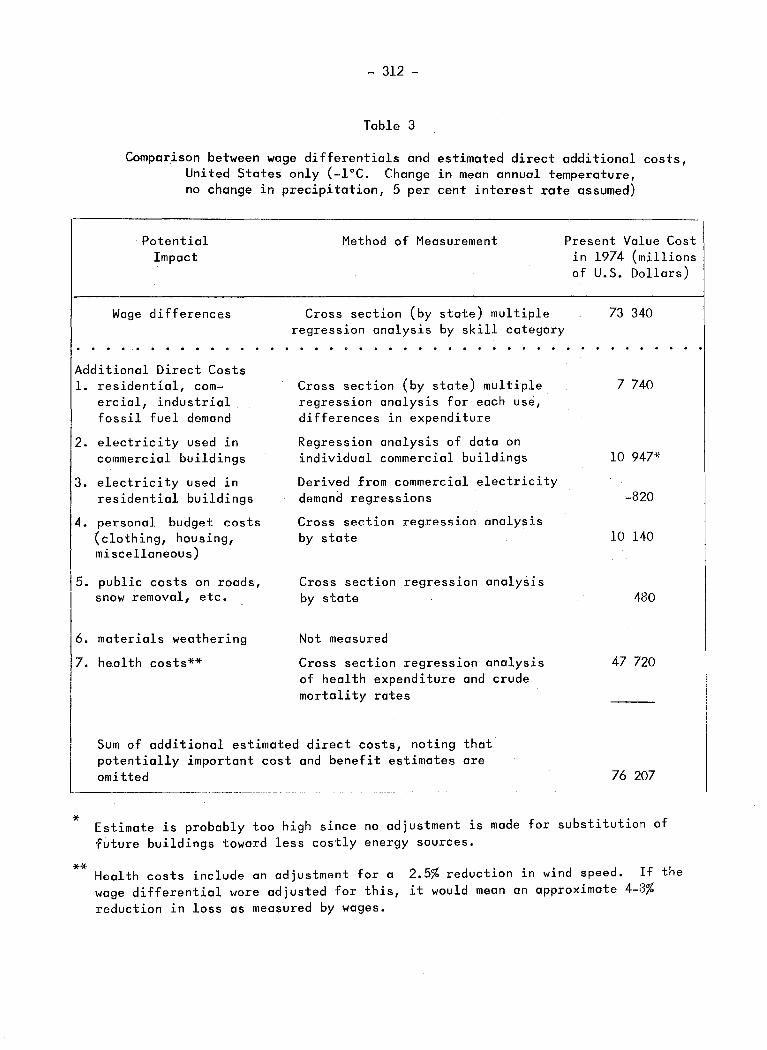
- 312 -
Table 3
Comparison between wage differentials and estimated direct additional costs, United States only (-l°C. Change in mean annual temperature, no change in precipitation, 5 per cent interest rate assumed)
Potential Impact
Method of Measurement Present Value Cost in 1974 (millions of U. S. Dollars)
Wage differences Cross section (by state) multiple 73 340
Additional Direct Costs 1. residential, com
ercial, industrial fossil fuel demand
2. electricity used in commercial buildings
3. electricity used in residential buildings
4. personal budget costs (clothing, housing, miscellaneous)
js. public costs on roads, snow removal, etc.
6. materials weathering
7. health costs**
regression analysis by skill category
Cross section (by state) multiple regression analysis for each use, differences in expenditure
Regression analysis of data on individual commercial buildings
Derived from commercial electricity demand regressions
Cross section regression analysis by state
Cross section regression analysis by state
Not measured
Cross section regression analysis of health expenditure and crude mortality rates
Sum of additional estimated direct costs, noting that potentially important cost and benefit estimates are omitted
7 740
10 947*
-820
10 140
480
47 720
76 207
* Estimate is probably too high since no adjustment is made for substitution of future buildings toward less costly energy sources.
** Health costs include an adjustment for a wage differential were adjusted for this, reduction in loss as measured by wages.
2.5% reduction in wind speed. If the it would mean an approximate 4-8%
- 313 -
In summary, there is substantive evidence of direct economic linkages between economic costs and different climates as represented by differences in mean annual temperature. In particular, colder climates will be more costly for agricultural production, forest production, and marine resources. Colder climates will also require more urban resources for sustenance, although there may be offsetting factors between heating and cooling requirements. Second, while some very crude quantitative estimates of economic costs have been presented, they are far from being definitive or complete for policy-making purposes. Most of the estimates were presented for a single country with distinct climatic attributes. Thus, these estimates must only be viewed as suggestive of how sensitive various nations other than the United States might be to long-term climatic changes.
3. Benefit-cost analyses
In this section, several very crude benefit-cost analyses are conducted for assessing whether controls on emissions are currently justified. The estimates contained herein are highly tentative and should be viewed as illustrative of possible ranges of economic costs a~d benefits.
A very preliminary benefit-cost analysis based on measured environmental damages and control costs has been made. Estimates of the damages avoided ~y desulphurization of jet fuel used in supersonic aircraft (from climatic change induced by aerosols) along with costs associated with sulphur removal indicate that for various fleet sizes of supersonic aircraft flying in the year 2000, the benefit-cost ratio for desulphurization exceeds 2.5. However, until more precise meteorological models can be constructed on a global basis so that the joint effect of water vapour and aerosols can be more accurately predicted, the benefit-cost ratio calculated here for sulphur removal must be viewed with extreme qualificatio~.
Economic costs induced by alteration in the amount of UV radiation contacting the Earth were estimated for skin cancer (non-melanoma) and materials. Materials weathering costs associated with increased UV radiation have also been estimated for plastics, textiles, paints, and other surface finishes. Many other potential impacts including increased skin aging, sunburn, and biological processes dependent on the UV spectrum were not measured. Measured damages avoided greatly exceed estimated costs associated with redesigning jet engines combustors to reduce NOx emissions.
For fleet sizes from 200 to 1 000 airplanes, all computed benefit-cost ratios exceed four. Among countries, ozone depletion effects are highly diverse since incidence rates for skin cancer are much greater for light skinned Caucasians and for individuals who spend large amounts of time in the sun. For countries where there is relatively little activity out of doo=s, changed UV radiation should have only minor effects on skin cancer incidence rates. Alternatively, for nations with very substantial levels of outdoor recreational activity, skin cancer incidence rates are likely to increase.

- 314 -
These very preliminary benefit-cost analyses on aircraft indicate that the stratosphere is a potentially sensitive resource to man's activities and not enough is known about it currently to accurately predict co~sequences either in en efficiency or distributional sense; a~d suspected impacts tend to be negative and of a long-term character.
Recently concern has been expressed as to the impact of fluorocarbons on the ozone concentration in the stratosphere and on the impact of these same compounds on world climate Li7.
Fluorocarbons after or during economic use escape and ultimately collect in the stratosphere. In the stratosphere, these chemicals interact with ozone and other chemical constituents, initiating a reduction in ozone and perhaps a change to plants and animals, including humans. The climatic changes are presumed to induce another set of adjustments to organic life. The major question is whether, on balance, these changes are beneficial or adverse to humans.
effects: It has been hypothesized that fluorocarbon emissions will induce two global
(a) reduction in stratospheric ozone and increase in biologically active ultraviolet radiation at the Earth's surface, and
(b) a slight rise in surface temperature due to an increased transparency of the stra~osphere resulting from ozone depletion.
Both of these global effects, if they occurred at a significant level, would have large-scale ramifications on biological life and thereby on the U.S. and other nations' economies. It would seem to be impossible empirically to estimate the thousands of interrelated impacts of changes in surface micro-climates. In the partial analysis which was undertaken, costs and benefits were estimated for some major sectors of the U.S. economy from ozone depletion or enhancement and for slight long-term increases in surface temperature. The sectors and/or components of them included are:
(a) Ozone depletion
(i) Non-melanoma skin cancer (ii) Materials weathering (polymeric materials)
(b) Temperature change (induced by ozone depletion)
(i) (ii) (iii) (iv)
Marine resources Forest products Agricultural crops Urban resources (fossil fuel, electricity, housing, clothing and government expenditure).
- 315 -
The major question is whether, given the evidence, fluorocarbons should be regulated as to production and/or emissions ot~d to what degree. Present values of net benefits varied in sign and magnitude according to the methodology employed for estimation. Nevertheless, it was possible to show that the benefits of unilateral action by the U.S.A. to reduce fluorocarbon production outweigh the costs.
Very little empirical evidence has been developed to assess the effect of nitrogen fertilizers on the stratosphere. However, in a recent study L27 using the damage estimates presented earlier for fluorocarbons, a rough assessment was developed for the impact of nitrogen fertilizers. Worldwide use of nitrogen fertilizer is about 36 million metric tons per year, and such use is critical for providing high yields of most food crops. In consequence, unlike fluorocarbons or aircraft, the potential losses due to restrictions could be enormous both in terms of basic dietary needs and related health effects. The present value of damages per metric ton is $310.00, where $237.00 is accounted for by climatic changes and the remainder by direct ultraviolet radiation effects. Thus, on a worldwide basis, damages could be as high as $11 billion, certainly not an insignificant amount but small in relation to the benefits of nitrogen fertilizers for augmenting food supplies. The benefit per ton may well exceed $2 500.00 to $3 000.00 on a present value basis. This very crude assessment is suggestive that it would be productive to examine the possibility of substitutes for nitrogen fertilizer such as improved cultivation or reduced runoff, particularly in the developed nations. It is also suggestive of the very stro~g need for international regulatory agreement on pollutant loadings to the stratosphere and the very high potential payoff of greater accuracy in predicting the climatic effects of chemicals entering the stratosphere.
Carbon dioxide
In recent years the scientific community has become concerned with the rise in the atmospheric carbon dioxide resulting from the burning of fossil fuels and deforestation. Because of the so-called "greenhouse" effect this increase in carbon dioxide through time may lead to a gradual warming of the Earth's surface and movement of various climatic zones.
The economic effects of such a gradual warming of the global surface of from 1.5 deg C to 3 deg C in 40 to 80 years is almost impossible to predict. However, it appears that on balance global agricultural productivity would increase but is highly dependent on how patterns of precipitation change as well LIQ7. But, both positive and negative changes in economic value can occur. For example, the U.S.S.R. may undergo slight reductions in yield for both spring and winter wheat crops given an increase in temperature with no compensating change in precipitation patterns~-
A general warming will reduce the use of petroleum, electricity and natural gas for space heating equipment and increase the amount of electricity used for space cooling. Estimates for various regions of the United States of changes in residential consumption of energy for various changes in temperature indicate that on balance a gradual warming will result in a net saving of energy for all regions of the United Statei~ That is, the reduction in energy use from lower space heating requirements
- 316 -
would more than offset the increased energy needed for space cooling. However, this current estimate does not consider the likely future expansion in demand for space cooling on population movements toward warmer climates currently taking place in the U.S. Both of these factors may well cause the net energy saving estimate to become a net economic cost in the long term. Changes in expenditures for energy used in residential consumption for selected U.S. cities given a temperature change range from a reduction in expenditure per year for Portland, Maine residents of about $6.50 to an increase in expenditures for Tucson, Arizona residents of more than $45.00. These preliminary computations indicate that even within a single nation, some regions are likely to be made better off and others worse off from a gradual increase in surface temperature.
In an important paper on C02 control, Nordhaus has demonstrated the economic cost of switching to non-fossil fuel sources in 40 to 60 years to substantially reduce carbon dioxide emissions is relatively small, less than 1/2 per cent of world gross product LII7. If his estimates are correct, then carbon dioxide can be viewed as a relatively manageable potential pollutant where immediate controls need not be considered. What is missing is an adequate assessment of the economic costs and benefits of a gradual increase in temperature.
Recent discussions among scientists suggest a much greater temperature increase of almost catastrophic proportions (3 to 6 deg C increase in northern latitudes) might be possible Ll17. Such changes would so alter the present configuration and intensity of economic activities that predictable quantities or even qualitative changes become impossible to estimate or even foresee.
REFERENCES
STUDY OF CRITICAL ENVIRONMENTAL PROBLEMS (SCEP). (1970). Man's Impact on the Global Environment. Massachusetts Institute of Technology, 319 pp.
JOHNSTON1 H.S. (1971). Reduction of stratospheric ozone by nitrogen oxide catalysts from supersonic transport exhausts. Science, 173, pp. 517-522.
CLIMATIC IMPACT ASSESSMENT PROGRAM (ClAP.). (1975). The Effects of Stratospheric Pollution by Aircraft. U.S. Department of Transportation, Washington, D.C.
U.S. NATIONAL ACADEMY OF SCIENCES. (1978). Nitrates: An Environmental Assessment. Report of the Panel on Nitrates, Environmental Studies Board, Washington,D.C.
d'ARGE, R.C., et al. Climatic Change.
(1975). Economic and Social Measures of Biologic and U.S. Department of Transportation, Washington, D.C.

- 317 -
L§7 d'ARGE, R.C. and SMITH, V. Kerry. (1978). Managing an Uncertain Natural Environment: The Stratosphere. University of Maryland Conference on Ozone Management, Port Deposit, Maryland. (Paper prepared for the U.S. Environmental Protection Agency.)
LZ7 HOCH, I. (1978). Climate, Energy Use, and Wages. University of Maryland Conference on Ozone Management, Port Deposit, Maryland. (Paper prepared for the U.S. Environmental Protection Agency.)
L§l FEDERAL TASK FORCE ON INADVERTENT MODIFICATION OF THE STRATOSPHERE (IMOS). (1975). Fluorocarbons and the Environment. U.S. Council on Environmental Quality and Federal Council for Science and Technology, Washington,~C.
£27 SCHULZE, W. (1976). Economic Analysis of Nitrate in the Environment. Draft paper prepared for the Panel on Nitrat~, U.S. National Academy of Sciences, Washington, D.C.
CLIMATIC IMPACT ASSESSMENT PROGRAM (ClAP). on the Biosphere. Monograph Number 5. Washington, D.C.
(1975). Impact of Climatic Change U.S. Department of Transportation,
NORDHAUS, W.D. (1977). Strategies for the Control of Carbon Dioxide. Cowles Foundation Discussion Paper No. 443, Yale University, New Haven, Connecticut, U.S.A.
ASPEN INSTITUTE OF HUMANISTIC STUDIES. (1978). Carbon Dioxide Workshop.

Related Documents