April 2020 Country Environmental Analysis Public Disclosure Authorized Public Disclosure Authorized Public Disclosure Authorized Public Disclosure Authorized

Welcome message from author
This document is posted to help you gain knowledge. Please leave a comment to let me know what you think about it! Share it to your friends and learn new things together.
Transcript
April 2020
CountryEnvironmental Analysis
Pub
lic D
iscl
osur
e A
utho
rized
Pub
lic D
iscl
osur
e A
utho
rized
Pub
lic D
iscl
osur
e A
utho
rized
Pub
lic D
iscl
osur
e A
utho
rized

ii
© 2020 The World Bank
1818 H Street NW
Washington DC 20433
Telephone: 202-473-1000
Internet: www.worldbank.org
This work is a product of the staff of The World Bank with external contributions. The findings, interpretations, and
conclusions expressed in this work do not necessarily reflect the views of The World Bank, its Board of Executive Directors,
or the governments they represent.
The World Bank does not guarantee the accuracy of the data included in this work. The boundaries, colors, denominations,
and other information shown on any map in this work do not imply any judgment on the part of The World Bank concerning
the legal status of any territory or the endorsement or acceptance of such boundaries.
Rights and Permissions
The material in this work is subject to copyright. Because the World Bank encourages dissemination of its knowledge,
this work may be reproduced, in whole or in part, for noncommercial purposes as long as full attribution to this work is
given. Any queries on rights and licenses, including subsidiary rights, should be addressed to World Bank Publications, The
World Bank Group, 1818 H Street NW, Washington, DC 20433, USA; fax: 202-522-2625; e-mail: [email protected].
iiiTable of ConTenTs
Table of ContentsTable of Contents . . . . . . . . . . . . . . . . . . . . . . . . . . . . . . . . . . . . . . . . . . . . . . . . . . . . . . . . . . iii
Boxes . . . . . . . . . . . . . . . . . . . . . . . . . . . . . . . . . . . . . . . . . . . . . . . . . . . . . . . . . . . . . . vi
Tables . . . . . . . . . . . . . . . . . . . . . . . . . . . . . . . . . . . . . . . . . . . . . . . . . . . . . . . . . . . . . vii
Abbreviations and Acronyms . . . . . . . . . . . . . . . . . . . . . . . . . . . . . . . . . . . . . . . . . . . . . . . viii
Acknowledgments . . . . . . . . . . . . . . . . . . . . . . . . . . . . . . . . . . . . . . . . . . . . . . . . . . . . . . . . xiii
Executive Summary . . . . . . . . . . . . . . . . . . . . . . . . . . . . . . . . . . . . . . . . . . . . . . . . . . . . . . .xvii
1. Introduction . . . . . . . . . . . . . . . . . . . . . . . . . . . . . . . . . . . . . . . . . . . . . . . . . . . . . . . . . . . . . 2
2. The Cost of Environmental Degradation in Ghana . . . . . . . . . . . . . . . . . . . . . . . . . . . . .12
3. Air Pollution . . . . . . . . . . . . . . . . . . . . . . . . . . . . . . . . . . . . . . . . . . . . . . . . . . . . . . . . . . . .18
4. Plastic Pollution . . . . . . . . . . . . . . . . . . . . . . . . . . . . . . . . . . . . . . . . . . . . . . . . . . . . . . . . 30
5. E-waste . . . . . . . . . . . . . . . . . . . . . . . . . . . . . . . . . . . . . . . . . . . . . . . . . . . . . . . . . . . . . . . 40
6. Status of Forest Resources . . . . . . . . . . . . . . . . . . . . . . . . . . . . . . . . . . . . . . . . . . . . . . . 52
7. Land Degradation . . . . . . . . . . . . . . . . . . . . . . . . . . . . . . . . . . . . . . . . . . . . . . . . . . . . . . . 64
8. Illegal Artisanal and Small-scale Gold Mining (Galamsey) . . . . . . . . . . . . . . . . . . . . . 78
9. Coastal Ecosystem . . . . . . . . . . . . . . . . . . . . . . . . . . . . . . . . . . . . . . . . . . . . . . . . . . . . . 90
10. Status of Fisheries Resources . . . . . . . . . . . . . . . . . . . . . . . . . . . . . . . . . . . . . . . . . . . . . . . . . 100
11. Climate Change . . . . . . . . . . . . . . . . . . . . . . . . . . . . . . . . . . . . . . . . . . . . . . . . . . . . . . . . 112
12. Policies and Institutions . . . . . . . . . . . . . . . . . . . . . . . . . . . . . . . . . . . . . . . . . . . . . . . . 122
13. Conclusions . . . . . . . . . . . . . . . . . . . . . . . . . . . . . . . . . . . . . . . . . . . . . . . . . . . . . . . . . . .134
14. Annex . . . . . . . . . . . . . . . . . . . . . . . . . . . . . . . . . . . . . . . . . . . . . . . . . . . . . . . . . . . . . . . 138
15.References . . . . . . . . . . . . . . . . . . . . . . . . . . . . . . . . . . . . . . . . . . . . . . . . . . . . . . . . . . . 150

iv
Figure 1.1: 2017 exports (MIT Observatory of Economic Complexity database). . . . . . . . . . . . . . . . . . . . . . . .2 Figure 1.2: Resource rents as percent of Ghana GDP (World Bank WDI database). . . . . . . . . . . . . . . . . . . . .2Figure 1.3: Components of natural resource wealth per capita over time (Lange et al., 2018). . . . . . . . . . . .3Figure 1.4: Components of national wealth per capita (Lange et al., 2018). . . . . . . . . . . . . . . . . . . . . . . . . . .3Figure 1.5: Net natural resource wealth depletion (World Bank WDI database). . . . . . . . . . . . . . . . . . . . . . .6Figure 1.6: Adjusted savings. Natural resource depletion, Ghana vs. structural peers (World Bank WDI database). . . . . . . . . . . . . . . . . . . . . . . . . . . . . . . . . . . . . . . . . . . . . . . . . . . . . . . . . . . . . . . . . 7Figure 1.7: Ghana population by rural-urban presence (World Bank WDI database). . . . . . . . . . . . . . . . . . . . 7Figure 2.1: Framework for mercury exposure (Poulin et al., 2008). . . . . . . . . . . . . . . . . . . . . . . . . . . . . . . . . 14Figure 3.1: Rate of death associated with HAP and AAP (Global Burden of Disease database). . . . . . . . . . 19Figure 3.2: Premature deaths (top) and illness (bottom, in disability-adjusted life years (DALYs) associated with air pollution risk in Ghana (Global Burden of Disease database). . . . . . . . . . . . . . . . . . . . . . . . . . . . . . 21Figure 3.3: Estimated spatial distribution of annual average PM2.5 concentrations in Accra for 2014 (MESTI, 2014). . . . . . . . . . . . . . . . . . . . . . . . . . . . . . . . . . . . . . . . . . . . . . . .22Figure 3.4: Estimated AAP cost per year by urban area (Estimates by authors). . . . . . . . . . . . . . . . . . . . . .25Figure 4.1: Plastics value chain . . . . . . . . . . . . . . . . . . . . . . . . . . . . . . . . . . . . . . . . . . . . . . . . . . . . . . . . . . . . . 31Figure 5.1: Ghanaians using Internet (ITU, 2018). . . . . . . . . . . . . . . . . . . . . . . . . . . . . . . . . . . . . . . . . . . . . . . .40Figure 5.2: Mobile-cellular telephone subscriptions in Ghana (ITU, 2018). . . . . . . . . . . . . . . . . . . . . . . . . . 41Figure 6.1: Tree cover loss (Hansen/UMD/Google/USGS/NASA; World Database on Protected Areas (2000)) . . . . . . . . . . . . . . . . . . . . . . . . . . . . . . . . . . . . . . . . . . . . . . . . . .52Figure 6.2: Tree cover loss by region, canopy >15% (GFW database).. . . . . . . . . . . . . . . . . . . . . . . . . . . . . .53Figure 6.3: Main activities causing forest sector emissions in Ghana (2001-2015) (MLNR, 2017a). . . . . . . .55Figure 6.4: Net forest depletion among Ghana's peers (World Bank WDI database). . . . . . . . . . . . . . . . . .57Figure 7.1: Soil erosion (RUSLE model) (World Bank Hidden Dimensions Dataset). . . . . . . . . . . . . . . . . . . . .66Figure 7.2: Growth of staple crops, 2008-2014 (Adapted from World Bank, 2018b). . . . . . . . . . . . . . . . . . .66Figure 7.3: Fertilizer consumption, Ghana vs. structural peers (World Bank WDI database). . . . . . . . . . . . .67Figure 7.4: Scatterplot showing correlation between land degradation and population growth (World Bank Hidden Dimensions Dataset). . . . . . . . . . . . . . . . . . . . . . . . . . . . . . . . . . . . . . . . . . . . . . . . . . . . . . . . . . . . . . .68Figure 7.5: GDP, poverty reduction, and GEP (GSS, 2018; World Bank WDI database; World Bank Macroeconomic Growth Accounting Tool). . . . . . . . . . . . . . . . . . . . . . . . . . . . . . . . . . . . . . . . . . . . . . . . . . . . .68Figure 7.6: Agroecological Zones in Ghana (World Bank, 2015). . . . . . . . . . . . . . . . . . . . . . . . . . . . . . . . . . .69Figure 7.7: Governance Structure SLM and Desertification . . . . . . . . . . . . . . . . . . . . . . . . . . . . . . . . . . . . . . 71Figure 8.1: Key ecological hazards in the ASGM sector (Rajaee et al., 2015 with silhouettes adapted from UNEP Mercury: Time to Act (2013)). . . . . . . . . . . . . . . . . . . . . . . . . . . . . . . . . . . . . . . . . . . . . . . . . . . . . . . . . .79Figure 8.2: Mercury (Hg) cycle in a typical artisanal and small-scale gold mining (ASGM) process (Rajaee et al., 2015). . . . . . . . . . . . . . . . . . . . . . . . . . . . . . . . . . . . . . . . . . . . . . . . . . . . . . . . . . . . . . . . . . . . . . . . . . . . . 81Figure 8.3: Gold Production and ASM Share (MLNR, 2017). . . . . . . . . . . . . . . . . . . . . . . . . . . . . . . . . . . . . . . 81Figure 8.4: The galamsey ‘employment engine’ (From Hilson and Banchirigah, 2008; Banchirigah, 2008). . . . . . . . . . . . . . . . . . . . . . . . . . . . . . . . . . . . . . . . . . . . . . . . . . . . . . . . . . . . . . . . . . . . . . .83Figure 8.5: MDF allocation as per Minerals Development Fund Act 912 and Chapter 267 of Ghana's Constitution (Authors’ Figure). . . . . . . . . . . . . . . . . . . . . . . . . . . . . . . . . . . . . . . . . . . . . . . . . . . . . . . . . . . . . . .86
Figures

vTable of ConTenTs
Figure 9.1: Coastal erosion hotspots (Angnuureng et al., 2013). . . . . . . . . . . . . . . . . . . . . . . . . . . . . . . . . . . 91Figure 9.2: Flood risk map of Accra Metropolitan Area (City of Accra) (Centre for Remote Sensing and GIS (CERSGIS), University of Ghana, Accra, July–August 2013, cited in Amoako and Frimpong Boamah, 2015). . . . . . . . . . . . . . . . . . . . . . . . . . . . . . . . . . . . . . . . . . . . . . . . . . . . . . . . . . . . . . . . . . . . . . . . . .92Figure 9.3: Flood-prone areas and types of floods in Greater Accra Plains (Kagblor, 2010 cited in Amaoko and Frimpong Boamah, 2016) . . . . . . . . . . . . . . . . . . . . . . . . . . . . . . . . . . . . . . . . . . . . . . . . . . . . . .92Figure 9.4: Annual cost of coastal degradation (Compiled by authors based on World Bank, 2017a). . . . .93Figure 10.1: Fish consumption in Ghana (2006-2016) (FAO database). . . . . . . . . . . . . . . . . . . . . . . . . . . . . 100Figure 10.2: Origin of fish consumed, by proportion (MoFAD, 2017). . . . . . . . . . . . . . . . . . . . . . . . . . . . . . . 101Figure 10.3: Reported fish landings by the various fleets in the marine sector (Data obtained from MoFAD). . . . . . . . . . . . . . . . . . . . . . . . . . . . . . . . . . . . . . . . . . . . . . . . . . . . . . . . . . . . . . 101Figure 10.4: Annual catch per canoe and catch per fisherman in artisanal marine capture fisheries (Authors estimates from MoFAD data). . . . . . . . . . . . . . . . . . . . . . . . . . . . . . . . . . . . . . . . . . . . . . . . . . . . . . . 102Figure 10.5: Annual mean temperature coastal sea surface (at Tema) (MoFAD, 2018). . . . . . . . . . . . . . . . 103Figure 10.6: Annual major upwelling index (at Tema) (MoFAD, 2018) . . . . . . . . . . . . . . . . . . . . . . . . . . . . . . 103Figure 10.7: Aquaculture and capture fish production in Lake Volta (Data obtained from MoFAD). . . . . . . 104Figure 10.8: Lost rents due to overfishing in Ghana’s marine fisheries (Authors based on Akpalu and Okyere, 2018). . . . . . . . . . . . . . . . . . . . . . . . . . . . . . . . . . . . . . . . . . . . . . . . . . . . . . . . . . . . . . . . . . . . . . . . . . 105Figure 11.1: Number of significant flooding events by region (2000-2019) (Leftmost image) (EM-DAT database); Flood and drought severity (Middle and Rightmost images). . . . . . . . . . . . . . . . . . . . 113Figure 11.2: Projected change in monthly temperature (left) and precipitation (right) for 2020-2039 (World Bank Climate Change Knowledge Portal). . . . . . . . . . . . . . . . . . . . . . . . . . . . . . . . . . . . . . . . . . . . . . 114Figure 11.3: Estimated increased water levels in the Odaw Basin (Accra) for different climate change models and urbanization trends (World Bank, 2020). . . . . . . . . . . . . . . . . . . . . . . . . . . . . . . . . . . . . . . . . . . 115Figure 11.4: GHG emissions by sector (MESTI, 2018). . . . . . . . . . . . . . . . . . . . . . . . . . . . . . . . . . . . . . . . . . . . 116Figure 11.5: Total GHG emissions (% change from 1990) (World Bank WDI database). . . . . . . . . . . . . . . . . 116Figure 12.1: Environment expenditure as percentage of GDP (left), and as percentage of total government expenditure (right), 2012-2017 (CAGD audited annual reports). . . . . . . . . . . . . . . . . . . . 127Figure 12.2: Environment expenditures as percentage of total government expenditures 2012-2017 (CAGD audited annual reports). . . . . . . . . . . . . . . . . . . . . . . . . . . . . . . . . . . . . . . . . . . . . . . . . . . . . . . . . . . . 129Figure 12.3: Percentage of environment expenditures (COFOG standard classification), 2012-2017 (CAGD audited annual reports). . . . . . . . . . . . . . . . . . . . . . . . . . . . . . . . . . . . . . . . . . . . . . . . . . . . . . . . . . . . 130Figure 12.4: Environmental spending as percentage of total government expenditure, 2012-2017 (CAGD audited annual reports). . . . . . . . . . . . . . . . . . . . . . . . . . . . . . . . . . . . . . . . . . . . . . . . . . . . . . . . . . . . 130Figure 12.5: MLNR and MESTI Investment/Capital Expenditures (Audited annual reports of CAGD). . . . . 131Figure 12.6: MLNR and MESTI compensation or employee's remuneration (Audited annual reports of CAGD). . . . . . . . . . . . . . . . . . . . . . . . . . . . . . . . . . . . . . . . . . . . . . . . . . . . . . . . . . 131Figure A1. Integrated exposure-response (IER) Functions for (a) ischemic heart disease, (b) stroke, (c) lung cancer and CoPD, and (d) lower respiratory infections . . . . . . . . . . . . . . . . . . . . . . . . . . . . . . . . . . 141Figure A.2: Maximum Sustainable and Economic Level of Fishing Effort (Adapted from Israel, 1995). . . . 145
Figures

vi
Box 1.2: Adjusted net savings . . . . . . . . . . . . . . . . . . . . . . . . . . . . . . . . . . . . . . . . . . . . . . . . . . . . . . . . . . . . . . .6Box 3.1: Distributional effects of air pollution in Accra . . . . . . . . . . . . . . . . . . . . . . . . . . . . . . . . . . . . . . . . . .23Box 3.2: Multiple benefits of clean cooking in China . . . . . . . . . . . . . . . . . . . . . . . . . . . . . . . . . . . . . . . . . . .24Box 3.3: Air pollution at the Tema roundabout . . . . . . . . . . . . . . . . . . . . . . . . . . . . . . . . . . . . . . . . . . . . . . . .26Box 4.1: Pillars of the plastics management policy . . . . . . . . . . . . . . . . . . . . . . . . . . . . . . . . . . . . . . . . . . . . .34Box 4.2: Central Reforms to Stabilize the Waste Sector and Engage the Private Sector in Senegal . . . . . . 37Box 5.1: The “Burners” of Agbogbloshie . . . . . . . . . . . . . . . . . . . . . . . . . . . . . . . . . . . . . . . . . . . . . . . . . . . . . .43Box 7.1: Definition of Land Degradation . . . . . . . . . . . . . . . . . . . . . . . . . . . . . . . . . . . . . . . . . . . . . . . . . . . . . .64Box 7.2: Specifics of staple crop production in Ghana . . . . . . . . . . . . . . . . . . . . . . . . . . . . . . . . . . . . . . . . . . .67Box 7.3: Dealing with land degradation: lessons from Nigeria . . . . . . . . . . . . . . . . . . . . . . . . . . . . . . . . . . . .75Box 8.1: Estimating impacts and repair costs in galamsey-affected areas . . . . . . . . . . . . . . . . . . . . . . . . . .82Box 8.2: Multilateral Mining Integrated Project (MMIP) . . . . . . . . . . . . . . . . . . . . . . . . . . . . . . . . . . . . . . . . . .84Box 9.1: Using Mangroves and Sea Dikes as First Line of Coastal Defense in Vietnam . . . . . . . . . . . . . . . .95Box 10.1: Extract from an interview conducted at Dixcove . . . . . . . . . . . . . . . . . . . . . . . . . . . . . . . . . . . . . . . 101Box 10.2: Fish species of commercial importance in Ghanaian waters . . . . . . . . . . . . . . . . . . . . . . . . . . . . 104Box 10.3: The West Africa Regional Fisheries Program-Ghana . . . . . . . . . . . . . . . . . . . . . . . . . . . . . . . . . . . 108Box 12.1: Overview and methodology for the Ghana PEER . . . . . . . . . . . . . . . . . . . . . . . . . . . . . . . . . . . . . 128
Boxes

viiTable of ConTenTs
Table 2.1: Estimated CoED in Ghana, 2017 (Estimates by authors). . . . . . . . . . . . . . . . . . . . . . . . . . . . . . . . . 15Table 3.1: Annual mortality burden attributed to AAP/HAP, by age (Estimates by authors). . . . . . . . . . . . . .20Table 3.2: PM concentrations in Accra vs. air quality guidelines (Various authors). . . . . . . . . . . . . . . . . . . . 21Table 3.3: Fuel used by households in Ghana (DHS, 2016; Van Vliet, 2016; Van Donkelaar, et al., 2016) .22Table 3.4: Estimated annual cost (billion US$) of AAP and HAP-related health effects in Ghana, 2017 (Estimates by authors). . . . . . . . . . . . . . . . . . . . . . . . . . . . . . . . . . . . . . . . . . . . . . . . . . . . . . . . . . . . . . . . . . . .24Table 3.5: Selected air quality improvement projects . . . . . . . . . . . . . . . . . . . . . . . . . . . . . . . . . . . . . . . . . . .26Table 4.1: Plastic waste generation in Ghana, by plastic grade (Troutman and Aseidu-Dankwah, 2017; Miezah et al., 2015). . . . . . . . . . . . . . . . . . . . . . . . . . . . . . . . . . . . . . . . . . . . . . . . . . . . . . . . . . . . . . . . . . . . . . .30Table 4.2: Imports by Section, 2009-2013 (Adapted from GSS, 2014).. . . . . . . . . . . . . . . . . . . . . . . . . . . . . .32Table 4.3: Selected projects dealing with plastics/urban waste pollution. . . . . . . . . . . . . . . . . . . . . . . . . . .35Table 5.1: WEEE origination (Amoyaw-Osei et al., 2011). . . . . . . . . . . . . . . . . . . . . . . . . . . . . . . . . . . . . . . . . . 41Table 5.2: Imports by Section, 2009-2013 (Adapted from GSS, 2014). . . . . . . . . . . . . . . . . . . . . . . . . . . . . .45Table 5.3: Selected e-waste projects . . . . . . . . . . . . . . . . . . . . . . . . . . . . . . . . . . . . . . . . . . . . . . . . . . . . . . . . 47Table 6.1: Estimated losses of open and closed forests during three time periods (MLNR, 2017a). . . . . . . .53Table 6.2: Absolute and relative tree cover loss, by region (2001-2018) (GFW database). . . . . . . . . . . . . .54Table 6.3: Drivers of deforestation and degradation (MLNR, 2016b). . . . . . . . . . . . . . . . . . . . . . . . . . . . . . .55Table 6.4: Selected initiatives to reduce forest loss . . . . . . . . . . . . . . . . . . . . . . . . . . . . . . . . . . . . . . . . . . . .60Table 7.1: Drivers and factors behind land degradation (MES, 2002; MESTI, 2017a; MESTI, 2017b). . . . . . .65Table 7.2: Erosion vulnerability in Ghana (Asiamah, 1987). . . . . . . . . . . . . . . . . . . . . . . . . . . . . . . . . . . . . . . .66Table 7.3: Flood occurrence, drought severity, soil erosion rates and share of more favored agricultural land area by districts’ poverty level (World Bank Hidden Dimensions Dataset). . . . . . . . . . . . . . . . . . . . . .69Table 7.4: Additional relevant legal and legislative instruments related to SLM . . . . . . . . . . . . . . . . . . . . .70Table 7.5: Selected land management projects . . . . . . . . . . . . . . . . . . . . . . . . . . . . . . . . . . . . . . . . . . . . . . . .72Table 8.1: Selected projects combating illegal artisanal and small-scale gold mining . . . . . . . . . . . . . . . .85Table 9.1: Coastal zone indicators (World Bank WDI database). . . . . . . . . . . . . . . . . . . . . . . . . . . . . . . . . . . . 91Table 9.2: Legislation pertaining to the coastal zone of Ghana . . . . . . . . . . . . . . . . . . . . . . . . . . . . . . . . . . .94Table 10.1: Top 10 demersal species off coast of Ghana (Data from selected surveys of the R/V Dr. Fridtjof Nansen). . . . . . . . . . . . . . . . . . . . . . . . . . . . . . . . . . . . . 103Table 10.2: Top 10 demersal species off coast of Ghana (Data from selected surveys of the R/V Dr. Fridtjof Nansen). . . . . . . . . . . . . . . . . . . . . . . . . . . . . . . . . . . . . 106Table 11.1: Significant flood events in Ghana, 2000-2019 (EM-DAT database). . . . . . . . . . . . . . . . . . . . . . . 113Table 11.2: Selected projects focused on climate change in Ghana . . . . . . . . . . . . . . . . . . . . . . . . . . . . . . . 117Table 12.1: Challenges in EIA implementation (Various authors). . . . . . . . . . . . . . . . . . . . . . . . . . . . . . . . . . 125Table A1: Summary of CoED estimation methods . . . . . . . . . . . . . . . . . . . . . . . . . . . . . . . . . . . . . . . . . . . . . 139Table A2: Baseline Data for Estimating Morbidity Cost . . . . . . . . . . . . . . . . . . . . . . . . . . . . . . . . . . . . . . . . . 142Table A3: Benefit transfer of VSL for Ghana (estimated by authors) . . . . . . . . . . . . . . . . . . . . . . . . . . . . . . 144
Tables

viii
Abbreviations and AcronymsAbbreviation Definition AAP Ambient Air PollutionAFOLU Agriculture, Forestry, and Other Land UseANS Adjusted Net SavingsAQM Air Quality ManagementAP Air PollutionASGM Artisanal and Small-Scale Gold MiningASM Artisanal and Small-Scale MiningBMZ Bundesministerium für Wirtschaftliche Zusammenarbeit und Entwicklung (German Federal
Ministry for Economic Cooperation and Development)CAGD Controller and Accountant General’s Department of GhanaCDA Coastal Development AuthorityCDS Community Development SchemeCEA Country Environmental AnalysisCFI Cocoa & Forests InitiativeCO Carbon MonoxideCO2 Carbon DioxideCoED Cost of Environmental DegradationCOFOG Classification of Functions of GovernmentCREMA Community Resource Management AreaDALY Disability Adjusted Life YearsDCIM District Commission on Illegal MiningDEMC District Environmental Management CommitteeDHS Demographic and Health SurveyDP Development PartnerECOWAS Economic Community of West African StatesEEE Electrical and Electronic EquipmentEIA Environmental Impact AssessmentENRAC Environment and Natural Resources Advisory CouncilENRM Environment and Natural Resources ManagementEPA Environmental Protection AgencyEPR Extended Producer ResponsibilityER Emissions ReductionEU European UnionFAO Food and Agriculture OrganisationFC Forestry Commission FEU Fisheries Enforcement UnitFIP Forest Investment ProgramFSD Forest Services DivisionFLEGT Forest Law Enforcement, Governance and TradeFSSD Fisheries Scientific Survey Division FWP Forest and Wildlife PolicyGAMA Greater Accra Metropolitan Area
abbreviaTions and aCronyms
GASDA Greater Accra Scrap Dealers AssociationGBD Global Burden of DiseaseGCFRP Ghana Cocoa Forest REDD+ ProgramGDP Gross Domestic Product GEP Growth Elasticity of PovertyGFIP Ghana Forest Investment ProgramGFW Global Forest WatchGHG Greenhouse GasGIZ Deutsche Gesellschaft für Internationale Zusammenarbeit (German Development Agency)GH Ghanaian CediGHS Ghana Health ServiceGMet Ghana Meteorological AgencyGNI Gross National IncomeGoG Government of GhanaGRS Ghana REDD+ StrategyGRT Gross Registered TonsGSD Geological Survey DepartmentGSGDA Ghana Shared Growth and Development AgendaGSS Ghana Statistical ServiceGWCL Ghana Water Company Limitedha HectareHAP Household Air PollutionHDD Hidden Dimensions DatasetHDPE High-Density PolyethyleneHFZ High Forest ZoneHg MercuryHIA Hotspot Intervention AreasHSD Hydrological Services DepartmentICT Information and Communication TechnologyICT4AD ICT for Accelerated DevelopmentIPCC Intergovernmental Panel on Climate ChangeIPPU Industrial Processes and Product UseIQ Intelligence QuotientIUCN International Union for Conservation of NatureIUU Iillegal, Unreported, UnregulatedKfW Kreditanstalt für Wiederaufbau (German Development Bank)kg KilogramLC Lands CommissionLDPE Low-Density PolyethyleneLI Legislative InstrumentLMIC Lower-Middle-Income CountryLPG Liquefied Petroleum GasLUSPA Land Use and Spatial Planning Authorityμm Micrometerμg Microgramm Meterm3 Cubic Metermgl-1 Milligrams Per DeciliterM&E Monitoring and EvaluationMC Minerals CommissionMDA Ministries, Departments and AgenciesMDF Minerals Development Fund

x
MESTI Ministry of Environment, Science, Technology and InnovationMEY Maximum Economic YieldMINT Materials in Transition
MLGRD Ministry of Local Government and Rural Development
MLNR Ministry of Lands and Natural Resources
MMDA Metropolitan, Municipal, and District Assemblies
MMIP Multilateral Mining Integrated Project
MoC Ministry of Communication
MoE Ministry of Education
MoEP Ministry of Energy and Petroleum
MoF Ministry of Finance and Economic Planning
MoFA Ministry of Food and Agriculture
MoFAD Ministry of Fisheries and Aquaculture Development
MoI Ministry of the Interior
MoTI Ministry of Trade and Industry
MSDI Ministry of Special Development Initiatives
MSWR Ministry of Sanitation and Water Resources
MSY Maximum Sustainable Yield
MT Metric Ton
MWH Ministry of Works and Housing
NADMO National Disaster Management Organisation
NAP National Action Plan
NBSSI National Board for Small Scale Industries
NDC Nationally Determined Contribution
NDPC National Development Planning Commission
NDVI Normalized Difference Vegetation Index
NEAP National Environmental Action Plan
NEP National Environmental Policy
NGO Non-Governmental Organization
NO2 Nitrogen Dioxide
NPP Net Primary Productivity
NREG Natural Resources and Environment Governance
NSEZ Northern Savannah Ecological Zone
NTFP Non-Timber Forest Product
OASL Office of the Administration of Stool Lands
OXO Oxo-(bio)degradable Plastics
PAH Polycyclic Aromatic Hydrocarbons
PBDE Polybrominated Diphenyl Ethers
PBDD/F Polybrominated Dibenzo-p-Dioxins and Dibenzofurans
PCB Polychlorinated Biphenyl
PCDD/F Polychlorinated Dibenzo-p-Dioxins and Dibenzofurans
PE Polyethylene
PEER Public Environmental Expenditure Review
PET Polyethylene Terephthalate
PM Particulate Matter

abbreviaTions and aCronyms
PMMC Precious Minerals Marketing Corporation
POP Persistent Organic Pollutant
PP Polypropylene
PPP Purchasing Power Parity
PS Polystyrene
PV Present Value
PVC Polyvinyl Chloride
RCCs Regional Coordinating Councils
REDD+ Reducing Emissions from Deforestation and Forest Degradation
R/V Research Vessel
RUSLE Revised Universal Soil Loss Equation
SDGs Sustainable Development Goals
SEA Strategic Environmental Assessment
SLWM Sustainable Land and Water Management
SO2 Sulfur Dioxide
SST Sea Surface Temperature
SZ Savannah Zone
TF Trust Fund
TIDD Timber Industry Development Division
TZ Transition Zone
UN United Nations
ULAB Used Lead-Acid Battery
UNESCO United Nations Educational, Scientific and Cultural Organization
UNFCCC United Nations Framework Convention on Climate Change
VMS Vessel Monitoring System
VPA Voluntary Partnership Agreement
VSL Value of Statistical Life
WARFP West Africa Regional Fisheries Project
WASH Water supply, Sanitation, and Hygiene
WCF World Cocoa Foundation
WD Wildlife Division
WDI World Development Indicators
WEEE Waste Electrical and Electronic Equipment
WHO World Health Organization
WRC Water Resources Commission
YLD Years Lived with Disability

xii
Young boy on fishing boat. Arne Hoel / The World Bank

aCknowledgmenTs
Acknowledgments
This report was prepared by the Environment, Natural Resources and Blue Economy Global Practice (ENB GP) of the
World Bank in coordination with the Government of Ghana (GoG). The Task Team Leader (TTL) for this project was
Asferachew Abate Abebe. The lead author of the report was Steven Silverstein. Chapters 1 (Overview), 5 (E-waste), 8
(Illegal Artisanal and Small-Scale Gold Mining), and 13 (Conclusions) were prepared by Steven Silverstein. Chapter 2
(The Cost of Environmental Degradation in Ghana, CoED) was prepared by Elena Strukova and revised by Lelia Croitoru.
Chapter 3 (Air Pollution) was prepared by Gary Kleiman. Chapter 4 (Plastic Waste Pollution) was prepared by Heather
Troutman. Chapter 6 (Status of Forest Resources) was prepared by Rebecca Asare. Chapter 7 (Land Degradation) was
prepared by Gordana Kranjac-Berisavljevic and Steven Silverstein. Chapter 9 (Coastal Ecosystem) was prepared by David
Maleki, Sajid Anwar, and Nicolas Desramaut. Chapter 10 (Status of Fisheries Resources) was prepared by Wisdom Akpalu
and Kwame Koranteng and reviewed by Steinar Matthiasson. Chapter 11 (Climate Change) was prepared by Carl Dingel.
Chapter 12 (Policies and Institutions) was prepared by Jonathan Allotey, while the Public Environmental Expenditure
Review (PEER) section was authored by Kwabena Gyan Kwakye. Maclean Asamani Oyeh contributed critical research
and inputs to multiple chapters: E-waste, Land Degradation, and Policies and Institutions, including the PEER. Jia Jun
Lee provided multiple bespoke maps and graphics from the Hidden Dimensions Dataset.
The team would like to thank Fredua Agyeman, Isaac Acquah, and Kingsley Amoako, counterparts in the GoG, for
providing guidance and technical inputs to this work.
The report also benefited from advice and comments from colleagues in Ghanaian academia and civil society, as
well as from the international development community: Nicholas Baynham, Gloria Odoom, Emmanuel Odotei, Eunice
Annan-Aggrey, Yoann Poline, Marion Chapon, Paolo Della Stella, Susana Martins, Janet Arthur, Angela Kwashie, and
Daniel Twerefou.
World Bank peer reviewers were Anjali Acharya, Diji Chandrasekharan Behr, Stephen Danyo, Urvashi Narain, Craig
Meisner, and Helena Naber. Seth Beckerman edited the report. Timothy Brown, Yasmina Oodally, Yesmeana Butler,
Justice Odoi, and Charity Boafo-Portuphy provided invaluable feedback and support.
This publication was produced under the guidance of Maria Sarraf and Magda Lovei, Practice Managers.
Henry Kerali and Pierre Laporte, Country Directors, and Agata Pawlowska, Manager, Operations provided crucial support.
Additional funding support for land degradation aspects was provided by the TerrAfrica Leveraging Fund.

xiv
People dancing at the announcement of the global launch of Poverty in Rising Africa in Accra.Dominic Chavez / World Bank

xvaCknowledgmenTs

xvi

xviiexeCuTive summary
Executive SummaryNatural resources have been key drivers of economic growth in Ghana. Over the past 30 years, real GDP in Ghana has more than quadrupled, and in 2011 the country joined the ranks of Lower Middle-Income Countries (LMICs).1 Macroeconomic momentum has been driven in part by higher prices for Ghana’s main commodity exports, gold and cocoa, and the start of commercial oil production. This fits an overall trend that has seen natural resource rents as a percentage of GDP more than double between 1990 and the present; approximately one-half of these rents come from non-renewable sources (oil, mineral, natural gas).
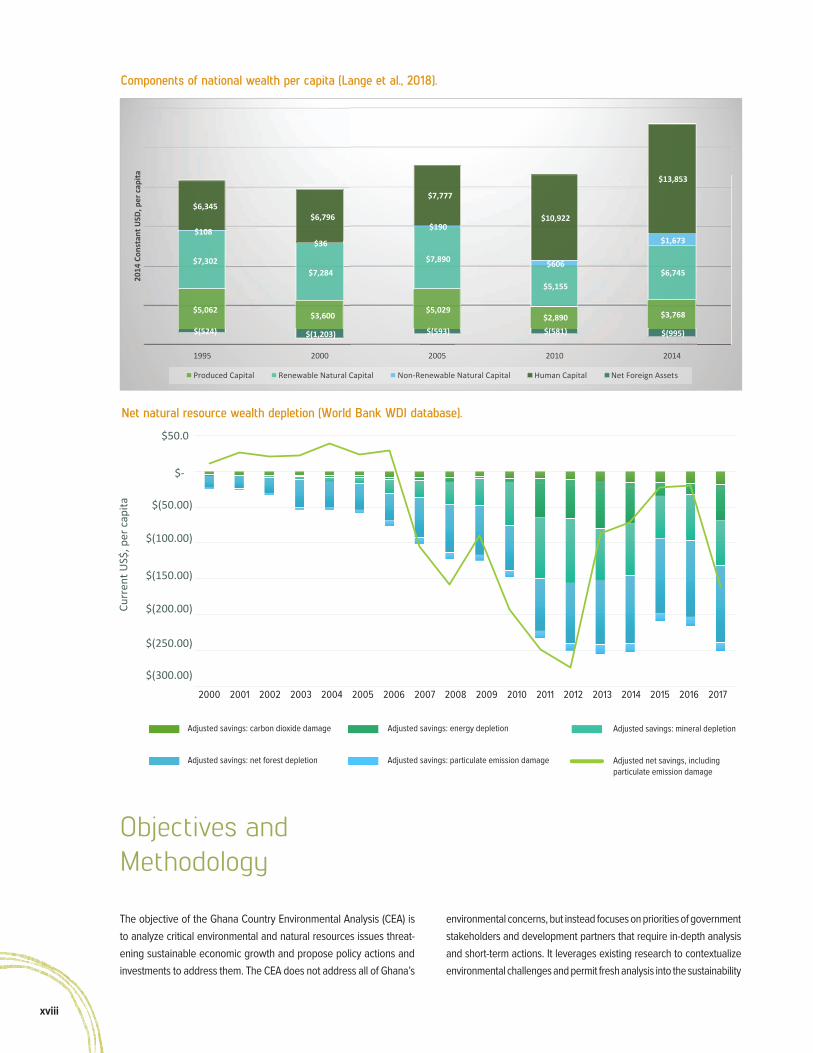
Environmental unsustainability may impair Ghana’s economic growth, as demonstrated through two economic indicators. The first is national wealth—the measurement of a country’s assets in produced capital, natural capital (renewable and non-renewable), human capital, and net foreign assets—a gauge of growth sustainability. Between 2000 and 2014, Ghana saw total national wealth more than double. Growth is predicated on efficiently and sustainably managing natural capital—a fact which can be demonstrated through increase in its per capita value over time—and reinvesting proceeds into other forms of capital, primarily human (Lange et al., 2018). Yet, much of Ghana’s recent wealth growth came with liquidation of non-renewable assets and losses to renewable resources, as well as erosion of produced capital. Ghana’s high popula-tion growth makes this a pressing concern since existing capital stocks must be shared with younger and future generations.
A second related indicator is adjusted net savings (ANS)—defined as gross national saving (national income less consumption, plus net transfers) adjusted for gains in education spending and losses through depletion of subsoil assets and timber resources, and the cost of air pollution to human health—a measure of how wealth changes over time.2 If ANS is positive, it is adding to wealth and future well-being; if it is negative it may indicate the country is consuming more than it is saving, using up its assets to fuel present growth, which undermines long-term sustain-ability (Lange et al., 2018). In Ghana, dissaving due to natural resource depletion and pollution damage has skyrocketed and ANS has been consistently negative since 2007.
Combined, the two indicators help inform an understanding of some of the linkages between environment and natural resource management and Ghana’s ability to foster future growth by investing in its people. For example, air pollution harms human health through early mortality and morbidity. From the national wealth perspective this has negative ramifications for the country’s stock of human capital, as it reduces labor force participation and productivity. The value of this loss is calculated using ANS, which shows a four-fold increase in damage from air pollution over the past two decades. If its current unsustainable environment and natural resource management remains unchanged, Ghana will see its wealth—its people, its lands, its infrastructure—destroyed over the long-term with less opportunity to sustain growth, share prosperity, adapt to a changing climate, and protect hard won development gains.
1. LMICs are defined as countries with a Gross National Income per capita between US$996 and US$3,895.
2. Conceptually, ANS differs from changes in wealth because it does not include exogenous impacts from (1) price changes, which can be substantial for natural resources; (2) new discoveries of energy and
mineral resources; and (3) other impacts on produced and human capital, such as natural disasters or civil unrest (Lange et al., 2018).Public health information comes from the Global Burden of Disease (database), https://vizhub.healthdata.org/gbd-compare/.
Natural resource rents as percentage of Ghana GDP (World Development Indicators (WDI) database).
% o
f GDP
19901991
19921993
19941995
19961997
19981999
20002001
20022003
20042005
20062007
20082009
2010 20112012
20132014
20152016
2017
Forest rents Mineral rents Natural gas rents Oil rents
20%
18%
16%
14%
12%
10%
8%
6%
4%
2%
0%0%
2%
4%
6%
8%
10%
12%
14%
16%
18%
20%
1990199119921993199419951996199719981999200020012002200320042005200620072008200920102011201220132014201520162017
% of G
DP
Forest rents Mineral rents Natural gas rents Oil rents
xviii
Components of national wealth per capita (Lange et al., 2018).
$5,062 $3,600
$5,029 $2,890 $3,768
$7,302 $7,284
$7,890
$5,155 $6,745
$108 $36
$190
$606
$1,673
$6,345 $6,796
$7,777
$10,922
$13,853
$(524) $(1,203) $(593) $(581) $(995)
1995 2000 2005 2010 2014
2014
Con
stan
t USD
, per
cap
ita
Produced Capital Renewable Natural Capital Non-Renewable Natural Capital Human Capital Net Foreign Assets
Net natural resource wealth depletion (World Bank WDI database).
$(300.00)
$(250.00)
$(200.00)
$(150.00)
$(100.00)
$-
$(50.00)
$50.0
Curr
ent U
S$, p
er c
apita
Adjusted savings: carbon dioxide damage
Adjusted savings: net forest deple�on
Adjusted savings: energy deple�on
Adjusted savings: par�culate emission damage
Adjusted savings: mineral deple�on
Adjusted net savings, including par�culate emission damage
$(300.00)
$(250.00)
$(200.00)
$(150.00)
$(100.00)
$-
$(50.00)
$50.0
Curr
ent U
S$, p
er c
apita
2000 2001 2002 2003 2004 2005 2006 2007 2008 2009 2010 2011 2012 2013 2014 2015 2016 2017
Adjusted savings: energy depletion
Adjusted savings: particulate emission damage
Adjusted savings: carbon dioxide damage
Adjusted savings: net forest depletion
Adjusted savings: mineral depletion
Adjusted net savings, including particulate emission damage
Objectives and Methodology
The objective of the Ghana Country Environmental Analysis (CEA) is to analyze critical environmental and natural resources issues threat-ening sustainable economic growth and propose policy actions and investments to address them. The CEA does not address all of Ghana’s
environmental concerns, but instead focuses on priorities of government stakeholders and development partners that require in-depth analysis and short-term actions. It leverages existing research to contextualize environmental challenges and permit fresh analysis into the sustainability

xixexeCuTive summary
of Ghana’s economic development. This includes an analysis of the Cost of Environmental Degradation (CoED), which is calculated using the latest World Bank approved methodology. The main analysis is expected to broaden dialogue with Government and engagement with the public, leading to improved environmental and natural resource management.
Cost of Environmental Degradation
The cost of environmental degradation estimates the effects of envi-ronmental degradation on Ghana’s national society due to air and water pollution, agricultural land degradation, deforestation, illegal mining, overfishing, coastal erosion, and flooding. In addition, it esti-mates the impact of environmental degradation on the global com-munity, through the cost of carbon emissions from economic activities. Both anthropogenic and natural factors are considered for estimating CoED. The assessment estimates the present value of both short-term and long-term impacts caused by activities occurring over the latest year for which data were available; it uses a 6 percent discount rate and a time horizon of 30 years (World Bank, 2016). The results are expressed in absolute terms (US$, 2017 prices) and relative terms (as a percentage of Ghana’s GDP, which was US$59 billion in 2017) to benchmark the extent of damage against macroeconomic indicators.
The CoED to Ghanaian society is estimated at about US$6.3 billion, equivalent to 10.7 percent of the country’s 2017 GDP. Additionally, GHG emissions cause damage to the global community, which, when quantified, are equivalent to about four percent of Ghana’s GDP. The national CoED appears almost triple that of the global cost.
Among the national costs, it is important to note that:
● Air Pollution is the most significant cost (equivalent to 4.2 percent of GDP). This is primarily due to the impacts caused by household air pollution (causing about 8,800 premature deaths), and secondarily by ambient air pollution (about 7,200 premature deaths) in rural and urban areas.
● Water Pollution causes significant damage (equivalent to 3 percent of GDP) due to the health effects of an inadequate water supply, poor sanitation, and inadequate hygiene (about 10,600 early deaths), as well as discharge of solid waste, industrial effluents, and toxic substances into water systems.
● Gold mines, unmanaged solid waste, and other contami-nated sites impose high costs on Ghana (1.2 percent of GDP). Activities related to the recycling and disposal of electronic waste, burning of plastic waste, and artisanal small-scale gold mining, release hazardous chemicals and heavy metals, to which exposure can be fatal (e.g., 1,200 deaths due to lead exposure).
● Agricultural land degradation, deforestation, and overfish-ing are noteworthy due to their negative effects on resource productivity—impacting national economic growth drivers, jobs, and livelihoods—and ecosystem services.
Women walking roadside. Curt Carnemark / World Bank.

xx
Beach scene, mouth of the Volta River. alantobey / iStock Photo

xxiexeCuTive summary
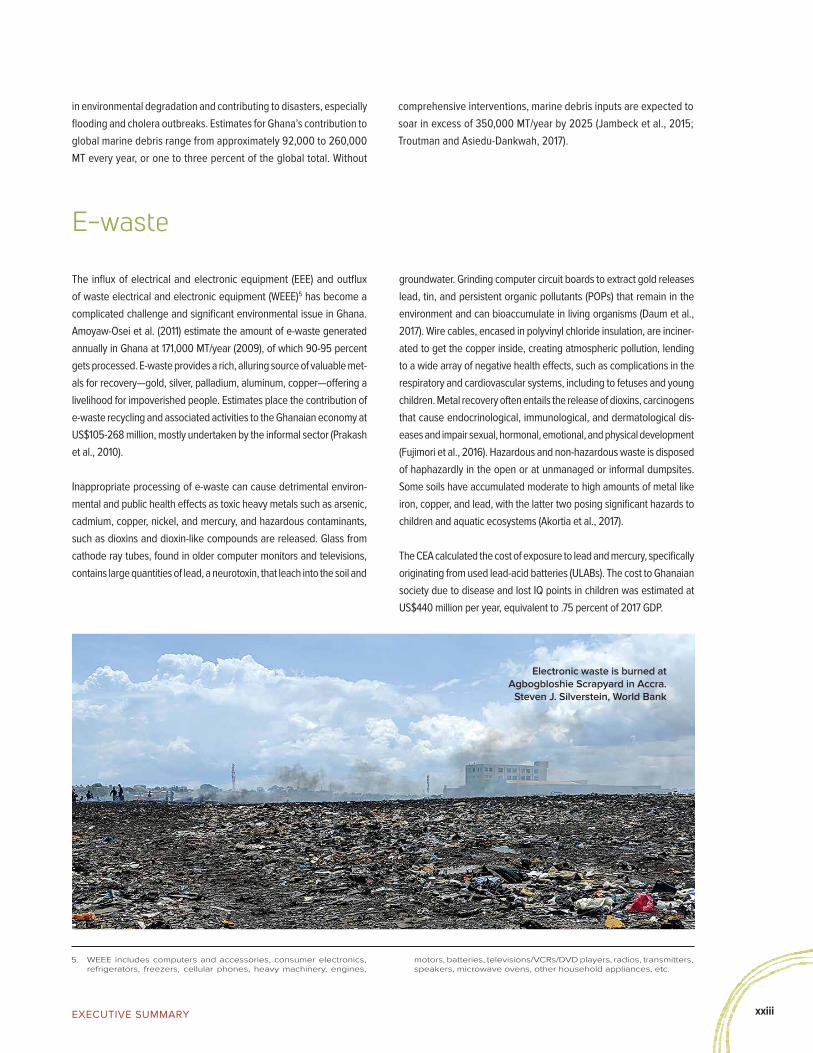
Annual total AP in Ghana has an estimated average cost equivalent to 4.2 percent of 2017 GDP, or about US$2.5 billion. AAP, estimated at US$1.1 billion is currently less costly than HAP by about US$250 million/year, but increasing urbanization means this may not be the case for long. AAP is estimated to cost US$264 million dollars/year alone in Accra and Kumasi, Ghana’s two largest cities.
3. Public health information comes from the Global Burden of Disease (database), https://vizhub.healthdata.org/gbd-compare/.
4. Final health burden estimates are adjusted for multiple risks because the same diseases are associated with different environmental risk factors.
Lower bound (US$ billion)
Upper bound (US$ billion)
Average (US$ billion)
% of GDP
Air 1.32 3.65 2.49 4.2%
Water 0.74 2.85 1.80 3.0%
Mining* 0.39 0.97 0.68 1.2%
Agricultural land 0.14 0.95 0.54 0.9%
Forests 0.14 0.66 0.40 0.7%
Fisheries 0.23 0.23 0.23 0.4%
Inland floods 0.06 0.17 0.12 0.2%
Coastal zone 0.05 0.05 0.05 0.1%
Cost to Ghanaian society 3.05 9.53 6.29 10.7%
Climate change 1.53 3.10 2.31 3.9%
Cost to Global community 1.53 3.10 2.31 3.9%
** Gold mining, e-waste, and other contaminated sites.
Estimated CoED in Ghana, 2017 (Estimates by authors).
Air Pollution
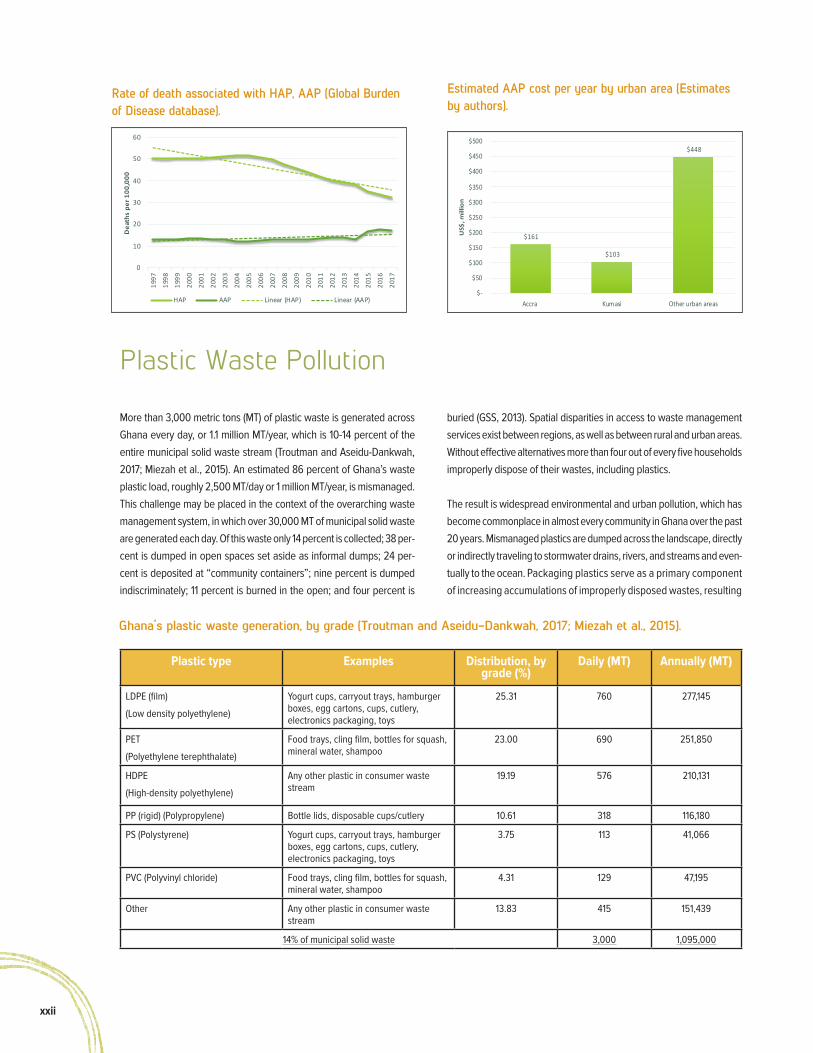
Air pollution (AP) is Ghana’s number one environmental risk to pub-lic health and its sixth-ranked overall risk (out of 19) for death.3 100 percent of Ghana’s population is exposed to PM2.5 levels exceed-ing WHO guidelines. Ghana’s air pollution mortality rate—inclusive of ambient air pollution (AAP) and household air pollution (HAP)—is 105 people per 100,000 (age-standardized) (Stanaway et al., 2018). AP is responsible for eight percent of total mortality with approximately 16,000 Ghanaians dying prematurely each year: 8,500 in urban areas (4,600 due to AAP; 3,900 from HAP) and 7,600 in rural areas (2,600 due to AAP; 5,000 from HAP).4 Over the past two decades, the HAP mortality rate has dramatically decreased, while AAP has slightly increased. AP’s disease burden is disproportionately borne by infants and the elderly: the elderly experience most AP-related premature deaths, while a greater proportion of non-fatal illness is borne by young children.
xxii
$161
$103
$448
$-
$50
$100
$150
$200
$250
$300
$350
$400
$450
$500
Accra Kumasi Other urban areas
US$
, mill
ion
Estimated AAP cost per year by urban area (Estimates by authors).
Plastic type Examples Distribution, by grade (%)
Daily (MT) Annually (MT)
LDPE (film)
(Low density polyethylene)
Yogurt cups, carryout trays, hamburger boxes, egg cartons, cups, cutlery, electronics packaging, toys
25.31 760 277,145
PET
(Polyethylene terephthalate)
Food trays, cling film, bottles for squash, mineral water, shampoo
23.00 690 251,850
HDPE
(High-density polyethylene)
Any other plastic in consumer waste stream
19.19 576 210,131
PP (rigid) (Polypropylene) Bottle lids, disposable cups/cutlery 10.61 318 116,180
PS (Polystyrene) Yogurt cups, carryout trays, hamburger boxes, egg cartons, cups, cutlery, electronics packaging, toys
3.75 113 41,066
PVC (Polyvinyl chloride) Food trays, cling film, bottles for squash, mineral water, shampoo
4.31 129 47,195
Other Any other plastic in consumer waste stream
13.83 415 151,439
14% of municipal solid waste 3,000 1,095,000
Ghana’s plastic waste generation, by grade (Troutman and Aseidu-Dankwah, 2017; Miezah et al., 2015).
Plastic Waste Pollution
More than 3,000 metric tons (MT) of plastic waste is generated across Ghana every day, or 1.1 million MT/year, which is 10-14 percent of the entire municipal solid waste stream (Troutman and Aseidu-Dankwah, 2017; Miezah et al., 2015). An estimated 86 percent of Ghana’s waste plastic load, roughly 2,500 MT/day or 1 million MT/year, is mismanaged. This challenge may be placed in the context of the overarching waste management system, in which over 30,000 MT of municipal solid waste are generated each day. Of this waste only 14 percent is collected; 38 per-cent is dumped in open spaces set aside as informal dumps; 24 per-cent is deposited at “community containers”; nine percent is dumped indiscriminately; 11 percent is burned in the open; and four percent is
buried (GSS, 2013). Spatial disparities in access to waste management services exist between regions, as well as between rural and urban areas. Without effective alternatives more than four out of every five households improperly dispose of their wastes, including plastics.
The result is widespread environmental and urban pollution, which has become commonplace in almost every community in Ghana over the past 20 years. Mismanaged plastics are dumped across the landscape, directly or indirectly traveling to stormwater drains, rivers, and streams and even-tually to the ocean. Packaging plastics serve as a primary component of increasing accumulations of improperly disposed wastes, resulting
0
10
20
30
40
50
60
1997
1998
1999
2000
2001
2002
2003
2004
2005
2006
2007
2008
2009
2010
2011
2012
2013
2014
2015
2016
2017
Dea
ths
per 1
00,0
00
HAP AAP Linear (HAP) Linear (AAP)
Rate of death associated with HAP, AAP (Global Burden of Disease database).
xxiiiexeCuTive summary
in environmental degradation and contributing to disasters, especially flooding and cholera outbreaks. Estimates for Ghana’s contribution to global marine debris range from approximately 92,000 to 260,000 MT every year, or one to three percent of the global total. Without
comprehensive interventions, marine debris inputs are expected to soar in excess of 350,000 MT/year by 2025 (Jambeck et al., 2015; Troutman and Asiedu-Dankwah, 2017).
5. WEEE includes computers and accessories, consumer electronics, refrigerators, freezers, cellular phones, heavy machinery, engines,
motors, batteries, televisions/VCRs/DVD players, radios, transmitters, speakers, microwave ovens, other household appliances, etc.
E-waste
The influx of electrical and electronic equipment (EEE) and outflux of waste electrical and electronic equipment (WEEE)5 has become a complicated challenge and significant environmental issue in Ghana. Amoyaw-Osei et al. (2011) estimate the amount of e-waste generated annually in Ghana at 171,000 MT/year (2009), of which 90-95 percent gets processed. E-waste provides a rich, alluring source of valuable met-als for recovery—gold, silver, palladium, aluminum, copper—offering a livelihood for impoverished people. Estimates place the contribution of e-waste recycling and associated activities to the Ghanaian economy at US$105-268 million, mostly undertaken by the informal sector (Prakash et al., 2010).
Inappropriate processing of e-waste can cause detrimental environ-mental and public health effects as toxic heavy metals such as arsenic, cadmium, copper, nickel, and mercury, and hazardous contaminants, such as dioxins and dioxin-like compounds are released. Glass from cathode ray tubes, found in older computer monitors and televisions, contains large quantities of lead, a neurotoxin, that leach into the soil and
groundwater. Grinding computer circuit boards to extract gold releases lead, tin, and persistent organic pollutants (POPs) that remain in the environment and can bioaccumulate in living organisms (Daum et al., 2017). Wire cables, encased in polyvinyl chloride insulation, are inciner-ated to get the copper inside, creating atmospheric pollution, lending to a wide array of negative health effects, such as complications in the respiratory and cardiovascular systems, including to fetuses and young children. Metal recovery often entails the release of dioxins, carcinogens that cause endocrinological, immunological, and dermatological dis-eases and impair sexual, hormonal, emotional, and physical development (Fujimori et al., 2016). Hazardous and non-hazardous waste is disposed of haphazardly in the open or at unmanaged or informal dumpsites. Some soils have accumulated moderate to high amounts of metal like iron, copper, and lead, with the latter two posing significant hazards to children and aquatic ecosystems (Akortia et al., 2017).
The CEA calculated the cost of exposure to lead and mercury, specifically originating from used lead-acid batteries (ULABs). The cost to Ghanaian society due to disease and lost IQ points in children was estimated at US$440 million per year, equivalent to .75 percent of 2017 GDP.
Electronic waste is burned at Agbogbloshie Scrapyard in Accra.
Steven J. Silverstein, World Bank

xxiv
Status of Forest Resources
6. Ghana defines “forest” as lands that have at least 15 percent canopy cover, minimum tree height of five meters, and minimum area of one hectare. Closed canopy forest is classified as one with a canopy cover exceeding 60 percent; open canopy forest is a modified or disturbed natural forest that has 15-59 percent canopy cover. Open canopy forests are mainly outside of forest reserves.
7. Net forest depletion is calculated as the product of unit resource rents and the excess of roundwood harvest over natural growth (World Bank WDI database).
8. Land degradation is defined as “reduction or loss, in arid, semi-arid and dry sub-humid areas, of the biological or economic productivity
and complexity of rainfed cropland, irrigated cropland, or range, pasture, forest and woodlands resulting from land uses or from a process or combination of processes, including processes arising from human activities and habitation patterns, such as: (i) soil erosion caused by wind and/or water; (ii) deterioration of the physical, chemical and biological or economic properties of soil; and (iii) long-term loss of natural vegetation (Article 1 of the 1994 United Nation’s Convention to Combat Desertification).
Based on analysis of data from 2001-2015 Ghana’s annual deforesta-tion rate was approximately 3.51 percent, equating to yearly losses of greater than 315,000 hectares (ha). Total deforestation during this time period surpassed 4.7 million ha, of which over 84 percent (3.98 million ha) occurred in open forests, compared to 16 percent (745,326 ha) in closed forests.6 From 2001 to 2010, the majority of deforestation occurred in the High Forest (southwestern Ghana) and Transition Zones (central Ghana), but from 2013-2015 there was a significant increase in forest loss across the Savannah Zone (northern Ghana), a shift that pushed annual average forest loss to over one-half million ha/year (MLNR, 2017a). Whereas the loss of closed canopy forest signals encroachment into state protected forests, open forest loss typically reflects conversion of private or customary land for agriculture, indicating expansion of cropland at the expense of forest.
The cost of deforestation to Ghana is about US$400 million, equivalent to 0.7 percent of 2017 GDP. Ghana’s economic dependence on the for-est sector exceeds that of its peers, as does its rate of unsustainable resource use. Net forest depletion7 as a percent of GNI tops the list of (non-small island state) LMICs, as does its contribution from forests to GDP. The economic costs of dependence rose to just under US$3 billion in the years 2014, 2016, and 2017 with unsustainable forest resource extraction being used as a motor for economic growth.
The increasing weakness over time of the timber industry flashes a warning sign. A significant foreign exchange earner as recently as the 1990s and 2000s, timber now provides a negligible contribution to the national economy when compared to commodities such as gold, cocoa, and crude oil. Historically, the forestry sector has employed 100,000. The decline in timber resources has, according to the Ghana Timber Millers Organisation, led to the collapse of nearly 100 companies since the early 2000s, representing 80 percent of the firms that once operated and the loss of 75,000 jobs.
Land Degradation
Land degradation8 has increased over the past two decades in Ghana. Two measures of vegetation health—the normalized difference vegeta-tion index (NDVI) and net primary productivity (NPP)—confirm this. An analysis of annual mean vegetation density—defined as the number of plants per unit area—shows that Ghana’s vegetation health has been decreasing since 2000. Net Primary Productivity (NPP)9, an indicator of vegetation health, has exhibited a downward trend in every region except for Greater Accra (which is mostly urban) and Western (which is heavily forested). Declining NPP, considered a proxy indicator for land degradation, shows land degradation is intensifying in the north and middle of the country (particularly Upper West, Northern, Upper East, Brong Ahafo, and Ashanti regions) (Barbier et al., 2016). Agriculture is the primary driver of land degradation in Ghana.
Soil erosion rates are high in the Upper West, Northern, Brong Ahafo, and Upper East Regions where NPP has been on a strong downward trend for the past two decades (2000-2016). Soil erosion from wind or water stems from inappropriate agriculture, forestry, and infrastructure practices. In areas with more degraded lands surface runoff, and hence
Net forest depletion among Ghana's peers (World Bank WDI database).
20002001
20022003
20042005
20062007
20082009
2010 20112012
20132014
20152016
20170%
2%
4%
6%
8%
10%
12%
% o
f GN
I
Ghana Kenya Mauritania Nicaragua Myanmar

xxvexeCuTive summary
9. Data from World Bank Poverty and Equity Data Portal, http://povertydata.worldbank.org/poverty/country/GHA.
10. The word “galamsey” is derived from the phrase “gather them and sell.”
soil erosion, is widespread and concentrated. Erosion is the greatest threat to Ghana’s drylands in the Guinea and Sudan savannah zones in the North, where land degradation is qualified as “desertification.” The accompanying soil erosion map illustrates soil erosion geographically across the country with darker areas suffering the worst effects. Apart from the northern regions, there are significant levels of soil erosion in the upper Volta Region and Brong Ahafo, as well as in Accra, where insufficient urban planning has compromised the soil structure.
The cost of soil erosion is estimated at about US$0.54 billion, or 0.9 percent of the country’s GDP. Land degradation harms Ghana’s most vulnerable population, the rural poor, entrenching extreme poverty even more deeply. The 32 districts with increasing poverty rates are those more likely to have a negative NPP trend, while districts with reduced poverty rates tend to see positive changes in NPP. In 2012, there were 6.2 million people living below the national poverty line in Ghana.10 Although the percent poverty headcount ratio for the entire country is 24 percent, it is 40 percent in districts with degraded land—those with negative or no change in NPP. Districts that have seen little or no poverty reduction tend to see more intense land degradation, and NPP change is more negative in places with a stagnant or increased poverty rate.
Illegal Artisanal and Small-scale Gold Mining
Artisanal and small-scale gold mining (ASGM) is a contributor to national wealth and poverty reduction. Of the 120 MT of gold that Ghana produced in 2016, 39 percent came from ASG miners, up from 12 percent in 2004 (MoF, 2018). ASGM production has increased substantially since 2010 in response to high gold prices, high unemployment, and a slump in agricultural production. However, much of this increase was owed to illegal ASGM, referred to colloquially as “galamsey11”. National galamsey employment numbers, though unknown, are likely quite high; estimates range from 500,000 to 1.1 million workers, including direct and indirect jobs (e.g. Hilson et al., 2007; McQuilken and Hilson, 2016), implying that the informal gold mining economy may employ the equivalent of four to eight percent of Ghana’s workforce. Women’s participation in ASGM-related activities may be as high as half this workforce (McQuilken and Hilson, 2016).
Acknowledged as widespread, the full geographic extent of galamsey is unknown as data are limited due to the clandestine nature of opera-tions. Owusu-Nimo et al. (2018) identified 7,470 galamsey operations in 312 towns and villages, an average of 24 per locale, in the Western
Region alone. Conducted hastily and without oversight, illegal min-ing leads to deforestation and loss of biodiversity, accelerated soil erosion and sedimentation, and water and air pollution. Increased turbidity, sediment loading, and heavy metal contamination in the Pra and Birim Rivers are attributed to galamsey, disrupting aquatic environments and fisheries and threatening access to potable water. Mineral belts coincide with Ghana’s remaining forested areas, posing a massive deforestation and forest degradation risk. The destruc-tion of farmlands in galamsey areas has engendered food security issues, including increases in the price of staple crops (Bansah et al., 2018). Gold and cocoa especially maintain an uneasy coexistence and galamsey is a likely contributor to decreased cocoa health and yields (Boateng et al., 2014; Snapir et al., 2017). Mercury used in galamsey—to separate gold from impurities—contaminates land, water, the atmosphere, and people. Levels of mercury have been comparable between miners and villagers, signaling migration of pollution away from mining areas and into the broader community. When gold amalgamation occurs at home, women and children are exposed to toxic mercury fumes, leading to serious long-term health consequences (Teschner, 2012).
Some of galamsey’s costs can be quantified. The total annual cost attrib-uted to ASGM-related mercury exposure is estimated at US$240 million, or 0.4 percent of 2017 GDP. The GoG estimates that US$2.3 billion left
Soil erosion (RUSLE model) (World Bank Hidden Dimensions Dataset).

xxvi
the country via illegal ASGM, escaping taxation by the Ghana Revenue Authority.12 The cost of water provision rises as water treatment plant maintenance becomes more expensive and communities are forced to dig new wells. The destruction occasioned by earthmoving machinery and gold processing leaves land reclamation costly. Mantey et al. (2016) estimate that US$250 million is required just for the Western Region to restore lands and water bodies destroyed by galamsey.
Coastal Ecosystem
Ghana’s coastal zone, representing six percent of the country’s land area, hosts over a quarter of the nation’s population, its main urban centers and fastest-growing areas (e.g. Accra, Tema, Takoradi), and 70 percent of its industries and businesses (World Bank, 2010). Ghana’s coast, however, faces several challenges, including coastal erosion and flooding, overexploitation of natural resources, marine and coastal pol-lution, illegal sand mining, loss of ecosystem services, severe weather, and rapid urbanization and unsustainable land use.
Ghana loses about 2.7 million m2 of its shore every year13, with 80 percent of the shoreline actively eroding (Appeaning Addo et al., 2008). Coastal
11. MLNR presentation “Sanitization of Illicit Mining Activities in Ghana,” made at Ministry of Foreign Affairs, 10 May 2017
12. MESTI minister quoted in www.modernghana.com/news/697008/ghana-marks-world-oceans-day.html
13. MESTI minister quoted in www.modernghana.com/news/697008/ghana-marks-world-oceans-day.html.
erosion and flooding are particularly serious in and near Accra where sea-level rise has increased erosion intensity—by 2100, the Greater Accra’s coastline is expected to retreat by around 200 meters—and inundation of vulnerable areas. Accra is particularly susceptible to flooding with a 1-in-5 chance of flooding in any given year (Asumadu-Sarkodie et al., 2015). Rapid urbanization and poor solid waste management exacerbate the disaster risk, making low-lying neighborhoods—often the poorest in the city—vulnerable to flooding during heavy precipitation. Such threats will further increase due to rapid population growth and the impacts of climate change.
Exposure to coastal floods and soil erosion is estimated at 1.8 million people (2010 estimates) (USAID, 2014). These people live in the parts of the coastal zone situated below an elevation of 20 m, about half of whom live below 10 m. This exposure is projected to increase 67 percent by 2050 and the coastal economy and ecosystems are expected to suffer from degradation. World Bank (2017) reports that drift from rural to urban centers, the industrialization of coastal districts as well as a high urban population growth rate of three percent, will place increasing stress on the coastal ecosystems, producing more coastal erosion and impacting more people during flooding. Climate change aggravates this situation with projected sea level rise.
0%
5%
10%
15%
20%
25%
30%
35%
40%
45%
0
500,000
1,000,000
1,500,000
2,000,000
2,500,000
3,000,000
3,500,000
4,000,000
4,500,000
5,000,000
1990 1992 1994 1996 1998 2000 2002 2004 2006 2008 2010 2012 2014 2016
Shar
e of
tota
l pro
duct
ion
Oun
ces
prod
uced
Total gold production ASGM production (right axis)
Gold Production and ASM Share (MLNR, 2017).

xxviiexeCuTive summary
Total annual economic impact of coastal erosion and flooding was esti-mated at US$47 million in 2015, corresponding to the equivalent of >0.1 percent of Ghana’s 2017 GDP (and 1.5 percent of GDP in the coastal area).
Status of Fisheries Resources
The fishing industry contributes significantly to food security and nutrition, employment and household income, and foreign exchange earnings, yet some predict the imminent collapse of Ghana’s capture fishing sector. There are indicators to support the sense of unease. A combination of low fishing catch yield and increasing human popu-lation has increased fish imports. Fish consumption per capita has declined steadily over the past decade and is down twenty percent
to 21 kg (2016). Between 1996-2016 landings of small pelagic spe-cies—mainly anchovies, chub mackerel, and sardinellas, which are
TOGO
G H A N A
CÔTE
D'IV
OIRE
G u l f o f G u i n e aEsamang
Axim
Prince’s T
ownAketechi
Dixcove
Adjua
Amanful Kuma
Shama
Komenda
Kokrobite
Bortianor
Nungua Teshie
Tema
Prampram
Old Ningo
AdaDzito
Keta
Labadi
Elmina
Tantuam
Senya Breku
ACCRA
0 50 Kilometers
Low Under protection/being protected
Direction of Littoral DriftModerate
High
EROSION SEVERITY
IBRD 44986 | APRIL 2020
Coastal erosion hotspots (Angnuureng et al., 2013).
$27
$957
$1,639
$20
$17
$26
$0
$200
$400
$600
$800
$1,000
$1,200
$1,400
$1,600
$1,800
2015 2050 2100
Mill
ions
(US$
)
Erosion Flooding
Annual cost of coastal degradation (Compiled by authors based on World Bank, 2017a).
Fifty-seven percent of these impacts can be attributed to coastal erosion. Due to climate change the impact, most of which will be attributed to soil erosion, is expected to increase to US$1.6 billion by 2100.
referred to as “the people’s fish” because of their importance to local economies and diets--decreased 86 percent, from 138,955 to 19,608 MT (MoFAD, 2018). For the past ten-plus years, over half the fish consumed in Ghana has come from imports. In 2017 two-thirds of the whole frozen fish imports were from other African countries.
Ghana’s marine fisheries exhibit classic signs of overexploitation: declining catch rates and changes in the composition of key species that are caught, including a prevalence of small fish. Since fishing
Annual catch per canoe and catch per fisherman in artisanal marine capture fisheries (Authors estimates from MoFAD data).
1986
1987
1988
1989
1990
1991
1992
1993
1994
1995
1996
1997
1998
1999
2000
2001
2002
2003
2004
2005
2006
2007
2008
2009
2010
2011
2012
2013
2014
2015
2016
0.0
0.5
1.0
1.5
2.0
2.5
3.0
3.5
10
15
20
25
30
35
40
Met
ric to
ns
Met
ric to
ns
Catch per Canoe Catch per Fishermen (right axis)
Linear (Catch per Canoe) Linear (Catch per Fishermen (right axis))
Origin of fish consumed, by proportion (MoFAD, 2017).
52%58% 55% 58% 57% 56% 56% 59% 62% 59% 59%
48%42% 45% 42% 43% 44% 44% 41% 38% 41% 41%
0%
10%
20%
30%
40%
50%
60%
70%
80%
90%
100%
2006 2007 2008 2009 2010 2011 2012 2013 2014 2015 2016
Orig
in o
f fis
h co
nsum
ed
Domestic Net import
xxviii
fleets look to capture similar pelagic and demersal fish stocks work-ing in the same areas has often led to conflict among fishermen. Several converging factors explain this prototypical “tragedy of the commons”. Proximate causes include a dearth of job opportunities in other sectors, coupled with an open-access regime, where the right to harvest fish is open to all. Direct causes of fisheries decline are fleet overcapacity, illegal fishing, and climate change. The total annual cost of marine overfishing in Ghana is estimated at US$233 million—the sum of lost fishing rents—equivalent to 0.4 percent of 2017 GDP.
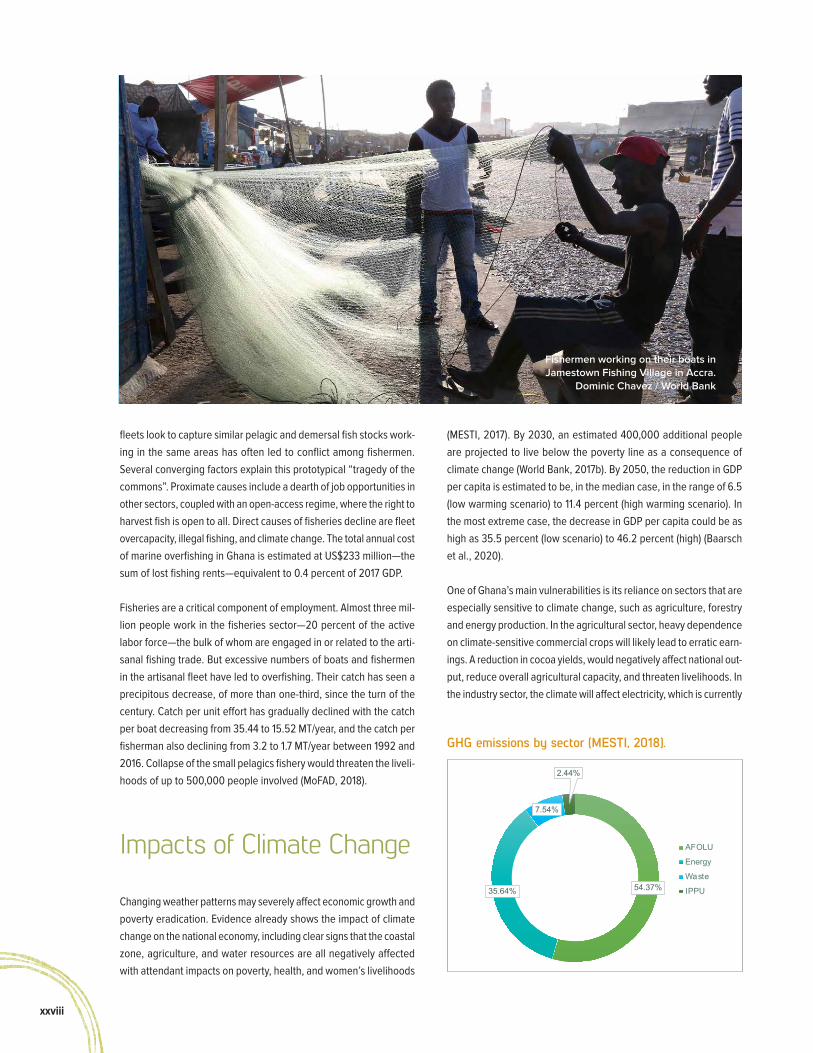
Fisheries are a critical component of employment. Almost three mil-lion people work in the fisheries sector—20 percent of the active labor force—the bulk of whom are engaged in or related to the arti-sanal fishing trade. But excessive numbers of boats and fishermen in the artisanal fleet have led to overfishing. Their catch has seen a precipitous decrease, of more than one-third, since the turn of the century. Catch per unit effort has gradually declined with the catch per boat decreasing from 35.44 to 15.52 MT/year, and the catch per fisherman also declining from 3.2 to 1.7 MT/year between 1992 and 2016. Collapse of the small pelagics fishery would threaten the liveli-hoods of up to 500,000 people involved (MoFAD, 2018).
Impacts of Climate Change
Changing weather patterns may severely affect economic growth and poverty eradication. Evidence already shows the impact of climate change on the national economy, including clear signs that the coastal zone, agriculture, and water resources are all negatively affected with attendant impacts on poverty, health, and women’s livelihoods
(MESTI, 2017). By 2030, an estimated 400,000 additional people are projected to live below the poverty line as a consequence of climate change (World Bank, 2017b). By 2050, the reduction in GDP per capita is estimated to be, in the median case, in the range of 6.5 (low warming scenario) to 11.4 percent (high warming scenario). In the most extreme case, the decrease in GDP per capita could be as high as 35.5 percent (low scenario) to 46.2 percent (high) (Baarsch et al., 2020).
One of Ghana’s main vulnerabilities is its reliance on sectors that are especially sensitive to climate change, such as agriculture, forestry and energy production. In the agricultural sector, heavy dependence on climate-sensitive commercial crops will likely lead to erratic earn-ings. A reduction in cocoa yields, would negatively affect national out-put, reduce overall agricultural capacity, and threaten livelihoods. In the industry sector, the climate will affect electricity, which is currently
GHG emissions by sector (MESTI, 2018).
54.37%35.64%
7.54%
2.44%
AFOLU
Energy
Waste
IPPU
Fishermen working on their boats in Jamestown Fishing Village in Accra.
Dominic Chavez / World Bank

xxixexeCuTive summary
it is already mightily diminished. This disincentivizes respect for the rule of law, as illustrated by illegal gold mining.
Institutional inefficiencies. Ghana has a high number of institutions mandated to deal with environmental management, yet the institutional framework for environmental management is incomplete. Strategic policy direction is missing for environmental resource management issues. MLNR and MEST (2010) reported the combination of potentially conflict-ing mandates within single institutions—policy coordination, regulation, and management—as impeding improvements to the country’s environ-mental governance system. They also view the Constitution’s wording as ambiguous in defining the relationship between sector agencies and parent ministries. In their view, the agencies need stronger policy direc-tion from parent ministries to operate efficiently within the national policy framework. The environmental resource management system is weak at all levels, especially at the decision-making and policy and district levels.
Ministry of Environment, Science, Technology and Innovation (MESTI).
Weak technical capacity in creating environmental policies has dimin-ished MESTI’s ability to provide effective direction on environmental management issues. The Ministry gives disproportionate attention to science and technology issues to the neglect of environmental aspects. The Ministry’s coordination function is also underutilized, with poor align-ment of environmental sector stakeholders, partly because the frame-work delineating stakeholder roles and responsibilities lacks clarity, thus there is limited mainstreaming of environmental concerns across MDAs. Information and knowledge management both within MESTI and with stakeholders is poor and most departments operate in “compartmen-talized” units without sharing information. The low level of knowledge and public awareness of environmental issues can be attributed to the lack of a coordinated environment program, and policies are often not properly disseminated or communicated to inform decisions at the local level. MESTI suffers from budgetary issues that adversely affect program implementation. Monitoring and evaluation (M&E) of environmental indi-cators, both internally and externally, is weak with no comprehensive database available to track inputs, outputs, outcomes, and impacts.
Environmental Protection Agency (EPA). The EPA suffers from institu-tional weaknesses, which include: a weak policy environment; weak enforcement and compliance system; declining budget and resources for program implementation; limited decentralization and low budget allocations to local levels, as well as poor accountability of resources by departments and field offices in terms of performance (results, outputs, and outcomes); poor staff remuneration and performance management, inadequate planning, monitoring and evaluation, and knowledge man-agement systems; suboptimal coordination with partner organizations; and poor client service orientation. The 2008 Ghana Environmental Sector Study concluded that these weaknesses led to inadequate ser-vice delivery, underperformance of the permitting and certification sys-tem, low levels of mainstreaming environment across sectors, low staff morale and high turnover, among others. To address these issues, the EPA Five-Year Strategic Plan (2011-2015) proposed activities covering
one of the fastest growing subsectors. Climate-related factors signifi-cantly influence Ghana’s energy generation options, which rely on water availability for cooling (thermal power plants) and production (hydropower, which generates 64 percent of Ghana’s electricity). In terms of the services sector, erosion, waterlogging, and flooding may curtail transportation and trade activities, while access to clean drinking water and sewage and sanitation, and associated health risks, may reduce the ability of an economically-active population to engage in productive activities. The cost of inland flooding is currently estimated at US$115 million/year, equivalent to 0.2 percent of GDP. Climate change may increase the recurrence of flooding events, and with the value of assets increasing due to economic growth there is a concurrent increase in risk for higher flood damages.
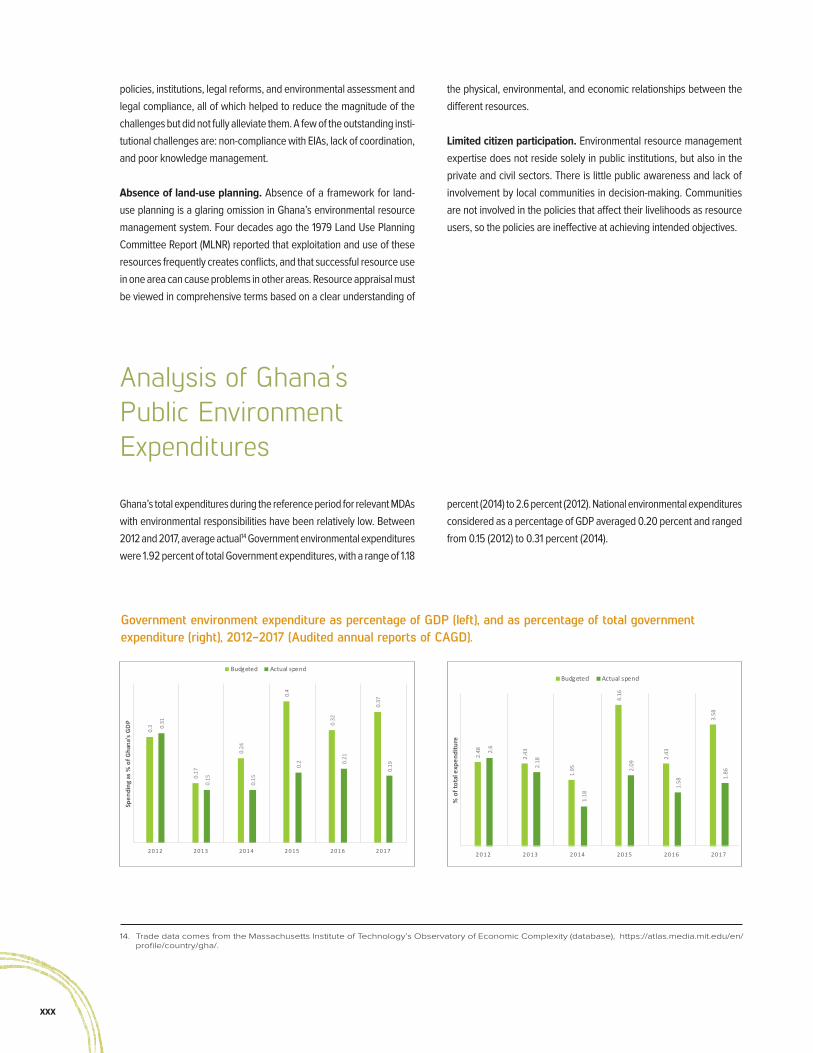
Finally, there are the costs of Ghana’s CO2 emissions to the global community, estimated at US$2.3 billion each year, equivalent to just under four percent of Ghana’s GDP. Ghana’s GHG emissions and short-lived climate pollutants inventory shows total national GHG emissions in 2016 were approximately 42.15 million MtCO2e, which was 66 and seven percent higher than the levels reported in 1990 and 2012, respectively. The rising trend in GHG emissions, over two percent a year over the period 1990-2016, can be attributed to demo-graphic and economic growth. The most recent data indicate the AFOLU sector as the largest source of emissions, especially land use change that converts forest into grazing and cropland (MESTI, 2018).
Key Policy and Institutional Gaps and Challenges
Policy and law implementation. Inefficient leadership and coordina-
tion. The inability to provide effective environmental leadership and coordination has fostered inter-agency conflict and functional overlap. First, the protocol for a national response to emerging environmental issues is unclear. One of the challenges is that many institutions are not equipped with the legal capacity to monitor and enforce actions. Second is an absence of national strategic policy direction and limited policy dialogue and oversight. Third, although Ministries have the responsibility for policies, they may find themselves stymied in the execution of this role due to competition with the departments and agencies they super-vise. Galamsey is a case in point for the failure of clear, well-delineated environmental leadership.
Unequal benefits sharing. Law enforcement has proved ineffective because natural resource laws emphasize control over planning and are not management-oriented. Not enough is done to help local populations to manage resources and the populations benefit little from resource revenues. By the time that revenue trickles to ministries in charge of envi-ronmental issues and the localities from which that revenue is generated,
xxx
policies, institutions, legal reforms, and environmental assessment and legal compliance, all of which helped to reduce the magnitude of the challenges but did not fully alleviate them. A few of the outstanding insti-tutional challenges are: non-compliance with EIAs, lack of coordination, and poor knowledge management.
Absence of land-use planning. Absence of a framework for land-use planning is a glaring omission in Ghana’s environmental resource management system. Four decades ago the 1979 Land Use Planning Committee Report (MLNR) reported that exploitation and use of these resources frequently creates conflicts, and that successful resource use in one area can cause problems in other areas. Resource appraisal must be viewed in comprehensive terms based on a clear understanding of
Analysis of Ghana’s Public Environment Expenditures
Ghana’s total expenditures during the reference period for relevant MDAs with environmental responsibilities have been relatively low. Between 2012 and 2017, average actual14 Government environmental expenditures were 1.92 percent of total Government expenditures, with a range of 1.18
Government environment expenditure as percentage of GDP (left), and as percentage of total government expenditure (right), 2012-2017 (Audited annual reports of CAGD).
0.3
0.17
0.24
0.4
0.32
0.37
0.31
0.15
0.15
0.2 0.21
0.19
2 012 2013 2014 2015 2016 2017
Spen
ding
as
% o
f Gha
na's
GD
P
Budgeted Actual spend2.48
2.43
1.95
4.16
2.43
3.58
2.6
2.18
1.18
2.09
1.58
1.86
2 012 2013 2014 2015 2016 2017
% o
f tot
al e
xpen
ditu
re
Budgeted Actual spend
14. Trade data comes from the Massachusetts Institute of Technology’s Observatory of Economic Complexity (database), https://atlas.media.mit.edu/en/profile/country/gha/.
the physical, environmental, and economic relationships between the different resources.
Limited citizen participation. Environmental resource management expertise does not reside solely in public institutions, but also in the private and civil sectors. There is little public awareness and lack of involvement by local communities in decision-making. Communities are not involved in the policies that affect their livelihoods as resource users, so the policies are ineffective at achieving intended objectives.
percent (2014) to 2.6 percent (2012). National environmental expenditures considered as a percentage of GDP averaged 0.20 percent and ranged from 0.15 (2012) to 0.31 percent (2014).
0.3
0.17
0.24
0.4
0.32
0.37
0.31
0.15
0.15
0.2 0.21
0.19
2 012 2013 2014 2015 2016 2017
Spen
ding
as
% o
f Gha
na's
GD
P
Budgeted Actual spend
2.48
2.43
1.95
4.16
2.43
3.58
2.6
2.18
1.18
2.09
1.58
1.86
2 012 2013 2014 2015 2016 2017
% o
f tot
al e
xpen
ditu
re
Budgeted Actual spend

xxxiexeCuTive summary
Recommendations to Improve Environment and Natural Resource Management in Ghana
Short-term (1-2 years) Medium-term (2-5 years) Long-term (5+ years)
Air p
ollu
tion
• Improve enforcement of existing reg lations (MESTI/EPA)
• Finalize the draft AQM policy (Cabinet, MESTI)
• Create a multi-stakeholder platform to coordinate AQM planning across public, private, and non-profit sectors (Cabinet)
• Reinforce/recruit staff with proper AQM training (MESTI/EPA)
• Make the case for clean air policies as an avenue to protect human capi-tal and develop economic opportuni-ties (MESTI/EPA)
• Establish a robust AQM data man-agement system to support deci-sion making and provide alerts to the public (MESTI/EPA)
• Communicate behavior change on HAP risks (MESTI/EPA)
• Bolster AQM institutional framework (Cabinet, MESTI)
• Enhance EPA’s AQM regulatory/enforcement authority (Parl., MESTI)
• Author guidelines, regulations, by-laws (Parl., MLGRD/MMDAs)
• Collaborate w/Nigeria, ECOWAS to reduce vehicle emissions (MESTI)
• Lower import duties on eco-friendly vehicles; raise on high-emission ones (MoF/GRA)
• Transition away from solid biofuels; establish HAP guidelines for clean cookstoves to regulate residential combustion (MESTI/EPA, MoTI)
• Analyze and reduce trash burn-ing; forge public-private municipal waste mgmt. partnerships (MESTI/EPA, MLGRD/MMDAs, MSWR)
• Improve understanding of AP sources; build analytical capacity (MESTI)
• Increase funding for AQM-qualified staff (MESTI, MoF)
• Mainstream/coordinate AQM policy plan-ning, implementation, enforcement across GoG (MDAs, MLGRD/MMDAs)
• Quantify air quality impacts with natural capital accounting, cost- benefit analysis (MESTI, MoF)
• Monitor air quality in rural settings to address HAP (MESTI/EPA)
• Impose sufficient distances between industrial, commercial, residential zones (MESTI/LUSPA, MLGRD/MMDAs)
• Design interventions to promote LPG cookstove use (MESTI, MoTI)
Plas
tic w
aste
• Operationalize the Plastic Waste Recycling Fund (Parl., MoF/GRA)
• Amend Act 863 compliance protocols to tax imported semi-finished and fin-ished plastic products (Parliament, MoF/GRA)
• Communicate behavior change to plastics consumers for conscien-tious waste management (MESTI, MoE/GES, MSWR, NCCE)
• Clarify mandates/roles in enforce-ment (MESTI, MSWR, MLGRD)
• Perform market analysis of financial sustainability of recyclable plastic products to promote private sector initiatives (MESTI, MoTI)
• Establish a cross-sectoral body to hold authority for making and imple-menting plastic management policies (Cabinet)
• Dedicate budgetary resources to agencies tasked with enforcement of anti-plastic pollution regulations (Cabinet, MoF)
• Improve plastic waste mgmt. capac-ity, coordination at subnational admin. levels (MLGRD/MMDAs/RCCs)
• Explore innovative models for sus-tainable financing: plastics levy; con-sumption tax; increase cost of plastic bags (MoF/GRA)
• Incentivize plastic recycling using cash-back schemes (MESTI, MSWR)
• Create reverse logistics schemes that remunerate retailers for collecting waste plastics (MESTI, MSWR)
• Legislate extended producer responsibil-ity: hold manufacturers accountable for plastic waste management at the end of useful product life (i.e. once in the waste stream) (Parliament)
• Integrate economic efficiency criteria into project design and public procurement awards (MOPP/PPA)

xxxii
Short-term (1-2 years) Medium-term (2-5 years) Long-term (5+ years)
E-w
aste
• Perform a detailed gap analysis for e-waste management (Parl., MESTI)
• Increase regularity of e-waste regula-tion enforcement efforts (MESTI/EPA, MLGRD/MMDAs)
• Reframe the national discourse around e-waste (Cabinet, MESTI)
• Raise awareness among policymakers to promote greater sensitivity to the human dimension and encourage new legisla-tion (Parliament)
• Take steps to safeguard the welfare of e-waste laborers (MESTI/EPA)
• Build capacity of customs officials to monitor ports for illegal WEEE, enhance internal oversight and quality control, coordinate with neighboring countries (MoF/CEPS)
• Designate informal dumpsites as for-mal recycling centers to permit closer inspection (MSWR)
• Ensure WEEE goes to approved sites, setting up collection points and incentiv-izing their use (MLGRD/MMDAs)
• Lay out the roles and expectations of MMDAs vis-à-vis e-waste and pass strin-gent, enforceable municipal by-laws (MLGRD/MMDAs)
• Collect data on e-waste flows (MESTI/EPA, MoF/CEPS/GSS)
• Conduct value chain analysis to deter-mine current and needed levels of human and physical capital for e-waste recycling (MESTI)
• Explore carbon financing to forge an e-recycling sector (MESTI, MoF)
• Create a mandatory registration/licensing scheme for recycling enterprises, incl. informal sector; incentivize adherence (MESTI/EPA)
• Improve metal recovery through partnerships, technology transfer (MESTI, MoTI)
• Bolster infrastructure at municipal landfills (MSWR)
• Assist scrap dealers’ associations to better organize the sector (MLGRD/MMDAs, MESTI, MSWR)
• Professionalize the sector through tripartite public-private partner-ships (private sector, GoG, informal sector) (President/GIPC)
• Legislate extended producer responsibility (MESTI, MoTI)
Fore
st R
esou
rces
• Improve coordination, communication, collaboration across forestry sector-relevant public authorities/institutions (MLNR/FC, MDAs)
• Appoint institutional leaders who have technical appreciation and deep knowl-edge of forest resources management (President, MLNR)
• Legislate tree tenure reforms, incentiv-ize tree protection (Parliament)
• Scale-up extension services promoting adoption of agroforestry models, espe-cially in timber, cocoa (MLNR/FC, MoFA/Cocobod)
• Leverage evidence from natl. forest monitoring (MLNR/FC)
• Offer material and financial support to trade associations in the forestry sec-tor to foster partnerships with potential investors (MLNR/FC, MoTI)
• Promote dialogue among regional tree crop producers (MLNR, MoFA)
• Update the national FRL every two years (MLNR/FC)
• Harmonize/align forest monitoring & reporting methods (MLNR/FC)
• Enable no-deforestation supply chains (MLNR, MoTI)
• Enable investment in NTFP value chains, value addition (MoTI/NBSSI)
• Enable sustainable cocoa production (Cabinet, MLNR, MoFA/Cocobod)
• Strengthen, scale-up CREMAs/HIAs (MLNR)
• Expand wildlife tourism for middle-income clients (MoTAC)
• Recommit to sustainable forest mgmt across the sector (MLNR/FC)
• Conduct a house-to-house tree registra-tion campaign (MLNR/FC)
• Pioneer REDD+ forest reserves; incen-tivize sustainable forest, land, cocoa mgmt., private sector engagement (MLNR, MoFA/Cocobod)
• Improve forest investment climate to promote foreign and domestic private investment; encourage extension of commercial credit lines to prospective timber planta-tion owners (MLNR/FC, MoF)
• Bring stakeholders together in par-ticipatory land use planning (MESTI/LUSPA, MLGRD/RCC/MMDAs, MLNR/FC/LC, MOCRA)
• Address illegalities and lack of transparency within the sector (President, MLNR/FC)
• Explore how to generate sustain-able revenue from payment for for-est ecosystem services (MLNR/FC)
• Prioritize research and develop-ment of new or under-developed forest resource value chains (MLNR/FC, MoTI/NBSSI)

xxxiiiexeCuTive summary
Short-term (1-2 years) Medium-term (2-5 years) Long-term (5+ years)La
nd D
egra
datio
n
• Improve SLWM communication, knowledge management (MESTI)
• Improve coordination on land use mgmt (MESTI/EPA/LUSPA, MLGRD/MMDAs/RCCs, MLNR/FC/LC/MC, MoFA, NDPC)
• Analyze and disseminate indigenous and farmer-to-farmer land degrada-tion management practices (MESTI/EPA, MoFA/DAES)
• Work with communities to promote low-technology rehabilitation of degraded lands; increase trees on farms (MESTI/EPA, MoFA/DAES)
• Establish/reinforce inclusive local land governance structures (MESTI/EPA, MLGRD/MMDAs, MoCRA, MoFA)
• Increase support to environmental management committees at the regional and district levels (MLGRD/MMDAs/RCCs)
• Relieve pressure on trees in the landscape (MESTI/EPA, MoFA/DAES)
• Improve map preparation, dissemi-nation (MESTI/LUSPA, MLNR/GSD)
• Develop spatial dev. plans (MESTI/LUSPA, MLGRD/MMDAs/RCCs)
• Scale-up existing interventions in SLWM (MESTI, MLNR/FC, MoF)
• Incorporate ecosystem values in use planning exercises and project economic analysis (MESTI, MoFA, MoF)
• Update national education curricula to contain messages on avoiding land deg-radation or improving lands (MESTI, MoE)
• Promote inclusivity in SLWM by creating employment opportunities for vulnerable groups (MESTI/EPA, MLNR/FC, MoFA/DAES)
• Harmonize/streamline land management policies and regulations; strengthen key implementing institutions (MESTI/EPA/LUSPA, NDPC)
• Formalize NDPC role as lead institution in land use planning (Parl.)
• Promote enabling environment for land use planning and mainstreaming across sectors (Cabinet)
• Update land use plans; make develop-ment planners available to the local level (MESTI/LUSPA, MLGRD/MMDAs/RCCs)
• Progress towards a landscape approach to development planning and SLWM at national/subnational levels (NDPC, MESTI/EPA, LUSPA)
• Work with traditional authorities to improve communication, knowledge transfer on land degradation-neutral farming, women’s access to land (MESTI/EPA, MLNR/LC, MoCRA, MoFA/DAES)
• Encourage and increase women’s access to land ownership, markets, credit, and extension services to facili-tate investments in land degradation neutral activities (MLNR/LC)
• Build momentum for land tenure, secu-rity reforms (Cabinet, Parl.)
• Undertake a comprehensive land reg-istration exercise (MLNR/LC)
• Incentivize individuals to invest in their lands (MLNR/LC, MoFA, MoF)
• Establish, scale, and support CREMAs to incentivize and decentralize local land use planning and management (MESTI/EPA, MLNR/FC)
• Resource communities to control bush-fires (MoFA/DAES, MoI/GNFRS)
Plumes of smoke from a rural kitchen.Curt Carnemark / World Bank

xxxiv
Short-term (1-2 years) Medium-term (2-5 years) Long-term (5+ years)
Illeg
al M
inin
g • Clarify/codify roles, responsibilities;
assign EPA authority over waste sites; provide staff/resources (Cab., Parl., MESTI/EPA, MoF)
• Strengthen environ. regulations related to mining (Parl., MESTI, MLNR)
• Strengthen coordination b/n key agen-cies (MESTI/EPA, MLNR/FC/MC)
• Ease community access to officials (MESTI/EPA, MLNR/FC/MC)
• Train agencies in use of technologies (e.g. drones, remote sensing) to target ASGM interventions (MESTI/EPA, MLNR/FC/MC, MSWR/WRC)
• Deploy interagency teams to identify, classify, prioritize sites; make informa-tion public (MESTI/EPA, MLNR/MC/FC, MSWR/WRC)
• Accelerate Minamata Conv. implemen-tation (MESTI/EPA, MLNR/MC)
• Operationalize MDF guidelines to improve benefits sharing, public par-ticipation, transparency (Parl., MLGRD/MMDAs, MoF/GRA)
• Establish an ASM mining permit-ting/monitoring system (MESTI/EPA, MLNR/FC, MLNR/MC, MSWR/WRC)
• Improve transparency, citizen partici-pation in MDF activities (President, MLGRD/MMDAs, MLNR, MoF/GRA)
• Establish a galamsey environmen-tal trust fund to restore rural mining areas (President, Parliament, MoF/GRA)
• Institute legal guidelines that allow judicial remedies for recovery of cleanup costs from those parties responsible for the damages, e.g. use proceeds from the auctioning of confiscated galamsey equipment to replenish the environmental TF (MoJ)
• Expand MMIP to build human capital in environ. mgmt.; use this workforce for waste mgmt projects nationwide (MESTI/EPA, MLNR)
• Use MDF to expedite clean-up, remedia-tion, redevelopment; foster citizen par-ticipation and private sector partnerships (MESTI, MLNR)
• Reclaim galamsey brownfields and turn them into economically productive assets (MESTI, MLGRD/MMDAs, MLNR, MWH)
• Engage communities to ensure long-term stewardship over recovered areas (MESTI/EPA/LUSPA, MLGRD/MMDAs, MLNR/FC/MC)
• Empower institutions to perform watch-dog roles in the oversight of funding spent (MoF, MLNR/OASL)
• Establish performance indicators and create a scorecard to judge progress in rehabilitating contaminated public spaces (MESTI/EPA)
• Implement a performance M&E scheme to follow redevelopment and analyze long-term stewardship (MESTI, MLNR, MWH)
Coas
tal E
cosy
stem
• Identify weaknesses/explore measures for improved coastal mgmt (MESTI/EPA/LUSPA, MoFAD, MLGRD/MMDAs/RCCs, MWH/HSD)
• Support the Coastal Development Authority as a coordination mecha-nism for coastal resilience, protection, planning, investment; hold coastal zone development workshops to map stake-holders and build a forum for coastal issues (MLGRD/MMDAs, MoF, MSDI)
• Enhance use of geographic informa-tion systems and satellite imagery for coastal zone management (MESTI/EPA, MLGRD/MMDAs, MWH)
• Identify vulnerable coastal communi-ties (MESTI/EPA, MLGRD/MMDAs)
• Continue regional approach to coastal management (MESTI/EPA)
• Improve drainage, flood control infrastructure/management systems (MESTI/EPA, MLGRD/MMDAs, MLNR/LC, MoF, MSWR, MWH/HSD)
• Invest in and manage spatial plan-ning of terrestrial and marine coastal areas (MESTI/EPA/LUSPA, MLGRD/MMDAs, MLNR/FC/LC/MC, MoEP, MoFAD, MSDI/CDA, MWH, NDPC)
• Identify/secure areas to increase retention capacity, reduce runoff; develop green areas on floodplains (MESTI/EPA, MLGRD/MMDAs, MWH/HSD, MSWR/WRC)
• Analyze contribution of pollution from off and on-shore extractives and determine appropriate regula-tions (MESTI/EPA, MoEP, MLNR/MC)
• Construct public green-gray infrastruc-ture works (MESTI/EPA/LUSPA, MLGRD/MMDAs/RCCs, MoF, MSWR/WRC, MWH/HSD)
• Accommodate changing coastline through: flood-proofing, avoiding lique-faction zones, population resettlement, community participation (MESTI/EPA/LUSPA, MLGRD/MMDAs/RCCs, MSWR/WRC, MWH/HSD)
• Establish a multi-sectoral coastal program (MSDI/CDA, MDAs)
• Modernize hydromet/early warning ser-vices (MoC/GMet)
• Support the national observatory on coastal issues (MESTI/EPA)
• Improve waste mgmt. in coastal urban areas (MLGRD/MMDAs, MSWR)
• Design climate-smart oil and gas infra-structure (MESTI, MoEP, MWH)

xxxvexeCuTive summary
Short-term (1-2 years) Medium-term (2-5 years) Long-term (5+ years)
Fish
erie
s
• Raise awareness regulatory compli-ance (MoFAD/Fisheries Comm.)
• Emboss/license canoes, issue ID cards (MoFAD/Fisheries Comm./NPC)
• Agree on a monthly allowable number of trawlers and an effective enforce-ment mechanism (MoFAD/Fisheries Commission)
• Increasing the Inshore Exclusive Zone from 30 to 50 meters (MoFAD)
• Make on-the-spot fishing gear inspec-tions (MoFAD/Fisheries Comm.)
• Sanction infractions through with-drawal of fishing licenses and ban-ning inshore vessels, canoes for a predetermined period (MoFAD/FEU)
• Record sources, quality, quantity of saiko landings; sanction offend-ers; use records in license renewal (MoFAD/Fisheries Commission)
• Suspend vessel import, replacement (MoFAD/Fisheries Comm.)
• Support efforts for an additional weekly no-fishing day (MoFAD)
• Agree upon/sustain a two-month closed season for all fleets (MoFAD)
• Draft general guidelines on additions to the industrial fleet (MoFAD)
• Reduce industrial fleet (50%), artisanal fleet (MoFAD/Fisheries Comm)
• Revise Fisheries Act to make co-man-agement feasible (Parl.)
• Establish co-management committees at the community, zonal, and national levels (MoFAD/Fisheries Commission)
• Develop management plans for all fisheries sub-sectors (MoFAD)
• Conduct new stakeholder analyses to reflect the changing nature of the sector, help data collection along the entire fish value chain, and champion regulatory compliance (MoFAD)
• Prepare a Marine Protected Areas report with a view to establishing reserves in zones of fish spawning and biodiversity (MLNR, MoFAD)
• Acquire: i) a research vessel to assess fish stocks and support other critical research; ii) two dedicated patrol boats (for inland and marine sectors); iii) a fish patrol helicopter (to support monitoring and control duties of national security agencies) (President, MoFAD, MoF)
• Design and construct new landing beaches to facilitate fishing vessel inspection (MESTI/LUSPA, MoFAD/Fisheries Commission, MWH)
• Construct spaces for fish auctions to add value, improve data collection/docu-mentation, and improve traceability of catches (MESTI/LUSPA, MoFAD/Fisheries Commission, MWH)
• Train personnel, acquire logistics, and deploy officers to collect fish catch and price data at landing beaches, and conduct regular canoe frame surveys (MoFAD/Fisheries Commission)
Kakum National Forest near Cape Coast, Central Region.Jonathan Ernst / World Bank

xxxvi
Short-term (1-2 years) Medium-term (2-5 years) Long-term (5+ years)
Clim
ate
Chan
ge • Obtain better understanding of the
potential impacts of climate-related risks, especially at the MMDA level, to support decision makers and city plan-ners in management of climate resilient urban growth and development (MLGRD/MMDAs, MESTI/TCPD)
• Reinforce collaboration between hydromet, disaster mgmt. agencies (MESTI/EPA, MoC/GMet, MoI/NADMO, MSWR/WRC, MWH/HSD)
• Enhance enforcement of environmen-tal regulations, specifically for spatial development, sanitation, and flood and stormwater management (MESTI/EPA, MLGRD/MMDAs, MSWR)
• Identify actions for improved climate-related disaster response, prepared-ness (MoI/NADMO, MLGRD/MMDAs/RCCs, MWH/HSD)
• Develop climate change/disaster pre-paredness awareness campaigns (MESTI/EPA, MLGRD/MMDAs, MoE/GES, MoI/NADMO, NCCE)
• Develop a comprehensive Climate-Related Disaster Risk Management Plan, either standalone, or as a subsection of a National Disaster Risk Management Master Plan, with clearly defined actions to prepare for and mitigate the effects of climate-related disasters (MoC/GMet, MESTI/EPA, MLGRD/MMDAs, MoH/GHS, MoI/NADMO, MSWR/WRC)
• Link disaster and climate risk assess-ments to master planning exercises (MESTI/EPA/LUSPA, MLGRD/MMDAs/RCCs, NDPC, MWH/HSD)
• Undertake multi-hazard risk assess-ments in districts; develop, imple-ment climate change/disaster risk management plans; build capacity for contingency planning (MESTI/EPA, MLGRD/MMDAs/RCCs, MoC/GMet, MoI/NADMO, MSWR/WRC, MWH/HSD)
• Increase usage of nature-based solu-tions (MESTI/LUSPA, MLGRD/MMDAs/RCCs, MWH/HSD, NDPC)
• Identify vulnerable settlements/com-munities; formulate a comprehensive slum upgrading and redevelopment strategy (MESTI/EPA/LUSPA, MLGRD/MMDAs/RCCs, MWH, NDPC)
• Improve, extend hydromet and early warning systems (MESTI/EPA, MoC/GMet, MoF, MoI/NADMO, MSWR/WRC, MWH/HSD)
• Enhance emergency coordination and disaster risk management operations capacity to ensure that all parts of the country are accounted for under the emergency operations center (MoC/GMet, MoI/NADMO, MLGRD/MMDAs, MSWR/WRC, MWH/HSD)
• Construct, repair, strengthen flood management and drainage systems; resource for operation and mainte-nance (MLGRD/MMDAs, MWH/HSD)
• Bolster the solid waste mgmt sector (MLGRD/MMDAs/RCCs, MSWR)
• Establish a fund for climate risk mitiga-tion measures (MESTI, MoF)
Polic
ies
& In
stitu
tions
• Create a high-level, inter-ministerial body for environmental. policy making; reactivate ENRAC, inter-sectoral net-works (Cabinet, MDAs)
• Delegate some EPA responsibilities to other institutions (MESTI/EPA, MDAs, MLGRD/MMDAs)
• Support MDAs technically in environ. mgmt. procedures (MESTI/EPA)
• Involve civil, private sectors in executing EPA functions (MESTI/EPA)
• Update Environmental Assessment Regulations (Parl., MESTI/EPA)
• Strengthen, highlight Social, Health Assessments in EIAs (MESTI/EPA)
• Develop guidance on stakeholder con-sultations in EIAs (MESTI/EPA)
• Provide professional development programs for EPA technical staff in addition to capacity building for other stakeholders (MESTI/EPA)
• Design a national registration/accreditation system that tests and licenses local and foreign consultants to undertake EIAs (MESTI/EPA)
• Develop a system to inform public about issued permits (MESTI/EPA)
• Develop an automated database for environmental administrative pro-cedures, monitoring and evaluation (MESTI/EPA)
• Adopt sector-specific EIA guidelines (MESTI/EPA, MDAs)
• Institute a national environmental action planning process to produce action plans covering ten-year cycles; include participation of all stakehold-ers, especially civil society and private sectors (MESTI)
• Evaluate implementation progress, assess effectiveness of proposed actions through an annual environmen-tal policy review (MESTI/EPA)
• Have districts develop natural resource management plans; draft district land use plans as a first activity (MMDAs)
• Establish environ./natural resource mgmt departments within MMDAs; have EPA, FC, MC provide technical support (MMDAs, MESTI, MLNR)

xxxviiexeCuTive summary
Conclusions
The following are major takeaways to assist the GoG to usher in a new era of pro-growth, pro-poor, pro-environment policies:
Prioritize environmental considerations in
development planning Increase the ENRM sector budget. For the public sector to ensure that public environmental goods are well taken care of, the right amount of resources needs to be dedicated to their management. The Public Environmental Expenditure Review showed low levels of funding to MESTI and MLNR. Regulatory agencies, notably EPA, but also MC, FC, and WRC, among others, cannot provide proper oversight and corrective remedies—compliance and effects moni-toring, impact management, audit evaluation—if they are lacking in operational budgets.
Mainstream National Wealth Accounting. National wealth account-ing quantifies a country’s natural capital and other asset classes. It provides a warning when a country is experiencing economic growth by liquidating natural capital. Integrating accounting into national economic analysis can help Ghana review tradeoffs between environ-mental preservation and resource use/extraction and make decisions that allow it to prudently and sustainably manage natural capital and reinvest proceeds into people (human capital) and infrastructure (produced capital).
Act now against climate change. Strategic planning is essential in preparing for and mitigating the effects of climate change. Given that the worst effects of climate disruption are projected to occur to those who are least able to bear them, namely the extreme poor, Ghana must prepare for the possibility of managing disaster risks in the Northern Savannah, urban slums of Accra, coastal communities, and elsewhere.
Promote public awareness raising and proactivity. Dissemination of information, from data indicators to legal rights not only needs to be made publicly accessible, but also the population must be edu-cated on how to instrumentalize such knowledge. A publicly available scorecard showing achievements and deficiencies could keep the population informed and the GoG incentivized and accountable to meet its environmental duties.
Strengthen institutions to ensure accountability and transpar-
ency in environment and natural resource management Enhance EPA powers. If the EPA is going to be the apex institution for the enforcement of environmental regulations, it needs to be imbued with prescriptive powers. The adaptive capacity of EPA needs to be enhanced, especially since the passing of laws and other legal instruments is a laborious and time-consuming process, which has not shown the ability to react fast enough to new environmental challenges like e-waste, coastal erosion, and illegal ASGM.
Accelerate decentralization. EPA field agents can be imbued with stronger monitoring and enforcement resources and powers, leav-ing headquarters to work on national strategy and environmental mainstreaming across sectors.
Create autonomous watchdogs. Autonomous watchdogs that are independent from Ministries or other entities can help ensure that conflicts of interest, excesses, and poor governance practices within environmental management institutions are prevented. An institution charged with auditing performance and spending based on legis-lated criteria, which is free from political interference is one way of stopping political economy issues of untoward or inefficient natural resource governance.
Enforce/reinforce existing laws and advance critical policy
reforms Enforce existing laws. Ghana has a robust legal framework for environmental management, but experiences complications in executing its laws. Regulatory agencies that ensure compliance need reinforcement through recognition of their authority, proportionate financial and technical resourcing, and checks and balances that prevent political interference from obstructing law enforcement.
Bolster existing tools used to manage the environment. For the Environmental Impact Assessment process to be effective it needs: a strong legislative base with clear purpose; specific requirements and prescribed responsibilities; dedicated financial resources; appro-priate controls to ensure proper scope and rigor; flexible timetables for completion; incentives for public participation; accessibility of consequential information; a transparent and clearly defined rationale for permit approvals and condition setting. Importantly, a culture of receptivity by decision makers, enterprises, and communities to abide by Environmental Assessment results must be forged.
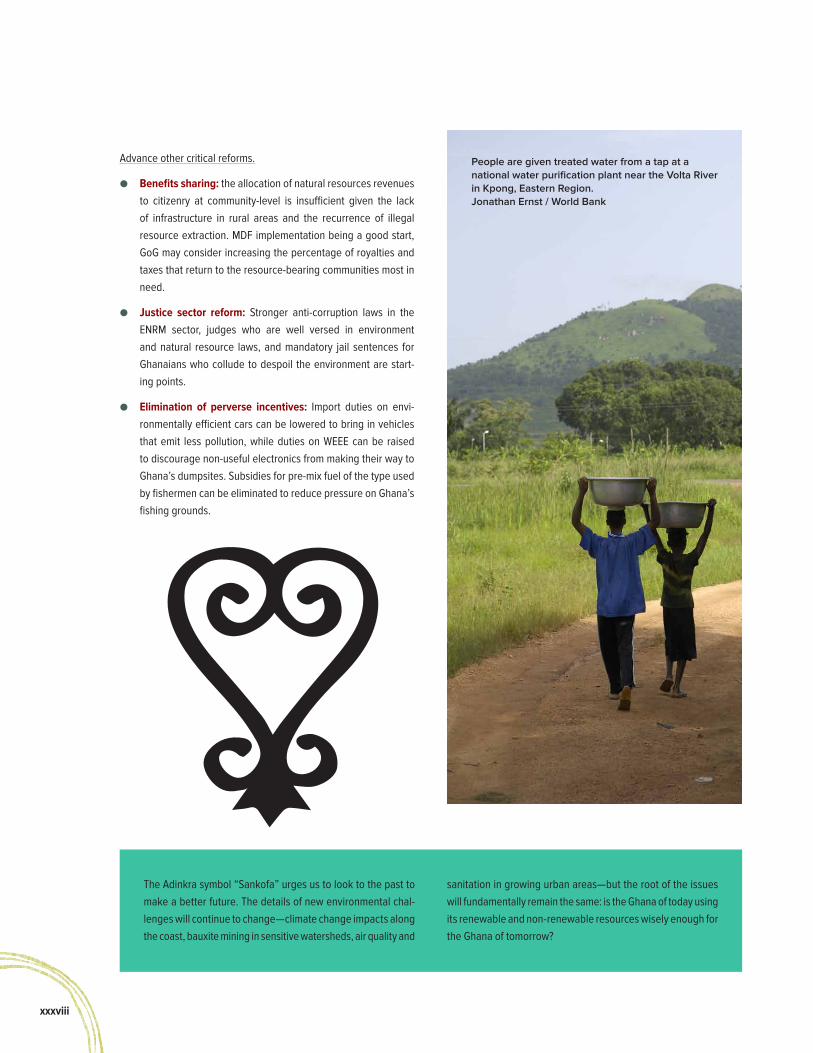
xxxviii
Advance other critical reforms.
● Benefits sharing: the allocation of natural resources revenues to citizenry at community-level is insufficient given the lack of infrastructure in rural areas and the recurrence of illegal resource extraction. MDF implementation being a good start, GoG may consider increasing the percentage of royalties and taxes that return to the resource-bearing communities most in need.
● Justice sector reform: Stronger anti-corruption laws in the ENRM sector, judges who are well versed in environment and natural resource laws, and mandatory jail sentences for Ghanaians who collude to despoil the environment are start-ing points.
● Elimination of perverse incentives: Import duties on envi-ronmentally efficient cars can be lowered to bring in vehicles that emit less pollution, while duties on WEEE can be raised to discourage non-useful electronics from making their way to Ghana’s dumpsites. Subsidies for pre-mix fuel of the type used by fishermen can be eliminated to reduce pressure on Ghana’s fishing grounds.
The Adinkra symbol “Sankofa” urges us to look to the past to make a better future. The details of new environmental chal-lenges will continue to change—climate change impacts along the coast, bauxite mining in sensitive watersheds, air quality and
sanitation in growing urban areas—but the root of the issues will fundamentally remain the same: is the Ghana of today using its renewable and non-renewable resources wisely enough for the Ghana of tomorrow?
People are given treated water from a tap at a national water purification plant near the Volta River in Kpong, Eastern Region. Jonathan Ernst / World Bank
xxxixexeCuTive summary EXECUTIVE SUMMARY xxxixAn elephant traverses the northern savannah.
Arne Hoel / World Bank

1
1

21. inTroduCTion
1.1 Economic Growth and Environmental Challenges
Ghana has managed remarkable suc-cess in economic growth over the past two decades. Since 1990, real GDP in Ghana has more than quadrupled, and in 2011 the country hit a significant milestone when it joined the ranks of Lower Middle-Income Countries (LMICs).15 Momentum in macroeco-nomic growth was accompanied by reduced poverty, allowing Ghana to halve its national poverty rate (from 52.7 to 24.2 percent during the period 1991-2012). Ghana’s international pov-erty headcount is lower than the LMIC average (World Bank, 2018a).
FIGURE 1.1: 2017 exports (MIT Observatory of Economic Complexity database).
Natural resources have been key drivers of this development. Strong economic growth has been driven in part by higher prices for Ghana’s main commodity exports, gold and cocoa, and the start of commercial oil production in 2011. Gold, oil, cocoa, cashew, and manganese com-bined for 84 percent of Ghana’s 2017 US$17.1 billion export total (all dollar
figures are U.S. dollars) (Figure 1.1).16 This fits an overall trend that has seen natural resource rents as a percentage of GDP more than double between 1990 and the present; approximately one-half of these rents come from non-renewable sources (oil, mineral, and natural gas, Figure 1.2).17 With the addition of oil, total natural resource rents increased to nearly one-fifth of GDP in 2011 and 2012, the highest share in West Africa.
% o
f GDP
19901991
19921993
19941995
19961997
19981999
20002001
20022003
20042005
20062007
20082009
2010 20112012
20132014
20152016
2017
Forest rents Mineral rents Natural gas rents Oil rents
20%
18%
16%
14%
12%
10%
8%
6%
4%
2%
0%
Gold (unwrought)25%
Gold (semi-manufactured)
24%Petroleum (crude)
17%
Cocoa beans10%
Cocoa paste2%
Cashew nuts2%
Cocoa butter2%
Manganese2%
All other exports16%
0%
2%
4%
6%
8%
10%
12%
14%
16%
18%
20%
1990199119921993199419951996199719981999200020012002200320042005200620072008200920102011201220132014201520162017
% of G
DP
Forest rents Mineral rents Natural gas rents Oil rents
PEMPAMSIE (“sew it for
preservation”): foresight,
precaution, readiness
FIGURE 1.2: Resource rents as percent of Ghana GDP (World Bank WDI database).
15. LMICs are defined as countries with a Gross National Income per capita between US$996 and US$3,895.
16. Trade data comes from the Massachusetts Institute of Technology’s Observatory of Economic Complexity (database), https://atlas.media.mit.edu/en/profile/country/gha/.
17. Natural resource rents data comes from the World Bank’s WDI (database), https://data.worldbank.org.
1. Introduction

3
$0
$1,000
$2,000
$3,000
$4,000
$5,000
$6,000
$7,000
$8,000
$9,000
2000 2005 2010 2014
Con
stan
t 201
4 U
SD, p
er c
apita
Forests Protected Areas Cropland Pasture Energy (non-renewable) Minerals (non-renewable)
FIGURE 1.3: Components of natural resource wealth per capita over time (Lange et al., 2018).
Environmental unsustainability may impair Ghana’s economic growth, as demonstrated through two economic indicators. The first is national wealth a gauge of growth sustainability. It measures a country’s assets in produced, natural (renewable and non-renewable), and human capi-tal, and net foreign assets (Box 1.1). Between 2000 and 2014, Ghana saw total national wealth more than double. Growth is predicated on efficiently and sustainably managing natural capital—a fact which can be demonstrated through an increase in its per capita value over time18 —and reinvesting proceeds into other forms of capital, primarily human (Lange et al., 2018). Much of Ghana’s wealth increase came with losses to renewable natural resources and overreliance on non-renewable assets. Per capita non-renewable natural capital—mainly from petroleum produc-tion—increased substantially from a very low base (US$36 to US$1,673).
In contrast, renewable natural capital per capita decreased more than seven percent, with specific declines in forests and protected areas assets (Figure 1.3). In Ghana’s case, not only was renewable natural capital eroded, but produced capital was as well (Figure 1.4)19. Ghana’s high population growth makes this a pressing concern since existing capital stock must be shared with the younger generation and future generations. If its current unsustainable natural resource management remains unchanged, Ghana will see its wealth destroyed over the long term with less opportunity to sustain growth and share prosperity.
$5,062 $3,600 $5,029 $2,890 $3,768
$7,302 $7,284
$7,890
$5,155 $6,745
$108 $36
$190
$606
$1,673
$6,345 $6,796
$7,777
$10,922
$13,853
$(524) $(1,203) $(593) $(581) $(995)
1995 2000 2005 2010 2014
2014
Con
stan
t USD
, per
capi
ta
Produced Capital Renewable Natural Capital Non-Renewable Natural Capital Human Capital Net Foreign Assets
FIGURE 1.4: Components of national wealth per capita (Lange et al., 2018).
18. In high-income OECD countries the share of produced capital is double that in low-income countries (28 vs. 14 percent), and human capital reaches 70 percent of wealth. While the share of natural capital in high-income OECD countries is only 3 percent, its per capita value is three times that of low-income countries (US$19,525 compared with US$6,421 in 2014) (Lange et al., 2018).
19. Ghana’s shrinking manufacturing as a share of GDP confirms that natural wealth asset depletion is not being reinvested in economic activities that can survive in the long run.

41. inTroduCTion
Box 1.1: Philippines: natural capital accounting as a planning tool
Natural capital accounting helps the Philippines to measure the country’s natural resources and evaluate how they can be used equitably and sustainably. The Philippine archipelago is rich in biodiversity, coastal and marine resources, minerals, timber and other forest products. Natural resource wealth underpins the livelihoods of farmers and fisherman and provides an important social safety net for rural communities, especially during times of crisis. The country has historically relied on natural capital for its economic growth: in 2010, natural capital accounted for 19 percent of gross domestic product. Responsible management of natural capital is critical to ensure future profit streams for private enterprises in the tour-ism, agriculture and fisheries, and mining sectors, as well as revenues to local and national governments.
The Wealth Accounting and Valuation of Ecosystem Services (WAVES) Global Partnership Program provides key Philippine decision makers with scientific-based evidence, information, and capacity building to assess the social, economic, and environmental trade-offs of different resource-use scenarios and their implications on the achievement of sustainable development. The Philippines is now producing mineral, mangrove, and ecosystem accounts. The data gives a clearer picture of the country’s natural capital resources and provides input for investment and policy decisions. With the support of WAVES and the Program on Forests (PROFOR) the country has produced a significant number of policy briefs, technical reports, natural capital accounts, maps and communications products to inform development planning and policy around four key policy areas: (i) macroeconomics, (ii) minerals, (iii) mangroves, and (iv) landscapes and ecosystems.
To strengthen macroeconomic monitoring, the Philippine Statistical Authority developed adjusted macroeconomic indicators—adjusted net national income, adjusted net national savings, comprehensive wealth, produced capital—that are used to measure not only whether the Philippine economy is growing, but also whether that growth is sustainable. At a sectoral level, the accounts have been used to measure the contribution of natural capital to the economy. Minerals asset accounts (gold, copper, nickel and chromium) determine the extent to which the Philippine Government is recovering and reinvesting nonrenewable resource rents. The role of mangroves in protecting people and assets from coastal hazards helped to identify priority areas for mangrove restoration. The valuation of hitherto unmeasured ecosystem services, such as hydrological services, carbon storage, and erosion control, provided critical input to improved local land use management and planning.
Source: World Bank, 2016a.

5
Chocolate bar production at the Golden Tree cocoa processing and chocolate plant in Tema. Jonathan Ernst / World Bank
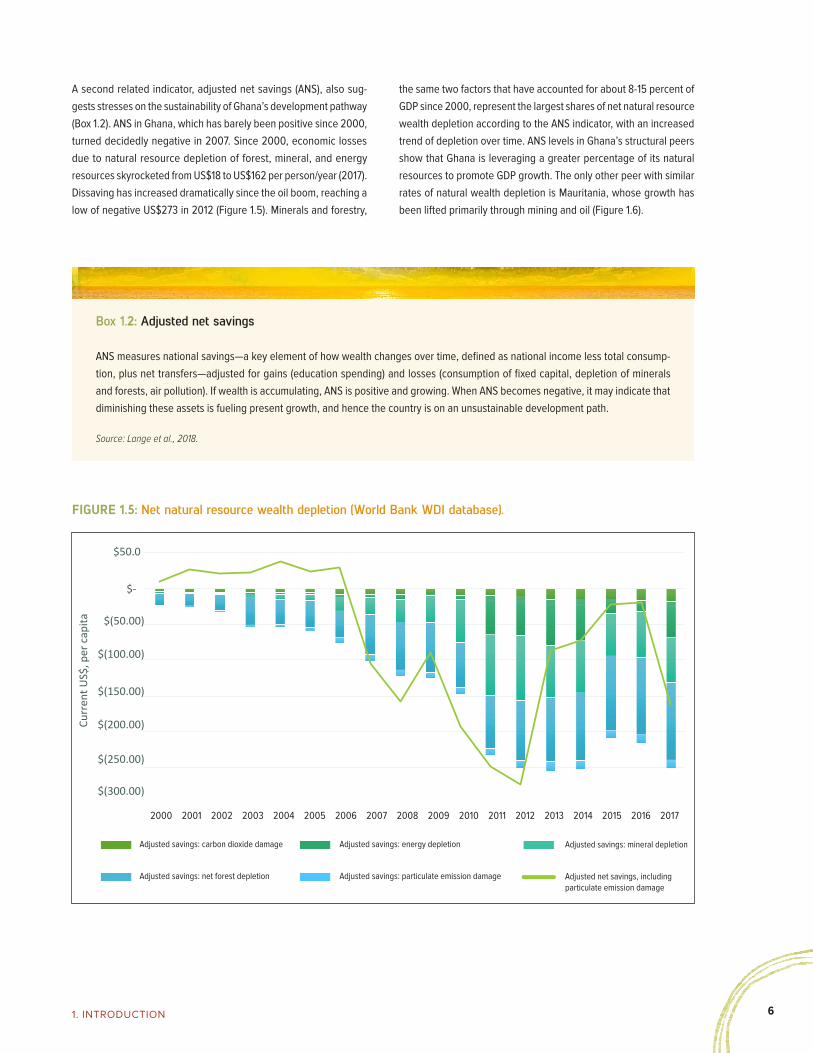
61. inTroduCTion
A second related indicator, adjusted net savings (ANS), also sug-gests stresses on the sustainability of Ghana’s development pathway (Box 1.2). ANS in Ghana, which has barely been positive since 2000, turned decidedly negative in 2007. Since 2000, economic losses due to natural resource depletion of forest, mineral, and energy resources skyrocketed from US$18 to US$162 per person/year (2017). Dissaving has increased dramatically since the oil boom, reaching a low of negative US$273 in 2012 (Figure 1.5). Minerals and forestry,
Box 1.2: Adjusted net savings
ANS measures national savings—a key element of how wealth changes over time, defined as national income less total consump-tion, plus net transfers—adjusted for gains (education spending) and losses (consumption of fixed capital, depletion of minerals and forests, air pollution). If wealth is accumulating, ANS is positive and growing. When ANS becomes negative, it may indicate that diminishing these assets is fueling present growth, and hence the country is on an unsustainable development path.
Source: Lange et al., 2018.
FIGURE 1.5: Net natural resource wealth depletion (World Bank WDI database).
the same two factors that have accounted for about 8-15 percent of GDP since 2000, represent the largest shares of net natural resource wealth depletion according to the ANS indicator, with an increased trend of depletion over time. ANS levels in Ghana’s structural peers show that Ghana is leveraging a greater percentage of its natural resources to promote GDP growth. The only other peer with similar rates of natural wealth depletion is Mauritania, whose growth has been lifted primarily through mining and oil (Figure 1.6).
$(300.00)
$(250.00)
$(200.00)
$(150.00)
$(100.00)
$-
$(50.00)
$50.0
Curr
ent U
S$, p
er c
apita
Adjusted savings: carbon dioxide damage
Adjusted savings: net forest deple�on
Adjusted savings: energy deple�on
Adjusted savings: par�culate emission damage
Adjusted savings: mineral deple�on
Adjusted net savings, including par�culate emission damage
$(300.00)
$(250.00)
$(200.00)
$(150.00)
$(100.00)
$-
$(50.00)
$50.0
Curr
ent U
S$, p
er c
apita
2000 2001 2002 2003 2004 2005 2006 2007 2008 2009 2010 2011 2012 2013 2014 2015 2016 2017
Adjusted savings: energy depletion
Adjusted savings: particulate emission damage
Adjusted savings: carbon dioxide damage
Adjusted savings: net forest depletion
Adjusted savings: mineral depletion
Adjusted net savings, including particulate emission damage

7
1.2 Management of Natural Resources in Ghana’s Urban, Rural, and Coastal Landscapes
Ghana faces environmental challenges roughly corresponding to its rural, urban, and coastal landscapes. The complexion and complex-ity of Ghana’s environmental issues are changing as a function of the socioeconomic and environmental dynamics in these areas. Meanwhile, the population is set to double over the next 40 years, at which point more than 75 percent of Ghanaians will be living in cities.20 Growth and development will deplete natural capital—as the GDP per capita growth rate must exceed the population’s growth rate to have a poverty-reduc-ing effect—complicating existing environmental, climate, and natural resource management challenges.
The livelihood of much of the rural population depends on access to natural resources. Although the economic structure is shifting to services, a substantial share of jobs is still based in renewable natural resources. In rural areas 71 percent of people are employed in agriculture, forestry, and fishing and the sector is a primary source of employment for the 300,000-350,000 new workers who enter the labor force each year (World Bank, 2016b; 2018b).21 Cocoa, Ghana’s most important agricultural export, employs over one million households and is a driver of poverty reduction, with poverty rates among cocoa farmers declining from 60 to 24 percent between 1991-2005 (World Bank, 2018b). Food production also doubled during this period.
Economic growth has brought rapid urbanization. The services sector has become the largest contributor to the economy, with an attendant shift of labor from rural farm work to provision of urban services. Since 2009, Ghana’s urban population has outstripped its rural one, standing at 55 percent (Figure 1.7). Accra’s population nearly doubled over the past two decades, but the capital city’s overall proportion of all urban dwellers has remained steady, indicating that urbanization has been occurring on a wide scale. Rural exodus to and rapid growth in traditional urban population centers such as Accra and Kumasi are being complemented by development in cities such as Tamale, Sekondi-Takoradi, Sunyani, Cape Coast, Obuasi, Teshie, Tema, and Koforidua. Nearly one in five Ghanaians now lives in an urban agglomeration of more than one million people22.
The coastal zone is a hybrid of rural and urban settings with a high density of human settlements interwoven along marine ecosystems. About three million people are projected to live in Ghana’s coastal zones by 2050. This includes those living in low elevation flood-prone informal settlements, where poverty is more prevalent. Eighty percent of Ghana’s industrial base is found along the coast and about US$1 billion, equivalent to 1.5 percent of GDP, is exposed to sea level rise. The fisheries sector provides
FIGURE 1.6: Adjusted savings. Natural resource depletion, Ghana vs. structural peers (World Bank WDI database).
livelihoods for 10 percent of the population and accounts for 60 percent of animal protein consumption in Ghana.
People in Ghana’s northern savannah, coastal areas, and urban slums are most at risk to an increasingly variable climate. With one-third of the total labor force involved in agriculture23, insufficient rainfall during the major cropping season may lead to devastating effects across the national economy and societal landscape, including crop failure/losses, disease outbreaks, and dislocation of human populations. Climate change will exacerbate land degradation and is expected to adversely affect crop yields, affect crop yields, leading to a decline in agricultural GDP and further entrenching rural poverty. Climate change poses a threat to the suitability of cocoa production in Ghana, and past cases show that spe-cialized economies have difficulty recovering from the collapse of their main activity (World Bank, 2017). Mean annual rainfall fell from 11.7 mm/year in 1901-1910 to 6.3 mm in 2011-2015 in the poorest one-third of
FIGURE 1.7: Ghana population by rural-urban presence (World Bank WDI database).
0%
2%
4%
6%
8%
10%
12%
14%
Mauritania Ghana KyrgyzRepublic
Nicaragua Myanmar Cameroon Kenya Coted'Ivoire(2016)
% o
f GN
I
-
5
10
15
20
25
30
35
19801981
19821983
19841985
19861987
19881989
19901991
19921993
19941995
19961997
19981999
20002001
20022003
20042005
20062007
20082009
20102011
20122013
20142015
20162017
2018
Mill
ions
Rural population Urban population Population, total
20. Population data from the United Nations Department of Economic and Social Affairs (database), https://population.un.org/wup/Country-Profiles/.
21. This employment is higher than the labor force study suggests because more than 80 percent of Ghana’s workforce is in the informal sector, 55 percent of which is in agriculture and fisheries, and 13 percent of which is involved in agro-related services and sales.
22. Data comes from the World Bank’s WDI (database), “Population in urban agglomerations of more than 1 million,” https://data.worldbank.org
23. Data comes from World Bank WDI (database), “Employment in agriculture (% of total employment),” https://data.worldbank.org.
81. inTroduCTion
districts. The northern savannah, where subsistence agriculture is the main employment for poor households, has been affected by frequent droughts and flooding accompanied by high temperatures and intense heat. Catastrophic floods in 2007, which affected 317,000 people, were followed immediately by drought—indicative of the high variability in climate and hydrological flows in northern Ghana. Coastal communi-ties face erosion and infrastructure collapse from rising sea levels. The effects of climate risks are likely to magnify the uneven social and spatial distribution of risk in Ghana, and possibly amplify poverty in the north and vulnerable areas.
1.3 Objectives
The objective of this Country Environmental Analysis (CEA) is to analyze critical environmental and natural resource issues threatening sustainable economic growth in Ghana and propose policy actions and investments to address them. The main output of the analysis aims to broaden dia-logue with Government and engagement with the public on improving environment and natural resource management. The CEA aims to effec-tively analyze and communicate the links between good environmental and natural resource stewardship in Ghana, and economic growth and improved livelihoods to galvanize investment in environmental man-agement, conservation and restoration, policy and regulatory reform, institutional strengthening, and capacity building. Ultimately, the CEA will permit the Government, the World Bank, development partners, and other stakeholders to make informed decisions that effectively address environmental sustainability and natural resource management ques-tions that affect Ghana’s future.
1.4 Methodology and Structure
The CEA does not address all Ghana’s environmental concerns, but instead focuses on priority topics that require in-depth analysis and short-term actions. There are three reasons behind this decision. First, the Government of Ghana has already prepared a “State of the Environment” Report with the support of the Natural Resources and Environment Governance (NREG) Project financed by the World Bank. That report comprehensively covered all aspects of environmental and natural resource management issues facing Ghana. Second, the World Bank held consultations with the Ministry of Environment, Science, Technology and Innovation (MESTI) and the Environment Protection Agency (EPA) during which both prioritized the emerging challenges of e-waste, plastic waste, and illegal small-scale artisanal mining as key issues to be addressed. Finally, because the World Bank has been engaged in land, forests, coasts and fisheries, and pollution management
investments in Ghana for several decades, it is uniquely positioned to provide critical analysis on the root causes of challenges in these sectors.
For its methodology, the CEA leverages existing research to contextualize environmental challenges and permit fresh analysis into the sustainability of Ghana’s economic development. Undertaking a vast literature review, the CEA synthesizes existing data and analyses from a wide range of publications including reports by government development partners and non-governmental organizations (NGOs), research findings, and lessons learned from international best practices. This base permits an economic analysis of the Cost of Environmental Degradation (CoED), which is calculated using the latest methodology approved by the World Bank. These findings were discussed with government stakeholders and development partners. Each section concludes with recommendations to improve environment and natural resource governance that are split into categories of short-term (recommendations for immediate implementa-tion, i.e. over the next two years), medium-term (recommendations ready for implementation once foundational reforms are in place, i.e. over the next two to five years), and long-term (recommendations that can only be implemented once an enabling environment exists, i.e. five or more years from now).
It is also to be noted that since the writing of this report Ghana has changed its number of administrative regions from 10 to 16. Given the newness of this division, data in this report refers to the administrative boundaries that existed up to the end of 2018.
The following chapters proceed along the thematic sectoral lines of rural, urban, and coastal challenges24, and are followed by cross-cutting chap-ters on climate change and policies and institutions. The report begins with an overview on the cost of environmental degradation (Chapter 2). Urban issues are addressed first: air pollution (Chapter 3), plastic pollution (Chapter 4), and e-waste (Chapter 5). The next section moves to rural issues: forest resources (Chapter 6), land degradation (Chapter 7), and artisanal and small-scale gold mining (“galamsey”) (Chapter 8). The third section, coastal resources, includes two chapters: fisheries resources (Chapter 9), and coastal erosion (Chapter 10). Finally, cross-cutting chap-ters on climate change (Chapter 11) and policies and institutions (Chapter 12) are followed by conclusions (Chapter 13).
24. This analysis acknowledges that lines can be blurred between environmental challenges. For example, the air pollution chapter addresses ambient and household air pollution, with the former mainly affecting urban zones and the latter rural ones. This is not to say that air pollution is solely an urban issue. The analysis classifies it as such given trends showing increasing ambient air pollution (from urbanization and industrialization) and decreasing household air pollution (from urbanization and access to cleaner energy).

9

101. inTroduCTion
View from Umbrella Rock in the Yilo Krobo District (Eastern Region), outside of Accra. The Umbrella Rock is situated on a high land making it possible to watch
nature hundreds of miles away into the green.Felix Lipov / Shutterstock

11
2

122. The CosT of environmenTal degradaTion in ghana 12
2.1 Objective and Scope
This chapter estimates Ghana’s annual cost of environmental degradation (CoED) at the national level in monetary terms. Specifically, it values the effects of environ-mental degradation on Ghana’s national society due to air and water pollution, agri-cultural land degradation, deforestation, illegal mining, overfishing, coastal erosion, and flooding. In addition, it estimates the impact of environmental degradation on the global community, through the cost of carbon emissions from economic activities.
This assessment estimated the present value (PV) of both short-term and long-term impacts caused by activities occurring over the latest year for which data were available. Certain activities cause short-term impacts, for example, air pollution causes certain health problems that last from a few weeks to several months (bronchitis, respiratory symptoms). Other activities have long-term impacts, such as deforestation, which causes ecosystem losses that may take years or decades to recover. The analysis uses a six percent discount rate and a time horizon of 30 years (World Bank, 2016). The results are expressed in absolute terms (US$, 2017 prices) (all dollar figures are U.S. dollars) and relative terms (as a percent-age of Ghana’s 2017 GDP, which was US$59 billion) to benchmark the extent of damage against macroeconomic indicators. Both anthropogenic and natural factors are considered for estimating CoED.
The assessment looks at damages at three levels: social, such as morbid-ity and mortality due to air and water pollution; economic, including lost agricultural productivity due to soil erosion and lost fishing rents due to overfishing; and environmental, such as reduced value of watershed services due to deforestation.
25. So far, no commonly accepted method has been developed to value the overall cost of morbidity due to air pollution (OECD, 2014). However, results of studies conducted in several countries indicate that morbidity costs account for a small percentage of mortality costs – about 10 percent (Hunt et al., 2016).Forest data comes from the GFW database, https://www.globalforestwatch.org/.
ASAASE YƐ DURU ("the Earth has weight"): sanctity and divinity of
the Earth
2.2. Sectors Analyzed2.2.1 Air pollution
The total cost of air pollution is estimated at about US$2.5 billion, or 4.2 percent of GDP. Household air pollution is responsible for US$1.37 billion, while ambient air pollution accounts for about US$1.11 billion. Ambient and household air pollution negatively affect human health, primarily due to exposure to fine particulates (PM2.5). This exposure translates into premature mortality due to induced lower tract respiratory infections; ischemic heart disease; stroke; chronic obstructive pulmonary disease; tracheal, bronchus, and lung cancer; and diabetes mellitus type 2; and morbidity, as a result of problems such as chronic bronchitis, hospital admissions, lost work days, and restricted activity days (Hunt et al., 2016; Stanaway et al., 2018; World Bank, 2016). Monetary valuation is based on the Value of Statistical Life (VSL) for mortality, which reflects the soci-ety’s willingness to pay to reduce the risk of death, and a morbidity cost assumed to be 10 percent of the mortality cost25.
Ambient air pollution. The annual average PM2.5 concentration has been estimated at 50 ug/m3 for urban areas [EPA data for Accra; World Health Organization (WHO), 2018; and Van Donkelaar et al., 2016 for other cit-ies] and 40 ug/m3 for rural areas (Van Donkelaar et al., 2016). The total population (approximately 29 million) is exposed to ambient air pollution, of which approximately 16 million people are in urban areas and 13 million are in rural areas Using the most recent concentration-response functions from the literature (the 2017 Global Burden of Disease (GBD)), ambient air pollution is estimated to cause about 7,200 premature deaths per year.
Household air pollution. Household PM2.5 concentration varies depend-ing on the type of fuel used for cooking, location of the kitchen (inside or outside the house), ventilation system and level of penetration of ambient PM2.5 into the household. The cost is based on a concentration at 128 ug/m3 for Ghana (Van Vliet et al., 2013). Using Ghana Statistical Service (GSS) et al. (2015) data related to the use of solid fuel for cooking, the population exposed to indoor air pollution is nine million people in urban
2. The Cost of Environmental Degradation in Ghana

13
areas and 11.5 million people in rural areas. Accordingly, household air pollution is estimated to cause 8,800 premature deaths per year.
2.2.2 Water
The total cost due to inadequate water supply, sanitation, and hygiene is estimated at US$1.8 billion, or just over three percent of GDP. Inadequate water supply, sanitation, and hygiene (WASH) are important challenges for Ghana. The burden of waterborne diseases is particularly serious in rural areas, where only a small share of households benefits from safely managed WASH26 . These problems, exacerbated by discharge of solid waste, industrial effluents, and toxic substances in water systems, have serious effects on health.
The valuation shows that inadequate WASH is responsible for about 10,600 deaths per year, estimated based on WHO data related to relative risks for water-borne diseases (Prüss-Üstün et al., 2014). This is primarily due to diarrhea, typhoid, and paratyphoid (5,600 deaths); malnutrition (4,800 deaths); and, to a lesser extent, schistosomiasis, dengue, and ascariasis (200 deaths). In addition, diarrheal morbidity due to WASH is estimated at 14.7 million cases.
2.2.3 Gold Mining, E-waste and Other Contaminated Sites
Total annual cost attributed to exposure to toxic metals in Ghana is esti-mated at US$0.68 billion, equivalent to 1.2 percent of GDP. Chemical pol-lution—with hazardous chemicals and heavy metals—is a major problem in Ghana due to several unregulated activities such as recycling and disposal of electronic waste (e-waste), burning plastic, and artisanal small-scale mining. Dowling et al. (2016) estimated that Ghana has between 1,600-1,900 sites contaminated with electronic waste; among the key pollutants are lead, chromium, and arsenic. In addition, there are about 77 mercury-contaminated sites, largely as a result of gold mining. The current analysis estimated the impacts of lead and mercury on health.
Lead. Human exposure to lead can increase the incidence of cardiovas-cular, kidney, and neurological diseases. Based on GBD (2017) data, lead exposure in Ghana caused about 1,200 deaths due to cardiovascular and kidney diseases in 2017, corresponding to about US$146 million in VSL. In addition, exposure to lead in hotspots contaminated by e-waste (particularly from recovery of used lead-acid batteries) has reduced the intelligence quotient (IQ) in children by an estimated 2.4-6.3 IQ points per child. Using a forgone income approach, the annual cost of IQ loss is estimated at about US$58 million on average. Accordingly, the total cost of lead contamination is about US$0.2 billion/year.
26. Only seven percent of rural households benefit from safely managed drinking water and a very negligible portion benefit from safely managed sanitation and hygiene (https://washdata.org/data).
27. Forest data comes from the GFW database, https://www.globalforestwatch.org/.
28. The value of sustainably managed forests has been crudely estimated at US$110/ha, including extractive values (US$80/ha/year, based on Angelsen et al., 2014) and forest services (US$30/ha/year, based on Siikamäki et al., 2015, adjusted to 2017). It is assumed that deforestation leads to a loss of all extractive values and one-half of the value of services.
Mercury. Exposure to mercury vapor can lead to several symptoms, including immunological changes, insomnia, and abnormal renal func-tions. In Ghana, it is estimated that gold miners and people living in proximity to contaminated sites incur 0.17-0.3 Years Lived with Disability (YLD) each year. Using the forgone income approach, this corresponds to about US$0.48 billion.
2.2.4 Agricultural Land Degradation
The cost of soil erosion is estimated at about US$0.54 billion, equivalent to 0.9 percent of the country’s GDP. The agricultural sector contributes about 18 percent of Ghana’s GDP and accounts for 36 percent of formal employment (GSS, 2017; World Bank, 2018). A large proportion of agri-cultural land is degraded due to unsustainable agro-pastoral practices. Land degradation is especially pronounced in the country’s Northern Region (MESTI, 2017). The cost of agricultural land degradation is based on a study conducted by Diao and Sarpong (2007). The authors used an economy-wide model that estimated the cost due to land erosion covered by the main agricultural crops (e.g., maize, sorghum, cassava, yam) to be about US$4.2 billion for the period 2006-2015. The valuation assumes that the effect of soil erosion was similar in 2017.
2.2.5 Forests
The cost of deforestation, on average, is about US$0.4 billion, equivalent to 0.67 percent of GDP. Forests in Ghana cover about 5.7 million ha (Global Forest Watch (GFW27). Deforestation is a widely recognized problem, mainly due to cocoa expansion, slash and burn agriculture, and illegal logging. However, available estimates differ considerably, for example, GFW indicates an annual deforestation of 98,500 ha during 2013-2017, while Ghana’s Forestry Commission (FC) shows annual losses of 315,000 ha during 2001-2015, and of nearly 795,000 ha during 2013-2015 (MLNR, 2017). Due to this uncertainty, the valuation assumes that the area subject to deforestation varies between 98,500 ha (low scenario) and 315,000 ha (high scenario) per year. It is estimated that deforestation leads to an annual loss of forest benefits of about US$90/ha28, which corresponds to a present value of US$1,300. The cost of deforestation is estimated as a range between US$135 million and US$658 million, from which the assessment takes the average to derive its estimate.
2.2.6 Fisheries
The total annual cost of overfishing in Ghana is estimated at US$233 million, equivalent to 0.4 percent of GDP. Over the past decade, overfishing has led to declining biomass of pelagic and demersal fish stocks in Ghana. Recent studies indicate excessive numbers of vessels in marine waters (Akpalu and Okyere, 2018; Koranteng and Awity,

142. The CosT of environmenTal degradaTion in ghana
2018). The cost of overfishing is estimated through the difference in rents between the current fish catch and the maximum sustainable yield. Based on Akpalu and Okyere (2018), this difference is valued for artisanal (US$101 million), tuna (US$87 million), industrial (US$41 million) and semi-industrial fleets (US$4 million) in marine waters.
2.2.7 Inland Floods
The total annual cost of inland flooding is estimated at US$120 million, equivalent to 0.2 percent of GDP. Ghana is prone to floods during the rainy season. Communities located along riverbanks and in coastal areas and lowlands are particularly affected by floods (Bramiah et al., 2014). The International Disaster Database indicates that the frequency of floods is increasing; a major flood occurring in 2017 affected more than one million people (EM-DAT29). The impact of inland floods is estimated based on the Aqueduct model that the World Resources Institute30 developed. The model calculates the annual expected urban damage due to inland floods through direct damage to assets in the affected areas. For Ghana, this is estimated between US$120 million and US$169 million31; for conservative rea-sons, this assessment considers only the lower estimate.
FIGURE 2.1: Framework for mercury exposure (Poulin et al., 2008).
29. Information from the EM-DAT database, https://www.emdat.be/.
30. Information from World Resource Institute, https://floods.wri.org/#/country/87/Ghana.
31. The estimates represent the level of urban damage assuming the country has a five-year flood protection level ($120 million) and a two-year flood protection level ($169 million).activities, solid waste landfills and waste incineration, household sources of air pollution.
32. This value was estimated for 2015.
2.2.8 Coastal Zone
The annual cost of coastal floods and erosion32 is estimated at about US$47 million, equivalent to less than 0.1 percent of GDP. As in many West African countries, Ghana faces significant challenges to its coastal zone, including erosion, floods, marine and coastal pollution, rapid urbanization, and unsustainable land use. This section focuses only on the cost of coastal flooding and erosion and is based on a study conducted by World Bank (2017a). The study assessed these damages using information on the frequency of events, exposure (i.e., assets and ecosystem services at risk), damage functions (for both short- and long-duration floods, and erosion), and unit values of damage to different land uses. Erosion alone accounted for 57 percent of the estimated cost.
2.2.9 Climate Change
On average, the cost of Ghana’s carbon emissions to the global community is US$2.3 billion each year, equivalent to 3.9 percent of Ghana’s GDP. It is to be noted that this high value is not a cost for Ghana, but for the global community. Valuation is based on the shadow price of carbon, which ranges between US$37 (low scenario)
SOURCE OFEXPOSURE
Dental amalgams
Folk medicines, religious practices, etc.
Transformation by microorganisms and bioaccumulation in aquatic species
EXPOSUREPATHWAY
BIOLOGICALMEASURE OFEXPOSURE
Thermometers, barometers, etc.
Mining
Mercury in foodFossil fuel Combustion
• Blood • UrineWaste
Incineration
Industrial processes
Mercury in air
Mercury in water
Methylmercury in food
• Hair • Blood • Cord-blood
Methylmercury health
OUTCOME

15
to US$75/tCO2 (high scenario) for 2017 (World Bank, 2017b). Ghana’s Second Biennial Update to the United Nations Convention on Climate Change (UNFCCC) estimated the total net greenhouse gas (GHG) emissions at about 42.2 million tCO2e for 2016 (MESTI, 2018). Agriculture, forestry, and other land uses (AFOLU) were the largest source of emissions, followed by energy.
Ghana has an opportunity to sell carbon emissions reductions from reduced deforestation and degradation through its forthcoming Ghana Cocoa Forest REDD+ Program. It is hoped that the country will succeed in trading emission reduction credits, at a price of about US$5/tCO2 (Forestry Commission projections, see Chapter 6: Status of Forest Resources). This achievement would mean a reduction of the global cost of carbon emissions and significant future earnings for Ghana.
2.3 Conclusions
The CoED to Ghanaian society is estimated at about US$6.3 billion, equivalent to 10.7 percent of the country’s GDP in 2017. Additionally, GHG emissions cause damages to the global community that are esti-mated at just under four percent of GDP. The national CoED appears almost triple that of the global cost (Table 2.1).
Among the national costs, it is important to note that:
● Air pollution stands out as the most important driver of degra-dation (4.2 percent of GDP). This is primarily due to the impacts caused by household air pollution (about 8,800 premature deaths), and secondarily by ambient air pollution (about 7,200 premature deaths) in rural and urban areas.
● Water pollution causes significant damage (3 percent of GDP) largely due to the health effects of an inadequate water supply, poor sanitation, and inadequate hygiene (about 10,600 deaths). The problem of water pollution is partly due to the discharge of solid waste, industrial effluents, and toxic substances in water systems.
● Gold mining, e-waste, and other contaminated sites also impose high costs on Ghana (1.2 percent of GDP). Activities mainly related to the recycling and disposal of electronic waste, burning plastic, and artisanal small-scale gold mining, cause the release of hazardous chemicals and heavy metals, to which exposure can be fatal (e.g., 1,200 deaths due to lead exposure).
● Agricultural land degradation, deforestation, and over-fishing are also noteworthy due to their negative effects on resource productivity and ecosystem services.
CategoryLower bound (US$ billion)
Upper bound (US$ billion)
Average (US$ billion)
% of GDP
Air pollution 1.32 3.65 2.49 4.2%
Water pollution 0.74 2.85 1.80 3.0%
Heavy metal contamination* 0.39 0.97 0.68 1.2%
Agricultural land degradation 0.14 0.95 0.54 0.9%
Deforestation 0.14 0.66 0.40 0.7%
Overfishing 0.23 0.23 0.23 0.4%
Inland flooding 0.06 0.17 0.12 0.2%
Coastal zone degradation 0.05 0.05 0.05 0.1%
Cost to Ghanaian society 3.05 9.53 6.29 10.7%
Climate change 1.53 3.10 2.31 3.9%
Cost to Global community 1.53 3.10 2.31 3.9%
*Gold mining, e-waste, and other contaminated sites.
TABLE 2.1: Estimated CoED in Ghana, 2017 (Estimates by authors).

162. The CosT of environmenTal degradaTion in ghana
Cars driving along a road in Osu, Accra. Olivier Asselin / Alamy Stock Photo

17
3

183. air PolluTion
Air pollution is the release of gases, finely divided solids, and aerosols into the Earth’s atmosphere at levels difficult to dilute naturally and which may cause adverse health, environmental, and economic effects. It can be subdivided into (outdoor) ambient air pollution (AAP) or (indoor/near-home) household air pollution (HAP). AAP has both natural origins and anthropogenic sources.33 Emissions from anthropogenic activi-ties far outweigh those from nature. Common components of AAP causing noxious health effects are particu-late matter (PM), ozone (O3), nitrogen
3. Air Pollution
MFRAMADAN (“wind-resistant house”): resilience, self-reliance, alertness in the face of difficulty
3.1 Baseline Air Quality in Ghana
Air pollution is Ghana’s number one environmental risk to public health and its sixth-ranked overall risk (out of 19) for death.36 100 percent of Ghana’s population is exposed to PM2.5 levels exceeding WHO guidelines. Ghana’s air pollution mortality rate—inclusive of AAP and HAP—is 105 people per 100,000 (age standardized) (Stanaway et al., 2018). Air pollution is responsible for eight percent of total mortality with approximately 16,000 Ghanaians dying prematurely each year: 8,500 in urban areas (4,600 due to AAP; 3,900 from HAP) and 7,600 in rural areas (2,600 due to AAP; 5,000 from HAP) (Table 3.1).37 Over the past two decades, the HAP mortality rate has dramatically decreased, while AAP has slightly increased (Figure 3.1). Air pollution’s disease burden is disproportionately borne by infants and the elderly. Figure 3.2’s top panel demonstrates how the elderly experience most AP-related premature deaths, while the bottom panel shows that a greater proportion of non-fatal illness is borne by young children.
Rapid urbanization presents Ghana with a challenge in air quality management. Data from 2006-2015 show monitor readings with concentrations well above PM10 guidelines set by both Ghana (70 μg/m3, 24-hour mean) and WHO (50 μg/m3, 24-hour mean) (MESTI, 2017). Roadside sites tend to show higher concentrations than com-mercial and industrial sites, which in turn show higher concentrations than residential sites. This supports findings that transportation and commercial/industrial sources are significant contributors to Accra’s AAP. However, elevated annual average concentrations in some resi-dential neighborhoods suggest that household combustion of solid biofuels remains a significant contributor to AAP levels (Table 3.2).
Natural phenomena add to AAP. Zhou et al. (2013) point out the role of the Harmattan winds that come off the Sahara Desert from December to February/March as a natural air pollution source modulating Accra’s air quality. Harmattan winds carry high concentrations of Saharan
MFRAMADAN (“wind-resistant house”):
resilience, self-reliance, alertness in the face
of difficulty
33. Natural air pollution sources include smoke from bush/forest fires, windblown dust, pollen and mold spores, volcanic activity, sea spray, etc. Anthropogenic sources include fuel combustion from motor vehicles, electricity and heat generation, industrial and mining activities, solid waste landfills and waste incineration, household sources of air pollution.
34. Information from WHO, https://www.who.int/airpollution/ambient/pollutants/en/.
35. Information from WHO, https://www.who.int/news-room/fact-sheets/detail/ambient-(outdoor)-air-quality-and-health.MLGRD = Ministry of Local Government and Rural Development; MMDAs = Metropolitan, Municipal, and District Assemblies.
36. Public health information comes from the Global Burden of Disease (database), https://vizhub.healthdata.org/gbd-compare/.
37. Final health burden estimates are adjusted for multiple risks because the same diseases are associated with different environmental risk factors.
dioxide (NO2) and sulfur dioxide (SO2).34 HAP results from incomplete combustion of solid biomass fuels (e.g. wood, charcoal, crop waste, dung), coal and kerosene, for cooking, heating, and lighting needs. Smoke from biomass combustion contains suspended PM, NO2, SO2, carbon monoxide (CO), formaldehyde and polycyclic aromatic hydro-carbons (PAHs) (UN, 1997).
PM affects more people than any other pollutant. It primarily consists of solid and liquid particles of inorganic and organic substances—sul-fates, nitrates, ammonia, sodium chloride, black carbon, mineral dust, water—suspended in the air.35 Although coarse PM of 10 microns in diameter (PM10) can irritate the eyes, nose, throat, and lungs, exposure to fine PM, being 2.5 microns or less (PM2.5), can pose significant and even fatal health risks. Illnesses associated with air pollution-related mortality include lung cancer, ischemic heart disease, stroke, acute lower respiratory infection and chronic obstructive pulmonary disease (COPD) (e.g., bronchitis, emphysema).
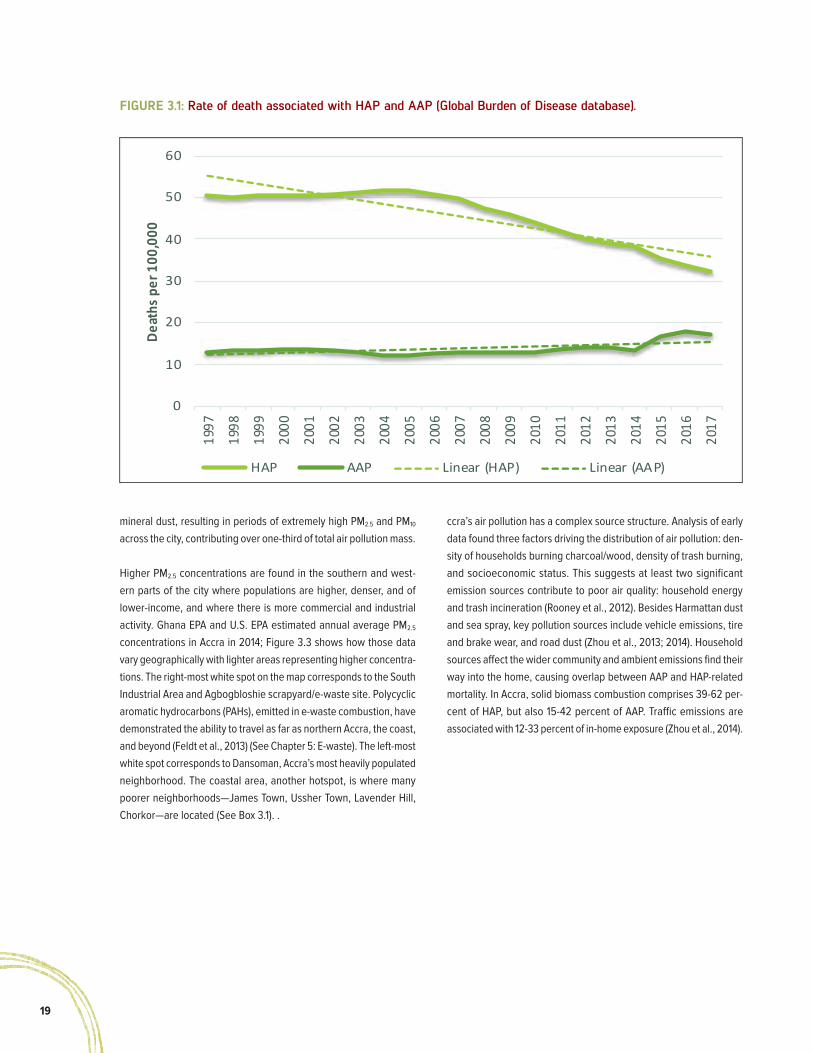
19
FIGURE 3.1: Rate of death associated with HAP and AAP (Global Burden of Disease database).
ccra’s air pollution has a complex source structure. Analysis of early data found three factors driving the distribution of air pollution: den-sity of households burning charcoal/wood, density of trash burning, and socioeconomic status. This suggests at least two significant emission sources contribute to poor air quality: household energy and trash incineration (Rooney et al., 2012). Besides Harmattan dust and sea spray, key pollution sources include vehicle emissions, tire and brake wear, and road dust (Zhou et al., 2013; 2014). Household sources affect the wider community and ambient emissions find their way into the home, causing overlap between AAP and HAP-related mortality. In Accra, solid biomass combustion comprises 39-62 per-cent of HAP, but also 15-42 percent of AAP. Traffic emissions are associated with 12-33 percent of in-home exposure (Zhou et al., 2014).
0
10
20
30
40
50
60
1997
1998
1999
2000
2001
2002
2003
2004
2005
2006
2007
2008
2009
2010
2011
2012
2013
2014
2015
2016
2017
Deat
hs p
er 1
00,0
00
HAP AAP Linear (HAP) Linear (AAP)
mineral dust, resulting in periods of extremely high PM2.5 and PM10 across the city, contributing over one-third of total air pollution mass.
Higher PM2.5 concentrations are found in the southern and west-ern parts of the city where populations are higher, denser, and of lower-income, and where there is more commercial and industrial activity. Ghana EPA and U.S. EPA estimated annual average PM2.5 concentrations in Accra in 2014; Figure 3.3 shows how those data vary geographically with lighter areas representing higher concentra-tions. The right-most white spot on the map corresponds to the South Industrial Area and Agbogbloshie scrapyard/e-waste site. Polycyclic aromatic hydrocarbons (PAHs), emitted in e-waste combustion, have demonstrated the ability to travel as far as northern Accra, the coast, and beyond (Feldt et al., 2013) (See Chapter 5: E-waste). The left-most white spot corresponds to Dansoman, Accra’s most heavily populated neighborhood. The coastal area, another hotspot, is where many poorer neighborhoods—James Town, Ussher Town, Lavender Hill, Chorkor—are located (See Box 3.1). .

203. air PolluTion
Age
AAP 0-4 5-14 15-49 50-69 70+ Total
Ischemic heart disease 0 0 269 788 694 1,752
Stroke 0 0 296 680 507 1,483
Chronic obstructive pulmonary disease
0 0 59 172 208 439
Lung cancer 0 0 14 73 53 141
Lower respiratory infection 543 56 517 915 1,065 3,096
Diabetes Mellitus 2 19 129 123 271
Total 543 56 1,174 2,758 2,650 7,182
HAP 0-4 5-14 15-49 50-69 70+ Total
Ischemic heart disease 0 0 302 860 845 2,008
Stroke 0 0 361 713 584 1,659
COPD 0 0 73 216 261 550
Lung cancer 0 0 20 99 71 190
Lower respiratory infection 691 71 657 1,163 1,354 4,130
Diabetes Mellitus 2 21 142 136 299
Total 691 71 1,434 3,193 3,252 8,835
AP (AAP+HAP) 1,234 127 2,608 5,951 5,902 16,017
TABLE 3.1: Annual mortality burden attributed to AAP/HAP, by age (Estimates by authors).
Plumes of smoke from a rural kitchen.Curt Carnemark / World Bank
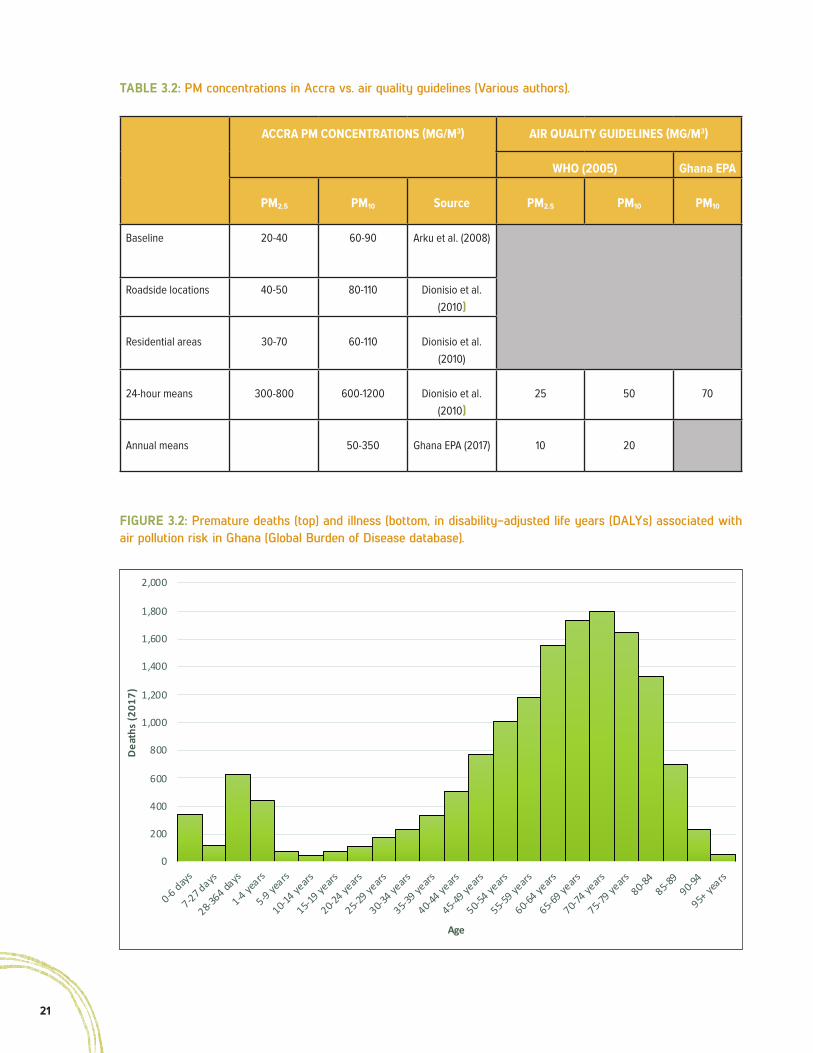
21
ACCRA PM CONCENTRATIONS (ΜG/M3) AIR QUALITY GUIDELINES (ΜG/M3)
WHO (2005) Ghana EPA
PM2.5 PM10 Source PM2.5 PM10 PM10
Baseline 20-40 60-90 Arku et al. (2008)
Roadside locations 40-50 80-110 Dionisio et al. (2010)
Residential areas 30-70 60-110 Dionisio et al. (2010)
24-hour means 300-800 600-1200 Dionisio et al. (2010)
25 50 70
Annual means 50-350 Ghana EPA (2017) 10 20
TABLE 3.2: PM concentrations in Accra vs. air quality guidelines (Various authors).
FIGURE 3.2: Premature deaths (top) and illness (bottom, in disability-adjusted life years (DALYs) associated with air pollution risk in Ghana (Global Burden of Disease database).
0
200
400
600
800
1,000
1,200
1,400
1,600
1,800
2,000
0-6 days
7-27 days
28-364 da
ys
1-4 years
5-9 years
10-14 ye
ars
15-19 ye
ars
20-24 ye
ars
25-29 ye
ars
30-34 ye
ars
35-39 ye
ars
40-44 ye
ars
45-49 ye
ars
50-54 ye
ars
55-59 ye
ars
60-64 ye
ars
65-69 ye
ars
70-74 ye
ars
75-79 ye
ars80-8
485-8
990-9
4
95+ ye
ars
Dea
ths
(201
7)
Age

223. air PolluTion
An estimated 20.5 million Ghanaians—over 70 percent of the popu-lation—burn solid fuels, like fuelwood, charcoal, and dung, in their homes for cooking and heating. Households use open fires or inef-ficient cookstoves—often in confined, poorly ventilated spaces—that generate PM2.5 pollution. Ghana Statistical Service (GSS) (2015) reported that over half of urban households and 90 percent of rural households use solid fuel for cooking (Table 3.3). Since 2005 Ghana has reduced, by over 20 percent, the proportion of the population using solid fuels (HEI, 2019). Clean cookstove interventions and gov-ernment programs to support liquefied petroleum gas (LPG) distribu-tion have played a key role in this transition (Box 3.2).
HAP contributes directly to Ghana’s disease burden but is also a major source of AAP. The cooking area in many compounds does not have closed walls or windows, so often exposure is not technically indoors. As these emissions disperse into the neighborhood, they serve as both a direct health risk through HAP and a contributor to the health risk associated with AAP. One regional estimate holds that such emissions contribute approximately 10 percent of AAP across western
FIGURE 3.3: Estimated spatial distribution of annual average PM2.5 concentrations in Accra for 2014 (MESTI, 2014).
0
10,000
20,000
30,000
40,000
50,000
60,000
0-6 days
7-27 days
28-364 da
ys
1-4 years
5-9 years
10-14 ye
ars
15-19 ye
ars
20-24 ye
ars
25-29 ye
ars
30-34 ye
ars
35-39 ye
ars
40-44 ye
ars
45-49 ye
ars
50-54 ye
ars
55-59 ye
ars
60-64 ye
ars
65-69 ye
ars
70-74 ye
ars
75-79 ye
ars80-8
485-8
990-9
4
95+ ye
ars
DAL
Ys (2
017)
Location Population that uses solid fuel Population that does not use solid fuel
Accra 1.6 million 2 million
Other Urban 7.4 million 5 million
Rural 11.5 million 1.3 million
Average household PM2.5 concentration 128 µg/m3 45-50 µg/m3
TABLE 3.3: Fuel used by households in Ghana (DHS, 2016; Van Vliet, 2016; Van Donkelaar, et al., 2016)
sub-Saharan Africa, while findings particular to Accra hold that they are up to one-third of AAP (Chafe et al., 2014; Zhou et al., 2014).
The lighter the color the higher the PM concentration.

23
It appears that rural areas are also experiencing dangerously high levels of air pollution. Testing conducted in Navrongo, Upper East Region, at the town’s periphery gave lower ambient PM2.5 concentra-tions than at the roadside, suggesting that the relationship between road proximity and ambient concentrations holds in urban and rural locations. Exposure to CO, a key indicator of HAP-related health outcomes, was greatest in households near city centers, dropping off in increasingly rural areas. On the other hand, exposure to car-bonaceous PM2.5—black carbon and organic carbon suspended in air—was higher in rural households (Van Vliet et al., 2013; Ofosu et al., 2013; Piedrahita et al., 2017). This may be explained by the higher prevalence of LPG and charcoal, which emit less PM2.5, in more centralized households or the greater role of non-cooking sources in overall air pollution exposure in cities.
3.2 Economics of Air Pollution in Ghana
Annual total air pollution in Ghana has an estimated average cost equivalent to 4.2 percent of 2017 GDP, or about US$2.5 billion (Table 3.4). AAP, estimated at US$1.1 billion is currently less costly than HAP by about US$250 million/year, but increasing urbanization means
Box 3.1: Distributional effects of air pollution in Accra
Research suggests that poor health from air pollution expo-sure is not equally distributed across a city. Studies have found significant differences in road conditions, traffic pat-terns, and fuel use between affluent and poorer neighbor-hoods, which have an impact on ambient pollution levels and disease burden. Zhou et al. (2013) made measurements in four different neighborhoods that lie on a line from the coast to Accra’s northern boundaries (see figure). James Town and Nima are densely populated low-income communities where most residents use biomass for cooking at home and for street food. Fewer people use biomass in Asylum Down, a middle-class neighborhood, and East Legon, an upper class, low-density neighborhood where families live on large plots of land in modern low-rise homes. Zhou et al. (2013) found sea salt aerosol and crustal material (Saharan dust) predictably distributed, with larger contributions of sea salt at southern sites (near the ocean) and dust at northern sites. They also found biomass smoke contributed more particle pollution in poorer neighborhoods, where the density of households using biomass fuels was substantially higher than in affluent areas. Road dust and traffic aerosols were more significant at the two sites near traffic routes, one a busy road in Nima, the other in Asylum Down, which is bordered by the highly trafficked Ring Road. A final source for fine particles, likely from burning solid waste, was identified in all neighborhoods except East Legon, where there is regular trash collection. This source was largest in James Town where old tires and trash are commonly burned.
Source: Zhou et al., 2013.
this may not be the case for long. AAP is estimated to cost US$264 million dollars/year alone in Accra and Kumasi, Ghana’s two largest cities (Figure 3.4).
3.3 Air Pollution Governance Framework and Analysis
Ghana has piecemeal laws, regulations, and policies related to improved air quality and reduced GHG emissions, but no overarch-ing policy on air quality management (AQM). The need for air quality management was defined in the Environmental Protection Agency Act 1994 (Act 490) and the Environmental Assessment Regulations, (1999) (L.I. 1652). The National Environmental Sanitation Strategy and Action Plan (2010) supported actions to prevent open burning of municipal and agricultural waste. The 2014 National Environmental Policy reiterated the call for improved AQM through a comprehensive National Air Quality Policy and concurrent compliance monitoring system. In 2018, Ghana developed a National Action Plan (NAP) to combat emissions of Short-Lived Climate Pollutants, identifying and prioritizing policy options to adopt.
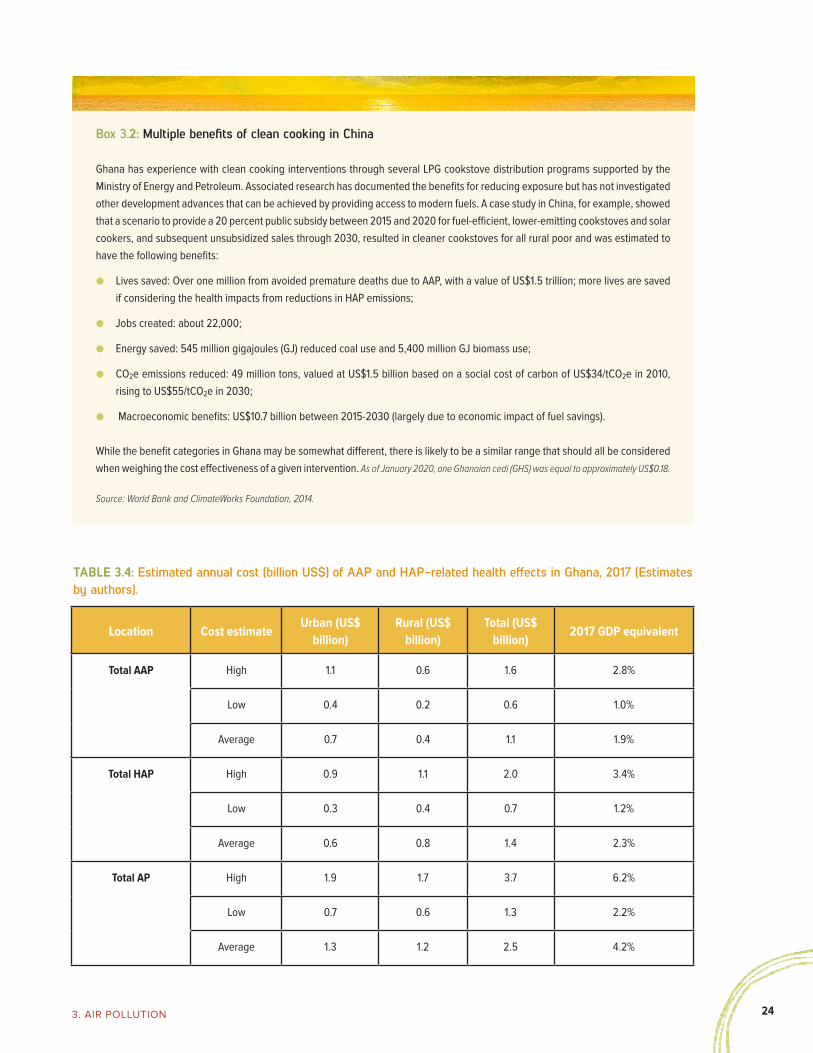
243. air PolluTion
Location Cost estimateUrban (US$
billion)Rural (US$
billion)Total (US$
billion)2017 GDP equivalent
Total AAP High 1.1 0.6 1.6 2.8%
Low 0.4 0.2 0.6 1.0%
Average 0.7 0.4 1.1 1.9%
Total HAP High 0.9 1.1 2.0 3.4%
Low 0.3 0.4 0.7 1.2%
Average 0.6 0.8 1.4 2.3%
Total AP High 1.9 1.7 3.7 6.2%
Low 0.7 0.6 1.3 2.2%
Average 1.3 1.2 2.5 4.2%
TABLE 3.4: Estimated annual cost (billion US$) of AAP and HAP-related health effects in Ghana, 2017 (Estimates by authors).
Box 3.2: Multiple benefits of clean cooking in China
Ghana has experience with clean cooking interventions through several LPG cookstove distribution programs supported by the Ministry of Energy and Petroleum. Associated research has documented the benefits for reducing exposure but has not investigated other development advances that can be achieved by providing access to modern fuels. A case study in China, for example, showed that a scenario to provide a 20 percent public subsidy between 2015 and 2020 for fuel-efficient, lower-emitting cookstoves and solar cookers, and subsequent unsubsidized sales through 2030, resulted in cleaner cookstoves for all rural poor and was estimated to have the following benefits:
● Lives saved: Over one million from avoided premature deaths due to AAP, with a value of US$1.5 trillion; more lives are saved if considering the health impacts from reductions in HAP emissions;
● Jobs created: about 22,000;
● Energy saved: 545 million gigajoules (GJ) reduced coal use and 5,400 million GJ biomass use;
● CO2e emissions reduced: 49 million tons, valued at US$1.5 billion based on a social cost of carbon of US$34/tCO2e in 2010, rising to US$55/tCO2e in 2030;
● Macroeconomic benefits: US$10.7 billion between 2015-2030 (largely due to economic impact of fuel savings).
While the benefit categories in Ghana may be somewhat different, there is likely to be a similar range that should all be considered when weighing the cost effectiveness of a given intervention. As of January 2020, one Ghanaian cedi (GHS) was equal to approximately US$0.18.
Source: World Bank and ClimateWorks Foundation, 2014.

25
$161
$103
$448
$-
$50
$100
$150
$200
$250
$300
$350
$400
$450
$500
Accra Kumasi Other urban areas
US$
, mill
ion
FIGURE 3.4: Estimated AAP cost per year by urban area (Estimates by authors).
The main agency responsible for AQM is the EPA. EPA’s air quality monitoring activities are geared toward: (1) improving coordination of all activities to monitor atmospheric air quality, (2) scientific deter-mination of levels of various air pollutants resulting from natural and anthropogenic sources, and (3) developing enforceable air quality standards and regulations to improve air quality and protect human health.
AQM planning aligns with Ghana’s Nationally Determined Contributions (NDC) goals, submitted under the 2015 Paris Climate Agreement. The GoG will seek to reduce GHG emissions by at least 15 percent below a “business as usual” baseline scenario, which projects national emissions to be 73.95 MtCO2eq in 2030. Targets are to be achieved broadly, but primarily focused in the energy and waste sectors with non-emission targets in the transportation as well as forestry sectors (MESTI, 2015). The commitments are directly in line with air quality goals given that several of the energy, transpor-tation, and solid waste targets are among the chief sources of air pollution. Forestry sector targets are indirectly linked to air pollution since wood fuel contributes to emissions. Another of Ghana’s NDC’s goals is to reduce hydrofluorocarbons emissions from retired heating/cooling equipment.
Several ongoing projects demonstrate how investment and lending can be aligned with an AQM/multiple benefits agenda (Table 3.5).
3.4 Gaps and Challenges
Cross-sectoral coordination. Successful AQM planning requires strong coordination between relevant ministries, departments, and agencies (MDAs), as well as external organizations. This level of inter-agency, multi-stakeholder coordination requires commitment, resources, and leadership at the highest levels of government. For example, the EPA is attempting to strengthen the regulation of vehicle emission standards. The Ministry of Transportation (MoT), Ministry of Finance and Economic Planning (MoF), and private sector trade associations and industries all have a part in supporting regulations to ensure compliant fuel supplies, vehicle inspection and maintenance programs, alternative transportation choices, and active enforcement through increased vehicle checks and fines. Similarly, solid waste collection and disposal initiatives requires public-private partnerships that span multiple government agencies and private sector partners. Currently, there is no such coordination mechanism in place.

263. air PolluTion
Box 3.3: Air pollution at the Tema roundabout
Many women work at Tema Roundabout, a large traffic circle located halfway Accra and Tema. Two years ago, Georgina, a 30-year-old single mother from Western Region, moved with her five children to a home 100 meters from this bustling crossroads. Georgina sets up a wooden table next to the pavement and sells kenkey (fermented cornmeal) and fish to passers-by, working from 6 a.m. to 11 p.m. After school her children join her to help with the family enterprise. Georgina sets her table up seven days a week but makes only 20 cedis a day (less than US$4). Jennifer and Janet are “hawkers” who weave in between cars, buses, and trucks sell-ing plantain chips and water sachets to hot and dusty road travelers. Both in their twenties and hailing from Central and Northern Regions, respectively, they live in Ashaiman, a sprawling, densely populated, impoverished neighborhood 30 km away. They earn more money plying the roadway than in agriculture (Jennifer) or selling eggs (Janet).
Asked about any ill health effects from working so close to a highly trafficked highway that sees near constant traffic jams, the three women complain of “catching cold,” although Georgina believes this is due to the weather. Janet, who has also been working at the roundabout for two years, complains of severe headaches, sneezing, and a lingering cough. The headaches are daily and cause her great distress due to their severity. Georgina too complains of near constant headaches and chest pains, observing that they seem worse when the dust and fume concentrations are higher, although she says that she is habituated to the sour smell of exhaust. Jennifer gets the occasional headache, but she has only been working at the roundabout for two months. The three agree that the dust coming from a nearby construction site is very bad and, combined with the black smoke and exhaust fumes they are exposed to all day long, can cause severe pain.
Janet, Jennifer, and Georgina try not to think about the effects the air may be having on them, but they find themselves going to the pharmacy often to buy painkillers. Recently, Georgina had to go to the clinic to get a CAT scan due to her continuing chest pain. She could not afford to stay because admission costs GHS2,000, 100 times her daily earnings.
Project title, location (duration)
ActivityDevelopment partners; Government partners
Greater Accra Metropolitan Area (GAMA) Sanitation and Water Project, Greater Accra (2013-2020)
Open burning of municipal solid waste is a major source of pollution in GAMA. The US$150 million project is focused on improving service delivery in the wake of the 1993 GoG decentralization reform. This sectoral program attempts to increase access to improved sanitation and improved water supply in the GAMA by coor-dinating municipal entities.
World Bank; Ghana Water Company Ltd., Ministry of Sanitation and Water Resources
Transport Sector Improvement Project, Northern Ghana (2017-2023)
This US$150 million project aims to improve regional connectivity with the central part of Togo and improve road infrastructure supporting ongoing agricultural development and improve accessibility in one of the poorest agricultural produc-tion areas of Northern Ghana. The Ghana Poverty and Inequality Profile (June 2015) shows a high correlation between the presence of road infrastructure and poverty rates.
World Bank; MoF, Ministry of Transport, Ministry of Roads and Highways
Urban Health and Short-Lived Climate Pollution (SLCP) Reduction Project, Accra (2017 - Present)
The initiative aims to mobilize the health sector in support of policy action to mitigate climate change and air pollution. It emphasizes the health risks of air pollution and climate change to the public and other economic sectors with the hope of compelling constituencies and policy makers to act.
WHO; MESTI/EPA, Ministry of Health/Ghana Health Service
TABLE 3.5: Selected air quality improvement projects

27
Increased data. The lack of quality data on pollution and its cost exacerbates the challenges of building a case to allocate public budget to AQM. Relatedly, there is need for capacity enhancement to assess the nature and severity of air pollution. Quantifying the contribution to pollution from various sources will help determine AQM priorities. The EPA has laid the foundational step of establishing an air quality monitoring network, which collects data from over a dozen locations throughout Accra and its environs. As of now, the monitoring network lacks ability to track key gaseous pollutants. Further progress will require advancing the network’s level of sophistication and scaling-up beyond the Accra metropolis.
3.5 Recommendations to Improve Air Quality
3.5.1 Short-term (1-2 years)
● Improve enforcement of existing air pollution regulations (MESTI/EPA)
● Finalize the draft AQM policy (Cabinet, MESTI)
● Create a multi-stakeholder platform to coordinate AQM planning across public, private, non-profit sectors (Cabinet)
● Reinforce/recruit staff with proper training and expertise in AQM to document levels of air pollution, monitor trends, and quantify improvements (MESTI/EPA)
● Make the case for clean air policies as an avenue to protect human capital and develop economic opportunities (MESTI/EPA)
● Establish a robust data management system that can support decision-making and provide information to the public on when to take self-protective measures (MESTI/EPA)
● Support behavior change communication that helps households, especially women, to adopt practices that reduce health risks from HAP (MESTI/EPA)
3.5.2 Medium-term (2-5 years)
● Bolster the institutional framework in a way that facilitates achievement of AQM policy objectives, e.g. creation of a “Clean Air Czar/Commissioner” (Cabinet, MESTI)
● Enhance AQM regulatory and enforcement authority of the EPA (Parliament, MESTI)
● Author HAP/AAP guidelines, regulations, by-laws that account for socioeconomic and cultural differences across neighborhoods and rural/urban settings (Parliament, MLGRD/MMDAs38)
● Maintain collaboration with Nigeria and other Economic Community of West African States countries to reduce vehicle emissions: setting limits for sulfur in fuels at <50 ppm 39(MESTI)
● Lower import duties on environmentally-friendly cars; raise duties on higher-emission secondhand vehicles (MoF/GRA40)
● Transition away from solid biofuels; establish HAP guidelines for clean cookstoves to regulate residential combustion levels (MESTI/EPA, MoTI41)
● Analyze causes and effects of trash burning in Accra, other major urban areas and develop suitable policies and mecha-nisms to prohibit/control it; encourage public-private part-nerships to finance municipal services for waste collection, disposal, recycling (MESTI/EPA, MLGRD/MMDAs, MSWR)
3.5.3 Long-term (5+ years)
● Improve understanding of air pollution sources; work with universities, research institutes to use existing expertise and build future capacity for analysis of pollution issues (MESTI)
● Provide sustained funding to hire/retain qualified staff to deliver on AQM goals (MESTI, MoF)
● Mainstream and coordinate AQM policy planning, implementa-tion, and enforcement across national, regional, local levels of Government (MDAs42 , MLGRD/MMDAs)
● Quantify air pollution costs and AQM benefits using natural capital accounting (at macroeconomic level) and cost-benefit analysis (at project level) to target priority sectors for action (MESTI, MoF)
● Given the high personal exposures observed in households using solid biomass fuels, provide air quality monitoring in rural settings to address HAP (Wiedinmyer et al., 2017) (MESTI/EPA)
● Impose sufficient distances between industrial, commercial, residential zones in city planning (MESTI/LUSPA43, MLGRD/MMDAs)
● Design LPG cookstove interventions for rural and urban communities; study supply chains and market conditions to identify incentives for LPG distribution companies and clean cookstove manufacturers/suppliers; target subsidies to transi-tion away from solid biomass fuel use; employ results-based financing to reach program goals (e.g. World Bank, 2016) (MESTI, MoTI)
38. MLGRD = Ministry of Local Government and Rural Development; MMDAs = Metropolitan, Municipal, and District Assemblies.
39. Setting limits for sulfur in fuels at 50 ppm or lower (by 2020) will enable Ghana to follow through on the 2015 Transportation Policy Roadmap, which calls for adopting EURO emission standards for automobiles and diesel trucks.
40. MoF = Ministry of Finance and Economic Planning; GRA = Ghana Revenue Authority
41. MoTI = Ministry of Trade and Industry.
42. MDAs = Ministries, Departments, Agencies.
43. LUSPA = Land Use and Spatial Planning Authority, an agency of MESTI.

283. air PolluTion
Boy removes plastic waste caught in a fishing net, west of Accra. Ulrich Doering / Alamy Stock Photo

29
4

304. PlasTiC PolluTion
Table 4.1: Plastic waste generation in Ghana, by plastic grade (Troutman and Aseidu-Dankwah, 2017; Miezah et al., 2015).
Plastic type Examples Distribution, by grade (%)
Daily (MT) Annually (MT)
LDPE (film)
(Low density polyethylene)
Black/white (transparent)/other color carrier bags
25.31 760 277,145
PET
(Polyethylene terephthalate)
Soft drink and water bottles; oven-ready meal trays
23.00 690 251,850
HDPE
(High-density polyethylene)
Bottles for milk and washing-up liquids; garden chairs; buckets
19.19 576 210,131
PP (rigid) (Polypropylene) Bottle lids, disposable cups, cutlery 10.61 318 116,180
PS (Polystyrene) Yogurt pots, carryout trays, hamburger boxes, egg cartons, vending cups, cutlery, protective packaging for electronics, toys
3.75 113 41,066
PVC (Polyvinyl chloride) Food trays, cling film, bottles for squash, mineral water, shampoo
4.31 129 47,195
Other Any other plastic in consumer waste stream (e.g. textiles, shoes, electronic enclosures)
13.83 415 151,439
14% of municipal solid waste 3,000 1,095,000
4. Plastic Pollution4.1 Plastic Waste in Ghanaian Society
Plastics are an integral and ubiqui-tous component to human life and economic activity. Consequently, more and more plastic ends up as waste. In Ghana, over 3,000 metric tons (MT) of plastic waste is generated every day—equivalent to 1.1 million MT per year—comprising 10-14 percent of the municipal solid waste stream (Troutman and Aseidu-Dankwah, 2017; Miezah et al., 2015) (Table 4.1).
An estimated 86 percent of Ghana’s waste plastic load, roughly 2,500 MT/
day or 1 million MT/year, is mismanaged. This challenge may be placed in the context of the overarching waste management system, in which
over 30,000 MT of municipal solid waste are generated each day. Of this waste only 14 percent is collected; 38 percent is dumped in open spaces set aside as informal dumps; 24 percent is deposited at “community containers”; nine percent is dumped indiscriminately; 11 percent is burned in the open; and four percent is buried (GSS, 2013). Spatial disparities in access to waste management services exist between regions, as well as between rural and urban areas. Without effective alternatives more than four out of every five households improperly dispose of their wastes, including plastics.
The result is widespread environmental and urban pollution, which has become commonplace in nearly every community in Ghana over the past 20 years. Packaging plastics serve as a primary component of increasing accumulations of improperly disposed wastes, resulting in environmental degradation and contributing to disasters, especially flooding and cholera outbreaks. Even when rain conditions are insuf-ficient to cause flooding, drains clogged with a mixture of plastics, organics, and water become an inviting habitat for disease-carrying vectors such as mosquitos and rats, posing threats to public health.
HYE WON HYE(“that which does not
burn”): Imperishability, endurance

31
The impact on air pollution can be significant given that 11 percent of Ghana’s waste is burned. Burning plastics releases toxic substances and greenhouse gas emissions that contribute to climate change. Air pollutants are available for environmental and human exposure via many pathways, including inhalation, dermal exposure, and ingestion of contaminated food and water. Health effects include decreased immune function, cataracts, kidney and liver damage, breathing prob-lems, asthma-like symptoms, lung function abnormalities, skin inflam-mation, and increased risk of cancers of the skin, lung, bladder, and gastrointestinal organs (Verma et al., 2016; North and Halden, 2013).
Mismanaged plastics are strewn across the landscape, where they either directly or indirectly migrate to stormwater drains, rivers, and streams and eventually the ocean. Estimates for Ghana’s contribu-tion to global marine debris range from approximately 92,000 MT to 260,000 MT every year, or one to three percent of the global total. Without comprehensive interventions, marine debris inputs are expected to soar in excess of 350,000 MT/year by 2025 (Jambeck et al., 2015; Troutman and Asiedu-Dankwah, 2017). Impacts include entanglement and ingestion by wildlife, alteration of habitats, and the transport of alien species. Freshwater environments are also vulnerable to many of the hazards that plastics pose to the marine environment.
Fragmented plastic pieces, both micro and nanoplastics, are so small they can be absorbed by plants and animals and bioaccumulate up the food web. Once in the food web, micro and nanoplastics particles enter the cells of all living organisms including humans and wildlife, amplifying most of the ecotoxilogical impacts (Revel et al., 2018; Kershaw and Rochman, 2015). Microplastics are fragments less than 5 mm produced from the weathering of larger plastics or deposited directly, such as microbeads used in cosmetics, and are found in marine, terrestrial, and freshwater ecosystems (Rochman, 2018). Nanoplastics are nano-sized particles (< 1 μm), that are now found ubiquitously in the environment and are a significant threat to the environment and human health (Revel et al., 2018). The reduced size of these particulates makes them susceptible to ingestion by
organisms that are at the base of the food chain, exaggerating bioac-cumulation and bioamplification phenomena.
Once in the ecological food chain, the chemicals derived from plastics bioaccumulate in the food web, finding pathways into the human diet. Plastics and especially chemicals associated with plastics are known to have many adverse effects on the food web, including inhibition of plant growth, broken nutrient pathways, animals chok-ing and foraging, and chemical uptake in both plant and animals (NetEnrich, 2015). Of importance are persistent organic pollutants (POPs) associated with chemical fertilizer and pesticide use in agricul-ture. Plastics—especially microplastics and nanoplastics—are known to have a high affinity for POPs (Koelmans et al., 2013). These find-ings, in connection with ingestion of plastics by fish consumed by humans and pathways for chemical contamination from plastics to fish to human are problematic.
4.2 Economics of Plastics in Ghana
Since the turn of the 21st century, plastics have become a large, ever-growing proportion of packaging applications. In Ghana, this has resulted in a burgeoning domestic plastics industry. From 1996 to 2010, local plastics manufacturing grew from 20 companies to 895; those companies directly employ 147,410 people, mostly in the Accra-Tema Metropolitan Area (Adama-Tettey, 2012). The plastics value-chain includes imports, manufacture of semi-finished and fin-ished goods, retail, waste generation, waste management, plastics collection, recycling, and exports (Figure 4.1). Plastics in Ghana are imported as either virgin pellets or finished products. Importers of virgin pellets also manufacture semi-finished goods such as bottles and lids for the food and beverage industry. Fast-moving consumer goods manufacturers are mostly represented by multinational cor-porations. Retail is predominantly carried out in the informal sector by micro-enterprises, a sector characteristically difficult to regulate.
FIGURE 4.1: Plastics value chain

324. PlasTiC PolluTion
Growth in imported finished products (e.g. prepared food) and semi-finished goods (e.g. flexible plastics used in packaging) has outpaced domestic plastic manufacturing. All plastics in Ghana originate from foreign sources, imported mainly from Asia and Europe (GSS, 2014). 2009-2013 trade data from the GSS (2014)44 showed 265 percent growth in polyethelene (PE) raw imports, 333 percent growth in plas-tics and 304 percent growth in prepared foods, which are typically packaged in flexible plastic films. In context, total imports grew by 275 percent (Table 4.2). In the flexible packaging sector, the Ghana Plastics Manufacturers Association reports annual production of 27,000 MT of flexible packaging and imports of 120,000 MT of plastic films. Waste characterization studies over the same data period (2014-2017) estimate that 275,000 MT of flexible plastic films are discarded every year, which suggests that 55 percent of all flexible plastics in Ghana are imported as a finished product (GSS, 2014).
Two to five percent of plastic waste in Ghana is collected for recycling and more than 95 percent of all waste plastics recovered for recycling are recovered by the informal sector. (Adama Tettey, 2012). Most collection for recycling involves thin-film plastic sachets for drinking water, which is transformed into reusable shopping bags. Waste pick-ers recover plastics from streets and markets, scavenge at landfills and dumpsites, or offer micro-enterprise door-to-door services in many communities. Presently, Ghana’s market for recycled plastics is demand-driven, with supply substantially outweighing needs. A
new group of recyclers in Ghana is emerging that transforms waste plastic materials into innovative, high-value products, including diesel fuel, fishing rope and nets, affordable housing building panels, high-value furniture, and asphalt road modification. In the past decade, conventional recycling has been used to transform waste high-density polyethylene into low-value products, like single-use carrier bags, in a process referred to as “down-cycling.” Formal sector waste manage-ment service providers are interested in diversifying their business models to include higher levels of plastics recovery. However, the sector is impeded by a limited domestic market for recyclables and insufficient national and regional collaboration to achieve the econo-mies of scale necessary to generate the high tonnages demanded by international markets (Authors’ interviews).
Table 4.2: Imports by Section, 2009-2013 (Adapted from GSS, 2014).
Sector 2009, million GHS 2013, million GHS Growth (%)
Prepared food 496.0 1,509.4 304
Plastics and articles thereof 470.9 1,360.5 333
PE having a specific gravity > 0.94, in primary form
79.5 210.8 265
Total Imports 9,087.7 25,001.7 275
44. Most recent data publicly available.

33
4.3 Economics of Plastics in Ghana
There are several national institutions and private organizations whose mandates and activities touch—and overlap—on waste management issues (including plastics). Principally, plastics waste management is shared by three ministries—MESTI; Ministry of Local Government and Rural Development (MLGRD); and Ministry of Sanitation and Water Resources (MSWR). The overlapping mandates create redundancies and delays in efficient planning and governance. Lack of direction in policy setting and implementation and a lack of resources are factors have contributed to challenges in plastic pollution management.
In 2007 the Ministry of Local Government and Rural Development published an ambitious and holistic Environmental Sanitation Policy45. The Policy’s main theme is “Materials in Transition (MINT).” MINTing is a philosophy of creating awareness to change public attitudes toward handling and disposal of all types of waste by demonstrating that there remains economic value in waste components. MINTing aims to create “green collar” jobs and has the potential to reduce Metropolitan, Municipal and District Assemblies’ (MMDAs) waste management costs. The policy has seven broad and cross-cutting focal areas: (1) capacity development; (2) information, education and communication; (3) legislation and regulation; (4) sustainable financing and cost recovery; (5) levels of service; (6) research and development; and (7) monitoring and evaluation.
An associated National Environmental Sanitation Strategy and Action Plan is robust and comprehensive in scope but neglects to define roles, responsibilities, and activities with the level of detail neces-sary for implementation. Consequently, although the Environmental Sanitation Policy provides a strong mandate for sustainable develop-ment and plastics management, the framework for action is ineffec-tive and little progress has been made in implementing the Policy over the past 10 years. Lack of accountability, coordination, and strategic planning have been principal causes leading to its failure.
Act 863, the Customs and Excise (Duties and Other Taxes) (Amendment) Act (2013), known as the Environmental Tax, places an excise duty of 10 percent of the ex-factory price of select plastics. Proceeds are intended for the Plastic Waste Recycling Fund. Act 863 is defunct because the Fund has not been set up, although virgin plastic gran-ules have been taxed at the seaport since the Act was brought into force. Furthermore, as only virgin plastic granules—used notably by domestic manufacturers—have been subjected to the excise duty, there has been an influx of cheaper imported products (e.g. single-use carrier bags) able to easily outcompete local production.
In 2015 MESTI published a directive that “all flexible plastics pro-duced in the country will have bio-degradable additive added to them to make them bio-degradable for easy management.” Use of oxo-biodegradable plastics (OXOs) have been proposed as a solu-tion to the global problem of plastic pollution, as they are meant to degrade in the presence of oxygen more quickly than regular plastic. However, they have also received widespread criticism and caution due to fears they may actually worsen the problem.
MESTI released a draft National Plastics Management Policy in early 2018. The Policy is designed to bring cohesion and clear account-ability to all plastics-related issues. It aligns with the objectives set out in the Environmental Sanitation Policy, attempting to translate them into detailed activities that are actionable and measurable (Box 4.1). At the time of this report, the National Plastics Management Policy and associated Implementation Plan were under review by the Presidential Cabinet.
45. The Policy was revised in 2009.
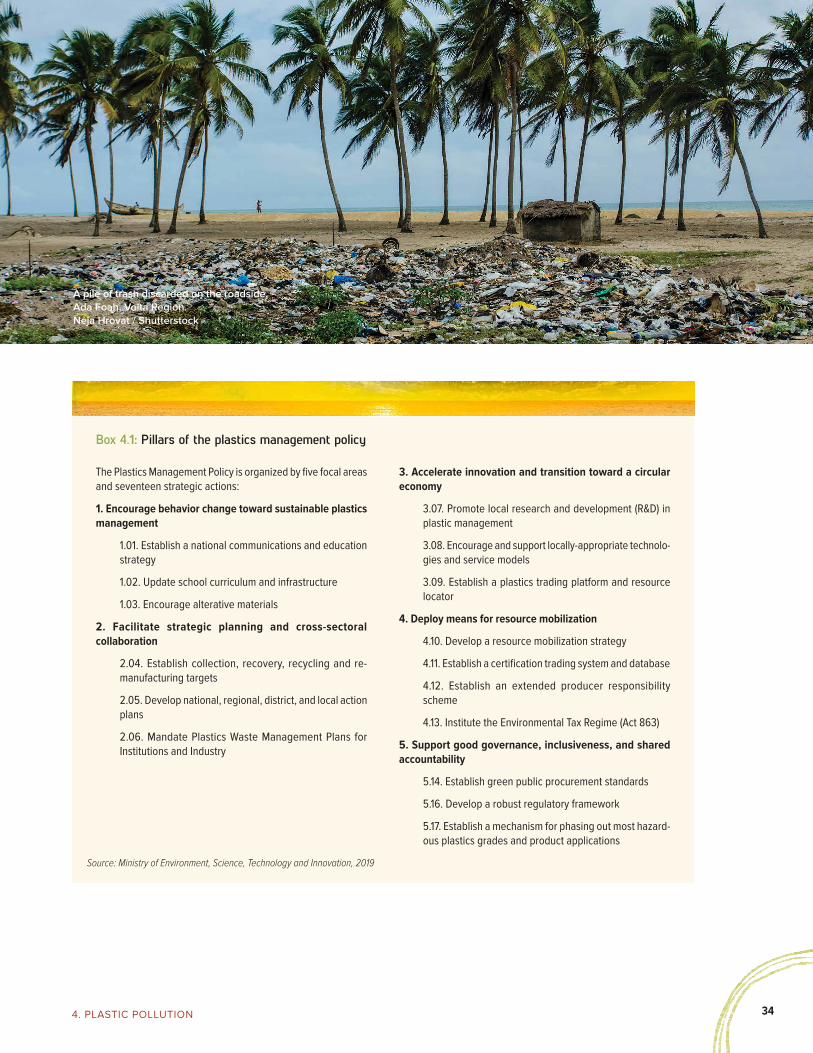
344. PlasTiC PolluTion
Box 4.1: Pillars of the plastics management policy
The Plastics Management Policy is organized by five focal areas and seventeen strategic actions:
1. Encourage behavior change toward sustainable plastics management
1.01. Establish a national communications and education strategy
1.02. Update school curriculum and infrastructure
1.03. Encourage alterative materials
2. Facilitate strategic planning and cross-sectoral collaboration
2.04. Establish collection, recovery, recycling and re-manufacturing targets
2.05. Develop national, regional, district, and local action plans
2.06. Mandate Plastics Waste Management Plans for Institutions and Industry
3. Accelerate innovation and transition toward a circular economy
3.07. Promote local research and development (R&D) in plastic management
3.08. Encourage and support locally-appropriate technolo-gies and service models
3.09. Establish a plastics trading platform and resource locator
4. Deploy means for resource mobilization
4.10. Develop a resource mobilization strategy
4.11. Establish a certification trading system and database
4.12. Establish an extended producer responsibility scheme
4.13. Institute the Environmental Tax Regime (Act 863)
5. Support good governance, inclusiveness, and shared accountability
5.14. Establish green public procurement standards
5.16. Develop a robust regulatory framework
5.17. Establish a mechanism for phasing out most hazard-ous plastics grades and product applications
Source: Ministry of Environment, Science, Technology and Innovation, 2019
A pile of trash discarded on the roadside, Ada Foah, Volta Region.Neja Hrovat / Shutterstock
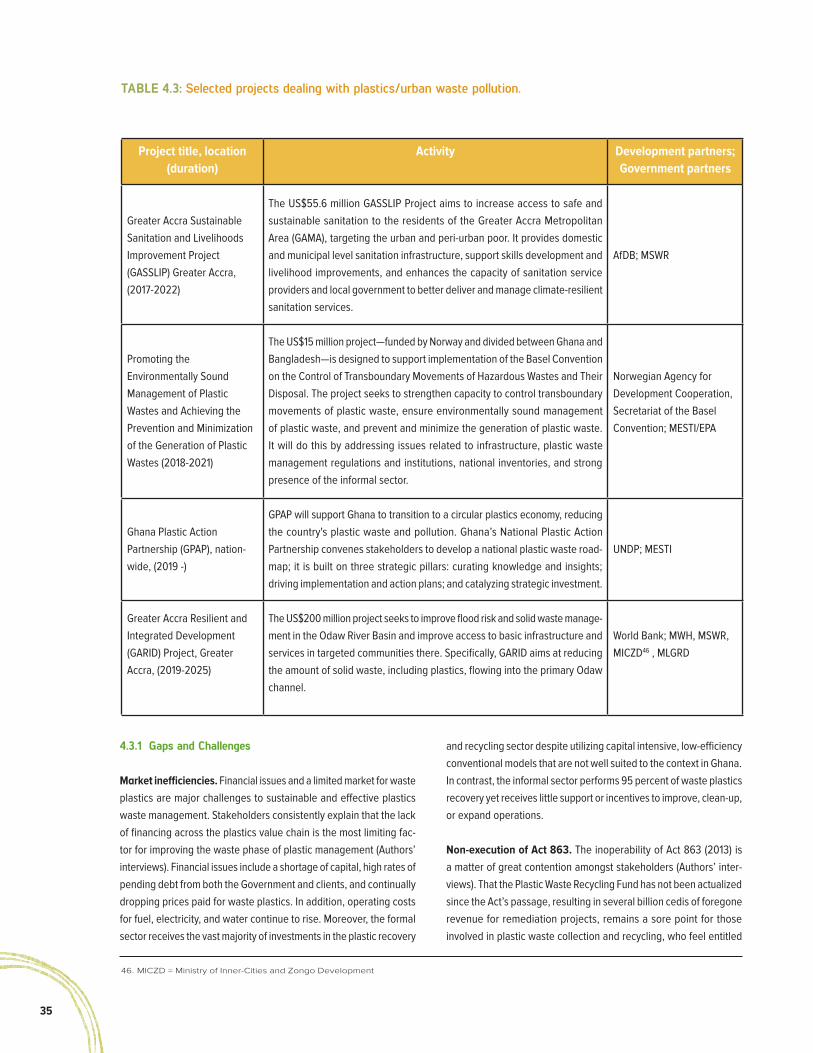
35
TABLE 4.3: Selected projects dealing with plastics/urban waste pollution.
Project title, location (duration)
Activity Development partners; Government partners
Greater Accra Sustainable Sanitation and Livelihoods Improvement Project (GASSLIP) Greater Accra, (2017-2022)
The US$55.6 million GASSLIP Project aims to increase access to safe and sustainable sanitation to the residents of the Greater Accra Metropolitan Area (GAMA), targeting the urban and peri-urban poor. It provides domestic and municipal level sanitation infrastructure, support skills development and livelihood improvements, and enhances the capacity of sanitation service providers and local government to better deliver and manage climate-resilient sanitation services.
AfDB; MSWR
Promoting the Environmentally Sound Management of Plastic Wastes and Achieving the Prevention and Minimization of the Generation of Plastic Wastes (2018-2021)
The US$15 million project—funded by Norway and divided between Ghana and Bangladesh—is designed to support implementation of the Basel Convention on the Control of Transboundary Movements of Hazardous Wastes and Their Disposal. The project seeks to strengthen capacity to control transboundary movements of plastic waste, ensure environmentally sound management of plastic waste, and prevent and minimize the generation of plastic waste. It will do this by addressing issues related to infrastructure, plastic waste management regulations and institutions, national inventories, and strong presence of the informal sector.
Norwegian Agency for Development Cooperation, Secretariat of the Basel Convention; MESTI/EPA
Ghana Plastic Action Partnership (GPAP), nation-wide, (2019 -)
GPAP will support Ghana to transition to a circular plastics economy, reducing the country's plastic waste and pollution. Ghana’s National Plastic Action Partnership convenes stakeholders to develop a national plastic waste road-map; it is built on three strategic pillars: curating knowledge and insights; driving implementation and action plans; and catalyzing strategic investment.
UNDP; MESTI
Greater Accra Resilient and Integrated Development (GARID) Project, Greater Accra, (2019-2025)
The US$200 million project seeks to improve flood risk and solid waste manage-ment in the Odaw River Basin and improve access to basic infrastructure and services in targeted communities there. Specifically, GARID aims at reducing the amount of solid waste, including plastics, flowing into the primary Odaw channel.
World Bank; MWH, MSWR, MICZD46 , MLGRD
4.3.1 Gaps and Challenges
Market inefficiencies. Financial issues and a limited market for waste plastics are major challenges to sustainable and effective plastics waste management. Stakeholders consistently explain that the lack of financing across the plastics value chain is the most limiting fac-tor for improving the waste phase of plastic management (Authors’ interviews). Financial issues include a shortage of capital, high rates of pending debt from both the Government and clients, and continually dropping prices paid for waste plastics. In addition, operating costs for fuel, electricity, and water continue to rise. Moreover, the formal sector receives the vast majority of investments in the plastic recovery
and recycling sector despite utilizing capital intensive, low-efficiency conventional models that are not well suited to the context in Ghana.In contrast, the informal sector performs 95 percent of waste plastics recovery yet receives little support or incentives to improve, clean-up, or expand operations.
Non-execution of Act 863. The inoperability of Act 863 (2013) is a matter of great contention amongst stakeholders (Authors’ inter-views). That the Plastic Waste Recycling Fund has not been actualized since the Act’s passage, resulting in several billion cedis of foregone revenue for remediation projects, remains a sore point for those involved in plastic waste collection and recycling, who feel entitled
46. MICZD = Ministry of Inner-Cities and Zongo Development

364. PlasTiC PolluTion
47. MoE = Ministry of Education; GES = Ghana Educational Service.
48. NCCE = National Commission for Civic Education
49. RCC = Regional Coordinating Council. As stipulated under the Local Government Act (Act 936), 2016, and National Development Planning (System) Act (Act 480), 1994, RCCs are to harmonize and lend technical support to District Planning Coordinating Units.
50. Cash-back schemes are particularly effective because they do not require every household/individual to participate, as do conventional “curb-side” or “at-source-separation” schemes.
51. MOPP = Ministry of Public Procurement; PPA = Public Procurement Authority.
to financial support for their activities and are among the stakehold-ers involved in plastics manufacturing who are often blamed for the state of plastic pollution and threatened with having their products banned if they do not resolve the situation. Manufacturers believe such resolution is outside of their function or responsibility.
Problems with the Directive on OXO-biodegradable plastics.
The directive requiring use of OXO additives in certain plastics is a potential cause for concern, as current science does not conclu-sively support claims made by their manufacturers. Questions about the efficacy of OXOs as a solution to plastic pollution and littering include: (1) lack of scientific data on biodegradation presently in use; (2) lack of evidence on the impact to shelf life of products packaged with OXOs (with possibility of risks of higher quantities of waste and revenue loss for retailers); (3) impact on marine life and seafood from increased microplastic formation and pollution; (4) inability to recover or recycle OXO plastics; and (5) not addressing the problem of littering, and possibly worsening it.
4.4 Recommendations to Improve Plastic Waste Management
4.4.1 Short-term (1-2 years)
● Operationalize the Plastic Waste Recycling Fund (Act 863) to collect revenues for plastic pollution remediation activities and support sustainable plastics enterprises (Parliament, MoF/GRA)
● Amend Act 863 compliance protocols to tax imported semi-finished and finished plastic products (correcting the imbal-ance between domestic manufacturers, importers) (Parliament, MoF/GRA)
● Communicate behavior change to plastics consumers: i) raise awareness of the impacts of improper waste management on health, society, economic productivity; ii) update national school curriculum, through the School Health Education Programme, to educate youth in sustainable plastics management; iii) under-take a national advocacy campaign to instill civic pride in manag-ing plastic waste; iv) distribute/install waste plastic collection receptacles (MESTI, MoE/GES47 , MSWR, NCCE48 )
● Clarify mandates/roles regarding enforcement of plastic waste regulations (MESTI, MSWR, MLGRD)
● Undertake a market analysis on the financial sustainability of selected recyclable products, determining break-even prices
for different scales of operations, to promote private sector-led initiatives in plastic reuse (MESTI, MoTI)
4.4.2 Medium-term (2-5 years)
● Establish a unitary, cross-sectoral body, such as a secretariat, to hold authority for making and implementing plastic management policies and that can be held accountable to and continuously engage with relevant MDAs, the private sector, academia, and civil society groups to harmonize plastic pollution control efforts into a cohesive, holistic, strategy and action plan (Cabinet))
● Dedicate budgetary resources—personnel, equipment, moti-vation—to agencies tasked with enforcement of anti-plastic pollution regulations (Cabinet, MoF)
● Improve capacity, coordination at subnational administrative levels: i) empower community, district, regional governments to manage plastic waste by leveraging indigenous knowledge and locally-appropriate technologies and service models; ii) join national and regional planning at economies of scale to provide localities with markets for recovered materials (MLGRD/MMDAs/RCCs49)
● Explore innovative models to mobilize sustainable financing: i) enact a plastics levy to generate additional funds for recycling; ii) embed progressive taxes into consumer products so that citizens pay in relation to consumption; iii) increase wholesale cost of purchase of plastic bags (MoF/GRA)
4.4.3 Long-term (5+ years)
● Incentivize plastic recycling by placing an economic value on the return of waste materials to a designated location, i.e. cash-back schemes50 (MESTI, MSWR)
● Create reverse logistics schemes that remunerate retailers for collecting waste plastics (as a complementary activity to their core business) (MESTI, MSWR)
● Legislate extended producer responsibility (EPR) for plastic waste: hold manufacturers legally accountable for effective management at the end of useful product life (i.e., once they have entered the waste stream) (Parliament)
● Integrate economic efficiency criteria into project design and public procurement awards, as measured in tonnages of material sustainably managed per cedi invested (MOPP/PPA51)

37
Box 4.2: Central Reforms to Stabilize the Waste Sector and Engage the Private Sector in Senegal
Senegal produces more than 2.4 million tons of waste per year. However, about 1.08 million tons remains uncollected. Of the waste that is collected, most is disposed of at a central dump that is one of the 10 largest dumpsites in the world. The country, which faces a rapid urbanization rate of 2.5 percent each year, has strongly focused on modernizing its waste management sector and developing the urban services needed by its burgeoning city population.
Although Senegal was interested in engaging the private sector to revitalize the waste management sector, it faced challenges typical of low- and middle-income countries related to transparency and difficulty in navigating the political system. Until 2015, waste management responsibilities were spread over several ministries, making coordination difficult. Furthermore, to invest in infrastructure and provide collection and disposal services, corporations require opportunities to recover costs. In Senegal, thelack of an established citizen payment system created financial gaps and led to payment delays that discouraged private entities.
Recognizing the pressing need to revitalize the waste sector, Senegal turned to internal reforms. The national government established a single public entity to streamline all waste management planning and services, called L’Unité de Coordination de la Gestion des Déchets Solides, or the Waste Coordination Unit, in 2015. This organizational structure was sustained even as regimes changed, and the government now has a mix of public and private service provision. The government structured a realistic relationship by devolving responsibilities to the private sector that are affordable to both the capital, Dakar, and the country at large. This structure is complemented by reliable and stable public entities that will follow through on contracts.
The waste management sector recovers 15 percent of operational costs, with the remaining 85 percent coming from the central government budget. Small, local private entities provide services from street cleaning to waste collection, and the government is responsible for residual activities. Waste is now collected daily in Dakar, streets are swept consistently, and most waste deposits have been cleaned up. The Waste Coordination Unit also began using media to communicate with citizens and optimized waste collection routes using web-based monitoring systems. They recruited young professionals to deploy modern technologies and implement progressive policies, ensuring long-term development of the sector.
The success of the new management structure has revived the interest of potential investors, including international donors. The rapid improvement in waste service delivery in Senegal was made possible through radical changes in governance and improvements in technical capacity centrally. While Senegal has so far improved waste services without a traditional public-private partnership, the structural transformation in governance has created a more stable, attractive waste management sector for investors and waste management companies.
Source: Case study reprinted from Kaza et al., 2018

384. PlasTiC PolluTion
Two young workers stand in the middle of the Agbogbloshie e-waste dumpsite, Agbogbloshie
Scrapyard, Accra. Steven J. Silverstein / World Bank

39
5

405. e-wasTe
5. E-wasteOver the past two decades increases in technological innovation, as well as in consumer demand and affordability, have led to rapid expansion in the range of electrical and electronic equipment (EEE). While this has been a net gain for human development, it has also resulted in a new and unprecedented global envi-ronmental challenge: the generation of electronic waste. Electronic waste, also known as “e-waste” or “waste electrical
5.1 Ghana’s E-Waste Dilemma
Figure 5.1: Ghanaians using Internet (ITU, 2018).
52. Technology use data comes from International Telecommunications Union (ITU) (database), https://www.itu.int/en/ITU-D/Statistics/Pages/stat/default.aspx.
0%
5%
10%
15%
20%
25%
30%
35%
40%
45%
2000 2001 2002 2003 2004 2005 2006 2007 2008 2009 2010 2011 2012 2013 2014 2015 2016 2017
Per
cen
tage
of
Gh
anai
ans
usi
ng
Inte
rnet
NKYINKYIM (“twisting”):
initiative, dynamism, versatility
and electronic equipment” (WEEE), refers to discarded devices that are at the end of their economic use and can no longer be used by consumers. Such waste includes computers and their accessories, consumer electronics, refrigerators and freezers, cellular phones, heavy machinery, engines, motors, batteries—including used
lead-acid batteries (ULABs)—televisions/VCRs/DVD players, radios and transmitters, speakers, microwave ovens, and other household appliances. The “Global E-waste Monitor” estimates that 44.7 million MT of e-waste was generated in 2016. The amount is expected to increase to 52.2 million MT by 2021, with an annual growth rate of 3-4 percent (Baldé et al., 2017).
The GoG launched the Information and Communication Technology for Accelerated Development Policy (ICT4AD) in 2004 to “bridge the digital divide.” To encourage trade in digital products, the Government reduced import duties on used computers and acces-sories to zero. These measures were successful in increasing access to technology, including computers and Internet. Cell phone use grew exponentially, and personal computers are now in one out every seven homes (Figures 5.1, 5.2)52.

41
Origin Metric tons/year (2009) Percentage
Consumers 96,000 56.1
Communal collection
5,000 2.9
Repairers/ refurbishers
48,000 28.1
Imports 22,000 12.9
Total 171,000 100
Table 5.1: WEEE origination (Amoyaw-Osei et al., 2011).The accumulating stocks of electronic and electrical goods meant to jumpstart Ghana’s information and communications technology (ICT) development and catalyzed by ICT4AD, had the unintended side effect of creating tons of discarded waste. The influx of EEE and outflux of WEEE has become a complicated challenge and significant environmental issue. Amoyaw-Osei et al. (2011) estimated the amount of e-waste generated at 171,000 MT/year (based on 2009 figures) (Table 5.1). Waste originates from two sources: domestic generation and imports. Over half of WEEE comes directly from Ghanaian consum-ers who sell to informal collectors plying neighborhoods in search of scrap. Another quarter comes from repair and refurbishment shops unable to fix used EEE and a small amount is claimed from communal dumpsites. Importation of completely unusable electronic equipment (i.e. WEEE), brought in under the guise of being reparable secondhand goods, has further increased quantities of e-waste. Estimates of WEEE in imported shipments vary significantly, from 10-20 to 70-80 percent (Amoyaw-Osei et al., 2011; Grant and Oteng-Ababio, 2012; Grant and Oteng-Ababio, 2016).
Some component parts in WEEE are rare or valuable and can be extracted for re-use. E-waste provides an alluring source of valuable metals for recovery—gold, silver, palladium, aluminum, copper—and hence a livelihood to many. However, inappropriate processing of e-waste can cause detrimental environmental and public health effects as toxic heavy metals such as arsenic, cadmium, copper, nickel, and mercury, and hazardous contaminants, such as dioxins and dioxin-like compounds are released (See Annex B). E-waste pro-cessing thus demands, but does not often receive, environmentally and technically sound extraction and disposal methods.
Treatment of e-waste is in three stages— dismantling, metal recov-ery, and disposal. Dismantling in Ghana is typically performed with manual implements such as hammers and chisels. Environmentally unsound disassembly pollutes the ground. For example, glass from cathode ray tubes, found in older computer monitors and televisions, contains large quantities of lead (a neurotoxin) that leach into the soil and groundwater. Grinding computer circuit boards to extract gold
releases lead, tin, and polybrominated diphenyl ethers (PBDEs)—persistent organic pollutants (POPs) that remain in the environment and can bioaccumulate in living organisms with deleterious health effects (Daum et al., 2017).
The second stage, metal recovery, is often the most noxious, espe-cially when burning of the e-waste is employed. Wire cables, encased in polyvinyl chloride (PVC) insulation, are incinerated to get the copper inside, creating atmospheric pollution. Burning plastics impregnated with flame retardants (e.g., PBDEs, triphenyl phosphate, and plasticiz-ers like phthalates), especially PVC, can lend to a wide array of nega-tive health effects, including to fetuses and young children. These chemical processes foster generation of fine particulate matter, PM2.5,
which causes complications in the respiratory and cardiovascular systems, and of dioxin-rich and dioxin-like compounds—polychlo-rinated dibenzo-p-dioxins and furans (PCDD/Fs), polybrominated dibenzo-p-furans (PBDFs), polychlorinated biphenyls (PCBs)—known carcinogens that cause endocrinological, immunological, and der-matological diseases and impair sexual, hormonal, emotional, and physical development (Fujimori et al., 2016). Scrap recyclers feed fires using polyurethane foam found in old refrigerators and vehi-cles, producing by-products of dense smoke and toxic gases such as chlorofluorocarbons.
Figure 5.2: Mobile-cellular telephone subscriptions in Ghana (ITU, 2018).
0
5
10
15
20
25
30
35
40
45
50
2000 2001 2002 2003 2004 2005 2006 2007 2008 2009 2010 2011 2012 2013 2014 2015 2016 2017 2018
Num
ber o
f sub
scrip
tions
Mill
ions

425. e-wasTe
The final stage of e-waste processing, disposal, involves dump-ing or burning non-valuable components to reduce volume. Non-salvageable items include monitors, keyboards, capacitors, and dry batteries, which contribute lead, cadmium, mercury, plastic, glass, and brominated flame retardants to the environment. Hazardous and non-hazardous waste is disposed of haphazardly in the open or at unmanaged or informal dumpsites. Some soils have accumulated moderate to high amounts of metal like iron, copper, and lead, with the latter two posing significant hazards to children and aquatic eco-systems (Akortia et al., 2017).
5.2 Economics of E-waste
As noted earlier, this CEA calculated the cost of exposure to lead and mercury, in part from areas contaminated by e-waste (in part from illegal mining, see Chapter 8: Illegal Artisanal Small-scale and Gold Mining), and specifically originating from used lead-acid bat-teries. The cost to Ghanaian society from disease and lost IQ points in children was estimated at US$440 million per year, equivalent to .75 percent of 2017 GDP.
The most widely accepted estimate places the contribution of e-waste recycling and associated activities to the Ghanaian economy at US$105-268 million (Prakash et al., 2010). This estimate is based on annual national e-waste treatment/processing figure of 10,000-13,000 MT, though Amoyaw-Osei et al. (2011) have suggested a figure more than ten times higher (155,100 MT). Though these vastly different estimates are a decade old, they are also the best currently available.
The informal economy, buttressed by an intricate hierarchy of actors in its supply chain, handles the majority of e-waste collection, pro-cessing, treatment, and trading. At the base of the pyramid are scrap collectors who roam and search for discarded equipment. Recyclers purchase the equipment to extract precious metals. Middlemen serve as intermediaries, purchasing the metals from recyclers and selling them to dealers. Scrap dealers are at the apex, supplying bulk metal to domestic and international refineries, aluminum re-smelters, steel plants, exporters, and others. There are also refurbishers and repair-ers who fix EEE to prolong its useful life; importers, both formal and informal; and retailers, who often sell used EEE (Daum et al., 2017; Grant and Oteng-Ababio, 2012). Estimates of the number of informal e-workers are 4,500-6,000 in Accra, and 6,300-9,000 nationwide. Refurbishing contributes about 10,000-15,000 jobs in Accra, and 14,000-24,000 nationally. An estimated 121,800-201,600 depen-dents53 rely on income generated from e-waste (Prakash et al., 2010).
From a socioeconomic perspective informal e-waste collection is a male-dominated sector. Women serve in auxiliary capacities, selling food and drink to workers; they may also act as scrap brokers in a
53. Prakash et al. (2010) assume an average of six people per household
few exceptional examples. Most workers are illiterate or lack formal education. Work is attractive not only because it is low-skilled: daily income is seven times the minimum wage and payment is regular and in cash (Amankwaa, 2013). Child labor is rife; one survey showed one-quarter of collectors were under the age of 15, with many choos-ing work over schooling (Grant and Oteng-Ababio, 2012). There is a significant amount of income inequality in the system—scrap dealers obtain a disproportionate share of revenues—and workers at the base are constrained from investing their income into productive purposes due to poverty and heightened health burdens.
5.3 Agbogbloshie: Ghana’s E-waste Epicenter
Agbogbloshie, a neighborhood in center-west Accra, is a giant scrap-yard and the hub of Ghana’s informal e-waste industry. Together with Old Fadama, its residential sister, it is home to about 80,000 residents (community census 2009) (Farouk and Owusu, 2012). Agbogbloshie’s e-workers are predominantly young men from northern Ghana who have fled economic dislocation and declining agricultural productivity (Box 5.1) (Amoyaw-Osei et al., 2011; Grant and Oteng-Ababio, 2012). Processing an estimated 40-60 percent of the country’s total WEEE, it is entrenched as the epicenter of e-waste recycling due to an evolved scrap salvage supply chain, proximity to the port of Tema and Accra’s Central Business District, and an ambiguous land tenure regime that permits the site to grow unabated (Grant and Oteng-Ababio, 2012). The Greater Accra Scrap Dealers Association (GASDA) has 4,000 estimated members, half of whom are involved in e-waste. On average, each recycler employs a team of three to four work-ers (CEHRT Environmental Consulting, 2015). Prakash and Manhart (2010) estimate that outside of scrap collecting “enterprises,” there were 200 associated small businesses operating at Agbogbloshie.
The hub is highly polluted, ranking among one of the world’s most toxic sites and raising critical environmental and public health con-cerns (Caravanos et al., 2013; Daum et al., 2017). In Agbogbloshie’s soils and sediments researchers have observed elevated levels of trace metals--including extremely high concentrations originating from combustion of plastic sheathing on metal wire--and dioxin-rich compounds, specifically PCDD/Fs and PBDD/Fs, likely originated in combustion of plastics containing PBDE (Otsuka et al., 2012; Tokumaru et al., 2017; Tue et al., 2016).
This pollution has dramatic effects on the health of Agbogbloshie’s e-waste workers. Testing of workers’ blood serum indicates sig-nificant levels of barium, cobalt, chromium, copper, iron, selenium and zinc, all of which are released during the burning of plastic-encased copper wires (Srigboh et al., 2016). Young male workers at Agbogbloshie showed PCDF concentrations in their blood four

43
Box 5.1: The “Burners” of Agbogbloshie
Abdulrahim, 23, is a married father of three. He and his family live within the confines of the Agbogbloshie e-waste scrapyard in Accra. On an average day, Abdulrahim wakes up, attends morning prayer, and is on his “burn site” by 7 a.m. He stays there burning plastic tubing off copper wiring and smelting metal scraps into balls of iron until 6 p.m., a practice he engages in six to seven days a week. Abdulrahim has been working at the scrapyard since 2007, earning himself the status of “boss man” due to seniority, which puts him in charge of 20 “burners.” Workers foraging for scrap metal come to Abdulrahim with tubes, pipes, circuit boards, and motor parts, asking him to smelt the remaining precious metal that can be salvaged.
Everyone who works at Agbogbloshie knows the flames are dangerous and the fumes are noxious. For protection Abdulrahim and his burners wear light clothing (heavier clothing tends to catch fire) makeshift masks, gloves, and boots bought secondhand. He says his best protection is to “stand behind the smoke.” There is a clinic near the worksite where burners can go when they get burned, get migraine headaches, or cough up blood from inhaling the toxic plumes. Abdulrahim and his crew generally avoid the clinic because they and their households can ill afford treatment costs.
Abdulrahim’s crew is comprised of northerners from areas near Tamale and Bolgatanga. Leaving home in search of work, they have settled in Agbogbloshie because other northerners before them had done the same. Abdulrahim takes home GHS50 (less than US$10) a day, his burners about GHS20 (less than US$4). On the same site, children as young as 12 scavenge for metal bits, trying desperately to earn enough money to pay the daily school feeding fee. Although Abdulrahim says burning is “honest work” he would take any other job presented to him. He hopes to return home one day and purchase land so that he can start a farm.
54. The elevated levels in women’s breast milk is very likely due to the physiological pathway in which the human body stores and excretes anthropogenic chemicals the body is unable to metabolize. Many chemicals are known to accumulate in the reproductive organs:
the testicles of men and the mammary glands of women. Because women secrete less frequently from mammary glands as the average man does from his testes, women often exhibit higher concentrations of many anthropogenic toxins.
times higher than Ghanaians living 25 km outside of Accra (Wittsiepe et al., 2015). Workers whose tasks included burning had very high levels of toxic metals and PAHs, much higher in fact than non-burning peers (Feldt et al., 2013; Srigboh et al., 2016). Ambient air samples at Agbogbloshie have shown aluminum, copper, iron, and zinc, as well as lead at levels four times above U.S. permissible exposure standards. Studies have confirmed atmospheric release of metals into adjoining communities (Caravanos et al., 2011; Caravanos et al., 2013).
In the vicinity of Agbogbloshie the population is directly exposed to contamination via air, water, and food pathways. Spatial analysis has shown heavy metal presence in soils around Agbogbloshie, with mer-cury the most prevalent toxic metal (Kyere et al., 2017). Hair samples of community members showed trace metal—copper, molybdenum, cadmium, antimony, lead—accumulation over time (Tokumaru et al., 2017). Sellers and buyers in the local markets, predominantly women and their infants or toddlers, inhale the fumes and dust wafting in from the burn sites. Contaminated soil can affect health, especially children’s, through ingestion. Women working close to the dumpsite showed toxicity levels higher than e-workers at the site for several elements (Srigboh et al., 2016). The breast milk of nursing mothers
living near Agbogbloshie contained elevated levels of PCBs, PBDEs, and hexabromocyclododecanes, a brominated flame retardant. Many mothers had purchased fish and meat from the market (Asante et al., 2011).54
Damage is not limited to the immediate area of Agbogbloshie. Toxic plumes affect neighborhoods within a 4 km radius (Amoyaw-Osei et al., 2011). Surface dust samples collected within a ½ km radius around Agbogbloshie revealed pervasive heavy metal contamination, which can carry PBDEs and other POPs (Petrlik et al., 2019). This dust has the potential to settle on fruits and vegetables in Agbogbloshie’s markets, which provision large swathes of Accra in tomato and onion. Eggs from chickens foraging in the waste have some of the highest levels of dioxins and brominated dioxins ever tested (Petrlik et al., 2019).
Agbogbloshie is situated on the Odaw River in the upper Korle Lagoon, the major catchment basin into which Accra’s floodwaters flow before meeting the Atlantic Ocean. It is thus a significant point source of pollution on the Gulf of Guinea (Karikari et al., 2006). E-waste pol-lution can alter the ability of wetlands to regulate flooding and filter pollutants from stormwater runoff. Rainfall, flooding, and atmospheric

445. e-wasTe
deposition migrates contaminated ash, soil, debris, dust, and oil into surface and groundwaters before discharging them into the ocean. River sediment samples confirm copper and cadmium contamination and high concentrations of PCBs (Chama et al., 2014; Hosoda et al., 2014). Cadmium and lead are extremely toxic contaminants that dam-age aquatic food chains, since the former inhibits aquatic plant growth and the latter stunts algae growth (Huang et al., 2014). Up until the 1960s, Korle Lagoon had supported commercial fisheries and related socioeconomic activities, but extreme pollution has turned it into a morass that can support neither, and the area’s aesthetic value has been destroyed (Karikari et al., 2006). Many aquatic species in the lagoon have disappeared and exposure to contaminants has and will continue to adversely affect the diversity, abundance, and biomass of aquatic organisms (Huang et al., 2014). Increased precipitation and flooding related to climate change means more hazardous e-waste will find its way into the river, lagoon, and sea, putting the population at greater risk of exposure to high concentrations of contaminants and compounding the negative effects of climate-related disasters.
The frontier for collecting e-waste has expanded beyond Agbogbloshie, with e-waste sites opening in Greater Accra, Koforidua, Kumasi, and Tamale. Accra hosts other e-waste scrapyards and smaller localized sites around the city, while the Greater Accra and Eastern Regions have significant e-waste sites. Kumasi in Ashanti Region has recycling clusters, one of which, Suame Magazine, may actually be larger than
Agbogbloshie (Atiemo et al., 2016). It is possible that opportunistic micro-entrepreneurs see the money in e-waste processing and have entered the industry as WEEE volumes have continued to grow.
5.4 E-waste Governance Framework and Analysis
The Hazardous and Electronic Waste Control and Management Act, 2016 (Act 917) and its associated regulations, L.I. 2250, are the main legal instruments that govern the control, management, and disposal of hazardous and electrical/electronic waste, as well as regulating EEE imports and domestic production and prohibiting WEEE imports. The Act also provides for the establishment of an Electrical and Electronic Waste Management Fund, the objectives of which are to finance modern e-waste recycling facilities, support research and publication of reports, and conduct education and awareness campaigns. Other legislative instruments have supported management and control of electronic waste over the years but, because most e-waste is processed in the informal economy and Government surveillance remains minimal, the regulations are largely not respected. The EPA is currently preparing guidelines for e-waste management and recy-cling, adapted from the Sustainable Recycling Industries initiative of the Swiss government. Until 2016, Ghana did not maintain a specific e-waste policy and legal framework for WEEE management, which created oversight challenges. A national e-waste policy is under development with a final draft forthcoming.
Electronic waste is burned at Agbogbloshie Scrapyard in Accra.
Steven J. Silverstein, World Bank

45
Institution Role in managing e-waste
MESTI Formulates policy, laws, and regulations related to promotion of information technology for the nation’s development. Tasked with ensuring that technologies are environmentally sustainable. Oversees EEE and WEEE management. The EPA is the regulatory arm of MESTI.
MLGRD Ensures good governance and balanced development of MMDAs. Guides policies on environmental sani-tation and rural/urban development. MMDAs are responsible for designating recycling sites for deposit of electronic waste, in accordance with recycling standards determined by the EPA.
Ministry of Employment and Labour Relations (MELR)
Provides leadership on matters of occupational safety and health. Under this Ministry, The Factories Inspectorate Department provides licensing and safety standards for the setting up and operation of recycling facilities.
Energy Commission Regulates and manages the development and utilization of energy resources. This role includes improv-ing energy efficiency of EEE entering the country, and scaling-up buy-back programs with major EEE importers/manufacturers.
Scrap Dealers Associations Represents civil society organizations for recyclers, serves as interlocutors between members and the Government, negotiates with e-waste workers to foster understanding of policy changes and assuage possible tensions.
Table 5.2: Imports by Section, 2009-2013 (Adapted from GSS, 2014).
The EPA, under MESTI, has the mandate to regulate and manage WEEE (also see Table 5.2). The Environmental Protection Agency Act, 1994 (Act 490) empowers the Agency to prescribe pollution and toxic substance standards and guidelines and to coordinate relevant bodies to control the generation, treatment, storage, transportation, and disposal of industrial waste. The Agency has the responsibility to issue environmental permits and pollution abatement notices for substances hazardous to the environment. The EPA’s main functions in WEEE management are to establish a framework for e-waste recycling operations, create health and safety standards for recycling sites, and enforce regulations through compliance monitoring. Its mandate extends to helping manage hazardous waste and overseeing clean-up and reclamation of contaminated sites.
The EPA also coordinates several inter-sectoral committees to control and manage e-waste:
● Hazardous Chemicals Committee, which monitors hazardous chemicals through data collection on import, export, manu-facture, distribution, sale, use, and disposal, and advises on regulation and management;
● Technical Committee on E-waste Management, which coor-dinates initiatives aimed at improving e-waste control and management;/
● Technical Committee on Waste Shipment Prevention, which drafts national guidelines on waste imports, builds capacity to meet the guidelines, coordinates programs to monitor and control waste imports, and raises awareness around WEEE import and dumping issues.
The GoG, bilateral aid agencies, and NGOs have started projects at e-waste sites, mainly Agbogbloshie, to increase awareness about the environmental and health hazards of unsound handling of e-waste (Table 5.3). Many activities remain fragmented, worker participa-tion is not compulsory, and limited access or long queues at the few improved facilities militates against their use, but coordination is starting to improve. Known active projects meet on a biannual basis to facilitate collaboration using a single stakeholder dialogue forum facilitated by the German Development Agency (GIZ). Still, one of the biggest impediments to tangible progress is the time that infrastructure and system changes require. The interventions underway will require years for successful implementation consider-ing bureaucratic obstacles.

465. e-wasTe
E-waste “burners”—workers who incinerate plastic covered wiring to obtain the copper metal inside—hold out stained hands, Agbogbloshie Scrapyard, Accra.Steven J. Silverstein / World Bank

47
Project title, location (duration)
Activity Development partners; Government partners
Sustainable Recycling Industries (SRI) - National (2011-)
Supports small- and medium-sized enterprises that would like to become part of a sustainable e-waste recycling chain in Ghana. This support includes developing alternative business models, transferring knowledge about recycling practices and technologies, and accessing markets for recycling outputs. In addition, the project addresses issues about standards and financing mechanisms to generate favorable conditions for sustainable recycling industries.
Swiss State Secretariat for Economic Affairs (SECO); MESTI/EPA
Environmentally Sound Disposal and Recycling of E-waste in Ghana - National (2016-2020)
Assists in improving the framework for sustainable e-waste manage-ment; kick-starts and promotes a sustainable e-waste recycling sector. Project activities include capacity development at the individual and organizational levels, including MESTI and EPA, and the private sector; support to set up an electronic register to record producers/distributors of EEE; technical and in-process advice to promote economically viable business models for recycling and disposal of e-waste; understanding technical solutions and their impacts through communication and network activities; training in environment and recycling/disposal methods that consider public health.
German Federal Ministry for Economic Cooperation and Development (BMZ), GIZ; MESTI/EPA, Accra Metropolitan Assembly
Recycling and Disposal of Waste of Electrical and Electronic Equipment in an Environmentally Sound Way (Phase One) - National (2018-2021)
Pilots and tests a financial mechanism to encourage and enable envi-ronmentally sound WEEE disposal. The pilot project will construct and operate a Handover Centre—working with GASDA--where scrap dealers can sell unprocessed e-waste above market prices. Materials will be aggregated and tendered/auctioned to recycling companies possessing EPA permits compliant with new national e-waste recycling guidelines at an incentivized price to support investment in the industry and accelerated compliance with new EPA standards. The pilot seeks to demonstrate lessons learned for implementation of the National E-waste Recycling Fund introduced in Act 917 (2016).
BMZ, German Development Bank (KfW), GIZ; MESTI/EPA
From Grave to Cradle: E-waste Management in Ghana (E-MAGIN Ghana) (2018-2021)
Contributes to the effective implementation of Act 917 and L.I. 2250 by fostering formalization of informal Micro, Small and Medium-sized Enterprises, establishing a collection mechanism for e-waste, dis-seminating best practices through capacity building and training of trainers, providing decision support and creating awareness among a wide range of stakeholder.
European Commission – SWITCH Africa Green Programme; MESTI/EPA
Integrated E-waste Management Program, Agbogbloshie (2018-2023)
Envisions a large e-waste recycling facility (40,000-150,000 MT/year treatment capacity) with funding from the advance eco levy of the Hazardous and Electronic Waste Control and Management Act.
Implemented by SGS – Debsther Klean Recycling
Table 5.3: Selected e-waste projects

485. e-wasTe
5.4.1 Gaps and Challenges
Non-adaptive policy and legal framework. The absence of a national strategy on e-waste pollution has been problematic. Environmental and health regulations have not been updated to respond to the modern challenges posed by e-waste. Ghana has no comprehensive occupational health and safety policy—a Draft Policy and Bill date back to 2000—and relevant workplace protection and safety Acts are outmoded, such as the Factories, Offices and Shops Act, 1970 (Act 328) (Amendment no. 275 of 1991). The Hazardous and Electronic Waste Control and Management Act requires EEE manufacturers, distributors, and wholesalers to take back WEEE found in shipments, which is difficult in practice as unscrupulous exporters of waste often provide misinformation to hide their tracks. Issues of longstanding debate, such as land tenure reform, amplify the crisis. Ambiguous land ownership arrangements at Agbogbloshie allow the status quo to prevail and for e-waste treatment to continue as the primary economic driver in the area. Whereas the GoG has planned for an ambitious Korle Lagoon Ecological Restoration Project to revitalize the wetlands, the unchecked growth of population and settlements at the waste site have been the primary social obstacle to implementation (Davis et al., 2019).
Monitoring and enforcement issues. E-waste recyclers have neither incentives nor concerns about punitive actions to properly dispose of hazardous fractions. They are not recognized for their services and are often neglected by local authorities, leading to health risks, child labor, unfair business practices, and marginalization. This perpetuates high levels of informality and enables improper e-waste disposal (Oteng-Ababio et al., 2014). Deceptive customs practices and lax enforcement of import regulations have allowed containers filled with WEEE, misleadingly labeled as EEE, to enter Ghana, including at the port of Tema. The porosity of Ghana’s borders, which allows shipments to pass undetected across poorly monitored and highly trafficked terrestrial routes such as the West African Coastal Highway, is a contributing factor. Direct imports of WEEE into Ghana are likely higher than official records indicate (Grant and Oteng-Ababio, 2012). The recently opened Ghana Single Window for trade is meant to shore up some of this laxity.
Infrastructure gaps. Hazardous components, or fractions, make up more than one-quarter of the waste generated, however, Ghana does not currently have the infrastructure for their proper manage-ment. Existent municipal landfills and sanitation infrastructure are not capable of properly securing hazardous e-waste. Disposal often occurs on unfortified, unlined grounds with no manmade barrier to prevent contaminants from entering soil or water. While several modern private sector companies perform source separation and are
Basel Convention export-compliant, most Ghanaians cannot afford to use their services. The use of crude extraction methods and lack of modern recycling machinery also means that many of the pre-cious metals are lost in the recovery process. Prakash et al. (2010) estimate a total valuable metal recovery rate from e-waste of 42 percent, mostly in common industrial metals, e.g. iron, aluminum, lead, copper. The remaining 58 percent is in plastic, glass, adhesives, non-precious metals, and hazardous fractions.
5.5 Recommendations for Sustainable E-waste Recycling
5.5.1 Short-term (1-2 years)
● Perform a detailed gap analysis of the policy, legal, regulatory and institutional frameworks around e-waste management, i.e. Act 917 (Hazardous Waste Act) and L.I. 2250, as well as Act 328 (Factories, Offices and Shops Act, 1970) on occupational health and safety (Parliament, MESTI)
● Increase regularity of e-waste regulation enforcement efforts (MESTI/EPA, MLGRD/MMDAs)
● Reframe the national discourse around e-waste to: avoid stig-matizing e-waste workers; highlight economic dynamism of recycling activities; change terminology, e.g. moving from a notion of “e-waste” to “urban mining” (Koehn, 2012; Oteng-Ababio et al., 2014) (Cabinet, MESTI
● Raise awareness among policymakers of socioeconomic, environmental consequences of e-waste to promote greater sensitivity to the human dimension and to encourage new legislation (Parliament)
● Take steps to safeguard welfare of the e-waste labor force,e.g. expanding training programs on mitigating e-waste risks (MESTI/EPA)
● Build capacity of customs officials to monitor ports of entry to prevent illicit WEEE shipments; enhance internal oversight and quality control within customs; coordinate with neighboring countries that share transport arteries (MoF/CEPS 55)
55. CEPS = Customs, Excise and Preventative Service, under the Ministry of Finance and Economic Planning.

49
● Designate informal dumpsites as formal recycling centers to permit closer inspection (MSWR)
● Ensure WEEE goes to approved sites, setting up collection points and incentivizing their use (Pwamang and Amoyaw-Osei, 2011) (MLGRD/MMDAs)
● Lay out the roles and expectations of MMDAs vis-à-vis e-waste and pass stringent, enforceable municipal by-laws (MLGRD/MMDAs)
● Collect accurate data on international and domestic e-waste flows to obtain a clearer sense of the scope of the problem and inform decision-making: i) conduct regular soil, air, water qual-ity sampling at and near e-waste sites; ii) survey consumers about their EEE turnover rates (possibly during 2020 census); improve data collection and inspections for WEEE at ports (MESTI/EPA, MoF/CEPS/GSS)
● Conduct value chain analysis to determine current and needed levels of human and physical capital for e-waste recycling within the segments of: collection, pre-treatment, mechanical shredding/granulation of cables, trade of steel/aluminum to refineries (MESTI)
● Explore carbon financing and other environmental funding sources (Global Environmental Facility, Green Climate Fund) to forge a sustainable e-recycling sector (MESTI, MoF)
● Create a mandatory registration and licensing scheme for recy-cling enterprises, inclusive of the informal sector, to facilitate oversight; provide incentives for informal actors to adhere, such as access to credit or knowledge and training (Pwamang and Amoyaw-Osei, 2011) (MESTI/EPA)
● Improve metal recovery rates through international partner-ships, technology transfer (MESTI, MoTI)
● Bolster infrastructure at municipal landfills for proper disposal of non-salvageable fractions (MSWR)
● Assist scrap dealers’ associations to better organize the sector to reduce negative environmental, occupational, and public health and safety effects, as well as income inequality; hold direct consultations with scrap dealers’ associations and their members to formulate national and local e-waste management strategies (MLGRD/MMDAs, MESTI, MSWR)
● Professionalize the e-waste sector through tripartite public-private partnerships between international or domestic recy-cling enterprises, the GoG, and the informal sector (President/GIPC 56)
● Legislate extended producer responsibility to organize WEEE buy-back purchases, as envisioned under Act 917, after stake-holder consultations with EEE manufacturers, distributors, retailers (MoTI, MESTI)
5.5.2 Medium-term (2-5 years) 5.5.3 Long-term (5+ years)
56. GIPC = Ghana Investment Promotion Centre in the Office of the President.

505. e-wasTe
Woman walking in forest, Boabeng-Fiema Sanctuary, Bono East
(formerly Brong Ahafo Region). Mint Image Ltd / Alamy Stock Photo

51
6

526. sTaTus of foresT resourCes
Ghana is endowed with diverse forest resources that cover 25 percent of its land and span three main zones: the High Forest Zone (HFZ), Transitional Zone (TZ) and Savannah Zone (SZ) (MLNR, 2017a). ). The HFZ falls within West Africa’s Upper Guinean biodi-versity hotspot and is a source of timber—top export species include African whitewood, known locally as wawa (Triplochiton scleroxylon), and ceiba (Ceiba pentandra)—and non-timber forest products (NTFPs), as well as major agricultural production,
6. Status of Forest Resources
including cocoa agroforests (MLNR, 2017b). Intact forests in the HFZ exist only within the 1.2 million ha of Forest Reserves and National Parks, a landscape traditionally at the center of the timber industry. The TZ, covering the middle belt of the country, has expanded since the 1980s due to gradual drying of the subregion, drought events (El Niño), and the onset of climate change (Owusu and Waylen, 2009). The fire-prone nature of the transitional forests has facilitated their conversion into plantations of timber (mainly teak (Tectonis spp.), gmelina (Gmelina arborea)), and tree crops (cashew). The SZ is mainly found in the northern part of Ghana, although there is also savannah along the eastern coastal plain. The north’s SZ hosts significant wild-life resources and has the largest national park in the country—Mole National Park. Savannah woodlands are increasingly a source of timber, as well as NTFP species like shea tree (Vitellaria paradoxa). High-value timber species, such as African rosewood (Pterocarpus erinaceus and members of genus Dalbergia), were the top export species in 2017 and have come under heavy pressure from illegal exploitation (MLNR, 2017b).
Although logging, cocoa farming, and mining have brought eco-nomic growth, they have come with significant costs to Ghana’s forest resources and ecosystem services. Forest loss leads to frag-mentation of biodiversity corridors, loss of soil fertility and non-timber forest products, and emission of GHGs. Deforestation is not a new
6.1 The Resource Base
Figure 6.1: Tree cover loss (Hansen/UMD/Google/USGS/NASA; World Database on Protected Areas (2000))
NYAME DUA (“tree of God”):
tree as symbol of worship and veneration
phenomenon in Ghana, but rather reflects a pattern that has persisted for over a century. In 1900, Ghana had over 8 million ha of tropical high forest, but from the 1950s to 2000, it lost 2.7 million hectares, over 60 percent, of its primary forests (FAO, 2010). Off-reserve forests have been almost entirely converted to agriculture, infrastructure, or human settlement and urban expansion, while many forest reserves and national parks have gone on to experience moderate to severe degradation, particularly in the 1980s and 1990s, a trend that con-tinues today (Hawthorn and Abu-Juam, 1995).
Based on analysis of data from 2001-2015, Ghana’s annual deforesta-tion rate was approximately 3.51 percent, equating to yearly losses of greater than 315,000 ha. Total deforestation during this time period
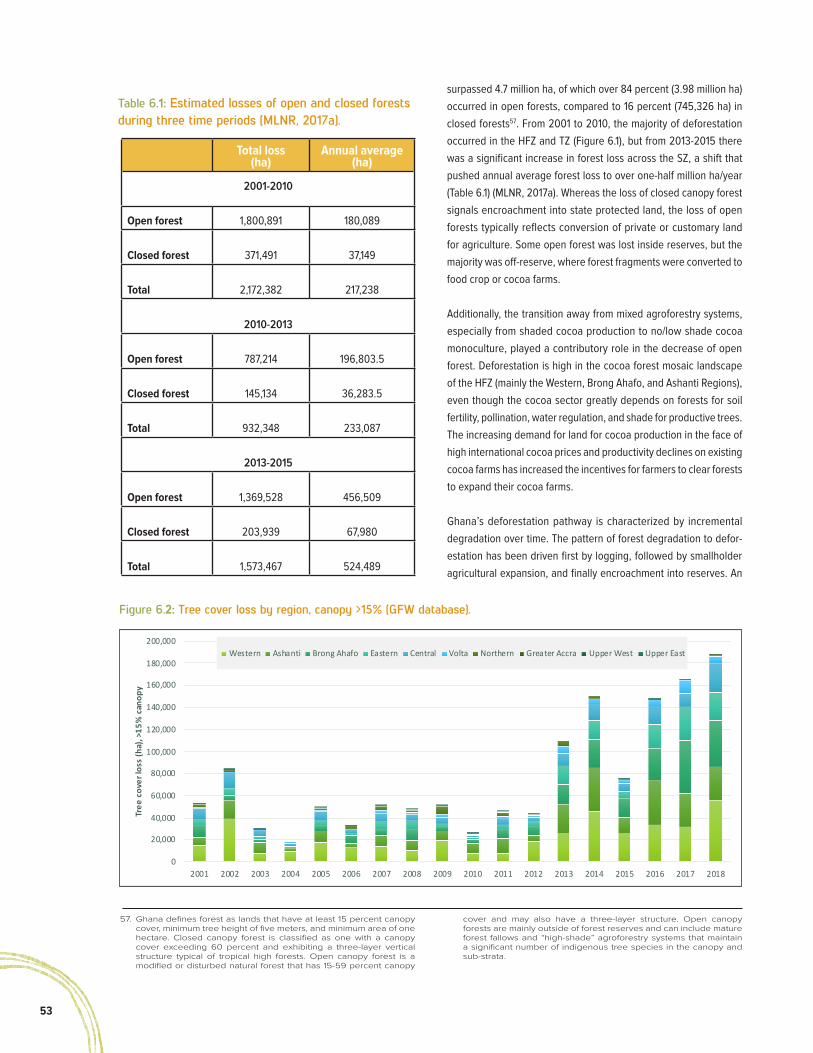
53
Figure 6.2: Tree cover loss by region, canopy >15% (GFW database).
Additionally, the transition away from mixed agroforestry systems, especially from shaded cocoa production to no/low shade cocoa monoculture, played a contributory role in the decrease of open forest. Deforestation is high in the cocoa forest mosaic landscape of the HFZ (mainly the Western, Brong Ahafo, and Ashanti Regions), even though the cocoa sector greatly depends on forests for soil fertility, pollination, water regulation, and shade for productive trees. The increasing demand for land for cocoa production in the face of high international cocoa prices and productivity declines on existing cocoa farms has increased the incentives for farmers to clear forests to expand their cocoa farms.
Ghana’s deforestation pathway is characterized by incremental degradation over time. The pattern of forest degradation to defor-estation has been driven first by logging, followed by smallholder agricultural expansion, and finally encroachment into reserves. An
57. Ghana defines forest as lands that have at least 15 percent canopy cover, minimum tree height of five meters, and minimum area of one hectare. Closed canopy forest is classified as one with a canopy cover exceeding 60 percent and exhibiting a three-layer vertical structure typical of tropical high forests. Open canopy forest is a modified or disturbed natural forest that has 15-59 percent canopy
cover and may also have a three-layer structure. Open canopy forests are mainly outside of forest reserves and can include mature forest fallows and “high-shade” agroforestry systems that maintain a significant number of indigenous tree species in the canopy and sub-strata.
surpassed 4.7 million ha, of which over 84 percent (3.98 million ha) occurred in open forests, compared to 16 percent (745,326 ha) in closed forests57. From 2001 to 2010, the majority of deforestation occurred in the HFZ and TZ (Figure 6.1), but from 2013-2015 there was a significant increase in forest loss across the SZ, a shift that pushed annual average forest loss to over one-half million ha/year (Table 6.1) (MLNR, 2017a). Whereas the loss of closed canopy forest signals encroachment into state protected land, the loss of open forests typically reflects conversion of private or customary land for agriculture. Some open forest was lost inside reserves, but the majority was off-reserve, where forest fragments were converted to food crop or cocoa farms.
Table 6.1: Estimated losses of open and closed forests during three time periods (MLNR, 2017a).
Total loss (ha)
Annual average (ha)
2001-2010
Open forest 1,800,891 180,089
Closed forest 371,491 37,149
Total 2,172,382 217,238
2010-2013
Open forest 787,214 196,803.5
Closed forest 145,134 36,283.5
Total 932,348 233,087
2013-2015
Open forest 1,369,528 456,509
Closed forest 203,939 67,980
Total 1,573,467 524,489
0
20,000
40,000
60,000
80,000
100,000
120,000
140,000
160,000
180,000
200,000
2001 2002 2003 2004 2005 2006 2007 2008 2009 2010 2011 2012 2013 2014 2015 2016 2017 2018
Tree
cov
er lo
ss (h
a), >
15%
can
opy
Western Ashanti Brong Ahafo Eastern Central Volta Northern Greater Accra Upper West Upper East

546. sTaTus of foresT resourCes
FAO (2015) assessment of the forest estate indicated 44 percent of forest reserves under active production, 20 percent in poor condition and designated for plantation development, 9 percent in poor condi-tion and in convalescence to promote natural regeneration, and 27 percent under recognized conservation or community management. In 2018 alone, Ghana lost nearly 190,000 ha; attendant effects have led to increased CO2 emissions/ha and increasing losses in biomass per ha, as well.
The Global Forest Watch (GFW) database—which uses a separate definition for deforestation from the one used by the FC—provides insights into tree cover loss58 at the subnational level (Figure 6.2). The top five Regions by absolute tree cover loss over the period 2001-2018 were: Western, Ashanti, Brong Ahafo, Eastern, and Central, all of which contain portions of the HFZ. However, when looked at through the prism of relative tree loss, Upper East Region lost one-quarter of its tree cover over the past two decades (though it started from the lowest tree cover extent of all the regions); Western and Central lost a significant proportion of their tree cover, as well (Table 6.2).
Forest degradation is a rampant problem, with illegal logging the main source of degradation, though legal timber harvesting, wildfires, and
wood fuel harvesting also play roles. Agricultural expansion is driven by food crop and tree crop expansion, while logging includes both legal and illegal activities. Fuelwood harvesting, charcoal production, wildfires, infrastructure development, and mining (legally and illegally for gold and minerals, and for sand) are also drivers (MLNR, 2016b). Table 6.3 provides a detailed description of the direct and indirect drivers of deforestation and degradation in Ghana.
Ghana is a net emitter of CO2 emissions, primarily from its oil and gas industry, but deforestation and forest degradation contribute. The average annual emissions in Ghana from deforestation and forest degradation from 2001-2015 was estimated at 61.2 million tCO2e yr-1 and average removals were 569,300 tCO2e/yr-1. Deforestation—defined by GoG as human-induced forest loss—was the largest con-tributor to emissions (Figure 6.3) On the basis of this information, Ghana’s national forest reference level (FRL) is 60.7 tCO2e yr-1. For deforestation alone, the annual average emissions over a 15-year period (2001-2015) were 40,295,807 tCO2e, with a significant increase between 2010 and 2015. Overall, emissions were high-est from the moist evergreen forests of the HFZ, accounting for 28 percent of the national total (MLNR, 2017a).
Tree Cover Loss (ha) Proportion of Region’s tree cover lost (%)
Western 402,179 17%
Ashanti 285,983 12%
Brong Ahafo 244,196 8%
Eastern 170,595 12%
Central 160,031 18%
Volta 56,719 5%
Northern 42,143 3%
Greater Accra 5,762 8%
Upper West 2,703 4%
Upper East 577 25%
58. According to the GFW website, “’Tree cover loss’ refers to the removal of trees, which may be within natural forests or tree plantations. Accordingly, “tree cover loss” does not necessarily
equate to “deforestation” and can result from a variety of factors, including mechanical harvesting, fire, disease, or storm damage.”
Table 6.2: Absolute and relative tree cover loss, by region (2001-2018) (GFW database).

55
Figure 6.3: Main activities causing forest sector emissions in Ghana (2001-2015) (MLNR, 2017a).
Table 6.3: Drivers of deforestation and degradation (MLNR, 2016b).
Direct Indirect
Agricultural expansion • Shifting cultivation using slash-and-burn • Cocoa expansion; loss of shade trees in cocoa systems • Other tree crops: rubber, cashew
Population growth and development • High population growth rate • Increasing demand for food crops, fuelwood, charcoal, and construc-
tion materials
Logging • Illegal logging by timber companies and chainsaw
operators
Markets • Increasing demand for high-value timber species • Growing global demand for chocolate and cocoa • Increasing global and regional demand for palm oil and other agricul-
tural commodities • Growing global, regional, national demand for timber and wood products
Fuelwood harvesting • Wood harvesting for charcoal production • Wood harvesting for firewood
Weak law enforcement • Weak institutional capacity • Lack of transparency
Wildfire • Land clearing for agriculture • Cattle ranching • Hunting
Land and tenure • Policies that create perverse incentives to remove on-farm trees • Absence of a comprehensive land-use plan
Mining • Wood harvesting for charcoal production • Wood harvesting for firewood
Low and overcapacity • Low stumpage prices in domestic market • Proliferation of chainsaws and small-scale mills
Infrastructure development • Urban and rural settlement expansion • Expansion of roads and other infrastructure
Low stumpage prices and overcapacity • Low stumpage prices in domestic market • Proliferation of chain sawing, small-scale mills
Deforestation, 66%Illegal Logging, 22%
Legal Logging, 5%
Fuelwood, 5%Fire, 1% Enhancements, 1%

566. sTaTus of foresT resourCes
BOX 6.1: Changing cocoa forest livelihoods in Papase community, Bia West District
Papase is a cocoa farming community located in the Bia West District of the Western Region. The name Papase comes from the “Papoa” tree (Afzelia africana) under which one of the original inhabitants, an old hunter, used to sit to enjoy the shade and roast his meat. The oldest members of the community recount that when they were children the way of life was good, and the area was a thick forest. “Life was very lovely. Houses were made with bamboo and raffia leaves, a lot of timber trees provided shade and habitat for wildlife and bush meat to be hunted, food was in abundance and you could hear birds chirping and the cry of animals. Above all, there was unity.” In those days, people engaged in farming, hunting, and fishing, but over the decades, the community leaders say that there has been a huge loss of the forest, wildlife, and soil fertility, and overall degradation of the land.
There is no longer any forest remaining in Papase, and disputes over land and water are increasing. They see all these issues as caused by an increasing population and increasing demand for resources, especially timber resources. As a result, their livelihood options have also changed and today most people in Papase make a living through cocoa farming, chain sawing, and small-scale mining. But they are worried because they notice an irregular rainfall pattern, longer dry seasons, and shorter wet seasons. Temperatures are also rising, and if the trend continues, they feel the area will eventually not support any agricultural activities, including cocoa.
As a result of the loss of forest resources, Papase is worried about the future. “The future is going to be so terrible” and the only solution they can see is for the government, civil society, and companies to step in and protect the forest resources and “establishome standards and policies that will safeguard their lives and community.”
Source: Authors’ interviews.
6.2 Economics of Ghana’s Forests
The cost of deforestation to Ghana is about US$400 million, equiv-alent to 0.7 percent of 2017 GDP. Ghana’s economic dependence on the forest sector exceeds that of its peers, as does its rate of unsustainable resource use. Net forest depletion59 as a percent of GNI tops the list of low-middle income (non-small island state) coun-tries, as does its contribution from forests to GDP (Figure 6.4). The economic costs of dependence rose to just under US$3 billion in the years 2014, 2016, and 2017, with unsustainable forest resource extraction being used as a motor for economic growth. And yet, the volume and value of timber exports remain substantially below levels recorded in the mid-1990s and early 2000s, when Ghana produced 1 million m³ and forestry was an important foreign exchange earner. It is now negligible compared to other major commodities such as gold, cocoa, and crude oil.
Recent years saw a modest increase in timber product export earnings. In 2012, timber exports were valued at US$131 million and rose steadily to a high of US$256 million in 2016 before dropping to US$215 mil-lion in 2017 (GSS, 2018). The main export destinations for Ghana’s
59. Net forest depletion is calculated as the product of unit resource rents and the excess of roundwood harvest over natural growth (World Bank WDI database) .
60. FLEGT is an EU-sponsored initiative that aims to curtail trade in illegally logged forest products by promoting sustainable forest management and improved forest governance. VPAs are bilateral trade agreements that commit timber exporting countries and the EU to trading only in legal, FLEGT-certified timber products.
timber products are Asia and the Far East, followed by Economic Community of West African States (ECOWAS) and the European Union (EU). The share of exports to Asia/Far East has increased sharply since 2012, overtaking both the EU and ECOWAS to become the leading export destination, responsible for 59 percent of total export volume (215,300 m³) and 57 percent of total export value (US$107.78 million) in 2015. ECOWAS/Africa markets follow with 68,000 m³, worth €27 million in 2015 (MLNR, 2016a). The decline in demand from Europe is linked to Ghana’s inability to meet the heightened transparency standards for timber certification under the Forest Law Enforcement, Governance and Trade/Voluntary Partnership Agreement (FLEGT/VPA)60 it has with the EU (Acquah et al., 2015).
The long-term decline of Ghana’s formal timber market has had an adverse effect on the timber industry. Historically, the forestry sector has provided formal employment for more than 100,000. According to the Ghana Timber Millers Organisation, 96 companies have collapsed since the early 2000s, representing 80 percent of the firms that once

57
operated, with a loss of 75,000 jobs. Those that have survived are operating at 50 percent capacity; they argue that they are threatened by a lack of raw materials, overregulation, and high cost of doing busi-ness (Ghanaweb, 2018).Domestic timber production comes mainly from informal or illegal sources—chainsaw millers—using inefficient and unsustainable practices. Hansen and Treue (2012) estimate that illegally logged timber in Ghana’s domestic market surpasses 4 million m3 per year. Sustainable sources of good-quality timber are needed for construction, housing, furniture, and panels to sustain Ghana’s growth and development, and even more wood is needed to meet demand for household energy needs.
The loss of forests in Ghana presents tremendous socioeconomic risks for the country. Forests provide critical ecosystem services that support agricultural production and water generation—water catchment, soil fertility, NTFP provision, etc.—and there is high depen-dence on forest resources and agriculture across the country for economic development and support for livelihoods. Sixty percent of the population, including 53 percent of women, are employed by the agriculture and forestry sectors. Fourteen percent of the population lives in forest-fringe communities and directly depends upon forests for one-third of their livelihood resources and income. Wood fuel accounts for 78 percent of Ghanaian households’ primary energy consumption. The Atewa Range Forest Reserve serves as a water tower for more than one million people in Accra, supplying industries, urban families, and rural communities and farms. The annual value of downstream water consumption from the two main river basins that have their source in the Atewa Range was more than US$28 million in 2016 (IUCN-NL, 2016). Forests serve as the main source of plant materials for the traditional medicine industry, valued at over US$30 million/year. Wildlife and biodiversity represent a large, untapped sector with significant revenue potential through development of an eco-tourism industry.
Figure 6.4: Net forest depletion among Ghana's peers (World Bank WDI database).
0%
2%
4%
6%
8%
10%
12%
2000 2001 2002 2003 2004 2005 2006 2007 2008 2009 2010 2011 2012 2013 2014 2015 2016 2017
% o
f GN
I
Ghana Kenya Mauritania Nicaragua Myanmar
Perhaps most important is the effect of cocoa on forest resources in Ghana. Ghana is the world’s second largest producer of cocoa beans, and the cocoa sector, valued at US$1.5 billion per year, is a major foreign exchange earner. Between 1991 and 2005, poverty rates among cocoa farmers declined from 60 to 24 percent, with Brong Ahafo and Western Regions showing the greatest achieve-ments in poverty reduction (World Bank, 2018). Cocoa-forest mosaics play an important role in climate change adaptation and mitigation strategies—as articulated by Ghana’s shift to climate-smart cocoa production—through micro-climate generation of rainfall, tempera-ture moderation, hosting of pollinators, enhancement of soil and air moisture, and carbon sequestration, among other services. To catalyze these gains, Ghana has decided to test performance-based payments through the signing of an Emission Reductions Purchase Agreement with the World Bank’s Forest Carbon Partnership Facility Carbon Fund. From 2018-2024, Ghana will be in a position to gener-ate US$50 million in emission reduction results-based payments. The long-term value of reducing (a conservatively estimated) 240 million tons of CO₂ emissions from deforestation and forest degrada-tion in the HFZ over a 20-year period is estimated at US$1.2 billion. Emerging signals that the sector’s revenue sources and funding are shifting from a timber-centric to a non-extractive model that values the standing forest are encouraging.
6.3 Forestry Sector Governance Framework and Analysis
Two national bodies have overlapping mandates over the forestry sector in Ghana: MLNR and FC. The MLNR is the ministerial body with supervisory responsibility for the management of Ghana's lands, forests, wildlife, and mineral resources. MLNR oversees a number of agencies and independent commissions, including the FC, which has the constitutional mandate to develop and manage the country’s for-est and wildlife resources. The FC maintains a large corporate struc-ture that is highly centralized in its decision-making and financing.
586. sTaTus of foresT resourCes
It is divided across multiple divisions or similar units, with offices spread across the country at district and regional levels. The core of the Commission is focused around three main divisions—Forest Services Division (FSD), Timber Industry Development Division (TIDD), and Wildlife Division (WD). FC last produced an Annual Report in 2015, which noted that it employs more than 3,800 staff members. Of those figures, women account for 18 percent of senior staff and 11 percent of junior staff.
Ghana updated its Forest and Wildlife Policy (FWP) in 2012. The policy aims to: (1) manage and enhance the ecological integrity of Ghana's forest resources, (2) promote the rehabilitation and restoration of degraded landscapes, (3) promote the development of viable for-est and wildlife-based industries and livelihoods, (4) promote and develop mechanisms for transparent governance, equity sharing, and citizen participation in forest and wildlife resource management, and (5) promote training, research, and technology development for sustainable forest management. The FWP aligns with other key inter-sectoral policies, including Ghana’s National Climate Change Policy (2012), the National Gender Policy (2015), and the Ghana Shared Growth and Development Agenda II (GSGDA). It is comprehensive and lays a strong foundation for sustainable forest and wildlife manage-ment, however, implementation often falls short. Timber still takes precedence over all other sub-sectors, and the gap between the policy’s objectives and sustainable outcomes is significant.
Ghana also has a Forest Plantation Strategy (2016-2040). The goal of the strategy is to achieve a sustainable supply of planted forest goods and services to deliver a range of benefits. In partnership with the private sector, it aims to establish 625,000 ha of forest plantations, conduct enrichment planting over 100,000 ha of degraded forest reserves, and promote on-farm tree planting (agroforestry) across 3.5 million ha. Plantation development has featured prominently in all sector programs and the government has been adding approximately 10,000-15,000 ha/year through internal and bilateral funds. Private sector uptake, however, has been limited due to the associated costs and off-reserve land tenure challenges, among other factors. There is also concern that an over-dependence on establishing on-reserve plantations will lead to a loss of natural forest areas, which could have otherwise regenerated and recovered if left to convalesce.
In 2016, Ghana developed a comprehensive national REDD+ strategy focused on a commodity-based, landscape-scale program to reduce deforestation. The Ghana REDD+ Strategy (GRS) outlines a broad plan to implement large-scale, sub-national emissions reduction (ER) programs that follow ecological boundaries and are defined by major commodities in each forest zone. Under the GRS, each land-scape program is to be supported by a set of over-arching, national
activities, policy reforms, benefit sharing, and monitoring systems, as well as strong private sector investment and collaboration. The most advanced ER program is the Ghana Cocoa Forest REDD+ Programme (GCFRP), which targets the HFZ and expansive cocoa production, and has strong support from the global chocolate industry. The Shea Savannah Woodland Project is under development, while the other ER programs outlined in GRS include the Coastal Mangroves, the Togo Plateau, and the Transitional Forest Landscape Program (MLNR, 2016b). A critical aspect of the strategy, and of all the articulated programs, is the need to foster much greater collaboration and coor-dinated actions across all stakeholders working in a landscape or sub-landscape. The long-term success of the strategy will depend upon concerted efforts and not siloed initiatives. A look at other current initiatives is presented in Table 6.4.
Economic rights to naturally occurring trees sit with the Ghanaian State. The Timber Resources Management Act 617 (2002) decrees that landowners and land users do not have the right to harvest naturally occurring trees for commercial or domestic purposes. The FC is entitled to issue permits or concessions to timber companies to harvest trees off-reserve, often damaging tree crops during felling. This has created a perverse incentive to the sustainable management of trees on farms, failing to acknowledge the role that farmers play in selecting and nurturing trees. Under Act 617, ownership rights are conferred to a person who plants a tree, but making such documenta-tion is a significant challenge. Despite movement towards a broader set of tree tenure reforms that would address naturally-occurring trees, the government has not been able to implement the needed policy or legislative reforms.
6.3.1 Gaps and Challenges
Fiscal revenues and budgetary problems. The GoG provides most funding for forestry activities though the forestry sector’s share of total government expenditures had been declining. Between 2007 and 2015 financing increased from 19 percent of total forest expendi-tures to 46 percent and was as high as 63 percent in 2014. Internally generated funds—stumpage fees, export levies, timber rights fees, and royalties—used to be the largest source of financing for the FC but these funds are no longer consistent and are plagued by significant fluctuations. In 2015, these funds, mainly from FSD and TIDD, accounted for less than half of the budget; at the same time FC overspent their budget by 27 percent.
Sectoral investment enabling environment. Although timber demand is likely to keep growing, investment in new production or plantations is low. The unattractive climate for private investment is partly due to the complexity of land tenure arrangements, the absence of land and tree tenure security for smallholders, and lim-ited financing options for long-term forest sector prospects, such as plantations. However, the Government is neither in a position to perform the role of the private sector nor to create entrepreneurial

59
61. Cocobod = Ghana Cocoa Board
62. NBSSI = National Board for Small Scale Industries
63. MoTAC = Ministry of Tourism, Arts and Culture
opportunities. At the local level, farmers and communities have little incentive to protect naturally regenerated trees on farms because of Ghana’s tree tenure and benefit-sharing system, which vests the management rights and economic revenues in the government and other high-level stakeholders, leaving smallholders with few incen-tives to care for existing trees or to plant new ones.
Lack of institutional transparency, accountability. The prevalence of political interference, personal interests, and intimidation are crip-pling Ghana’s forestry sector institutions. As a result, management decisions and enforcement of laws at all levels are frequently driven by interests and opportunities as opposed to ethically and techni-cally sound principles and laws. While the policies and strategies are focused on sustainable and equitable use and regeneration of the resources, the Government has struggled to follow through with effec-tive implementation. This is most glaring in the face of the galamsey crisis (See Chapter 8: Illegal Artisanal and Small-scale Gold Mining). Despite bans, inter-sectoral task forces, and the deployment of Rapid Response Units, the incidence of illegal mining (mainly for gold) and illegal logging (rosewood harvesting in the SZ and illegal logging in forest reserves in the HFZ) across the country is growing and the scale of destruction is highly worrisome. Without strong institutional and political will to implement transparent programs that hold offend-ers accountable, illegal resource extraction will continue unabated, causing severe damage to people and forests.
6.4 Recommendations for Sustainable Management of Ghana’s Forest Resources
6.4.1 Short-term (1-2 years)
● Improve coordination, communication, collaboration within divisions and units of the FC; strengthen relationships across relevant MDAs to reinforce the forestry sector (MLNR/FC, MoF, MoTI)
● Appoint institutional leaders who have technical apprecia-tion and deep knowledge of forest resources management (President, MLNR)
● Legislate tree tenure reforms that create incentives to maintain and protect trees (Parliament)
● Offer material and financial support to trade associations in the forestry sector so that they can work towards forging partner-ships with potential investors (MLNR/FC, MoTI)
● Promote a multi-country dialogue for West and Central African cocoa and commodity producing nations to catalyze wider action on the drivers of deforestation and land degradation (MLNR, MoFA)
● Scale-up extension services promoting adoption of agrofor-estry models, especially in timber, cocoa (MLNR/FC, MoFA/Cocobod61)
● Use evidence from the first national forest monitoring (compar-ing it against the reference level) to demonstrate that Ghana is stopping natural forest loss, or, in the case of natural forest loss, devise an action plan to take immediate, targeted steps to control the situation (MLNR/FC)
● Offer material and financial support to trade associations in the forestry sector so that they can work towards forging partner-ships with potential investors (MLNR/FC, MoTI)
● Promote a multi-country dialogue for West and Central African cocoa and commodity producing nations to catalyze wider action on the drivers of deforestation and land degradation (MLNR, MoFA)
6.4.2 Medium-term (2-5 years)
● Update the national FRL every two years (MLNR/FC)
● Harmonize/align monitoring and reporting methods on rates of deforestation, degradation, forest cover, emissions (MLNR/FC)
● Create an enabling environment for no-deforestation commod-ity supply-chains (MLNR, MoTI)
● Enable greater investment in NTFP value chains and strongly encourage value addition by actively seeking partnerships with large international private sector players (MoTI/NBSSI62)
● Harmonize policy enabling conditions to promote climate-smart cocoa production to boost smallholder incomes and cocoa sustainability (Cabinet, MLNR, MoFA/Cocobod)
● Strengthen and scale-up CREMAs/HIAs, especially with sustain-able financing strategies (MLNR)
● Expand wildlife tourism sites, experience, and infrastructure for middle-income clients (MoTAC63)
● Recommit to sustainable forest management practices across the forestry sector and for all export markets (MLNR/FC, MoTI64)

606. sTaTus of foresT resourCes
Table 6.4: Selected initiatives to reduce forest loss
Project title, location
(duration)Activity
Development part-ners; Government
partners
Ghana Forest Investment Program, HFZ, (GFIP) (2015-2023)
A US$50+ million program, GFIP has a strong climate mitigation component. The main activities are to: (1) improve forest and landscape management with communi-ties, (2) implement institutional reforms, policy strengthening, (3) enhance trees and agroforestry practices in cocoa forests (4) make on-reserve investments for REDD+ and plantations. Early remote sensing analysis has shown positive land-use changes.
World Bank; MLNR/FC
Ghana Cocoa Forest REDD+ Programme, HFZ, (GCFRP) (2019-2025)
Valued at more than US$230 million, with a potential US$50 million performance-based payments the GCFRP covers 5.9 million ha of the HFZ and is the world’s first commodity-based ER Program with the World Bank Forest Carbon Partnership Facility Carbon Fund. The GCFRP is supported by private investment through the Cocoa and Forests Initiative (see below). The GCFRP is being implemented in identified hotspot intervention areas (HIAs) through five main pillars of activities that require concerted actions by stakeholders: (1) institutional coordination and monitoring, (2) landscape level land-use planning, (3) climate-smart cocoa pro-duction, (4) risk management and finance, and (5) legislative and policy reforms.
World Bank; MLNR/FC, MoFA/Cocobod
Cocoa and Forests Initiative (CFI), cocoa areas, (2019-)
More than 30 cocoa and chocolate sector companies have committed to a no-deforestation supply chain from Ghana (and Côte d’Ivoire), in partnership with the GoG. Having signed a Framework for Action in 2017, individual companies are now taking concrete steps and making investments to end cocoa-related deforestation and support reforestation. The main actions are focused on forest protection and restoration, sustainable cocoa production and farmers’ livelihoods, and community engagement and social inclusion. The CFI aims to align with the Paris Climate Agreement and the GCFRP.64
World Cocoa Foundation, Dutch Sustainable Trade Initiative; MLNR/FC, MoFA/Cocobod
Form Ghana Reforestation Project, Ashanti Region (2017- )
The US$24 million loan to Form Ghana Ltd., a forest plantation management com-pany, aims to restore 11,700 ha of degraded forest reserves by establishing a large scale sustainable commercial forest plantation (composed of 10 percent indigenous tree species, 90 percent teak) in partnership with GoG. The project focuses on production of billets, poles, and round logs for local and export markets. Form Ghana is the first FSC-certified plantation company in West Africa, andis already producing Carbon Credits as per Verified Carbon Standard (VCS).
African Development Bank, Forest Investment Program; MLNR/FC
Community Resource Management Area (CREMA), nationwide
The CREMA mechanism is Ghana’s natural resource management and landscape-level planning tool for community initiatives. It was developed by the FC’s Wildlife Division under the 1994 FWP to enable community-based natural resource manage-ment in off-reserve lands. CREMAs fill a critical policy gap by giving communities the right to govern, manage, and benefit economically from their natural resources (Kasanga, 2003; Sarpong, 2006). There are at least 30 CREMAs across Ghana, with an estimated 500,000+ ha under management. CREMA use is growing, and its scope has evolved over the past two decades from a wildlife management tool to a mechanism that supports eco-tourism, NTFP value chains, climate-smart cocoa production, and REDD+, among other revenue generating activities. CREMA has most recently been adapted to serve as the foundation of the GCFRP HIA model for landscape-level governance.
MLNR/FC (Wildlife Division)
64. Information comes from the World Cocoa Foundation, http://www.worldcocoafoundation.org/initiative/cocoa-forests-initiative/

61
65. MoTAC = Ministry of Tourism, Arts and Culture
Lumber yard factory. Curt Carnemark / World Bank
● Bring tree registration to farmers’ doorsteps through a national registration campaign (MLNR/FC)
● Pioneer REDD+ forest reserves to capture climate finance; increase incentives for sustainable forest, land, and cocoa management practices and private sector engagement; step up efforts to access and utilize climate finance for emissions reductions (MLNR, MoFA/Cocobod)
6.4.3 Long-term (5+ years)
● Improve forest investment climate for foreign/domestic invest-ment in forests, plantations; promote extension of commercial credit lines to prospective timber plantation owners (MLNR/FC, MoF)
● Bring local officials, traditional authorities, and agriculture and mining actors together in a participatory land use planning process to better balance competing uses of land and forests (MESTI/LUSPA, MLGRD/RCC/MMDAs, MLNR/FC/LC, MOCRA65 )
● Address illegalities and lack of transparency within the sector (President, MLNR/FC)
● Explore how to generate sustainable revenue from payment for forest ecosystem services (MLNR/FC)
● Prioritize research and development of new or under-devel-oped forest resource value chains, such as rare indigenous timber tree species (MLNR/FC, MoTI/NBSSI)

626. sTaTus of foresT resourCes
A fire in northern Ghana. Nicolas Marino / Alamy Stock Photo

63
7

647. land degradaTion
7. Land Degradation7.1 Land Health in Ghana
Box 7.1: Definition of Land Degradation
Land degradation is defined as “reduction or loss, in arid, semi-arid and dry sub-humid areas, of the biological or economic produc-tivity and complexity of rainfed cropland, irrigated cropland, or range, pasture, forest and woodlands resulting from land uses or from a process or combination of processes, including processes arising from human activities and habitation patterns, such as: (i) soil erosion caused by wind and/or water; (ii) deterioration of the physical, chemical and biological or economic properties of soil; and (iii) long-term loss of natural vegetation”
Source: UNCCD, 2012
BESE SAKA (“sack of cola nuts”):
affluence, abundance;
agriculture as unifier
Land degradation affects Ghana’s crop and pasture lands, forests, natural habitats, urban areas, and water bodies. It is a complex process caused by a combination of biophysical and anthropogenic drivers, occurring mainly in dry-lands and on the margins of tropi-cal forests where soils have lost their ability to provide ecosystem services. These services include nutrient cycling, water filtration,
waste absorption, and the breakdown of vegetative cover and soil formation. The four major types of land degradation in Ghana include soil erosion, declining soil fertility, deterioration of rangelands, and deforestation (MEST, 2011). These forces increase barren lands and lower resilience to climate change (MES, 2002). They also constrain socioeconomic development—reducing the availability or access to water, food, and energy and contributing to resource-based conflict—and jeopardize successful achievement of development goals, like UN Sustainable Development Goal (SDG) 15: Life on Land.
Nationally, the problem is one of gradual degradation with no single dominant driver. Proximate causes of land degradation are a complex mosaic of demographic, economic, and policy influences: high popu-lation growth; land tenure issues; increasing local demand for agricul-tural and wood products; limited technology use in farming systems (and persistent reliance on rainfed and slash and burn agriculture); dependence on fuelwood and charcoal for household energy in rural and urban settings; and lack of enforcement of relevant regulations, among others. The drivers of land degradation are varied (Table 7.1) and closely associated with ecological zone and agricultural produc-tion system. Unsustainable agricultural practices are the leading drivers, out of which progressive reduction of fallow periods prob-ably ranks foremost, accompanied by overgrazing, overharvesting of fuelwood, and uncontrolled bush fires.
Land degradation has increased over the past two decades in Ghana. Two measures of vegetation health—the normalized difference veg-etation index (NDVI) and net primary productivity (NPP)—confirm this. An analysis of annual mean vegetation density—defined as the number of plants per unit area—shows that Ghana’s vegetation health has been decreasing since 2000. Net Primary Productivity (NPP66) , an indicator of vegetation health, has exhibited a downward trend
66. MoCRA = Ministry of Chieftancy and Religious Affairs

65
Process Type
Driver
Anthropogenic
BiophysicalAgro-silvo-pastoral practices
Unsustainable, unregulated,
illegal use of common areas
Physical Erosion (water, wind) Improper soil management Lack of urban planning Naturally occurringvulnerabilities due to:
• Soil
composition
• Topography
• Climate
conditions
Galamsey mining Compaction
Crusting Reduced fallow periods Sand and gravel winning
Hardpan formation
Chemical Nutrient depletion (removal of NPK resulting in decline in soil fertility)
Slash-and-burn agriculture Bushfire setting
Limited use of fertilizers andamendments use
Limited use of irrigation
Biological Loss of organic matter(vegetation, biomass,biodiversity)
Agricultural horizon expansion Unsustainable fuelwood /charcoal production
Improper soil management Illegal logging
Deforestation / forestdegradation
Livestock overgrazing Unsustainable forestmanagement
Deterioration of rangelands
Improper annual, perennial, tree crop care (e.g. use of no-shade)
Table 7.1: Drivers and factors behind land degradation (MES, 2002; MESTI, 2017a; MESTI, 2017b).
in every region except for Greater Accra (which is mostly urban) and Western (which is heavily forested). Declining NPP, considered a proxy indicator for land degradation, shows land degradation is intensify-ing in the north and middle of the country (particularly Upper West, Northern, Upper East, Brong Ahafo, and Ashanti regions) (Barbier et al., 2016).
Nearly 70 percent of Ghana is estimated to be subject to “severe to very severe” erosion (Table 7.2) (Asiamah, 1987). Soil erosion rates are high in the Upper West, Northern, Brong Ahafo, and Upper East Regions where NPP has been on a strong downward trend for the past two decades (2000-2016). Soil erosion from wind or water stems from inappropriate agriculture, forestry, and infrastructure practices. In areas with more degraded lands surface runoff, and hence soil erosion, is widespread and concentrated. Erosion is the greatest threat to Ghana’s drylands in the Guinea and Sudan savannah zones in the North, where land degradation is qualified as “desertification.”
The Ministry of Environment and Science (2002) estimated that 35 percent of Ghana was prone to desertification with the overwhelming area of vulnerability located in the Upper East Region and eastern part of the Northern Region. The soil erosion map (Figure 7.1) illustrates soil erosion geographically across the country with darker areas suffering the worst effects. Apart from the northern regions, there are significant levels of soil erosion in the upper Volta Region and Brong Ahafo, as well as in Accra, where insufficient urban planning has compromised the soil structure.
The agriculture sector, which contributes about 18 percent of GDP and 36 percent of formal employment, is the primary driver of land degradation in Ghana. (World Bank, 2018b; GSS, 2017). Agricultural land—land under annual crops, perennial crops, and permanent pas-ture for livestock—is about 70 percent of total land area, up by about one-third since 198067 . To keep up with rural population growth—27 percent since 1995—and increasing demand from urban consumers,
67. Net primary productivity shows net uptake of carbon--how much carbon dioxide plants take in during photosynthesis minus how much they release through respiration. A negative value signals more carbon being released into the air, due in part to decomposition.

667. land degradaTion
Figure 7.2: Growth of staple crops, 2008-2014 (Adapted from World Bank, 2018b).
3.64%
12.96%
-3.66%
6.50%
6.66%
3.35%
9.38%
-3.19%
0.98%
12.13%
0.84%
2.96%
-1.28%
5.56%
2.78%
M a i ze Ri ce S or g hum Ca ssa v a Yam
Crop production Area cultivated Yield (MT/ha)
68. Data comes from World Bank WDI (database), https://data.worldbank.org/indicator/AG.LND.AGRI.ZS?locations=GHData comes from World Bank WDI (database), https://data.worldbank.org/indicator/AG.LND.AGRI.ZS?locations=GH
69. Data comes from World Bank WDI (database), https://data.worldbank.org/indicator/AG.CON.FERT.ZS?locations=GH.
70. Sheet erosion is washing away of soil due to surface runoff. Gully erosion is when runoff carries away soil and forms channels of significant depth.
Figure 7.1: Soil erosion (RUSLE model) (World Bank Hidden Dimensions Dataset).
Type of erosion Land Area (km2) Proportion of Land Area
Slight/moderate sheet erosion70
70,441 31%
Severe sheet and gully erosion
103,248 45%
Very severe sheet and gully erosion
54,712 24%
Table 7.2: Erosion vulnerability in Ghana (Asiamah, 1987).agricultural production has increased by more than one-half (57 per-cent), in large part through expansion of arable land. But arable land per capita has shrunk by one-fifth since 2000, from 0.205 ha/person to 0.165 (2016 figures)68. With decreasing levels of arable land per capita, Ghana has less room for agricultural expansion other than by intensification.
The marked increase in agriculture has fostered changes in land use across all regions of the country. This has led to two major negative trends in land use and productivity: (1) transformation of forests to croplands and shrubs, grasslands, sparsely vegetated areas (i.e., for-est degradation and deforestation); and (2) a decline in productivity (MESTI, 2017b). Conversion of natural habitats to agricultural use homogenizes the diverse mosaic of vegetation types—savannah, woodlands, gallery forests, and wetlands—and turns them into crop-dominated landscapes. Land degradation is especially pronounced in the Northern Region, where the share of forest conversion is the highest in Ghana. In this region, conversion of forest lands to shrubs, grasslands, and sparse vegetation is estimated at about 75 percent (MESTI, 2017b). Shoyama et al. (2018) discuss how the northern savan-nah has been a significant victim to this change. A 5,600 km2 sample of the Northern Region between 1984-2015 showed cropland steadily increasing by 150 percent while grassland and closed woodland declined 90 and 73 percent, respectively. Due to this phenomenon
the northern savannah and the transitional zone in the country’s middle have become fragmented and unsustainable.
At the same time, Ghana’s agricultural growth is slowing. Annual growth rates are on average below those of industry and services. The sector remains plagued by low yields, with Ghana behind many of its West African peers. Data from the last decade indicate that while total output has increased, productivity growth has lagged, suggesting agricultural growth is driven by expansion of the agricul-tural horizon into uncultivated areas—typically natural forests—rather than by increasing output through higher yields (Figure 7.2 and Box 7.2) (World Bank, 2018b). Ghana’s use of irrigation was a mere 0.23 percent of all agricultural land equipped for it. Nutrient depletion—removing the nutrients nitrogen (N), phosphorous (P), and potassium (K) from the soil without replacing them—is prevalent across all of Ghana’s agro-ecological zones. Such overexploitation is caused by farmers with little access to fertilizers who are forced to bring less fertile soils on marginal lands into production. Ghana has a negative soil nutrient balance the amount of NPK added is significantly less than the amount removed at harvest or lost by erosion and leaching. Fertilizer consumption in Ghana is just under 21 kg/ha, which is six times less than lower-middle income country peers (Figure 7.3)69.

67
Figure 7.3: Fertilizer consumption, Ghana vs. structural peers (World Bank WDI database).
Box 7.2: Specifics of staple crop production in Ghana
As reported in a yield gap study, staple crop production in Ghana is predominantly with smallholders, with about 90 percent of farmers cultivating less than one hectare. It is characterized by traditional methods of farming using hoes and cutlasses. There is little mechanization except in the forest/savannah transitional zone and the Guinea Savannah zone, where tractors are used for land preparation. Land preparation using bullocks is also practiced in the Sudan savannah zone. Cereal crops (mainly maize, sorghum, and millet) are produced in annual single-crop systems in the lower rainfall areas in the three northern regions. Maize is produced in annual single-crop systems in the higher rainfall area in the southern forest zone and in annual double-crop systems in the forest/savannah transitional zone. Typical double-crop systems in this zone include maize-maize, maize-cowpea and groundnut-maize. In the three northern regions, sorghum and millet are often intercropped with cowpea and/or maize and in the southern forest zone maize is often intercropped with one or more other crops such as cassava, cocoyam, and plantain.
Source: http://www.yieldgap.org/ghana
71. Data from World Bank Poverty and Equity Data Portal, http://povertydata.worldbank.org/poverty/country/GHA
7.2 Economics of Land Degradation
The cost of soil erosion is estimated at about US$0.54 billion, or 0.9 percent of the country’s GDP. Land degradation harms Ghana’s most vulnerable population, the rural poor, entrenching extreme poverty even more deeply. The 32 districts with increasing poverty rates are those more likely to have a negative NPP trend, while districts with reduced poverty rates tend to see positive changes in NPP. In 2012, there were 6.2 million people living below the national pov-erty line in Ghana71. Although the percent poverty headcount ratio for the entire country is 24 percent, it is 40 percent in districts with degraded land—those with negative or no change in NPP. Districts that have seen little or no poverty reduction tend to see more intense land degradation, and NPP change is more negative in places with a stagnant or increased poverty rate.
0
10
20
30
40
50
60
70
2007 2008 2009 2010 2011 2012 2013 2014 2015 2016
kg/h
a arab
le lan
d
Cameroon
Kyrgyz Republic
Cote d'Ivoire
Kenya
Myanmar
Nicaragua
Ghana
Other factors such as internal migration and illegal galamsey gold mining have contributed to and amplified land degradation. Migrants seeking to escape land degradation at home may also be fueling land degradation in their new destinations. The population has decreased in degraded rural areas and moved to urban areas, primarily in the Greater Accra (Accra, Teshie, Tema), Northern (Tamale) and Ashanti (Kumasi, Obuasi) regions. Population growth and rapid urbanization correlate with increased land degradation, which tends to be greater in districts where population growth is strongest (Figure 7.4). Not surprisingly, the Greater Accra Region, which experiences the great-est influx of migrants, has the highest soil erosion rate in the country at 15.6 tons/ha/year. Illegal gold mining has also been a significant
contributor to land degradation. Water courses are particularly vulner-able because land disturbances increase the likelihood of erosion and sediment loading in streams (Rajaee et al., 2015).
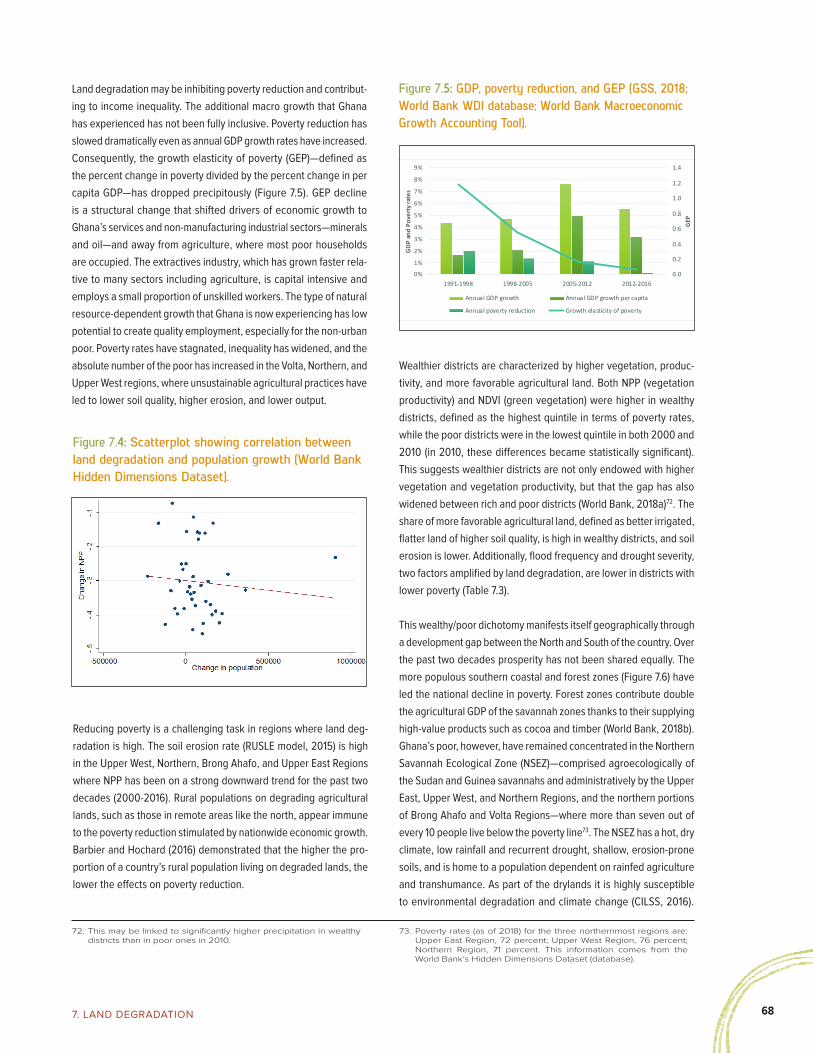
687. land degradaTion
Land degradation may be inhibiting poverty reduction and contribut-ing to income inequality. The additional macro growth that Ghana has experienced has not been fully inclusive. Poverty reduction has slowed dramatically even as annual GDP growth rates have increased. Consequently, the growth elasticity of poverty (GEP)—defined as the percent change in poverty divided by the percent change in per capita GDP—has dropped precipitously (Figure 7.5). GEP decline is a structural change that shifted drivers of economic growth to Ghana’s services and non-manufacturing industrial sectors—minerals and oil—and away from agriculture, where most poor households are occupied. The extractives industry, which has grown faster rela-tive to many sectors including agriculture, is capital intensive and employs a small proportion of unskilled workers. The type of natural resource-dependent growth that Ghana is now experiencing has low potential to create quality employment, especially for the non-urban poor. Poverty rates have stagnated, inequality has widened, and the absolute number of the poor has increased in the Volta, Northern, and Upper West regions, where unsustainable agricultural practices have led to lower soil quality, higher erosion, and lower output.
Reducing poverty is a challenging task in regions where land deg-radation is high. The soil erosion rate (RUSLE model, 2015) is high in the Upper West, Northern, Brong Ahafo, and Upper East Regions where NPP has been on a strong downward trend for the past two decades (2000-2016). Rural populations on degrading agricultural lands, such as those in remote areas like the north, appear immune to the poverty reduction stimulated by nationwide economic growth. Barbier and Hochard (2016) demonstrated that the higher the pro-portion of a country’s rural population living on degraded lands, the lower the effects on poverty reduction.
Wealthier districts are characterized by higher vegetation, produc-tivity, and more favorable agricultural land. Both NPP (vegetation productivity) and NDVI (green vegetation) were higher in wealthy districts, defined as the highest quintile in terms of poverty rates, while the poor districts were in the lowest quintile in both 2000 and 2010 (in 2010, these differences became statistically significant). This suggests wealthier districts are not only endowed with higher vegetation and vegetation productivity, but that the gap has also widened between rich and poor districts (World Bank, 2018a)72. The share of more favorable agricultural land, defined as better irrigated, flatter land of higher soil quality, is high in wealthy districts, and soil erosion is lower. Additionally, flood frequency and drought severity, two factors amplified by land degradation, are lower in districts with lower poverty (Table 7.3).
This wealthy/poor dichotomy manifests itself geographically through a development gap between the North and South of the country. Over the past two decades prosperity has not been shared equally. The more populous southern coastal and forest zones (Figure 7.6) have led the national decline in poverty. Forest zones contribute double the agricultural GDP of the savannah zones thanks to their supplying high-value products such as cocoa and timber (World Bank, 2018b). Ghana’s poor, however, have remained concentrated in the Northern Savannah Ecological Zone (NSEZ)—comprised agroecologically of the Sudan and Guinea savannahs and administratively by the Upper East, Upper West, and Northern Regions, and the northern portions of Brong Ahafo and Volta Regions—where more than seven out of every 10 people live below the poverty line73. The NSEZ has a hot, dry climate, low rainfall and recurrent drought, shallow, erosion-prone soils, and is home to a population dependent on rainfed agriculture and transhumance. As part of the drylands it is highly susceptible to environmental degradation and climate change (CILSS, 2016).
Figure 7.4: Scatterplot showing correlation between land degradation and population growth (World Bank Hidden Dimensions Dataset).
Figure 7.5: GDP, poverty reduction, and GEP (GSS, 2018; World Bank WDI database; World Bank Macroeconomic Growth Accounting Tool).
72. This may be linked to significantly higher precipitation in wealthy districts than in poor ones in 2010.
73. Poverty rates (as of 2018) for the three northernmost regions are: Upper East Region, 72 percent; Upper West Region, 76 percent; Northern Region, 71 percent. This information comes from the World Bank’s Hidden Dimensions Dataset (database).
0.0
0.2
0.4
0.6
0.8
1.0
1.2
1.4
0%
1%
2%
3%
4%
5%
6%
7%
8%
9%
1991-1998 1998-2005 2005-2012 2012-2016
GEP
GD
P an
d Po
vert
y ra
tes
Annual GDP growth Annual GDP growth per capita
Annual poverty reduction Growth elasticity of poverty
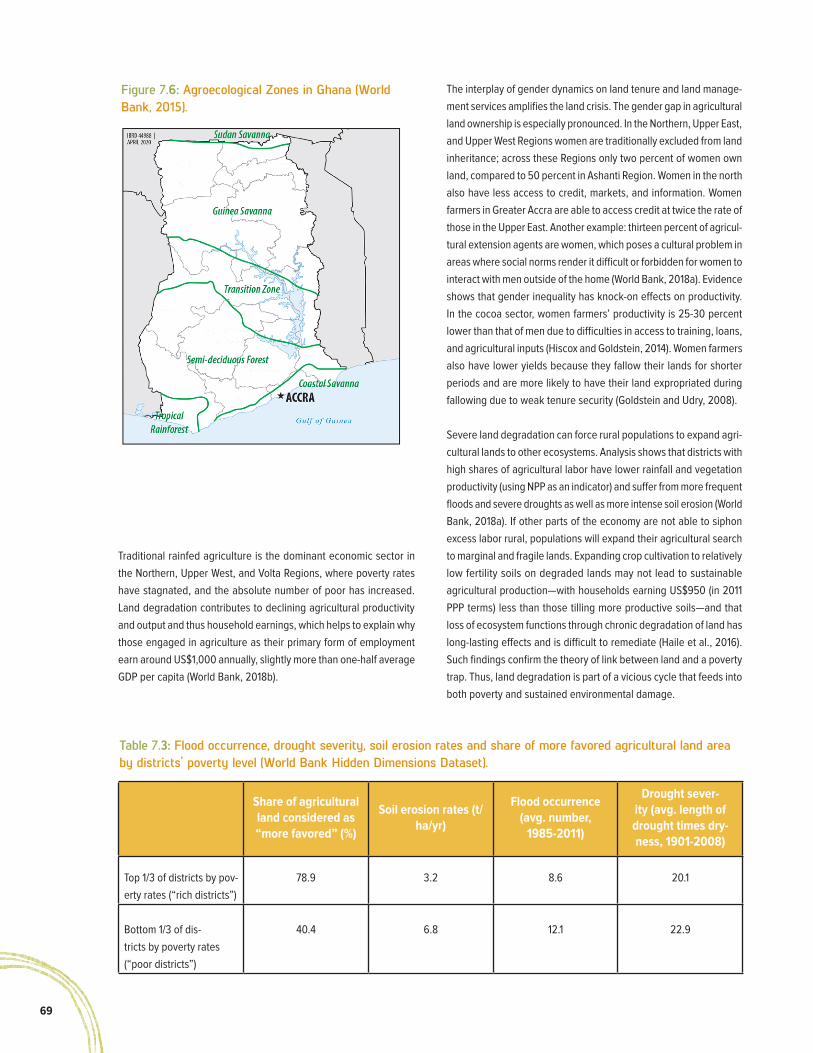
69
Figure 7.6: Agroecological Zones in Ghana (World Bank, 2015).
The interplay of gender dynamics on land tenure and land manage-ment services amplifies the land crisis. The gender gap in agricultural land ownership is especially pronounced. In the Northern, Upper East, and Upper West Regions women are traditionally excluded from land inheritance; across these Regions only two percent of women own land, compared to 50 percent in Ashanti Region. Women in the north also have less access to credit, markets, and information. Women farmers in Greater Accra are able to access credit at twice the rate of those in the Upper East. Another example: thirteen percent of agricul-tural extension agents are women, which poses a cultural problem in areas where social norms render it difficult or forbidden for women to interact with men outside of the home (World Bank, 2018a). Evidence shows that gender inequality has knock-on effects on productivity. In the cocoa sector, women farmers’ productivity is 25-30 percent lower than that of men due to difficulties in access to training, loans, and agricultural inputs (Hiscox and Goldstein, 2014). Women farmers also have lower yields because they fallow their lands for shorter periods and are more likely to have their land expropriated during fallowing due to weak tenure security (Goldstein and Udry, 2008).
Severe land degradation can force rural populations to expand agri-cultural lands to other ecosystems. Analysis shows that districts with high shares of agricultural labor have lower rainfall and vegetation productivity (using NPP as an indicator) and suffer from more frequent floods and severe droughts as well as more intense soil erosion (World Bank, 2018a). If other parts of the economy are not able to siphon excess labor rural, populations will expand their agricultural search to marginal and fragile lands. Expanding crop cultivation to relatively low fertility soils on degraded lands may not lead to sustainable agricultural production—with households earning US$950 (in 2011 PPP terms) less than those tilling more productive soils—and that loss of ecosystem functions through chronic degradation of land has long-lasting effects and is difficult to remediate (Haile et al., 2016). Such findings confirm the theory of link between land and a poverty trap. Thus, land degradation is part of a vicious cycle that feeds into both poverty and sustained environmental damage.
Share of agricultural land considered as “more favored” (%)
Soil erosion rates (t/ha/yr)
Flood occurrence (avg. number,
1985-2011)
Drought sever-ity (avg. length of drought times dry-ness, 1901-2008)
Top 1/3 of districts by pov-erty rates (“rich districts”)
78.9 3.2 8.6 20.1
Bottom 1/3 of dis-tricts by poverty rates (“poor districts”)
40.4 6.8 12.1 22.9
Table 7.3: Flood occurrence, drought severity, soil erosion rates and share of more favored agricultural land area by districts’ poverty level (World Bank Hidden Dimensions Dataset).
Traditional rainfed agriculture is the dominant economic sector in the Northern, Upper West, and Volta Regions, where poverty rates have stagnated, and the absolute number of poor has increased. Land degradation contributes to declining agricultural productivity and output and thus household earnings, which helps to explain why those engaged in agriculture as their primary form of employment earn around US$1,000 annually, slightly more than one-half average GDP per capita (World Bank, 2018b).

707. land degradaTion
Legislation Purpose
Town and Country Planning (Gold Coast) (Cap. 84) Establishes the Town and Country Board, which is tasked with the responsibility of the orderly and progressive development of land, towns, and other areas whether urban or rural, and the preservation and improvement of amenities in these areas.
Land and Soil Conservation Ordinance (1953) Provides for the establishment of committees with powers to preserve and reclaim land and to protect water resources in approved areas, and of further committees to coordinate the work and policy therein as well as to make provisions for related matters.
Land Planning and Soil Conservation Act (amended 1957) Amends the Land and Soil Conservation Ordinance and provides for the establishment of committees that should promote in designated areas proper land use and cultivation for purposes of erosion control.
Administration of Lands Act 1962 (Act 123) Permits the State to act as a Trustee for stool lands, creating a situation where the State holds the legal title to the land, but channels accrued benefits to the community.
State Lands Act, 1962 (Act 125) Provides for the acquisition of land in the national interest and other purposes connected therewith.
Lands (Statutory Wayleaves) Act, 1963 (Act 186) Provides for the entry on any land for the purpose of the construction, installation, and maintenance of works of public utility, and for the creation of rights of way and other similar rights in respect of such works and for purposes connected with those matters.
Control and Prevention of Bushfires Act 1990 (PNDCL 229) Prohibits use of bushfire unless expressly authorized; sets up local governance structures to prevent, control, and monitor bushfires.
Water Use Regulations. 2001 (L.I. 1692) Establishes regulations for issuance of water use permits or grant of water rights for various uses.
Table 7.4: Additional relevant legal and legislative instruments related to SLM
7.3 Governance Framework and Analysis
The legal framework governing land management in Ghana is com-plex and is characterized by an intricate combination of constitutional provisions, common law principles, legislation, and traditional law. Some inconsistent legislative provisions make it difficult to effectively implement the legal provisions. Table 7.4 presents some legislation enacted since 1953 to address land management in Ghana.
Technical land degradation issues are governed by institutions across several Ministries. MESTI provides leadership on land degradation from the technical perspective, with its EPA taking care of monitoring aspects related to SLWM. The Ministry of Food and Agriculture (MoFA)
leads watershed planning and implementation of SLWM activities in the agricultural landscape through Directorates such as those for Agricultural Engineering Services (AESD) in the case of watershed planning, and Agricultural Extension Services (DAES) in the case of on-farm activities. Under MLNR, the Forestry Commission’s Wildlife Division and Forest Service Division implement activities related to biodiversity management in non-agricultural landscapes in the case of the former, and sustainable forest management activities, in the case of the latter. Also, under MLNR is the Lands Commission (LC)--established in Article 258 of the 1992 Constitution and by the Lands Commission Act, 2008 (Act 767)—which is tasked with managing
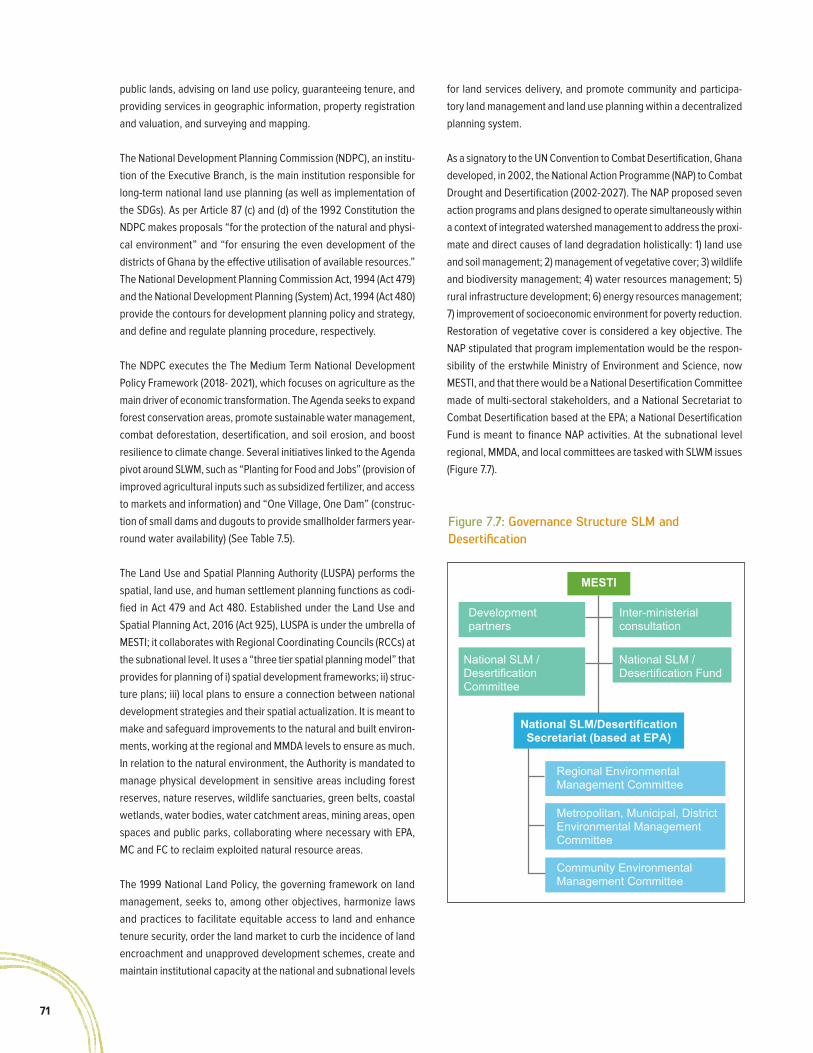
71
public lands, advising on land use policy, guaranteeing tenure, and providing services in geographic information, property registration and valuation, and surveying and mapping.
The National Development Planning Commission (NDPC), an institu-tion of the Executive Branch, is the main institution responsible for long-term national land use planning (as well as implementation of the SDGs). As per Article 87 (c) and (d) of the 1992 Constitution the NDPC makes proposals “for the protection of the natural and physi-cal environment” and “for ensuring the even development of the districts of Ghana by the effective utilisation of available resources.” The National Development Planning Commission Act, 1994 (Act 479) and the National Development Planning (System) Act, 1994 (Act 480) provide the contours for development planning policy and strategy, and define and regulate planning procedure, respectively.
The NDPC executes the The Medium Term National Development Policy Framework (2018- 2021), which focuses on agriculture as the main driver of economic transformation. The Agenda seeks to expand forest conservation areas, promote sustainable water management, combat deforestation, desertification, and soil erosion, and boost resilience to climate change. Several initiatives linked to the Agenda pivot around SLWM, such as “Planting for Food and Jobs” (provision of improved agricultural inputs such as subsidized fertilizer, and access to markets and information) and “One Village, One Dam” (construc-tion of small dams and dugouts to provide smallholder farmers year-round water availability) (See Table 7.5).
The Land Use and Spatial Planning Authority (LUSPA) performs the spatial, land use, and human settlement planning functions as codi-fied in Act 479 and Act 480. Established under the Land Use and Spatial Planning Act, 2016 (Act 925), LUSPA is under the umbrella of MESTI; it collaborates with Regional Coordinating Councils (RCCs) at the subnational level. It uses a “three tier spatial planning model” that provides for planning of i) spatial development frameworks; ii) struc-ture plans; iii) local plans to ensure a connection between national development strategies and their spatial actualization. It is meant to make and safeguard improvements to the natural and built environ-ments, working at the regional and MMDA levels to ensure as much. In relation to the natural environment, the Authority is mandated to manage physical development in sensitive areas including forest reserves, nature reserves, wildlife sanctuaries, green belts, coastal wetlands, water bodies, water catchment areas, mining areas, open spaces and public parks, collaborating where necessary with EPA, MC and FC to reclaim exploited natural resource areas.
The 1999 National Land Policy, the governing framework on land management, seeks to, among other objectives, harmonize laws and practices to facilitate equitable access to land and enhance tenure security, order the land market to curb the incidence of land encroachment and unapproved development schemes, create and maintain institutional capacity at the national and subnational levels
for land services delivery, and promote community and participa-tory land management and land use planning within a decentralized planning system.
As a signatory to the UN Convention to Combat Desertification, Ghana developed, in 2002, the National Action Programme (NAP) to Combat Drought and Desertification (2002-2027). The NAP proposed seven action programs and plans designed to operate simultaneously within a context of integrated watershed management to address the proxi-mate and direct causes of land degradation holistically: 1) land use and soil management; 2) management of vegetative cover; 3) wildlife and biodiversity management; 4) water resources management; 5) rural infrastructure development; 6) energy resources management; 7) improvement of socioeconomic environment for poverty reduction. Restoration of vegetative cover is considered a key objective. The NAP stipulated that program implementation would be the respon-sibility of the erstwhile Ministry of Environment and Science, now MESTI, and that there would be a National Desertification Committee made of multi-sectoral stakeholders, and a National Secretariat to Combat Desertification based at the EPA; a National Desertification Fund is meant to finance NAP activities. At the subnational level regional, MMDA, and local committees are tasked with SLWM issues (Figure 7.7).
Figure 7.7: Governance Structure SLM and Desertification
MESTI
National SLM/DesertificationSecretariat (based at EPA)
Regional EnvironmentalManagement Committee
Metropolitan, Municipal, DistrictEnvironmental ManagementCommittee
Community EnvironmentalManagement Committee
Developmentpartners
Inter-ministerial consultation
National SLM /Desertification Committee
National SLM /Desertification Fund

727. land degradaTion
Project title, loca-tion (duration)
Activity Development partners; Government partners
Sustainable Land and Water Management Project (SLWMP), Northern Savannah, (2014-2020)
The Project Development Objective of this US$28M project (which includes US$14.77M in additional financing) is to expand the area under SLWM prac-tices in selected watersheds. The specific objectives are to: (a) improve SLWM practices to reduce land degradation and enhance maintenance of biodiversity in selected micro-watersheds; and (b) strengthen spatial planning for identification of linked watershed investments in the Northern Savannah region. SLWM activities are currently ongoing in 174 communities within 12 districts across northern Ghana.
GEF, World Bank; MESTI
Ghana Agriculture Sector Investment Programme (GASIP) (2014-2021)
A US$78 million project, GASIP aims at scaling up investments in private sector-led pro-poor agricultural value chain development; its Objective is: “agribusinesses, including smallholders, have enhanced their profitability and climate change resilience”. The project is built on four strategic axes (i) linking smallholder farmers to agribusinesses to enhance pro-poor growth, (ii) nationwide scaling up of a successful value chain investment approach, (iii) promoting and mainstreaming climate change resilience approaches in Ghana, in particular in the northern regions, financed through the Adaptation for Smallholder Agriculture Programme (ASAP) and (iv) knowledge manage-ment, harmonization of intervention approaches, policy optimization.
IFAD; MoFA
Land Administration Project - 2 (2011-2021)
The US$85M project (of which US$35M is in additional financing) looks to consolidate and strengthen land administration and management systems for efficient and transparent land services delivery. The project includes components to harmonize the policy and legislative framework and formal-ize institutional arrangements in a strengthened and decentralized land administration system.
World Bank; MLNR/LC
Ghana Commercial Agriculture Project (2012-2020)
The goal of this US$150 million project (which includes $50 million of addi-tional financing) is to improve agricultural productivity and production of both smallholder and nucleus farms in selected project intervention areas (Accra Plains and Savannah Accelerated Development Authority zone).
World Bank; MoFA
Planting for Food and Jobs
The US$140M program aims to increase food production to achieve food self-sufficiency and create jobs. It focuses on staple crops of maize, rice, soybean, sorghum, and vegetables, and implementation is based on five pillars: (i) improved seeds; (ii) fertilizers; (iii) extension services; (iv) marketing arrangements and reduction of post-harvest losses; and (v) an electronic platform for M&E. The program targets 200,000 farmers in all districts of the country.
Various donors; MoFA
Table 7.5: Selected land management projects

73
7.3.1 Gaps and Challenges
Lack of coherence in land management. The legal framework gov-erning land management in Ghana is byzantine. It is characterized by an intricate combination of constitutional provisions, common law principles, legislation, and, above all, traditional and customary law. Inconsistent legislative provisions make effective implementation dif-ficult. As a result, land management and administration fall under the responsibility of a number of different MDAs ministries and agencies, as well as traditional authorities. At least 10 agencies and institutions at the central level are directly and/or indirectly mandated for land management and administration. However, these institutions have mandates that are often not well defined and sometimes conflict-ing. This makes it difficult to identify the correct authority to deal with land issues and pin down institutional accountability. Details of duplication of institutional roles were provided in the World Bank’s 2007 Ghana CEA.
Weak coordination hinders a comprehensive, integrated SLWM approach. Coordination among government agencies on land deg-radation issues is generally weak, especially at the national level. Opportunities and forums for strategic dialogue among MESTI, MLNR, and MoFA are limited. Weak intersectoral coordination makes policy harmonization and coherence more difficult and reduces information flow. MESTI may not have the resources or convening power to lead on a cross-cutting issue as contentious as land use management.
Weak enforcement and compliance. Overall weak enforcement and compliance with environmental laws continues to be a chal-lenge. The key issue that has impeded adequate implementation and subsequent compliance with the law is weak institutional capacity, specifically lack of adequate resources to cover operational costs. As a result, illegal activities that negatively affect land such as bushfires in forest areas, illegal logging and mining activities, or cultivation over river banks and hillsides, remain largely uncontrolled.
● Improve communication and knowledge management related to SLWM (MESTI)
● Improve inter-ministerial and interagency coordination and cooperation on land use and land management issues (MESTI/EPA/LUSPA; MLGRD/MMDAs/RCCs; MLNR/FC/LC/MC; MoFA; NDPC)
● Scale-up existing interventions in SLWM—crop rotation, plant-ing of economic trees, composting techniques, development of watershed plans, replanting of degraded riparian zones to improve water retention—to more districts and communi-ties in order to reduce rural poverty and build the resilience of communities and ecosystems; develop the SLWM Project (World Bank/GEF) into a larger program of land and water management across the entire NSEZ (See Box 7.3) (MESTI; MLNR/FC; MoF)
● Conduct an analysis of indigenous erosion/soil degradation management practices (e.g. stone bunding); facilitate uptake of SLWM knowledge through a locally appropriate knowledge dissemination strategy, e.g. farmer field schools or demonstra-tion plots to foster peer-to-peer learning (MESTI/EPA; MoFA/DAES)
● Work with communities to promote low-technology rehabilita-tion of degraded lands, such as planting of restorative cover crops and use of composting and green manure to enrich depleted soils; increase assistance to smallholders to plant trees on farms (e.g. moringa (Moringa olifera), white acacia (Faidherbia albida)) (MESTI/EPA; MoFA/DAES)
● Establish and reinforce inclusive local governance structures to discuss and decide on local rules for management of common and privately held lands, especially in regard to transhumance/livestock grazing in northern areas (MESTI/EPA; MLGRD/MMDAs; MoCRA; MoFA)
● Increase support to environmental management committees at the regional and district levels for planning, implementing, monitoring and evaluating land degradation neutral interven-tions (MLGRD/MMDAs/RCCs)
● Relieve pressure on trees in the landscape by promoting: retention and planting of trees on farms, efficiency in fuelwood use, e.g. through improved cookstoves, alternate sources of household energy, and establishment of sustainably managed community woodlots (MESTI/EPA; MoFA/DAES)
● Improve public sector ability to prepare and disseminate maps for local, district, and regional land use purposes (MESTI/LUSPA; MLNR/GSD)
● Develop land use and spatial development plans for all MMDAs; ensure active participation of traditional authorities and other stakeholders in plan formulation and implementation (MESTI/LUSPA; MLGRD/MMDAs/RCCs)
7.4.1 Short-term (1-2 years)
7.4.2 Medium-term (2-5 years)7.4 Recommendations to Reduce Land Degradation

747. land degradaTion
● Build momentum to enact critical reforms in land tenure, secu-rity (Cabinet; Parliament)
● Undertake a comprehensive national land registration exer-cise, advancing customary land records, and clarifying proce-dures for access to customary lands and public land acquisition to facilitate private investment (MLNR/LC)
● Offer incentives for individuals to invest in their lands through land titling, access to credit, access to markets, access to agri-cultural inputs and best practices, etc. (MLNR/LC; MoFA; MoF)
● Establish, scale, and support (with extension services, capacity building) CREMAs to incentivize and decentralize local land use planning and management (MESTI/EPA; MLNR/FC)
● Resource communities to control bushfires and reduce inci-dence of bushfires started deliberately, e.g. for slash-and-burn agriculture or hunting of bush game (MoFA/DAES; MoI/GNFRS74 )
● Progress towards a holistic, landscape approach to develop-ment planning and SLWM at the local, regional, and national levels (NDPC; MESTI/EPA; LUSPA)
● Work with traditional authorities to improve communication and knowledge transfer that support i) land degradation-neutral farming and other land uses; ii) women’s access to land ownership (MESTI/EPA; MLNR/LC; MoCRA; MoFA/DAES)
● Encourage and increase women’s access to land ownership, markets, credit, and extension services to facilitate invest-ments in land degradation neutral activities (MLNR/LC)
● Incorporate ecosystem values in i) national and local land use planning exercises and ii) project economic analysis (to quan-tify/monetize application of SLWM practices and illustrate their positive economic effects); target dissemination to key policy-makers (MESTI; MoFA; MoF)
● Update national education curricula to contain clear messages on sustainable actions that avoid land degradation and/or lead to improvement, restoration, and rehabilitation of lands (MESTI; MoE)
● Promote inclusivity in SLWM by creating employment opportu-nities for women, youth, and other sensitive groups living on affected/degraded lands (MESTI/EPA; MLNR/FC; MoFA/DAES)
● Harmonize and streamline land management policies and regulations, and strengthen key institutions to implement SLWM practices effectively (MESTI/EPA/LUSPA, NDPC)
● Formalize NDPC role as lead institution in land use planning to prevent land degradation (Parliament)
● Promote an enabling environment for mechanisms to integrate land use planning and mainstreaming, including principles of land degradation neutrality-based land and water manage-ment programs and projects, across sectors (Cabinet)
● Update land use plans; address human capacity gaps by making development planners available to the local level (MESTI/LUSPA; MLGRD/MMDAs/RCCs)
7.4.3 Long-term (5+ years)
74. GNFRS = Ghana National Fire and Rescue Service

75
Box 7.3: Dealing with land degradation: lessons from Nigeria
Despite its middle-income status, Nigeria’s poverty incidence is high with nearly four out of every ten living below the poverty line, and many of those impoverished living on degraded lands. Almost 6 percent of Nigeria’s land mass is estimated to be severely degraded. A preliminary inventory identified 6,000 degraded lands sites. The country is classified as one of the ten most vulnerable countries in climate change in the world, according to the 2017 Climate Change Vulnerability Index.
The Nigeria Erosion and Watershed Management Project (NEWMAP) is a US$900 million credit from the International Development Association (IDA) to reclaim degraded areas and reduce vulnerability to soil erosion in targeted sub-watersheds. The project engages and coordinates across sectors and stakeholders, from government at the federal, state, and local levels, to community and non-state actors, to academics and private sector service providers. It is supported through an alliance of development partners: World Bank, GEF, Special Climate Change Fund, TerrAfrica, GIZ, and FAO.
To support Nigeria’s goals of achieving sustainable and inclusive socioeconomic development, the project delivers solutions that reduce the vulnerability of people, infrastructure, assets, and natural capital, to land degradation by preventing erosion, reclaiming valuable land, and focusing on sustainable livelihoods to enhance resilience. Project activities are a combination of civil engineer-ing, vegetative land management, watershed protection measures, and community-led livelihood enhancements. NEWMAP’s three main components are: 1) gully restoration, catchment management, and economic support measures; 2) capacity building in erosion and watershed management for key national and state institutions; 3) climate change and alternative energy use in rural areas.
Despite challenging circumstances including weak institutions, overlapping responsibilities and conflicting mandates, capacity gaps, and socioeconomic and environmental factors (e.g. high population density, rapid urbanization, fragile soils, heavy rainfall), NEWMAP’s approach delivered effective results: drafting of planning tools (participatory sub-watershed management plans; storm water master plans, state-wide erosion risk mapping); land restoration (over 1,500 ha of degraded land reclaimed; rehabilitation of 25 gully erosion sites, 30 more in process); livelihoods improvements (9,318 households benefitting from income generating activi-ties, including gabion box welding, cement sales, block molding, aquaculture, tailoring, horticulture, cassava processing, palm oil production and processing).
The Federal Ministry of Environment has signaled willingness to adopt NEWMAP’s approach as the gold standard in addressing Nigeria’s land degradation issues. To build upon this success, the European Investment Bank is planning to invest US$200 million into NEWMAP to scale up investments. NEWMAP has also supported Nigeria in issuing, in December 2017, Africa’s first sovereign Green Bond with a capital value of US$30 million, to meet its NDC target.
Source: World Bank, 2019.
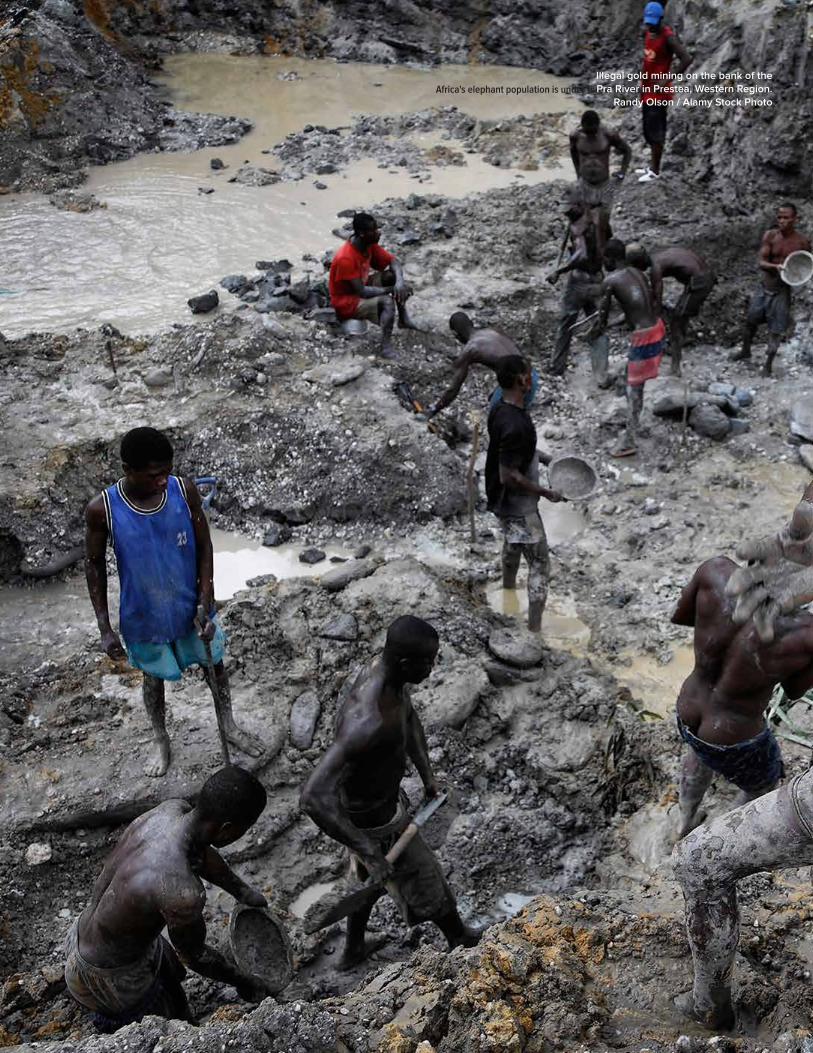
767. land degradaTion
Africa's elephant population is under threat from poaching and habitat loss.Illegal gold mining on the bank of the Pra River in Prestea, Western Region.
Randy Olson / Alamy Stock Photo

77
8

788. illegal arTisanal and small-sCale gold mining (galamsey)
8. Illegal Artisanal and Small-scale Gold Mining (Galamsey)8.1 From Traditional Practice to Modern Challenge
Artisanal and small-scale gold min-ing (ASGM) has figured prominently in the economic and social fabric of Ghana since time immemorial. The country owes its reputation as the “Gold Coast” to the ease with which miners can extract gold from accessible, rich deposits (Afriyie et al., 2016; Botchway, 1995). Whereas most large-scale miners conduct hard rock mining, ASGM is primar-ily alluvial (in stream beds). Some current ASGM practices still rely
on traditional tools and techniques to separate gold from sediment (Ofosu-Mensah, 2011; Wilson et al., 2015).
When unlicensed—and hence illegal—ASGM is referred to colloquially as “galamsey75.” McQuilken and Hilson (2016) make the distinction between formal ASGM and galamsey, with the former synonymous with legal/licensed mining, while the latter, although illegal, indi-cates that miners have “social license to operate” from traditional authorities or communities, but do not have government permits. Though informal gold mining established Ghana as a world-class gold producer by the time of the Akan and Adansi kingdoms in the sixth and seventh centuries, galamsey only increased in intensity and destructiveness when the price of gold skyrocketed following the 2008 global financial crisis. The recent galamsey explosion has involved a combination of foreign speculators, politically-connected locals, equipment/machinery providers, rural villagers, out-of-work miners, and migrant laborers. Crucially, foreigners and well-heeled Ghanaians have provided access to capital, enabling the import of
advanced machinery and allowing illegal miners, or galamseyers, to exploit large surface areas in short periods of time (Bansah et al., 2018).
Galamsey requires the removal of overlying layers of surface veg-etation, forest, and rock. Conducted hastily and without oversight, illegal mining operations lead to deforestation and loss of biodiversity, accelerated soil erosion and sedimentation, and water and air pollu-tion. The result is a landscape deprived of vital ecosystem services, bearing significant ramifications for local populations dependent on land, forest, and water resources (Figure 8.1).
Extent. Acknowledged as widespread, the full geographic extent of galamsey is unknown. Data are limited due to the clandestine and transitory nature of operations. Galamseyers work to avoid detection, choosing sites difficult to access, remaining ready to uproot quickly, and mining at night. The size of an average galamsey site is deter-mined by the extent of excavation achievable with a limited number of earthmoving machines and a mining cycle of two or three months. Sites generally range from 5-15 ha, although some stakeholders have reported areas as large as over 100 ha (WBG, 2019). Owusu-Nimo et al. (2018) identified 7,470 individual galamsey operations in 312 towns and villages—an average of 24 per town—in Western Region alone.76
75. The word “galamsey” is derived from the phrase “gather them and sell.”
76. Hotspots were in Tarkwa Nsuaem, Amenfi East, and Prestea-Huni Valley District(Owusu-Nimo et al., 2017).
BI NKA BI: BI NKA BI: (“bite not one (“bite not one
another”): caution another”): caution against provocation against provocation
and strifeand strife

79
Water pollution. Dependent on alluvial soils, galamsey follows riv-ers and their tributaries, diverting or destroying them, restricting stream flow, increasing vulnerability to flooding, and endangering downstream water usage. Increased turbidity, sediment loading, and heavy metal contamination in the major Pra and Birim Rivers are attributed to galamsey (Attua et al., 2014; Hogarh et al., 2016; Kusimi et al., 2014). Galamsey disrupts aquatic environments and fisheries and threatens access to potable water. In Tarkwa, Western Region, multiple studies have shown water quality levels unsuitable for human consumption (Armah et al., 2012; Asante et al., 2007; Bansah, et al., 2018; Cobbina et al., 2013; Rajaee et al., 2015; Rossiter et al., 2010). Since 2011, the Ghana Water Company Limited (GWCL) has had to shut down water treatment operations several times, including on the Birim, where pollution was too high for water to be treated for household use (Amankwah, 2013; Bansah et al., 2018; Long et al., 2013). Without alternatives, miners and communities may continue to rely on contaminated water for daily needs.
Deforestation. Ghana’s mineral belts coincide with its remaining for-ested areas, making galamsey a deforestation and forest degradation risk. Some HFZ forest reserves saw as much as a 12-fold increase in galamsey between 2011-2015; reserves spared from encroachment still experienced galamsey’s deleterious effects when water polluted upstream flowed through their forests (Snapir et al., 2017). As illegal mining communities expand, illegal logging and fuelwood harvest-ing increase to fulfill demand for construction and cooking needs.
Furthermore, surface mining can displace farmers, leading to knock-on effects of deforestation in untouched areas, agricultural intensi-fication (due to land scarcity), and land degradation from the loss of ecosystem services that are critical to rural jobs and the wider economy. ASGM may also force affected farmers to cultivate marginal, erosion-prone lands (Schueler et al., 2011). Gold and cocoa especially maintain an uneasy coexistence, with the two vying over land and labor, and galamsey is a likely contributor to decreased cocoa health and yields (Boateng et al., 2014; Snapir et al., 2017). Nevertheless, galamsey may be tied to positive effects for cocoa because it provides income diversification and supplements off-season income, allow-ing farmers to invest mining profits into farming inputs (Hilson and Garforth, 2013; Okoh and Hilson, 2011).
Land degradation. Digging and dredging of alluvial soils can lead to loss of arable land and degradation of rural landscapes. The destruc-tion of farmlands in galamsey areas has engendered food security issues, including increases in the price of staple crops (Bansah et al., 2018). In the cocoa-growing southwest, galamsey directly affected 43,879 ha in 2015—up 250 percent from 2011—and an additional “impact zone” of over 500,000 ha (Snapir et al., 2017). Open mine pits and abandoned galamsey sites are massive fall hazards that threaten people and livestock; they also modify natural drainage pat-terns and become stagnant pools and breeding zones for mosquitoes and mosquito-borne diseases (Bansah et al., 2018).
Figure 8.1: Key ecological hazards in the ASGM sector (Rajaee et al., 2015 with silhouettes adapted from UNEP Mercury: Time to Act (2013)).

808. illegal arTisanal and small-sCale gold mining (galamsey)
Heavy metal contamination. Recovering gold creates pollution from arsenic, lead, and mercury, among other elements. Contaminants are discharged in the immediate environment, including as effluent in water bodies. Excavation churns naturally occurring metals to the surface, affecting riverine flora and fauna, as well as humans (Rajaee et al., 2015). Harmful levels of arsenic and cadmium have been found in miners and communities, with arsenic levels exceed-ing Ghana Standards Board/GWCL/WHO guidelines in two-thirds of samples; samples from Western Region and northern Ghana found arsenic at levels threatening carcinogenic risk (Armah et al., 2012; Basu et al., 2015; Long et al., 2013; Obiri et al., 2006). Proximity to gold mining sites has been linked with contaminated soil and irrigation water (Adomako et al., 2010). Analysis of sediment cores from Lake Amponsah, Western Region, showed increasing arsenic, copper, cadmium, and lead contamination over time, consistent with acid mine drainage (the outflow of acidic water from mines) (Hogarh et al., 2016).
Mercury. Mercury used in galamsey activities contaminates land, water, and the atmosphere (Figure 8.2). Illegal miners use it as an inexpensive way to separate gold from impurities, mixing the two together to form an amalgam, then burning off the mercury to leave behind a gold nugget. Mercury vapor inhalation is the primary route of occupational exposure, though mercury can also be absorbed through the skin. Galamseyers have exhibited hair and urine mercury levels exceeding guideline values with those handling the substance during amalgamation showing the highest urine levels (Basu et al., 2015; Paruchuri et al., 2010). Levels of mercury have been comparable between miners and villagers, signaling migration of pollution away from the mine area and into the broader community. When gold amalgamation occurs at home, women and children are exposed to toxic mercury fumes, leading to serious long-term health conse-quences (Teschner, 2012). There are indications that diet may be another exposure pathway: fish near ASGM sites have been found
to harbor three times the mercury suggested by the U.S. EPA, while samples of cassava, a staple of the Ghanaian diet, have also revealed contamination (Rajaee et al., 2015).
8.2 Economics of Galamsey
Gold mining is a major contributor to national wealth and poverty reduction. According to the U.S. Geological Survey (2019), Ghana was the 8th largest gold producer in 2017 and holds two percent of the world’s reserves. Of the 120 MT of gold Ghana produced in 2016, 39 percent came from ASG miners, up from 12 percent in 2004 (MoF, 2018). ASGM production has increased substantially since 2010 (Figure 8.3), both in overall volume and as a share of total gold production. This increase was a response to high gold prices, high unemployment, and a slump in agricultural production. Looking at Bonsa, Western Region, Bansah et al. (2018) note that informal mining is the major source of livelihood for the community, employing 3,000, especially youth—80 percent of those aged 15-35 are directly engaged in illegal mining.
Mining accounts for about one percent of Ghana’s total labor force employment77, of which 90 percent is in gold mining, and three-quarters is in the informal sector.78 National galamsey employment numbers, though unknown, are likely quite high. Figures range from 500,000 to 1.1 million workers, including direct and indirect jobs (e.g. Hilson et al., 2007; McQuilken and Hilson, 2016). This implies that the entire informal mining economy may employ the equivalent of four to eight percent of the workforce. Though eight out of every 10 Ghanaian miners are male, galamsey creates associated jobs often occupied by women, such as food preparation and market activities. If galamsey indeed accounts for 1.1 million jobs, economic benefits may accrue to an additional 4.4 million dependents (UNECA, 2011).
77. Ghana’s labor force is 14,011,888 (2018 figures) according to WDI database. ”
78. Statistics quoted by Professor Baah Boateng, see: https://unctad.org/meetings/en/Presentation/GCF2018_BaahBoateng_23042018.pdf
A giant illegal gold mining pit mars the edge of a forest in Nkatieso, Western Region.Steven J. Silverstein / World Bank

81
FIGURE 8.2: Mercury (Hg) cycle in a typical artisanal and small-scale gold mining (ASGM) process (Rajaee et al., 2015).
Illegal mining provides an array of income and market opportuni-ties for individuals, households, and communities, with a range of employment options from low to higher-skilled work (Figure 8.4) (Banchirigah, 2008). Galamseyers earn between US$2.90-22.90 per day.This includes women who carry up to 100 loads of heavy rock and sand for US$5-10/day (these wages are 60 percent lower than those of males performing the same task) (Andrews, 2015; Dinye and Erdiaw-Kwasie, 2012; Teschner, 2012). Owners of capital goods like grinding machines can bring home US$1,300/week. The influx of gold-related income and increased purchasing power seems to have local multiplier effects, creating microeconomies that develop within communities to support the informal ASGM sector. Bush (2009)
illustrates how galamsey injects dynamism into communities by cre-ating demand for local products and ancillary services. Boadi et al. (2016) estimate that 70 percent of workers at galamsey sites are directly involved in mining and 30 percent are involved in activities like tool repair or food preparation.
Women’s estimated participation in artisanal mining-related activities may be as high as half of the workforce (McQuilken and Hilson, 2016). Though they do not typically work in the pits, and few are mine own-ers or managers, they do serve as panners, carriers, and processors, transporting heavy loads of ore on their heads to washing sluices, or are otherwise involved in providing ancillary services. Many work with babies on their backs (Andrews, 2015).
FIGURE 8.3: Gold Production and ASM Share (MLNR, 2017).
0%
5%
10%
15%
20%
25%
30%
35%
40%
45%
0
500,000
1,000,000
1,500,000
2,000,000
2,500,000
3,000,000
3,500,000
4,000,000
4,500,000
5,000,000
1990 1992 1994 1996 1998 2000 2002 2004 2006 2008 2010 2012 2014 2016
Shar
e of
tota
l pro
duct
ion
Oun
ces
prod
uced
Total gold production ASGM production (right axis)
Numbers represent key steps in the ASGM process: 1—excavation, 2—crushing and grinding, 3—sifting/shanking, 4—washing/sluicing, 5—amalgamation, and 6—burning.Letters represent key steps in the mercury cycle: A—residual mercury from amalgamation may be discarded in local soil and water, B—volatilization of elemental mercury into the atmosphere, C—oxidation of elemental mercury, D—deposition onto local terrestrial systems, E—deposition onto local aquatic systems, F—methylation of inorganic mercury to methylmercury (MeHg)

828. illegal arTisanal and small-sCale gold mining (galamsey)
Some of galamsey’s costs can be quantified. The total annual cost attributed to ASGM-related mercury exposure is estimated at US$240 million, or 0.4 percent of 2017 GDP.79,80 .The GoG estimates that US$2.3 billion left the country via illegal ASGM, escaping taxation by the Ghana Revenue Authority81.The cost of water provision rises as water treatment plant maintenance becomes more expensive and
communities are forced to dig new wells. The destruction occasioned by earthmoving machinery and gold processing leaves land recla-mation costly. Mantey et al. (2016) estimate that US$250 million is required for the Western Region alone to restore lands and water bodies destroyed by galamsey (Box 8.1).
79. Assumptions are based on a total of 5.5 million affected people (1.1 million ASGM workers and their dependents, assumed to be four individuals, on average) (Hilson et al., 2007; Wilson et al., 2015). This includes all those involved in any step of the gold mining process who have either direct or indirect contact with mercury—workers and millers mixing ore with mercury, smelters conducting the amalgamation process, as well as refiners (also called gold dealers or gold shop workers).
80. Poulin et al. (2008) provide a methodology to estimate health effects of organic mercury pollution using mercury levels contained in the hair of mothers. However, no studies to date have analyzed
Ghanaian women. Regardless, Basu et al. (2015) advise that future studies must be treated cautiously, because while hair is a preferred biomarker of methylmercury exposure, positive results may be derived, exogenously, from adsorbed inorganic mercury. Thus, this report does not conduct such analysis due to lack of proper data.
81. MLNR presentation “Sanitization of Illicit Mining Activities in Ghana,” made at Ministry of Foreign Affairs, 10 May 2017
82. https://www.climateinvestmentfunds.org/country/ghana
Box 8.1: Estimating impacts and repair costs in galamsey-affected areas
Ghana may not yet have a full inventory of areas affected by ASGM, but the MLNR, commissioned a baseline study in four Forest Districts (as preparation for investment from the Forest Investment Program82). Undertaken by Accra-based environmental special-ists at the Traffic and Environmental Network (TEN), the study found that for the districts surveyed, the total mine-degraded area was about 18,737 ha.
The study also identified locations for potential pilot projects to rehabilitate degraded lands back to their near-original state. The first step would be rehabilitation. The second step would restore biodiversity to the rehabilitated lands. Using a unit cost estimate for rehabilitation from the NGO AROCHA of US$2,750/ha on the basis of approxi-mately 1,080 ha of identified pilot sites in four forest districts, the study estimates a total cost of US$2,969,402. The amount is calculated to cover restoration of: (1) forest reserves and their fringes (109 ha), (2) river courses (249 ha), and (3) outskirts of communities and farmlands (721 ha). Restoration costs for the currently known illegal mining area in these forest districts is higher, at US$7.7 million, although given the number of illegal hectares currently classified as unvalidated, it is sure to rise significantly upon a final comprehensive inventory of galamsey sites. Even without counting those additional hectares, the amount of earth disrupted and turned into open pits, nearly 165 million cubic meters, is staggering.
Source: MLNR Consultant Report prepared by TEN, 2018
Forest district
Known illegal sites (ha)
Estimated volume of void
(m3)
Total rehabilita-tion cost (US$)
Bibiani 88.86 5,030,400 244,365.00
Tarkwa 1204.69 68,623,900 3,312,897.50
Begoro 1436.99 83,608,400 3,951,722.50
Kade 77.73 7,559,200 213,757.50
Total 2808.27 164,821,900 7,722,742.50
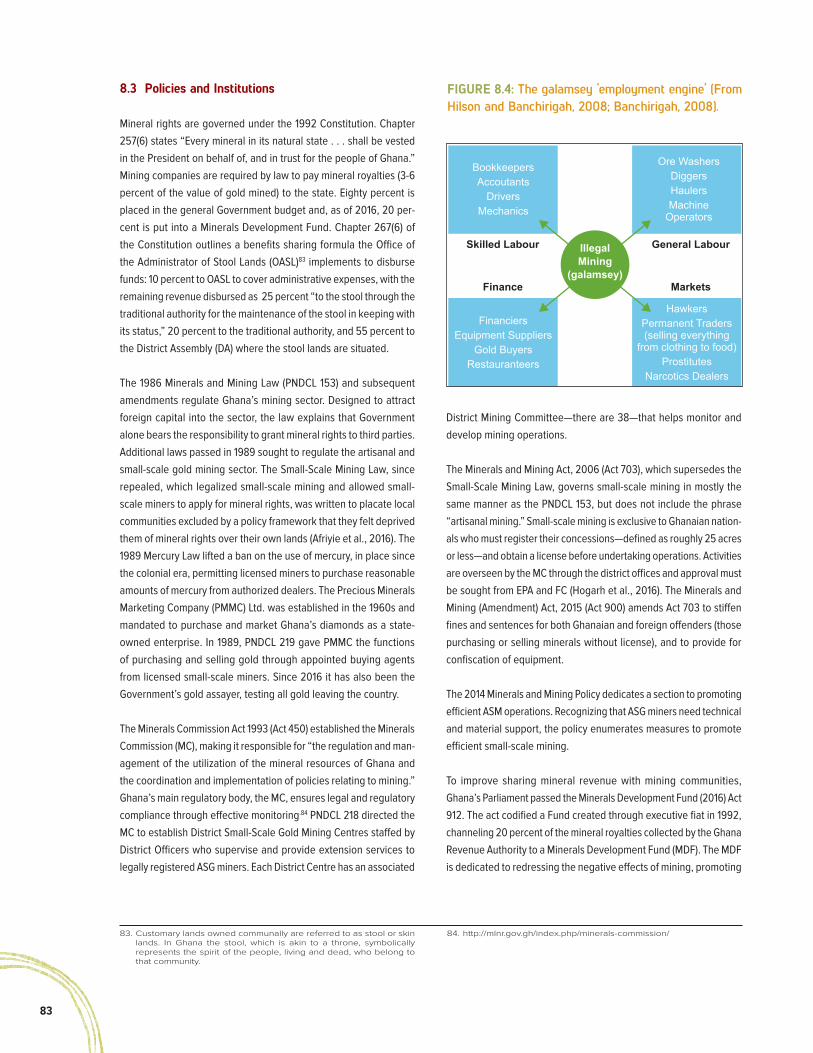
83
FIGURE 8.4: The galamsey ‘employment engine’ (From Hilson and Banchirigah, 2008; Banchirigah, 2008).
IllegalMining
(galamsey)
BookkeepersAccoutants
DriversMechanics
FinanciersEquipment Suppliers
Gold BuyersRestauranteers
Ore WashersDiggersHaulersMachine
Operators
HawkersPermanent Traders(selling everything
from clothing to food)Prostitutes
Narcotics Dealers
General Labour
Markets
Skilled Labour
Finance
8.3 Policies and Institutions
Mineral rights are governed under the 1992 Constitution. Chapter 257(6) states “Every mineral in its natural state . . . shall be vested in the President on behalf of, and in trust for the people of Ghana.” Mining companies are required by law to pay mineral royalties (3-6 percent of the value of gold mined) to the state. Eighty percent is placed in the general Government budget and, as of 2016, 20 per-cent is put into a Minerals Development Fund. Chapter 267(6) of the Constitution outlines a benefits sharing formula the Office of the Administrator of Stool Lands (OASL)83 implements to disburse funds: 10 percent to OASL to cover administrative expenses, with the remaining revenue disbursed as 25 percent “to the stool through the traditional authority for the maintenance of the stool in keeping with its status,” 20 percent to the traditional authority, and 55 percent to the District Assembly (DA) where the stool lands are situated.
The 1986 Minerals and Mining Law (PNDCL 153) and subsequent amendments regulate Ghana’s mining sector. Designed to attract foreign capital into the sector, the law explains that Government alone bears the responsibility to grant mineral rights to third parties. Additional laws passed in 1989 sought to regulate the artisanal and small-scale gold mining sector. The Small-Scale Mining Law, since repealed, which legalized small-scale mining and allowed small-scale miners to apply for mineral rights, was written to placate local communities excluded by a policy framework that they felt deprived them of mineral rights over their own lands (Afriyie et al., 2016). The 1989 Mercury Law lifted a ban on the use of mercury, in place since the colonial era, permitting licensed miners to purchase reasonable amounts of mercury from authorized dealers. The Precious Minerals Marketing Company (PMMC) Ltd. was established in the 1960s and mandated to purchase and market Ghana’s diamonds as a state-owned enterprise. In 1989, PNDCL 219 gave PMMC the functions of purchasing and selling gold through appointed buying agents from licensed small-scale miners. Since 2016 it has also been the Government’s gold assayer, testing all gold leaving the country.
The Minerals Commission Act 1993 (Act 450) established the Minerals Commission (MC), making it responsible for “the regulation and man-agement of the utilization of the mineral resources of Ghana and the coordination and implementation of policies relating to mining.” Ghana’s main regulatory body, the MC, ensures legal and regulatory compliance through effective monitoring.84 PNDCL 218 directed the MC to establish District Small-Scale Gold Mining Centres staffed by District Officers who supervise and provide extension services to legally registered ASG miners. Each District Centre has an associated
District Mining Committee—there are 38—that helps monitor and develop mining operations.
The Minerals and Mining Act, 2006 (Act 703), which supersedes the Small-Scale Mining Law, governs small-scale mining in mostly the same manner as the PNDCL 153, but does not include the phrase “artisanal mining.” Small-scale mining is exclusive to Ghanaian nation-als who must register their concessions—defined as roughly 25 acres or less—and obtain a license before undertaking operations. Activities are overseen by the MC through the district offices and approval must be sought from EPA and FC (Hogarh et al., 2016). The Minerals and Mining (Amendment) Act, 2015 (Act 900) amends Act 703 to stiffen fines and sentences for both Ghanaian and foreign offenders (those purchasing or selling minerals without license), and to provide for confiscation of equipment.
The 2014 Minerals and Mining Policy dedicates a section to promoting efficient ASM operations. Recognizing that ASG miners need technical and material support, the policy enumerates measures to promote efficient small-scale mining.
To improve sharing mineral revenue with mining communities, Ghana’s Parliament passed the Minerals Development Fund (2016) Act 912. The act codified a Fund created through executive fiat in 1992, channeling 20 percent of the mineral royalties collected by the Ghana Revenue Authority to a Minerals Development Fund (MDF). The MDF is dedicated to redressing the negative effects of mining, promoting
83. Customary lands owned communally are referred to as stool or skin lands. In Ghana the stool, which is akin to a throne, symbolically represents the spirit of the people, living and dead, who belong to that community.
84. http://mlnr.gov.gh/index.php/minerals-commission/

848. illegal arTisanal and small-sCale gold mining (galamsey)
local development and alternative livelihood projects specifically in mining host communities, strengthening research and human capacity in the sector, promoting Ghanaian mining, and supporting policy planning and M&E. The Act authorizes the creation of Mining Community Development Schemes (CDS), the objective of which is socioeconomic development in mining communities, and Local Management Committees to oversee the execution of the schemes.
Ghana is an adherent to the 2013 Minamata Convention on mercury pollution, becoming a signatory in 2014 and ratifying it in 2017. The Convention’s Article 7 is dedicated to ASGM and requires signatories to develop environmental and public health strategies for affected communities and vulnerable populations. It binds countries to pro-mote mercury risk outreach, education, and capacity building, and to collect data on baseline mercury quantities. Ghana has already begun preparation for the Convention’s implementation with the drafting of its Initial Assessment—through a project funded by the GEF and implemented by the United Nations Development Programme (UNDP)—that establishes a baseline of mercury use, supply, and trade. Next steps are a National Implementation Plan to ensure that the Convention’s commitments are enforced and a National Action Plan to reduce mercury emissions (as per Article 8 of the Convention).
Box 8.2: Multilateral Mining Integrated Project (MMIP)
In parallel with the moratorium, the Government has been devel-oping the Multilateral Mining Integrated Project (MMIP). The MMIP, a US$200 million program intended to begin at the end of the moratorium, takes a multi-stakeholder, holistic approach based on the following five elements:
● Review and enforce the legal regulatory regime ($10 million);
● Reclaim degraded lands, dredge silted estuaries, and free lands for agribusiness ($100 million);
● Implement social interventions to facilitate livelihoods in mining communities ($50 million);
● Adapt technology to ensure efficient mining, processing, environmental and monitoring activities ($20 million); and
● Capacity building of ASM, regulator,s and project management ($20 million).
These include some ambitious targets, notably:
● Engage over 500,000 miners from small-scale mining communities;
● Alternative livelihoods program – in particular, establish 20,000 ha of oil palm plantations;
● Train 1,000 miners in mining and processing;
● Reclaim 2,380 km2 of mined out lands; and
● Reduce ASM license acquisition time by 40 percent.
Source: Ministry of Lands and Natural Resources, 2016
To tackle the recent spate of illegal ASGM, the GoG initiated the Multilateral Mining Integration Project (MMIP) in 2017 (Box 8.2). The MMIP is planned as a five-year project, ending in 2022, presided over by the MLNR. It proposes a holistic framework to tackle illegal mining based on a Legislations Enforcement Civil Integration and Technical Approach, which has three elements: legal reform, law enforcement, and use of new technologies to ensure transparency and sustainability in the mining sector.
As a precursor to the MMIP, the GoG implemented a moratorium on all types of small-scale mining (licensed and unlicensed; alluvial and hard rock) in April 2017 that was extended several times until ending in January 2019. The Government deployed a military-style task force to carry out the moratorium, which reflected the national mood of crisis surrounding galamsey. Some criticized the ban (e.g., Hilson, 2017) for failing to consider the impact of depriving ASGM miners and their households of income. The GoG has acknowledged that a military operation is not a sustainable solution and some donor-funded projects are hoping to derive alternate solutions (Table 8.1).

85
Project title, location (duration) ActivityDevelopment partners; Government partners
Artisanal and Small-Scale Mining Formalization (nationwide; 2020 – 2025)
The objective of this US$47.8 million project is to create enabling conditions for the orderly, safe, sustainable, and environmentally sound development of ASM for the benefit of Ghanaians and Ghana. The project addresses illegal mining’s threat by supporting ASM formalization, strengthening the Government’s capacity for support and monitoring of ASM operations, promoting responsible entrepreneurship for ASM development, and support-ing sustainable livelihood alternatives in galamsey com-munities. Project activities focus on: (1) improving the enabling environment for ASM legalization, formalization; (2) strengthening institutional capacity to manage ASM; (3) promoting sustainable ASM practice.
World Bank; MLNR/MC
Additional Financing to Ghana’s FIP (Brong-Ahafo, Western, Ashanti, Eastern Regions; 2019-2023)
An extension to the existing Forest Investment Program’s Enhancing Natural Forest and Agroforest Landscapes project, the grant portion of this project—US$9.89 mil-lion—is dedicated to reducing forest loss and degrada-tion and demonstrating rehabilitation of mined-out sites through pilot programs in selected landscapes of Ghana's High Forest Zone.
World Bank; MLNR/FC
Table 8.1: Selected projects combating illegal artisanal and small-scale gold mining
8.3.1 Gaps and Challenges
Service delivery. The agencies within MLNR and MESTI, most nota-bly EPA and MC, but also LC, PMMC, and GSD, have been unable to provide services effectively; district-level government institutions designed to tackle environmental and mining issues have been equally constrained. Contributory factors include:
● Resources: Inadequacies in personnel, logistics, and training are a major impediment to enforcement of laws/regulations and implementation of activities. EPA and WRC need additional resources to deal with galamsey’s damage, but budgetary provisioning has been unequal to the magnitude of the task.
● Citizen access: The current ASM framework poses a cumber-some compliance burden and perversely incentivizes illegality. Galamseyers cite bottlenecks in registration and licensing—i.e. time commitment of going to Accra to obtain the permit—high cost of fees, and bureaucracy (including bribery and corrup-tion) (Banchirigah, 2008).
● Decentralization: The ASM moratorium highlighted the need for local solutions in resource governance, such as enhanc-ing district-level public sector capacity to license applicants and track ASGM operations. However, district authorities are neither sufficiently empowered to assist small-scale mining entrepreneurs, nor sufficiently resourced to work with commu-nities to stem galamsey. Although the Government instituted a program of local consultation in environmental and mining policymaking in the 1990s, the venues intended to discuss and resolve ASGM-related issues—District Environmental Management Committees (DEMCs), District Small-Scale Gold Mining Centres, District Committees on Illegal Mining (DCIMs)—are underfunded and unable to attain their mandate.
● Community participation: Policies, laws and regulations, and alternative livelihood efforts have failed to curb galamsey thus far in part because they have not sufficiently accounted for community dynamics and long-term objectives (Afriyie et al., 2016).
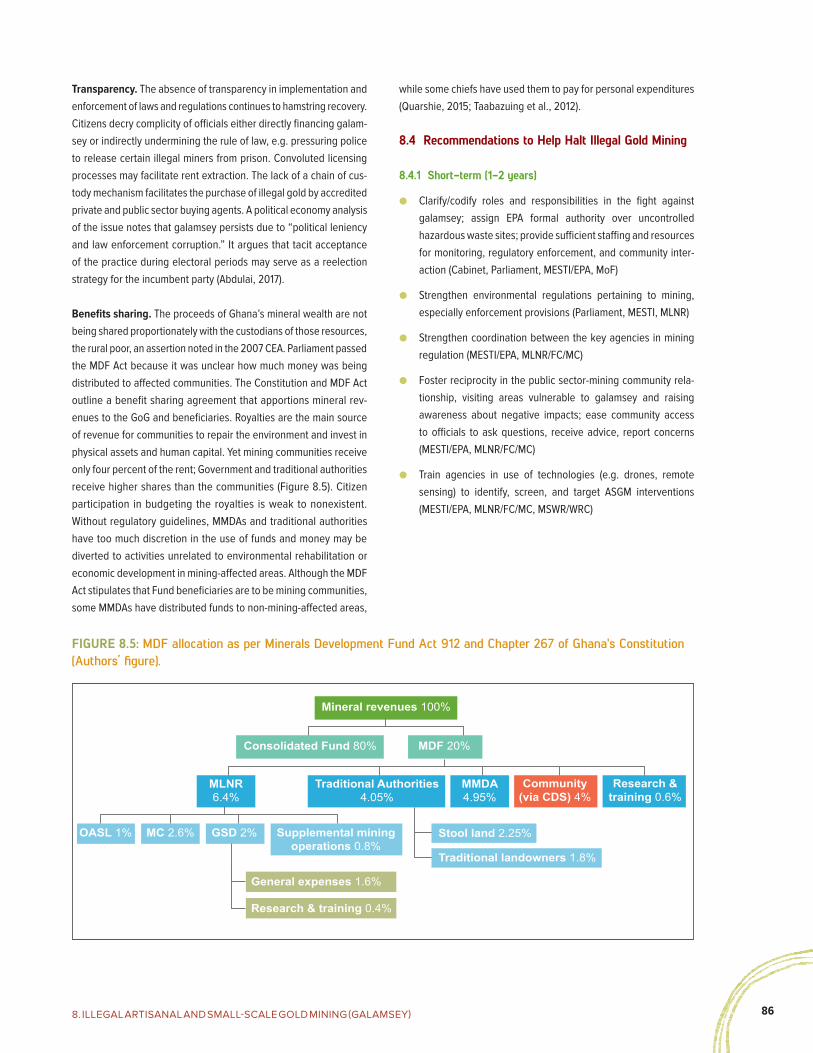
868. illegal arTisanal and small-sCale gold mining (galamsey)
Mineral revenues 100%
Consolidated Fund 80%
MLNR6.4%
OASL 1% MC 2.6% GSD 2%
General expenses 1.6%
Research & training 0.4%
Supplemental miningoperations 0.8%
Traditional Authorities4.05%
MMDA4.95%
Community(via CDS) 4%
Research &training 0.6%
MDF 20%
Stool land 2.25%
Traditional landowners 1.8%
FIGURE 8.5: MDF allocation as per Minerals Development Fund Act 912 and Chapter 267 of Ghana's Constitution (Authors’ figure).
Transparency. The absence of transparency in implementation and enforcement of laws and regulations continues to hamstring recovery. Citizens decry complicity of officials either directly financing galam-sey or indirectly undermining the rule of law, e.g. pressuring police to release certain illegal miners from prison. Convoluted licensing processes may facilitate rent extraction. The lack of a chain of cus-tody mechanism facilitates the purchase of illegal gold by accredited private and public sector buying agents. A political economy analysis of the issue notes that galamsey persists due to “political leniency and law enforcement corruption.” It argues that tacit acceptance of the practice during electoral periods may serve as a reelection strategy for the incumbent party (Abdulai, 2017).
Benefits sharing. The proceeds of Ghana’s mineral wealth are not being shared proportionately with the custodians of those resources, the rural poor, an assertion noted in the 2007 CEA. Parliament passed the MDF Act because it was unclear how much money was being distributed to affected communities. The Constitution and MDF Act outline a benefit sharing agreement that apportions mineral rev-enues to the GoG and beneficiaries. Royalties are the main source of revenue for communities to repair the environment and invest in physical assets and human capital. Yet mining communities receive only four percent of the rent; Government and traditional authorities receive higher shares than the communities (Figure 8.5). Citizen participation in budgeting the royalties is weak to nonexistent. Without regulatory guidelines, MMDAs and traditional authorities have too much discretion in the use of funds and money may be diverted to activities unrelated to environmental rehabilitation or economic development in mining-affected areas. Although the MDF Act stipulates that Fund beneficiaries are to be mining communities, some MMDAs have distributed funds to non-mining-affected areas,
while some chiefs have used them to pay for personal expenditures (Quarshie, 2015; Taabazuing et al., 2012).
8.4 Recommendations to Help Halt Illegal Gold Mining
8.4.1 Short-term (1-2 years)
● Clarify/codify roles and responsibilities in the fight against galamsey; assign EPA formal authority over uncontrolled hazardous waste sites; provide sufficient staffing and resources for monitoring, regulatory enforcement, and community inter-action (Cabinet, Parliament, MESTI/EPA, MoF)
● Strengthen environmental regulations pertaining to mining, especially enforcement provisions (Parliament, MESTI, MLNR)
● Strengthen coordination between the key agencies in mining regulation (MESTI/EPA, MLNR/FC/MC)
● Foster reciprocity in the public sector-mining community rela-tionship, visiting areas vulnerable to galamsey and raising awareness about negative impacts; ease community access to officials to ask questions, receive advice, report concerns (MESTI/EPA, MLNR/FC/MC)
● Train agencies in use of technologies (e.g. drones, remote sensing) to identify, screen, and target ASGM interventions (MESTI/EPA, MLNR/FC/MC, MSWR/WRC)

87
● Deploy interagency teams to identify, assess, and monitor potential threats that galamsey sites pose to health and envi-ronment; classify sites according to a hazard ranking system (like AKOBEN), and use the rankings to develop a list of prior-ity cleanup sites; make information publicly available with signage (MESTI/EPA, MLNR/MC/FC, MSWR/WRC)
● Accelerate implementation of Minamata Convention commit-ments, including Ghana’s National Action Plan; raise aware-ness of hazards linked to mercury; regulate mercury at its source (entry into country; wholesale/retail sale) as opposed to end-user level; introduce and promote mercury-free process-ing technologies in legal ASGM (MESTI/EPA; MLNR/MC)
● Operationalize MDF guidelines to improve benefits shar-ing, public participation, transparency; author provisions that ensure MDF funds are spent on mining communities, e.g. commit a percentage of royalties to local infrastructure or other capital expenditures; prevent MMDAs from diverting MDF money to communities not affected by mining; hold obligatory stakeholder consultations/Assembly Meetings open to public comment (Parliament, MLGRD/MMDAs, MoF/GRA)
8.4.2 Medium-term (2-5 years)
● Establish a comprehensive mining permitting and monitoring system, with rigorous checks and field inspections (MESTI/EPA, MLNR/FC, MLNR/MC, MSWR/WRC)
● Undertake monitoring of MDF activities to ensure that, espe-cially in the case of the CDS, projects have public backing and activities target ASGM-affected areas; prepare/publish guide-lines for the Fund Administrator to clarify responsibilities to the citizenry and Government (Cabinet, MLGRD/MMDAs, MLNR, MoF/GRA)
● Establish a galamsey environmental trust fund (TF) to restore Ghana’s environment and rural mining areas: replenish initially via taxes/royalties collected from large-scale miners by dedicating a percentage of the Consolidated Fund for a finite period or having both the Consolidated Fund and the MDF contribute a percentage of their royalties to the new TF (Cabinet, Parliament, MoF/GRA)
● Institute legal guidelines that allow judicial remedies for recov-ery of cleanup costs from those parties responsible for the damages, e.g. use proceeds from the auctioning of confiscated galamsey equipment to replenish the environmental TF (MoJ)
● Expand the MMIP to include job skills training initiatives that teach environmental handling skills, e.g., soil/water testing, handling of toxic chemicals, sanitation, operation of dump trucks/heavy equipment; build human capital in environ-mental management and transition this workforce to other hazardous waste management projects nationwide, e.g. solid waste management/sanitation in urban areas, rehabilitation of e-waste sites, work with industrial enterprises (MESTI/EPA, MLNR)
8.4.3 Long-term (5+ years)
● Use MDF proceeds to expedite clean-up and remediation and prepare the path for rehabilitation and redevelopment; engage with local stakeholders to foster high levels of citizen partici-pation; encourage partnerships with the private sector (MESTI, MLGRD/MMDAs, MLNR)
● Reclaim galamsey brownfields and turn them into economi-cally productive assets available for community revitalization (MESTI, MLGRD/MMDAs, MLNR, MWH)
● Engage communities to ensure long-term stewardship over areas vulnerable to illegal mining: write Community Engagement Action Plans to delineate the expectations and roles and responsibilities of stakeholders in preventing illegal ASGM, enhance District offices' engagement with local commu-nities and other relevant parties, facilitate inclusive participa-tion in decision-making on land rehabilitation and hazardous substance management (MESTI/EPA/LUSPA, MLGRD/MMDAs, MLNR/FC/MC)
● Empower institutions to perform watchdog roles in the over-sight of funding spent, including by customary authorities, to guarantee efficient and wise implementation of development projects (Quarshie, 2015) (MoF, MLNR/OASL)
● Establish a series of performance indicators to create a score-card to judge social, environmental, and economic progress in rehabilitating contaminated public spaces (MESTI/EPA)
● Implement an ongoing performance monitoring and evalua-tion scheme to follow redevelopment and analyze long-term stewardship and find ways to continue financial and technical support (MESTI, MLNR, MWH)
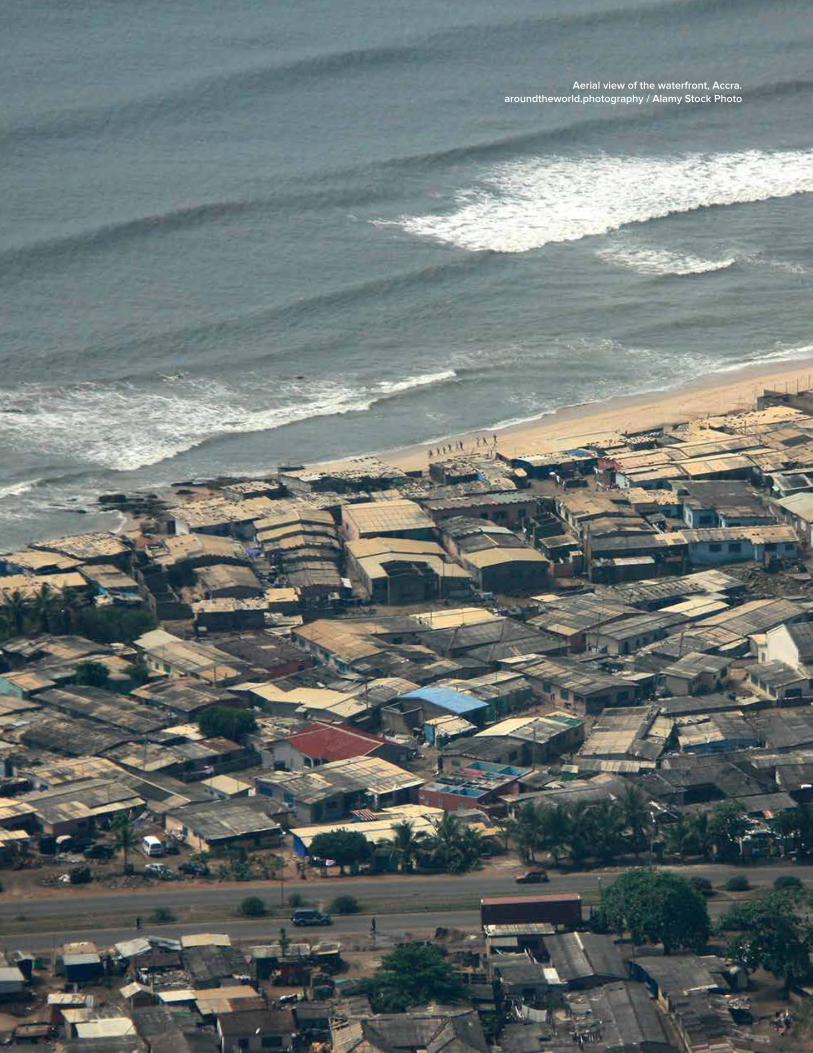
888. illegal arTisanal and small-sCale gold mining (galamsey)
Aerial view of the waterfront, Accra. aroundtheworld.photography / Alamy Stock Photo

89
9
909. CoasTal eCosysTem
Ghana’s coastal zone, representing around 6 percent of the country’s land area, is a high energy envi-ronment with flood-prone lowlands (MLNR et al., 2015). The zone spans four regions—Greater Accra, Volta, Central, and Western—and hosts over a quarter of the nation’s popu-lation. It has 550 km of coastline, a 20,900 km2 continental shelf, and 218,100 km2 of exclusive economic zone, the fifth largest in West Africa (MESTI, 2019). One-tenth of a percent of Ghana’s territorial waters are clas-sified as marine protected areas.
Along the coast there are about 90 lagoon systems. Several areas along the coast have been designated as wetlands of international importance (Ramsar sites85), with the Anlo-Keta Lagoon Complex as the largest at 1,278 km². These wetlands are rich in biodiversity because they serve as nursery grounds for many marine fish and crustacean species, harbor important bird life, both resident and migratory, and serve as nesting grounds for five species of globally endangered [as classified by the International Union for Conservation of Nature (IUCN)] marine turtles: leatherback (Dermochelys coricea), loggerhead (Caretta caretta), olive ridley (Lepidochelys olivacea), hawksbill (Eretomychelys imbricata), and green turtle (Chelonia mydas). Mangroves in Ghana occupy a very narrow, non-continuous coastal area, occurring along the lagoons and extending from east to west. The mangroves provide habitat to the threatened West African manatee (Trichechus senegalensis) and the soft-skinned turtle
9. Coastal Ecosystem
AYA (“water fern”): endurance in
the face of uncertainty
9.1 The Coastal Zone and its Resources
(Trionyx triunguis). In addition to its importance for biodiversity, the Ghanaian coast is marked by important historical monuments, three of which, at Cape Coast and Elmina, are designated as UNESCO86 World Heritage sites. These sites are significant for both domestic and international tourism due to their rich and significant history.
Ghana’s coast faces several challenges, including coastal erosion and flooding, overexploitation of natural resources, marine and coastal pollution, illegal sand mining, loss of biodiversity and ecosystem services, severe weather, and rapid urbanization and unsustain-able land use. These challenges degrade the coast, endanger eco-systems, put human livelihoods and well-being at risk, undermine economic potential, and increase vulnerability to natural disasters (Table 9.1). The threats posed by these challenges will further increase due to rapid population growth and the impacts of climate change. Between 1990 and 2010, built-up area (i.e. land with development on it) between the shoreline and a line 10 km inland doubled at a rate of 3.6 percent/year.
Ghana loses about 2.7 million m2 of its shore every year,87 with 80 percent of the shoreline actively eroding (Appeaning Addo et al., 2008). Erosion rates range from 4-12 m/year, with the sandy beaches on the East Coast receding at about 8 m/year. Hotspots include the narrow beaches around Tema and the Keta dike with its artificial lagoon outlet (Figure 9.1). Coastal erosion is particularly serious in and near Accra where sea-level rise has increased erosion intensity and inundation of vulnerable areas. Nearly 80 percent of the Greater Accra Metropolitan Area’s (GAMA) 225 km shoreline is threatened by erosion. By 2100, the coastline is expected to retreat by between 189-202 meters.
85. Article 2.1 of the Convention on Wetlands (held in Ramsar, Iran in 1971), establishes a List of Wetlands of International Importance, populated by signatory nations using wetlands within their territory selected “on account of their international significance in terms of ecology, botany, zoology, limnology or hydrology.” Wetlands included in the List are recognized by the international community as being of significant value for all humankind (https://www.ramsar.org/sites/default/files/documents/library/sitelist.pdf).
86. United Nations Educational, Scientific and Cultural Organization
87. MESTI minister quoted in www.modernghana.com/news/697008/ghana-marks-world-oceans-day.html

91
Indicator Measurement 2010 figures
Land area where elevation is below 5 meters
% of total land area (sq.- km) 0.56
Of which, urban 0.06 (128.21 km2)
Of which, rural 0.5 (1170.14 km2)
Population living in areas where eleva-tion is below 5 meters
% of total population 2.6
Of which, urban 1.8
Of which, rural 0.8
Table 9.1: Coastal zone indicators (World Bank WDI database).
Erosion has devastated communities, destroyed houses, businesses, and infrastructure, threatened cultural heritage, and undermined tour-ism. In Accra, Appeaning Addo et al. (2011) foresee 650,000 people, 900+ buildings, and a total area of about 0.80 km2 of land vulnerable to permanent inundation by the year 2100. Loss of coastal land is also contributing to displacement and migration. The erosion of natural fish landing sites has resulted in fishers migrating physically--to other communities within and outside of Ghana in search of better fish stocks—and economically—to alternative livelihoods such as illegal beach sand mining (Appeaning Addo and Appeaning Addo, 2016).
Uncontrolled urban and peri-urban development, including building in waterways, has contributed to flooding of coastal communities with severe consequences. Weak enforcement of planning stan-dards and building codes has resulted in incompatible land uses and buildings dangerously encroaching the banks of streams and drains. Due to unplanned expansion of the city, infiltration capacities
of basin surfaces—i.e. the maximum amount of water that can enter the soil before runoff occurs—have been dramatically reduced. Urban planning and infrastructure issues—especially hydraulic, solid waste management, and transport infrastructure—exacerbate Ghana’s vul-nerability to flooding. For example, Greater Accra’s hydraulic infra-structure, namely drainage and coastal zone management, is highly vulnerable, with design flaws in transport infrastructure contributing to its failure, e.g. improper installation of concrete cover slabs on roadside drains that break and block water flow, or improper assess-ment of runoff patterns and flow regimes during road infrastructure design (World Bank, 2017). Flooding in coastal areas is compounded by inadequate solid waste management, sea-level rise, tidal waves, and storm surges, with downstream effects on cultural heritage, bio-diversity, and livelihoods, among others. With no active management, sea-level rise alone could contribute to the movement of Ghana’s eastern shoreline approximately 50-250m landward over the next 50 years in different locations (Boateng, 2012).
TOGO
G H A N A
CÔTE D
'IVOIRE
G u l f o f G u i n e aEsamang
Axim
Prince’s Town Aketechi
Dixcove
AdjuaAmanful Kuma
ShamaKomenda
Kokrobite
Bortianor
Nungua Teshie
TemaPrampram
Old Ningo
Ada Dzito
Keta
Labadi
Elmina
Tantuam
Senya Breku
ACCRA
0 50 Kilometers
Low Under protection/being protected
Direction of Littoral DriftModerate
High
EROSION SEVERITY
IBRD 44986 | APRIL 2020
Figure 9.1: Coastal erosion hotspots (Angnuureng et al., 2013).

929. CoasTal eCosysTem
Accra is particularly susceptible to flooding, with a flood occurrence rate of 17-20 percent in any given year (Figure 9.2) (Asumadu-Sarkodie et al., 2015). Rapid urbanization specifically has negatively impacted the infiltration capacity of Accra’s natural drainage basin system. Owing to poor solid waste management, drains are commonly used to dispose of garbage and sewerage, leaving drainage channels choked up and reducing their discharge capacity. Blockage of free flow streams and drains makes low-lying neighborhoods—often the poorest in the city—vulnerable to flooding during heavy precipita-tion. Silting in lagoon outlets makes flooding a perennial threat in GAMA (Figure 9.3) (World Bank, 2017). In 2015, Accra experienced an unprecedented flood coupled with an explosion at a fuel and gas station that killed more than 152 people. The flood was attributed to inadequate waste management, structural settlement, and poor hydraulic performance of the basins in the city.
Pollution in the coastal areas is not only a serious threat to the coastal ecosystem but also to residents who depend on the coastal environment. Marine pollution is an increasing cause for concern in Ghana, especially due to the high economic dependence on coastal industries such as fisheries and tourism. The sources of such marine pollution are seemingly due to poor management of solid, liquid, mining, and industrial waste. Accra generates nearly 900,000 metric tons of solid waste per year, with a generation rate of approximately 0.5 kg/person/day (Samwine, 2017). The city does not have the infrastructure capacity to manage this waste and it is estimated that only 75 percent of all generated trash is collected daily. The rest is dumped in open spaces, surface drains, and bodies of water, much of which flows into the Korle Lagoon, with its direct outlet to the Gulf of Guinea. The lagoon is a major run-off water receptacle through which uncontrolled discharges of domestic and industrial waste and untreated sewage and wastewater end up in
Figure 9.2: Flood risk map of Accra Metropolitan Area (City of Accra) (Centre for Remote Sensing and GIS (CERSGIS), University of Ghana, Accra, July–August 2013, cited in Amoako and Frimpong Boamah, 2015).
Figure 9.3: Flood-prone areas and types of floods in Greater Accra Plains (Kagblor, 2010 cited in Amaoko and Frimpong Boamah, 2016)
A C C R A
Ga South
Ga East Adenta
Accra Metropolis
Ga Central Municipal
GaWest
La Dade Kotopon
Ledzokuku/Krowor
Gulf of Guinea
A C C R A
Ga South
Ga East Adenta
Accra Metropolis
Ga Central Municipal
GaWest
La Dade Kotopon
Ledzokuku/KroworMAJOR ROADS
DISTRICT BOUNDARIES
FLOOD RISK
VERY LOW
LOW
MEDIUM
HIGH
VERY HIGH
0 1 2 KilometersIBRD 44989 | APRIL 2020
A C C R AGa South
Ga East Adenta
AccraMetropolis
Ga Central Municipal
GaWest
La Dade Kotopon
Ledzokuku/Krowor
Gulf of Guinea
A C C R AGa South
Ga East Adenta
AccraMetropolis
Ga Central Municipal
GaWest
La Dade Kotopon
Ledzokuku/Krowor
MAJOR ROADS
DISTRICT BOUNDARIES
FLOOD RISK
FLOOD PRONE AREA
FREQUENT FLOODING
NATURAL FLOOD AREA
0 1 2 KilometersIBRD 44990 | APRIL 2020
Kids play in boats in Jamestown Fishing Village in Accra.
Dominic Chavez/World Bank
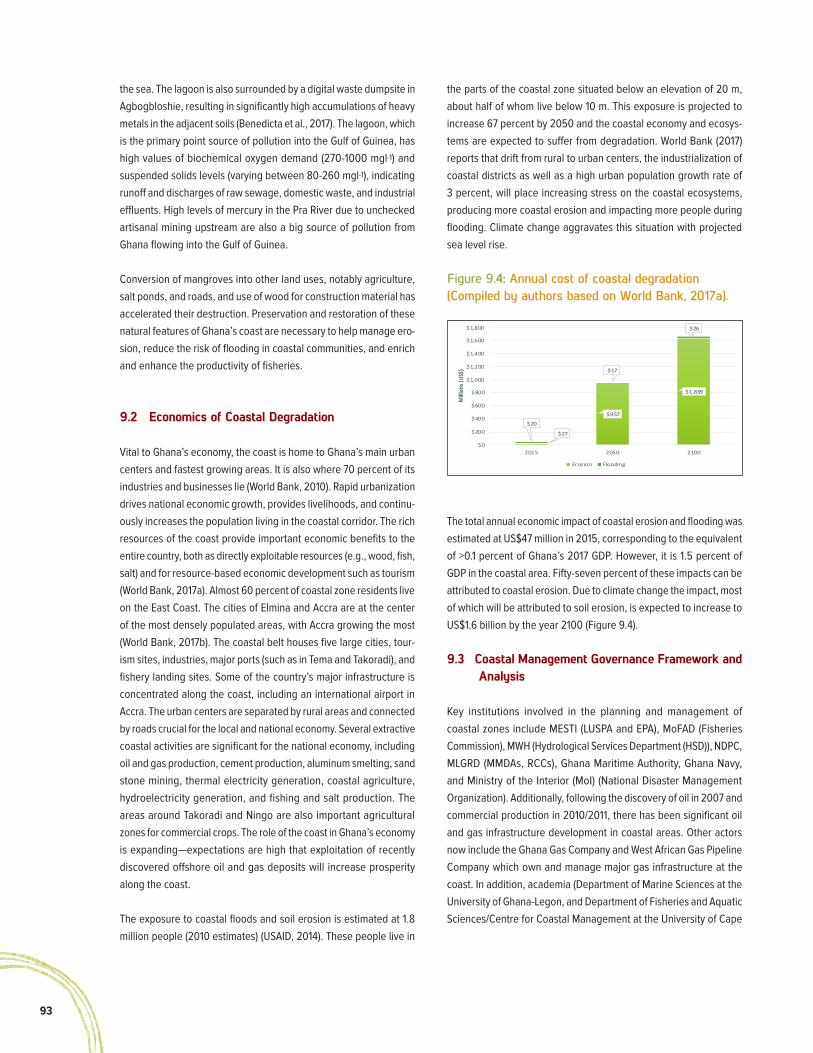
93
the parts of the coastal zone situated below an elevation of 20 m, about half of whom live below 10 m. This exposure is projected to increase 67 percent by 2050 and the coastal economy and ecosys-tems are expected to suffer from degradation. World Bank (2017) reports that drift from rural to urban centers, the industrialization of coastal districts as well as a high urban population growth rate of 3 percent, will place increasing stress on the coastal ecosystems, producing more coastal erosion and impacting more people during flooding. Climate change aggravates this situation with projected sea level rise.
The total annual economic impact of coastal erosion and flooding was estimated at US$47 million in 2015, corresponding to the equivalent of >0.1 percent of Ghana’s 2017 GDP. However, it is 1.5 percent of GDP in the coastal area. Fifty-seven percent of these impacts can be attributed to coastal erosion. Due to climate change the impact, most of which will be attributed to soil erosion, is expected to increase to US$1.6 billion by the year 2100 (Figure 9.4).
9.3 Coastal Management Governance Framework and Analysis
Key institutions involved in the planning and management of coastal zones include MESTI (LUSPA and EPA), MoFAD (Fisheries Commission), MWH (Hydrological Services Department (HSD)), NDPC, MLGRD (MMDAs, RCCs), Ghana Maritime Authority, Ghana Navy, and Ministry of the Interior (MoI) (National Disaster Management Organization). Additionally, following the discovery of oil in 2007 and commercial production in 2010/2011, there has been significant oil and gas infrastructure development in coastal areas. Other actors now include the Ghana Gas Company and West African Gas Pipeline Company which own and manage major gas infrastructure at the coast. In addition, academia (Department of Marine Sciences at the University of Ghana-Legon, and Department of Fisheries and Aquatic Sciences/Centre for Coastal Management at the University of Cape
the sea. The lagoon is also surrounded by a digital waste dumpsite in Agbogbloshie, resulting in significantly high accumulations of heavy metals in the adjacent soils (Benedicta et al., 2017). The lagoon, which is the primary point source of pollution into the Gulf of Guinea, has high values of biochemical oxygen demand (270-1000 mgl-1) and suspended solids levels (varying between 80-260 mgl-1), indicating runoff and discharges of raw sewage, domestic waste, and industrial effluents. High levels of mercury in the Pra River due to unchecked artisanal mining upstream are also a big source of pollution from Ghana flowing into the Gulf of Guinea.
Conversion of mangroves into other land uses, notably agriculture, salt ponds, and roads, and use of wood for construction material has accelerated their destruction. Preservation and restoration of these natural features of Ghana’s coast are necessary to help manage ero-sion, reduce the risk of flooding in coastal communities, and enrich and enhance the productivity of fisheries.
9.2 Economics of Coastal Degradation
Vital to Ghana’s economy, the coast is home to Ghana’s main urban centers and fastest growing areas. It is also where 70 percent of its industries and businesses lie (World Bank, 2010). Rapid urbanization drives national economic growth, provides livelihoods, and continu-ously increases the population living in the coastal corridor. The rich resources of the coast provide important economic benefits to the entire country, both as directly exploitable resources (e.g., wood, fish, salt) and for resource-based economic development such as tourism (World Bank, 2017a). Almost 60 percent of coastal zone residents live on the East Coast. The cities of Elmina and Accra are at the center of the most densely populated areas, with Accra growing the most (World Bank, 2017b). The coastal belt houses five large cities, tour-ism sites, industries, major ports (such as in Tema and Takoradi), and fishery landing sites. Some of the country’s major infrastructure is concentrated along the coast, including an international airport in Accra. The urban centers are separated by rural areas and connected by roads crucial for the local and national economy. Several extractive coastal activities are significant for the national economy, including oil and gas production, cement production, aluminum smelting, sand stone mining, thermal electricity generation, coastal agriculture, hydroelectricity generation, and fishing and salt production. The areas around Takoradi and Ningo are also important agricultural zones for commercial crops. The role of the coast in Ghana’s economy is expanding—expectations are high that exploitation of recently discovered offshore oil and gas deposits will increase prosperity along the coast.
The exposure to coastal floods and soil erosion is estimated at 1.8 million people (2010 estimates) (USAID, 2014). These people live in
Figure 9.4: Annual cost of coastal degradation (Compiled by authors based on World Bank, 2017a).
$27
$957
$1,639
$20
$17
$26
$0
$200
$400
$600
$800
$1,000
$1,200
$1,400
$1,600
$1,800
2015 2050 2100M
illion
s (US
$)Erosion Flooding

949. CoasTal eCosysTem
Wildlife conservation Wildlife Conservation Regulations, 1971 revised 1999 (L.I. 685); Wildlife Reserves Regulations, 1971 (L.I. 710); Wildlife Conservation Policy, 1974; Forest and Wildlife Policy adopted in 1994; Forestry Commission Act, 1999; Wild Animals Preservation Act of 1961
Fisheries resources protection Fisheries Law 1991 (PNDCL 256); Fisheries Commission Act 1993 (Act 457); Fisheries Development and Management Bill, 1996; Fisheries Decree, 1972 (amended 1977, 1984)
Oil and gas development Petroleum (Exploration and Production) Law, 1984 (PNDCL 84); Minerals (Oil and Gas) Regulations 1963 (L.I. 258); Oil in Navigable Waters Act, 1964 (Act 233)
Environmental management Beaches Obstruction Ordinance 1897 (Cap 240); Draft Coastal Zone Management Law; Environ-mental Protection Agency Act, 1994 (Act 490); Environmental Assessment Regulations 1999 (L.I. 1652); Land Planning and Soil Conservation Ordinance, 1953 (No. 32); Water Resources Act, 1997; Water Resources Commission Act, 1996 (Act 522); National Land Policy, 1999; Wetland Manage-ment (Ramsar Sites) Regulations, 1999 (L.I. 1659)
Table 9.2: Legislation pertaining to the coastal zone of Ghana
Coast), NGOs, civil society organizations, as well as bilateral and multilateral donors.
LUSPA, under MESTI, is in charge of planning, management and promotion of growth and development of cities, towns, and villages; it plays a key role in coastal protection given the need of steward-ing the growth of coastal human settlements and protecting them. At the regional level it works with RCCs and MMDAs to materialize the NDPC’s strategic planning vision. Protection, management, and development of drainage and coastal zone infrastructure is arranged and executed by MMDAs through their Medium-Term Development Plans. The HSD, an agency under MSWR, has the responsibility of programming and coordination of coastal protection works, the construction and maintenance of storm drains and the monitoring and evaluation of surface water bodies in respect of floods. The Lands Commission plays a role regarding potential relocations due to coastal flooding. It produces maps of coastal areas and monitors sea level rise. The LC’s Geological Survey Department (GSD) gener-ates and disseminates geoscientific data and information includ-ing coastal sensitivity maps. To deal with disaster risk, generally, including coastal areas, there is the National Disaster Management Organisation (NADMO).
There are three major areas of policies in the sector: (i) integrated coastal zone management and sustainable development; (ii) marine environmental protection; and (iii) sustainable use and conservation of biological marine resources. Important plans under these policy areas include: Coastal Zone Management Indicative Plan (1990), National Environmental Action Plan (1994), Integrated Coastal Zone Plan (1998), Coastal Zone Profile of Ghana (1998), National Oil Spill Contingency Plan—with specific reference to the marine environment (2002), and Environmental Sensitivity Map of the Coastal Areas of Ghana (1999 and 2004).
The GoG recently passed the Coastal Development Authority Act, 2017 (Act 963), which creates a Coastal Development Authority under the Ministry of Special Development Initiatives (MSDI), and which is in charge of socioeconomic development in Greater Accra, Central, Western, and Volta Regions. This includes a mandate to develop the coastal areas of said Regions. The country also has the Marine Pollution Act (Act 932), 2017 to address regulations to prevent pol-lution by oil, noxious liquid substances in bulk, harmful substances carried by the sea, sewage, and garbage and air pollution from ships. As part of Ghana’s commitment to international efforts, the nation recently ratified the London Convention (1972), which aims to control all manner of marine pollution and to take all practicable steps to prevent pollution of the sea by dumping of wastes and other matter. Other relevant laws are contained in Table 9.2.
9.3.1 Gaps and Challenges
Coastal zone governance needs reinforcement. For coastal eco-systems to continue to support economic growth, there is a need to strengthen environmental governance through the development of coastal management. Integrated coastal management policy and practice is not yet well established. Furthermore, challenges related to the number of agencies involved have resulted in weak coordina-tion, planning, and enforcement of coastal management policies and regulations; this is on top of low institutional capacity and insufficient financial resources (especially in disaster risk management agencies like NADMO) (World Bank, 2017). The absence of a forum/platform for coastal issues and investment projects can be discussed in an inclusive manner is another weak point. Lack of inclusiveness in coastal zone management has led to poor awareness among local residents as to the increased risks of flooding posed by poor solid waste management, unregulated sand mining, and application of construction setbacks (distance from the coast within which it is

95
prohibited to build), as well as an overall lack of buy-in to coordinated action against coastal degradation.
Issues of data. As is the case in many environmental management subsectors in Ghana, coastal zone data collection, standardization (across sectors), analysis and dissemination to decision makers is not being routinely undertaken or effectively accomplished. The knowl-edge base on causes and consequences of coastal environmental degradation in Ghana needs to be broadened and integrated to com-prehensively monitor the coastline and generate the real-time data
necessary to help preserve the zone. Critically missing data includes beach profiles and crest elevation to determine how natural hazards affect the coast, as well as local demographic and economic data to estimate potential damage and evaluate options to reduce risk. Research must also be diversified geographically, i.e. channeled from known hotspots where research inquiries have already been con-ducted and towards areas that have been heretofore neglected. This will require resources and commitment, though national universities are already engaged in studying these issues and can the necessary technical knowhow.
Box 9.1: Using Mangroves and Sea Dikes as First Line of Coastal Defense in Vietnam
As part of an integrated climate resilience and sustainable liveli-hoods project, Vietnam and the World Bank are implementing an infrastructure project that utilizes mangroves and sea dikes to protect coastal communities in the Mekong Delta from flood-ing and erosion. The Mekong Delta is densely populated and home to 22 percent of Vietnam’s population, most of whom are near-poor households living in rural coastal areas, highly dependent upon rice or shrimp farming for their livelihoods. Recent urbanization and intensification of agriculture and aqua-culture production are among the rapid changes occurring that are increasing economic growth while simultaneously creating unsustainable land and water resource use issues. Furthermore, the region is facing increased saline intrusion, erosion, and flooding from land subsidence and sea-level rise, with effects on the livelihoods of Mekong Delta communities, as well as dis-ruptions to the Delta’s natural sedimentation process because of upstream hydropower development.
In 2016, the Government of Vietnam and World Bank developed the Mekong Delta Integrated Climate Resilience and Sustainable Livelihoods (MD-ICRSL) Project to strengthen integrated climate-resilient management and development across different sectors and institutional levels in the Mekong Delta. The MD-ICRSL consists of a host of measures in different hydro-ecological subregions and requires a complex coordination and imple-mentation arrangement spanning ministries, provinces, com-munities, research agencies, and development partners. The International Development Association, the Global Environment Facility Adaptation Fund, and the Government of Vietnam are financing the US$387 million MD-ICRSL project. The project’s components primarily help address coastal flooding and ero-sion, as well as salinity intrusion and impacts on aquaculture and mangrove systems to improve livelihoods of communities living in the coastal areas.
Although natural mangroves play an important role in ecosys-tem productivity and in protecting coastal communities from storm surges, flooding, and coastal erosion the usual method employed to protect Vietnam’s coastline consists of construct-ing sea dikes, often reinforced with rocks or concrete. The mangroves have rapidly declined over time, and so have the ecosystem defense services they provide, primarily due to poorly planned and unregulated shrimp farming and urban development, as well as an absence of regulations and institu-tions that oversee integrated coastal management. Increased fragmentation of mangroves has reduced their capacity to with-stand coastal processes, such as wave actions, coastal currents, and wind at exposed and semi-exposed coastline locations.
Enter the MD-ICRSL, which supports a “green-gray” infrastruc-ture approach—a combination of nature-based and manmade solutions—for coastal protection The project is establishing a mangrove belt outside the sea dike to serve as a first line of defense, followed by new sea dikes (where appropriate), and then a more extensive inland mangrove belt. Additional subprojects include construction of coasta defenses made from compacted earth embankments interspersed among coastal mangrove belts. At the same time, the project is encouraging coastal shrimp farmers to shift from intensive shrimp farming—a risk-prone business due to concerns such as shrimp disease and storms—to a mixed shrimp-mangrove system. Converting to the mangrove-based system creates opportunities for shrimp farmers to become internationally certified in sustainable sea-food production, from which they obtain a premium market price (and hence increased household revenue). Less intensive, more natural shrimp cultivation also reduces shrimp disease, thus providing a safeguard against a potential shock to income generation. A shift into certified organic mangroves was esti-mated to generate annual net benefits of $992 per hectare per year compared to current practices.
Source: Browder et al., 2019.

969. CoasTal eCosysTem 96
9.4 Recommendations to Protect Ghana’s Coastline
9.4.1 Short-term (1-2 years)
● Use gap analysis in policy/regulatory frameworks, enforce-ment, and coastal zone master plan to identify weaknesses and explore additional soft measures for improved coastal management, planning (MESTI/EPA/LUSPA; MoFAD; MLGRD/MMDAs/RCCs; MWH/HSD)
● Support the nascent Coastal Development Authority (CDA) as a coordination mechanism for coastal resilience, protection, planning, investment; hold a series of coastal zone develop-ment workshops to map stakeholders and build a forum for coastal issues (MLGRD/MMDAs; MoF; MSDI88)
● Enhance use of geographic information systems and satellite imagery for coastal zone management (MESTI/EPA; MLGRD/MMDAs; MWH)
● Identify the most vulnerable coastal settlements/communi-ties—on the basis of socioeconomic status and environmen-tal risk criteria—and create a national priority list for hazard management and resilience (MESTI/EPA, MLGRD/MMDAs)
● Continue pursuit of a regional approach to coastal manage-ment through political and technical dialogue to maximize the value and impact of existing initiatives; collaborate with regional institutions such as the West African Economic and Monetary Union, ECOWAS, Abidjan Convention89, and West Africa Coastal Observatory90; participate in coastal observation in coordination with neighboring countries (as per commit-ments to the West Africa Coastal Observatory) (MESTI/EPA)
9.4.2 Medium-term (2-5 years)
● Improve drainage and flood control infrastructure and manage-ment systems by: i) mapping/demarcating the floodplains and buffer zones of all drainage-ways and enforcing regulations; ii) improving coordination between MDAs and MMDAs; iii) increasing annual operation and maintenance budgets for drainage systems and hydraulic infrastructure (MESTI/EPA; MLGRD/MMDAs; MLNR/LC; MoF; MSWR; MWH/HSD)
● Invest in and manage spatial planning of terrestrial and marine coastal areas through: i) urban planning (including where cities can/cannot be built); ii) marine planning (including off-shore activities, e.g. extractives, fishing); iii) delineation of setback lines and enforcement of regulations to prevent high-risk construction, development; iv) drafting a coastal zone master plan, (highlighting areas needing urgent management); v) a strategy for constructing green and grey infrastructure (MESTI/EPA/LUSPA; MLGRD/MMDAs; MLNR/FC/LC/MC; MoEP; MoFAD; MSDI/CDA; MWH; NDPC)
● Identify and secure areas to increase retention capacity and reduce runoff; zone green areas on floodplains for develop-ment (MESTI/EPA; MLGRD/MMDAs; MWH/HSD; MSWR/WRC)
● Analyze contribution of pollution from off-shore extractive and on-shore mining industries and determine appropriate regula-tions (MESTI/EPA; MoEP; MLNR/MC)
88. MSDI = Ministry of Special Development Initiatives
89. According to UNEP, the Convention for Cooperation in the Protection, Management and Development of the Marine and Coastal Environment of the Atlantic Coast of the West, Central and Southern Africa Region (Abidjan Convention, in short), covers a
marine area of 14,000 km from Mauritania to South Africa, providing an overarching legal framework for marine-related programs.
90. The West Africa Coastal Observatory is a joint initiative between the Government of France and the World Bank.

97
9.4.3 Long-term (5+ years)
● Construct public works combining nature-based solutions (green) and manmade (gray) infrastructure for shoreline protection: (green) coastal mangrove protection/management; planting of trees; mangroves, sea grass, other dune vegeta-tion; salt marsh protection; beach nourishment and cleaning; (gray) increase sea dikes; build/reinforce river dikes to protect ports and harbors (MESTI/EPA/LUSPA; MLGRD/MMDAs/RCCs; MoF; MSWR/WRC; MWH/HSD)
● Accommodate a changing coastline through measures such as: flood-proof building construction; avoidance of areas subject to liquefaction during earthquakes; resettlement of populations located in vulnerable peri-urban slums; implica-tion of communities in planning, implementation (MESTI/EPA/LUSPA; MLGRD/MMDAs/RCCs; MSWR/WRC; MWH/HSD)
● Establish a multi-sectoral program—leveraging Ghana’s blue economy for development—that provides direct financial support to coastal management and marshals resources for investments, technical assistance, data collection, and regional integration (MSDI/CDA; MDAs)
● Modernize hydromet/early warning services for end-to-end connectivity between service providers and users (MoC/GMet)
● Lend support to the national observatory on coastal issues (Centre for Coastal Management at University of Cape Coast) to: nurture coordinated research (specifically, to understand river/coastal sediment transport and management options); standardize, share, provide access to information; create link-ages with hydromet agencies; network with regional observa-tories (MESTI/EPA)
● Improve waste management in coastal urban areas to protect ecosystems (MLGRD/MMDAs; MSWR)
● Design new oil and gas development and related infrastructure and plan regional development in the oil-producing Western Region with climate change adaptation in mind (MESTI; MoEP; MWH)

989. CoasTal eCosysTem
A fisherman prepares his fishing nets in Jamestown Fishing Village in Accra,.
Dominic Chavez / World Bank

99
10

10010. sTaTus of fisheries resourCes
10. Status of Fisheries Resources
From the Gulf of Guinea and the Keta Lagoon to the Volta Lake and the Black and White rivers that feed it, fishing is a traditional source of livelihood for many Ghanaians. The fishing industry contributes signifi-cantly to food security and nutrition, employment and household income, and foreign exchange earnings. Small-scale, canoe fishing is critical to millions of individuals, families, and communities.
And yet, some predict the imminent collapse of Ghana’s capture fishing sector. There are indicators to support the sense of unease. A com-bination of low fishing catch yield and increasing human population has increased fish imports. Fish consumption per capita has declined steadily over the past decade and is down twenty percent to 21 kg (2016) (Figure 10.1). Between 1996-2016 landings of small pelagic
10.1 Features of Ghana’s Fisheries and Aquaculture Sector
FUNTUNFUNEFU (“two-headed crocodile sharing one stomach”):
unity and oneness in purpose
Figure 10.1: Fish consumption in Ghana (2006-2016) (FAO database).
91. Data comes from the MIT Observatory of Economic Complexity database: https://oec.world/en/profile/country/gha/.
15
17
19
21
23
25
27
29
2006 2007 2008 2009 2010 2011 2012 2013 2014 2015 2016
Kilo
gram
s, p
er c
apita
species—mainly anchovies, chub mackerel, and sardinellas, which are referred to as “the people’s fish” because of their importance to local economies and diets--decreased 86 percent, from 138,955 to 19,608 MT (MoFAD, 2018). For the past ten-plus years, over half the fish consumed in Ghana has come from imports (Figure 10.2). In 2017 around two-thirds of imports (of whole frozen fish) were from other African countries, including Mauritania (35 percent), Morocco (17 percent), and Angola (9.7 percent)91.
Ghana’s marine fisheries exhibit classic signs of overexploitation: declining catch rates and changes in the composition of key species that are caught, including a prevalence of small fish. Since fishing fleets look to capture similar pelagic and demersal fish stocks working in the same areas has often led to conflict among fishermen. Several converging factors explain this prototypical “tragedy of the commons” (Box 10.1). Proximate causes include a dearth of job opportunities in other sectors, coupled with an open-access regime, where the right to harvest fish is open to all. Direct causes of fisheries decline are fleet overcapacity, illegal fishing, and climate change.
The first direct factor, fleet overcapacity, has led to overexploitation and depleted stocks, especially in the marine subsector. Ghana's marine fisheries sector includes three main fleets: artisanal canoes, inshore and semi-industrial boats (wooden boats no greater than 30 m long, powered by inboard marine engines of 90-400 horsepower), and industrial vessels such as trawlers and tuna fishing vessels. The evidence shows fluctuating, but overall increasing numbers of industrial and semi-industrial (inshore) vessels, and artisanal canoes. Industrial vessels (excluding tuna vessels and shrimpers) contribute about one-third of total industrial landings. The large number of trawlers operating in Ghanaian waters suggests that fish stocks are biologically overfished, which could lead to an eventual collapse if they are not significantly reduced.
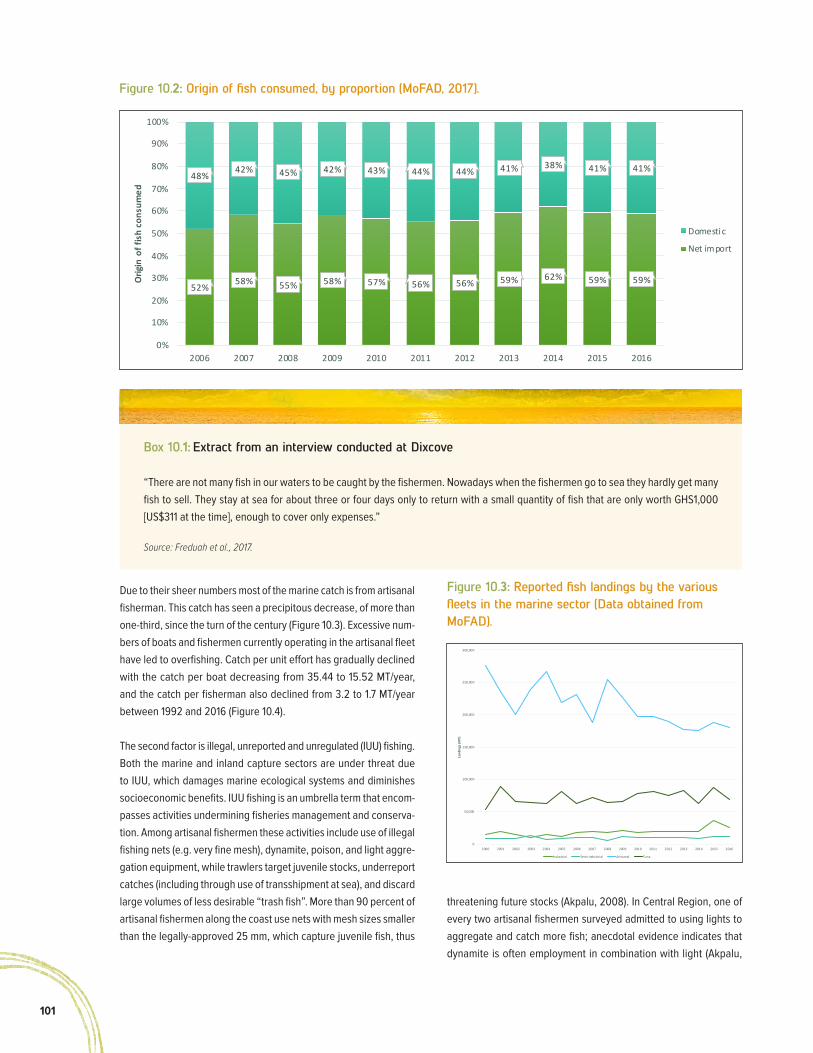
101
Box 10.1: Extract from an interview conducted at Dixcove
“There are not many fish in our waters to be caught by the fishermen. Nowadays when the fishermen go to sea they hardly get many fish to sell. They stay at sea for about three or four days only to return with a small quantity of fish that are only worth GHS1,000 [US$311 at the time], enough to cover only expenses.”
Source: Freduah et al., 2017.
Figure 10.2: Origin of fish consumed, by proportion (MoFAD, 2017).
Figure 10.3: Reported fish landings by the various fleets in the marine sector (Data obtained from MoFAD).
Due to their sheer numbers most of the marine catch is from artisanal fisherman. This catch has seen a precipitous decrease, of more than one-third, since the turn of the century (Figure 10.3). Excessive num-bers of boats and fishermen currently operating in the artisanal fleet have led to overfishing. Catch per unit effort has gradually declined with the catch per boat decreasing from 35.44 to 15.52 MT/year, and the catch per fisherman also declined from 3.2 to 1.7 MT/year between 1992 and 2016 (Figure 10.4).
The second factor is illegal, unreported and unregulated (IUU) fishing. Both the marine and inland capture sectors are under threat due to IUU, which damages marine ecological systems and diminishes socioeconomic benefits. IUU fishing is an umbrella term that encom-passes activities undermining fisheries management and conserva-tion. Among artisanal fishermen these activities include use of illegal fishing nets (e.g. very fine mesh), dynamite, poison, and light aggre-gation equipment, while trawlers target juvenile stocks, underreport catches (including through use of transshipment at sea), and discard large volumes of less desirable “trash fish”. More than 90 percent of artisanal fishermen along the coast use nets with mesh sizes smaller than the legally-approved 25 mm, which capture juvenile fish, thus
threatening future stocks (Akpalu, 2008). In Central Region, one of every two artisanal fishermen surveyed admitted to using lights to aggregate and catch more fish; anecdotal evidence indicates that dynamite is often employment in combination with light (Akpalu,
52%58% 55% 58% 57% 56% 56% 59% 62% 59% 59%
48%42% 45% 42% 43% 44% 44% 41% 38% 41% 41%
0%
10%
20%
30%
40%
50%
60%
70%
80%
90%
100%
2006 2007 2008 2009 2010 2011 2012 2013 2014 2015 2016
Orig
in o
f fis
h co
nsum
ed
Domestic
Net import
0
50,000
100,000
150,000
200,000
250,000
300,000
2000 2001 2002 2003 2004 2005 2006 2007 2008 2009 2010 2011 2012 2013 2014 2015 2016
Land
ings
(MT)
Industrial Semi-industr ial Artisanal Tuna
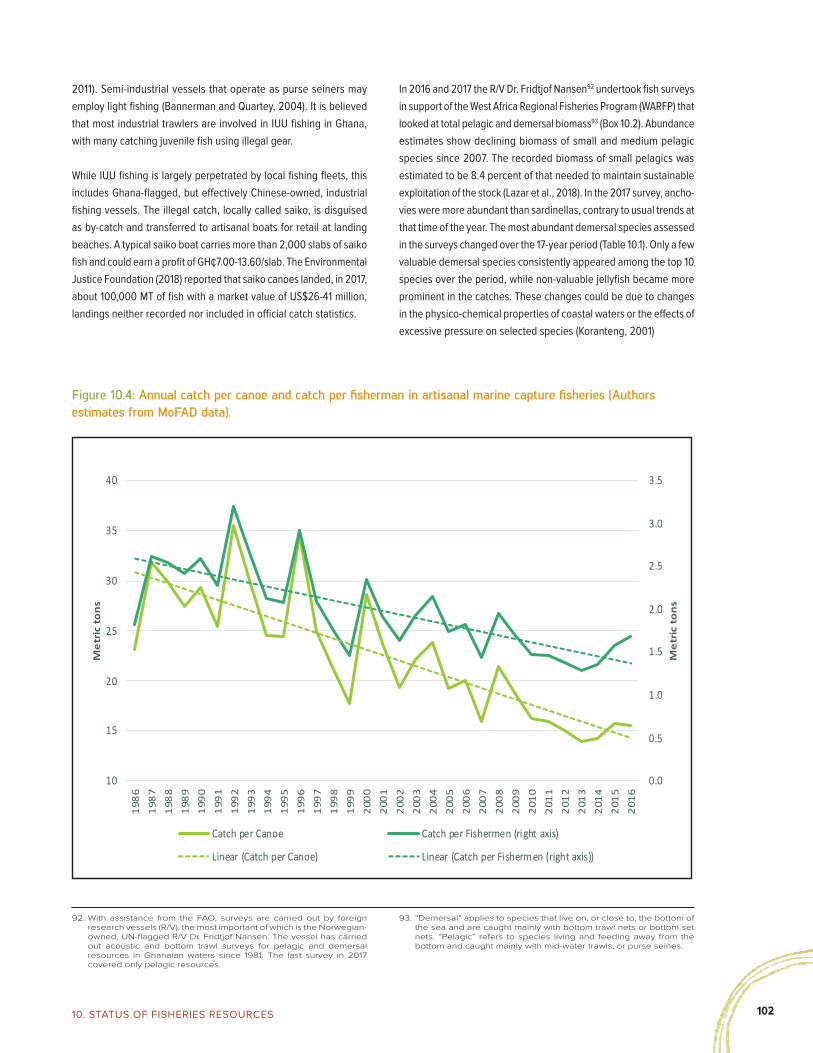
10210. sTaTus of fisheries resourCes
198
61
987
198
81
989
199
01
991
199
21
993
199
41
995
199
61
997
199
81
999
200
02
001
200
22
003
200
42
005
200
62
007
200
82
009
201
02
011
201
22
013
201
42
015
201
6
0.0
0.5
1.0
1.5
2.0
2.5
3.0
3.5
10
15
20
25
30
35
40
Me
tric
to
ns
Me
tric
to
ns
Catch per Canoe Catch per Fishermen (right axis)
Linear (Catch per Canoe) Linear (Catch per Fishermen (right axis))
Figure 10.4: Annual catch per canoe and catch per fisherman in artisanal marine capture fisheries (Authors estimates from MoFAD data).
2011). Semi-industrial vessels that operate as purse seiners may employ light fishing (Bannerman and Quartey, 2004). It is believed that most industrial trawlers are involved in IUU fishing in Ghana, with many catching juvenile fish using illegal gear.
While IUU fishing is largely perpetrated by local fishing fleets, this includes Ghana-flagged, but effectively Chinese-owned, industrial fishing vessels. The illegal catch, locally called saiko, is disguised as by-catch and transferred to artisanal boats for retail at landing beaches. A typical saiko boat carries more than 2,000 slabs of saiko fish and could earn a profit of GH¢7.00-13.60/slab. The Environmental Justice Foundation (2018) reported that saiko canoes landed, in 2017, about 100,000 MT of fish with a market value of US$26-41 million, landings neither recorded nor included in official catch statistics.
In 2016 and 2017 the R/V Dr. Fridtjof Nansen92 undertook fish surveys in support of the West Africa Regional Fisheries Program (WARFP) that looked at total pelagic and demersal biomass93 (Box 10.2). Abundance estimates show declining biomass of small and medium pelagic species since 2007. The recorded biomass of small pelagics was estimated to be 8.4 percent of that needed to maintain sustainable exploitation of the stock (Lazar et al., 2018). In the 2017 survey, ancho-vies were more abundant than sardinellas, contrary to usual trends at that time of the year. The most abundant demersal species assessed in the surveys changed over the 17-year period (Table 10.1). Only a few valuable demersal species consistently appeared among the top 10 species over the period, while non-valuable jellyfish became more prominent in the catches. These changes could be due to changes in the physico-chemical properties of coastal waters or the effects of excessive pressure on selected species (Koranteng, 2001)
92. With assistance from the FAO, surveys are carried out by foreign research vessels (R/V), the most important of which is the Norwegian-owned, UN-flagged R/V Dr. Fridtjof Nansen. The vessel has carried out acoustic and bottom trawl surveys for pelagic and demersal resources in Ghanaian waters since 1981. The last survey in 2017 covered only pelagic resources.
93. “Demersal” applies to species that live on, or close to, the bottom of the sea and are caught mainly with bottom trawl nets or bottom set nets. “Pelagic” refers to species living and feeding away from the bottom and caught mainly with mid-water trawls, or purse seines.

103
Species Survey year and rank
1999 2004 2010 2016
Bigeye grunt (Brachydeuterus auratus) 1 1 5 2
Cunene horse mackerel (Trachurus trecae) 2 4 1 6
Atlantic bumper (Chloroscombrus chrysurus) 3 10 - 7
Red pandora (Pagellus bellottii) 4 3 14 5
Common cuttlefish (Sepia officinalis) 5 11 7 8
Atlantic bigeye (Priacanthus arenatus) 6 2 4 -
African moonfish (Selene dorsalis) 7 5 - 16
Congo dentex (Dentex congoensis) 8 9 2 3
Lesser African threadfin (Galeoides decadactylus) 9 - - 15
Angolan dentex (Dentex angolensis) 10 - 8 -
Table 10.1: Top 10 demersal species off coast of Ghana (Data from selected surveys of the R/V Dr. Fridtjof Nansen).
Figure 10.5: Annual mean temperature coastal sea surface (at Tema) (MoFAD, 2018).
Figure 10.6: Annual major upwelling index (at Tema) (MoFAD, 2018)
The third direct factor is climate change. Alterations to marine eco-system conditions—ocean currents, temperature, upwelling, biogeo-chemistry, water salinity—affect fish production. Ocean temperatures have risen, especially in tropical countries, as has ocean acidification, negatively affecting global fish catch rates (Cooley and Doney, 2009; Sumaila et al., 2011). In the Gulf of Guinea, the location of Ghana’s territorial waters, oceanographic conditions necessary for sustainable fisheries are trending in unfavorable directions, notably temperature and upwelling.
Temperature. Over the past three decades, sea surface tempera-ture (SST) in Ghanaian waters has steadily increased (Figure 10.5). Increasing SST contributes to a decline in the biomass of zooplankton, a key component of the aquatic ecosystem. Studies have documented
the harmful effects of higher temperatures on fish production in Ghana (Akpalu et al., 2015; IPCC, 2014).
Upwelling. The Gulf’s coastal hydrography affects the biology and status of marine fish, in particular through the intensity of its major upwelling period (July to September)—where nutrient-rich, colder water rises up from the deep, increasing biological productivity in surface waters. The major upwelling is the main fishing season in Ghana, being when most fish spawning takes place; it is critical to artisanal fishermen who rely on the proliferation of sardinellas in inshore waters (Houghton and Mensah, 1978; Mensah, 1974). The major upwelling index has exhibited subtle weakening since 1998 (Figure 10.6).

10410. sTaTus of fisheries resourCes
Figure 10.7: Aquaculture and capture fish production in Lake Volta (Data obtained from MoFAD).
The combination of rising SST, less productive coastal upwelling, and decline in zooplankton paint a worrying picture for fish resources, particularly small pelagics. Changes to productivity dynamics make disappearance of certain marine fish species a possibility (Barange and Perry, 2009).
The inland water resources of Ghana include Lake Volta (which in itself totals four percent of Ghana’s surface area), several large rivers, and lagoons. Inland catches, predominantly from Lake Volta, are both smaller in size and in decline, indications of dwindling fish stocks. According to the Fisheries Commission, except for Lake Volta and coastal lagoons, fisheries in other inland water bodies (e.g. reservoirs, rivers) are not well monitored. Freshwater fishing mainly uses arti-sanal dugout canoes. Different kinds of fishing equipment are used in the lake, including illegal beach and purse seine nets. Estimated fish catch from the lake has been between 80,000 and 100,000 MT for a decade, but as there is no official catch assessment survey program for lake fisheries this is an approximation (MoFAD, 2016).
Notwithstanding the discouraging news in the marine and fresh-water capture subsectors, the aquaculture sector is a bright spot
in Ghana’s fisheries, and has been developing rapidly. Lake Volta is the main site for fish cage farming. Tilapia is the predominant spe-cies for intensive culture, but other farmed species include catfish (Clarias gariepinus), bonytongue (Heterotis niloticus), and tiger shrimp (Penaeus monodon). The rapid increase in production of farmed fish is due to the tilapia harvest, which more than quadrupled between 2010 and 2017 (Figure 10.7)
Box 10.2: Fish species of commercial importance in Ghanaian waters
● Small/medium pelagics: Round sardinella (Sardinella aurita), flat sardinella (Sardinella maderensis), chub mackerel (Scomber
colia), anchovy (Engraulis encrasicolus), scad mackerel (Decapterus rhonchus)
● Large pelagics: Yellowfin tuna (Thunnus albacares), bigeye tuna (Thunnus obesus), skipjack tuna (Katsuwonus pelamis)
● Demersals: Sea breams (Pagellus bellottii, Sparus caeruleostictus, Dentex canariensis), grunts (Pomadasys incisus,
Pomadasys jubelini, Brachydeuterus auritus), croakers (Pseudotolitus spp., Umbrina spp.), snappers (Lutjanus fulgens,
Lutjanus agennes), goatfishes (Pseudupeneus prayensis), groupers (Epinephelus spp.), shrimps (Penaeus notialis,
Parapenaeopsis atlantica, Parapenaeus longirostris), cuttlefish (Sepia officinalis)
-
20,000
40,000
60,000
80,000
100,000
120,000
2010 2011 2012 2013 2014 2015 2016 2017M
etric
tons
('00
0s)
Volta Lake Fish Aquaculture
10.2 Economics of the Fisheries Sector
Over the last decade, marine and inland capture fishing accounted for a significant portion of agricultural GDP. The contribution was more than eight percent in 2006 but has declined steadily to nearly six per-cent since 2014. The sector’s contribution to total GDP declined from about 2.4 percent in 2006 to 1.4 percent in 2016 though these figures would be higher if all segments of the value chain were captured, like fish processing and retail. In addition to making a significant contribu-tion to GDP, fishing generates more than half of non-traditional export
earnings. Between 2014 and 2016, the average annual export revenue exceeded US$14 million (based on data from MoFAD).
Fisheries are a critical component of employment. From 1950 to 2010 total employment in the industry rose 35 percent (Nunoo et al., 2014). Estimating an employment rate of 20 percent of the active labor force, almost three million people work in the fisheries sector, of which 150,000 are canoe fishers, 30,000 are fish processors, and 2.7 million are involved in trade, transport, and sale (Atta-Mills et al., 2004; MoFAD, 2018). 300,000 are engaged in fishing activities on

105
94. Data from FAO Fisheries and Aquaculture Department, updated 2016, http://www.fao.org/fishery/facp/GHA/en#CountrySector-Statistics.
95. Calculation of MSY includes the level of effort (number of fishing vessels) for each of the four marine fishing fleets (artisanal, inshore, industrial trawlers, tuna), annual catch volume, and the number of vessels spanning different time periods. MSY calculations from data (ending 2016) obtained through direct discussion with the Fisheries Commission, primarily the Marine Fisheries Management Division and Fisheries Scientific Survey Division (FSSD). For MEY, price/
revenue information was obtained from FSSD, but average cost figures were collected from vessel owners and members of fisheries associations.
96. The sustainable number of vessels was computed using information on operational cost per vessel and price (average revenue) per MT of fish.
97. This CEA used data on actual profits in the marine fisheries sub-sectors (artisanal, semi-industrial, industrial, tuna) from 2012 to 2016.
Figure 10.8: Lost rents due to overfishing in Ghana’s marine fisheries (Authors based on Akpalu and Okyere, 2018).
● Artisanal vessels: The estimated MSY for the artisanal fish-ing fleet is 211,678 MT, which translates to a ceiling of 12,041 canoes. The highest fleet capacity of about 12,728 canoes recorded in 2013 exceeds the effort that could generate the maximum annual catch (Table 10.2). Actual profits derived over the period 2012-2016, on average, were 37 percent lower than MEY (Figure 10.8). The cumulative five-year loss in rents due to excessive artisanal fleet size totaled half a billion dollars.
37.3% 38.4%
52.2%
18.9%
0%
10%
20%
30%
40%
50%
60%
$-
$50
$100
$150
$200
$250
$300
Artisanal Tuna Industrial Semi-Industrial
Perc
enta
ge o
f max
imum
rent
s fo
rego
ne
Prof
its (U
S$ m
illio
ns)
Maximum yearly profit (i.e.MEY)Actual annual profi t, 2012-2016Annual lost rents (%) (rightaxis)
Lake Volta.94 Collapse of the small pelagics fishery would possibly threaten the livelihoods of up to 500,000 people involved (MoFAD, 2018).
Gender dynamics play a role in the fisheries economy. Women primarily manage fish processing and distribution. In most coastal communities, women are forbidden from physically catching fish, but they can own fishing gear, finance expeditions, and engage in wholesale and retail commerce. In some communities in the Central and Western Regions, the head of the fish traders, known as the fish queen, unilaterally sets the daily beach price for fish, hence indirectly influencing catch decisions of fishermen. Thus, a successful fish trade has earned some women prestigious status in the fishing com-munity, giving them the financial muscle to own and control fishing
equipment. Studies have found a multiplier of 2.5 for fishing revenue that accrues to women as the main intermediaries (Chimatiro, 2010).
Estimates suggest that increases to the size of Ghana’s fishing fleet could further economic losses (on top of stock losses) in the sector. For renewable natural resources such as fish, the rate of extraction must not exceed the rate at which the stock replenishes itself, other-wise known as the Maximum Sustainable Yield (MSY).95 Similarly, the Maximum Economic Yield (MEY) is the sustainable catch quantity that generates the highest rents, given total revenues and costs. Using MSY and MEY it is possible to derive the number of vessels needed to reach those maxima96; knowing MEY also permits calculation of the difference between optimal and actual rent extraction.97
● Inshore/semi-industrial vessels: MSY is estimated at 10,659 MT with a corresponding number of vessels of 276. This is lower than the number of boats in operation between 2012-2016 but higher than more recent figures. All else being equal, a fleet of 250 would maximize rents.
● Industrial trawlers: MSY is an estimated 28,944 MT with a maxi-mum number of vessels at 54. This is approximately half the current size of the fleet. Only 50 trawlers would be required

10610. sTaTus of fisheries resourCes
10.3 Fisheries Governance Framework and Analysis
MoFAD has primary responsibility to formulate the policies and pro-grams necessary to develop and manage the sector. The Ministry has two agencies, the Fisheries Commission and the National Premix Secretariat (which serves the National Premix Committee). The Fisheries Commission, with a Board of Commissioners, is the implementing agency of the Ministry and is mandated by the Fisheries Act to regulate and manage exploitation of fisheries resources in accordance with policies and regulations formulated by MoFAD. It has five operational Divisions—Marine Fisheries Management; Inland Fisheries Management; Fisheries Scientific Survey; Monitoring, Control, and Surveillance; Operations and Administration—and four units—Fish Health; Monitoring and Evaluation; Post-Harvest; Projects.The NPC administers distribution of premix fuel for fishing vessels, which the GoG lends significant fiscal support to in the form of a US$48.9 million/year subsidy (Tobey et al., 2016). The NPC uses Landing Beach Committees to permit fishermen to run local premix fuel stations; proceeds from premix fuel sale are aimed at develop-ment of surrounding fishing communities. Part of the NPC’s mandate
is to monitor fuel distribution and sale to avoid leakage and ensure appropriate use of funds.
The fishing and aquaculture sector is regulated by the Fisheries Act, 2002 (Act 625), Fisheries Regulations, 2010 (L.I. 1968), Fisheries (Amendment) Act, 2014 (Act 880), and Fisheries (Amendment) Regulations, 2015 (L.I. 2217). The Fisheries Act (2002) established the Fisheries Enforcement Unit (FEU), which is responsible for moni-toring, control, and surveillance of fishing operations within Ghana’s waters, and enforcement of regulations. The FEU includes personnel from the Ghana Navy, Ghana Air Force, and the Fisheries Commission, and it is assigned an attorney from the Ministry of Justice.
Private organizations are also involved in fisheries governance. The National Fisheries Association of Ghana (NAFAG) is an umbrella asso-ciation with membership from all the marine and inland sectors as well as fish processors and traders. NAFAG has two representatives on the Fisheries Commission Board. There is also the Ghana Aquaculture Association, an advocacy group for fish farmers, as well as NGOs.
to maximize economic benefits, hence the industry is losing annual rents of more than 50 percent of profits, equivalent to US$206 million during the period studied due to overcapital-ization and overfishing.
Table 10.2: Top 10 demersal species off coast of Ghana (Data from selected surveys of the R/V Dr. Fridtjof Nansen).
Year IndustrialSemi-industrial
(inshore)Tuna (baitboats &
purse seiners)Artisanal (canoes)
Maximum number of vessels at MSY
54 276 31 12,041
Actual number of vessels in the ocean and inland water bodies
2006 76 153 31 11,550
2007 76 273 35 11,718
2008 74 339 42 11,886
2009 53 264 44 12,055
2010 71 288 48 12,223
2011 83 221 42 12,391
2012 87 288 40 12,560
2013 89 360 41 12,728
2014 103 360 55 12,346
2015 93 204 44 11,965
2016 98 190 44 11,583
*Red cell denotes figure over the MSY ceiling; underline is highest number of vessels recorded in the sub-sector during the period in question
The total annual cost of marine overfishing in Ghana is estimated at US$233 million—the sum of lost fishing rents—equivalent to 0.4 percent of 2017 GDP. Akpalu and Okyere (2018) caution that cli-mate change impacts to marine ecosystems may alter calculations in economic models.

107
The GoG adopted the National Fisheries and Aquaculture Policy in 2008 to ensure that the sector would contribute significantly to achieving the African Union’s Comprehensive Africa Agriculture Development Program targets. It also adopted the Ghana Fisheries and Aquaculture Sector Development Plan (2011-2016) to imple-ment the National Fisheries and Aquaculture Policy in the short-term. MoFAD and the Fisheries Commission implement the Fisheries Management Plan of Ghana (2015-2019). The goal of the plan is to “rebuild fish stocks to enhance the socioeconomic conditions of fishing communities, create employment within national and inter-regional frameworks and standards and improve food security as well as contribute to GDP and foreign exchange earnings” (MoFAD, 2015). The key objectives of the plan are to reduce excessive pressure on fish stocks, ensure sustainable exploitation of fish stocks, ensure implementation of fisheries legislation, protect marine habitats and biodiversity, enhance export opportunities and value addition, strengthen participatory decision-making in fisheries management, and meet regional and international obligations.
Under the plan, a closed season of two months for trawlers has been in place since 2016 (November 2016, February-March 2017, January-February 2018, and August-September 2019). In 2019, for the first time, a closed season was introduced for artisanal and inshore fishing from May 15 to June 15. MoFAD reported that all industrial trawlers complied with the directive with zero infractions as determined from the Vessel Monitoring System (VMS) and that some canoe operators reported higher fish catches thereafter. The Management Plan has a provision to increase the number of non-fishing days for canoes from one to two days per week. The Plan also offers alternate livelihood activities to encourage some fishermen to exit the industry, thereby alleviating pressure on fisheries.
10.3.1 Gaps and Challenges
Inadequate human and institutional capacity. A major issue con-fronting MoFAD is inadequate capacity. This is in terms of i) person-nel numbers, particularly of those in the field, ii) expertise in key areas; iii) data collection. For example, while most artisanal fishing nets have mesh smaller than what is legally allowed, the Fisheries Commission has been unable to address this chronic issue due to a lack of manpower. The Fisheries Enforcement Unit (FEU) is usually assigned two Police personnel to investigate and prepare dockets; they and the State Prosecutors have other commitments, which slows down the adjudication process for fisheries infractions. With the support of the WARFP-Ghana, gains have been made in monitor-ing, control, and surveillance but the enforcement capacity of the Fisheries Commission is still inadequate considering the magnitude and multitude of issues needing supervision. In terms of technical expertise, there are too few fisheries experts, from fisheries econo-mists to fishing gear specialists, even though technical knowledge is crucial to mitigating adverse impacts. Finally, marine and inland fish
production are likely underestimated because of weak data collec-tion. The Fisheries Commission’s Fisheries Scientific Survey Division (FSSD) has not had its own research vessel since 1997. Inadequate data on stocks, legal and illegal landings, fleets, number and dura-tion of fishing trips, operational cost of vessels, fees and taxes, etc., makes socioeconomic analysis of the sector very difficult.
Perverse incentives and sectoral transparency. Despite over-whelming evidence pointing to excess fleet capacity among arti-san fishermen, political expediency coupled with ignorance and misperception of the dynamics of fish stocks has seen successive governments in Ghana introduce incentives that intensify fishing. The most salient example is the subsidy for premix boat fuel. Undeniably detrimental to fisheries and burdensome to the taxpayer, incentives are often intensified during election years, reaffirming the notion that the subsidy’s true purpose is to gather votes from Ghana’s 3 million fishermen.
Though most trawl vessels are registered as Ghanaian, with Ghanaians owning at least a 51 percent share, a disproportionate amount of their profit accrues to foreigners (Harrison, 2009). There are those who maintain that some locals are fronting for foreigners in return for small monthly bribe—quoted at around US$1,000—and by-catch fish (Authors’ interviews). The hire-purchase agreement requirement of the Fisheries Act, which gives the Ghanaian partner full ownership of the vessel after five years, is not enforced because a loophole allows vessels to change ownership after four years and become subject to a new agreement. According to the Ghana Maritime Authority, the registration fee for a vessel of 300 gross registered tonnes (GRT) is around US$1,350 while the license fee charged by the Fisheries Commission for such a vessel is US$35/GRT. The licensing fee is among the lowest of West Africa’s coastal countries, making Ghana’s waters highly attractive to foreign investors (World Bank, 2017).

10810. sTaTus of fisheries resourCes
Box 10.3: The West Africa Regional Fisheries Program-Ghana
Between 2012-2018, the Government of Ghana implemented the US$53.8 million World Bank-funded West Africa Regional Fisheries Program (WARFP-Ghana) to actualize its Fisheries and Aquaculture Sector Development Plan and National Aquaculture Development Plan. The development objective of WARFP-Ghana was to improve sustainable management of Ghana’s fish and aquatic resources by: i) strengthening the country’s capacity to sustainably govern and manage fishing; ii) reducing illegal fishing; iii) increasing the value and profitability generated by fish resources and their contribution to the national economy; and iv) developing aquaculture.
Key activities carried out during project implementation included:
● preparing an aquatic animal health policy;
● creating awareness about the consequences of illegal, unreported, unregulated (IUU) fish catches; and publicizing actions taken by The Monitoring, Control, and Surveillance Division of the Fisheries Commission that led to reduced infractions;
● organizing two canoe frame surveys in the marine sector;
● embossing registration numbers on canoes;
● assessing pelagic and demersal stocks in partnership with FAO’s EAF-Nansen Project;
● instituting closed fishing seasons;
● re-registering semi-industrial vessels, and creating a web-based digital register of canoes, inshore, and industrial vessels, accessible through the WARFP Regional Dashboard;
● fitting industrial vessels with VMS beacons and semi-industrial with Automatic Identification System (AIS) technology, enabling them to be monitored electronically; achieving 100 percent coverage of trawlers on fishing expeditions through the marine fishing observer program.
It is hoped that these activities will further sustainable fishing, increase profitability, and improve fisheries’ contributions to the national economy.
● Reinforce the Fisheries Management Plan’s communication strategy to raise awareness among stakeholders about regula-tory compliance (MoFAD/Fisheries Commission)
● Emboss and license all registered canoes, and issue owners with picture identification cards (that can also be used to obtain premix fuel) (MoFAD/Fisheries Commission/NPC)
● Agree on a monthly allowable number of trawlers and an effective enforcement mechanism with stakeholders (MoFAD/Fisheries Commission)
● Decrease trawling by increasing the Inshore Exclusive Zone for artisanal fishermen from 30 to 50 meters (MoFAD)
● Implement on-the-spot inspections of fishing gear equipment (MoFAD/Fisheries Commission)
10.4 Recommendations for Sustainable Fisheries
10.4.1 Short-term (1-2 years)
● Sanction infractions through withdrawal of fishing licenses; ban inshore vessels, canoes caught during enforcement oper-ations from fishing for a predetermined period (e.g. minimum of six months) (MoFAD/FEU)
● Take detailed records of sources and quality/quantity of saiko landings; sanction offending vessels; use records in determin-ing license renewal (MoFAD/Fisheries Commission)
● Place (and communicate) a moratorium on the import of new industrial vessels and canoes; halt replacement of old or lost vessels (MoFAD/Fisheries Commission)
● Support Ghana National Canoe Fishermen Council efforts to institute an additional weekly no-fishing day (MoFAD)

109
● Acquire: i) a research vessel to assess fish stocks and support other critical research; ii) two dedicated patrol boats (for inland and marine sectors); iii) a fish patrol helicopter (to support monitoring and control duties of national security agencies) (Cabinet, MoFAD, MoF)
● Design and construct new landing beaches to facilitate fishing vessel inspection (MESTI/LUSPA, MoFAD/Fisheries Commission, MWH)
● Construct spaces for fish auctions to add value, improve data collection/documentation, and improve traceability of catches (MESTI/LUSPA, MoFAD/Fisheries Commission, MWH)
● Train personnel, acquire logistics, and deploy officers to collect fish catch and price data at landing beaches, and conduct regular canoe frame surveys (MoFAD/Fisheries Commission)
● Agree upon and sustain a two-month closed season for all fleets to rebuild fish stocks (MoFAD)
● Draft stringent, enforceable general guidelines on future addi-tions to the industrial fleet (MoFAD)
● Reduce industrial fleet by 50 percent; reduce artisanal fleet size (MoFAD/Fisheries Commission)
● Revise provisions in Fisheries Act 625 to make co-manage-ment feasible and workable (Parliament)
● Establish co-management committees at the community, zonal, and national levels (MoFAD/Fisheries Commission)
● Develop management plans for all fisheries sub-sectors (MoFAD)
● Conduct new stakeholder analyses to reflect the changing nature of the sector—identifying interest groups, reorganizing and reinforcing associations, and strengthening NAFAG—to help data collection along the entire fish value chain and to champion regulatory compliance (MoFAD)
● Prepare a Marine Protected Areas report with a view to estab-lishing MPAs in areas of fish spawning and important biodiver-sity (MLNR, MoFAD)
10.4.2 Medium-term (2-5 years) 10.4.3 Long-term (5+ years)
A detail of fish being washed in Jamestown Fishing Village in Accra.
Dominic Chavez/World Bank

11010. sTaTus of fisheries resourCes
A farmer attempts to cultivate in a drought-stricken maize field in Upper East Region.
Jake Lyell / Alamy Stock Photo

111
11

11211. ClimaTe Change
11. Climate Change
The climate of Ghana is tropical, and tem-peratures and precipitation vary with geo-graphical location, season—characterized by wet and dry periods—and elevation. The northern part of Ghana is marked by a single wet season, occurring between May and November. The northern regions receive on average about 150 - 250 mm of rainfall per month in the peak months of the wet season (July - September). The southern regions benefit from two wet seasons: a major one from March to
July, and a minor one from September to November. Annual rainfall ranges from about 1,100 mm in the North to 2,100 mm in the Southeast.
Historically, Ghana has been affected by several weather and climate-related hazards, including floods, droughts, wildfires, and strong winds (Figure 11.1). The country experiences high levels of climate variability and climate-related extremes. In the 1970s and 1980s, Ghana went through three serious droughts. While recorded dam-ages from droughts have decreased in the recent years, the NSEZ remains drought prone. In the last 20 years Ghana has experienced
11.1 The Impacts of a Changing Climate on Ghana
19 significant floods of various magnitudes, with the major flooding event occurring between April-July 2017 (Table 11.1). Flood events have affected nearly four million people over the last 40 years, both in rural areas—riverine flooding, mainly in the Volta River System—and in he urban areas, notably the Greater Accra Region. In recent years, flooding in the North has been recurrent, affecting large swathes. In the southern regions, the extent of floods has been limited to the cit-ies and is driven by rapid urbanization, poor hydraulic infrastructure, and weak solid waste management, among other factors. A 2015 flash flood in Accra caused an estimated US$55 million in damages to the housing, water, and transport sectors, though losses were likely substantially higher (MESTI, 2016).
Climate change is expected to have substantial impacts on Ghana, with the potential to alter seasonal climate patterns, temperature, and rainfall events. This may include higher extreme rainfall peaks with concurrent effects of increased surface runoff and flooding. In fact, the climate of Ghana is already changing. Temperature and precipitation data over the period 1960-2000 show a progressive increase in mean temperature and a decrease in mean annual rainfall in all regions. Temperature has increased about 0.2°C per decade, with a more rapid increase in the northern regions (MESTI, 2013).
DƐNKYƐM: (“crocodile”)
adaptability in changing
circumstances
Canoe under trees. Curt Carnemark / World Bank
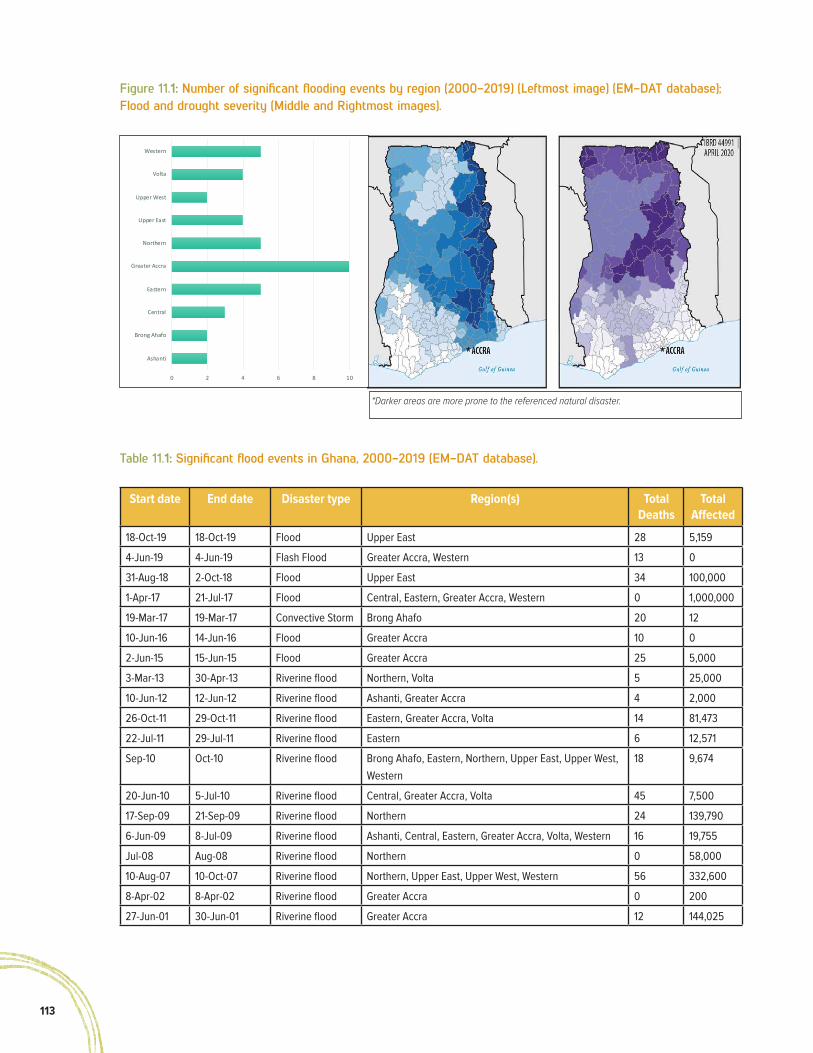
113
Figure 11.1: Number of significant flooding events by region (2000-2019) (Leftmost image) (EM-DAT database); Flood and drought severity (Middle and Rightmost images).
*Darker areas are more prone to the referenced natural disaster.
Table 11.1: Significant flood events in Ghana, 2000-2019 (EM-DAT database).
Start date End date Disaster type Region(s) Total Deaths
Total Affected
18-Oct-19 18-Oct-19 Flood Upper East 28 5,159
4-Jun-19 4-Jun-19 Flash Flood Greater Accra, Western 13 0
31-Aug-18 2-Oct-18 Flood Upper East 34 100,000
1-Apr-17 21-Jul-17 Flood Central, Eastern, Greater Accra, Western 0 1,000,000
19-Mar-17 19-Mar-17 Convective Storm Brong Ahafo 20 12
10-Jun-16 14-Jun-16 Flood Greater Accra 10 0
2-Jun-15 15-Jun-15 Flood Greater Accra 25 5,000
3-Mar-13 30-Apr-13 Riverine flood Northern, Volta 5 25,000
10-Jun-12 12-Jun-12 Riverine flood Ashanti, Greater Accra 4 2,000
26-Oct-11 29-Oct-11 Riverine flood Eastern, Greater Accra, Volta 14 81,473
22-Jul-11 29-Jul-11 Riverine flood Eastern 6 12,571
Sep-10 Oct-10 Riverine flood Brong Ahafo, Eastern, Northern, Upper East, Upper West, Western
18 9,674
20-Jun-10 5-Jul-10 Riverine flood Central, Greater Accra, Volta 45 7,500
17-Sep-09 21-Sep-09 Riverine flood Northern 24 139,790
6-Jun-09 8-Jul-09 Riverine flood Ashanti, Central, Eastern, Greater Accra, Volta, Western 16 19,755
Jul-08 Aug-08 Riverine flood Northern 0 58,000
10-Aug-07 10-Oct-07 Riverine flood Northern, Upper East, Upper West, Western 56 332,600
8-Apr-02 8-Apr-02 Riverine flood Greater Accra 0 200
27-Jun-01 30-Jun-01 Riverine flood Greater Accra 12 144,025
0 2 4 6 8 10 12
Ashanti
Brong Ahafo
Central
Eastern
Greater Accra
Northern
Upper East
Upper West
Volta
Western

11411. ClimaTe Change
Figure 11.2: Projected change in monthly temperature (left) and precipitation (right) for 2020-2039 (World Bank Climate Change Knowledge Portal).
There is no consensus model being used to predict the effects of climate change in either Ghana or West Africa. A review of studies, conducted by the World Bank (2017b),98 identified projected impacts on temperature and rainfall for time horizons of 2030 and 2040. In a low warming scenario, a countrywide warming of 1°C is projected by the 2030s and 2040s. In a high warming scenario, temperature increases of 1.3°C and 1.8°C are projected for the 2030s and the 2040s respectively. The models forecast a pronounced increase in heat extremes in southern Ghana. Mean annual temperature is projected to increase, most rapidly in the northern inland regions, 1.0-3.0°C by the 2060s, and 1.5-5.2°C by the 2090s.
Extreme droughts will primarily affect Brong Ahafo and Ashanti Regions, consistently in both warming scenarios, though the ampli-tude of the effects is lower in the low warming scenario. Despite larger uncertainty, climate models tend to indicate an increase in extreme wet event conditions in the northern regions of Ghana (World Bank, 2017b). Total annual rainfall is projected to decline 1.1 percent by 2020, and 20.5 percent by 2080 (Figure 11.2).
Predicting the potential impacts of climate change on floods is dif-ficult due to the large number of variables that must be considered.
Hydrological-hydraulic models used to understand flood risk in Accra, notably in the Odaw Basin, point towards climate change and urban-ization limiting the safety levels of flood management infrastructure by 2070, with substantial increases in the number of people affected and damage to assets (Figure 11.3) (World Bank, 2020).
Urban areas, notably the major urban centers of Accra, Kumai, Sekondi-Takoradi, and Tamale are the hubs of economic growth and are rapidly expanding. The city of Accra and the Greater Accra Region are affected by floods, due to their low-lying location at the Gulf of Guinea. Demographic growth, fueled in part by the in-migration from Ghana’s rural areas, will contribute to rapid urbanization; associ-ated buildings and paving and sealing of surfaces will lead to more and higher floods during heavy rainfall. The design capacity of the main drains, especially downstream, is no longer sufficient to safely discharge excess water to the sea. Moreover, the actual capacity of the drains has decreased, due to siltation, solid waste accumulation, and lack of regular maintenance. A dearth of studies anticipating the twin issues of demographic growth and climate change are wholly missing, making it difficult to prepare for the future.
98. The study is based on analysis of the 5th Coupled Model Intercomparison Project assessed in the Intergovernmental Panel on Climate Change’s Fifth Assessment Report.
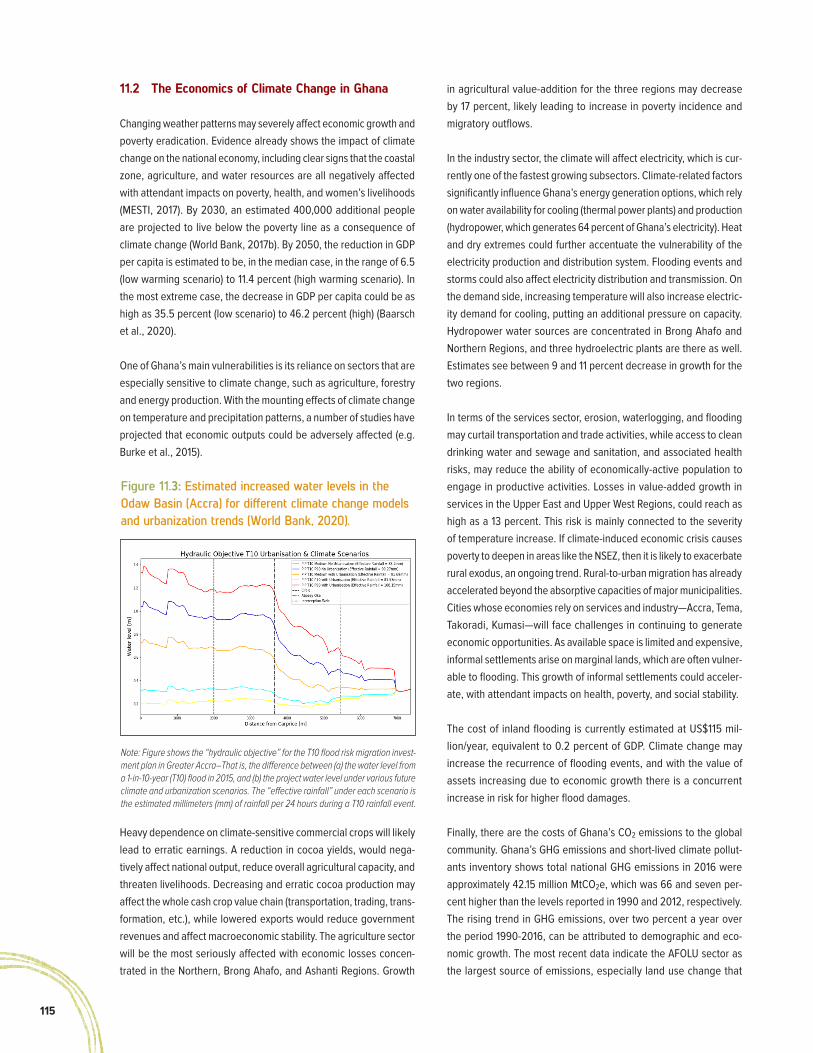
115
11.2 The Economics of Climate Change in Ghana
Changing weather patterns may severely affect economic growth and poverty eradication. Evidence already shows the impact of climate change on the national economy, including clear signs that the coastal zone, agriculture, and water resources are all negatively affected with attendant impacts on poverty, health, and women’s livelihoods (MESTI, 2017). By 2030, an estimated 400,000 additional people are projected to live below the poverty line as a consequence of climate change (World Bank, 2017b). By 2050, the reduction in GDP per capita is estimated to be, in the median case, in the range of 6.5 (low warming scenario) to 11.4 percent (high warming scenario). In the most extreme case, the decrease in GDP per capita could be as high as 35.5 percent (low scenario) to 46.2 percent (high) (Baarsch et al., 2020).
One of Ghana’s main vulnerabilities is its reliance on sectors that are especially sensitive to climate change, such as agriculture, forestry and energy production. With the mounting effects of climate change on temperature and precipitation patterns, a number of studies have projected that economic outputs could be adversely affected (e.g. Burke et al., 2015).
Heavy dependence on climate-sensitive commercial crops will likely lead to erratic earnings. A reduction in cocoa yields, would nega-tively affect national output, reduce overall agricultural capacity, and threaten livelihoods. Decreasing and erratic cocoa production may affect the whole cash crop value chain (transportation, trading, trans-formation, etc.), while lowered exports would reduce government revenues and affect macroeconomic stability. The agriculture sector will be the most seriously affected with economic losses concen-trated in the Northern, Brong Ahafo, and Ashanti Regions. Growth
Figure 11.3: Estimated increased water levels in the Odaw Basin (Accra) for different climate change models and urbanization trends (World Bank, 2020).
Note: Figure shows the “hydraulic objective” for the T10 flood risk migration invest-ment plan in Greater Accra–That is, the difference between (a) the water level from a 1-in-10-year (T10) flood in 2015, and (b) the project water level under various future climate and urbanization scenarios. The “effective rainfall” under each scenario is the estimated millimeters (mm) of rainfall per 24 hours during a T10 rainfall event.
in agricultural value-addition for the three regions may decrease by 17 percent, likely leading to increase in poverty incidence and migratory outflows.
In the industry sector, the climate will affect electricity, which is cur-rently one of the fastest growing subsectors. Climate-related factors significantly influence Ghana’s energy generation options, which rely on water availability for cooling (thermal power plants) and production (hydropower, which generates 64 percent of Ghana’s electricity). Heat and dry extremes could further accentuate the vulnerability of the electricity production and distribution system. Flooding events and storms could also affect electricity distribution and transmission. On the demand side, increasing temperature will also increase electric-ity demand for cooling, putting an additional pressure on capacity. Hydropower water sources are concentrated in Brong Ahafo and Northern Regions, and three hydroelectric plants are there as well. Estimates see between 9 and 11 percent decrease in growth for the two regions.
In terms of the services sector, erosion, waterlogging, and flooding may curtail transportation and trade activities, while access to clean drinking water and sewage and sanitation, and associated health risks, may reduce the ability of economically-active population to engage in productive activities. Losses in value-added growth in services in the Upper East and Upper West Regions, could reach as high as a 13 percent. This risk is mainly connected to the severity of temperature increase. If climate-induced economic crisis causes poverty to deepen in areas like the NSEZ, then it is likely to exacerbate rural exodus, an ongoing trend. Rural-to-urban migration has already accelerated beyond the absorptive capacities of major municipalities. Cities whose economies rely on services and industry—Accra, Tema, Takoradi, Kumasi—will face challenges in continuing to generate economic opportunities. As available space is limited and expensive, informal settlements arise on marginal lands, which are often vulner-able to flooding. This growth of informal settlements could acceler-ate, with attendant impacts on health, poverty, and social stability.
The cost of inland flooding is currently estimated at US$115 mil-lion/year, equivalent to 0.2 percent of GDP. Climate change may increase the recurrence of flooding events, and with the value of assets increasing due to economic growth there is a concurrent increase in risk for higher flood damages.
Finally, there are the costs of Ghana’s CO2 emissions to the global community. Ghana’s GHG emissions and short-lived climate pollut-ants inventory shows total national GHG emissions in 2016 were approximately 42.15 million MtCO2e, which was 66 and seven per-cent higher than the levels reported in 1990 and 2012, respectively. The rising trend in GHG emissions, over two percent a year over the period 1990-2016, can be attributed to demographic and eco-nomic growth. The most recent data indicate the AFOLU sector as the largest source of emissions, especially land use change that

11611. ClimaTe Change
Figure 11.4: GHG emissions by sector (MESTI, 2018). Figure 11.5: Total GHG emissions (% change from 1990) (World Bank WDI database).
99. These emissions calculations are based on the European Commission, Joint Research Centre (JRC)/Netherlands Environmental Assessment Agency (PBL) Emission Database for Global Atmospheric Research (EDGAR). For additional information, see
https://data.worldbank.org/indicator/EN.ATM.GHGO.ZG?locations=GH and edgar.jrc.ec.europa.eu.
54.37%35.64%
7.54%
2.44%
AFOLU
Energy
Waste
IPPU
-100% -50% 0% 50% 100% 150% 200% 250% 300%
Ghana
Mauritania
Nicaragua
Kenya
Cameroon
Myanmar
Kyrgyz Republic
Cote d'Ivoire
converts forest into grazing and cropland. The energy sector is the second largest contributor to national emissions, half of which comes from fuel combustion in the road transport sector, and a third from thermal electricity generation. The third and fourth contributors are the manufacturing, industry, and construction sector, and the waste treatment and disposal sector, respectively (Figure 11.4) (MESTI, 2018). Under a different methodology99 that allows for comparison between countries, Ghana’s total emissions change between 1990 and 2012 far outpaced any of its structural peers, nearly tripling over the period (Figure 11.5).
The cost of Ghana’s GHG emissions to the global community is, on average US$2.3 billion each year (though the estimated range is US$1.5 to 3.2 billion), equivalent to just under four percent of Ghana’s GDP.
11.3 Governance Framework and Analysis for Climate Change
Ghana's strategy to tackle climate change is articulated in several policies and strategies including the National Climate Change Policy, which focuses on low-carbon growth, adaptation and social develop-ment. Ghana ratified the Paris Agreement in September 2016, and the associated NDC, which is anchored in the 40-year long-term development plan, the GSGDA II, the National Climate Change Policy, as well as the Low Carbon Development Strategy. Other policies and strategies include the National Energy Policy, National LPG Promotion Policy, Strategic National Energy Plan and National Gas Master Plan, Renewable Energy Act, Energy Efficiency Regulation, Environmental Fiscal Reforms, Forest and Wildfire Policy and the National REDD+ Strategy.
Ghana has been praised for its well-developed National Climate Change Policy (NCCP) and its Action Program for Implementation: 2015-2020 and a National Climate Change Adaptation Strategy to tackle climate change and disaster risks in the country. Framed by the country’s sustainable development priorities, the NCCP provides strategic direction and the institutional framework for climate change and disaster risk management, emphasizing commitment, prepared-ness, and the resolve to lessen climate-related hardships, and it looks forward to a green economy. The NCCP identifies ten focus areas with specific programs for addressing Ghana’s climate change chal-lenges and opportunities: develop climate-resilient agriculture and food security systems; build climate-resilient infrastructure; increase resilience of vulnerable communities to climate-related risks; increase carbon sinks; improve management and resilience of terrestrial, aquatic and marine ecosystems; address impacts of climate change on human health; minimize impacts of climate change on access to water and sanitation; address gender issues in climate change; address climate change and migration; minimize GHG emissions (MESTI, 2013).
Ghana also has a Plan of Action on Disaster Risk Reduction and Climate Change Adaptation (2012), which oriented the approach of the national agenda from disaster response to disaster preven-tion and risk reduction. Mainstreaming of disaster risk reduction and climate change adaptation into MMDA development planning and programs was the key axis of implementation. The National Disaster Management Act, 2016 (Act 927), effectively codifies this prevention-first approach. Act 927 emphasizes prevention, early warning and preparedness, and building codes, and establishes a National Disaster Management Fund.

117
Table 11.2: Selected projects focused on climate change in Ghana
Project title, location (duration) Activity Development Partners; Implementing Agencies
Ghana Climate Innovation Center Project, (2016-2020)
This US$17.2 million project supports entre-preneurs and small and medium enterprises involved in developing profitable and locally appropriate solutions to climate change and increasing business activity in the climate technology sector.
World Bank; Ashesi University College
Increased Resilience to Climate Change in Northern Ghana through the Management of Water Resources and Diversification of Livelihoods, Upper East, Upper West, and Northern Regions (2016-2020)
The US$8.3 million project seeks to en-hance the resilience and adaptive capacity of rural livelihoods to climate impacts and risks on water resources. Results center on improved water access, as well as increased institutional capacity and coordination.
UN Development Programme; MESTI
Program on Affirmative Finance Action for Women in Africa (AFAWA): Financing Climate Resilient Agricultural Practices in Ghana, NSEZ (2019-2024)
The objective of this US$20 million project (of which US$18.5 is loan) is to empower women groups in the climate-vulnerable NSEZ to participate in low-emission climate resilient agricultural practices. The project provides concessional loans and technical assistance to women-led enterprises and farmer-based associations.
African Development Bank, Green Climate Fund; MoF, MoFA
11.3.1 Gaps and Challenges
Climate leadership and coordination. Although Ghana has a National Climate Change Committee and a Climate Change Unit within EPA, there is no overarching coordinating entity to guide the country’s response to the warming earth. For example, while the Ghana National Climate Change Master Plan Action Programs for Implementation: 2015-2020 identified the key institutions tasked to
fight climate change effects, it largely did so in a piecemeal manner, missing a holistic perspective. As a consequence, there is inadequate funding in the national budget for climate change activities (fund-ing is largely donor driven and project-based), many MDAs have inadequate access to resources to meet their prioritized financial, technical and capacity needs, and there is duplication of activities
The Ghana National Climate Change Master Plan Action Programs for Implementation: 2015-2020 identifies key institutions in com-bating climate change and conducting disaster management. These include MESTI and EPA, MSWR and WRC, MoH, MWH and HSD, MLGRD and MMDAs, the Ministry of Communications’ Ghana Meteorological Agency (GMet), and MoI and the National Disaster Management Organisation (NADMO). GMet is Ghana’s primary source of climate data. It is responsible for the provision of efficient and reliable meteorological data/information, while the Hydrological Services Department (HSD) is responsible for operational hydrology (MESTI, 2017). NADMO was established under the National Disaster Management Organisation Act, 1996 (Act 517) to manage national disasters and emergencies. NADMO, which falls under MoI to enable it to coordinate relevant civil authorities at the national and subna-tional levels, is mandated to manage disasters through coordination of government institutions and non-governmental agencies, and to develop communities’ capacity to respond effectively to disasters and
improve their livelihood. At the national level NADMO is made up of the National Disaster Management Committee (NDMC) and technical advisory subcommittees; it also includes an Emergency Operations Centre operating 24 hours/day, 7 days/week that is manned by per-sonnel from the Urban Search and Rescue Unit. It also has over 900 zonal offices throughout the country. At the subnational level are Regional and District Disaster Management Committees (RRMCs, DRMCs), as well as 900 zonal offices throughout the country. Each DRMC is required to formulate a disaster management plan as part of its planning process. NADMO is largely response-oriented organiza-tion, though it has shifted towards better understanding disaster risk and flood, coastal erosion, and drought management.
Selected projects/investments being carried out by the Government of Ghana to prepare for and adapt to climate change ramifications are presented in Table 11.2.

11811. ClimaTe Change
and funding (weak institutional coordination within government, among donors). Funding is especially significant as Ghana’s NDCs propose investment needs of US$22.6 billion (9.8 billion for mitigation and 12.8 billion for adaptation), of which Ghana intends to mobilize one-quarter domestically and the rest from international resources (UNFCCC, 2015).
Data/data infrastructure issues. Accurate weather and climate data are essential for the prevention of loss to life, livelihoods, and assets, and for the sustainable design of climate-sensitive economic activi-ties and infrastructure. While Ghana has made progress in providing hydro-meteorological (hydromet) services, observation infrastructure, data processing, and forecasting services remain weak. Currently, only a small part of the country is covered by these services. HSD and GMet lack accurate consistent historical data from weather stations, which are often ill-equipped.
Managing residual risks. At the subnational level NADMO faces staffing and resources challenges that impede effective and timely response to disaster. A recent contingency planning and simulation exercise carried out across different regions and districts in Ghana highlighted the absence of operationally implemented and updated contingency plans (UNDP, 2017). While standard operating procedures exist for different regions and districts, these are often not current or regularly used.
11.4 Recommendations to Plan for and Make Ghana Resilient to Climate Change
11.4.1 Short-term (1-2 years)
● Obtain better understanding of the potential impacts of climate-related risks, especially at the MMDA level, to support decision makers and city planners in management of climate resilient urban growth and development (MLGRD/MMDAs; MESTI/TCPD)
● Reinforce collaboration between entities responsible for moni-toring and issuing forecasts related to hydromet, and those dealing with disaster preparedness and prevention (MESTI/EPA; MoC/GMet; MoI/NADMO; MSWR/WRC; MWH/HSD)
● Enhance enforcement of environmental regulations, specifi-cally for spatial development, sanitation, and flood and storm-water management (MESTI/EPA; MLGRD/MMDAs; MSWR)
● Identify immediate actions for improved climate-related disas-ter response and preparedness (MoI/NADMO; MLGRD/MMDAs/RCCs; MWH/HSD)
● Develop climate change and disaster risk preparedness aware-ness campaigns for citizens and schools (MESTI/EPA; MLGRD/MMDAs; MoE/GES; MoI/NADMO; NCCE)
11.4.2 Medium-term (2-5 years)
● Develop a comprehensive Climate-Related Disaster Risk Management Plan, either standalone, or as a subsection of a National Disaster Risk Management Master Plan, with clearly defined actions to prepare for and mitigate the effects of climate-related disasters (MoC/GMet, MESTI/EPA, MLGRD/MMDAs, MoH/GHS, MoI/NADMO, MSWR/WRC)
● Link disaster and climate risk assessments to master planning exercises (MESTI/EPA/LUSPA; MLGRD/MMDAs/RCCs; NDPC; MWH/HSD)
● Undertake detailed multi-hazard risk assessments in MMDAs; develop and implement climate change/disaster risk manage-ment plans; build capacity to ensure that cities, towns, and villages have contingency plans and effective standard oper-ating procedures in place to address climate-related risks (MESTI/EPA; MLGRD/MMDAs/RCCs; MoC/GMet; MoI/NADMO; MSWR/WRC; MWH/HSD)
● Install nature-based and localized solutions for adaptation to climate change: maintain and create green and open urban space to improve air quality and reduce heat impacts; iden-tify and secure areas to increase water retention capacity and reduce runoff through planting of trees; develop green areas on floodplains (MESTI/LUSPA; MLGRD/MMDAs/RCCs; MWH/HSD; NDPC)
11.4.3 Long-term (5+ years)
● Identify vulnerable settlements/communities, especially in densely populated urban areas; formulate a comprehensive slum upgrading and redevelopment strategy addressing criti-cal vulnerabilities of poor/informal settlements (e.g. housing, access to basic services) (World Bank, 2017) (MESTI/EPA/LUSPA; MLGRD/MMDAs/RCCs; MWH; NDPC)
● Improve, extend, and support hydromet services and early warning systems: allocate adequate operational budget; build human capacity in numerical weather forecasting, seasonal climate outlooks, and information provision to targeted sectors (agriculture, hydropower, transport); supply routine hydrologi-cal and meteorological forecasts based on a sound concept of operations using state-of-the-art technologies to disseminate actionable information on climate risk; construct and equip observation stations, with higher-quality infrastructure and in more parts of the country, to allow for effective monitoring and accurate and quality data at the national and subnational levels (MESTI/EPA; MoC/GMet; MoF; MoI/NADMO; MSWR/WRC; MWH/HSD)

119
● Enhance emergency coordination and disaster risk manage-ment operations capacity to ensure that all parts of the coun-try are accounted for under the emergency operations center (MoC/GMet, MoI/NADMO, MLGRD/MMDAs, MSWR/WRC, MWH/HSD)
● Construct, repair, and strengthen flood management and drainage systems that retain water upstream, promote local-ized storm water management, are adequately designed and consider social and environmental constraints; resource sufficiently to allow for effective operation and maintenance (MLGRD/MMDAs; MWH/HSD)
● Bolster the solid waste management sector by: i) promoting private sector involvement in the solid waste management sector (to prevent pollution from inhibiting drainage infrastruc-ture); ii) supporting community-based solid waste manage-ment; iii) investing in engineered, appropriately operated waste transfer and disposal infrastructure (MLGRD/MMDAs/RCCs; MSWR)
● Establish a disaster and climate fund to support climate risk mitigation measures (MESTI; MoF)
Torrential rains flood the streets of Ghana's second largest city Kumasi (Ashanti Region). Zute Lightfoot / Alamy Stock Photo

12011. ClimaTe Change
Independence Square and Black Star Gate, Accra. jbdodane / Alamy Stock Photo
121
12

12212. PoliCies and insTiTuTions
12. Policies and Institutions12.1 Environmental Management Policies and Laws
Strategic Environmental Assessments (SEAs) have been used to address environmental concerns at all levels. The GoG began undertaking SEAs in 2002, starting with the Ghana Poverty Reduction Strategy (GPRS), and since then it has carried out more than 20 SEAs. A 2009 review of overall SEA practices concluded that Ghana was ready to consolidate lessons learned and mainstream applica-tion of SEAs as well as identify best practices to ensure quality in future SEAs. The EPA has prepared an Implementation Framework for Operationalizing SEA Practice in Ghana, which defines the orga-nizational and regulatory framework for standardization in MDAs (MESTI, 2016).
12.2 Institutional Framework for Environmental and Natural Resources Management
The 1991 National Environmental Action Plan (NEAP) proposed an environmental resource management system under which the EPA has since been operating. At the Presidential Cabinet level, apex authorities take national decisions on environmental and natural resource management policy and planning. Just below that level, by its mandate the EPA provides an inter-sectoral forum to discuss envi-ronmental issues prior to making recommendations to be considered at the national level. Sectoral agencies have responsibility to prepare and implement sectoral development plans. The EPA also serves as a technical secretariat, interfacing with sectoral agencies and acts as a clearinghouse through a number of inter-sectoral networks. At the base of the system are DAs and community authorities which together manage environmental resources through mechanisms that facilitate community participation and are underpinned by local by-laws.
12.2.1 Ministry level
MESTI is at the top of the hierarchy for environmental and natural resource management. MESTI formulates and directs policy under a mission “to ensure accelerated socioeconomic development of Ghana through the formulation of sound policies and a regulatory
Ghana has a broad range of poli-cies that affect environmental and natural resource management. The foremost environmental law is the 1992 Constitution, which enshrines commitment to a sound environment. Chapter Six, “Directive Principles of State Policy,” ascribes the responsi-bility of ensuring sustainable use of Ghana’s natural resources to both Government and citizens. Article 36(9) proclaims that “the State shall take appropriate steps needed to protect and safeguard the national
environment for posterity; and shall seek cooperation with other states and bodies for purposes of protecting the wider international environment for mankind.” The first explicit environment-related policies developed in Ghana were the Forest Policy in 1948 and the Wildlife Policy of 1974. The first comprehensive policy was the National Environment Policy that was adopted in 1991 to provide a broad framework to implement the National Environmental Action Plan (NEAP).
Establishment of the Environmental Protection Council, now Environmental Protection Agency (EPA), in 1974 brought regula-tion of environmental issues under one body and implemented the Environmental Impact Assessment (EIA). The Environmental Protection Agency Act, 1994 (Act 490) is the primary law on environ-mental management. It is supported by the Hazardous and Electronic Waste Control and Management Act, 2016 (Act 917) and subsidiary laws such as the Environmental Assessment Regulations, L.I. 1652, and the Hazardous, Electronic and other Wastes (Classification, Control and Management) Regulations, 2016 (L.I. 2250). The EPA Act assigns 19 functions to the Agency and provides for creation of regulations to effectively implement the Act. EIA regulations are at the heart of environmental protection in Ghana.
HWƐ MU DUA (“measuring stick”):
Examination, assessment,
quality assurance

123
framework to promote the use of science and technology that is not harmful to the environment.” The Ministry’s main functions are protection of the environment through policy formulation; economic, scientific, and technological interventions to mitigate harmful impacts caused by development activities; and standard setting and regula-tory activities to apply science and technology to manage the envi-ronment for sustainable development.
In May 2010, as part of the Natural Resource and Environmental Governance (NREG) program, a sector budget support initiative, the GoG established an inter-ministerial body, the Environmental and Natural Resources Advisory Council (ENRAC). With 11 members and chaired by the Vice President, ENRAC itself receives support from a five-member inter-agency technical committee with experts from EPA, as well as the Forestry and Minerals Commissions. ENRAC was designed as a platform to discuss cross-sectoral issues and promote policy coordination, with a goal to facilitate the Environment and Natural Resources Management (ENRM) policy reforms and function as an oversight mechanism. ENRAC has not been efficient at achiev-ing its goal, mainly because of its ad-hoc nature and lack of budget.
12.2.2 EPA and other institutions
The EPA is MESTI’s implementing agency, interfacing with other MDAs and the private sector. According to its mandate, the EPA is Ghana’s main agency for environmental governance and management. Core functions include formulating environmental policy; promoting envi-ronmentally-conscious planning; coordinating and collaborating with domestic and international agencies/institutions as well as decen-tralized offices on environmental governance issues; developing standards and guidelines related to pollution including discharge of waste and control of toxic substances; issuing environmental permits and compliance enforcement; conducting investigations and research focused on environmental protection; raising awareness for environ-mental education; and developing a comprehensive environmental database for public use. To execute its mandate the EPA partners with stakeholders from all branches of Government and society.
The EPA’s capacity has increased its personnel and their quality over the years, an accomplishment that has been borne out in innovative and transparent practices. Currently, EPA has 404 employees, of which 170 are technical experts plus 234 administrative staff. As the lead agency responsible for administering and enforcing EIA regu-lations, the Agency has spearheaded efforts over the past decade that include decentralizing, automating, and making the EIA system more efficient. As a result, in 2016 the EPA issued 3,844 permits out of 4,623 (83 percent) applications received. In 2010, it launched AKOBEN, an environmental performance rating and public disclosure
mechanism scaled-up after a 4-year pilot phase in the mining and manufacturing sectors. AKOBEN aims to increase compliance with environmental regulations and incentivize companies to invest in pollution control measures. AKOBEN rated environmental perfor-mance by colors (gold, green, blue, orange, red). Gold was given for excellent performance and red for poor performance. The initiative raised the EPA’s profile for accountability, transparency (results are published in newspapers), and good governance, especially in the mining sector. AKOBEN was not backed by law, however, and since 2015 there have been no ratings disclosures due to funding issues. The Agency has also implemented a Grievance Redress Mechanism that registers public concerns and ensures their resolution in a timely, efficient, and transparent manner.
MMDAs are the apex political authority at the local level. As such, they are responsible for “the development, improvement and manage-ment of human settlements and the environment in the district” as decreed in Section 10(3)(e) of the Local Government Act, 1993 (Act 462) and the National Decentralization Policy Framework, 2015–2019. This responsibility is subject to policy directives, guidance, plan-ning evaluation, and monitoring responsibilities of national level ENRM sector MDAs. Oversight is exercised by Regional Coordinating Committees (RCCs) as political institutions, and Regional MDA offices as bureaucratic/technical institutions. The EPA currently has 12 dis-trict zonal offices (Accra East, Accra West, Brong Ahafo, Ashanti, Central Eastern, Upper East, Northern, Upper West, Western, Volta, and Tarkwa), that liaise with MMDAs and communities. While this regional network is well-established, district-level statutory arrange-ments—the creation of ENRM departments as per Section 38(1) of Act 462—have not yet been established.
12.2.3 Gaps and Challenges
Policy and law implementation.
● Inefficient leadership and coordination. The inability to provide effective leadership and coordination has fostered inter-agency conflict and functional overlap. First, the protocol for a national response to emerging environmental issues is unclear. One of the challenges is that many institutions are not equipped with the legal capacity to monitor and enforce actions. Second is an absence of national strategic policy direction and limited policy dialogue and oversight. For example, the SEA of the 2002 GPRS found that policies promoting irrigated agriculture and an anti-malaria program prohibiting standing water were in direct contradiction. Third, although Ministries have the responsibility for policies, they may find themselves stymied in the execution of this role due to competition with the depart-ments and agencies they supervise. Illegal small-scale mining

12412. PoliCies and insTiTuTions
EPA. The EPA suffers from institutional weaknesses, which include: a weak policy environment; weak enforcement and compliance system; declining budget and resources for program implementation; limited decentralization and low budget allocations to local levels, as well as poor accountability of resources by departments and field offices in terms of performance (results, outputs, and outcomes); poor staff remuneration and performance management, inadequate planning, monitoring and evaluation, and knowledge management systems; suboptimal coordination with partner organizations; and poor client service orientation. The 2008 Ghana Environmental Sector Study concluded that these weaknesses led to inadequate service delivery, underperformance of the permitting and certification system, low levels of mainstreaming environment across sectors, low staff morale and high turnover, among others. To address these issues, the EPA Five-Year Strategic Plan (2011-2015) proposed a number of activi-ties covering policies, institutions, legal reforms, and environmental assessment and legal compliance, all of which helped to reduce the magnitude of the challenges but did not fully alleviate them. A few of the more pressing institutional challenges encountered by the EPA are: i) non-compliance with EIAs, ii) lack of coordination, iii) poor knowledge management.
Non-compliance with EIAs. The high degree of non-compliance with EIA regulations signals major systemic issues. To ensure compli-ance and enforcement with L.I. 1652, in 2016 the EPA undertook a nationwide monitoring exercise of 5,068 facilities and determined that 4,585 (91 percent) were operating without environmental per-mits. Decentralization of the EIA system has led to non-standardized practices. There are long turnaround times for processing applica-tions—in 2018 to early 2019 turnaround time in Accra was 2-44 days while in Ashanti Region it was 2-156 days. To address long wait times, EPA instituted an expedited review process whereby applicants pay higher fees for faster service, however, this approach raises equity issues as those unable to pay suffer undue delays.
EPA has delayed issuing certificates to cover environmental manage-ment plans submitted by most mining companies, with one company operating without a certificate since 2011 after expiration of its initial permit. In effect, companies operating without valid certificates are doing so illegally. Delays experienced in processing applications have resulted in other regulatory agencies disregarding or marginalizing EIA permit requirements. Despite significant progress, a 2005 assess-ment of EIA system performance, a 2013 review by Appiah-Opoku and Bryan (which identified challenges in EA follow-up), and a 2018 study commissioned by the Ghana Wildlife Society—reviewing 124 pieces of legislation and 28 policies—show that EIA implementation still faces multiple constraints and challenges (Table 12.1).
(galamsey) is a case in point for the failure of clear, well-delin-eated environmental leadership.
● Unequal benefits sharing. Law enforcement has proved inef-fective because natural resource laws emphasize control over planning and are not management-oriented. Not enough is done to help local populations to manage resources and the populations benefit little from resource revenues. By the time that revenue trickles to ministries in charge of environmental issues and the localities from which that revenue is generated, it is already mightily diminished. This disincentivizes respect for the rule of law, as illustrated by illegal gold mining.
Institutional inefficiencies. Ghana has a high number of institutions to deal with environmental management, yet the institutional framework for environmental management is incomplete. Strategic policy direc-tion is missing for environmental resource management issues. MLNR and MEST (2010) reported the combination of potentially conflicting mandates within single institutions—policy coordination, regulation, and management—as impeding improvements to the country’s envi-ronmental governance system. They also view the Constitution’s wording as ambiguous in defining the relationship between sector agencies and parent ministries. In their view, the agencies need stronger policy direction from parent ministries to operate efficiently within the national policy framework. The environmental resource management system is weak at all levels, especially at the decision-making and policy and district levels.
MESTI. Weak technical capacity in creating environmental policies has diminished MESTI’s ability to provide effective direction on envi-ronmental management issues. The Ministry gives disproportionate attention to science and technology issues to the neglect of environ-mental aspects. The Ministry’s coordination function is also under-utilized, with poor alignment of environmental sector stakeholders, partly because the framework delineating stakeholder roles and responsibilities lacks clarity, thus there is limited mainstreaming of environmental concerns across MDAs.
Information and knowledge management both within MESTI and with stakeholders is poor and most departments operate in “compartmen-talized” units without sharing information. The low level of knowledge and public awareness of environmental issues can be attributed to lack of a coordinated environment program, and often policies are not properly disseminated or communicated to inform decisions at the local level. MESTI suffers from budgetary issues that adversely affect program implementation (See Section on PEER). Monitoring and evaluation (M&E) of environmental indicators, both internal and externally, is weak with no comprehensive database available to track inputs, outputs, outcomes, and impacts.

125
2005 Assessment 2019 GWS 2013 Appiah-Opoku & Bryan (EIA follow-up)
Value of EIA not appreciated, seen as time wasted
Lack of standard procedures Lack of clarity in roles/respon-sibilities in decision-making, implementation
Lack of public participa-tion and availability of EA documentation
EIA conducted at too late a stage, applications to EPA not made in timely fashion
Reliance on applicants to imple-ment and monitor their own impact mitigation measures
Lack of experience and expertise Lack of application of the mitigation hierarchy
Limited consultant capacity to carry out EIA
Insufficient monitoring due to inadequate logistics, manpower
Little clarity on triggers, thresh-olds that initiate EIAs
Quality control
Lack of guidelines Lack of scientific rigor, baseline information, and quality in reports
Lack of screening/scoping requests and opinions, including alternatives
Insufficient link to sectoral regulations
Limited resources for compliance, enforcement, public awareness, capacity building
Ambiguity around what is considered part of the impact assessment
Insufficient arrange-ments for compliance and enforcement
Table 12.1: Challenges in EIA implementation (Various authors).
Lack of coordination. Absence of coordination and collaboration mechanisms is a significant handicap. Currently, the MC allocates mining concessions without regard to current land use (such as agri-culture), and settlements pay compensation and relocate communi-ties. The situation applies to other commissions established under the Constitution which act without prior regard to the environmental implications of their actions. At the establishment of the EPA, pro-grams were carried out through committees. With implementation of NEAP, however, it was done through inter-sectoral networks that were institutionalized in EPA’s organizational structure. This consultative mechanism between EPA and the sector agencies was discontinued due to the high cost of supporting participation by stakeholders. EPA has realized the value of the networks and intends to reinstate them according to a revised organogram. Such interactions led to establishment of the WRC.
Poor knowledge management. Ghana’s environmental institutions lack comprehensive monitoring, evaluation, and knowledge manage-ment systems. Lack of information is a constraint for environmental resource management because resource inventories are not current. For example, an internal EPA audit in 2018 found that EPA is not able to renew expired permits because it lacks a database to trigger follow-up on expired permits. Other challenges abound.
Absence of land use planning. Absence of a framework for land-use planning is a glaring omission in Ghana’s environmental resource management system. Four decades ago the 1979 Land Use Planning Committee Report (MLNR) reported that exploitation and use of these resources frequently creates conflicts, and that successful resource use in one area can cause problems in other areas. Resource appraisal must be viewed in comprehensive terms based on a clear understanding of the physical, environmental, and economic relation-ships between the different resources. Until this missing feature is rectified, environmental and natural resource management will be problematic.
Limited citizen participation. Environmental resource management expertise does not reside solely in public institutions, but also in the private sector and civil society. There is, however, little public awareness and lack of involvement by local communities in decision-making. A study on the impact of environmental policy on livelihoods of forest fringe communities found out that policymaking is mainly centralized. Communities are not involved in the policies that affect their livelihood as resource users, so the policies are ineffective at achieving intended objectives.
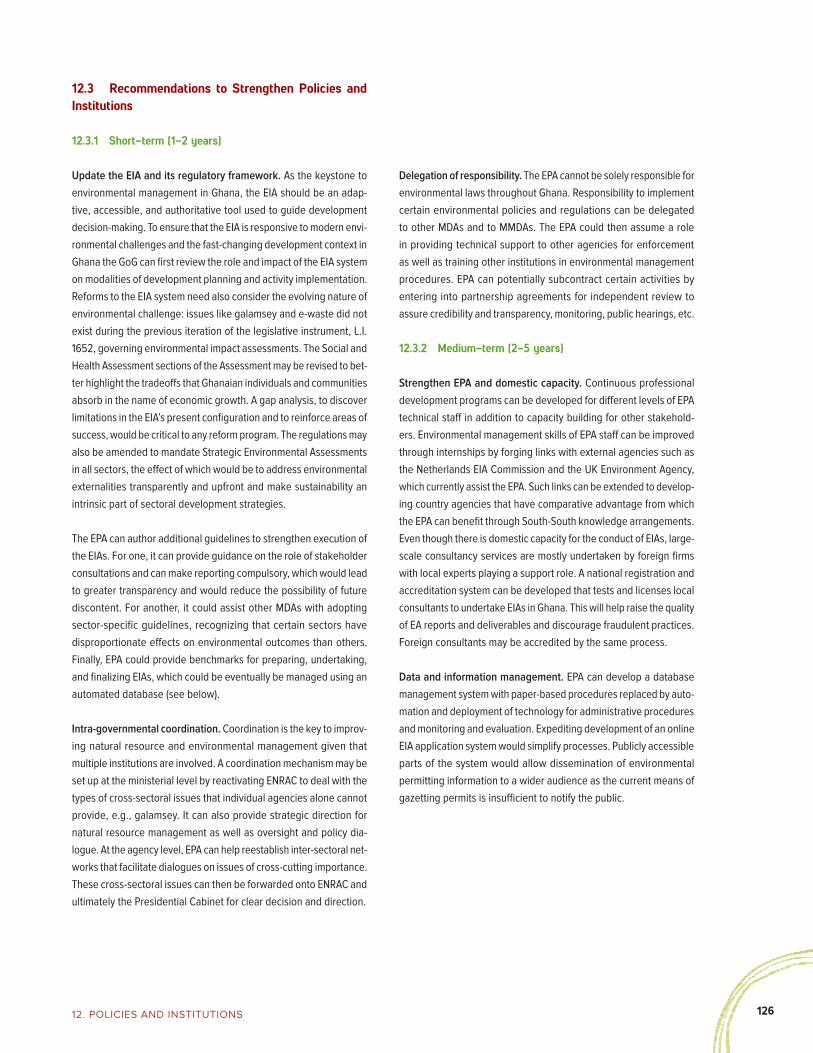
12612. PoliCies and insTiTuTions
Delegation of responsibility. The EPA cannot be solely responsible for environmental laws throughout Ghana. Responsibility to implement certain environmental policies and regulations can be delegated to other MDAs and to MMDAs. The EPA could then assume a role in providing technical support to other agencies for enforcement as well as training other institutions in environmental management procedures. EPA can potentially subcontract certain activities by entering into partnership agreements for independent review to assure credibility and transparency, monitoring, public hearings, etc.
12.3.2 Medium-term (2-5 years)
Strengthen EPA and domestic capacity. Continuous professional development programs can be developed for different levels of EPA technical staff in addition to capacity building for other stakehold-ers. Environmental management skills of EPA staff can be improved through internships by forging links with external agencies such as the Netherlands EIA Commission and the UK Environment Agency, which currently assist the EPA. Such links can be extended to develop-ing country agencies that have comparative advantage from which the EPA can benefit through South-South knowledge arrangements. Even though there is domestic capacity for the conduct of EIAs, large-scale consultancy services are mostly undertaken by foreign firms with local experts playing a support role. A national registration and accreditation system can be developed that tests and licenses local consultants to undertake EIAs in Ghana. This will help raise the quality of EA reports and deliverables and discourage fraudulent practices. Foreign consultants may be accredited by the same process.
Data and information management. EPA can develop a database management system with paper-based procedures replaced by auto-mation and deployment of technology for administrative procedures and monitoring and evaluation. Expediting development of an online EIA application system would simplify processes. Publicly accessible parts of the system would allow dissemination of environmental permitting information to a wider audience as the current means of gazetting permits is insufficient to notify the public.
12.3 Recommendations to Strengthen Policies and Institutions
12.3.1 Short-term (1-2 years)
Update the EIA and its regulatory framework. As the keystone to environmental management in Ghana, the EIA should be an adap-tive, accessible, and authoritative tool used to guide development decision-making. To ensure that the EIA is responsive to modern envi-ronmental challenges and the fast-changing development context in Ghana the GoG can first review the role and impact of the EIA system on modalities of development planning and activity implementation. Reforms to the EIA system need also consider the evolving nature of environmental challenge: issues like galamsey and e-waste did not exist during the previous iteration of the legislative instrument, L.I. 1652, governing environmental impact assessments. The Social and Health Assessment sections of the Assessment may be revised to bet-ter highlight the tradeoffs that Ghanaian individuals and communities absorb in the name of economic growth. A gap analysis, to discover limitations in the EIA’s present configuration and to reinforce areas of success, would be critical to any reform program. The regulations may also be amended to mandate Strategic Environmental Assessments in all sectors, the effect of which would be to address environmental externalities transparently and upfront and make sustainability an intrinsic part of sectoral development strategies.
The EPA can author additional guidelines to strengthen execution of the EIAs. For one, it can provide guidance on the role of stakeholder consultations and can make reporting compulsory, which would lead to greater transparency and would reduce the possibility of future discontent. For another, it could assist other MDAs with adopting sector-specific guidelines, recognizing that certain sectors have disproportionate effects on environmental outcomes than others. Finally, EPA could provide benchmarks for preparing, undertaking, and finalizing EIAs, which could be eventually be managed using an automated database (see below).
Intra-governmental coordination. Coordination is the key to improv-ing natural resource and environmental management given that multiple institutions are involved. A coordination mechanism may be set up at the ministerial level by reactivating ENRAC to deal with the types of cross-sectoral issues that individual agencies alone cannot provide, e.g., galamsey. It can also provide strategic direction for natural resource management as well as oversight and policy dia-logue. At the agency level, EPA can help reestablish inter-sectoral net-works that facilitate dialogues on issues of cross-cutting importance. These cross-sectoral issues can then be forwarded onto ENRAC and ultimately the Presidential Cabinet for clear decision and direction.

127
12.3.3 Long-term (5+ years)
Undertake national environmental policy planning. A national planning process can be instituted to produce action plans cover-ing 10-year cycles based on experience from the first NEAP (initiated in 1988). This includes participation by all stakeholders, especially civil society and private sectors. New issues such as climate change, e-waste management, environmental crime, and environmental management practices must be considered in existing policies. An annual environmental policy review can be held each year to evaluate implementation progress and assess the effectiveness of proposed actions in the plan.
Empower district-level environmental planning and management. For effective environmental management in Ghana, service delivery must at the district level. Although district assemblies are respon-sible for development and management of human settlements and their environment, they lack appropriate authority and capacity in
environmental management. Districts can be enabled to develop natural resource management plans with guidelines issued from the national level. An environment and natural resource management department can be set up within MMDAs to coordinate activities at the district and community levels. EPA and resource-oriented sector departments can provide technical support to these new depart-ments. The districts will conduct overall planning of environmental activities and act as link between communities and national level institutions. Effective environmental planning requires free and active input by communities. Decentralization of natural resource manage-ment can be tied to promotion of public participation.
12.4 Public Environment Expenditure Review (PEER)
A Public Environmental Expenditure Review (PEER) analyzes Government resource allocations for environmental and natural resource management. Public environmental expenditure looks at all environmental and natural resource clusters relevant to environ-mental management objectives, including those at the national and sub-national levels. These include pollution abatement and control costs, protection of biodiversity and landscapes, and research and development in environmental management, among others. Swanson and Lundethors (2003) suggest a definition of public environmental expenditures as “expenditures by public institutions for purposeful activities aimed directly at the prevention, reduction and elimination of pollution or any other degradation of the environment resulting from human activity, as well as natural resource management activi-ties not aimed at resource exploitation or production.”
The purpose of the Ghana PEER is to ascertain how much the GoG commits to the environment sector through it budget. Analyses are made of budgetary allocations and compared with actual dis-bursements, and discernible trends are assessed for implications on sustainable environmental management. Sustainable environ-mental management is necessary to improve the quality of life of all Ghanaians, but especially those in extreme poverty. Addressing environmental and natural resource management challenges through appropriate resource allocations at all levels in the budget process is critical to ensure environmental quality and promote sustain-able development. This PEER is based exclusively on expenditures financed by the GoG. 100
100. It is important to note that GoG funding is complemented by other sources including internally generated funds, the Multilateral Debt Relief Initiative, and donor support. These funds usually cover non-wage expenditures such as services and investment. Internally generated funds, however, include administrative expenditures.
Figure 12.1: Environment expenditure as percentage of GDP (left), and as percentage of total government expenditure (right), 2012-2017 (CAGD audited annual reports).
0.3
0.17
0.24
0.4
0.32
0.37
0.31
0.15
0.15
0.2 0.21
0.19
2 012 2013 2014 2015 2016 2017
Spen
ding
as
% o
f Gha
na's
GD
P
Budgeted Actual spend
2.48
2.43
1.95
4.16
2.43
3.58
2.6
2.18
1.18
2.09
1.58 1.
86
2 012 2013 2014 2015 2016 2017
% o
f tot
al e
xpen
ditu
re
Budgeted Actual spend

12812. PoliCies and insTiTuTions
Box 12.1: Overview and methodology for the Ghana PEER
Ghana adopted the United Nations Classification of Functions of Government (COFOG) to improve government accounting and ensure transparency in its operations, including compilation and presentation of fiscal statistics. COFOG’s standard classification of expenditures is (1) compensation of employees; (2) goods and services; (3) consumption of fixed capital, interest, subsidies, grants, social benefits, other expenses; and (4) non-financial assets or capital expenditure.
The annual national budget is prepared by sector ministries, departments, and agencies, consolidated by the Ministry of Finance, and subsequently submitted to Parliament for approval. The Ghana PEER covers the years 2012-2017. The public expenditure esti-mate methodology delves into projected and actual budget provisions to Ministries, Departments, and Agencies (MDAs) that have responsibilities in environment and natural resources protection, conservation, and management. The data were retrieved from the audited annual reports of Ghana’s Controller and Accountant General’s Department (CAGD)101. Public environmental expenditure data for the this 6-year period were screened, classified, and analyzed to get an estimate of public environmental expenditures.
Overall Government environmental spending includes expenditures in the spending units of the various MDAs with specific mandates for environmental and natural resource management, particularly MESTI and MLNR. It also includes spending units in other MDAs but with responsibility for environmental and natural resources management. Those ministries included MOFAD, Ministry of Local Government and Rural Development (MLGRD), Ministry of Sanitation and Water Resources (MSWR), and MOFA. The specific depart-ments and agencies identified for this PEER are included in the table below.
Ministry Departments and Agencies
MESTI • Environmental Protection Agency• Council for Scientific and Industrial Research• Town and Country Planning Department• National Biosafety Authority• Ghana Atomic Energy Commission• Nuclear Regulatory Authority
MLNR • Forestry Commission• Geological Survey Authority• Minerals Commission• Lands Commission• Office of the Administrator of Stool Lands
MoFAD • Fisheries Commission
MLGRD • Department of Parks and Gardens• Environmental Health and Sanitation
MSWR • Hydrological Services Department• Water Resources Commission
MoFA • Plant Protection and Regulatory Services• Crop Services Directorate• Directorate of Agricultural Extension Services
101. The Financial Administrative Act, 2003 (Act 654) mandates the CAGD to, among other functions: (1) receive all public and trust monies payable into the Consolidated Fund (done through its staff stationed in all Government departments, including those collecting revenue); (2) make disbursements on behalf of the Government (includes monthly salaries to government employees in active service; pension
gratuity and monthly pension payments to retirees; release of funds to implement Government projects and development initiatives); (3) pay all government workers’ wages, salaries, allowances; and (4) keep, prepare, render, and publish, monthly and annually, the Consolidated Fund’s financial statements.
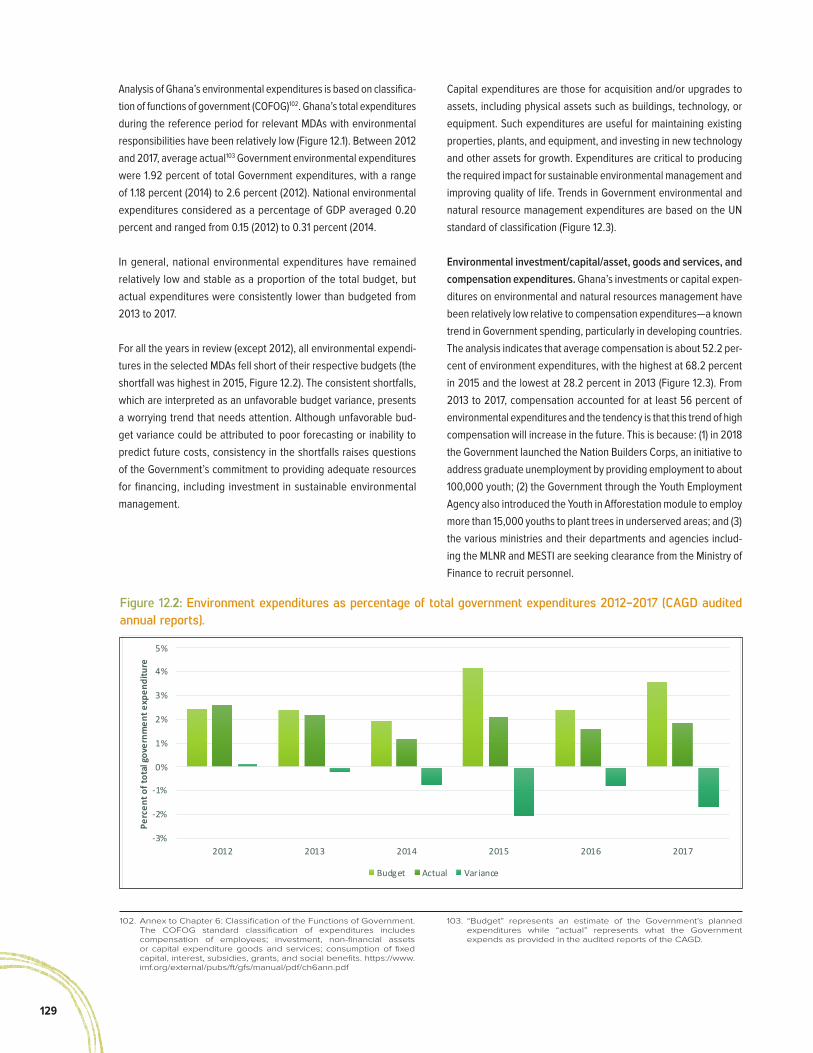
129
Analysis of Ghana’s environmental expenditures is based on classifica-tion of functions of government (COFOG)102. Ghana’s total expenditures during the reference period for relevant MDAs with environmental responsibilities have been relatively low (Figure 12.1). Between 2012 and 2017, average actual103 Government environmental expenditures were 1.92 percent of total Government expenditures, with a range of 1.18 percent (2014) to 2.6 percent (2012). National environmental expenditures considered as a percentage of GDP averaged 0.20 percent and ranged from 0.15 (2012) to 0.31 percent (2014.
In general, national environmental expenditures have remained relatively low and stable as a proportion of the total budget, but actual expenditures were consistently lower than budgeted from 2013 to 2017.
For all the years in review (except 2012), all environmental expendi-tures in the selected MDAs fell short of their respective budgets (the shortfall was highest in 2015, Figure 12.2). The consistent shortfalls, which are interpreted as an unfavorable budget variance, presents a worrying trend that needs attention. Although unfavorable bud-get variance could be attributed to poor forecasting or inability to predict future costs, consistency in the shortfalls raises questions of the Government’s commitment to providing adequate resources for financing, including investment in sustainable environmental management.
Figure 12.2: Environment expenditures as percentage of total government expenditures 2012-2017 (CAGD audited annual reports).
102. Annex to Chapter 6: Classification of the Functions of Government. The COFOG standard classification of expenditures includes compensation of employees; investment, non-financial assets or capital expenditure goods and services; consumption of fixed capital, interest, subsidies, grants, and social benefits. https://www.imf.org/external/pubs/ft/gfs/manual/pdf/ch6ann.pdf
103. “Budget” represents an estimate of the Government’s planned expenditures while “actual” represents what the Government expends as provided in the audited reports of the CAGD.
Capital expenditures are those for acquisition and/or upgrades to assets, including physical assets such as buildings, technology, or equipment. Such expenditures are useful for maintaining existing properties, plants, and equipment, and investing in new technology and other assets for growth. Expenditures are critical to producing the required impact for sustainable environmental management and improving quality of life. Trends in Government environmental and natural resource management expenditures are based on the UN standard of classification (Figure 12.3).
Environmental investment/capital/asset, goods and services, and compensation expenditures. Ghana’s investments or capital expen-ditures on environmental and natural resources management have been relatively low relative to compensation expenditures—a known trend in Government spending, particularly in developing countries. The analysis indicates that average compensation is about 52.2 per-cent of environment expenditures, with the highest at 68.2 percent in 2015 and the lowest at 28.2 percent in 2013 (Figure 12.3). From 2013 to 2017, compensation accounted for at least 56 percent of environmental expenditures and the tendency is that this trend of high compensation will increase in the future. This is because: (1) in 2018 the Government launched the Nation Builders Corps, an initiative to address graduate unemployment by providing employment to about 100,000 youth; (2) the Government through the Youth Employment Agency also introduced the Youth in Afforestation module to employ more than 15,000 youths to plant trees in underserved areas; and (3) the various ministries and their departments and agencies includ-ing the MLNR and MESTI are seeking clearance from the Ministry of Finance to recruit personnel.
-3%
-2%
-1%
0%
1%
2%
3%
4%
5%
2012 2013 2014 2015 2016 2017
Perc
ent o
f tot
al g
over
nmen
t exp
endi
ture
Budget Actual Variance

13012. PoliCies and insTiTuTions
Figure 12.3: Percentage of environment expenditures (COFOG standard classification), 2012-2017 (CAGD audited annual reports).
Consistent decline in environmental and natural resource man-agement investment/capital/assets expenditures. While compen-sation expenditures tend to be increasing over time, investments, including goods and services, have been relatively stable, with a tendency to even decrease. Average expenditures on goods and services and investment/capital as a percentage of environmental expenditures between 2012-2017 are 28.1 percent and 18.9 percent, respectively. It is evident that while goods and service as a percentage of environmental expenditures has continued to increase since 2014, investment/capital expenditures as percentage of environmental expenditures continued to decrease from 32.8 percent in 2013 to 6.7 percent in 2017 (Figure 12.3).
Ghana’s main environmental management MDAs with the great-est responsibilities, resource allocations, and spending power for environmental management are MLNR and MESTI (Figure 12.4). Investment expenditures to these MDAs have been relatively low with high shortfall for all years. Government allocations to MLNR and MESTI for investment/capital/asset has been less than one percent of overall government expenditures, and this continued to decline for MLNR since 2014, with the lowest in 2017 at 0.08 percent. The sum of all actual expenditures on investments/capital/assets and goods and services by MLNR and MESTI fell short of the budget for the years 2012-2017 (lowest shortfall was in 2014 and highest in 2015 for MLNR). The budgeted and actual investment/assets and
0%
10%
20%
30%
40%
50%
60%
70%
80%
2012 2013 2014 2015 2016 2017
Perc
ent o
f tot
al g
over
nmen
t exp
endi
ture
Compensation Goods & Services Investment Interest, Social Benefit , & Other
Figure 12.4: Environmental spending as percentage of total government expenditure, 2012-2017 (CAGD audited annual reports).
-1.0%-0.8%-0.6%-0.4%-0.2%0.0%0.2%0.4%0.6%0.8%
0.0%0.2%0.4%0.6%0.8%1.0%1.2%1.4%1.6%1.8%
MLN
R
MES
TI
Oth
ers
MLN
R
MES
TI
Oth
ers
MLN
R
MES
TI
Oth
ers
MLN
R
MES
TI
Oth
ers
MLN
R
MES
TI
Oth
ers
MLN
R
MES
TI
Oth
ers
2012 2013 2014 2015 2016 2017
Variance (di fference between actual and budgeted) (right axis)
Budgeted expenditures
Actual expenditures

131
employee compensation for MLNR and MESTI are presented in Figure 12.5 and Figure 12.6.
Since 2013, the Government has spent less than what was budgeted in overall environmental spending. Yet, as noted earlier, deforesta-tion and land degradation have been increasing since the last two decades, with vegetation health decreasing since 2000 (World Bank,
2018). Reducing and reversing these trends of deforestation and land degradation require significant Government investment, especially capital expenditures. If left unaddressed this trend in expenditures will hamper achievement of Ghana’s medium-term vision, which is underpinned by goals such as safeguarding the natural environment and ensuring a resilient, built environment.
Figure 12.5: MLNR and MESTI Investment/Capital Expenditures (Audited annual reports of CAGD).
Figure 12.6: MLNR and MESTI compensation or employee's remuneration (Audited annual reports of CAGD).
1.7%
0.3%
3.7%
0.3%
2.1%
0.9%
4.4%
2.4%
3.9%
2.3% 2.5%
7.1%
0.3% 1.
4%
0.5%
0.0%
1.3%
0.0% 0.7%
0.1% 0.2%
0.1%
0.1%
0.0%
-1.4%
1.1%
-3.3%
-0.3%
-0.8%
-0.9%
-3.8% -2.3%
-3.7% -2.2%
-2.4%
-7.1%
M LNR MES T I MLNR MES T I MLNR MES T I MLNR MES T I MLNR MES T I MLNR MES T I
2012 2013 2014 2015 2016 2017
% o
f tot
al g
over
nmen
t exp
endi
ture
Budget Actual Variance
0.4%
0.8%
0.3%
0.6% 0.7%
1.2%
0.8%
1.1%
0.7%
1.1%
0.8%
1.1%
0.8%
1.3%
0.6%
1.5%
0.6%
1.2%
0.6%
1.1%
0.6%
0.9%
0.6%
0.9%
0.3% 0.
5%
0.4%
1.0%
-0.1%
0.0%
-0.2%
0.0%
0.0%
-0.1%
-0.2% -0
.2%
M LNR MES T I MLNR MES T I MLNR MES T I MLNR MES T I MLNR MES T I MLNR MES T I
2012 2013 2014 2015 2016 2017
% o
f tot
al g
over
nmen
t exp
endi
ture
Budget Actual Variance

13212. PoliCies and insTiTuTions
Paddling in traditional wooden canoe, Sopotnicki / Shutterstock.

133
13

13413. ConClusions
13. ConclusionsGhana’s future lies in its youth, strong and vibrant cultural heritage, and world-renowned commodities such as cocoa and gold. Accra is at the cutting-edge of Africa’s capital cities, but how will Ghana preserve its history when its monuments are being eaten away by rising seas? How will the capital attract emigrants, the dias-pora, expatriates, visitors, and investors when its air is becoming increasingly sooty and its beaches polluted with plastic and other wastes? How can Ghanaian cocoa remain one of the world’s favorite foods when its forests are being destroyed by deforestation and illegal mining?
Ghana can no longer afford to consume its natural capital and expect economic growth to continue unabated. As the country advances farther into middle-income status, increased consumption of natural resources, be it timber, cocoa, fish, or gold, will exact an increasingly heavy toll on future growth. If current unsustainable natural resource management remains unchanged Ghana, the country will see its wealth destroyed over the long term, with fewer opportunities to sustain growth and share prosperity.
Heightened vigilance of the effects of environmental change, preser-vation of critical and vulnerable ecosystems, planning and investment in climate-smart preparedness and infrastructure, transition to a “green economy”—these are all ways in which Ghana can adapt to an earth system in flux and prevent the sacrifice of public and ecologi-cal health on the altar of unsustainable development. Three major recommendations from this report will help the Government to usher in a new era of pro-growth, pro-poor, and pro-environment policies.
13.1 Prioritize environmental considerations in development planning
Ghana’s environment can only thrive if Ghanaians make a conscious choice to do so. As stated in the Constitution, the GoG and Ghanaian citizens share a dual, mutually-reinforcing duty to safeguard the country’s environmental resources.
13.1.1 For the Government
Increase the ENRM sector budget. For the public sector to ensure that public environmental goods are well tended, adequate resources need to be dedicated to their management. This CEA has illustrated that the GoG has not committed sufficient resources to sustain-able stewardship of the environment. The Public Environmental Expenditure Review showed low levels of funding to MESTI and MLNR. Regulatory agencies, notably EPA, but also MC, FC, and WRC, among others, cannot provide proper oversight and corrective rem-edies—compliance and effects monitoring, impact management, audit evaluation—if they lack operational budgets.
Mainstream national wealth accounting. Traditional measures of economic growth such as GDP underestimate the importance of natural capital to a country’s development and social, economic, and spiritual well-being. Yet, there are other measures that tell us if a development path is sustainable. National wealth accounting quantifies a country’s natural capital and other asset classes. It warns when a country experiences economic growth by liquidating natural capital. Integrating accounting into national economic analysis can help Ghana review tradeoffs between environmental preservation and resource use/extraction and help make decisions that allow it to prudently, efficiently, and sustainably manage natural capital and reinvest proceeds into its people (human capital) and infrastructure (produced capital).
SANKOFA: learn from the
past to improve the
future

135
Act now against climate change. Strategic planning is essential to prepare for and mitigate the effects of climate change. Given that the worst effects of climate disruption are projected to occur to those who are least able to bear them, the extreme poor in Ghana may have to manage disaster risks in the Northern Savannah, the urban slums of Accra, coastal communities, and elsewhere.
13.1.2 For the citizens
Promote raising public awareness and proactivity. This cannot occur in a vacuum of information, nor in the absence of understanding. Dissemination of information, from data indicators to legal rights, not only needs to be made publicly accessible, but the population must also be educated on how to use such knowledge. Government and civil society organizations have a role to play in informing the public on the stakes of environmental degradation. They can spur their proactivity on issues where individuals and communities can contribute to prevention or remediation of environmental hazards. A publicly available scorecard showing achievements and deficien-cies could keep the population informed and the GoG incentivized and accountable to meet its environmental duties. Concerned non-profits and the private sector can increase the focus on public health problems posed by hazardous waste sites and degraded natural ecosystems and encourage greater citizen participation in returning these areas to a productive state. Moreover, Ghana has a wealth of brainpower from its excellent university system, yet this expertise is underutilized. Politicians can convene scientists, academics, and researchers to probe environmental quandaries by asking the right questions. They can also work with economists, industries, and entre-preneurs to brainstorm, pilot, and scale market-based mechanisms to solve ecological challenges.
13.2 Strengthen institutions for accountability, transpar-ency in environment and natural resource management
Enhance EPA powers. Although EPA is founded under an omnibus clause—meaning it has a stake in everything that pertains to Ghana’s environment—its main mechanisms, EIA, and to a lesser extent SEA—are not backed up sufficiently with enforcement powers. If the EPA is going to be the apex institution to enforce environmental regulations, it needs to be granted prescriptive powers. The adaptive capacity of EPA needs to be enhanced. The enactment of laws and other legal instruments is a laborious, time-consuming process that does not react fast enough to new environmental challenges such as e-waste, coastal erosion, and illegal ASGM.
Accelerate decentralization. Incomplete decentralization efforts leave the Districts and local institutions in limbo. Many of the most challenging environmental issues are in the interior, not in Accra, and an understanding of local dynamics is a major component for managing them. Yet, it is virtually impossible to monitor the entire country from the EPA head office in Accra, while challenges remain
in managing localities from Regional capitals. It is imperative that coordination and devolution of responsibility occurs to the most local level possible to monitor and responds rapidly to environmen-tal crises. EPA field agents can be granted stronger monitoring and enforcement resources and powers, leaving headquarters to work on national strategy and environmental mainstreaming across sectors. Finally, decentralization without needed resources is self-defeating.
Create autonomous watchdogs. Autonomous watchdogs that are independent from Ministries or other entities can help ensure that conflicts of interest, excesses, and poor governance practices within environmental management institutions are prevented. MESTI is meant to monitor the EPA, which raises the question—who monitors those doing the monitoring? As the parent ministry to EPA, impartial-ity is not possible. An institution charged with auditing performance and spending based on legislated criteria that is free from politi-cal interference is one way to stop untoward or inefficient natural resource governance.
13.3 Enforce and reinforce existing laws and advance critical policy reforms
Enforce existing laws. Ghana generally has a robust legal frame-work for environmental management, but complications arise in executing its laws. Regulatory agencies that ensure compliance need reinforcement through recognition of their authority, proportionate financial and technical resources, and checks and balances that prevent political interference with law enforcement.
Bolster existing tools used to manage the environment. Environmental degradation is not a fait accompli from economic growth. Planning, monitoring, and evaluation can decouple national policies and local activities from unmanageable externalities. Strategic Environment Assessments and Environmental Impact Assessments are the key instruments in actualizing this goal. For the environmental assessment process to be effective it needs: a strong legislative base with clear purpose; specific requirements and prescribed responsibili-ties; dedicated financial resources; appropriate controls to ensure scope and rigor; flexible timetables for completion; incentives for public participation; problem and decision-orientation concerned with the issues that matter; accessibility of consequential information; and a transparent and clearly defined rationale for permit approvals and condition setting. Importantly, a culture of receptivity by decision-makers, enterprises, and communities to abide by the results of an environmental assessment must be forged.
Advance other critical reforms. Policy failures lie at the root of many environmental issues and have led to a sense of impunity when it comes to contaminating the environment. To rectify this situation, Ghana can advance urgently needed reforms, including, by way of example:

13613. ConClusions
● Benefits sharing. The allocation of natural resource revenues to citizenry at a community level is insufficient given the lack of infrastructure in rural areas and the recurrence of illegal resource extraction, highlighted by the galamsey phenome-non. MDF implementation is a good start, but GoG may want to consider increasing the percentage of royalties and taxes that return to communities with resources that are most in need.
● Justice sector reform. Stronger anti-corruption laws in the ENRM sector, judges who are well versed in environment and natural resource laws, and mandatory jail sentences for Ghanaians who collude to despoil the environment are start-ing points.
● Elimination of perverse incentives. Lower import duties on newer, environmentally efficient cars will bring in vehicles that emit less pollution, while import duties on WEEE can be raised to discourage non-useful electronics from making their way to Ghana’s dumpsites. Subsidies for pre-mixed fuel of the type used by fishermen can be eliminated to reduce pressure on Ghana’s fishing grounds.
The Adinkra symbol “Sankofa” urges us to look to the past to make a better future. The details of new environmental challenges will
change—climate change impacts along the coast, mining for bauxite in sensitive areas, air quality and sanitation in growing urban
areas—but the root of the issues will fundamentally remain the same. Is Ghana today using its renewable and non-renewable resources
wisely enough for the Ghana of tomorrow?
Kakum National Forest near Cape Coast, Central Region.Jonathan Ernst / World Bank

137
14

13814. annex
14. AnnexA: Approach to the Cost of Environmental Degradation
The study, which was based exclusively on secondary information, estimated the COED using a variety of methods (Table A1). Data sources included consultations with Government officials, official publications, and scientific articles. Priority was given to country-level information like the Demographic and Health Survey (GSS et al., 2015) and Ghana’s Third National Communication to the UNFCCC. Global datasets, such as the World Bank’s Hidden Dimensions of Poverty database, the Institute for Health Metrics and Evaluation’s Global Burden of Disease, the World Research Institute’s Global Forest Watch, and FAOSTAT provided complementary information.
Several data limitations affected the study, imposing the use of rough approximations or precluding calculation of certain cost components. Examples relate to the physical quantification of damages: in some cases, available publications lacked consensus on data (e.g., defor-ested area); in other cases, available data was collected based on differing methodologies (e.g., ground-level monitoring vs. satellite-derived PM2.5 concentration). Data limitations also affected monetary valuation, e.g. valuation of damages related to forests is based on benefits transfer estimates obtained from other studies. Finally, limi-tations prevented the valuation of other impacts, notably, air pollut-ants other than PM2.5, exposure to heavy metals other than lead and mercury, reduced recreational opportunities and property values due to water pollution, impacts at the macro level on food security, exports, GDP growth, etc. Therefore, the results of this study are conservative estimates which only partially reflect the real value of the CoED in Ghana.
Air pollution health burden estimation
We estimate health outcomes from ischemic heart disease (IHD), cerebrovascular disease (stroke), lung cancer, chronic obstructive pulmonary disease (COPD), diabetes mellitus 2 and lower respiratory infections (LRI) that may be attributed to ambient and indoor PM2.5 air pollution in Ghana in 2017. The health burden for each disease is expressed in terms of in terms of annual number of deaths.
We first estimate the background mortality using countrywide back-ground mortality figures provided in GBD (2017)104.
To estimate the fractions of the background mortality from these diseases that are attributable to ambient and indoor air pollution, we use an integrated exposure-response (IER) relative risk (RR) function for disease outcome, k, in age-group, l, associated with exposure to fine particulate matter pollution (PM2.5) both in the outdoor and household environments (Burnett et al, 2014):
where x is the ambient concentration of PM2.5 in µg/m3 and xcf is a counterfactual concentration below which it is assumed that no association exists (5.2 µm/m3 in this report). The function allows prediction of RR over large range of PM2.5 concentrations. However, we are able to estimate the RRs for mortality only, due to lack of information on background morbidity incidence of the corresponding negative health end-points in Ghana. We apply the same IER function to both ambient and indoor air pollution since PM2.5 is the criteria ambient pollutant and pollutant within each household associated with additional mortality. We then apply the RR value for each of the above listed diseases to estimate the population attributable frac-tion for the population exposed to different PM2.5 concentrations, as described in (World Bank & IHME, 2016 – Figure A1) for ischemic heart disease (IHD), cerebrovascular disease (stroke), lung cancer, chronic obstructive pulmonary disease (COPD), and lower respira-tory infections (LRI); and as described in (Bowe et al., 2018) for diabetes mellitus 2.
The risk functions for IHD and stroke are age-specific with five-year age intervals from 25 years of age, while singular age-group risk functions are applied for lung cancer (≥ 25 years), COPD (≥ 25 years), Diabetes mellitus 2 and LRI in children (total population). Disease burden for IHD, lung cancer, COPD, diabetes mellitus 2 and stroke is estimated for three population groups starting age 25. For LRI the disease burden is estimated for all population, starting from children under 5 years of age.
104. http://ghdx.healthdata.org/gbd-results-tool

139
IMPACTS ON NATURAL RESOURCES
Agricultural land ● Loss of yield due to soil erosion Market price
Forests
Impact of deforestation
● Losses of timber, NTFPs, watershed services Benefits transfer
Fisheries ● Loss in fisheries due to excessive fishing Market price
Inland floods ● Impact of inland floods Market price of assets
Coastal zone ● Impact of coastal erosion and floods Market price (for assets and land) and benefits
transfer (for ecosystem services)
Climate change ● Impact of carbon emissions Shadow price of carbon
Notes: VSL = Value of Statistical Life; * Refers to artisanal gold mining and other contaminated sites.
The population attributable fraction of disease from PM2.5 exposure is calculated using the following expression:
where Pi is the share of the population exposed to PM2.5 concentra-tions in the range xi-1 to xi. This population attributable fraction is calculated for each disease outcome, k, and age group, l. The disease burden (B) in terms of annual cases of disease outcomes due to PM2.5 exposure is then estimated by:
Categories Impacts Valuation method
IMPACTS ON HEALTH
Air
Impact of ambient and household air pollution
● Mortality due to exposure to fine particulate matter (PM2.5) (isch-emic heart disease; stroke; chronic obstructive pulmonary disease; tracheal, bronchus and lung cancer; diabetes mellitus type 2)
● Morbidity due to exposure to air pollutants
VSL for mortality
Benefits transfer for morbidity
Water
Impact of inadequate water, sanitation and hygiene*
● Mortality due to water borne diseases (diarrhea; typhoid; schistoso-miasis; malnutrition)
● Morbidity due to water-borne diseases
VSL for mortality
Cost of illness for morbidity
Mining*
Impact of toxic chemicals and heavy metals
● Mortality and morbidity due to lead and mercury exposure VSL for mortality; Forgone income
for morbidity
Table A1: Summary of CoED estimation methods
where Dkl is the total annual number of cases of disease, k, in age group, l, and PAFkl is the attributable fraction of these cases of disease, k, in age group, l, due to PM2.5 exposure.

14014. annex
1. Estimate population attributable fractions (PAFs) for 6 diseases associated with PM2.5 air pollution using ambient average moni-toring data, relative risk from GBD2017, and GBD2017 for back-ground mortality on the national level
2. Estimate attributed mortality by five age groups with the cor-responding RR from GBD 2017
3. Adjustment for multiple risk for lower respiratory illness, since multiple rick factors affects children under 5 to cause LRI
4. Monetary valuation of physical impacts: For mortality end-points valuation, applied GDP-adjusted VSL estimates from OECD coun-tries as per Narain and Sall (2016)
5. Morbidity cost estimated as 10 percentage of mortality cost
1. Household PM2.5 monitoring data from (Van Vliet, 2016)
2. Exposure for HAP for urban areas estimated from DHS (2016)
3. Similar approach to the health cost assessment as for AAP
4. Adjustment for multiple risk is for lower respiratory illness, since multiple rick factors affects children under 5 to cause LRI
Steps to value AAP cost Steps to value HAP cost

141
Figure A1. Integrated exposure-response (IER) Functions for (a) ischemic heart disease, (b) stroke, (c) lung cancer and CoPD, and (d) lower respiratory infections
Water supply, sanitation and hygiene health burden estimation
Prüss-Üstün et al. (2014) present an assessment of relative risk of diarrheal, typhoid, and some other disease reduction in population that is located in different WASH tiers. These relative risks almost twice reduced compare to the old methodology, which reflects new understanding of health burden from unsafe WASH, supported by the recent epidemiological studies (Wolf et al, 2014). The population attributable fraction of diarrheal and typhoid disease associated with inadequate WASH exposure is calculated by the following expression:
where Pi is the share of the population with a scenario i of WASH (described by waste and sanitation tiers) and RRi is the relative risk at the scenario i. GBD 2017 data on diarrheal, typhoid and paratyphoid mortality in Ghana are used for background mortality.
For diarrheal morbidity household surveys on diarrheal prevalence among children under 5 years of age are used to estimate morbidity burden. Adult morbidity burden is approximated from the children diarrheal morbidity based on the literature. The Demographic and Health Survey 2014 (DHS 2014) provides data on diarrheal preva-lence in children under the age of five years. It reports a diarrheal prevalence (preceding two weeks) rate at 11-13 percent for urban and rural Ghana.
Sometimes diarrheal illness requires hospitalization. There are no readily available centralized records in Ghana that provide data on the annual number of diarrheal hospitalizations. International experience on the total number of intestinal disease hospitalizations was there-fore used, corresponding to about 0.3 percent of diarrheal cases.
Baseline data for estimating health burden associated with inad-equate drinking water supply and sanitation is presented in Table A2. The duration of diarrheal illness is assumed to be 3-4 days.

14214. annex
Table A2: Baseline Data for Estimating Morbidity Cost
The following log-linear function is applied by Lanphear et al (2005) to estimate IQ losses in children from elevated BLLs:
Lanphear et al (2005) report a β=2.70 for concurrent measurement of BLL (BLL at time of IQ test). Although no BLL threshold (X0), below which there are no impacts on children’s IQ have been identified in the international research literature, X0 was adopted at 2 µg/dL as explained above.
Schwartz (1994) applied a linear model that is more conservative at a lower BLL levels. For the higher BLL the Lanphear et al (2005) estimate is more conservative.
An individual’s lifetime income is related to her IQ score, as estab-lished by Schwartz (1994) and Salkever (1995). These studies found that a decline of one IQ point is associated with a 1.4-1.9 % decline in lifetime income, respectively.105 (Attina &Trasande, 2013) estimated lost lifetime economic productivity (LEP) using average IQ point loss per microgram per deciliter BLL, percent lost LEP per IQ point, and total lost LEP. Lost LEP was derived based on a U.S. estimate (Grosse et al. 2002) of decrements in LEP per IQ point loss at 2% loss in LEP–IQ point estimate. This study assumed annual growth in productivity of 3% and a 4.5% discount rate.
Baseline Source
Diarrheal 2-week Prevalence in urban children under 5 years 11-13% DHS 2014
Estimated annual diarrheal cases per child under 5 years 2.3-2.4 Estimated from DHS 2014
Estimated annual diarrheal cases per person (> 5 years) 0.3-0.7 Estimated from a combination of DHS 2014
and Egypt Survey, Colombia Survey
Hospitalization rate (% of all diarrheal cases) 0.3 % Expert estimate
105. The high bound reflects the estimated loss in income in Salkever (1995), weighted by the labor force participation rates (0.77 in Ghana).
Steps to measure inadequate WASH
1. Risk variation for diarrhea and typhoid estimated in the range 60-64%, applying WHO methodology
2. RR for corresponding risk reduction in different WASH scenarios are applied
3. Population attributable fractions (PAFs) estimated using RR (for-mula 5)
4. PAFs applied to background diarrheal and typhoid mortality from GBD 2017 adjusted to urban and rural population
5. Attributed morbidity estimated from DHS 2016 and PAFs
6. 50% of malnutrition health effect on children under 5 years of age (excluding diarrhea and typhoid to avoid double counting) is added to reflect indirect impact of WASH
7. Morbidity valued using Cost of Illness and Productivity Loss method
Lead exposure in children burden estimation
Following Fewtrell et al (2004), loss of IQ is estimated for children under five years of age (the population at risk is represented by each one-year cohort of children under 5 years of age). This methodology uses blood lead levels (BLL) in children as an indicator of a potential loss of IQ.

143
Steps to value cost of lead exposure in children
1. Annual IQ loss attributed to exposure to lead, estimated using recent studies on blood lead level in children
2. The Lanphear (for the high) and Schwartz (for the low) models are applied to convert BLL level into IQ loss for 1-year cohort of exposed children in lead polluted hotspots
3. Total IQ loss is valued as 1.4-1.9% of lifetime income, adjusted by labor force participation and probability of survival in Ghana
Mercury exposure health burden estimation
Steckling et al. (2017) estimates YLD attributed to moderate cases of CMMVI (mortality and severe cases are not included in the analy-sis) based on the annual prevalence rate of CMMVI (24.2-29.9%) (Steckling et al., 2017), and disability weights (DWs) for moderate cases (DW: 0.368, UI: 0.261-0.484) and severe cases (DW: 0.588, UI: 0.193-0.907) (Steckling et al 2015). Severe cases of CMMVI are excluded because it is assumed that gold miners suffering from such severe health effects are no longer able to work and thus not included in the prevalence numbers. YLDs are presented with UIs basically indicating the impact of the uncertainty of the DW.
Lost YLDs are valued at GDP per capita in 2017 to come up with the annual health burden attributed to the artisan gold mining.
Steps to value cost of mercury exposure in ASGM workers
1. Total number of workers in ASGM from the literature
2. Total number of YLDs lost due to exposure to mercury from the literature
3. Lost YLDs are valued at GDP per capita in 2017
Adjustment to multiple risks
The estimates are adjusted to multiple risks for air pollution and occupational risks as recommended in (World Bank & IHME, 2016) to account for a combined exposure to pollutants with the same attrib-uted health end-point. When more than one of the environmental risk factors assessed in this report causes the same disease, then the total disease burden from these risk factors is overestimated if simply added up by risk factor. To avoid this double-counting the joint attributable fraction (AFT) formula for n risk factors can be applied to estimate total mortality from the specific disease (i):
This formula does, however, not provide the “adjusted” AFi for each risk factor so that:
As an approximation, the adjusted attributable fraction for each individual risk factor is here calculated as follows:
where the adjusted attributable fractions satisfy equation above.
The adjusted AFs are applied in the individual sections of this report to estimate the disease burden from each environmental risk factor.
14414. annex
Table A3: Benefit transfer of VSL for Ghana (estimated by authors)
Low High
Average VSL estimates from OECD (million US$) 3.2 3.8
Country's GDP (US$ billion) in 2017 59 59
Country's GDP PPP (US$ billion) in 2017 129.8 129.8
Population (million) in 2017 29 29
GDP per capita (PPP US $) in 2017 4,476 4,476
Average GDP/capita differential 0.12 0.12
Income elasticity of VSL 1.40 1.00
PPP 2.2 2.2
VSL transferred to Ghana (million US$) 0.07 0.21
Estimation of the economic value of the health burden of pollution
In this report, we use lost welfare approach to estimate the economic cost of health burden attributed to pollution. Welfare loss is calculated by multiplying the estimated number of premature deaths with the value of statistical life (VSL). VSL measures “represents an aggregate of individuals’ willingness to pay (WTP) for marginal reductions in their mortality risks. It is not the value of any single person’s life or death, nor does it represent a society’s judgment as to what that value should be. (Narain and Sall, 2016). VSL is estimated using the stated preference approach, whereby surveyed individuals are asked how much they would hypothetically be willing to reduce their mortality risk marginally. As such, VSL is not limited to the value of output that would be lost in case of premature death but covers an array of other values that contribute to an individual’s and the society’s welfare. Therefore, this measure is not directly comparable with GDP.
VSL estimates are available for OECD countries. In this report, we transfer a range of VSL estimates from OECD countries to Ghana using the average GDP per capita differential and assumptions regarding the income elasticity of VSL, following the guidance in Narain and Sall (2016). The resulting low and high-end values, US$ 0.062 and US$ 0.169 million are used in this report.
Specifically, we use the formula below for benefit transfer:
Table A3 presents the derivation of a range of VSL for Ghana from low-end and high-end VSL estimates in OECD countries (Narain and Sall, 2016), using the above formula. This range of adjusted VSL is used in welfare-based CoED estimates in this report.

145
Economic cost of overfishing
In theory the initial stock of fish (S) is assumed to grow at a net natural rate (r). This rate is equal to the recruitment of young fish joining the stock plus the growth of original fish in the stock minus natural fish mortality. If fish catch (H) exceeds r*S then fishing could eventually lead to the reduction of S.
An inverted U-shaped relationship exists between r and level of fish-ing effort E, and also between H and E. At low levels of effort, fish stock is high, causing overcrowding and slow growth. As fishing effort rises, the stock declines and crowding is lessened, causing faster growth. Finally, at higher levels of effort, there is a smaller stock to reproduce and growth slows again. The point at which the level of effort (E) yields the maximum net natural rate (r) is the maximum sustainable point. At this point, the fish catch (H) is the biological optimum, the so-called maximum sustainable yield (MSY).
For marine resource planning and management purposes, economic concerns are important, and prices of fish catch and fishing effort are introduced to turn the biological parameters into economic param-eters. Total revenue (TR) is the product of fish catch (H) and the price of fish. Total cost (TC) is the product of level of fishing effort (E) and
the unit price of effort. If the price of fish and unit price of effort are assumed constant, then the TR curve will be inversely U-shaped and the TC curve will be a straight upward sloping line in relation to level of effort (Figure A2).
Economic theory explains that as level of effort (E) initially increases TR also increases but at a decreasing rate. Continued increase in E brings the level of TR first to the economic optimum with maximum economic profit, or the maximum economic yield (MEY). If the fish-ery were run efficiently, fishing would stop at MEY where economic profit is at a maximum. However, with complete open-access, fishing continues beyond MEY as more and more fishermen, motivated by economic profit, enter the fishery sector. This situation first pushes the level of fishing past the economic optimum to the maximum sustain-able yield (MSY), which as mentioned is the biological optimum of the fish stock. At the MSY level, positive economic profits still exist, as TR remains greater than TC. This induces further fishing until the open access yield (OAY) is reached. At this point, positive economic profit or economic rent is zero and, without any incentive to continue fishing, further human predation stops.106 This approach assumes optimization of fishing efforts to achieve an optimal biomass level corresponding to MEY or MSY.
Figure A.2: Maximum Sustainable and Economic Level of Fishing Effort (Adapted from Israel, 1995).
106. Zero economic profit or economic rent is equivalent to a normal financial rate of return on capital. At OAY the fishery sector is still financially profitable but no more than other sectors.
14614. annex
Exposed assets: 31 land use categories and classes are mapped, reflecting differences in the values at risk and vulnerabilities among urban, suburban, and rural categories, specific economic activities (agriculture, industry, services, ports, transportation) and ecosystems (wetlands, mangroves, etc.).
Max value at risk: The GDP per ha reflects the value of the economic activity in that location. In absence of such a detailed valuation map, the study maps GDP using information on land use, population density and GDP per capita, accounting for differences between rural and urban areas in employment and the sector of employment (agricul-ture, industry, and services), corrected for the presence of high value assets (schools or ports). Total value of the assets per ha is estimated at US$762-1719. Based on literature analysis wetlands are estimated at US$150 ha/year, and mangroves at US$ 3,847 ha/year. If wetland is populated and some productive assets are present, the wetland is estimated at US$800 ha/year.
Damage functions: The damage functions for floods (tangible dam-ages) present percentage of assets and ecosystem lost due to the water depth during flood with short and long duration separately. These functions are based on the review of worldwide literature on flood damage functions in (Huizinga et al., 2017). The damage func-tion for flood victims is estimated at 0.16 fatal cases per 1000 people exposed. Erosion damage functions are estimated as a direct effect of relocation with a consequent loss of all assets and indirect effects reflecting loss of productivity due to relocation. Damage function (25 years, 4% discount rate) is estimated at US$9-53 thousand in rural areas, US$49-659 thousand in suburban, peri-urban, and urban areas, US$302-652 thousand for industry, transport, services and ports. The impact on ecosystem is estimated at 5% loss/year from floods, 15% loss of mangroves values and 100% loss of wetlands val-ues due to erosion (US$ 4-14 thousand), and 50% loss of mangroves value and 75% of wetlands value loss due to sea level rise. Damage function from water pollution is estimated as additional morbidity and mortality due to inadequate WASH for the exposed population. This component is estimated at 1.1% of GDP.
Economic cost of coastal degradation
(soil erosion and coastal floods)
The risks from erosion, coastal flooding and sea level rise, are assessed by (World Bank, 2017) with a four-step methodology:
1. The hazard assessment: which describes flood and erosion events, with a specified return period, for three (3) periods in time (2015; 2050; 2100)
2. The exposure assessment: the people, assets, production and ecosystem services at risk
3. The damage assessment: the victims, restoration costs, and loss of production and ecosystem services
4. The risk assessment: aggregation of the damages for different events, type of risks, and current and future risks
The study (Colophon, 2017) assesses damages and risk per grid cell (1 ha). For a single event (e.g. one type of flood), the damage per grid cell is calculated separately for urban and rural areas in 2015, 2050 and 2010 as follows:
Damage = (Exposed assets, people, ecosystems)*(Max value at risk) x (Damage function)
Risk of erosion is estimated at 100%. Risk for floods is estimated as
Risk = expected damage = damage from the flood x probability of the flood
Where,
● Exposed assets, people, ecosystems are estimated from mapping the people, assets, production and ecosystem services values at risk
● Max value at risk is estimated including the estimation of the value of the exposed assets, people (buildings, infrastructure, etc.) ($/ha), exposed production values (US$/ha/year), and ecosystem services (US$/ha/year)
● Damage functions from the literature for erosion, flooding and sea level rise are utilized
● Probability of the 100-year flood at 1% is included in the analy-sis on the national level

147
The Aqueduct Global Flood Analyzer
1. Global hydrological and hydraulic modeling. Daily river runoff and flood volumes (0.5°x0.5°) for the period 1960-1999 simu-lated using the global hydrological model PCR-GLOBWB and its extension for dynamic routing, DynRout. Daily precipitation, temperature, and radiation are used to estimate river runoff, and for each global 0.5°x0.5° cell, the resulting volume of water that ends up either in the river channel or on the adjacent floodplain (if flooding occurs) is estimated.
2. Extreme value statistics. From the daily flood volume time series for 1960-1999 annual maximum flood volumes for each 0.5°x0.5° cell on the map extracted and fitted to a Gumbel extreme value distribution curve. This allows to calculate flood volumes for floods of any magnitude (ranging from a 2-year flood event to a 1000-year flood event).
3. Inundation modeling. In this step, the relatively coarse resolu-tion (0.5°x0.5°) flood volumes conversed into high resolution (30”x30”) flood hazard maps showing inundation depths for each cell on the map. This is done using the GLOFRIS downscaling module.
4 Impact modeling. Several types of “impacts” per 30”x30” cell on the map for a variety of flood magnitudes (e.g. floods occur-ring once in 10 years, 100 years, 1000 years) are estimated. The impacts are then aggregated to user-selected geographic units (countries, states, basins). The impacts included in the Aqueduct Flood Analyzer are (1) population exposed to flooding, (2) GDP exposed to flooding, and (3) urban damage – in U.S. dollars – from flooding.
5. Exposed population and GDP. Exposed population and GDP estimated using downscaled population and GDP data for 2010. For each inundated cell on the map, the number of people and amount of GDP in the inundated cell counted and aggregated up to the country level.
6. Urban damage. Urban area per 5’x5’ cell on the map is estimated and economic values to urban areas are assigned. Then a stage damage function used to estimate the percentage of flooded urban assets that would be damaged for different flood depths.
7. Estimation of “annual expected impacts”. Each impact – including exposed population, exposed GDP, and urban damage – was calculated for floods of the following magnitudes: 2-year flood, 5-year-flood, 10-, 25-, 50, 100-, 250-, 500-, and 1000-year flood. The impact of a 2-year-flood event was always deemed to be zero. Then “risk curves” or “exceedance probability-impact curves” are fitted. “Annual expected impact” is calculated as the area under the risk curve.
Source: http://floods.wri.org

14814. annex
B: Selected E-waste Contaminants and Their Effects on Health
CHEMICAL SOURCE HEALTH EFFECTS
Metal contaminants
Arsenic (As) Circuit boards, semiconductors, LCD displays,
computer chips
Chronic exposure can lead to skin diseases and decrease nerve conduction
velocity; lung cancer carcinogen
Cadmium (Cd) Electrical contacts, switches, solder joints,
NiCd batteries, PVC, light-emitting layer in CRT,
printer inks/toners
Kidney damage, bone diseases: osteomalacia and osteoporosis;
hypertension and heart disease; effects on respiratory system, including
pulmonary emphysema and lung cancer; exposure to fumes causes flu-like
symptoms
Lead (Pb) Cathode ray tube (CRT) glass, lead-acid
batteries, polyvinyl chloride cable sheathing,
solder, printed wiring boards
Damage to nervous, cardiovascular, reproductive systems, and kidneys;
acute effects on brain development in young children; short-term exposure
to high levels can cause vomiting, diarrhea, convulsions, coma, and death;
toxic effects seen in animals and lead is toxic to all aquatic life
Mercury (Hg) Fluorescent lamps (that backlight LCDs,
alkaline batteries, mercury-wetted switches),
batteries, flat screen electronic displays,
switches, thermostats, relays, housing
Brain and liver damage; cognitive and psychomotor damage; loss of color
discrimination; psychological issues: anxiety/depression; heightened
sensitivity in children with long-term exposure leading to nerve and brain
damage and birth defects in newborns; in fish, blood and behavioral
abnormalities, and death
Nickel (Ni) NiCd/NiMH batteries, electron gun in CRT Dust and certain nickel compounds are carcinogenic; causes asthma
attacks, chronic bronchitis, reduced lung function; water with high amounts
of nickel causes stomach ache, effects to blood and kidneys; damage
to lungs, nasal cavity, stomach, blood, liver, kidneys, and immune and
reproductive systems, as well as development in animals
Non-metal contaminants
Polybrominated
diphenyl ethers (PBDEs)
Flame retardant additive in plastics and foams,
including casings of electronic equipment
Possible carcinogen; endocrine disrupting properties lead to severe
hormonal disorders, immune system effects; chronic exposure associated
with abnormal brain development in animals, possible long-term impacts on
memory, learning and behavior; may affect humans similarly
Polychlorinated
biphenyls (PCBs)
Used in transformer oils, capacitor dielectrics,
hydraulic fluids, plasticizers, printing inks
May affect endocrine systems; incidences of stunted growth, including to
immune system, neurological effects, delayed cognitive development and
behavioral problems; in animals: known carcinogen; effects on immune,
nervous, reproductive, and endocrine systems
Polychlorinated
dibenzo-p-dioxins/
furans (PCDD/Fs)
Formed during combustion (open burning of
wires and plastics)
Carcinogenic under chronic exposure; skin lesions (e.g., chloracne); impacts
to liver function; immune, endocrine, and reproductive system impairment;
adverse effects on developing nervous systems in fetuses/newborns
Polyvinyl chloride (PVC) Most widely used plastic; cooling units,
insulation foam
Known carcinogen; inhalation causes dizziness, sleepiness, fainting, even
death; respiratory issues; skin issues from liquid form of PVC; long-term
exposure: structural damage to liver, nerve damage, immune reactions,
problems with circulatory system; damage to sperm and testes in animals
Adapted from Brigden et al., 2008; Huang et al., 2014; WHO; CDC (ASTDR); ewaste.ee.washington.edu

149
15
15015.referenCes
15.ReferencesIntroduction
Lange, Glenn-Marie, Quentin Wodon, and Kevin Carey (eds). 2018. The Changing Wealth of Nations 2018: Building a Sustainable Future. Washington, D.C.: World Bank.
Molini, Vasco, and Pierella Paci. 2015. Poverty Reduction in Ghana — Progress and Challenges: Overview. Ghana in Brief. Washington, D.C.: World Bank.
World Bank. 2016a. Expanding Job Opportunities in Ghana. Washington, D.C.: World Bank Group.
World Bank. 2016b. “Philippines: Natural Capital Accounting as a Planning Tool.” Country Brief, April. Washington, DC: World Bank.
World Bank. 2017. Ghana - Agriculture Sector Policy Note: Transforming Agriculture for Economic Growth, Job Creation, and Food Security. Washington, D.C.: World Bank Group.
World Bank. 2018a. Ghana - Priorities for Ending Poverty and Boosting Shared Prosperity. Washington, D.C.: World Bank Group.
World Bank. 2018b. Third Ghana Economic Update: Agriculture as an Engine of Growth and Jobs Creation. Washington, D.C.: World Bank Group.
The Cost of Environmental Degradation
Akpalu, Wisdom, and M. Okyere. 2018. The Socio-Economic Analysis of The Fisheries Sector in Ghana. Draft report. Washington, D.C.: World Bank.
Angelsen, Arild, Pamela Jagger, Ronnie Babigumira, Brian Belcher, Nicholas J. Hogarth, Simone Bauch, Jan Börner, Carsten Smith-Hall, and Sven Wunder. 2014. "Environmental Income and Rural Livelihoods: A Global-Comparative Analysis." World Development 64: S12-S28.
Braimah, Maurice M., Issahaku Abdul-Rahaman, Daniel Oppong-Sekyere, Prince Hasimu Momori, Adams Abdul-Mohammed, and George Alexander Dordah. 2014. "A Study into the Causes of Floods and its Socio-economic Effects on the People of Sawaba in the Bolgatanga Municipality, Upper East, Ghana."
Diao, Xinshen, and Daniel B. Sarpong. 2007. "Cost Implications of Agricultural Land Degradation in Ghana: An Economywide, Multimarket Model Assessment." Ghana Strategy Support Program. Washington, D.C.: IFPRI (International Food Policy Research Institute).
Dowling, Russell, Jack Caravanos, Patrick Grigsby, Anthony Rivera, Bret Ericson, Yaw Amoyaw-Osei, Bennett Akuffo, and Richard Fuller. 2016. "Estimating the Prevalence of Toxic Waste Sites in Low-and Middle-Income Countries." Annals of Global Health 82 (5): 700-710.
Feldt, Torsten, Julius N. Fobil, Jürgen Wittsiepe, Michael Wilhelm, Holger Till, Alexander Zoufaly, Gerd Burchard, and Thomas Göen. 2014, "High Levels of PAH-Metabolites in Urine of E-waste Recycling Workers from Agbogbloshie, Ghana." Science of the Total Environment 466: 369-376.
Ghana, GSS (Ghana Statistical Service), GHS (Ghana Health Service), and ICF International. 2015. Ghana Demographic and Health Survey 2014. Rockville, MD: ICF International.
Ghana, GSS (Ghana Statistical Service). 2017. Ghana Labor Force Report 2015. Accra.
Ghana, MESTI (Ministry of Environment, Science, Technology and Innovation). 2017. Ghana’s Third National Communications Report to the UNFCCC. Environmental Protection Agency, Accra.
Ghana, MESTI (Ministry of Environment, Science, Technology and Innovation). 2017. LDN (Land Degradation Neutrality) Baseline. Environmental Protection Agency, consultant report prepared by C. Quansah, Accra, Ghana.

151
Ghana, MESTI (Ministry of Environment, Science, Technology and Innovation). 2018. Ghana’s Second Biennial Update Report to the United Nations Framework Convention on Climate Change. Environmental Protection Agency, Accra.
Ghana, MLNR (Ministry of Lands and Natural Resources). 2017. Ghana’s National Forest Reference Level. National REDD+ Secretariat, Forestry Commission, Accra.
Hunt, Alistair, Julia Ferguson, Fintan Hurley, and Alison Searl. 2016. “Social Costs of Morbidity Impacts of Air Pollution.” OECD Environment Working Papers. Paris: OECD Publishing.
Koranteng, K., and L. Awity. 2018. Marine and Inland Ecosystem Health and Status of Commercial Fish Stocks. Draft report. Washington, D.C.: World Bank.
OECD (Organisation for Economic Cooperation and Development). 2014. The Cost of Air Pollution. Paris: OECD Publishing.
Poulin, Jessie, Herman Gibb, Annette Prüss-Üstün, and WHO (World Health Organization). 2008. Mercury: Assessing the Environmental Burden of Disease at National and Local Levels. Geneva: WHO.
Prüss Ustün, Annette, Jamie Bartram, Thomas Clasen, John M. Colford Jr, Oliver Cumming, Valerie Curtis, Sophie Bonjour, Alan D. Dangour, Jennifer De France, Lorna Fewtrell, Matthew C. Freeman, Bruce Gordon, Paul R. Hunter, Richard B. Johnston, Colin Mathers, Daniel Mäusezahl, Kate Medlicott, Maria Neira, Meredith Stocks, Jennyfer Wolf, and Sandy Cairncross"Burden of Disease from Inadequate Water, Sanitation and Hygiene in Low and Middle Income Settings: A Retrospective Analysis of Data from 145 Countries." Tropical Medicine & International Health 19 (8): 894-905.
Siikamäki, Juha, Francisco J. Santiago-Ávila, and Peter Vail. 2015. Global Assessment of Non-Wood Forest Ecosystem Services: Spatially Explicit Meta-Analysis and Benefit Transfer to Improve the World Bank’s Forest Wealth Database. Washington, D.C.: Program on Forests (PROFOR).
Stanaway, Jeffrey D., Ashkan Afshin, Emmanuela Gakidou, Stephen S. Lim, Degu Abate, Kalkidan Hassen Abate, Cristiana Abbafati et al. 2018. "Global, Regional, and National Comparative Risk Assessment of 84 Behavioural, Environmental and Occupational, and Metabolic Risks or Clusters of Risks for 195 Countries and Territories, 1990–2017: A Systematic Analysis for the Global Burden of Disease Study 2017." The Lancet 392 (10159): 1923-1994.
Van Donkelaar, Aaron, Randall V. Martin, Michael Brauer, N. Christina Hsu, Ralph A. Kahn, Robert C. Levy, Alexei Lyapustin, Andrew M. Sayer, and David M. Winker. 2016. "Global estimates of fine particu-late matter using a combined geophysical-statistical method with
information from satellites, models, and monitors." Environmental Science & Technology 50 (7): 3762-3772.
WHO (World Health Organisation). 2018. Health Impacts of Air Pollution in Accra. Presentation in Accra, Ghana, 13 August 2018.
World Bank; Institute for Health Metrics and Evaluation. 2016. The Cost of Air Pollution: Strengthening the Economic Case for Action. World Bank, Washington, DC.
World Bank. 2017a. Cost of Coastal Environmental Degradation, Multi-Hazard Risk Assessment and Cost Benefit Analysis: Report D5: An Executive Comparative Report on the Coastal Zones Management and the COCED Results. A report for the World Bank by International Marine and Dredging Consultants. Washington, D.C.: World Bank Group.
World Bank. 2017b. Guidance Note on Shadow Price of Carbon in Economic Analysis (English). Washington, D.C.: World Bank Group.
Air Pollution
Bowen, Alex. 2012. “‘Green’ Growth, ‘Green’ Jobs and Labor Markets." Policy Research Working Paper 5990. Sustainable Development Network, Chief Economist’s Office. Washington, D.C.: World Bank.
Chafe, Zoë A., Michael Brauer, Zbigniew Klimont, Rita Van Dingenen, Sumi Mehta, Shilpa Rao, Keywan Riahi, Frank Dentener, and Kirk R. Smith. 2014. "Household Cooking with Solid Fuels Contributes to Ambient PM2.5 Air Pollution and the Burden of Disease." Environmental Health Perspectives 122 (12): 1314-1320.
Ghana, GSS (Ghana Statistical Service), GHS (Ghana Health Service), and ICF International. 2015. Ghana Demographic and Health Survey 2014. Rockville, Maryland, USA: ICF International.
Ghana, MESTI (Ministry of Environment, Science, Technology and Innovation). 2014. National Environmental Policy. Accra.
Ghana, MESTI (Ministry of Environment, Science, Technology and Innovation). 2015. Ghana’s Intended Nationally Determined Contribution (INDC) and Accompanying Explanatory Note. Accra.
Ghana, MLGRD (Ministry of Local Government and Rural Development). 2010. National Environmental Sanitation Strategy and Action Plan (NESSAP): Materials in Transition (MINT). Environmental Health and Sanitation Directorate, Accra.

15215.referenCes
Ghana, NPA (National Petroleum Authority). 2016. “Report on Two-Day Workshop on ‘Low Sulphur Fuels in Ghana,’ Theme: Promoting Low Sulphur in West Africa,” Accra, October 31 – November 1.
HEI (Health Effects Institute). 2019. State of Global Air 2019. Special Report. Boston, MA: HEI.
Ofosu, Francis G., Philip K. Hopke, Innocent J.K. Aboh, and Samuel A. Bamford. 2013. "Biomass Burning Contribution to Ambient Air Particulate Levels at Navrongo in the Savannah Zone of Ghana." Journal of the Air & Waste Management Association 63 (9): 1036-1045.
Piedrahita, R., Ernest Kanyomse, Evan Coffey, Mingjie Xie, Yolanda Hagar, Rex Alirigia, Felix Agyei, Christine Wiedinmyer, Katherine L. Dickinson, Abraham Oduro, and Michael Hannigan. 2017. “Exposures to and Origins of Carbonaceous PM2.5 in a Cookstove Intervention in Northern Ghana.” Science of the Total Environment 576: 178–192.
Rooney, Michael S., Raphael E. Arku, Kathie L. Dionisio, Christopher Paciorek, Ari B. Friedman, Heather Carmichael, Zheng Zhou et al. 2012. "Spatial and Temporal Patterns of Particulate Matter Sources and Pollution in Four Communities in Accra, Ghana." Science of the Total Environment 435: 107-114.
UN (United Nations), Statistics Division. 1997. Glossary of Environment Statistics: Studies in Methods, Series F. No. 67. New York: United Nations.
UNEP (United Nations Environment Programme). 2011. Near-term Climate Protection and Clean Air Benefits: Actions for Controlling Short-lived Climate Forcers. Nairobi, Kenya: UNEP.
Van Donkelaar, Aaron, Randall V. Martin, Michael Brauer, N. Christina Hsu, Ralph A. Kahn, Robert C. Levy, Alexei Lyapustin, Andrew M. Sayer, and David M. Winker. 2016. "Global Estimates of Fine Particulate Matter Using a Combined Geophysical-Statistical Method with Information from Satellites, Models, and Monitors." Environmental Science & Technology 50 (7): 3762-3772.
Van Vliet, Eleanne DS, Kwakupoku Asante, Darby W. Jack, Patrick L. Kinney, Robin M. Whyatt, Steven N. Chillrud, Livesy Abokyi, Charles Zandoh, and Seth Owusu-Agyei. 2013. "Personal Exposures to Fine Particulate Matter and Black Carbon in Households Cooking with Biomass Fuels in Rural Ghana." Environmental Research 127: 40-48.
WHO (World Health Organisation). 2014. WHO Indoor Air Quality Guidelines: Household Fuel Combustion. Geneva: WHO.
Wiedinmyer, Christine, Katherine Dickinson, Ricardo Piedrahita, Ernest Kanyomse, Evan Coffey, Michael Hannigan, Rex Alirigia, and Abraham Oduro. 2017. “Rural–Urban Differences in Cooking Practices
and Exposures in Northern Ghana.” Environmental Research Letters 12. 065009. 10.1088/1748-9326/aa7036.
World Bank. 2013. Turn Down the Heat: Climate Extremes, Regional Impacts, and the Case for Resilience. A report for the World Bank by the Potsdam Institute for Climate Impact Research and Climate Analytics. Washington, D.C.: World Bank.
World Bank, and ClimateWorks. 2014. Climate-Smart Development: Adding Up the Benefits of Actions that Help Build Prosperity, End Poverty and Combat Climate Change. Washington, D.C.: World Bank and San Francisco: ClimateWorks Foundation.
World Bank. 2016. “Toward Universal Access to Clean Cooking and Heating: Early Lessons from the East Asia and Pacific Clean Stove Initiative.” LiveWire 2016/62. World Bank Energy and Extractives Global Practice Knowledge Note. Washington, D.C.: World Bank.
World Bank. 2018. Local and Regional Pollution Reduction Co-Benefits from Climate Change Mitigation Interventions: A Literature Review. World Bank Independent Evaluation Group (IEG) Working Paper 2018/No.1. Washington, D.C.
Zhou, Zheng, Kathie L. Dionisio, Thiago G. Verissimo, Americo S. Kerr, Brent Coull, Raphael E. Arku, Petros Koutrakis, John D. Spengler, Allison F. Hughes, Jose Vallarino, Samuel Agyei-Mensah, and Majid Ezzati. 2013. "Chemical Composition and Sources of Particle Pollution in Affluent and Poor Neighborhoods of Accra, Ghana." Environmental Research Letters 8 (4): 044025.
Zhou, Zheng, Kathie L. Dionisio, Thiago G. Verissimo, Americo S. Kerr, Brent Coull, Stephen Howie, Raphael E. Arku, Petros Koutrakis, John D. Spengler, Kimberly Fornace, Allison F. Hughes, Jose Vallarino, Samuel Agyei-Mensah, Majid Ezzati. 2014.
"Chemical Characterization and Source Apportionment of Household Fine Particulate Matter in Rural, Peri-Urban, and Urban West Africa." Environmental Science & Technology 48 (2): 1343-1351.
Plastic Pollution
Adama-Tettey, Quaranchie. 2012. Plastic Waste Management in Ghana; the Journey Traveled. News Ghana (17.03.2012)
Ghana, GSS (Ghana Statistical Service). 2014. Digest of International Merchandise Trade Statistics – 2009-2013. Accra.
Jambeck, Jenna R., Roland Geyer, Chris Wilcox, Theodore R. Siegler, Miriam Perryman, Anthony Andrady, Ramani Narayan, and Kara

153
Lavender Law. 2015. "Plastic Waste Inputs from Land into the Ocean." Science 347 (6223): 768-771.
Kaza, Silpa, Lisa C. Yao, Perinaz Bhada-Tata, and Frank Van Woerden. 2018. What a Waste 2.0: A Global Snapshot of Solid Waste Management to 2050. Urban Development Series. Washington, DC: World Bank.
Kershaw, P. J., and C. M. Rochman. 2015. "Sources, Fate and Effects of Microplastics in the Marine Environment: Part 2 of a Global Assessment." Reports and Studies-IMO/FAO/UNESCO-IOC/WMO/IAEA/UN/UNEP Joint Group of Experts on the Scientific Aspects of Marine Environmental Protection (GESAMP) Eng no. 93.
Koelmans, Albert A., Ellen Besseling, Anna Wegnert, and Edwin M. Foekema. 2013. Plastic as a Carrier of POPs to Aquatic Organisms: A Model Analysis.” Environmental Science and Technology 47 (14): 7812-7820.
Miezah, Kodwo, Kwasi Obiri-Danso, Zsófiá Kádár, Bernard Fei-Baffoe, and Moses Mensah. 2015. “Municipal Solid Waste Characterization and Quantification as a Measure Towards Effective Waste Management in Ghana.” Waste Management 45: 15-27.
North, Emily J., and Rolf U. Halden. 2013. “Plastics and Environmental Health: The Road Ahead.” Environmental Health 28 (1): 1-8.
Revel, Messika, Amélie Châtel, and Catherine Mouneyrac. 2018. “Micro(nano)plastics: A Threat to Human Health?” Current Opinion in Environmental Science and Health 1: 17-23.
Troutman, Heather, and Kwadwo Aseidu-Dankwah. 2017. “Waste Valorization as a Sustainable Strategy for Plastic Waste Management in Developing Economies: A Case Study of Accra, Ghana.” M.Sc. Thesis. Resource Efficiency in Architecture and Planning, HafenCity University Hamburg, Germany.
Verma, Rinku, K. S. Vinoda, M. Papireddy, and A. N. S. Gowda. 2016. "Toxic Pollutants from Plastic Waste-A Review." Procedia Environmental Sciences 35: 701-708.
E-waste
Akortia, Eric, Olubiyi I. Olukunle, Adegbenro P. Daso, and Jonathan O. Okonkwo. 2017. "Soil Concentrations of Polybrominated Diphenyl Ethers and Trace Metals from an Electronic Waste Dump Site in the Greater Accra Region, Ghana: Implications for Human Exposure." Ecotoxicology and Environmental Safety 137: 247-255.
Amankwaa, Ebenezer Forkuo. 2013. "Livelihoods in Risk: Exploring Health and Environmental Implications of E-waste Recycling as a Livelihood Strategy in Ghana." The Journal of Modern African Studies 51 (4): 551-575.
Amoyaw-Osei, Yaw, Obed Opoku Agyekum, John A. Pwamang, Esther Mueller, Raphael Fasko, and Mathias Schluep. 2011. "Ghana E-waste Country Assessment." SBC E-waste Africa Project 111. Accra: Ghana.
Asante, Kwadwo Ansong, Sam Adu-Kumi, Kenta Nakahiro, Shin Takahashi, Tomohiko Isobe, Agus Sudaryanto, Gnanasekaran Devanathan et al. 2011. "Human Exposure to PCBs, PBDEs and HBCDs in Ghana: Temporal Variation, Sources of Exposure and Estimation of Daily Intakes by Infants." Environment International 37 (5): 921-928.
Atiemo, Sampson, Lambert Faabeluon, Andreas Manhart, Letitia Nyaaba, and Tobias Schleicher. 2016. “Baseline Assessment on E-waste Management in Ghana.” Sustainable Recycling Industries. St. Gallen: World Resource Forum Association, Freiburg: Öko-Institut e.V., Accra: Ghana National Cleaner Production Centre, and Vienna: Sofies.
Baldé, Cornelis P., Vanessa Forti, Vanessa Gray, Ruediger Kuehr, and Paul Stegmann. The Global E-waste Monitor 2017: Quantities, flows and resources. Bonn: United Nations University, Geneva: International Telecommunication Union, and Vienna: International Solid Waste Association.
Brigden, Kevin, Iryna Labunska, David Santillo, and Paul Johnston. 2008. "Chemical Contamination at E-waste Recycling and Disposal Sites in Accra and Korforidua, Ghana." Amsterdam: Greenpeace.
Caravanos, Jack, Edith Clarke, and C. Lambertson. “Assessing the Exposure Risks and Potential Health Effects from Chemical
Contamination at an Electronic and Electrical Recycling and Waste Site in Accra, Ghana.” Journal of Health and Pollution 1 (1): 16-25.
Caravanos, Jack, Edith E. Clarke, Carl S. Osei, and Yaw Amoyaw-Osei. 2013. “Exploratory Health Assessment of Chemical Exposures at E-waste Recycling and Scrapyard Facility in Ghana.” Journal of Health and Pollution 3 (4): 11-22.
CEHRT Environmental Consulting. 2015. “Technical Report on the Sustainable Management of E-waste in Ghana.” Accra: Ghana.
Chama, Mary A., Ebenezer F. Amankwa, and Martin Oteng-Ababio. 2014. “Trace Metal Levels of the Odaw River Sediments at the Agbogbloshie E-waste Recycling Site.” Journal of Science and Technology 34: 1–8.
Daum, Kurt, Justin Stoler, and Richard Grant. 2017. “Toward a More Sustainable Trajectory for E-waste Policy: A Review of a Decade

15415.referenCes
of E-waste Research in Accra, Ghana.” International Journal of Environmental Research and Public Health 14 (2): 135.
Davis, John-Michael, Grace Akese, and Yaakov Garb. 2019. "Beyond the Pollution Haven Hypothesis: Where and Why do E-waste Hubs Emerge and What Does this Mean for Policies and Interventions?" Geoforum 98: 36-45.
Farouk, Braimah R., and Mensah Owusu. 2012. "“If in Doubt, Count”: the Role of Community-Driven Enumerations in Blocking Eviction in Old Fadama, Accra." Environment and Urbanization 24 (1): 47-57.
Feldt, Torsten, Julius N. Fobil, Jürgen Wittsiepe, Michael Wilhelm, Holger Till, Alexander Zoufaly, Gerd Burchard, and Thomas Göen. 2014, "High Levels of PAH-Metabolites in Urine of E-waste Recycling Workers from Agbogbloshie, Ghana." Science of the Total Environment 466: 369-376.
Fujimori, Takashi, Takaaki Itai, Akitoshi Goto, Kwadwo A. Asante, Masanari Otsuka, Shin Takahashi, and Shinsuke Tanabe. 2016. “Interplay of Metals and Bromine with Dioxin-Related Compounds Concentrated in E-waste Open Burning Soil from Agbogbloshie in Accra, Ghana.” Environmental Pollution 209: 155–163.
Grant, Richard, and Martin Oteng-Ababio. 2012. “Mapping the Invisible and Real “African” Economy: Urban E-waste Circuitry.” Urban Geography 33 (1): 1-21.
Grant, Richard, and Martin Oteng-Ababio. 2016. “The Global Transformation of Materials and the Emergence of Informal “Urban Mining” in Accra, Ghana.” Africa Today 62 (4): 3–20.
Hosoda, Junki, John Ofosu-Anim, Edward Benjamin Sabi, Lailah Gifty Akita, Siaw Onwona-Agyeman, Rei Yamashita, and Hideshige Takada. 2014. "Monitoring of Organic Micropollutants in Ghana by Combination of Pellet Watch with Sediment Analysis: E-waste as a Source of PCBs." Marine Pollution Bulletin 86 (1-2): 575–581.
Huang, Jingyu, Philip Nti Nkrumah, Desmond Ofosu Anim, and Ebenezer Mensah. " E-waste Disposal Effects on the Aquatic Environment: Accra, Ghana.” Reviews of Environmental Contamination and Toxicology 229: 19-34.
Karikari, Anthony Y., Kwadwo Ansong Asante, and C. A. Biney. 2006. "Water Quality Characteristics at the Estuary of Korle Lagoon in Ghana." West African Journal of Applied Ecology 10 (1).
Koehn, S. "Urban Mining: Recycling as a Key to Ensure Raw Material Supply." 2012. Business Journal of the German Chamber of Commerce in China 6.
Kyere, Vincent Nartey, Klaus Greve, Sampson Manukure Atiemo, and James Ephraim. 2017. "Spatial Assessment of Potential Ecological Risk of Heavy Metals in Soils from Informal E-waste Recycling in Ghana." Environmental Health and Toxicology 32.
Manhart, Andreas, Jürgen Meinel, and Sascha Walgenbach. 2014. Legal and Institutional Requirements for E-waste Recycling in Ghana. Work package 3.5 of the Bo2W project.
Oteng-Ababio, Martin, Ebenezer Forkuo Amankwaa, and Mary Anti Chama. 2014. “The Local Contours of Scavenging for E-waste and Higher-Valued Constituent Parts in Accra, Ghana.” Habitat International 43: 163–171.
Petrlik, Jindrich, Jim Puckett, Lee Bell, and Joe DiGangi. 2019. Weak Controls: European E-waste Poisons Africa’s Food Chain. Gothenburg: IPEN.
Prakash, Siddharth, Andreas Manhart, Yaw Amoyaw-Osei, and Obed Opoku Agyekum. 2010. Socio-Economic Assessment and Feasibility Study on Sustainable E-waste Management in Ghana. Freiburg: Öko-Institut eV.
Pwamang, John A., and Yaw Amoyaw-Osei. 2011. Ghana E-waste Project National Strategy. EMPA (Swiss Federal Institute of Material Testing and Research): Geneva.
Srigboh, Roland Kofi, Niladri Basu, Judith Stephens, Emmanuel Asampong, Marie Perkins, Richard L. Neitzel, and Julius Fobil. 2016. "Multiple Elemental Exposures Amongst Workers at the Agbogbloshie Electronic Waste (E-waste) Site in Ghana." Chemosphere 164: 68-74.
Tokumaru, Takashi, Hirokazu Ozaki, Siaw Onwona-Agyeman, John Ofosu-Anim, and Izumi Watanabe. 2017. "Determination of the Extent of Trace Metals Pollution in Soils, Sediments and Human Hair at E-waste Recycling Site in Ghana." Archives of Environmental Contamination and Toxicology 73 (3): 377-390.
Tue, Nguyen Minh, Akitoshi Goto, Shin Takahashi, Takaaki Itai, Kwadwo Ansong Asante, Tatsuya Kunisue, and Shinsuke Tanabe. 2016. "Release of Chlorinated, Brominated and Mixed Halogenated Dioxin-Related Compounds to Soils from Open Burning of E-waste in Agbogbloshie (Accra, Ghana)." Journal of Hazardous Materials 302: 151-157.
Wittsiepe, Jürgen, Julius N. Fobil, Holger Till, Gerd-Dieter Burchard, Michael Wilhelm, and Torsten Feldt. 2015. “Levels of Polychlorinated Dibenzo-p-Dioxins, Dibenzofurans (PCDD/Fs) and Biphenyls (PCBs) in Blood of Informal E-waste Recycling Workers from Agbogbloshie, Ghana, and Controls.” Environment International 79: 65–73.

155
Status of Forest Resources
Acquah, Stella Britwum, Richard Kodzo Avuglah, and Emmanuel Harris. 2015. “Impact of Trade Policies on Wood Products Export in Ghana.” American Journal of Mathematics and Statistics 5(5): 221-229.
Agyei, Kwame, and Rebecca Asare. 2016. Ghana: Mapping REDD+ Finance Flows 2009-2014. Washington, D.C.: Forest Trends.
Drigo, Rudi. 2001. Wood energy information in Africa. Working Document FOPW/01/4, FAO Project GCP. RAF/354/EC.
FAO (Food and Agriculture Organisation). 2010. Global Forest Resources Assessment Main Report. FAO Forestry Paper 163. Rome: FAO.
FAO (Food and Agriculture Organisation). 2010. Ghana Country Report: Global Forest Resources Assessment 2010. FRA2010/077. Rome: FAO.
Ghana, GSS (Ghana Statistical Service). 2018. Provisional 2017 Annual Gross Domestic Product. Ghana Statistical Service, Accra.
Ghana, MLNR (Ministry of Lands and Natural Resources). 2016a. 2015 Annual Report. Forestry Commission, Accra.
Ghana, MLNR (Ministry of Lands and Natural Resources). 2016b. Ghana REDD+ Strategy. National REDD+ Secretariat, Forestry Commission, Accra.
Ghana, MLNR (Ministry of Lands and Natural Resources). 2017a. Ghana’s National Forest Reference Level. National REDD+ Secretariat, Forestry Commission, Accra.
Ghana, MLNR (Ministry of Lands and Natural Resources). 2017b. Report on Export of Timber and Wood Products. Forestry Commission, Accra.
Ghana, MoF (Ministry of Finance and Economic Planning). No year. Public Expenditure Review of the Forestry Sector. (NREG TA) Natural Resources and Environmental Governance Technical Assistance Program, Accra.
Ghanaweb. 2018. “Save Ghana Timber Industry from Collapse—GTMO Cautions Government.” Saturday, April 21, 2018.
Hawthorne, William D., and Musah Abu-Juam. 1995. Forest Protection in Ghana: With Particular Reference to Vegetation and Plant Species. Vol. 15. Cambridge, UK: IUCN.
Kasanga, Kasim. 2003. "Current Land Policy Issues in Ghana." In Land Reform: Land Settlement and Cooperatives, edited by Paolo Groppo, 141-154. FAO: Rome.
Mayers, James, Gene Birikorang, E. Danso, Kwebena Samuel Nketiah, and Michael Richards. 2008. Assessment of Potential Impacts in Ghana of a Voluntary Partnership Agreement with the EC on Forest Governance. London: IIED (International Institute for Environment and Development).
Owusu, Kwadwao, and Peter Waylen. 2009. “Trends in Spatio-Temporal Variability in Annual Rainfall in Ghana (1951-2000).” Weather 64(5) :115-120.
Sarpong, George A. 2006. Improving Tenure Security for the Rural Poor: Ghana - Country Case Study. LEP Working Paper #2. Rome: FAO (Food and Agriculture Organization).
Schep, Stijn, Amílcar Guzmán, Pieter van Beukering, Hans de Moel, Maxime Eiselin, Samuel Ayesu, Gene Birikorang, Kingsley Bekoe Ansah. 2016. The Economics of the Atewa Forest Range, Ghana. Amsterdam: IUCN, National Committee of the Netherlands.
Land Degradation
Asiamah, R.D. 1987. “Soil Resources and Their Agricultural Utilization in Ghana.” Proceedings of the National Conference on Resource Conservation for Ghana’s Sustainable Development. Environmental Protection Council, Accra, 2: 99-111.
Barbier, Edward B. and Jacob P. Hochard. 2016. “Does Land Degradation Increase Poverty in Developing Countries?” PloS one 11 (5): e0152973.
Choudhary, Vikas; D'Alessandro, and Stephen Paul. 2015. Ghana: Agricultural Sector Risk Assessment - Risk Prioritization (English). Washington, D.C.: World Bank Group.
CILSS (Permanent Interstate Commitee for Drought Control in the Sahel). 2016. Landscapes of West Africa – A Window on a Changing World. Garretson, South Dakota: U.S. Geological Survey EROS.
Ghana. 1992. Constitution of the Republic of Ghana.
Ghana, MES (Ministry of Environment and Science). 2002. National Action Programme to Combat Drought and Desertification. Environmental Protection Agency, Accra.
Ghana, Ministry of Environment, Science and Technology. 2011. Ghana Strategic Investment Framework (GSIF) for Sustainable Land

15615.referenCes
World Bank. 2018b. Third Ghana Economic Update: Agriculture as an Engine of Growth and Jobs Creation (English). Washington, D.C.: World Bank Group.
World Bank. 2019. “Building Climate Resilience: Experience from Nigeria.” Results Briefs, April 18. https://www.worldbank.org/en/results/2019/04/18/building-climate-resilience-experience-from-nigeria.
Illegal Artisanal & Small-Scale Mining (Galamsey)
Abdulai, Abdul-Gafaru. 2017. "The Galamsey Menace in Ghana: A Political Problem Requiring Political Solutions." Policy Brief 5.
Adomako, Eureka E., Claire Deacon, and Andrew A. Meharg. 2010. "Variations in Concentrations of Arsenic and Other Potentially Toxic Elements in Mine and Paddy Soils and Irrigation Waters from Southern Ghana." Water Quality, Exposure and Health 2, no. 2: 115-124.
Afriyie, Kwadwo, John Kuumuori Ganle, and Janet Afua Abrafi Adomako. "The Good in Evil: A Discourse Analysis of the Galamsey Industry in Ghana." Oxford Development Studies 44 (4): 493-508.
Amankwah, Emmanuel. 2013. “Impact of Illegal Mining on Water Resources for Domestic and irrigation Purposes.” ARPN Journal of Earth Sciences 2(3): 117–121.
Andrews, Nathan. "Digging for Survival and/or Justice? The Drivers of Illegal Mining Activities in Western Ghana." Africa Today 62(2): 3-24.
Armah, Frederick A., Isaac Luginaah, and Benjamin Ason. 2012. " Water Quality Index in the Tarkwa Gold Mining Area in Ghana.” The Journal of Transdisciplinary Environmental Studies 11(2): 2-15.
Asante, Kwadwo Ansong, Tetsuro Agusa, Annamalai Subramanian, Osmund D. Ansa-Asare, Charles A. Biney, and Shinsuke Tanabe. 2007. “Contamination Status of Arsenic and Other Trace Elements in Drinking Water and Residents from Tarkwa, a Historic Mining Township in Ghana.” Chemosphere 66(8): 1513–1522.
Attua, Emmanuel Morgan, Stephen Twumasi Annan, and Frank Nyame. 2014. "Water Quality Analysis of Rivers Used as Drinking Sources in Artisanal Gold Mining Communities of the Akyem-Abuakwa Area: A Multivariate Statistical Approach." Ghana Journal of Geography 6(1): 24-41.
Banchirigah, Sadia Mohammed. 2008. “Challenges with Eradicating Illegal Mining in Ghana: A Perspective from the Grassroots.” Resources Policy 33 (1): 29-38.
Management (SLM), 2011-2025. EPA (Environmental Protection Agency), Accra.
Ghana, MESTI (Ministry of Environment, Science, Technology and Innovation). 2017a. Key Policy-Technical Measures to Achieve LDN (Land Degradation Neutrality). EPA (Environmental Protection Agency), consultant report prepared by C. Quansah, Accra.
Ghana, MESTI (Ministry of Environment, Science, Technology and Innovation). 2017b. Land Degradation Trends and Drivers. EPA (Environmental Protection Agency), consultant report prepared by C. Quansah, Accra.
Ghana, GSS (Ghana Statistical Service). 2017. 2015 Labour Force Report. GSS, Accra.
Ghana, GSS (Ghana Statistical Service). 2018. Poverty Trends 2005-2017. GSS, Accra.
Goldstein, Markus, and Christopher Udry. 2008. "The Profits of Power: Land Rights and Agricultural Investment in Ghana." Journal of Political Economy 116 (6): 981-1022.
Haile, Beliyou, Sara Signorelli, Carlo Azzarri, and Zhe Guo. 2016. “Land Cover Change and Rural Livelihoods: A Spatial Analysis on Northern Ghana.” Proceedings ICAS VII Seventh International Conference on Agricultural Statistics, Rome, 24-26 October 2016. Washington, D.C.: IFPRI (International Food Policy Research Institute).
Hiscox, Michael, and Rebecca Goldstein. 2014. Gender Inequality in the Ghanaian Cocoa Sector. Report prepared for Cocoa Life, Harvard University: Cambridge, MA.
Rajaee, Mozhgon, Samuel Obiri, Allyson Green, Rachel Long, Samuel J. Cobbina, Vincent Nartey, David Buck, Edward Antwi, and Niladri Basu. 2015. “Integrated Assessment of Artisanal and Small-Scale Gold Mining in Ghana—Part 2: Natural Sciences Review.” International Journal of Environmental Research and Public Health 12: 8971-9011.
Shoyama, Kikuko, Ademola K. Braimoh, Ram Avtar, and Osamu Saito. 2018. “Land Transition and Intensity Analysis of Cropland Expansion in Northern Ghana.” Environmental Management. Published online: 21 July 2018.
World Bank. 2007. Ghana Country Environmental Analysis. Washington, D.C.: World Bank.
World Bank. 2018a. Ghana - Priorities for Ending Poverty and Boosting Shared Prosperity (English). Washington, D.C.: World Bank Group.

157
Bansah, Kenneth. J., Nelson K. Dumakor-Dupey, Bruno A. Kansake, Elsie Assan, and P. Bekui. "Socioeconomic and Environmental Assessment of Informal Artisanal and Small-scale Mining in Ghana." Journal of Cleaner Production 202: 465-475.
Basu, Niladri, Edith Clarke, Allyson Green, Benedict Calys-Tagoe, Laurie Chan, Mawuli Dzodzomenyo, Julius Fobil, Rachel N. Long, Richard L. Neitzel, Samuel Obiri, Eric Odei, Lauretta Ovadje, Reginald Quansah, Mozhgon Rajaee, and Mark L. Wilson. 2015. "Integrated Assessment of Artisanal and Small-scale Gold Mining in Ghana—Part 1: Human Health Review." International Journal of Environmental Research and Public Health 12(5): 5143-5176.
Boadi, Samuel, Collins Ayine Nsor, Osei Owusu Antobre, and Emmanuel Acquah. 2016. "An Analysis of Illegal Mining on the Offin Shelterbelt Forest Reserve, Ghana: Implications on Community Livelihood." Journal of Sustainable Mining 15 (3): 115-119.
Boateng, D. O., Francis Nana Yaw Codjoe, and Johnson Ofori. 2014. "Impact of Illegal Small Scale Mining (Galamsey) on Cocoa Production in Atiwa District of Ghana.” International Journal of Advance Agricultural Research 2: 89-99.
Botchway, Francis N.N. 1995. "Pre-colonial Methods of Gold Mining and Environmental Protection in Ghana." Journal of Energy & Natural Resources Law 13(4): 299-311.
Bush, Ray. 2009. “‘Soon There Will Be No-One Left to Take the Corpses to the Morgue’: Accumulation and Abjection in Ghana's Mining Communities.” Resources Policy 34(1): 57-63.
Cobbina, Samuel J., Michael Myilla, and Michael Kumi. 2013. “Small Scale Gold Mining and Heavy Metal Pollution: Assessment of Drinking Water Sources in Datuku in the Talensi-Nabdam District.” International Journal of Scientific and Technology Research 2:96.
Dinye, Romanus D., and Michael O. Erdiaw-Kwasie. 2012. “Gender and Labour Force Inequality in Small-Scale Gold Mining in Ghana.” International Journal of Sociology and Anthropology 4: 285–95.
Friends of the Nation. 2014. Baseline Information for the National Action Plan on Artisanal and Small-Scale Gold Mining. Accra: Friends of the Nation.
Ghana. 1992. Constitution of the Republic of Ghana.
Ghana, MoF (Ministry of Finance). 2018. Ghana Extractive Industries Transparency Initiative (GHEITI) Report on the Mining Sector 2016. GHEITI Secretariat, Accra.
Ghana, MLNR (Ministry of Lands and Natural Resources). 2017. Project Appraisal and Implementation Document (PAID) for the
Multilateral Mining Integrated Project (MMIP). Report prepared by JMK Consulting, Accra.
Ghana, MLNR (Ministry of Lands and Natural Resources). 2018. Scoping Study of the Potential Reclamation of Mined Out Areas in Forest Landscapes --- Eastern and Western Regions. Forestry Commission, Accra. Consultant report prepared by TEN (Traffic and Environment Network).
Hilson, Gavin. 2017. "Shootings and Burning Excavators: Some Rapid Reflections on the Government of Ghana's Handling of the Informal Galamsey Mining ‘Menace’." Resources Policy 54: 109-116.
Hilson, Gavin, and Clive Potter. 2003. "Why is Illegal Gold Mining Activity So Ubiquitous in Rural Ghana?" African Development Review 15(2-3): 237-270.
Hilson, Gavin, Christopher J. Hilson, and Sandra Pardie. 2007. “Improving Awareness of Mercury Pollution in Small-Scale Gold Mining Communities: Challenges and Ways Forward in Rural Ghana.” Environmental Research 103(2):275-287.
Hilson, Gavin, and Sadia Mohammed Banchirigah. 2009. “Are Alternative Livelihood Projects Alleviating Poverty in Mining Communities? Experiences from Ghana.” The Journal of Development Studies 45(2): 172-196.
Hilson, Gavin 2010. “‘Once a Miner, Always a Miner’: Poverty and Livelihood Diversification in Akwatia, Ghana.” Journal of Rural Studies 26(3): 296-307.
Hilson, Gavin and Chris Garforth. 2013. “Everyone Now is Concentrating on the Mining: Drivers and Implications of Rural Economic Transition in the Eastern Region of Ghana.” Journal of Development Studies 49(3): 348–364.
Hira, Andy, and James Busumtwi-Sam. 2018. Mining Community Benefits in Ghana: A Case of Unrealized Potential. Vancouver: CIRDI (Canadian International Resources and Development Institute).
Hogarh, Jonathan, Ernest Adu-Gyamf, Daniel Nukpezah, Osei Akoto, and Sam Adu-Kumi. 2016. “Contamination from Mercury and Other Heavy Metals in a Mining District in Ghana: Discerning Recent Trends from Sediment Core Analysis.” Environmental Systems Research 5. 10.1186/s40068-016-0067-0.
ILO (International Labour Organization). 1999. Social and Labour Issues in Small-Scale Mines. Report for Discussion at the Tripartite Meeting on Social and Labour Issues in Small-scale Mines. Geneva: ILO.

15815.referenCes
Kusimi, John Manyimadin, Barnabas A. Amisigo, and Bruce K. Banoeng-Yakubo. 2014. "Sediment Yield of a Forest River Basin in Ghana." Catena 123: 225-235.
Long, Rachel, Elisha Renne, Thomas Robins, Mark Wilson, Kenneth Pelig-Ba, Mozhgon Rajaee, Allison Yee, Elizabeth Koomson, Codi Sharp, Jing Lu, and Niladru Basu. 2013. "Water Values in a Ghanaian Small-Scale Gold Mining Community." Human Organization 72: 199-210.
Mantey, Jones, Kwabena Nyarko, and Frederick Owusu-Nimo. 2016. Costed Reclamation and Decommissioning Strategy for Galamsey Operations in 11 Selected MDAs of the Western Region, Ghana. S-33205-GHA-1. London: International Growth Centre.
McQuilken, James and Gavin Hilson. 2016. Artisanal and Small-Scale Gold Mining in Ghana. Evidence to Inform an “Action Dialogue”. London: IIED.
Obiri, Samuel, David Kwesi Dodoo, Frank Okai-Sam, and David K. Essumang. 2006. "Cancer Health Risk Assessment of Exposure to Arsenic by Workers of AngloGold Ashanti–Obuasi Gold Mine." Bulletin of Environmental Contamination and Toxicology 76 (2): 195-201.
Ofosu-Mensah and Emmanuel Ababio. 2011. "Historical Overview of Traditional and Modern Gold Mining in Ghana." International Research Journal of Library, Information and Archival Studies 1 (1): 006-022.
Okoh, G. and Gavin M. Hilson. 2011. “Poverty and Livelihood Diversification: Exploring the Linkages Between Smallholder Farming and Artisanal Mining in Rural Ghana.” Journal of International Development 23: 1100–1114.
Owusu-Nimo, Frederick, Jones Mantey, Kwabena B. Nyarko, Eugene Appiah-Effah, and Anthony Aubynn. 2018. "Spatial Distribution Patterns of Illegal Artisanal Small Scale Gold Mining (Galamsey) Operations in Ghana: A Focus on the Western Region." Heliyon 4(2): e00534.
Paruchuri, Yasaswi, Amanda Siuniak, Nicole Johnson, Elena Levin, K. Mitchell, J.M. Goodrich, and Niladru Basu. 2010. “Occupational and Environmental Mercury Exposure Among Small-Scale Gold Miners in the Talensi–Nabdam District of Ghana's Upper East Region.” Science of the Total Environment 408 (24): 6079-6085.
Poulin, Jessie, Herman Gibb, Annette Prüss-Üstün, and WHO (World Health Organization). 2008. Mercury: Assessing the Environmental Burden of Disease at National and Local Levels. Geneva: WHO.
Quarshie, Abigail Nana K. 2015. Mining and Development in Ghana: A Case Study of the Mineral Development Fund in the Obuasi Municipal Assembly. Master’s Thesis. Accra: University of Ghana.
Rajaee, Mozhgon, Samuel Obiri, Allyson Green, Rachel Long, Samuel Cobbina, Vincent Nartey, David Buck, Edward Antwi, and Niladri Basu. 2015. "Integrated Assessment of Artisanal and Small-scale Gold Mining in Ghana—Part 2: Natural Sciences Review." International Journal of Environmental Research and Public Health 12 (8): 8971-9011.
Rossiter, Helfrid MA, Peter A. Owusu, Esi Awuah, Alan M. MacDonald, and Andrea I. Schäfer. 2010. "Chemical Drinking Water Quality in Ghana: Water Costs and Scope for Advanced Treatment." Science of the Total Environment 408 (11): 2378-2386.
Schueler, Vivian, Tobias Kuemmerle, and Hilmar Schröder. 2011. "Impacts of Surface Gold Mining on Land Use Systems in Western Ghana." Ambio 40 (5): 528-539.
Snapir, Boris, Daniel M. Simms, and Toby W. Waine. 2017. "Mapping the Expansion of Galamsey Gold Mines in the Cocoa Growing Area of Ghana Using Optical Remote Sensing." International Journal of Applied Earth Observation and Geoinformation 58: 225-233.
Taabazuing, Joseph, Isaac Luginaah, Godwin Djietror, and Kefa M. Otiso. 2012. "Mining, Conflicts and Livelihood Struggles in a Dysfunctional Policy Environment: the Case of Wassa West District, Ghana." African Geographical Review 31 (1): 33-49.
Teschner, Benjamin A. 2012. “Small-Scale Mining in Ghana: The Government and the Galamsey.” Resources Policy 37 (3): 308-314.
Tuokuu, Francis Xavier Dery, James S. Gruber, Uwafiokun Idemudia, and Jean Kayira. 2018. "Challenges and Opportunities of Environmental Policy Implementation: Empirical Evidence from Ghana's Gold Mining Sector." Resources Policy 59: 435-445.
UNECA (United Nations Economic Commission for Africa). 2011. Minerals and Africa’s Development. Addis Ababa: UNECA.
UNEP (United Nations Environment Programme). 2013. Mercury: Time to Act. Geneva: UNEP.
United States, Department of the Interior. 2019. Mineral Commodity Summaries 2019. U.S. Geological Survey, Reston, Virginia.
Wilson, Mark, Elisha Renne, Carla Roncoli, Peter Agyei-Baffour, and Emmanuel Tenkorang. 2015. "Integrated Assessment of Artisanal and Small-scale Gold Mining in Ghana—Part 3: Social Sciences and Economics." International Journal of Environmental Research and Public Health 12 (7): 8133-8156.
World Bank Group. 2019. Forest-Smart Mining: Identifying Good and Bad Practices and Policy Responses for Artisanal and Small-Scale Mining in Forest Landscapes. Washington, D.C.: World Bank.
159
Yakovleva, Natalia. 2007. "Perspectives on Female Participation in Artisanal and Small-Scale Mining: A Case Study of Birim North District of Ghana." Resources Policy 32 (1-2): 29-41.
The Coastal Ecosystem
Amoako, Clifford, and Emmanuel Frimpong Boamah. 2015. “The Three-dimensional Causes of Flooding in Accra, Ghana.” International Journal of Urban Sustainable Development, 7 (1): 109-129.
Angnuureng B. Donatus, Addo K. Appeaning, and G. Wiafe. 2013. “Impact of Sea Defense Structures on Down Drift Coasts: The case of Keta in Ghana.” Academia Journal of Environmental Sciences 1 (6): 104-121.
Appeaning, Addo K. and Addo I. Appeaning. 2016. “Coastal Erosion Management in Accra: Combining Local Knowledge and Empirical Research.” Jamba Journal of Disaster Risk Studies 8 (1): 274.
Appeaning, Addo K., L. Larbi, B. Amisigo, and P. Ofori-Danson. 2011. “Impacts of Coastal Inundation Due to Climate Change in a Cluster of Urban Coastal Communities in Ghana, West Africa.” Remote Sensing 3: 2029-2050.
Appeaning Addo K., M. Walkden, and J.P. Mills. 2008. “Detection, Measurement and Prediction of Shoreline Recession in Accra, Ghana.” ISPRS Journal of Photogrammetry and Remote Sensing 63 (5):543–558.
Boateng, Isaac. 2012. “An Assessment of the Physical Impacts of Sea-Level Rise and Coastal Adaptation: A Case Study of the Eastern Coast of Ghana.” Climatic Change 114: 273-293.
Browder, Greg, Suzanne Ozment, Irene Rehberger Bescos, Todd Gartner, and Glenn-Marie Lange. 2019. Integrating Green and Gray: Creating Next Generation Infrastructure. Washington, DC: World Bank and World Resources Institute.
Ghana, MLNR (Ministry of Lands and Natural Resources), MESTI (Ministry of Lands and Natural Resources), TCPD (Town and Country Planning Department), NDPC (National Development Planning Commission). 2015. Ghana National Spatial Development Framework (2015-2035), Space, Efficiency and Growth. Volume I: Conditions and Main Issues. Consultant report by COWI/AS.
Kagblor, Cephas. 2010. A Spatio-Temporal Study of Urbanization and Flooding in the Greater Accra Metropolitan Area (GAMA) of Ghana. Unpublished Masters’ thesis submitted to the Department of Geography and Resource Development, University of Ghana, Legon, Accra.
Sackey, I., E. Laing, and J. K. Adomako. 1993. "Status of the Mangroves of Ghana." In Conservation and Sustainable Utilization of Mangrove Forests in Latin America and Africa Regions. Part II–Africa, edited by E.D. Diop. Okinawa: International Society for Mangrove Ecosystems.
Samwine, Thomas, Peng Wu, Lezhong Xu, Yaoliang Shen, Emmanuel Appiah, and Wang Yaoqi. 2017. "Challenges and Prospects of Solid Waste Management in Ghana." International Journal of Environmental Monitoring and Analysis 5 (4): 96-102.
United States, USAID (United States Agency for International Development). 2014. Mapping the Exposure of Socioeconomic and Natural Systems of West Africa to Coastal Climate Stressors. A report for USAID by Tetra Tech ARD. Washington, DC: USAID.
World Bank. 2010. Ghana - Economics of Adaptation to Climate Change (EACC): Main report. Washington D.C.: World Bank
World Bank. 2011. Climate Risk and Adaptation Country Profile: Ghana. Washington, D.C.: World Bank.
World Bank. 2017a. Cost of Coastal Environmental Degradation, Multi-Hazard Risk Assessment and Cost Benefit Analysis: Report D5: An Executive Comparative Report on the Coastal Zones Management and the COCED Results. A report for the World Bank by International Marine and Dredging Consultants. Washington, DC: World Bank Group.
World Bank. 2017b. Cost of Coastal Environmental Degradation, Multi-Hazard Risk Assessment and Cost Benefit Analysis: Report D1a: Qualitative Review of Natural Hazards and Risk Mapping for Ghana. A report for the World Bank by International Marine and Dredging Consultants. Washington, DC: World Bank Group.
State of Fisheries Resources
Akpalu, Wisdom. 2008. "Fishing Regulations, Individual Discount Rate, and Fisherman Behaviour in a Developing Country Fishery." Environment and Development Economics 13 (5): 591-606.
Akpalu, Wisdom. 2011. "Determinants of Noncompliance with Light Attraction Regulation Among Inshore Fishers in Ghana." The Journal of Socio-Economics 40 (2): 172-177.
Akpalu, Wisdom, Channing Arndt, and Innocent Matshe. 2015. "Introduction to the Special Issue on the Economics of Climate Change Impacts on Developing Countries: Selected studies on Sub-Saharan Africa and South-East Asia." Sustainability 7 (9): 12122-12126.

16015.referenCes
Akpalu, Wisdom, and M. Okyere. 2018. The Socio-Economic Analysis of The Fisheries Sector in Ghana. Draft report. Washington, D.C.: World Bank.
Atta-Mills, John, Jackie Alder, and Ussif Rashid Sumaila. "The Decline of a Regional Fishing Nation: The Case of Ghana and West Africa." Natural Resources Forum 28 (1): 13-21.
Bannerman, Paul, and Richmond Quartey. 2004. Report on the Observations of Commercial Light Fishing Operation in Ghana. Marine Fisheries Research Division (MFRD), Tema.
Barange, Manuel, and R. Ian Perry. 2009. "Physical and Ecological Impacts of Climate Change Relevant to Marine and Inland Capture Fisheries and Aquaculture." In Climate Change Implications for Fisheries and Aquaculture: Overview of Current Scientific Knowledge, FAO (Food and Agriculture Organisation) Fisheries and Aquaculture Technical Paper. No. 530, edited by Kevern Cochrane, Cassandra De Young, Doris Soto and Tarûb Bahri, 7-106. Rome: FAO.
Chimatiro, Sloans. 2010. "Post-compact Interventions through the International Partnership for African Fisheries Governance and Trade (PAF)." Unpublished Manuscript.
Cooley, Sarah R., and Scott C. Doney. 2009. "Anticipating Ocean Acidification’s Economic Consequences for Commercial Fisheries." Environmental Research Letters 4 (2): 024007.
EJF (Environmental Justice Foundation). 2018. China’s Hidden Fleet in West Africa: A Spotlight on Illegal Practices within Ghana's Industrial Trawl Sector. London: EJF.
Freduah, George, Pedro Fidelman, and Timothy F. Smith. 2017. "The Impacts of Environmental and Socio-economic Stressors on Small Scale Fisheries and Livelihoods of Fishers in Ghana." Applied Geography 89: 1-11.
Ghana, MoFAD. 2018. The People’s Fish – A Crisis for Ghana’s Canoe Sector. Closed Season Factsheet. Fisheries Commission, Accra.
Ghana, MoFAD (Ministry of Fisheries and Aquaculture Development). 2016. Annual Report. Fisheries Commission, Accra.
Ghana, MoFAD (Ministry of Fisheries and Aquaculture Development). 2015. National Fisheries Management Plan.
Houghton, R. W., and M. A. Mensah. 1978. "Physical Aspects and Biological Consequences of Ghanaian Coastal
Upwelling." In Upwelling Ecosystems, edited by R. Boje, and M. Tomczak M., 167-180. Berlin, Heidelberg: Springer.
IPCC (Intergovernmental Panel on Climate Change). 2014. Climate Change 2014: Synthesis Report. Contribution of Working Groups I, II and III to the Fifth Assessment Report of the Intergovernmental Panel on Climate Change. Geneva: IPCC.
Koranteng, Kwame A. 1995. "The Ghanaian Fishery for Sardinellas." In Dynamics and Use of Sardinella Resources from Upwelling Off Ghana and Ivory Coast, edited by Francois Xavier Bard and Kwame A. Koranteng, 243-258. Paris: Orstom.
Lazar, N., Yankson K., Blay, J., Ofori-Danson, P., Markwei, P., Agbogah, K., Bannerman, P., Sotor, M., Yamoah, K. K., and W. B. Bilisini. 2018. Status of the Small Pelagic Stocks in Ghana and Recommendations to Achieve Sustainable Fishing 2017. Scientific and Technical Working Group. USAID/Ghana Sustainable Fisheries Management Project (SFMP). Coastal Resources Center, Graduate School of Oceanography, University of Rhode Island. GH2014_SCI042_CRC. Narragansett, RI: URI.
Mensah, M.A., 1974. “The Reproduction and Feeding of the Marine Copepod Calanoides carinatus (Krøyer) in Ghanaian Waters.” Ghana Journal of Science 14 (2): 167-192.
Nunoo, F. K. E., B. Asiedu, K. Amador, Dyhia Belhabib, Vicky Lam, Rashid Sumaila, and Daniel Pauly. 2014. “Marine Fisheries Catches in Ghana: Historic Reconstruction for 1950 to 2010 and Current Economic Impacts.” Reviews in Fisheries Science & Aquaculture 22 (4): 274-283.
Sumaila, U. Rashid, William W.L. Cheung, Vicky W.Y. Lam, Daniel Pauly, and Samuel Herrick. 2011. "Climate Change Impacts on the Biophysics and Economics of World Fisheries." Nature Climate Change 1 (9): 449-456.
Tobey, J., Normanyo, A.K., Osei, P., Beran, K. and B. Crawford. 2016. Subsidies in Ghana’s Marine Artisanal Fisheries Sector. USAID/Ghana Sustainable Fisheries Management Project (SFMP). Coastal Resources Center, Graduate School of Oceanography, University of Rhode Island. GH2014_POL059_CRC. Narragansett, RI: URI.
Climate Change
Baarsch, Florent, Jessie R. Granadillos, William Hare, Maria Knaus, Mario Krapp, Michiel Schaeffer, and Hermann Lotze-Campen. 2020. "The Impact of Climate Change on Incomes and Convergence in Africa." World Development 126: 104699.
Ghana, MESTI (Ministry of Environment, Science, Technology and Innovation). 2013. Ghana National Climate Change Policy. National Climate Change Committee, Accra.

161
Ghana, MESTI (Ministry of Environment, Science, Technology and Innovation). 2017. Ghana State of the Environment 2016 Report. Environmental Protection Agency, Accra.
Ghana, MESTI (Ministry of Environment, Science, Technology and Innovation). 2018. Ghana’s Second Biennial Update Report to the United Nations Framework Convention on Climate Change. Environmental Protection Agency, Accra.
World Bank. 2017a. Enhancing Urban Resilience in the Greater Accra Metropolitan Area. Washington, D.C.: World Bank.
World Bank. 2017b. Ghana Multi-Sectoral Investment Framework for Climate and Disaster Risk Management. Diagnostic Report. Unpublished.
World Bank. 2020. Greater Accra Climate and Flood Risk Mitigation Strategy: Making Robust Investment Choices for Flood Resilience. Forthcoming.
Policies and Institutions/Public Environmental Expenditure Review
Appiah-Opoku, Seth, and Hobson C. Bryan. 2013. "EA Follow-Up in the Ghanaian Mining Sector: Challenges and Opportunities." Environmental Impact Assessment Review 41: 38-44.
Ghana, MLNR (Ministry of Lands and Mineral Resources). 1979. Land Use Planning Committee Report. Accra.
Ghana, MLNR (Ministry of Lands and Natural Resources), MEST (Ministry of Environment, Science and Technology. 2010. NREG Draft Mid-Term Review Report. Consultant report by N. Byrd, C. Hiddink, and E. Akwetey, Accra.
Ghana, NDPC (National Development Planning Commission). 2017. Medium-Term
National Development Policy Framework. An Agenda for Jobs: Creating Prosperity and Equal Opportunity for All (First Step) 2018-2021. National Development Planning Commission, Accra.
GWS (Ghana Wildlife Society). 2018. Review of Ghana’s Legal Framework for Protected Areas, Agriculture, and Environmental Assessment. Accra: GWS.
Marfo, Kofi, Vincent Anchirinah, and Steve Wiggins. 2002. Environmental Policies and Livelihoods in the Forest Margins of Southern Ghana. Crops Research Institute. Kumasi: Council for Scientific and Industrial Research.
Swanson, AuPhil, and Leiv Lundethors. 2003. Public Environmental Expenditure Reviews (PEERs). Experience and Emerging Practice. Environmental Strategy Papers No. 7. Washington, D.C.: World Bank.
World Bank. 2018. Ghana - Priorities for Ending Poverty and Boosting Shared Prosperity (English). Washington, D.C.: World Bank Group.

16215.referenCes
A woman on the beach in Axim, Western Region.

163
Related Documents


