-~~'<~~~- 7+ - -; 7 > _- -r~~~~~~J7 -'~~~~~~~~~ _ .f;*>¢r,e ...- _ " d %', i ' 't i'' ' 4 ' *' .s- A-:- -- M 4 . 'swf; v $ z & -1 -g%4---~ ~~~~a q to¢v->u> tbbl^ J,lwm0 8-4. .- . Ot- J ;gat. 1 ZhL, _ t t, Public Disclosure Authorized Public Disclosure Authorized Public Disclosure Authorized Public Disclosure Authorized

Welcome message from author
This document is posted to help you gain knowledge. Please leave a comment to let me know what you think about it! Share it to your friends and learn new things together.
Transcript

-~~'<~~~- 7+ - -; 7 > _-
-r~~~~~~J7
-'~~~~~~~~~ _ .f;*>¢r,e ...- _ " d %',
i ' 't i'' ' 4 ' *' .s-
A-:- -- M 4 . 'swf; v $ z
& -1-g%4---~ ~~~~a q to¢v->u>
tbbl^ J,lwm0
8-4. .- . Ot- J ;gat. 1
ZhL, _ t t,
Pub
lic D
iscl
osur
e A
utho
rized
Pub
lic D
iscl
osur
e A
utho
rized
Pub
lic D
iscl
osur
e A
utho
rized
Pub
lic D
iscl
osur
e A
utho
rized

C H INA 2 02 0
SHARINGRISINGINCOMES
China 2020:
Development Challenges in the New Century
Clear Water, Blue Skies:
China's Environment in the New Century
At China's Table:
Food Security Options
Financing Health Care:
Issues and Options for China
Sharing Rising Incomes:
Disparities in China
Old Age Security:
Pension Reform in China
China Engaged:
Integration with the Global Economy
0 T H E W O R L D B A N K
W A S H I N G T O N D . C

-~ MM -~ -Cl -- -
SHARINGRxISINGINCOMESD I S P A R I T I E S I N
C H I N A
C T H E W O R L D B A N K
W A S H I N G T 0 N D . C
Copyright © 1997The International Bank for Reconstructionand Development/THE WORLD BANK
1818 H Street, N.W.Washington, D.C. 20433, U.S.A.
All rights reservedManufactured in the United States of AmericaFirst printing September 1997
The World Bank does not guarantee the accuracy of the data included in this publication and accepts no responsibilitywhatsoever for any consequence of their use. The boundaries, colors, denominations, and other information shown onany map in this volume do not imply on the part of the World Bank Group any judgment on the legal status of anyterritory or the endorsement or acceptance of such boundaries.
The material in this publication is copyrighted. Requests for permission to reproduce portions of it should be sent tothe Office of the Publisher at the address shown in the copyright notice above. The World Bank encourages dissemina-tion of its work and will normally give permission promptly and, when the reproduction is for noncommercial purposes,without asking a fee. Permission to copy portions for classroom use is granted through the Copyright Clearance Center,Inc., Suite 910, 222 Rosewood Drive, Danvers, Massachusetts 01923, U.S.A.
Cover photograph by Claus Meyer/Black Star.
Cover insets (from left to right) by Vince Streano/Aristock, Inc.; Dennis Cox/China Stock; Serge Attal/Gamma Liaison;Dennis Cox/China Stock; Joe Carini/Pacific Stock; Erica LansnerlBlack Star.
ISBN: 0-8213-4075-1
| p;~~~~~~~~~~~~~~~~~~~~~~~s
Contents
t~~-4;
Acknowledgments vii
Overview 1
Chapter 1 Richer but Less EquaL 7Growing unequal: National trends 8Growing out of poverty? 9
Chapter 2 Growing Apart: Rural-Urban andCoastal-Interior Gaps 15The rural-urban divide is growing 15The magnitude of rural and urban inequalities depends on
how incomes are measured 17The gulf between the coast and the interior is widening 20
Chapter 3 Understanding Inequality 27The structure of employment is changing 28The value of education is increasing 32Land remains a powerful source of social protection 34Women are increasingly at risk 38
Chapter 4 How Policies Affect Individual Welfare 43Eliminating policies that favor the better-off 44Protecting the absolute poor 45
i11 g f: ~~~~~~~~~~~~~~~~~~~~~~~~~~~~~~~~v
s~~~~~ I -

Boosting the potential of the near poor 47Caring for the urban poor 49
Annex 1 Migration and Inequality in China 53
Annex 2 Survey of Literature on Inequality, Income Distribution,and Migration in China 61
References 77
This report uses Hong Kong when referring to the Hong KongSpecial Administrative Region, People's Republic of China.
vi Sharing Rising Incomes: Disparities in China
* Acknowledgments
his report was written by TamarManuelyan Atinc based on inputs from many
individuals. Discussions with Chinese officials during aJuly 1996 mission were particularly helpful in identifyingthe main challenges facing the authorities and under-standing the institutional context in which policies affect-ing income distribution evolve. The mission, comprisingTamar Manuelyan Atinc, Valerie Charles, Albert Keidel,
a- - XXand Julia Li, is particularly thankful for the assistance ofthe State Planning Commission's Spatial and RegionalPlanning Department. The contributions of Chen Xuan
Qing, Chen Xiang, and Yan Pangui are gratefullyacknowledged.
X-- l The study also could not have been carried out withoutthe help of the State Statistical Bureau. Information pro-vided by the urban and rural household survey team and
background papers prepared by the bureau's ResearchInstitute were essential ingredients for the report.
vii3S | | I

The report also benefited from analytical inputs, some (Columbia University), and Lyn Squire (World Bank).in the form of background papers, from many scholars Other World Bank staff were also generous with theirwho have shown keen interest in income inequality. time and advice, including Vinod Ahuja, Liang Li,Within the World Bank these included Shaohua Chen, Natalie Lichtenstein, Andrew Mason, RichardYuri Dikhanov, Francisco Ferreira, Marcel Fratzscher, Newfarmer, Vikram Nehru, and Alan Piazza. BonitaShaikh Hossain, Aart Kraay, Martin Ravallion, Christine Brindley provided valuable advice on writing. KlausWong, Colin Xu, Xiaoqing Yu, Tao Zhang, and Heng-Fu Rohland and Nicholas Hope provided strategic guid-Zou. Outside the Bank, Robin Burgess (London School ance and able management.of Economics/STICERD) and Calla Wiemer (University The report was edited by Meta de Coquereaumontof Hawaii) made valuable contributions. and Paul Holtz, laid out by Damon lacovelli and Laurel
Valuable comments were also received from peer Morais, and designed by Kim Bieler, all with thereviewers, including Stephen Howes (World Bank), American Writing Division of CommunicationsNora Lustig (Brookings Institution), Carl Riskin Development Incorporated.
viii Sharing Rising Incomes: Disparities in China
| S G 9 Y ~per capita has unequal or has become more so. And1 fl ~~~~~a remarkable 8.2 gender disparities in the marketplace
i_ i ~~~~~econormc reforms may be more pronounced.E * arkt incentives hlave Elsewhere, high inequality has
1 X increa~~icresed factor dlepressed growth, undermined poverty5_ | w ed ~~~~retums to land alleviation, and contributed to social
; 31 I 9-va~~~all, a staggenng teiision. China's income inequality, sim-vha~~~~~~~ve been lifted out ilar to that in the United States, remains
:l ~~~~~~~~~~moderate by international standards.
za W pge ~~~With schooling, as the country's transition unfolds,a ! k a~~~~~d have beenl able increased inequality need not u-nder-
i1 N | ; 5 r3t the new market mine growth or social harmony-pro-
1 1|3 g ~~~to spur growth. vided It is accompanied by broadly11 rvt>4~~~Oi-cies, or their based growth, equal access to opportu-
t11 | pbening ~~inequalities. nities, and protection for the poor and
| V 0 E ~~urban areas. vulnerable. The challenge for the
&vo-r the coast. Chinese government iS tO extend the
a 111 lo n f ~~~health care, benefits of growth to all members ofa I Uu3ltiesremal~~iesreais sciety.
i1 Af ' I X
S ~~~~~~


| F ~Overview
hina's income distribution has become increas-ingly unequal since reforms started in 1978.
The Gini coefficient (a common measure of incomeinequality), a low 28.8 in 1981, reached 38.8 in 1995. Achange of this magnitude is highly unusual and signalsdeep structural transformation in the distribution of assetsand their returns.
Inequality has risen in large part because China hasbegun to harness the enormous potential of its people,suppressed during the first three decades of Communistrule. At the height of egalitarianism individual remunera-tion barely reflected productivity. In 1978 the governmentintroduced individual incentives and market forces thatimmediately began to increase returns to capital and land,diversify employment, and increase factor mobility. Notsurprisingly, the benefits of growth were distributedunevenly, accruing to those most able to take advantage of
4>-- | f'rising opportunities-the educated and the enterprising,

the mobile, and those with high-quality land. To some similar to that of the United States and close to the Eastdegree inequality was necessary for the rapid growth Asian average-substantially higher than in Easternthat followed the adoption of reforms. But government Europe but much lower than in Sub-Saharan Africa andpolicies, or their absence, are exacerbating inequalities. Latin America (table 1).Social policies favor urban over rural areas, economic Moreover, China's spectacular growth has beenpolicies favor the coast over the interior, and access to accompanied by substantial gains in poverty reduction.education, health care, and labor mobility remains Since the start of reforms in 1978, China has lifted someunequal or has become more so. And the price of admis- 200 million people out of absolute poverty. Butsion to a more affluent society appears to be higher for progress has been uneven. Most of the poverty reduc-women than for men. tion occurred in the early part of reforms, when the
Should China's policymakers be concerned about the household responsibility system was introduced in ruralincreasing polarization of incomes? Elsewhere, high areas. But in the mid-1980s and early 1990s povertyinequality has impeded growth, undermined poverty levels stagnated despite steady gains in per capita GDP.alleviation, and contributed to social tension. China's Since 1992 renewed momentum has decreased theincome inequality is still moderate. The benefits of number of poor, and by the end of 1995 less than 6 per-growth have been unevenly distributed, but they have cent of the population had incomes below the absolutereached the poor. Moreover, much of the increase in poverty line.inequality reflects a welcome adjustment to an incentive Growth in rural incomes has transformed poverty sta-and remuneration structure more typical of market tistics. Per capita GDP growth did not always increaseeconomies. But if not moderated, some aspects of personal incomes, but when it boosted rural incomes,China's inequality may imperil future growth and poverty declined. Without rural income growth, thestability. number of absolute poor in China would have increased
Social tension can result when the benefits of growth by more than 100 million between 1981 and 1995accrue unequally to easily identifiable groups-for because of adverse distributional changes. Instead, theexample, geographic and urban-rural imbalances, ranks of the poor fell by more than 150 million.inequalities between ethnic groups, and gender dispari- But there is no room for complacency. Reforms haveties-even if these are not major factors in explaining not reduced the large welfare differences between ruraloverall income inequality. If richer groups enjoy consis- and urban households; on the contrary, these havetently higher growth, simmering social tensions can increased. Policies favoring the coast have reinforcedbecome politically destabilizing and ultimately derail the region's natural endowments, widening the gulfgrowth and poverty reduction. Social and economic between coastal and interior provinces. Market forcesprogress can also be damaged by rising inequalities in have raised productivity, but labor markets remain seg-opportunities. Experience elsewhere suggests that mented. And if the marketplace alone is left to dictateinequalities in access to basic health and education typ-ically accompany higher income inequality and canintensify its negative effects on society. Policymakers in TABLE 1
intensify iseaveftoChina's inequality puts it in the middle of theChina need to manage the widening gap between rural pack internationallyand urban areas, the growing disparities between the (Gini coefficient)coast and the interior, and the increasing inequality Region or countryRegion or country1980s l990sacross income groups in access to opportunities for self-
rr ~~~~~Eastern Europe 25.0 28.9improvement. Chinaa 28.8 38.8
High-income countries 33.2 33.8and problems ~~~~~~~~~South Asia 35.0 31.8Progress and problems East Asia and the Pacific 38.7 38.1
Middle East and North Africa 40.5 38.0Although China's income inequality has risen rapidly, it Sub-Saharan Africa 43.5 47.0
Latin America and the Caribbean 49.8 49.3has not yet pushed the country into the ranks of the
a. Data are for 1981 and 1995.notoriously unequal. China's Gini coefficient is now Source: Deininger and Squire 1996; Ahuja and others 1997.
2 Sharing Rising Incomes: Disparities in China
increasing accommodation of the swelling demand forrural emigration, important impediments remain, reflect-
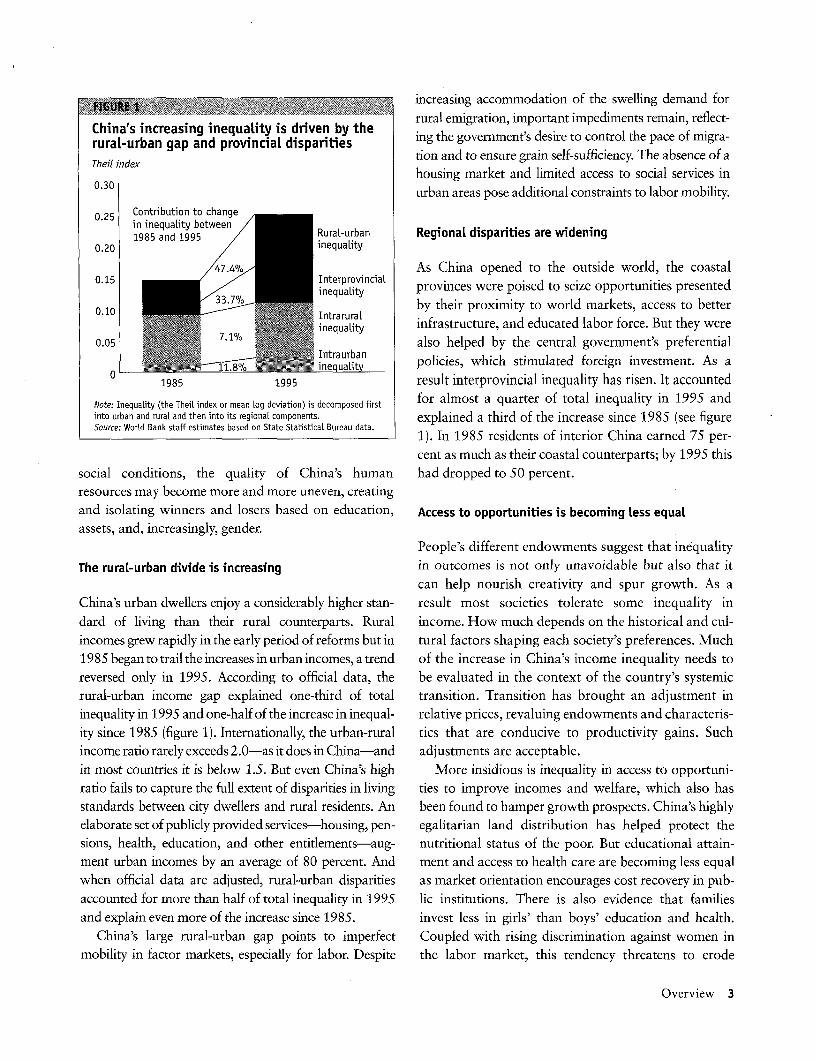
China's increasing inequality is driven by therural-urban gap and provincial disparities ing the government's desire to control the pace of migra-Theil index tion and to ensure grain self-sufficiency. The absence of a
housing market and limited access to social services inurban areas pose additional constraints to labor mobility.
0.25 Contribution to changein inequality between1985 and 1995 RuraL-urban Regional disparities are widening
0.20 inequality
/47.4% InterprovincL As China opened to the outside world, the coastal0.15 _/Interprovinial ...
.7% / inequality provinces were poised to seize opportunities presented0.10 IntraruraL by their proximity to world markets, access to better
inequality infrastructure, and educated labor force. But they were0.05 Xntraurbanalso helped by the central government's preferential
ine. Q meualit policies, which stimulated foreign investment. As a0 1985 1995 result interprovincial inequality has risen. It accounted
Note: Inequality (the Theil index or mean Log deviation) is decomposed first for almost a quarter of total inequality in 1995 andinto urban and rural and then into its regional components. explained a third of the increase since 1985 (see figureSource: World Bank staff estimates based on State StatisticaL Bureau data. (se e
1). In 1985 residents of interior China earned 75 per-cent as much as their coastal counterparts; by 1995 this
social conditions, the quality of China's human had dropped to 50 percent.resources may become more and more uneven, creatingand isolating winners and losers based on education, Access to opportunities is becoming less equalassets, and, increasingly, gender.
People's different endowments suggest that inequality
The rural-urban divide is increasing in outcomes is not only unavoidable but also that itcan help nourish creativity and spur growth. As a
China's urban dwellers enjoy a considerably higher stan- result most societies tolerate some inequality in
dard of living than their rural counterparts. Rural income. How much depends on the historical and cul-incomes grew rapidly in the early period of reforms but in tural factors shaping each society's preferences. Much1985 began to trail the increases in urban incomes, a trend of the increase in China's income inequality needs toreversed only in 1995. According to official data, the be evaluated in the context of the country's systemicrural-urban income gap explained one-third of total transition. Transition has brought an adjustment ininequality in 1995 and one-half of the increase in inequal- relative prices, revaluing endowments and characteris-ity since 1985 (figure 1). Internationally, the urban-rural tics that are conducive to productivity gains. Suchincome ratio rarely exceeds 2.0-as it does in China-and adjustments are acceptable.in most countries it is below 1.5. But even China's high More insidious is inequality in access to opportuni-ratio fails to capture the full extent of disparities in living ties to improve incomes and welfare, which also hasstandards between city dwellers and rural residents. An been found to hamper growth prospects. China's highlyelaborate set of publicly provided services-housing, pen- egalitarian land distribution has helped protect thesions, health, education, and other entitlements-aug- nutritional status of the poor. But educational attain-ment urban incomes by an average of 80 percent. And ment and access to health care are becoming less equalwhen official data are adjusted, rural-urban disparities as market orientation encourages cost recovery in pub-accounted for more than half of total inequality in 1995 lic institutions. There is also evidence that families
and explain even more of the increase since 1985. invest less in girls' than boys' education and health.China's large rural-urban gap points to imperfect Coupled with rising discrimination against women in
mobility in factor markets, especially for labor. Despite the labor market, this tendency threatens to erode
Overview 3

women's hard-earned gains, which have been a source incomes from grain, a heavily regulated subsector.of national pride. Finally, imperfect labor mobility cre- Reforms in grain policies are needed to improve thisates unequal access to better-paying jobs. China's seg- group's standard of living. Greater integration in labormented labor markets are reflected in the near-absence markets and better-functioning credit markets would alsoof urban poverty, the relatively low level of urbaniza- help. The government's decision to align grain procure-tion, and the large rural-urban income gap. ment prices to market prices is welcome. Better transport
infrastructure and changes in the grain distribution sys-Policies to grow with tem would help boost farmgate prices, and more spend-
ing on agricultural research and extension could increaseIncome inequality may well continue to rise as China's yields. Above all, the near poor would benefit from shift-transition unfolds. But increasing inequality need not ing out of low-return grain production into higher-valueundermine growth or social harmony-so long as crops or off-farm employment. But such shifts wouldgrowth is broadly based, policy biases are eliminated, require government willingness to import more food.and the poor and vulnerable are protected.
Urban poverty. Although urban poverty is negligible, itProtecting the poor and the vulnerable may become an increasing concern as enterprise reforms
deepen and China continues to urbanize. UnemploymentInvestment in human capital is key to long-term improve- (including furloughs) in China's cities has already reachedments in welfare for all, but other policies can usefully dif- 8 percent of the labor force. The government needs bet-ferentiate treatment by segments of the population. ter information about the urban poor to develop assis-
tance programs for them. Establishing a meaningfulThe absolute poor. In 1995 there were 70 million urban poverty line would help, as would systematic mon-
absolute poor in China. If current assistance programs itoring of the unemployed. Now is also an opportune timewere targeted more accurately, they would alleviate for the government to examine its social protection sys-more poverty and cost less. In 1990 almost half of tem; substantial work has already gone into analyzing theChina's poor lived outside the counties designated for pension and health care finance systems. Additionalspecial assistance programs. These programs would be efforts should concentrate on other benefits such as unem-more effective if they were targeted at the level of town- ployment compensation, disability, and labor trainingships, or perhaps even administrative villages and retraining schemes. Finally, a better job information
The government should also consider refocusing pri- system would facilitate the redeployment of labor, while aorities in its poverty reduction strategy. A renewed systematic evaluation of urban job creation programsemphasis on basic education and health services for the would help disseminate the lessons of their success orpoor is essential, combined with assistance for finding failure.employment in economically advanced areas. There is aneed to ensure essential health services for the poor and Eliminating policy biases and strengtheningto strengthen public health programs. Poor households reguLationsmust be compensated (through scholarships) for thecosts of educating their children, and in this the govern- Public policies in China tend to exacerbate the gapment is aided by the demographic transition-the num- between rich and poor. Policy changes in four areasber of school-age children is declining. Govemment would benefit welfare and income distribution.assistance to the poor in finding jobs outside their imme-diate home area should be expanded because remit- Redressing the urban bias. Housing, food, migration,tances contribute significantly to reducing rural poverty. credit, state employment, and other policies provide de
facto subsidies for urban residents. Some of these poli-The near poor. About 100 million additional people cies directly lower the welfare of rural residents. Others
survive on less than $1 of income a day (in 1985 pur- do so indirectly, by preempting public resources thatchasing power parity dollars) and derive almost half their could be targeted at more needy populations.
4 Sharing Rising Incomes: Disparities in China

Removing the coastal bias in economic policies. The can make the retirement age for men and women thenatural and human capital advantages of the coastal same and avoid discrimination in benefits provision.provinces are sufficient to attract foreign investment and Regulations and firm-level subsidies can spread the costsneed not be bolstered with preferential policies. In addi- of child rearing, which usually are shouldered solely bytion, a reformed intergovernmental transfer scheme women.would reduce disparities in public spending acrossprovinces; the government should accelerate its design Dealing fairly with the rich. Some of China's newlyand implementation. Policies that favor the interior also rich have worked hard and taken calculated risks tomay help address the widening gulf between China's benefit from new market opportunities. But others areinterior and the coast, but additional research is needed taking advantage of China's incomplete transition toon an appropriate package of regional growth policies. accumulate ill-begotten wealth. The government isInternational experience with regional development right to focus on the second group. To combat corrup-efforts has generally been negative, but there has been tion and to counter rent-seeking behavior, the govern-little systematic analysis of this important issue. ment must enforce its regulations. Doing so will
require reducing bureaucratic discretion, establishingCountering gender bias in household allocation deci- clear and transparent rules for public decisionmaking
sions and in the marketplace. Education grants can pro- (such as public procurement), and stamping out accessvide incentives for families to educate girls. Government to insider information in financial markets.
Overview 5

Richer but Less Equal
>;00 China's reforms have continued, its income
1 C-S distribution has become more unequal. In1981 China was an egalitarian society, with an incomedistribution similar to that of Finland, the Netherlands,
Poland, and Romania. But rapid economic growth has
brought dramatic change, so that China's income
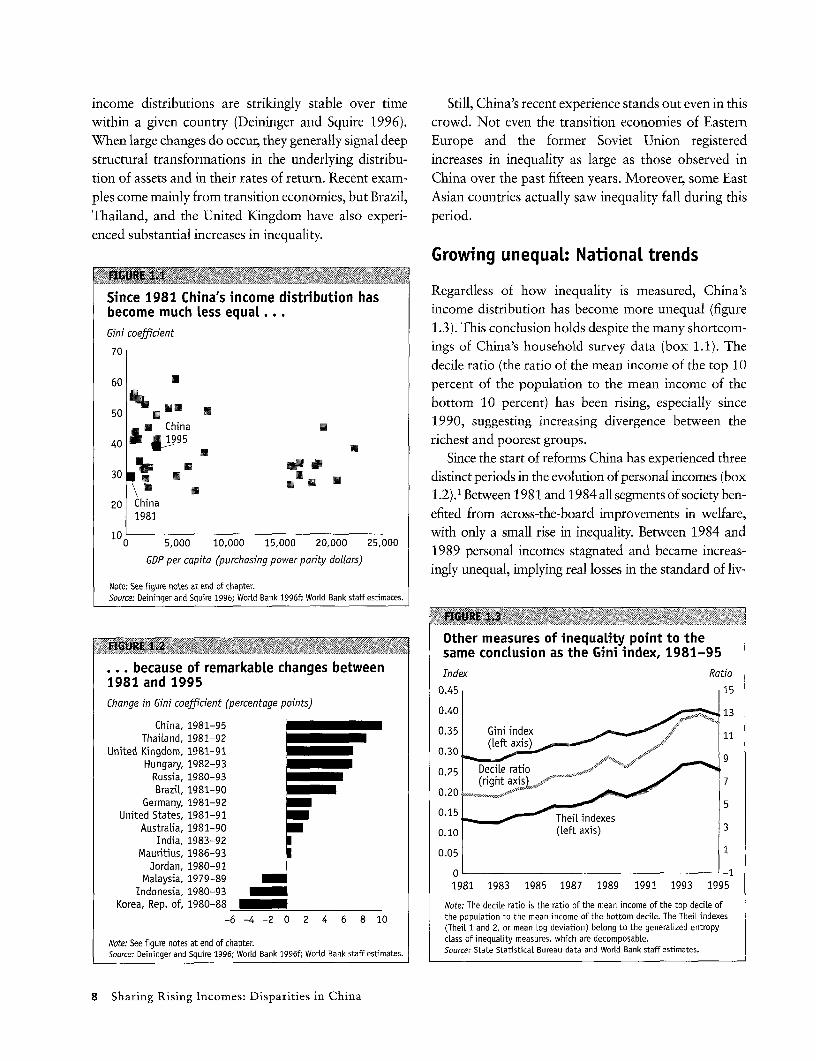
inequality is now just about average by internationalstandards (figure 1.1). In 1981 China's Gini coefficient
(a measure of inequality of income distribution rangingfrom 0, absolute equality, to 100, absolute inequality)was 28.8. By 1995 it was 38.8-lower than in most
Latin American, African, and East Asian countries andsimilar to that in the United States, but higher than in
most transition economies in Eastern Europe and manyhigh-income countries in Western Europe.
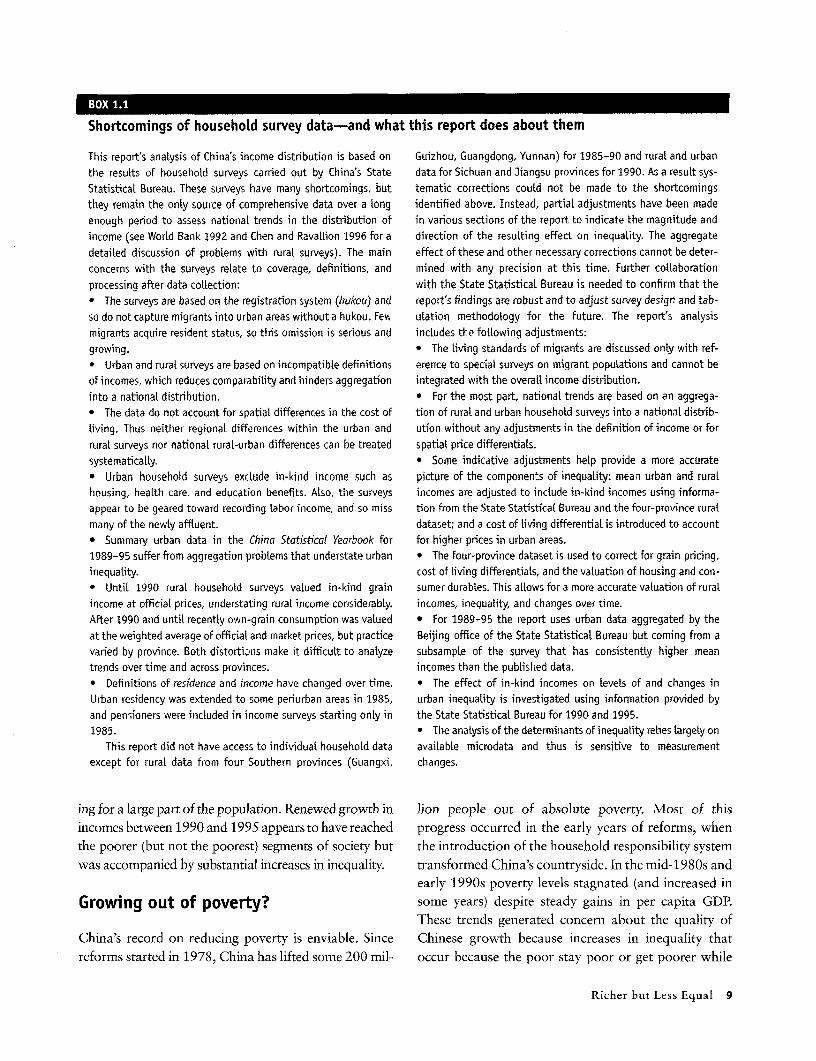
The increase in China's Gini coefficient was by far the
largest of all countries for which comparable data areavailable (figure 1.2). Such a large change is unusual.Levels of inequality vary enormously by country, but
7
income distributions are strikingly stable over time Still, China's recent experience stands out even in thiswithin a given country (Deininger and Squire 1996). crowd. Not even the transition economies of EasternWhen large changes do occur, they generally signal deep Europe and the former Soviet Union registeredstructural transformations in the underlying distribu- increases in inequality as large as those observed intion of assets and in their rates of return. Recent exam- China over the past fifteen years. Moreover, some Eastples come mainly from transition economies, but Brazil, Asian countries actually saw inequality fall during thisThailand, and the United Kingdom have also experi- period.enced substantial increases in inequality.
Growing unequal: National trends_~~ 5<
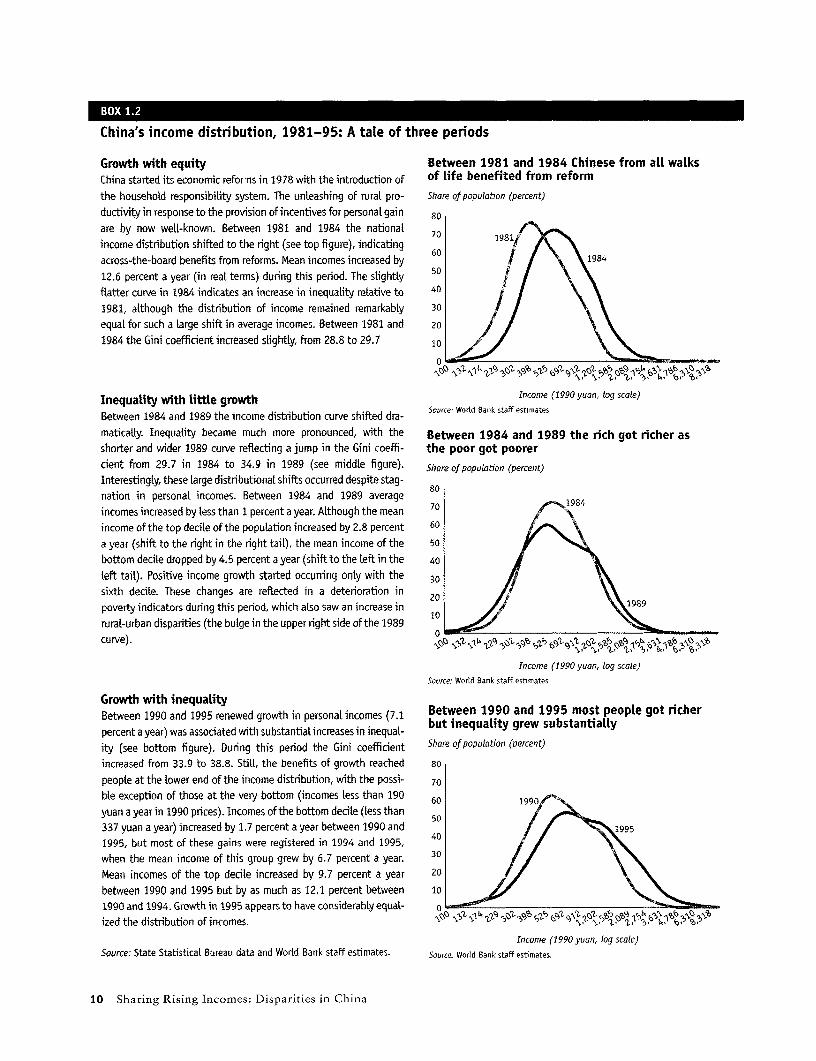
Since 1981 China's income distribution has Regardless of how inequality is measured, China'sbecome much less equal ... income distribution has become more unequal (figureGini coefficient 1.3). This conclusion holds despite the many shortcom-70 ings of China's household survey data (box 1.1). The
decile ratio (the ratio of the mean income of the top 1060 percent of the population to the mean income of the
50 bottom 10 percent) has been rising, especially sinceChina * 1990, suggesting increasing divergence between the
40 A 995 richest and poorest groups.
i * i Since the start of reforms China has experienced three30 * 0 * Eli gg S distinct periods im the evolution of personal incomes (box
20 China 1.2).1 Between 1981 and 1984 all segments of society ben-1981 efited from across-the-board improvements in welfare,
o0 with only a small rise in inequality. Between 1984 and0 DP5,000apit 10,000asing 15,00 20,000 25,000s1989 personal imcomes stagnated and became increas-
ingly unequal, implying real losses in the standard of liv-Note: See figure notes at end of chapter.Source: Deininger and Squire 1996; World Bank 1996f, World Bank staff estimates.
Other measures of inequality point to thesame conclusion as the Gini index, 1981-95
... because of remarkable changes between Index Ratio1981 and 19950451Change in Gini coefficient (percentage points) 0.40 13
China, 1981-95 0.35 Gini index 11ThaiLand, 1981-92(lfaxs
United Kingdom, 1981-91 0.30 *o"
Hungary, 1982-93 0.25 Decile ratio 9Russia, 1980-93 r7Brazil, 1981-90 0.20 ,
Germany, 1981-92 5United States, 1981-91 0.15 Theil indexes
AustraLia, 1981-90 0.10 (teft axis) 3India, 1983-92
Mauritius, 1986-93 0.05 1Jordan, 1980-91 0 -1
MaLaysia, 1979-89 1981 1983 1985 1987 1989 1991 1993 1995Indonesia, 1980-93
Korea, Rep. of, 1980-88 Note: The deciLe ratio is the ratio of the mean income of the top decile of
-6 -4 -2 0 2 4 6 8 10 the popuLation to the mean income of the bottom decile. The TheiL indexes(Theil 1 and 2, or mean Log deviation) beLong to the generalized entropy
Note: See figure notes at end of chapter. cLass of inequality measures, which are decomposable.Source: Deininger and Squire 1996; World Bank 1996f; World Bank staff estimates. Source: State StatisticaL Bureau data and World Bank staff estimates.
8 Sharing Rising Incomes: Disparities in China
BOX 1.1
Shortcomings of household survey data-and what this report does about them
This report's analysis of China's income distribution is based on Guizhou, Guangdong, Yunnan) for 1985-90) and rural and urbanthe results of household surveys carried out by China's State data for Sichuan and Jiangsu provinces for 1990. As a result sys-Statistical Bureau. These surveys have many shortcomings, but tematic corrections could not be made to the shortcomingsthey remain the only source of comprehensive data over a long identified above. Instead, partial adjustments have been madeenough period to assess national trends in the distribution of in various sections of the report to indicate the magnitude andincome (see World Bank 1992 and Chen and Ravallion 1996 for a direction of the resulting effect on inequality. The aggregatedetailed discussion of problems with rural surveys). The main effect of these and other necessary corrections cannot be deter-concerns with the surveys relate to coverage, definitions, and mined with any precision at this time. Further collaborationprocessing after data collection: with the Stdte StatisticaL Bureau is needed to confirm that the* The surveys are based on the registration system (hukou) and report's findings are robust and to adjust survey desigr and tab-so do not capture migrants into urban areas without a hukou. Fey. ulation methodology for the future. The report's analysismigrants acquire resident status, so this omission is serious and includes the following adjustments.growing. * The living standards of migrants are discussed only with ref-* Urban and rural surveys are based on incompatible definitions erence to special surveys on migrant populations and cannot beof incomes, which reduces comparability and hinders aggregation integrated with the overall income distribution.into a national distribution. * For the most part, national trends are based on an aggrega-* The data do not account for spatial differences in the cost of tion of rural and urban household surveys into a national distrib-living. Thus neither regional differences within the urban and ution without any adjustments in the definition of income or forrural surveys nor national rural-urban differences can be treated spatial price differentials.systematically. * Some indicative adjustments help provide a more accurate* Urban household surveys exclude in-kind income such as picture of the components of inequality: nean urban and ruralhousing, health care, and education benefits. Also, the surveys incomes are adjusted to include in-kind incomes using informa-appear to be geared toward recording labor income, and so miss tion from the State Statisticat Bureau and the four-province ruratmany of the newly affluent. dataset; and a cost of living differential is introduced to account* Summary urban data in the China Statistical Yearbook for for higher prices in urban areas.1989-95 suffer from aggregation problems that understate urban * The four-province dataset is used to correct for grain pricing,inequality. cost of living differentials, and the valuation of housing and con-* Until 1990 rural household surveys valued in-kind grain sumer durables. This allows for a more accurate valuation of ruralincome at official prices, understating rural income considerably. incomes, inequality, and changes over time.After 1990 and until recently own-grain consumption was valued * For 1989-95 the report uses urban data aggregated by theat the weighted average of official and market prices, but practice Beijing office of the State Statistical Bureau but coming from avaried by province. Both distorticns make it difficult to analyze subsample of the survey that has consistently higher meantrends over time and across provinces. incomes than the published data.* Definitions of residence and income have changed over time. * The effect of in-kind incomes on levels of and changes inUrban residency was extended to some periurban areas in 1985, urban inequality is investigated using information provided byand pensioners were included in income surveys starting only in the State Statistical Bureau for 1990 and 1995.1985. * The analysis of the determinants of inequality rehles largeLy on
This report did not have access to individual household data available microdata and thus is sensitive to measurementexcept for rural data from four Southern provinces (Guangxi, changes.
ing for a large part of the population. Renewed growth in lion people out of absolute poverty. Most of this
incomes between 1990 and 1995 appears to have reached progress occurred in the early years of reforms, when
the poorer (but not the poorest) segments of society but the introduction of the household responsibility system
was accompanied by substantial increases in inequality. transformed China's countryside. In the mid-1980s andearly 1990s poverty levels stagnated (and increased in
Growing out of poverty? some years) despite steady gains in per capita GDP.
These trends generated concern about the quality of
China's record on reducing poverty is enviable. Since Chinese growth because increases in inequality thatreforms started in 1978, China has lifted some 200 mil- occur because the poor stay poor or get poorer while
Richer but Less Equal 9
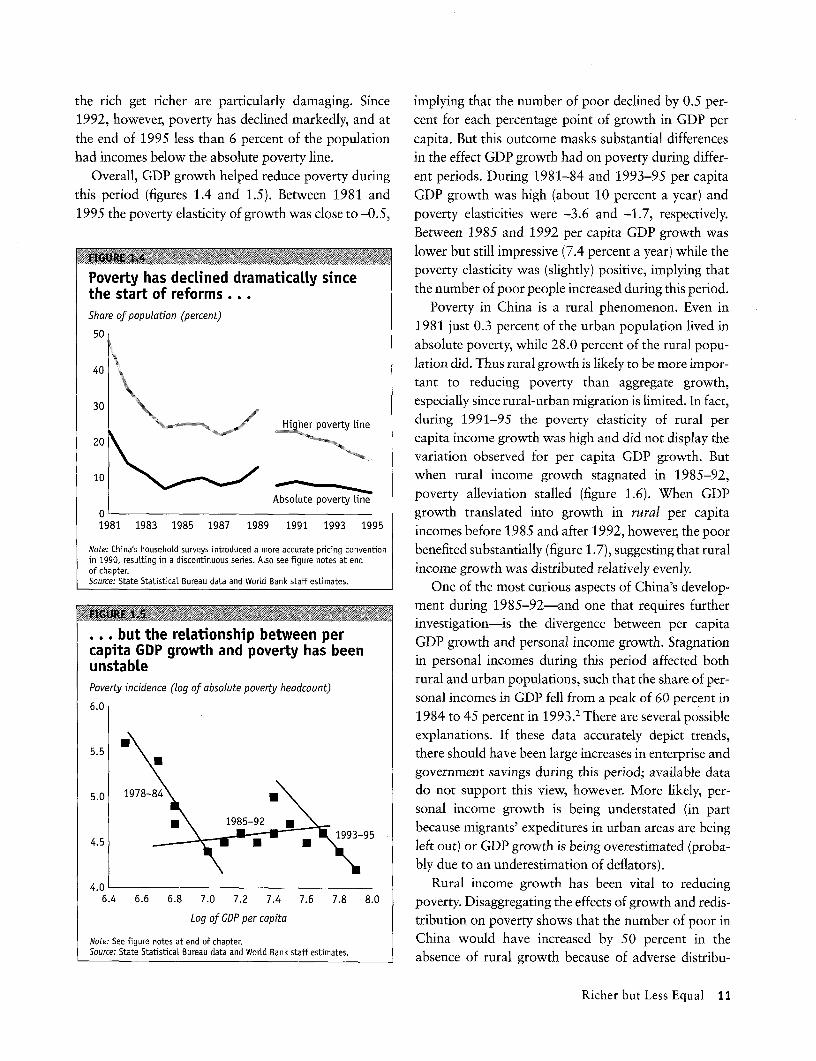
China's income distribution, 1981-95: A tate of three periods
Growth with equity Between 1981 and 1984 Chinese from all walksChina started its economic reforns iri 1978 with the introduction of of life benefited from reformthe household responsibility system. The unleashing of rural pro- Share of population (percent)ductivity in response to the provision of incentives for personal gain 80are by now well-known. Between 1981 and 1984 the national 70 1981income distribution shifted to the right (see top figure), indicating 60
across-the-board benefits from reforms. Mean incomes increased by 198412.6 percent a year (in real terms) during this period. The slightly 50flatter curve in 1984 indicates an increase in inequality relative to 401981, although the distribution of income remained remarkabLy 30equaL for such a large shift in average incomes. Between 1981 and 201984 the Gini coefficient increased slightly, from 28.8 to 29.7 10
0
Inequality with little growth income (1990 Yuan tog scale)Between 1984 and 1989 the income distribution curve shifted dra- Source- World Bank staff estimates
matically. Inequality became much more pronounced, with the Between 1984 and 1989 the rich got richer asshorter and wider 1989 curve reflecting a jump in the Gini coeffi- the poor got poorercient from 29.7 in 1984 to 34.9 in 1989 (see middle figure). Share of population (percent)Interestingly, these large distributional shifts occurred despite stag- 80nation in personal incomes. Between 1984 and 1989 average 1984incomes increased by less than 1 percent a year. Although the meanincome of the top decile of the population increased by 2.8 percent 60a year (shift to the right in the right tail), the mean income of the 50
bottom decile dropped by 4.5 percent a year (shift to the left in the 40left tail). Positive income growth started occuning only with the 30sixth decile. These changes are reflected in a deterioration in 20poverty indicators during this period, which atso saw an increase in 10 1989
rural-urban disparities (the bulge in the upper right side of the 1989 curve). 0 A1f9t3°W6?Zo,,,0,ob1>3
Income (1990 yuon, log scale)Source: Wortd Bank staff estimates
Growth with inequalityBetween 1990 and 1995 renewed growth in personal incomes (7.1 Between 1990 and 1995 most people got richerpercent a year) was associated with substantialincreases in inequal-ity (see bottom figure). During this period the Gini coefficient Share of population (percent)increased from 33.9 to 38.8. Still, the benefits of growth reached 80people at the lower end of the income distribution, with the possi- 70ble exception of those at the very bottom (incomes less than 190 60 1990yuan a year in 1990 prices). Incomes of the bottom decile (less than 50337 yuan a year) increased by 1.7 percent a year between 1990 and 4 19951995, but most of these gains were registered in 1994 and 1995,when the mean income of this group grew by 6.7 percent a year. 30Mean incomes of the top decile increased by 9.7 percent a year 20between 1990 and 1995 but by as much as 12.1 percent between 101990 and 1994. Growth in 1995 appears to have considerably equal- oized the distribution of incomes. 3 3,9 3
Income (1990 yuan, log scale)Source: State Statistical Bureau data and World Bank staff estimates. Source. World Bank staff estimates.
10 Sharing Rising Incomes: Disparities in China
the rich get richer are particularly damaging. Since implying that the number of poor declined by 0.5 per-1992, however, poverty has declined markedly, and at cent for each percentage point of growth in GDP perthe end of 1995 less than 6 percent of the population capita. But this outcome masks substantial differenceshad incomes below the absolute poverty line. in the effect GDP growth had on poverty during differ-
Overall, GDP growth helped reduce poverty during ent periods. During 1981-84 and 1993-95 per capitathis period (figures 1.4 and 1.5). Between 1981 and GDP growth was high (about 10 percent a year) and1995 the poverty elasticity of growth was close to -0.5, poverty elasticities were -3.6 and -1.7, respectively.
Between 1985 and 1992 per capita GDP growth was_l U g lower but still impressive (7.4 percent a year) while the
Poverty has declined dramatically since poverty elasticity was (slightly) positive, implying thatthe start of reformscie . .the number of poor people increased during this period.Share of population (percent) Poverty in China is a rural phenomenon. Even in50 1981 just 0.3 percent of the urban population lived in
absolute poverty, while 28.0 percent of the rural popu-
40 lation did. Thus rural growth is likely to be more impor-tant to reducing poverty than aggregate growth,
30 .> especially since rural-urban migration is limited. In fact,Higvher poverty Line during 1991-95 the poverty elasticity of rural per
20 capita income growth was high and did not display thevariation observed for per capita GDP growth. But
10 when rural income growth stagnated in 1985-92,Absolute poverty line poverty alleviation stalled (figure 1.6). When GDP
o growth translated into growth in rural per capita1981 1983 1985 1987 1989 1991 1993 1995 incomes before 1985 and after 1992, however, the poor
Note: China's househoLd surveys introduced a more accurate pricing convention benefited substantially (figure 1.7), suggesting that ruralin 1990, resulting in a discontinuous series. Also see figure notes at endof chapter. income growth was distributed relatvely evenly.Source: State Statistical Bureau data and WorLd Bank staff estimates. One of the most curious aspects of China's develop-
ment during 1985-92-and one that requires furtherinvestigation-is the divergence between per capita
. . . but the relationship between per GDP growth and personal income growth. Stagnationcapita GDP growth and poverty has been in personal incomes during this period affected bothunstable
rural and urban populations, such that the share of per-Pover0y iniene(lgo asluepoet hacon)sonal incomes in GDP fell from a peak of 60 percent in
1984 to 45 percent in 1993.2 There are several possible5.5 explanations. If these data accurately depict trends,
5.5 \ a there should have been large increases in enterprise andgovernment savings during this period; available data
5.0 1978-84 do not support this view, however. More likely, per-sonal income growth is being understated (in part
\1o985-92 because migrants' expeditures in urban areas are being4.5 95 * * * \.left out) or GDP growth is being overestimated (proba-
bly due to an underestimation of deflators).4.0 Rural income growth has been vital to reducing
6.4 6.6 6.8 7.0 7.2 7.4 7.6 7.8 8.0 poverty. Disaggregating the effects of growth and redis-Log of GDP per copita tribution on poverty shows that the number of poor in
Note: See figure notes at end of chapter. China would have increased by 50 percent in theSource: State StatisticaL Bureau data and WorLd Bank staff estimates. absence of rural growth because of adverse distribu-
Richer but Less Equal 11
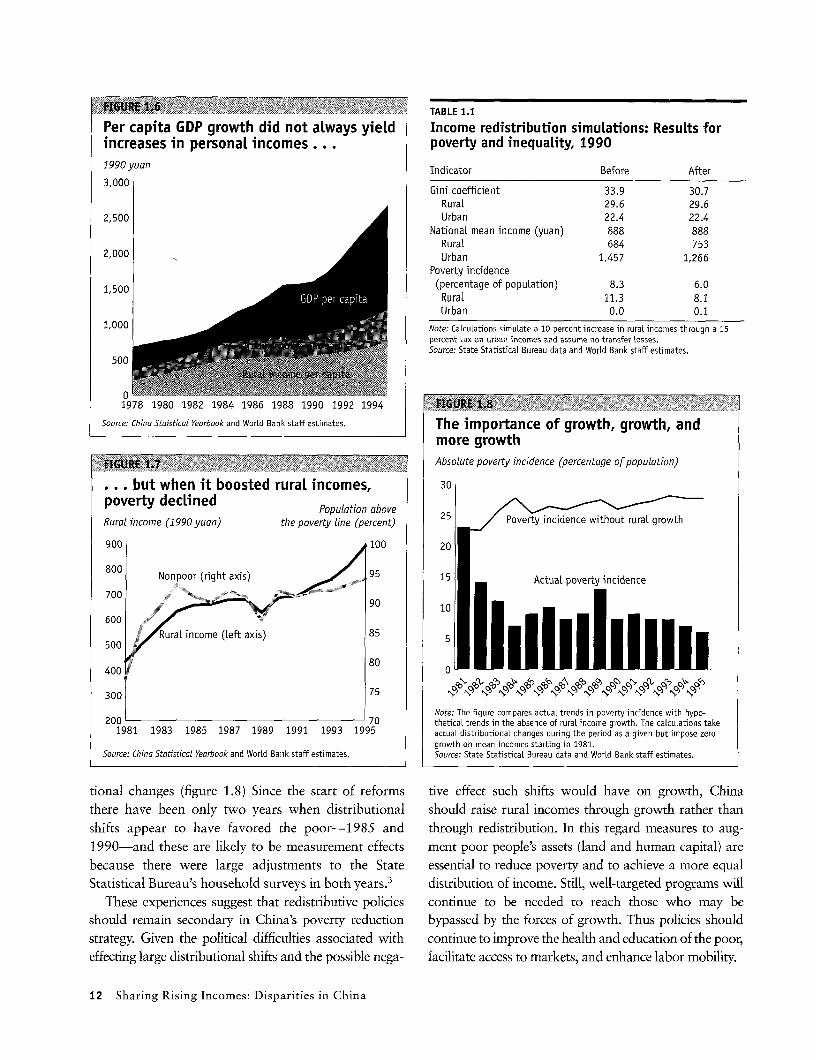
ftG(WRW1~ - TABLE 1.1Per capita GDP growth did not always yield Income redistribution simulations: Results forincreases in personal incomes ... poverty and inequality, 19901990 yuan Indicator Before After
3,000 Gini coefficient 33.9 30.7Rural 29.6 29.6
2,500 Urban 22.4 22.4National mean income (yuan) 888 888
Rural 684 7532,000 Urban 1,457 1,266
Poverty incidence
1,500 (percentage of popuLation) 8.3 6.0, _ - RuraL 11.3 8.1Urban 0.0 0.1
1,000 Note: CalcuLations simulate a 10 percent increase in rural incomes through a 15percent tax on urban incomes and assume no transfer Losses.Source: State Statistical Bureau data and World Bank staff estimates.
500
0 1978 1980 1982 1984 1986 1988 1990 1992 1994
Source: China Staistical Yearbook and World Bank staff estimates. The importance of growth, growth, andmore growth
~T.GUE _7 {Absolute poverty incidence (percentage of population)
... but when it boosted rural incomes, 30poverty declined Population above 25 P iniec w
Rural income (1990 yuan) the poverty line (percent) 25 Poverty incidence without rural growth
900 LO0 20
800 Nonpoor (right axis) 95 15 Actual poverty incidence
700 e Atapoetiniec
601 /sP 4 90 j 010
Rural income (left axis) 85 5500
400 ~~~ ~~~~~~~~80
3001 75 1 1 Xbo9°oX oo59oOw oo59Ffi A9i°ot 9t 9> 9 9> 9w 9 l
Note: The figure compares actual trends in poverty incidence with hypo-200 70 theticaL trends in the absence of ruraL income growth. The calculations take
1981 1983 1985 1987 1989 1991 1993 1995 actual distributionaL changes during the period as a given but impose zerogrowth on mean incomes starting in 1981.
Source: China Statistical Yearbook and World Bank staff estimates. Source: State StatisticaL Bureau data and WorLd Bank staff estimates.
tional changes (figure 1.8) Since the start of reforms tive effect such shifts would have on growth, Chinathere have been only two years when distributional should raise rural incomes through growth rather thanshifts appear to have favored the poor-1985 and through redistribution. In this regard measures to aug-1990-and these are likely to be measurement effects ment poor people's assets (land and human capital) arebecause there were large adjustments to the State essential to reduce poverty and to achieve a more equalStatistical Bureau's household surveys in both years.3 distribution of income. Still, well-targeted programs will
These experiences suggest that redistributive policies continue to be needed to reach those who may beshould remain secondary in China's poverty reduction bypassed by the forces of growth. Thus policies shouldstrategy. Given the political difficulties associated with continue to improve the health and education of the poor,effecting large distributional shifts and the possible nega- facilitate access to markets, and enhance labor mobility.
12 Sharing Rising Incomes: Disparities in China
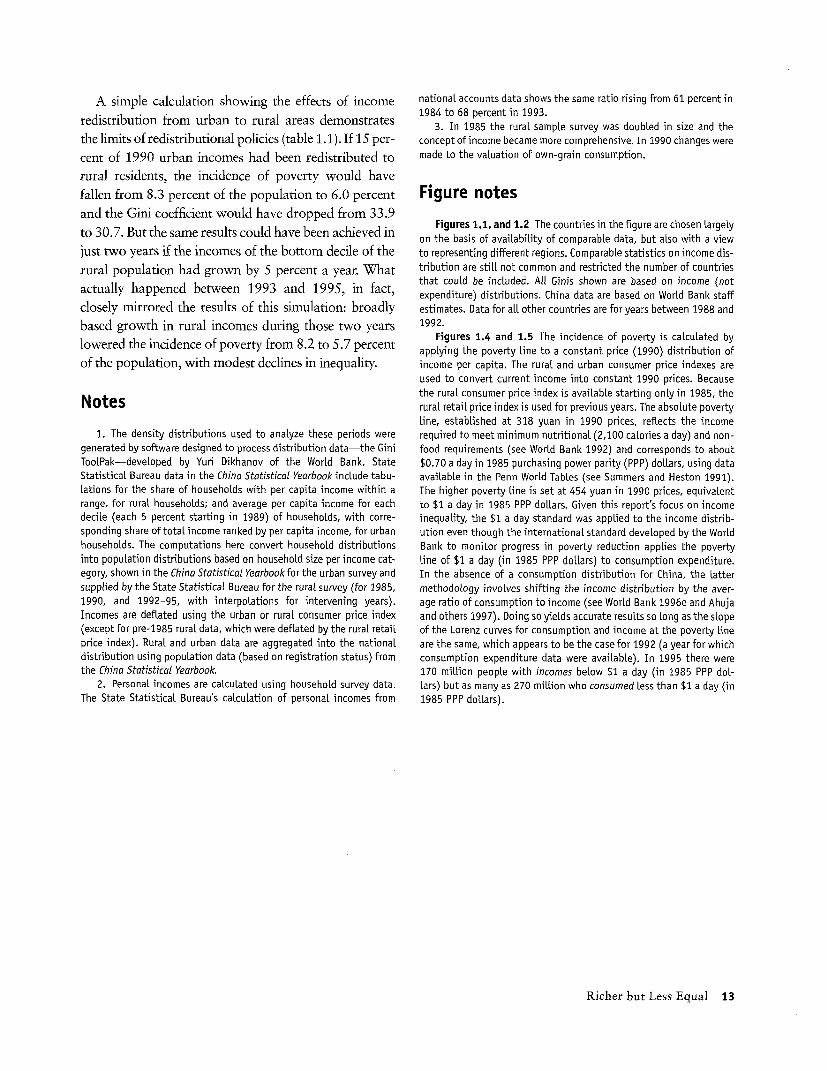
A simple calculation showing the effects of income nationaL accounts data shows the same ratio rising from 61 percent inredistribution from urban to rural areas demonstrates 1984 to 68 percent in 1993.
3. In 1985 the ruraL sampLe survey was doubLed in size and thethe limits of redistributional policies (table 1.1). If 15 per- concept of income became more comprehensive. In 1990 changes were
cent of 1990 urban incomes had been redistributed to made to the valuation of own-grain consumption.
rural residents, the incidence of poverty would have
fallen from 8.3 percent of the population to 6.0 percent Figure notesand the Gini coefficient would have dropped from 33.9ton30.7. Buti theffsamenrelts ould have broppee achied i9 Figures 1.1. and 1.2 The countries in the figure are chosen Largelyto 30.7. But the same results could have been achieved in on the basis of availabiLity of comparabLe data, but also with a view
just two years if the incomes of the bottom decile of the to representing different regions. Comparable statistics on income dis-
rural population had grown by 5 percent a year. What tribution are still not common and restricted the number of countriesactuall3and 1995, in fact, that could be incLuded. All Ginis shown are based on income (not
actually happened between 1993 ana 1995, m ract, expenditure) distributions. China data are based on WorLd Bank staffclosely mirrored the results of this simulation: broadly estimates. Data for aLL other countries are for years between 1988 and
based growth in rural incomes during those two years 1992.Figures 1.4 and 1.5 The incidence of poverty is caLcuLated by
lowered the incidence of poverty from 8.2 to 5.7 percent applying the poverty Line to a constant price (1990) distribution of
of the population, with modest declines in inequality. income per capita. The ruraL and urban consumer price indexes areused to convert current income into constant 1990 prices. Becausethe ruraL consumer price index is availabLe starting onLy in 1985, the
Notes ruraL retaiL price index is used for previous years. The absolute poverty
Line, estabLished at 318 yuan in 1990 prices, reflects the income1. The density distributions used to analyze these periods were required to meet minimum nutritionaL (2,100 caLories a day) and non-
generated by software designed to process distribution data-the Gini food requirements (see WorLd Bank 1992) and corresponds to aboutTooLPak-deveLoped by Yuri Dikhanov of the World Bank. State $0.70 a day in 1985 purchasing power parity (PPP) doLLars, using dataStatisticaL Bureau data in the China Statistical Yearbook incLude tabu- avaiLabLe in the Penn WorLd TabLes (see Summers and Heston 1991).
Lations for the share of households with per capita income within a The higher poverty Line is set at 454 yuan in 1990 prices, equivalentrange, for ruraL househoLds; and average per capita income for each to $1 a day in 1985 PPP doLLars. Given this report's focus on incomedecile (each 5 percent starting in 1989) of househoLds, with corre- inequaLity, the $1 a day standard was appLied to the income distrib-sponding share of totaL income ranked by per capita income, for urban ution even though the international standard deveLoped by the WorLdhousehoLds. The computations here convert househoLd distributions Bank to monitor progress in poverty reduction appLies the povertyinto popuLation distributions based on househoLd size per income cat- Line of $1 a day (in 1985 PPP doLLars) to consumption expenditure.egory, shown in the China Statistical Yearbook for the urban survey and In the absence of a consumption distribution for China, the Lattersupplied by the State StatisticaL Bureau for the ruraL survey (for 1985, methodology involves shifting the income distribution by the aver-1990, and 1992-95, with interpoLations for intervening years). age ratio of consumption to income (see WorLd Bank 1996e and AhujaIncomes are defLated using the urban or ruraL consumer price index and others 1997). Doing so yieLds accurate resuits so Long as the slope(except for pre-1985 ruraL data, which were defLated by the ruraL retaiL of the Lorenz curves for consumption and income at the poverty Lineprice index). RuraL and urban data are aggregated into the nationaL are the same, which appears to be the case for 1992 (a year for whichdistribution using popuLation data (based on registration status) from consumption expenditure data were avaiLable). In 1995 there werethe China Statistical Yearbook. 170 miLLion peopLe with incomes beLow $1 a day (in 1985 PPP doL-
2. PersonaL incomes are caLcuLated using househoLd survey data. lars) but as many as 270 miLLion who consumed Less than $1 a day (inThe State StatisticaL Bureau's caLcuLation of personaL incomes from 1985 PPP doLLars).
Richer but Less Equal 13


e'
IN,
Growl'ng art.:PRural-Urban andCoastal-Intefior Gaps
look at the components of the worsening44kwnational income inequality reveals uniquefeatures in China's income distribution and points to theunfinished nature of transition. The widening gulf betweenrural and urban incomes is the biggest contributor toincreased inequality. Regional disparities are responsiblefor a smaller but growing portion of inequality.
The rural-urban divide is growing
The income gap between China's rural and urban popula-tions is large and growing. According to State StatisticalBureau data, rural-urban disparities accounted for morethan one-third of inequality in 1995 and about 60 percentof the increase in inequality between 1984 and 1995 (fig-ure 2.1). Adjusting these data for some of the shortcom-ings noted in box 1.1 reveals an even starker picture.Adj'usted, rural-urban disparities accounted for more than50 percent of inequality in 1995 and explain 75 percent of
15

Rural-urban disparities account for the Rural per capita incomes are plummetingbulk of the increase in inequality relative to urban per capita incomes, 1978-95
Rural-urban income ratio
Unadjusted (original) income 80
Theil index
0.25 70Contribution to change /in inequality between Rural-urban
0.20 1984 and 1995 inequality 60 Constant 1978 prices
0.15 5-Intraurban
0.10 21 ~~~~~~~~~inequaLity urn e
40
0.05 18. ~~~~~~~~~IntraruratinequaLity 30
1978 1980 1982 1984 1986 1988 1990 1992 1994
1984 1995 Note: Rural incomes deflated using the rural consumer price index for1985-95. Pre-1985 rural incomes deflated using the ruraL retail price
Adjusted (revised) income index. Urban incomes deflated using the urban consumer price indexSource: WorLd Bank staff estimates based on State StatisticaL Bureau data.
Theil index
0.35
0.30 Contribution to change the differential increases in the cost of living betweenin inequality between urban and rural areas. But even the deflated series
0.25 1984 and 1995 RuraL-urban reveals an unmistakable trend. Rural incomes grew
0.20 inequatity rapidly during the early years of reform but in 1985
0.15 74.4 began to trail increases in urban incomes. This trendIntraurban reversed only in 1995.
0.10 3%inequality Two other variables affect the accurate assessment of
0.05 16.2 IntraruraL rural-urban income disparities, and both have been
0 1984 1995 incorporated in the adjusted data in figure 2.1 and table
Note: See figure note at end of chapter. 2.1: cost of living differences between rural and urbanSource: World Bank staff estimates based on State Statistical Bureau data. areas and the underestimation of both rural and urban
in-kind income.1 Rural incomes were adjusted tothe increase between 1984 and 1995. The data adjust- include imputed rent and urban incomes to include in-
ments yield two important changes: they lower inequal- kind income for housing, education, health care, pen-
ity within rural and within urban areas but maintain the sions and other subsidized services. In addition, a 15trend increase, and they magnify rural-urban dispari- percent cost differential was introduced between urbanties. The overall impact of the changes is an increase in and rural areas. These adjustments lowered ruraltotal inequality. incomes to 31 percent of urban incomes in 1990-sub-
China's rural-urban income gap is large by interna- stantially less than the 50 percent suggested by officialtional standards. Data for thirty-six countries show that data.2 The adjusted data also yield much higher
urban incomes rarely are more than twice rural national inequality (as measured by the Gini coefficient)
incomes; in most countries rural incomes are 66 percent because urban income increases more than compensateor more of urban incomes (Yang and Zhou 1996). In for the higher cost of living in urban areas.China rural incomes were only 40 percent of urban The magnitude of the gap between China's rural andincomes in 1995, down from a peak of 59 percent in urban incomes points to imperfect mobility in factor1983 (figure 2.2). These figures do not take into account markets, especially for labor. Despite increasing accom-
16 Sharing Rising Incomes: Disparities in China

modation of the swelling demand for rural emigration, and 1990 almost certainly represent measurementimpediments to labor mobility remain. These are moti- effects because there were large adjustments to thevated by the government's desire to control the pace of State Statistical Bureau's household survey in bothmigration and ensure grain self-sufficiency. The costs of years.relocation, lack of job information, absence of a hous- This section examines the effect data adjustmentsing market, and limited access to social services in have on urban and rural inequality: corrections areurban areas pose additional constraints to migration. made to coverage, valuation, and price differentials.3
Meanwhile, government policies continue to prop up Revisions to the rural household survey data raise theurban standards of living. Urban citizens are subsidized mean income and reduce inequality but do not alter thein a variety of ways, including through the absence of finding that overall inequality increased between 1985hard budget constraints for state-owned enterprises and 1990. Similarly, incorporating in-kind income(primarily to protect urban jobs), low-cost capital for yields substantially higher urban incomes that are moreurban enterprises, low-cost housing for urban residents, equally distributed, but urban inequality clearly roseand generous pensions and health insurance schemes. between 1990 and 1995.Enterprise and financial sector reforms and fiscal con-straints are challenging these acquired rights: some in-kind benefits have been eliminated while others are 0 tbeing monetized, as workers now pay higher rents and Rural and urban inequality have increasedcontribute more to their pension and medical benefits. steadily since reforms beganThis may account for part of the observed increase in Rural inequality index
the rural-urban income gap in official data. 0.35
0.30
The magnitude of rural and urban Giniinequalities depends on how incomes 0.25 coefficient
are measured 0.20
According to official data, both rural and urban 0.15 Theil
inequality increased steadily between 1981 and 1995 0.10 index(figure 2.3). The urban Gini coefficient increased from17.6 in 1981 to 27.5 in 1995, although it dropped dur- 0.05
ing the recession years of 1989-91 and in 1995. The orural Gini increased from a much higher base of 24.2 1981 1983 1985 1987 1989 1991 1993 1995
in 1981 to 33.3 in 1995. It dipped in 1985 and in 1990 Urban inequality indexand has stabilized since 1993. The declines in 1985
0.35
TABLE 2.1 0.30
Rural-urban income gap and inequality with data 0.25adjustments, 1990
0.20 GiniContribution coefficient
Rural-urban National to national 0.15income ratio Gini inequality
Meassure (percent) coefficient (percent) 0.10
Official data 49.5 33.9 29.5.9hWith 15 percent 0.05. Theiihigher cost of livingin urban areas 56.9 31.9 20.5 0
Plus in-kind incomes 30.5 40.6 51.8 1981 1983 1985 1987 1989 1991 1993 1995
Source: State Statistical Bureau urban household survey team and World Bank staff Source: World Bank staff estimates.
estimates. _________________________Growing_Apart:_Rural-Urban_and_Coastal-Interior_Gaps_17
Growing Apart: Rural-Urban and Coastal-Interior Gaps 17

Rural incomes revaLued (based on poverty lines) to measure the local cost of thesame standard of living everywhere.5
Official data from the rural household surveys prior to To assess the effect of these data adjustments,1990 rely on administrative planning prices for the valu- inequality indicators were calculated for each of threeation of in-kind income from consumption of own-farm income definitions (figure 2.4). The first (originalproduction. This approach undervalues a large compo- income) is the State Statistical Bureau's net income mea-nent of income-nonmarketed home production of sure direct from its data files. The second incorporatesgrain-and at a rising rate over time. According to stan- imputed rents and the revaluation of grain income fromdard definitions, 21 percent of rural incomes in 1985-90 own production. The third uses the new cost of livingin the four-province data set (Guangxi, Guizhou, deflator as well. Although inequality increased duringGuangdong, and Yunnan) came from grain production, 1985-90 for all three income definitions, the adjustedof which 80 percent was the imputed value of consump-tion from own production.4 Another problem is that the 14URIPincomes used in the State Statistical Bureau's tabulations Lorenz curves for China's rural southdo not include imputed rents for housing and consumer converge once data have been adjusted,durables. Past work also has ignored spatial differences in 1985 and 1990the cost of living. Unadjusted (originaL) income
To correct for these shortcomings, in-kind grain Percentage of income
income was revalued at median local (county-level) sell- 100
ing prices for grain, as determined from primary house-
hold data. The administrative prices conventionally used 80
for valuation were 72 percent of the median selling price
in 1985 but had fallen to 48 percent by 1990, resulting in 60
serious undervaluation of grain incomes. Other adjust- 40 Original 1985 data
ments were made to impute rents for housing and con- 40
sumer durables based on the asset valuations available in Origina[ 1990 datathe primary survey data. And new province-level spatial 20
and intertemporal cost of living indexes were constructed00 20 40 60 80 100
Poorest percentiles of people
Changes in inequality are much less Adjusted (revised) incomepronounced for adjusted data, 1985-90 Percentage of income
Gini coefficient 100
35Unadjusted (original) income 80
New valuation methods 60
30 40 Revised 1985 dataRevised 1990 data
20<z New valuation ptus new cost of tiving index O
00 20 40 60 80 100
25 Poorest percentiles of people1985 1986 1987 1988 1989 1990
Note: Unadjusted income data are from the State Statistical Bureau; adjustedincomes use the new vaLuation method and the new cost of living deflator.
Source: RavaLLion and Chen 1997. Source: RaviLlion and Chen 1997.
18 Sharing Rising Incomes: Disparities in China

data yield lower inequality and a lower rate of increase adjustment reflects the difference between this imputedin inequality. Both conclusions are robust to the choice rent and average rent per capita actually paid. To thisof inequality measure; with the revisions to the primary amount is added individual contributions to theincome data, the Lorenz curves for 1985 and 1990 con- Provident Housing Fund deducted by employers (andverge (figure 2.5).6 The revaluation of grain income in- thus not reflected in workers' income). The next largestkind accounts for most of the change, although the adjustments are made for pensions and medical care.other changes also reduce inequality. The revaluation Because they are deducted by employers, pension con-rates tend to be higher in 1990 than in 1985, largely tributions are not incorporated in the personal incomesreflecting the increasing divergence of market and plan- reported in the survey.9 The medical subsidy is calcu-ning prices. lated on the basis of an average 10 percent contribution
to health care costs. Other benefits that accrue to urbanUrban incomes revisited residents but are not captured by the survey include
price, education, and other subsidies (table 2.2).The two most important shortcomings of the urban Urban standards of living are much higher than officialhousehold surveys are coverage, which is restricted to per capita income data suggest, thanks to declining but stillregistered urban residents, and undervaluation of in- large subsidies. Including the value of these in-kind bene-kind income.7 It is not possible to adjust for the first, fits raises urban incomes 78 percent in 1990 and 72 per-increasingly important shortcoming, but crude esti- cent in 1995 (table 2.3). Housing accounts for most (aboutmates by the State Statistical Bureau help gauge the 60 percent) of the increase. An important shortcoming ofeffect a more inclusive definition of urban income has the urban household survey that has not been corrected foron urban inequality. The largest adjustment is made for in this calculation is the omission of migrants (unregisteredhousing. Imputed rent for housing is calculated based residents). Including them would reduce average urbanon prices that approximate the market.' The income incomes and thereby lower the rural-urban income gap.
TABLE 2.2Total urban income, 1995(yuan per capita)
Percentiles of househoLds, ranked by per capita income
Type Total Bottom 10% 10-30% 30-50% 50-70% 70-90% Top 10%
Income used for expenses0 4,612 1,777 2,733 3,592 4,572 6,153 10,250In-kind income 3,304 2,076 2,803 3,284 3,629 4,030 3,882
Housing subsidy 1,960 1,182 1,705 2,047 2,267 2,353 1,906Pension subsidy 595 233 380 495 603 853 1,222MedicaL subsidy 306 226 264 295 325 366 367Education subsidy 252 289 269 255 238 255 185Communication subsidy 14 14 14 14 14 14 14Price subsidy 59 59 59 59 59 59 59Other in-kind income 87 69 83 88 91 95 95Other weLfare subsidy 31 24 29 31 32 35 34
a. State StatisticaL Bureau urban household survey definition.Source: State StatisticaL Bureau urban household survey team.
TABLE 2.3Distribution of in-kind income in urban areas, 1990 and 1995(percentage of household survey definition of income)
Percentiles of househoLds, ranked by per capita income
Year Total Bottom 10% 10-30% 30-50% 50-70% 70-90% Top 100
1990 77.7 137.5 106.3 90.5 79.4 67.1 49.81995 71.6 116.8 102.6 91.4 79.4 65.5 37.9Source: State Statistical Bureau urban househoLd survey team.
Growing Apart: Rural-Urban and Coastal-Interior Gaps 19

Adjusting urban incomes for in-kind InterprovinciaL and coastal-interiorbenefits lowers urban inequality but does disparities are widening but remainnot aLter the trend, 1990 and 1995 moderateUnadjusted (original) income Provincial disparities
Percentage of income Theil index100 0.30
80 0.25 Contribution tochange in inequalitybetween 1985
60 0.20 and 1995Originall 1990 data I p/
/ _ ~~~~~~~~~~~~~~~~~~~~Intraprovincial40 0.15 inequaLity
Original 1995 data 0.10 66.3%
20
O o 0.05 _ Interprovincial0 33.7% inequality
0 20 40 60 80 100 0Poorest percentiles of peopie 1985 1995
Adjusted (revised) income Regional disparities
Percentage of income Theit index100
0.30
80 0.25 Contribution toD . ~~~~~~change in inequaLity /~~~~~~~~~between 1985/
60 0.20 and 1995
Revised 1990 data 0.15 IntraregionaL
40 Revised 1995 data inequality0.10
200.05
Coastal-interior
0 20 40 60 80 100 0alityPoorest percentiles of people 1985 1995
Note: Unadjusted income data are from the State StatisticaL Bureau; adjusted Note: The municipaLities of Beijing, Shanghai, and Tianjin are includedincomes reflect the incorporation of in-kind benefits. in the coast.Source: World Bank staff estimates. Source: WorLd Bank staff estimates based on State Statistical Bureau data.
Whichever income measure is used, urban inequality The gulf between the coast and theincreased between 1990 and 1995 (figure 2.6). But the interior is wideningdistribution of in-kind benefits has an equalizing effecton urban welfare. The ratio of the top to bottom Within China, much of the debate on inequality hasincomes (State Statistical Bureau definition) was 4.4 in focused on regional growth patterns. This is under-1990 and 5.8 in 1995, but once in-kind incomes are standable given sharply widening regional disparities:taken into account the ratios drop to 2.8 for 1990 and interprovincial differences contributed 50 percent3.7 for 1995. These are only approximations, however, more to inequality in 1995 than in 1985, and the con-as the largest adjustment (for housing) is based on a flat tribution of the coastal-interior gap doubled during theprice per square meter and not market value, which same period (figure 2.7 and box 2.1). Yet regionalwould reflect the location and quality of housing. income inequality in China is still moderate. As much
20 Sharing Rising Incomes: Disparities in China
BOX 2.1
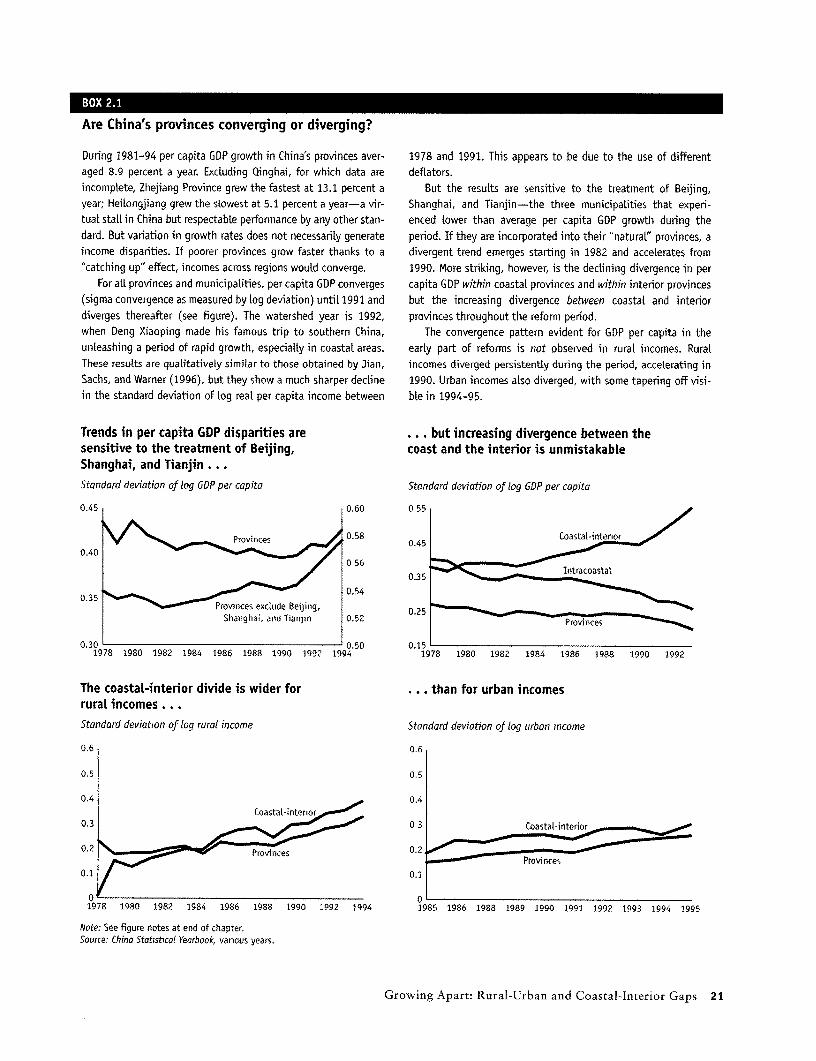
Are China's provinces converging or diverging?
During 1981-94 per capita GDP growth in China's provinces aver- 1978 and 1991. This appears to be due to the use of differentaged 8.9 percent a year. ExcLuding Qinghai, for which data are deflators.incomplete, Zhejiang Province grew the fastest at 13.1 percent a But the resutts are sensitive to the treatment of Beijing,year; Heilongjiang grew the slowest at 5.1 percent a year-a vir- Shanghai, and Tianjin-the three municipaLities that experi-tual stall in China but respectable performance by any other stan- enced lower than average per capita GOP growth durng thedard. But varation in growth rates does not necessarily generate period. If they are incorporated into their °natural" provinces, aincome disparities. If poorer provinces grow faster thanks to a divergent trend emerges starting in 1982 and accelerates from"catching up" effect, incomes across regions would converge. 1990. More striking, however, is the declining divergence in per
For all provinces and municipalities, per capita GDP converges capita GDP within coastal provinces and within interior provinces(sigma convergence as measured by log deviation) untiL 1991 and but the increasing divergence between coastal and interiordiverges thereafter (see figure). The wateished year is 1992, provinces throughout the reform period.when Deng Xiaoping made his famous trip to southern China, The convergence pattern evident for GOP per capita in theunleashing a period of rapid growth, especialty in coastal areas. early part of reforms is not observed in rural incomes. RuralThese results are qualitatively similar to those obtained by Jian, incomes diverged persistently during the period, accelerating inSachs, and Warner (1996), but they show a much sharper decline 1990. Urban incomes also diverged, with some tapering off visi-in the standard deviation of log real per capita income between ble in 1994-95.
Trends in per capita GDP disparities are . . . but increasing divergence between thesensitive to the treatment of Beijing, coast and the interior is unmistakableShanghai, and Tianjin . . .Standard deviation of tog GDP per capita Standard deviation of tog GDP per capita
0.45 0.60 055
o.4o~~~~~~~~Povne 0. 58 0.45 Cat0.40
0.35 nraastat
0.3sl Q~~~~~~~~~~~~~.54 .5 0.35provinces exCLude Beijing, 0.25
Shanghai, and Tianjin 0.52 Provinces
0.30 0.50 0.151978 1980 1982 1984 1986 1988 1990 1992 1994 1978 1980 1982 1984 1986 1988 1990 1992
The coastal-interior divide is wider for . . . than for urban incomesrural incomes . . .Standard deviation of log rural income Standard deviation of log urban income
0.6 0.6
0.5 0.5
0.2 ProvincP 0.2,r
0.1 0.1
0 01978 1980 1982 1984 1986 1988 1990 992 1994 1985 1986 1988 1989 1990 1991 1992 1993 1994 1995
Note: See figure notes at end of chapter.Source: China Statistical Yearbook, vanous years.
Growing Apart: Rural-Urban and Coastal-Interior Gaps 21

There is a clear income gap between the . .. but rural-urban disparities are muchcoast and the interior . . Larger ...Share of population, 1992 (percent) Share of population, 1992 (percent)
60 60
50 50
Interior RuraL40 40
30 30
20 20 rbin
Coast10 10
0 0oho
Income (1990 yuan, log scale) Income (1990 yuan, log scale)
... within both the interior ... ... and the coastShore of population, 1992 (percent) Shore of population, 1992 (percent)
40 RuraL inteinor 40
30 30
20 is coaan 20 Rural coast
Urban interdor10 Ub interior go
twice as large.ll First, the interior lags the coast in hum Urba copiastevl
0 0
N' N V n, -I' I" "o' N'N 1b b l'~'~
Income (1d990 yuan, log scale) Income (1990 yuon, log scale)Source. World Bank staff estimates based on State StatisticaL Bureau data.
as two-thirds of total inequality remains within provin- ones, fueling disparities in personal incomes. Coastal
cial borders. 10 provinces grew. 2.2 percentage points faster duringProvincial distributions for 1992 (the only year for 1978-94, 2.8 percentage points faster during 1985-94,
which data are available) are telling (figure 2.8). They and a remarkable 5 percentage points faster duringshow that the income gap between the coast and the inte- 1990-94. Initial conditions, natural endowments, andnior is significant; in 1992 average incomes in coastal preferential policies have combined to give coastalChina were 50 percent higher than in interior provinces, provinces a boost over interior ones in taking advantageBut in the same year the rural-urban income gap was of the opportunities created by reforms.12
twice as large.1 1 First, the interior lags the coast in human capital devel-Provincial income disparities are increasing for several opment. Even before reforms, education and health levels
reasons. Since the start of reforms, coastal provinces have were higher on the coast; the gap has since widened.
grown faster-and at an accelerating pace-than interior Literacy, school attendance, and infant mortality are all
22 Sharing Rising Incomes: Disparities in China

Access to health and education services was still widespread in the Late 1970s and the 1980s ...Secondary school enrolment rate, 1985 Infant mortality rate (per 1,000 live births), 1978
80 100 Yunnan Qinghai
UFujian
60 Jians80 Guizhou60 Ningxia liangsu
Hunan *
40 g g _ , 60 * Ningxia
40 X * HeLnjag
ag HHeiLongjiang 4iangxi Hei[angjiang
20 Shandong u Zhejiang Jiangsu20 Henan * iJiLin *
Guangdong Liaonng
0 00 200 400 600 800 1,000 1,200 0 200 400 600 800
Provincial GDP per capita (1978 yuan) Provincial GDP per capita (1978 yuan)
... but in the 1990s has become more dependent on income ...Secondary school enrolment rate, 1993 Infant mortality rate (per 1,000 live births), 199380 100
,Zhejiang 8060 Shanxi Qinghai
Shangdong Xinjiang3 Inner MongoLia 60 Guizhou *
Eu~~~~~~~~~~~~~~~~~~~~40 (lingha GneLng n angx
N G ans uXinjiang * 40
20 ** *Yunnan Anhui' e Ze_
Guizhou 20 * H iLongan hejang20 ~ ~~~~~~~~~Shandong a Hebei ~~Guangdong
0 00 200 400 600 800 1,000 1,200 1,400 1,600 1,800 0 400 800 1,200 1,600 2,000
Provincial GDP per capita (1978 yuan) Provincial GDP per capita (1978 yuan)
... reflecting the shrinking role of government, which itself has become less equalSource of health expenditurefinancing Percentage change in public health expenditure per capita, 1982-93(percent) (1978 yuan; provinces ranked by 1993 GDP per capita)100 CoLtectives 2.5
2.080
Patient fees 1.5
60 1.0
0.5
0
Source: ~ ~ ~ ~ ~ ~ ~ ~ ~ ~ ~ ~ S Chin Statitico )'abok vaiu years, Chin Miisroeatdt
20 05;~~, ~ Government-."'
0 -1.01980 1993a
Note: Beijing, Shanghai, and Tianjin are excLuded from the four scattergrams.Source: Chinai Statistical Yearbook, vanous years; China Ministry of Health data.
Growing Apart: Rural-Urban and Coastal-Interior Gaps 23
better on the coast. The presence of large ethnic fer scheme, which was equalizing in the 1980s, has not
minority populations in the interior likely contributes kept pace with rising regional disparities.to this outcome. While primary school attendance is
only slightly worse in the interior, high school atten- Notesdance rates are significantly lower than on the coast.
Second, per capita investment levels on the coast 1. Deflating rural and urban incomes corrects for differentincreases in prices but does not adjust for differences in the LeveL of
are two and a half times those in the interior. And dif- prices between urban and ruraL areas in the initiaL year.ferences are not confined to levels of investment; they 2. The State StatisticaL Bureau's urban househoLd survey teamalso extend to types of investment. In particular, the estimated the monetary vaLue of the main categories of in-kind
income, including housing, health care, education, and pension con-coast invests more in fast-growing industries, so more tributions. The resuLts increased the mean urban income in 1990 bycoastal residents work in industries that have seen some 80 percent. The bureau partLy addressed the most importanthigh productivity gains. The coast also shows some- sources of underestimation of ruraL income in officiaL data with the
valuation of own-grain consumption at mixed prices, starting in 1990.what lower investment in state enterprises. More Among the remaining areas requirng adjustment, an important one isimportant, investment in fast-growing township and imputed rent to reflect the vaLue of owner-occupied housing. Basedvillage enterprises accounts for nearly half of all non- on househoLd survey data for four provinces, RavaLLion and Chen
e1997) estimate this at about 6 percent of mean income. The changesstate enterprise mvestment m most coastal regions, but in the rural-urban income ratio in this anaLysis are more pronouncedless than a quarter in the interior. And these enterprises than the ones found in Griffin and Zhao (1993). A 1988 househoLd sur-
have grown faster on the coast than in the interior. vey that corrected for a number of the concerns with officiaL StateStatisticaL Bureau data pLaced ruraL incomes at 41 percent of urban
Disparities in foreign direct investment and trade are incomes and the nationaL Gini coefficient at 38. The corresponding fig-
even more striking. For example, in 1992 foreign ures based on officiaL data were 49 percent for the ruraL-urban incomedirect investment in the coast accounted for more than ratio and 33 for the Gini.
3. For urban incomes we reLy on work undertaken by the State10 percent of total fixed investment; in the interior it StatisticaL Bureau. For ruraL incomes househoLd survey data from
accounted for less than 2 percent. And coastal regions China's four southern provinces (Guangxi, Guizhou, Guangdong, andreceived more than 85 percent of China's imports in Yunnan) covering 1985-90 are used to gauge the effect data adjust-
i993. ments have on rural inequality; see RavaLlion and Chen (1997). The1993* muLtiyear nature of Ravillion and Chen's data set makes it possible toThird, as China has shifted from a closed and examine changes in inequaLity and their determinants. During
planned agricultural economy to an open, market-ori- 1985-90 the survey was longitudinal, returning to the same house-hoLds over time. RavaLLion and Chen used these results to construct
ented industrial one, returns have increased to natural panel data, which allow for anaLysis of the weLfare of households overand geographical advantages. Natural advantages like time. For more detaiLs on the data set and data problems of the Stateharbors, transport corridors, proximity to world mar- Statistical Bureau survey, see Ravallion and Chen (1997) and Jalan and
RavaLLion (1996b).kets, and communication links have played a big role 4. Other components of farm income aLso appear to have beenin spurring growth in coastal areas. undervaLued, but this is Less worrying because the shares of income
Fourth, regional policies have favored coastal areas invoLved are much smaLLer; 22 percent of ruraLincomes came from non-grain farm output, but onLy 10 percent of this was from own con-
by designating them for preferential treatment in for- sumption.eign trade and investment. Credit has been allocated 5. To do this, RavaLLion and Chen (1997) used a weighting diagram
disproportionately to the coast, explaining in part based on a food consumption bundLe that ensures nutritionaL require-ments are met, with an aLLowance for nonfood consumption anchored
investment differentials between the two regions. In to the consumption behavior of the poorest 30 percent of the popu-
addition, coastal provinces have often been the loca- Lation. See Chen and RavaLLion (1996) for fuLL detaiLs on the methods
tion of choice for pilot reform experiments, for the alternative vaLuations and the new cost of Living deflator.6. There is Lorenz dominance between pre- and post-adjustment
Finally, decentralization of the fiscal system has Lorenz curves for both 1985 and 1990, and between 1985 and 1990
fueled disparities in two ways (figure 2.9). It has for both unadjusted and adjusted curves.
increased the emphasis on cost recovery for social ser- 7. Another probLem has to do with the tabuLation of urban data,starting in 1989. Until 1989 urban data pubLished in the China
vices, which reduces the poor's access to these services. Statistical Yearbook showed the share of households within a certain
It also has meant that richer provinces can spend more income range. Since 1989 these data have taken the form of average
than poorer ones-for health, education, and infra- incomes corresponding to deciLes of househoLds, ranked by per capitaincome. But there is a serious probLem with the way these data are
structure-further boosting their growth prospects. tabulated. It appears that when county aggregates are processed byFurthermore, China's intergovernmental fiscal trans- the provinciaL State Statistical Bureau teams, the deciLe (quintile)
24 Sharing Rising Incomes: Disparities in China

means of aLL surveyed counties are averaged for each deciLe (quintile) incomes than peopLe Living in interior cities but much higher incomesto get the provinciaL mean in that deciLe (quintile). Differences in than peopLe Living in the coastaL countryside (see figure 2.9).deciLe (quintile) boundaries from county to county are ignored, Lead- 12. This section draws on WorLd Bank (1995b).ing to significant underestimation of inequaLity. For 1989-95 thisstudy uses urban data furnished directly by the State StatisticaLBureau's urban househoLd survey team in Beijing. ALthough these data Figure noteshave been properLy tabuLated and so do not have the probLems of thepubLished data, they come from a subsample of the whoLe survey. The Figure 2.1 Adjustments are only indicative and reflect variousurban survey covers 36,000 househoLds but the data furnished to the corrections made to these data. Changes to ruraL incomes are basedstudy team come from a 17,000 househoLd subsampLe. How the sub- on corrections made by RavaLLion and Chen (1997) to ruraL househoLdsampLe was seLected is not cLear, but the mean incomes of this sub- data from four provinces (Guanqxi, Guizhou, Guangdong, and Yunnan)sample are consistently higher than the published means for 1989-95. for 1985-90. Here we assume that these adjustments can be gener-Thus changes in the urban income distribution between 1988 and 1989 aLized to the country's ruraL areas as a whoLe. We aLso assume thatshould be treated with caution. changes made to the State Statistical Bureau's methodology in 1990
8. A standard rent per square meter was appLied to average Living correct fuLLy for the undervaLuation of own-grain consumption. Thusspace per capita based on the practices of the Housing Administration adjusted data after 1990 reflect onLy the impact of regionaL price dif-Authority for private housing rented privateLy. ferentials and assume that the impact of these on ruraL inequaLity in
9. The pension caLcuLation understates the vaLue of future pen- 1990-95 remains as in 1990. Adjustments to urban data are based onsions for urban workers in 1990 and to a Lesser extent in 1995. Pension information provided by the State StatisticaL Bureau's househoLd sur-contributions represent onLy a smalL portion of future pension receipts. vey team for 1990 and 1995. They reflect the inclusion of in-kind ben-In the past the difference has been the obLigation of enterprises, but efits on urban income. We assume that the LeveL and distribution ofthis responsibiLity is now being assumed by Local governments. pre-1990 in-kind benefits were as in 1990, and interpoLate for the
10. In 1992 mean income in the weaLthiest province (Guangdong) years between 1990 and 1995. FinaLLy, we introduce a 15 percent costwas onLy 2.8 times mean income in the poorest province (Guizhou), of Living differential between urban and ruraL areas, based on 1990whereas the ratio of the top to bottom income decile was 4.7 in the prices.most equaL province (Jiangxi) and as much as 16.0 in the most unequal Box 2.1 figures Provinces incLude twenty-seven provinces andprovince (Ningxia). municipalities. Tibet, Hainan, and Qinghai are excluded because of
11. Rural residents in the interior have incomes that are much incompLete data. Beijing, Shanghai, and Tianjin are incorporated incLoser to coastaL peasants than to urban residents in the interior. their neighboring provinces. The "new" provinces of Greater HubeiSimiLarLy, peopLe Living in coastaL cities have onLy miLdLy higher and Greater Jiangsu are classified as coastal.
Growing Apart: Rural-Urban and Coastal-Interior Gaps 25

UnderstandingInequality
he level of inequality and how it changesover time depend on people's employment, edu-
v cation, access to land, and gender, among other factors.China's transition from a centrally planned to a marketeconomy is altering the economic landscape and with itthe relationship between personal incomes and individualassets. Changes in the structure of employment are bene-fiting workers who can participate in the dynamic off-farm sector in rural China, or in the vigorous nonstate
711 0 urban enterprises. A stronger link between productivityand wages is increasing the value of education. A moreunified national market and increased openness to theoutside world are rewarding people who live close to mar-kets and have access to good infrastructure and good-quality land. The market is also placing a premium onmale employees, whose time and mobility are notimpeded by household or child-bearing responsibilities.
27
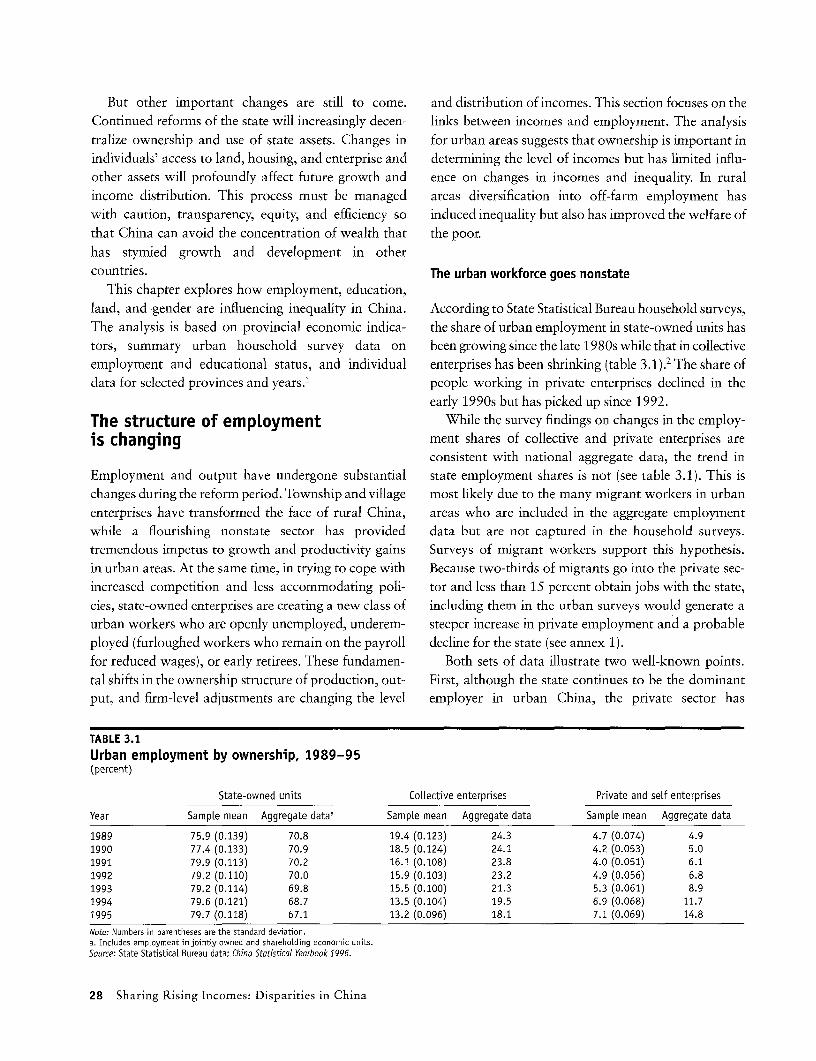
But other important changes are still to come. and distribution of incomes. This section focuses on theContinued reforms of the state will increasingly decen- links between incomes and employment. The analysistralize ownership and use of state assets. Changes in for urban areas suggests that ownership is important inindividuals' access to land, housing, and enterprise and determining the level of incomes but has limited influ-other assets will profoundly affect future growth and ence on changes in incomes and inequality. In ruralincome distribution. This process must be managed areas diversification into off-farm employment haswith caution, transparency, equity, and efficiency so induced inequality but also has improved the welfare ofthat China can avoid the concentration of wealth that the poor.has stymied growth and development in othercountries. The urban workforce goes nonstate
This chapter explores how employment, education,land, and gender are influencing inequality in China. According to State Statistical Bureau household surveys,The analysis is based on provincial economic indica- the share of urban employment in state-owned units hastors, summary urban household survey data on been growing since the late 1980s while that in collectiveemployment and educational status, and individual enterprises has been shrinking (table 3.1).2 The share ofdata for selected provinces and years.1 people working in private enterprises declined in the
early 1990s but has picked up since 1992.The structure of empLoyment While the survey findings on changes in the employ-is changing ment shares of collective and private enterprises are
consistent with national aggregate data, the trend inEmployment and output have undergone substantial state employment shares is not (see table 3.1). This ischanges during the reform period. Township and village most likely due to the many migrant workers in urbanenterprises have transformed the face of rural China, areas who are included in the aggregate employmentwhile a flourishing nonstate sector has provided data but are not captured in the household surveys.tremendous impetus to growth and productivity gains Surveys of migrant workers support this hypothesis.in urban areas. At the same time, in trying to cope with Because two-thirds of migrants go into the private sec-increased competition and less accommodating poli- tor and less than 15 percent obtain jobs with the state,cies, state-owned enterprises are creating a new class of including them in the urban surveys would generate aurban workers who are openly unemployed, underem- steeper increase in private employment and a probableployed (furloughed workers who remain on the payroll decline for the state (see annex 1).for reduced wages), or early retirees. These fundamen- Both sets of data illustrate two well-known points.tal shifts in the ownership structure of production, out- First, although the state continues to be the dominantput, and firm-level adjustments are changing the level employer in urban China, the private sector has
TABLE 3.1Urban employment by ownership, 1989-95(percent)
State-owned units Collective enterprises Private and seLf enterprises
Year SampLe mean Aggregate data' SampLe mean Aggregate data SampLe mean Aggregate data
1989 75.9 (0.139) 70.8 19.4 (0.123) 24.3 4.7 (0.074) 4.91990 77.4 (0.133) 70.9 18.5 (0.124) 24.1 4.2 (0.053) 5.01991 79.9 (0.113) 70.2 16.1 (0.108) 23.8 4.0 (0.051) 6.1
1992 79.2 (0.110) 70.0 15.9 (0.103) 23.2 4.9 (0.056) 6.81993 79.2 (0.114) 69.8 15.5 (0.100) 21.3 5.3 (0.061) 8.91994 79.6 (0.121) 68.7 13.5 (0.104) 19.5 6.9 (0.068) 11.71995 79.7 (0.118) 67.1 13.2 (0.096) 18.1 7.1 (0.069) 14.8
Note: Numbers in parentheses are the standard deviation.a. Inctudes emptoyment in jointly owned and shareholding economic units.Source: State Statistical Bureau data; Chino Statistical Yearbook 1996.
28 Sharing Rising Incomes: Disparities in China
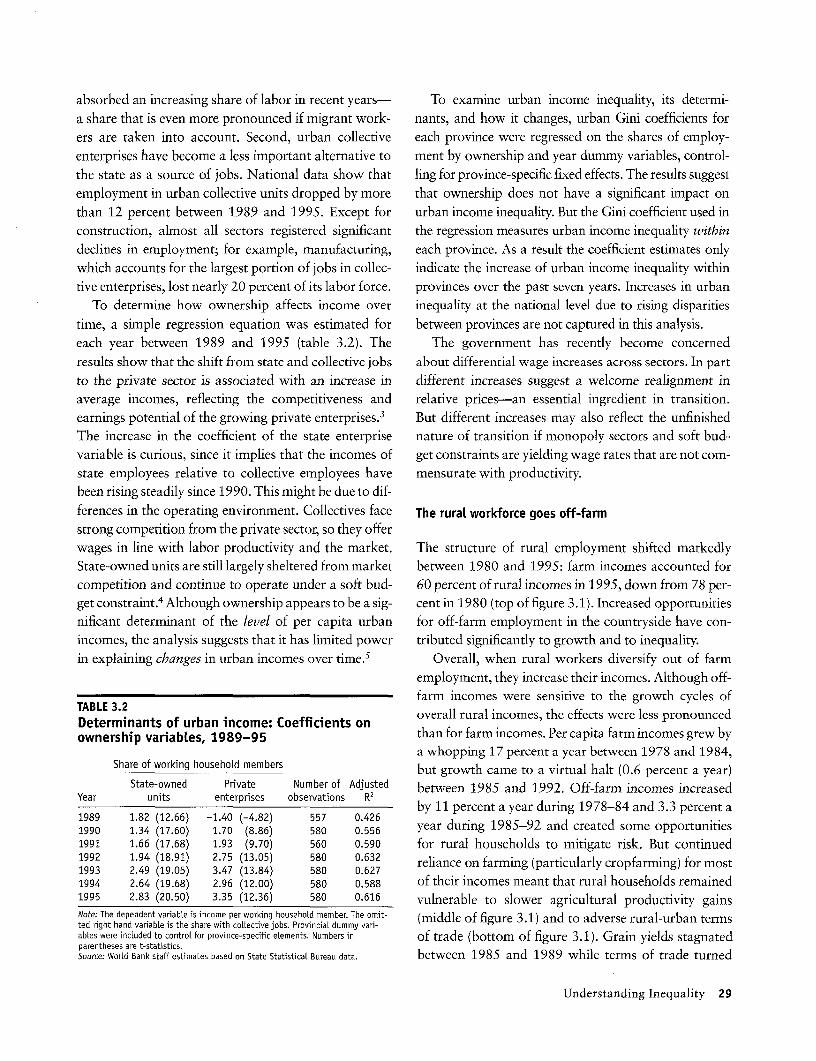
absorbed an increasing share of labor in recent years- To examine urban income inequality, its determi-a share that is even more pronounced if migrant work- nants, and how it changes, urban Gini coefficients forers are taken into account. Second, urban collective each province were regressed on the shares of employ-enterprises have become a less important alternative to ment by ownership and year dummy variables, control-the state as a source of jobs. National data show that ling for province-specific fixed effects. The results suggestemployment in urban collective units dropped by more that ownership does not have a significant impact onthan 12 percent between 1989 and 1995. Except for urban income inequality. But the Gini coefficient used inconstruction, almost all sectors registered significant the regression measures urban income inequality withindeclines in employment; for example, manufacturing, each province. As a result the coefficient estimates onlywhich accounts for the largest portion of jobs in collec- indicate the increase of urban income inequality withintive enterprises, lost nearly 20 percent of its labor force. provinces over the past seven years. Increases in urban
To determine how ownership affects income over inequality at the national level due to rising disparitiestime, a simple regression equation was estimated for between provinces are not captured in this analysis.each year between 1989 and 1995 (table 3.2). The The government has recently become concernedresults show that the shift from state and collective jobs about differential wage increases across sectors. In partto the private sector is associated with an increase in different increases suggest a welcome realignment inaverage incomes, reflecting the competitiveness and relative prices-an essential ingredient in transition.earnings potential of the growing private enterprises.3 But different increases may also reflect the unfinishedThe increase in the coefficient of the state enterprise nature of transition if monopoly sectors and soft bud-variable is curious, since it implies that the incomes of get constraints are yielding wage rates that are not com-state employees relative to collective employees have mensurate with productivity.been rising steadily since 1990. This might be due to dif-ferences in the operating environment. Collectives face The rural workforce goes off-farmstrong competition from the private sector, so they offerwages in line with labor productivity and the market. The structure of rural employment shifted markedlyState-owned units are still largely sheltered from market between 1980 and 1995: farm incomes accounted forcompetition and continue to operate under a soft bud- 60 percent of rural incomes in 1995, down from 78 per-get constraint.4 Although ownership appears to be a sig- cent in 1980 (top of figure 3.1). Increased opportunitiesnificant determinant of the level of per capita urban for off-farm employment in the countryside have con-incomes, the analysis suggests that it has limited power tributed significantly to growth and to inequality.in explaining changes in urban incomes over time.5 Overall, when rural workers diversify out of farm
employment, they increase their incomes. Although off-
TABLE 3.2 farm incomes were sensitive to the growth cycles ofDeterminants of urban income: Coefficients on overall rural incomes, the effects were less pronounced
ownership variabtes, 1989-95 than for farm incomes. Per capita farm incomes grew bya whopping 17 percent a year between 1978 and 1984,
Share of working household members but growth came to a virtual halt (0.6 percent a year)State-owned Private Number of Adjusted between 1985 and 1992. Off-farm incomes increased
Year units enterprises observations R5
1989 1.82 s (12.66) p-1.40 (-4.82)ti57 R426 by 11 percent a year during 1978-84 and 3.3 percent a1989 1.82 (12.66) -1.40 (-4.82) 557 0.4261990 1.34 (17.60) 1.70 (8.86) 580 0.556 year during 1985-92 and created some opportunities1991 1.66 (17.68) 1.93 (9.70) 560 0.590 for rural households to mitigate risk. But continued1992 1.94 (18.91) 2.75 (13.05) 580 0.632 reliance on farming (particularly cropfarming) for most1993 2.49 (19.05) 3.47 (13.84) 580 0.6271994 2.64 (19.68) 2.96 (12.00) 580 0.588 of their incomes meant that rural households remained1995 2.83 (20.50) 3.35 (12.36) 580 0.616 vulnerable to slower agricultural productivity gainsNote: The dependent variable is income per working household member. The omit- (middle of figure 3.1) and to adverse rural-urban termsted rght hand variable is the share with coLlective jobs. ProvinciaL dummy vari-ables were incLuded to control for province-specific elements. Numbers in of trade (bottom of figure 3.1). Grain yields stagnatedparentheses are t-statistics.Source: WorLd Bank staff estimates based on State Statistical Bureau data. between 1985 and 1989 while terms of trade turned
Understanding Inequality 29
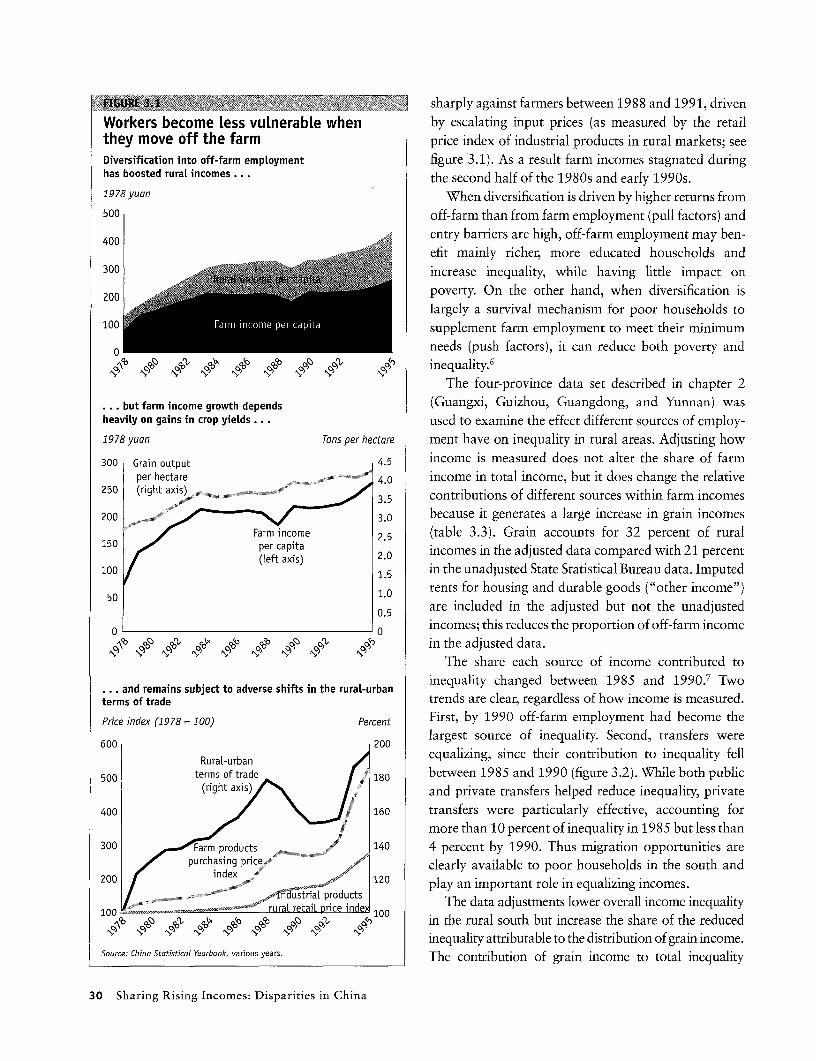
sharply against farmers between 1988 and 1991, drivenWorkers become Less vulnerabLe when by escalating input prices (as measured by the retailthey move off the farm price index of industrial products in rural markets; seeDiversification into off-farm employment figure 3.1). As a result farm incomes stagnated duringhas boosted ruraL incomes ... the second half of the 1980s and early 1990s.1978 yuan When diversification is driven by higher returns from
500 off-farm than from farm employment (pull factors) and
400 entry barriers are high, off-farm employment may ben-efit mainly richer, more educated households and
300 increase inequality, while having little impact on
200 poverty. On the other hand, when diversification islargely a survival mechanism for poor households to
100 supplement farm employment to meet their minimum
o needs (push factors), it can reduce both poverty and0,950 o inequality. 6
The four-province data set described in chapter 2
... but farm income growth depends (Guangxi, Guizhou, Guangdong, and Yunnan) washeavily on gains in crop yields ... used to examine the effect different sources of employ-
1978 yuan Tons per hectare ment have on inequality in rural areas. Adjusting how
300 Grain output 4.5 income is measured does not alter the share of farmper hectare ,>, 2>c 4.0 income in total income, but it does change the relative
250 (right axis) 35 contributions of different sources within farm incomes
200 </ 3.0 because it generates a large increase in grain incomesFarm income 2.5 (table 3.3). Grain accounts for 32 percent of rural
150 per capita([eft axis) 2.0 incomes in the adjusted data compared with 21 percent
100 /2.5 in the unadjusted State Statistical Bureau data. Imputed
50 , 1.0 rents for housing and durable goods ("other income")o.s are included in the adjusted but not the unadjusted
0 0 incomes; this reduces the proportion of off-farm incomeo% %1s r 0 9 9 b in the adjusted data.
The share each source of income contributed toinequality changed between 1985 and 1990.7 Two
... and remains subject to adverse shifts in the rural-urbanterms of trade trends are clear, regardless of how income is measured.
Price index (1978 = 100) Percent First, by 1990 off-farm employment had become the
600 200 largest source of inequality. Second, transfers wereRurat-urban equalizing, since their contribution to inequality fell
500 terms of trade 180 between 1985 and 1990 (figure 3.2). While both public(right axis) / S and private transfers helped reduce inequality, private
400 1 160 transfers were particularly effective, accounting formore than 10 percent of inequality in 1985 but less than
300 Fam products 140 4 percent by 1990. Thus migration opportunities arepurchasing prcer200 / purchasind priex .f-< clearly available to poor households in the south and
0 . p20 play an important role in equalizing incomes.100 rural retia products 100 The data adjustments lower overall income inequality
100b %lb rura[ rei price ) in the rural south but increase the share of the reducedinequality attributable to the distribution of grain income.
Source; China Statistical Yearbook, various years. The contribution of grain income to total inequality
30 Sharing Rising Incomes: Disparities in China

increased 35 percent between 1985 and 1990 but ber registered in an off-farm job as their primary sourceremained small in the original State Statistical Bureau def- of employment. As expenditures per adult rise, off-farminition of income. By contrast, when adjusted incomes are income increases as a share of total income (table 3.4).used, the contribution of grain to inequality is larger ini- The probability of having at least one household mem-tially and increases 60 percent (from 8.8 to 14.3 percent). ber engaged primarily in off-farm employment also
Overall, employment diversification increased increases with rising welfare. These findings confirminequality for the four provinces analyzed. Evidence that increasing off-farm income is the main factor dri-from Sichuan and Jiangsu (Burgess 1997) corroborates ving rising living standards in China. These patterns arethis finding. However, the question remains whether more pronounced for Jiangsu than Sichuan.diversification led to increasing inequality because itbenefited mainly rich households or whether it alsoimproved the welfare of the poor. Evidence from The contrbution of off-farm income toSichuan and Jiangsu suggests that diversification has TneuaLibtyis Lr andfrsincwie tr senhanced overall welfare in rural China. are increasingly equalizing, 1985 and 1990
Diversification has the potential to increase theincomes of the poor and can help stabilize incomes and Unadjusted (original) incomemitigate risk.8 Welfare can improve even with a con- Gini coefficient
stant level of income if there is a smoother flow. Because 35 GrainChinese households have limited access to means of ex 30
post consumption smoothing (for example, through Other farmcredit markets and transfers), ex ante income smooth- 25
ing, through occupational choice, may play an impor- 20tant role. Diversification can help mitigate risks 15associated with farm employment and make the lives of Offr
rural residents more secure. 10Two measures are used to analyze the incidence of D
diversification: share of off-farm income in total income 5 Transfersand probability of having at least one household mem- oJont costs
-5TABLE 3.3 1985 1990
Average income by source in the rural south, Adjusted (revised) income1985-90(percentage of six-year mean income) Gini coefficient
35Unadjusted Adjusted
Source (originaL) income (revised) income 30
Farm income 72.3 71.9 GrainGrain 21.1 31.5 25Other farm 51.1 40.5 Other farm
Off-farm income 25.8 19.9 20Transfers 5.1 4.5Other income 1.4 7.8 15Joint costs -5.2 -4.1 Off-farm
10TotaL 100.0 100.0Note: Unadjusted incomes are from the State StatisticaL Bureau. Adjusted incomes 5 Transfersreflect vaLuation and deflator adjustments. Otherfarm income incLudes remunera- Transferstion from nongrain crops, animal husbandry, forestry, and fisheries. Off-farm income Otheris income generated from collectiveLy or individuaLLy owned businesses and state o Joint costsempLoyment. Transfers incLude both public and private ones; private transfers arelargely remittances from migrant household members. Other income covers other -5factor incomes and imputed rent on housing and durable goods for the adjusted 1985 1990definition of income. Joint costs are costs that cannot be apportioned betweenfactor income components. Source: RavaLLion and Chen 1997; World Bank staff estimates based on StateSource: State StatisticaL Bureau data; RavaLLion and Chen 1997. StatisticaL Bureau data.
Understanding Inequality 31
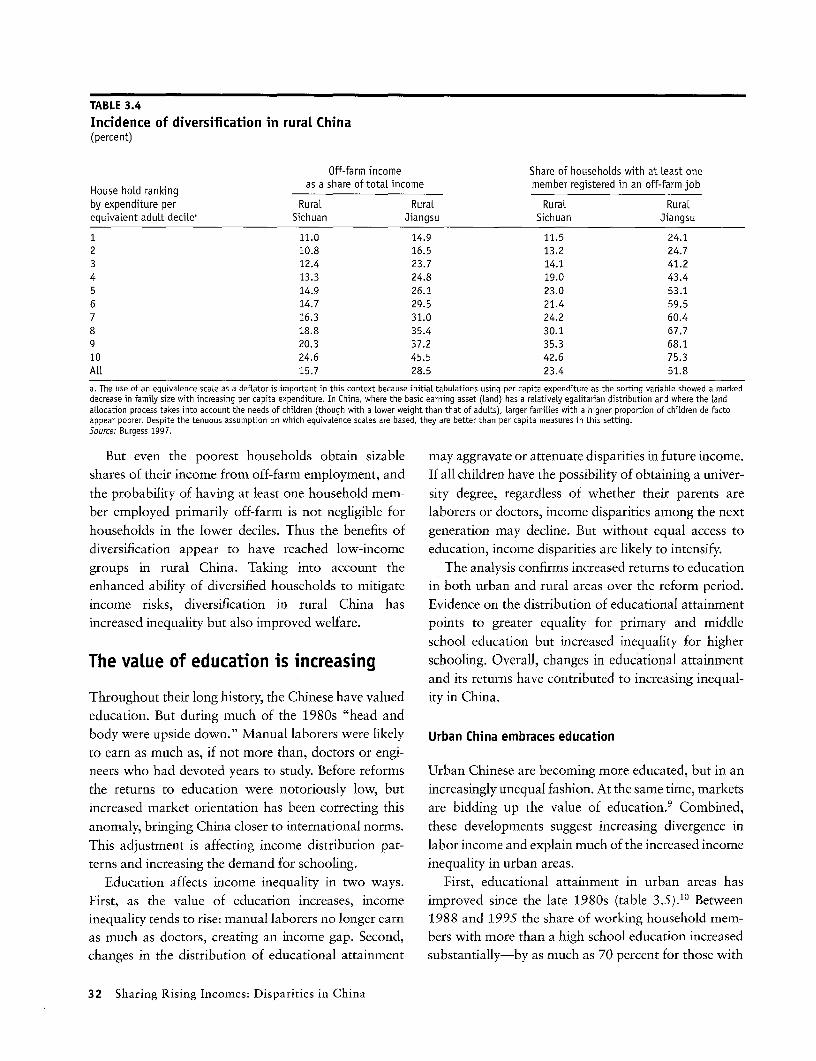
TABLE 3.4
Incidence of diversification in rural China(percent)
Off-farm income Share of househoLds with at [east oneHouse hoLd ranking as a share of totaL income member registered in an off-farm job
by expenditure per Rural Rural RuraL RuraLequivalent aduLt deciLe, Sichuan Jiangsu Sichuan Jiangsu
1 11.0 14.9 11.5 24.12 10.8 16.5 13.2 24.73 12.4 23.7 14.1 41.24 13.3 24.8 19.0 43.45 14.9 26.1 23.0 53.16 14.7 29.5 21.4 59.57 16.3 31.0 24.2 60.48 18.8 35.4 30.1 67.79 20.3 37.2 35.3 68.110 24.6 45.5 42.6 75.3AUl 15.7 28.5 23.4 51.8
a. The use of an equivaLence scale as a deflator is important in this context because initiat tabuLations using per capita expenditure as the sorting variabLe showed a markeddecrease in family size with increasing per capita expenditure. In China, where the basic earning asset (Land) has a reLatively egalitarian distrbution and where the landa[location process takes into account the needs of children (though with a lower weight than that of adults), larger famiLies with a higher proportion of children de factoappear poorer. Despite the tenuous assumption on which equivalence scaLes are based, they are better than per capita measures in this setting.Source: Burgess 1997.
But even the poorest households obtain sizable may aggravate or attenuate disparities in future income.shares of their income from off-farm employment, and If all children have the possibility of obtaining a univer-the probability of having at least one household mem- sity degree, regardless of whether their parents are
ber employed primarily off-farm is not negligible for laborers or doctors, income disparities among the nexthouseholds in the lower deciles. Thus the benefits of generation may decline. But without equal access to
diversification appear to have reached low-income education, income disparities are likely to intensify.groups in rural China. Taking into account the The analysis confirms increased returns to educationenhanced ability of diversified households to mitigate in both urban and rural areas over the reform period.
income risks, diversification in rural China has Evidence on the distribution of educational attainmentincreased inequality but also improved welfare. points to greater equality for primary and middle
school education but increased inequality for higher
The value of education is increasing schooling. Overall, changes in educational attainmentand its returns have contributed to increasing inequal-
Throughout their long history, the Chinese have valued ity in China.education. But during much of the 1980s "head and
body were upside down." Manual laborers were likely Urban China embraces educationto earn as much as, if not more than, doctors or engi-neers who had devoted years to study. Before reforms Urban Chinese are becoming more educated, but in an
the returns to education were notoriously low, but increasingly unequal fashion. At the same time, marketsincreased market orientation has been correcting this are bidding up the value of education. 9 Combined,
anomaly, bringing China closer to international norms. these developments suggest increasing divergence in
This adjustment is affecting income distribution pat- labor income and explain much of the increased incometerns and increasing the demand for schooling. inequality in urban areas.
Education affects income inequality in two ways. First, educational attainment in urban areas hasFirst, as the value of education increases, income improved since the late 1980s (table 3.5).10 Betweeninequality tends to rise: manual laborers no longer earn 1988 and 1995 the share of working household mem-as much as doctors, creating an income gap. Second, bers with more than a high school education increasedchanges in the distribution of educational attainment substantially-by as much as 70 percent for those with
32 Sharing Rising Incomes: Disparities in China

university degrees and above. This jump reflects RuraL China-schooling mattersincreasing demand for skilled labor as China's indus-
trial structure changes and markets mature. Second, the There are large disparities in educational attainment
data show small and narrowing dispersion in the attain- between rural and urban areas. A 19 88 national survey
ment of junior middle school education, in line with the found that urban residents had 9.6 years of education
government's policy of universal basic education. But compared with 5.5 years for rural residents (Knight and
disparities are larger for higher education, especially at Li 1996).11 Moreover, this gap has narrowed only
the post-secondary level. National data confirm trends slightly over four decades. Thus disparities in educa-
identified in the survey of urban workers, showing that tional attainment may help explain the large differences
the population as a whole is becoming more educated, in the level of rural and urban incomes (see chapter 2).
but post-secondary education is increasingly dispersed But they are unlikely to explain changes in the ratio of(table 3.6). rural to urban incomes. One possible explanation for
Third, regression analysis shows that urban income the widening income gap is that returns to education
increases with educational attainment (table 3.7). have increased faster in urban areas than in rural areas
Fourth, estimated schooling coefficients for each year because the bulk of the rural population remains
show increasing returns to higher education over the employed in farming, where educational attainment
period. continues to have a limited impact on incomes.
TABLE 3.5Urban educational attainment, 1988, 1991, and 1995(sampLe mean, percent)
Primary Junior high High schooLYear and beLow and above and above Post-secondary
1988 14.3 (10.0) 85.7 (10.0) 46.4 (11.8) 11.2 (5.8)1991 9.5 (6.2) 90.5 (6.2) 55.5 (11.2) 15.5 (7.8)1995 10.2 (5.6) 89.8 (5.6) 59.1 (12.7) 19.0 (9.5)
Note: Numbers in parentheses are the standard deviation. Tabulated survey data provide information on mean household income per capita for six income groups (top andbottom decite and four quintiLes in between), with corresponding household size and number of working household members, broken down by teveL of education for atLprovinces for three years.Source: State Statistical Bureau urban househoLd survey team.
TABLE 3.6National educationaL attainment, 1981 and 1993(mean, percent)
Year Uneducated Primary Secondary Post-secondary
1981 40.9 (12.3) 33.0 (6.0) 25.2 (9.6) 0.9 (1.0)1993 21.4 (11.4) 40.1 (7.5) 36.6 (10.4) 2.0 (2.4)
Note: Numbers in parentheses are the standard deviation. TabLe data show the ratio of people with corresponding educationaL attainment to the popuLation 6 years oLd and above.Source: China Statistical Yearbook, various years; China Population Yearbook 1994.
TABLE 3.7Determinants of urban income: Coefficients on education variables, 1988, 1991, and 1995
Shares of people with schooLing Level
Year Junior high High schooL Post-secondary Number of observations Adjusted R2
1988 -1.60 0.80 4.61 173 0.611991 1.22 3.12 5.13 174 0.731995 1.22 2.30 5.44 174 0.83
Note: ALL estimates are statisticatly significant at the 5 percent level. The dependent variabLe is income per employee. The omitted variable is the share who received educa-tion up to primary level. Province dummy variabLes were included to control for fixed effects.Source: World Bank staff estimates based on State StatisticaL Bureau data.
Understanding Inequality 33
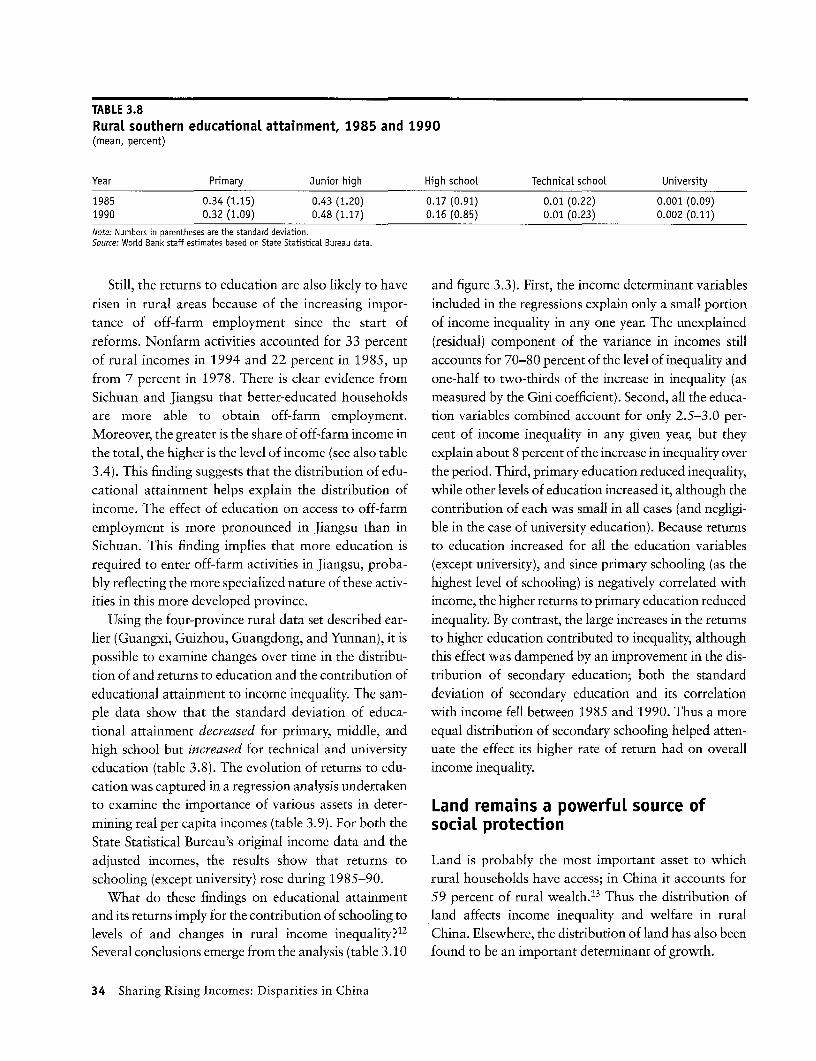
TABLE 3.8Rural southern educational attainment, 1985 and 1990(mean, percent)
Year Primary Junior high High schooL TechnicaL schooL University
1985 0.34 (1.15) 0.43 (1.20) 0.17 (0.91) 0.01 (0.22) 0.001 (0.09)1990 0.32 (1.09) 0.48 (1.17) 0.16 (0.85) 0.01 (0.23) 0.002 (0.11)
Note: Numbers in parentheses are the standard deviation.Source: World Bank staff estimates based on State Statistical Bureau data.
Still, the returns to education are also likely to have and figure 3.3). First, the income determinant variablesrisen in rural areas because of the increasing impor- included in the regressions explain only a small portion
tance of off-farm employment since the start of of income inequality in any one year. The unexplainedreforms. Nonfarm activities accounted for 33 percent (residual) component of the variance in incomes stillof rural incomes in 1994 and 22 percent in 1985, up accounts for 70-80 percent of the level of inequality andfrom 7 percent in 1978. There is clear evidence from one-half to two-thirds of the increase in inequality (asSichuan and Jiangsu that better-educated households measured by the Gini coefficient). Second, all the educa-are more able to obtain off-farm employment. tion variables combined account for only 2.5-3.0 per-Moreover, the greater is the share of off-farm income in cent of income inequality in any given year, but theythe total, the higher is the level of income (see also table explain about 8 percent of the increase in inequality over3.4). This finding suggests that the distribution of edu- the period. Third, primary education reduced inequality,cational attainment helps explain the distribution of while other levels of education increased it, although theincome. The effect of education on access to off-farm contribution of each was small in all cases (and negligi-employment is more pronounced in Jiangsu than in ble in the case of university education). Because returnsSichuan. This finding implies that more education is to education increased for all the education variablesrequired to enter off-farm activities in Jiangsu, proba- (except university), and since primary schooling (as thebly reflecting the more specialized nature of these activ- highest level of schooling) is negatively correlated withities in this more developed province. income, the higher returns to primary education reduced
Using the four-province rural data set described ear- inequality. By contrast, the large increases in the returnslier (Guangxi, Guizhou, Guangdong, and Yunnan), it is to higher education contributed to inequality, althoughpossible to examine changes over time in the distribu- this effect was dampened by an improvement in the dis-tion of and returns to education and the contribution of tribution of secondary education; both the standardeducational attainment to income inequality. The sam- deviation of secondary education and its correlationple data show that the standard deviation of educa- with income fell between 1985 and 1990. Thus a moretional attainment decreased for primary, middle, and equal distribution of secondary schooling helped atten-high school but increased for technical and university uate the effect its higher rate of return had on overalleducation (table 3.8). The evolution of returns to edu- income inequality.cation was captured in a regression analysis undertakento examine the importance of various assets in deter- Land remains a powerfuL source ofmining real per capita incomes (table 3.9). For both the social protectionState Statistical Bureau's original income data and theadjusted incomes, the results show that returns to Land is probably the most important asset to whichschooling (except university) rose during 1985-90. rural households have access; in China it accounts for
What do these findings on educational attainment 59 percent of rural wealth.13 Thus the distribution ofand its returns imply for the contribution of schooling to land affects income inequality and welfare in rurallevels of and changes in rural income inequality?12 China. Elsewhere, the distribution of land has also beenSeveral conclusions emerge from the analysis (table 3.10 found to be an important determinant of growth.
34 Sharing Rising Incomes: Disparities in China

The relationship between growth and inequality is of dence of landlessness in China: almost all rural house-longstanding interest among economists. Deininger and holds "own" at least some land (McKinley and GriffinSquire (1996) find evidence of a negative but weak rela- 1993). Also unlike other developing countries, land-tionship between initial income distribution and future lessness is not a significant determinant of poverty ingrowth but a strong relationship between initial land China. The incidence of poverty is higher among thedistribution and growth (figure 3.4). The authors sug- landless, but not dramatically so, and most of the land-gest that this difference may reflect the importance of less are not poor.14
land in the ability of the poor to access credit markets McKinley and Griffin (1993) calculate the Giniand make productive investments. In China an alterna- coefficient for three distributions of land-physicaltive explanation is fiscal: access to land is an effective units, irrigation-adjusted units, and land values. Theform of social protection in rural China and eliminates Gini coefficient for the distribution of physical units ofthe need for costly public transfers financed from gen- land is 54.3. This figure is probably the most compa-eral tax revenues. rable to Gini coefficients reported for other countries
The 1988 national survey noted earlier found that, and compares favorably with them.15 More importantunlike in other developing countries, there is little inci- for the effect of land distribution on rural welfare,
TABLE 3.9Determinants of rural southern income, 1985 and 1990
Regression coefficient Correlation coefficient with totaL
Unadjusted Adjusted Unadjusted Adjusted(original) income (revised) income (originaL) income (revised) income
Variabte 1985 1990 1985 1990 1985 1990 1985 1990
Intercept 333.02 420.33 401.91 463.38(23.52) (23.99) (27.60) (29.82)
Fixed productive assets per capita 0.32 0.18 0.36 0.21 0.24 0.18 0.27 0.23(24.36) (17.01) (26.35) (19.47)
HousehoLd size -14.96 -21.30 -16.48 -24.08 -0.04 -0.05 -0.05 -0.05(-12.33) (-14.38) (-13.21) (-18.33)
HousehoLd labor force per capita 155.69 126.55 181.50 147.89 0.20 0.15 0.21 0.19(12.98) (9.91) (14.71) (13.05)
HiLLy area -74.48 -101.67 -93.30 -89.49 0.05 0.08 0.04 0.09(-12.22) (-13.42) (-14.88) (-13.32)
Mountainous area -144.39 -201.73 -175.19 -191.74 -0.24 -0.29 -0.27 -0.30(-24.48) (-29.43) (-28.88) (-31.57)
Owned cuLtivated Land area 0.14 0.13 0.17 0.33 0.08 0.05 0.09 0.13per capita (6.90) (3.77) (8.41) (10.89)
Area of hiLLy Land per capita -0.01 -0.002 -0.004 0.01 0.00 -0.05 0.00 -0.03(-1.45) (-0.15) (-0.92) (0.80)
Area of fishpond Land per capita 0.08 1.27 0.07 0.89 0.06 0.16 0.05 0.13(2.96) (14.40) (2.53) (11.40)
Primary school 38.0 50.9 36.6 49.6 -0.12 -0.13 -0.12 -0.12(3.87) (3.93) (3.63) (4.32)
MiddLe school 78.2 106.9 76.5 97.5 0.06 0.05 0.06 0.05(7.93) (8.30) (7.55) (8.53)
High school 117.6 171.6 115.6 148.2 0.13 0.13 0.13 0.10(10.75) (12.13) (10.27) (11.81)
TechnicaL schooL 133.4 216.6 121.1 193.1 0.03 0.05 0.03 0.05(4.89) (7.55) (4.32) (7.59)
University 226.6 253.7 213.3 203.8 0.01 0.03 0.01 0.03(3.43) (4.43) (3.14) (4.02)
Note: The dependent variable is income per capita, in constant prices. The education variables are alL dummies for the highest level of education reached by the householdworkforce, with the omitted dummy variable being for an itliterate. Fixed productive assets is the survey valuation of all immobile productive farm assets, expressed in con-stant prices and normalized by household size. Laborforce is the number of able-bodied workers. Land variables include cultivated land, hilly land, andfishpond as areas ofland owned per person in the household, and hilly orea and mountoinous area as dummy variables for the geographic area in which the household lives, with the omitteddummy variable being that for households living on the plains. Numbers in parentheses are t-statistics.Source: Ravallion and Chen 1997.
Understanding Inequality 35

Educational attainment beyond the primary level has a small but increasing effect onincome inequalityUnadjusted (originaL) incomes Adjusted (revised) incomes
Contribution to Gini coefficient Contribution to Gini coefficient3.0 3.0
2.5 2.523 5° ~~~~~ALI eveLs 23°-2.0 of education 2.0 ALL leveLs
1.5 * * 1.5 L ~~~~~~~~~~~~~~~~~~~of education L2.5 1.5
1.0 1.0
0.5 0.5
0 0
-0.5 -0.5
-1.0 1985 1990 -1.0 1985 1990-1.5 -1.5
M Primary school N37 MiddLe school M High school M Technical schooL , University
Source:. RavaLIion and Chen 1997.
TABLE 3.10Contribution of income determinants to inequality in the rural south, 1985 and 1990
Unadjusted (original) incomes Adjusted (revised) incomes
1985-90 1985-90VariabLe 1985 1990 Gini coefficient 1985 1990 Gini coefficient
Productive assets 5.86 3.45 -11.24 6.68 4.34 -33.82HousehoLd size 0.21 0.36 1.25 0.25 0.63 6.81Labor 2.42 1.41 -4.74 2.91 2.30 -7.61Hilly area -0.69 -1.39 -5.67 -0.80 -1.49 -12.88Mountainous area 7.31 10.96 33.13 9.47 11.95 52.40Cultivated Land 0.53 0.19 -1.86 0.74 1.32 10.85HiLLy land 0.00 0.01 0.08 0.00 -0.02 -0.35Fishpond 0.12 2.17 14.67 0.09 1.40 22.79Primary schoot -0.94 -1.17 -2.59 -0.85 -1.13 -5.59Middle school 1.00 1.00 1.04 0.92 1.05 3.15High school 2.36 2.96 6.60 2.20 2.28 3.60TechnicaL school 0.17 0.42 2.00 0.12 0.42 5.19University 0.04 0.14 0.70 0.03 0.11 1.34ResiduaL 81.61 79.49 66.65 78.23 76.84 54.13
TotaL 100.00 100.00 100.00 100.00 100.00 100.00Source: Denved from tabLe 3.9.
however, is that adjustments for quality yield signifi- The four-province rural southern data set is used tocantly lower inequality. The Gini coefficient for irriga- examine how land affects income inequality over time.tion-adjusted units, for example, is 50.9. When the As expected, all land variables combined contributed
measurement is based on land values rather than phys- little to income inequality in 1985-7.0 percent usingical units the Gini drops to just 31.0-lower than the unadjusted (original) income and 9.5 percent usingGini that the authors found for income distribution. adjusted (revised) income (figure 3.5). Most of this con-This low inequality of land distribution in China has tribution is due to the gap between lower incomesimportant implications for income inequality and wel- earned by people living in mountainous rural areas rel-fare of the poor. 16 ative to people living on the plains-a gap that
36 Sharing Rising Incomes: Disparities in China
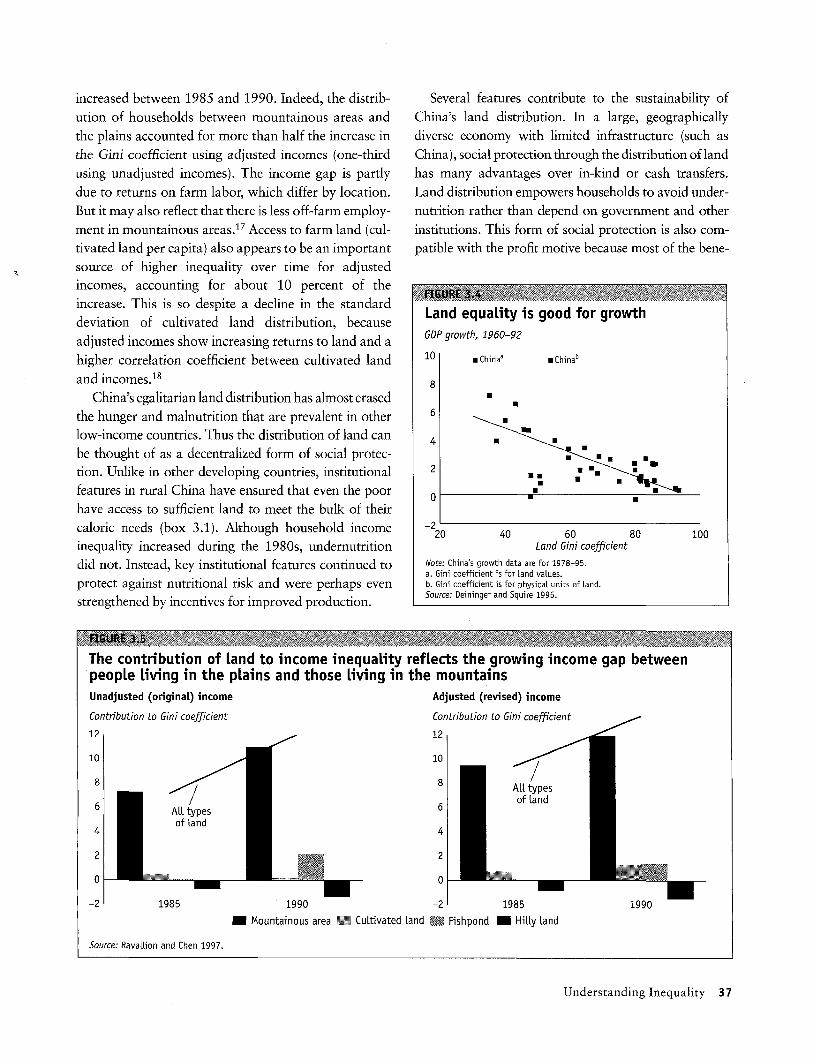
increased between 1985 and 1990. Indeed, the distrib- Several features contribute to the sustainability ofution of households between mountainous areas and China's land distribution. In a large, geographicallythe plains accounted for more than half the increase in diverse economy with limited infrastructure (such asthe Gini coefficient using adjusted incomes (one-third China), social protection through the distribution of landusing unadjusted incomes). The income gap is partly has many advantages over in-kind or cash transfers.due to returns on farm labor, which differ by location. Land distribution empowers households to avoid under-But it may also reflect that there is less off-farm employ- nutrition rather than depend on government and otherment in mountainous areas.17 Access to farm land (cul- institutions. This form of social protection is also com-tivated land per capita) also appears to be an important patible with the profit motive because most of the bene-source of higher inequality over time for adjustedincomes, accounting for about 10 percent of theincrease. This is so despite a decline in the standard =}deviation of cultivated land distribution, because Land equaLity is good for growthadjusted incomes show increasing returns to land and a GDP growth, 1960-92
higher correlation coefficient between cultivated land 10 m Chinaa * Chinab
and incomes."8 8
China's egalitarian land distribution has almost erasedthe hunger and malnutrition that are prevalent in other 6
low-income countries. Thus the distribution of land can 4be thought of as a decentralized form of social protec- . .
tion. Unlike in other developing countries, institutional 2 *U.features in rural China have ensured that even the poor 0 :have access to sufficient land to meet the bulk of theircaloric needs (box 3.1). Although household income -220 40 60 80 100inequality increased during the 1980s, undernutrition Land Gini coefficient
did not. Instead, key institutional features continued to Note: China's growth data are for 1978-95.a. Gini coefficient is for tand values.
protect against nutritional risk and were perhaps even b. Gini coefficient is for physicaL units of land.strengthened by incentives for improved production. Source: Deininger and Squire 1996.
se n ay n sr orp u'
The contribution of land to income inequality reflects the growing income gap betweenpeopLe living in the plains and those living in the mountainsUnadjusted (original) income Adjusted (revised) income
Contribution to Gini coefficient Contribution to Gini coefficient _
12 12
10 10
8 8 All types
-2 1985 1990 -2 1985 1990Mountainous area ->Cultivated land 2K.E Fishpond Hilly land
Source: Ravat6on and Chen 1997.
Understanding Inequality 37
are more likely to attend primary school, and women.. are more likely to have paid employment. Yet alongside
persistent problems such as inadequate access to social~~~ ~~~~ ~services for" women in poor areas, new problems are
emerging with deeper economic reforms. In fact, unfet-
tered market orientation is threatening past achieve-ments in gender equality and reinforcing a culturalpredisposition toward differential treatment of menand women. For example, if reproduction and child
-~~~~~ ~care are exclusively female responsibilities, women willearn less in the labor market and parents will have less
incentive to educate girls because expected returns willbe lower than for boys. In turn, less-educated women
|i4 | CG twill earn less in the future. Thus income inequalitybetween men and women is exacerbated by gender biasin household decisions about investment in children
Iand by occupational segregation and wage discrimina-tion in the labor market.
Here we use household data from Sichuan and
~~~~- ~~~~~~~ ~~Jiangsu to test for gender discrimination at the house-
fits of land access accrue to the household that maintains hold level by examining gender bias in the householdit. Moreover, the administrative costs of operating the allocation of food, calories, health, and education, sincesystem have been minimal because land redistribution these expenditures influence children's survival proba-was historically achieved in a single step. Finally, macro- bility and the welfare outcomes of surviving children;economic fluctuations do not affect the level of benefits and selective abortion of female fetuses, leading tobecause the system does not depend on fiscal revenues. skewed sex ratios at birth (Burgess and Zhang 1996).
Most policies to improve nutritional status focus on Three key results emerge from the analysis of householdtransferring income or food. A third alternative- spending on food, education, and health. First, there isproviding rural people with opportunities to produce no evidence of gender bias in the allocation of food andfood-appears to have been quite successful in China, calories, suggesting that parents feel unconstrained inwhere high nutritional status has been obtained with- this area thanks to universal access to and egalitarianout resorting to large-scale direct nutrition interven- distribution of land. Second, there is evidence of a sig-tions. Because growth has also benefited the poor, it has nificant bias against girls (0-4 age group) in the alloca-improved their nutritional welfare. But the pattern of tion of health goods in the poorer, less diversifiedgrowth and possibly growth rates may have been less province (Sichuan), but not in the richer, more diversi-favorable in the absence of a relatively even distribution fied one (Jiangsu).20 Third, overall investments inof assets in rural China.'9 Although the current distrib- human capital are higher for boys than girls, with bothution of land may not be economically optimal, the provinces showing a pro-male bias in expenditures forequity and social protection features of the system serve secondary education. Taken together, the health andimportant functions. Alternatives to this system should education results suggest that discrimination tends toexplicitly consider measures to compensate those who focus on expenditures when parents have to make dis-would be made nutritionally vulnerable by its absence. crete and costly decisions regarding investment in their
children.Women are increasingly at risk Income growth and diversification appear to erode
gender discrimination. This result is obtained when theThe status of Chinese women compares favorably with rural samples for both provinces are split into poorerthat of women in other Asian countries. Chinese girls and richer subsamples and the analysis is extended to
38 Sharing Rising Incomes: Disparities in China
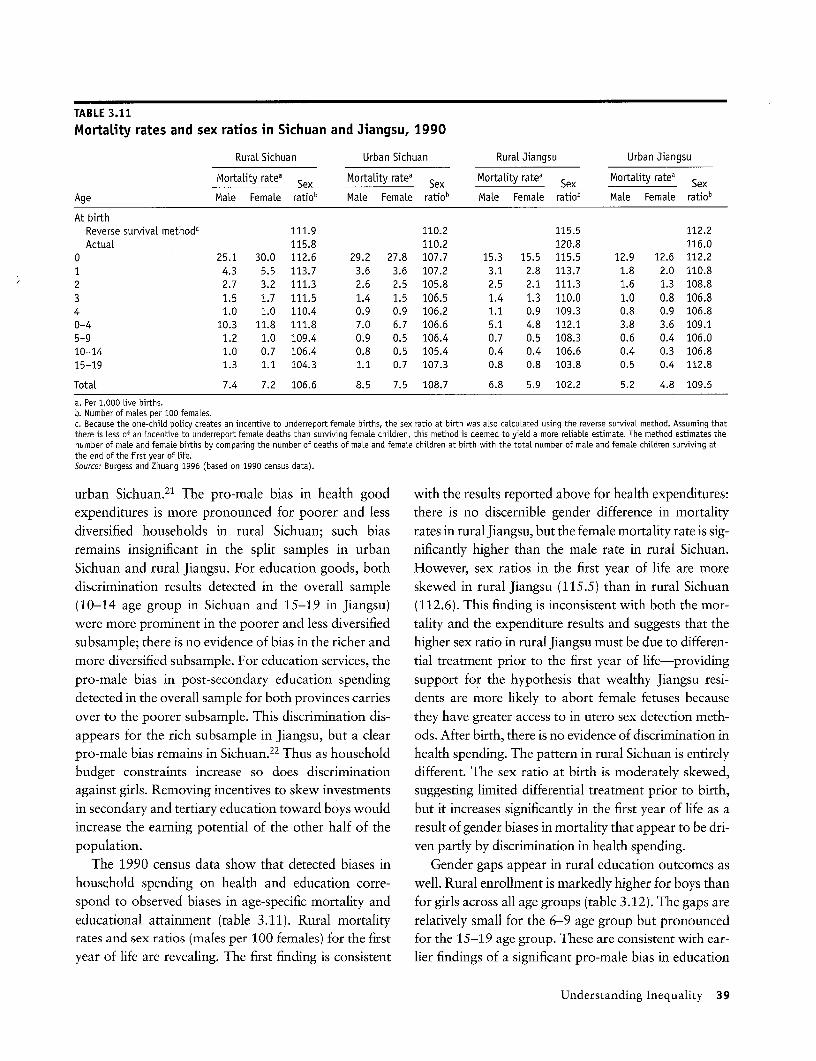
TABLE 3.11Mortality rates and sex ratios in Sichuan and Jiangsu, 1990
RuraL Sichuan Urban Sichuan RuraL Jiangsu Urban Jiangsu
Mortality ratea Sex Mortality ratea Sex MortaLity ratea Sex MortaLity ratea Sex
Age Male FemaLe ratiob MaLe FemaLe ratiob Male FemaLe ratiob MaLe FemaLe ratiob
At birthReverse survival methodc 111.9 110.2 115.5 112.2Actual 115.8 110.2 120.8 116.0
0 25.1 30.0 112.6 29.2 27.8 107.7 15.3 15.5 115.5 12.9 12.6 112.2
1 4.3 5.5 113.7 3.6 3.6 107.2 3.1 2.8 113.7 1.8 2.0 110.82 2.7 3.2 111.3 2.6 2.5 105.8 2.5 2.1 111.3 1.6 1.3 108.8
3 1.5 1.7 111.5 1.4 1.5 106.5 1.4 1.3 110.0 1.0 0.8 106.84 1.0 1.0 110.4 0.9 0.9 106.2 1.1 0.9 109.3 0.8 0.9 106.80-4 10.3 11.8 111.8 7.0 6.7 106.6 5.1 4.8 112.1 3.8 3.6 109.1
5-9 1.2 1.0 109.4 0.9 0.5 106.4 0.7 0.5 108.3 0.6 0.4 106.010-14 1.0 0.7 106.4 0.8 0.5 105.4 0.4 0.4 106.6 0.4 0.3 106.815-19 1.3 1.1 104.3 1.1 0.7 107.3 0.8 0.8 103.8 0.5 0.4 112.8
TotaL 7.4 7.2 106.6 8.5 7.5 108.7 6.8 5.9 102.2 5.2 4.8 109.5
a. Per 1,000 Live births.b. Number of males per 100 females.c. Because the one-child policy creates an incentive to underreport femaLe births, the sex ratio at birth was aLso calcuLated using the reverse survival method. Assuming thatthere is less of an incentive to underreport female deaths than surviving femaLe children, this method is deemed to yield a more reliable estimate. The method estimates thenumber of maLe and female births by comparing the number of deaths of maLe and femaLe chiLdren at birth with the totaL number of maLe and female chiLdren surviving atthe end of the first year of Life.Source: Burgess and Zhuang 1996 (based on 1990 census data).
urban Sichuan.21 The pro-male bias in health good with the results reported above for health expenditures:expenditures is more pronounced for poorer and less there is no discernible gender difference in mortalitydiversified households in rural Sichuan; such bias rates in rural Jiangsu, but the female mortality rate is sig-remains insignificant in the split samples in urban nificantly higher than the male rate in rural Sichuan.Sichuan and rural Jiangsu. For education goods, both However, sex ratios in the first year of life are morediscrimination results detected in the overall sample skewed in rural Jiangsu (115.5) than in rural Sichuan(10-14 age group in Sichuan and 15-19 in Jiangsu) (112.6). This finding is inconsistent with both the mor-
were more prominent in the poorer and less diversified tality and the expenditure results and suggests that thesubsample; there is no evidence of bias in the richer and higher sex ratio in rural Jiangsu must be due to differen-
more diversified subsample. For education services, the tial treatment prior to the first year of life-providing
pro-male bias in post-secondary education spending support for the hypothesis that wealthy Jiangsu resi-detected in the overall sample for both provinces carries dents are more likely to abort female fetuses because
over to the poorer subsample. This discrimination dis- they have greater access to in utero sex detection meth-
appears for the rich subsample in Jiangsu, but a clear ods. After birth, there is no evidence of discrimination inpro-male bias remains in Sichuan.2 2 Thus as household health spending. The pattern in rural Sichuan is entirelybudget constraints increase so does discrimination different. The sex ratio at birth is moderately skewed,against girls. Removing incentives to skew investments suggesting limited differential treatment prior to birth,
in secondary and tertiary education toward boys would but it increases significantly in the first year of life as aincrease the earning potential of the other half of the result of gender biases in mortality that appear to be dri-
population. ven partly by discrimination in health spending.
The 1990 census data show that detected biases in Gender gaps appear in rural education outcomes ashousehold spending on health and education corre- well. Rural enrollment is markedly higher for boys thanspond to observed biases in age-specific mortality and for girls across all age groups (table 3.12). The gaps are
educational attainment (table 3.11). Rural mortality relatively small for the 6-9 age group but pronouncedrates and sex ratios (males per 100 females) for the first for the 15-19 age group. These are consistent with ear-
year of life are revealing. The first finding is consistent lier findings of a significant pro-male bias in education
Understanding Inequality 39
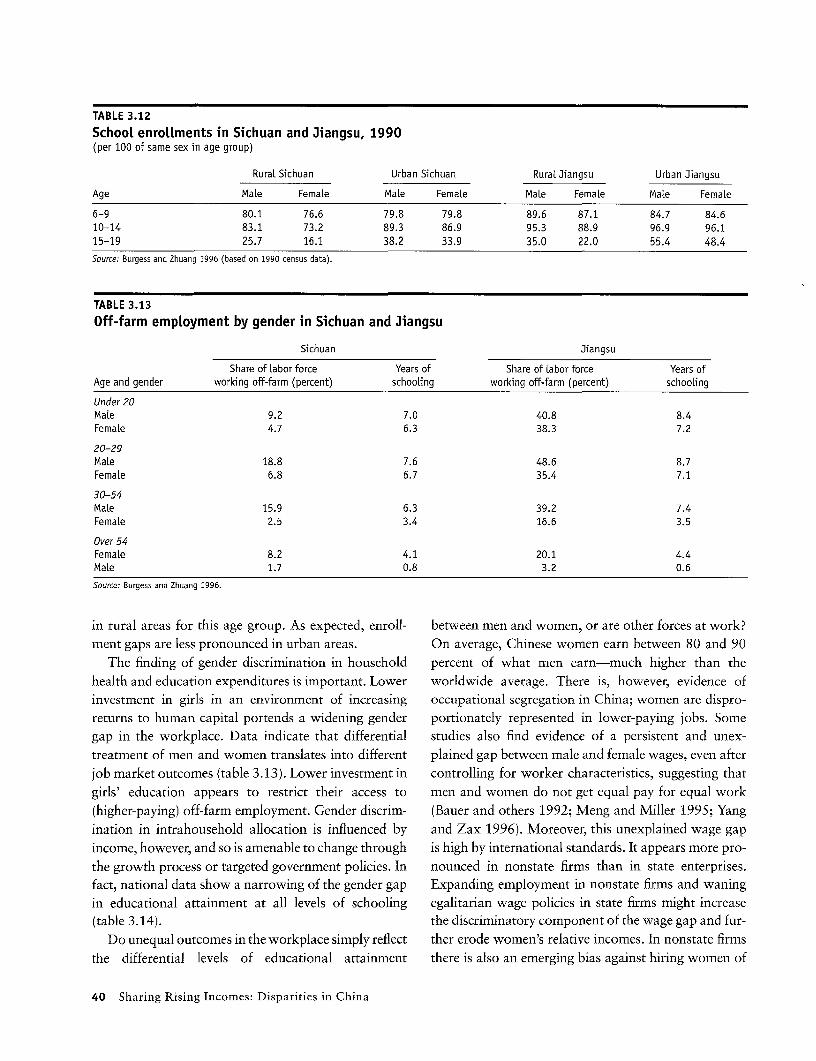
TABLE 3.12School enrollments in Sichuan and Jiangsu, 1990(per 100 of same sex in age group)
RuraL Sichuan Urban Sichuan Rural Jiangsu Urban Jiangsu
Age Male Female MaLe Female MaLe Female Male FemaLe
6-9 80.1 76.6 79.8 79.8 89.6 87.1 84.7 84.610-14 83.1 73.2 89.3 86.9 95.3 88.9 96.9 96.115-19 25.7 16.1 38.2 33.9 35.0 22.0 55.4 48.4Source: Burgess and Zhuang 1996 (based on 1990 census data).
TABLE 3.13Off-farm employment by gender in Sichuan and Jiangsu
Sichuan Jiangsu
Share of Labor force Years of Share of Labor force Years ofAge and gender working off-farm (percent) schooLing working off-farm (percent) schooling
Under 20Male 9.2 7.0 40.8 8.4FemaLe 4.7 6.3 38.3 7.2
20-29MaLe 18.8 7.6 48.6 8.7Female 6.8 6.7 35.4 7.1
30-54MaLe 15.9 6.3 39.2 7.4Female 2.5 3.4 16.6 3.5
Over 54Female 8.2 4.1 20.1 4.4Male 1.7 0.8 3.2 0.6Source: Burgess and Zhuang 1996.
in rural areas for this age group. As expected, enroll- between men and women, or are other forces at work?ment gaps are less pronounced in urban areas. On average, Chinese women earn between 80 and 90
The finding of gender discrimination in household percent of what men earn-much higher than thehealth and education expenditures is important. Lower worldwide average. There is, however, evidence ofinvestment in girls in an environment of increasing occupational segregation in China; women are dispro-returns to human capital portends a widening gender portionately represented in lower-paying jobs. Somegap in the workplace. Data indicate that differential studies also find evidence of a persistent and unex-treatment of men and women translates into different plained gap between male and female wages, even after
job market outcomes (table 3.13). Lower investment in controlling for worker characteristics, suggesting that
girls' education appears to restrict their access to men and women do not get equal pay for equal work(higher-paying) off-farm employment. Gender discrim- (Bauer and others 1992; Meng and Miller 1995; Yang
ination in intrahousehold allocation is influenced by and Zax 1996). Moreover, this unexplained wage gapincome, however, and so is amenable to change through is high by international standards. It appears more pro-the growth process or targeted government policies. In nounced in nonstate firms than in state enterprises.fact, national data show a narrowing of the gender gap Expanding employment in nonstate firms and waningin educational attainment at all levels of schooling egalitarian wage policies in state firms might increase(table 3.14). the discriminatory component of the wage gap and fur-
Do unequal outcomes in the workplace simply reflect ther erode women's relative incomes. In nonstate firmsthe differential levels of educational attainment there is also an emerging bias against hiring women of
40 Sharing Rising Incomes: Disparities in China
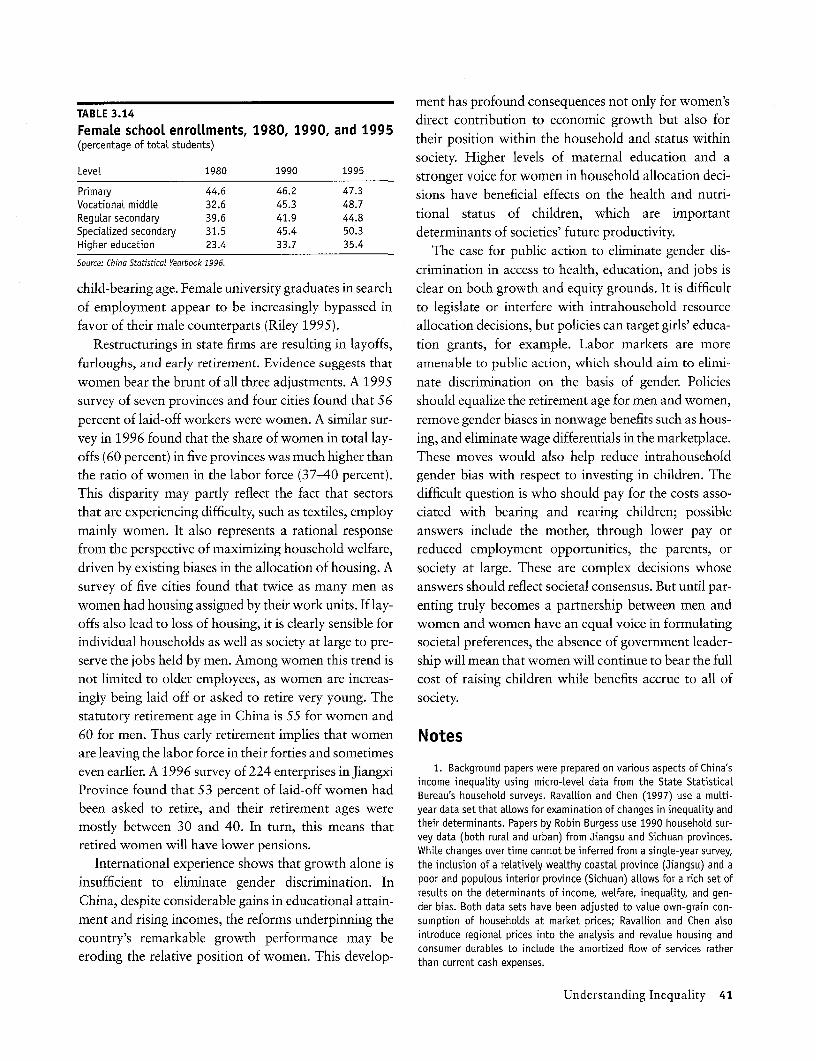
ment has profound consequences not only for women'sTABLE 3.14 direct contribution to economic growth but also for
(percentage of totaL students) their position within the household and status withinsociety. Higher levels of maternal education and a
Level 1980 1990 1995 stronger voice for women in household allocation deci-Primary 44.6 46.2 47.3 sions have beneficial effects on the health and nutri-VocationaL middLe 32.6 45.3 48.7ReguLar secondary 39.6 41.9 44.8 tional status of children, which are importantSpecialized secondary 31.5 45.4 50.3 determinants of societies' future productivity.Higher education 23.4 The case for public action to eliminate gender dis-Soulrce: Chins Statistical Yearbook 1996.
crimination in access to health, education, and jobs ischild-bearing age. Female university graduates in search clear on both growth and equity grounds. It is difficultof employment appear to be increasingly bypassed in to legislate or interfere with intrahousehold resourcefavor of their male counterparts (Riley 1995). allocation decisions, but policies can target girls' educa-
Restructurings in state firms are resulting in layoffs, tion grants, for example. Labor markets are more
furloughs, and early retirement. Evidence suggests that amenable to public action, which should aim to elimi-
women bear the brunt of all three adjustments. A 1995 nate discrimination on the basis of gender. Policiessurvey of seven provinces and four cities found that 56 should equalize the retirement age for men and women,
percent of laid-off workers were women. A similar sur- remove gender biases in nonwage benefits such as hous-
vey in 1996 found that the share of women in total lay- ing, and eliminate wage differentials in the marketplace.offs (60 percent) in five provinces was much higher than These moves would also help reduce intrahouseholdthe ratio of women in the labor force (37-40 percent). gender bias with respect to investing in children. TheThis disparity may partly reflect the fact that sectors difficult question is who should pay for the costs asso-that are experiencing difficulty, such as textiles, employ ciated with bearing and rearing children; possible
mainly women. It also represents a rational response answers include the mother, through lower pay orfrom the perspective of maximizing household welfare, reduced employment opportunities, the parents, ordriven by existing biases in the allocation of housing. A society at large. These are complex decisions whose
survey of five cities found that twice as many men as answers should reflect societal consensus. But until par-
women had housing assigned by their work units. If lay- enting truly becomes a partnership between men andoffs also lead to loss of housing, it is clearly sensible for women and women have an equal voice in formulatingindividual households as well as society at large to pre- societal preferences, the absence of government leader-serve the jobs held by men. Among women this trend is ship will mean that women will continue to bear the full
not limited to older employees, as women are increas- cost of raising children while benefits accrue to all ofingly being laid off or asked to retire very young. The society.
statutory retirement age in China is 55 for women and
60 for men. Thus early retirement implies that women Notesare leaving the labor force in their forties and sometimeseven earlier. A 1996 survey of 224 enterprises in Jiangxi 1. Background papers were prepared on various aspects of China's
income inequality using micro-LeveL data from the State StatisticalProvince found that 53 percent of laid-off women had Bureau's househoLd surveys. RavaLLion and Chen (1997) use a multi-
been asked to retire, and their retirement ages were year data set that aLLows for examination of changes in inequality andmostly between 30 and 40. In turn, this means that their determinants. Papers by Robin Burgess use 1990 househoLd sur-
vey data (both rural and urban) from Jiangsu and Sichuan provinces.retired women will have lower pensions. WhiLe changes over time cannot be inferred from a singLe-year survey,
International experience shows that growth alone is the inclusion of a reLatively weaLthy coastaL province (Jiangsu) and a
insufficient to eliminate gender discrimination. In poor and popuLous interior province (Sichuan) aLlows for a rich set ofresults on the determinants of income, welfare, inequality, and gen-
China, despite considerable gains in educational attain- der bias. Both data sets have been adjusted to value own-grain con-
ment and rising incomes, the reforms underpinning the sumption of households at market prices; Ravallion and Chen also
country's remarkable growth performance may be introduce regional prices into the analysis and revalue housing anderoding th relativepositionofwomen. Thisdeconsumer durables to include the amortized flow of services rather
eroding the relative position of women. This develop)- thncretasexne. n than current cash expenses.
Understanding Inequality 41

2. To examine the effect of ownership on income, ownership forms cent of the totaL popuLation and 17.4 percent of the landless popuLa-in the urban data set are categorized into state, coLLective, and pri- tion is poor.vateLy owned work units. Workers not empLoyed by state or coLLective 15. Because McKinLey and Griffin incLude the Landless in their cal-units are categorized as empLoyees of the private sector. cuLations, however, their Gini is higher.
3. As an extension of the anaLysis, the shares of schooLing and 16. InterestingLy, and unLike other countries, the distribution ofempLoyment by ownership were incLuded as explanatory variables. The Landed weaLth is not a good predictor of the distribution of otherresuLts for 1991 and 1995 further demonstrate the strong correLation assets. In fact, househoLds that hoLd Less Land (in terms of vaLue) tendbetween tertiary education and Labor income, and the high return to to hold relatively more other assets.private sector jobs. 17. There is strong evidence for this in Sichuan (Burgess 1997).
4. Another pLausibLe expLanation for increasing returns to state- 18. The same is true of fishponds, whose contribution to inequaL-owned units is the gradual monetization of in-kind income. ity was stiLL low in 1990 (1.4 percent for adjusted income) but which
5. In a regression of urban income growth on initial income, a accounted for 23 percent of the increase in inequaLity between 1985dummy variabLe for Location in a coastaL province, and the share of and 1990.empLoyment by ownership, ownership coefficients were found to be 19. Interestingly, anaLysis suggests that given incompLete mar-smaLL and insignificant. kets, making the distribution of Land Less egaLitarian wouLd hamper
6. This section draws on Burgess (1997). productive efficiency, equity, and weLfare, suggesting that Lump-sum7. The anaLysis was done using both the Gini coefficient and Log Land redistribution in ruraL China may represent a rare exampLe of a
deviation (or TheiL index), but because the conclusions are robust to redistributive poLicy intervention that enhances both equity and effi-the choice of inequality measure, onLy the resuLts of the decomposi- ciency (Burgess and Murthi 1996). ALthough this does not mean thattion of the Gini coefficient are reported here. the overaLL aLLocation of resources in rural China is optimal, it does
8. The question of transient poverty, as distinct from chronic suggest that the deveLopment of factor markets (particuLarLy for Labor)poverty, is an important one and has received some attention in empir- is likeLy to be more important than Land redistribution in increasingicaL work on China (Jalan and RavaLLion 1996). returns to Labor and improving househoLd weLfare.
9. The first year of the data set is 1988. The tendencies identified 20. These findings point to the absence of discrimination in thehere wouLd likeLy be stronger if the anaLysis could be carried out start- aLLocation of heaLth services for both provinces. However, the anaLy-ing with the launching of urban reforms in 1985. sis Likely has Limited power to pick up discrimination in this area,
10. The anaLysis here is based on data provided by the State given the heavy subsidization of heaLth services in 1990. ALso, ifStatistical Bureau, as described in the note to tabLe 3.5. attending a cLinic is not costly but drugs and other health goods need
11. Knight and Li (1996) show that Large differences in educa- to be purchased in the market, a preference may be expressed moretionaL attainment remain even after controLLing for different charac- forcibly in decisions to purchase heaLth goods rather than in decisionsteristics (sex, age, minority status) of ruraL and urban househoLds. to attend clinics.
12. RavaLLion and Chen (1997) show that the share of inequality 21. The sampLes were sptit according to expenditures (per equiv-attributed to any income determinant is the product of three things: aLent adult) and the share of off-farm income in net income.the partiaL regression coefficient of income on that determinant, the 22. As regards education services, the pro-maLe discriminationsimpLe correLation coefficient with income, and the ratio of the stan- detected in the full sample for the 15-19 age group in Sichuan appearsdard deviation of that determinant reLative to the standard deviation to be more pronounced for more diversified households; this mightof income. reflect the fact that it is mainly diversified househoLds that engage in
13. The remainder is made up of housing, fixed assets and finan- post-secondary education. Less diversified households aLso exhibit acial assets (McKinLey and Griffin 1993). pro-maLe bias in investments in secondary education services that was
14. By the standard deveLoped in the nationaL survey, 12.7 per- not apparent in the fuLL sampLe.
42 Sharing Rising Incomes: Disparities in China
How Policies A!fctIndividual Welre
eople's different endowments suggest that
# - innequality in outcomes is not only unavoidable
but also that it can help nourish creativity and spur
_ v growth. As a result most societies tolerate some inequal-
ity in income. How much depends on the historical and
cultural factors shaping each society's preferences.
China's income inequality may continue to rise as thecountry's transition unfolds. But increasing inequality
11+. >0need not undermine growth or social harmony-so longas growth is broadly based, policy biases are eliminated,
opportunities are equalized, and the poor and vulnerable
are protected. This chapter shows how policies can har-ness growth to improve the welfare of the poor and curbdamaging increases in inequality (figure 4.1).
p4'4 t l -43

Where the poor are, 1995Share of population(percent)
0.6
National
0.5
0.4
0.3
Near poor l an
0.2 (8 8%)
0.1 AbsoLute poor The ch(5A7bo poo •% \
YuanSource: World Bank staff estimates.
Eliminating policies that favor that could be targeted to more needy populations, somethe better-off of these policies directly lower the welfare of rural resi-
dents. Others do so directly. Adjusting these policiesDespite its increase over the past fifteen years, income would more likely affect middle- than upper-incomeinequality remains moderate in China. Unlike in some individuals.Latin American countries, wealth in China is not highly Second, the coastal bias in economic policies should
concentrated, and the gap between the haves and the be removed. The natural and human capital advantageshave-nots is not large enough to threaten the social of the coastal provinces are sufficient to attract foreign
order or warrant remedial policies. The per capita investment without preferential policies. The govern-income cutoff for the richest 5 percent of the population ment is already moving in this direction by eliminating
(3,180 yuan in 1990 prices) is exactly ten times the tariff and tax benefits for foreign investors. The impactabsolute poverty line (318 yuan in 1990 prices). Thus on regional growth patterns of policies that favor the
public policy should continue to focus on fostering con- interior is more complex. Research is needed to deter-ditions for people at the lower end of the distribution to mine the potential effectiveness of a package of suchparticipate in economic growth. policies. International experience with regional develop-
Some policies, however, exacerbate the gap between ment efforts generally has been negative, but there has
the rich and the poor. Eliminating policies that favor the been little systematic analysis of this important issue.
rich would help reduce inequality. So would strength- There is, however, substantial evidence that well-
ening policies that tax the rich and that guard against designed intergovernmental grants can reduce publicunscrupulous wealth accumulation (box 4.1). Two expenditure disparities across localities. The equalizing
efforts are crucial in this regard. nature of China's current interprovincial transfer schemeFirst, the urban bias in current policies should be has been eroding, and the government plans to reform it
redressed. Housing, food, migration, credit, state (World Bank 1995a). Income inequalities that resultemployment, and other policies provide de facto subsi- from the unequal size of provincial purses could bedies for urban residents. By preempting public resources addressed by a new transfer scheme based on provincial
44 Sharing Rising Incomes: Disparities in China
is now concentrated in remote upland areas whereBOX 4.1
people eke out a living in the face of severe resource~~ c½~~~~71'~~~7 ~ constraints (World Bank 1997b). Although these poor
have land use rights, in most cases the land is of suchpoor quality that it is impossible to achieve subsistence
I~~~i~~ ~~ ~~~ ~~ crop production. Consequently, most poor people
consume grain and other subsistence foods beyond
their production levels and suffer when the prices ofexpenditur needs and revenue generation. Progres these products increase. The poorest households often
are further disadvantaged by high dependency ratios,
t a mc d fill health, and low educational attainment. In many ofChina's poorest towns and villages at least half of the
Protecting the absolutep rboys and nearly all of the girls do not attend school
and will be illiterate. The poorest households have nei-ther the physical nor the human assets to reap the ben-
efits of growth.
Do current programs reach the poor?
The Chinese government is committed to reducing
remaining por,trgtd oeryineretin wl sgpoverty, and most government ministries and agencieshave special poverty reduction projects. In 1986 theState Council established the Leading Group for
~~ ~ ~ ~ ~~~& #t ~~~~ Poverty Reduction to coordinate poverty initiatives
_ ~~~~and to infuse rural social and relief services with a new
emphasis on economic development programs in poorareas. To be eligible for development assistance, coun-
~~~ ~~ties were designated as poor in 1986 using county-level~~~ j ~~~rural income data gathered by the Ministry of
~~e w 4~~~~~~~e~~~ ~Agriculture (box 4.2). The resulting list of 327 poorcounties captured many of the poor. But the decision to
- ~~~~~~~~~~~~~~focus on counties (rather than townships, for example)
expenditure needs and revenue generation. Progress in and to use county-level data to determine eligibilityreforming the system has been hampered by political limited the government's ability to target more effec-
concerns. Accelerating interprovincial disparities require tively. The switch to State Statistical Bureau data
the central government's concentrated effort if the trend (county average rural per capita income) in 1992is to be checked. improved the information base for targeting, but prob-
lems remain: there is substantial income variationwithin counties and considerable fluctuations in per
Protecting the absolute poor capita income over time.Analysis based on the rural household survey data
About 70 million Chinese lived in absolute poverty in for the four-province data set described in previous1995, down from 270 million in 1978. Although con- chapters shows that during 1985-90 roughly half the
tinued growth in agriculture and off-farm employ- poor did not live in either the nationally or the provin-ment should raise the living standards of some of the cially designated poor areas (table 4.1).1 This findingremaining poor, targeted poverty interventions will suggests that there is considerable variation in perremain essential for most. Absolute poverty in China capita incomes around the county mean. Indeed, for the
How Policies Affect Individual Welfare 45

pooled sample (excluding Guangdong) the standard extensive data.3 In China targeting is geographicdeviation of per capita consumption for the designated (based on county means), so household-level fluctua-poor counties was close to the mean. tions in annual per capita consumption will have little
A single year is not a useful time period for defining impact on targeting efficiency unless there are riskseligibility for poverty alleviation schemes. Individuals that affect entire communities.may dip below the poverty line in a given year andlater rise above it again. As such, they are members of Adjusting the governments approach tothe transient rather than the chronic poor. Transient alleviating povertypoverty appears prevalent among the households sam-pled in 1985-90,' suggesting that poverty alleviation As poverty declines, the need for better targetingpolicies based on consumption (income) levels in any increases. Targeting to the level of townships, or per-one year are less efficient than policies based on more haps even administrative villages, would reduce costs
and increase the effectiveness of poverty alleviation pro-grams. Current poverty alleviation criteria are compro-
i; ; ; , gmising the government's ability to reach all of the poor.0> >;N They also raise the cost of lifting an individual out of
_ w22~wsy~ poverty because increasingly large numbers of people-g E Ewho are not poor continue to benefit from government
programs.The government should also consider refocusing its
Do the pooriveidesgnatepoocouniespoverty reduction strategy. Most of the poor now live in
remote, sparsely populated regions with low-qualityM ~~~~ ~ land. Some will no doubt benefit from rural infrastruc-
ture investments, efforts to improve agricultural
productivity, and local off-farm employment opportu-nities-important pillars in the government's strategyto combat poverty. In particular, those who fall intopoverty because they are exposed to discrete shockswould benefit substantially from opportunities to diver-
~~W~~~& ~~~~ ~ ~ ~ > ~ sify risk through off-farm employment. But returns to
interventions that were effective in the past must bedeclining, given the changing profile of the poor. Thus a
renewed emphasis on basic education and health ser-
46ji ~ 4 ~ vices for the poor is essential, combined with help find-
ing employment in economically advanced areas~Y (box 4.3).
Evidence suggests that health emergencies contribute
_____________________________________ to transient poverty (World Bank 1996b). There is aTABLE 4.1 clear need to ensure essential health services for theDo the poor live in designated poor counties? poor and to strengthen public health programs.(percentage of provincial poor Living in designated poor counties) Chronic poverty in China is highly correlated with poor
Province 1985 1990 health, low levels of educational attainment, and illiter-Guangdong 34 42 acy. Poor households should be compensated for theGuangxi 449direct cost-and possibly some of the indirect (oppor-Guizhou 49 53Yunnan 40 43 tunity) costs-of educating their children. To increase
Total 45 48 returns to schooling, labor mobility should be pro-Source: Wortd Bank staff estimates based os State Statistical Bureau data- moted and the quality of education improved. Doing so
46 Sharing Rising Incomes: Disparities in China

gBOX 4.3 -,,,- Boosting the potential of~~~ ~the near poor
>~China's "near poor" have incomes above the absolute~ ~ poverty threshold but are considered poor by most
international standards. By this report's definition, thenumber of people considered near poor dropped fromsome 200 million in 1981 (25 percent of the popula-tion) to 100 million in 1995 (8.8 percent of the popula-tion) 4 This segment of the population has benefited
gg g greatly from reforms in grain pricing and strong growthin off-farm employment.
Policies that are beneficial to the absolute poor willalso help improve the welfare of the near poor.
Increased availability of basic education and health ser-
g 4g. vices is essential to ensure that the poor are not left outof the growth process. Access to higher levels of educa-tion, a more accommodating grain policy, greater inte-
gration in labor markets, and better-functioning creditmarkets would further upgrade the living standards of
1~the near poor.
Educating the near poor
Education is an increasingly important determinant ofincome. Arresting deterioration in China's income dis-tribution will require ensuring greater equality in accessto high school education and above. To this end, the
Eai tgovernment should consider providing merit-basedassistance to poor families to help defray the increasing
costs of higher education.
~-.HDeveloping a more flexibie grain policy
Government grain production policies continue to
would reduce parents' reluctance to send their children depress rural incomes. In rural China low incomes areto school. Information from household surveys and closely associated with grain production (figure 4.2).
special surveys of migrants shows the importance of Higher returns accrue to nongrain agriculture and toremittances to incomes, including those of the poor. The off-farm employment in particular. Survey data from the
main constraint to increased migration appears to be four southern provinces show that among the near poor
access to information about job opportunities. A recent grain income accounted for nearly half of per capita
village-level study on migration flows found that famil- income in 1990. Although grain incomes have increasediarity with previous migrants was the most important substantially, thanks to higher yields and price increases,
determinant of migration (Rozelle and others 1997). the potential for further gains in this area is limited. InExpanding the government's already important activi- particular, market prices in China's cities are now close
ties in this area offers promise. to-and in some cases even higher than-world market
How Policies Affect Individual Welfare 47
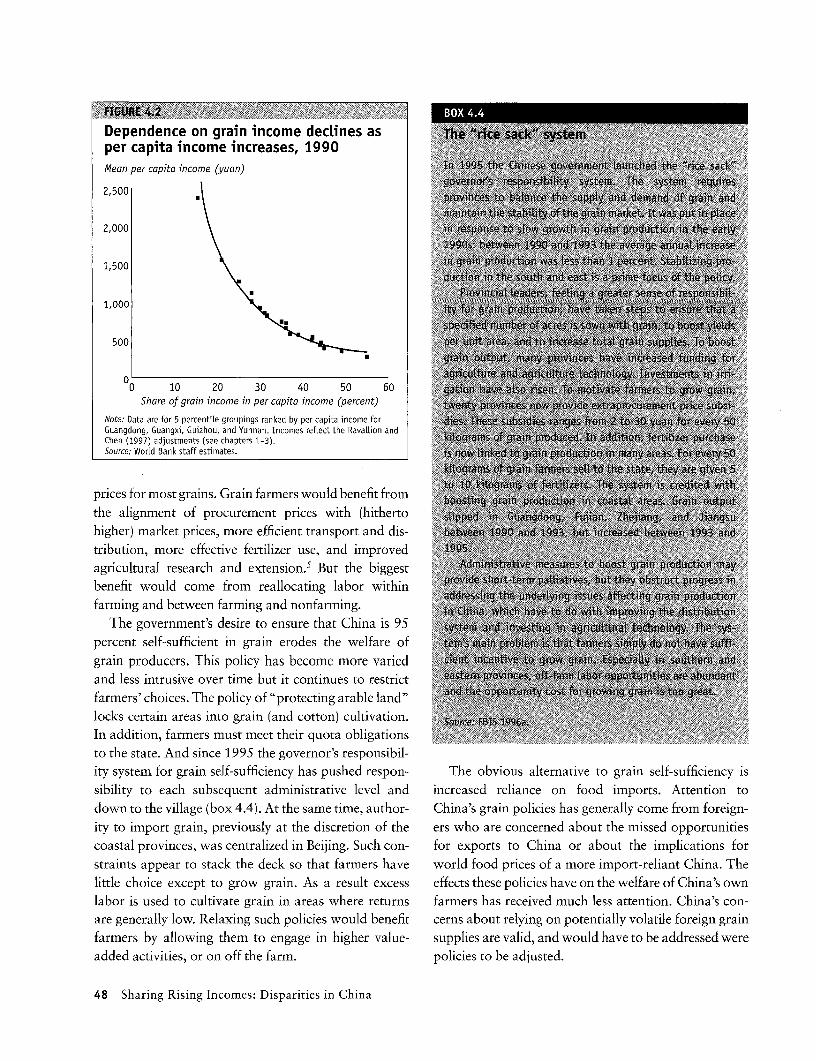
Dependence on grain income declines as--per capita income increases, 1990Mean per capita income (yuan) , 1i9t The 1 D D R s k
2,500 *p e t i e~i fgnna~
2,000 a o r e t c w ( r i
benefit ~ ~ ~ ~ ~ ~ ~ ~ ~ ~ 9s would~M come fro rellcain labr wthi ahii2 4 se
1,500 in g X r lt D D f p n
to ~ ~ ~ ~ ~ ~ ~ ~ ~ ~ ~~~~dcr the state And~ since 1995 th govenor' resonsbil
1,000 ~~ a ~ ~ e~
500 xrxt & t Le ot
0 10 20 30 40 50 60 tetsShare of grain incame in per capita income (percent)
Note: Data are for 5 percentile groupings ranked by per capita income forGuangdong, Guangxi, Guizhou, and Yunnan. Incomes refLect the Ravai. ion andChen (1997) adjustments (see chapters 1-3). s avfodre fa or ielnC aTSolirce: WorLd Bank staff estimates. w ofChia'sow
prices for most grains. Grain farmers would benefit fromthe alignment of procurement prices with (hitherto cern athigher) market prices, more efficient transport and dis- a vaid and w haveto e addressedtribution, more effective fertilizer use, and improved a sagricultural research and extension.' But the biggestbenefit would come from reallocating labor within t aJIPesltTenbpq s'ifarming and between farming and nonfarming. i~
The government's desire to ensure that China is 95percent self-sufficient in grain erodes the welfare of r ~ ~ tp n n t~f~grain producers. This policy has become more varied A tT itv r ;k~4 and less intrusive over time but it continues to restrict ~bl4nfarmers' choices. The policy of "protecting arable land"locks certain areas into grain (and cotton) cultivation.In addition, farmers must meet their quota obligationsto the state. And since 1995 the governor's responsibil-ity system for grain self-sufficiency has pushed respon- The obvious alternative to grain self-sufficiency issibility to each subsequent administrative level and increased reliance on food imports. Attention todown to the village (box 4.4). At the same time, author- China's grain policies has generally come from foreign-ity to import grain, previously at the discretion of the ers who are concerned about the missed opportunitiescoastal provinces, was centralized in Beijing. Such con- for exports to China or about the implications forstraints appear to stack the deck so that farmers have world food prices of a more import-reliant China. Thelittle choice except to grow grain. As a result excess effects these policies have on the welfare of China's ownlabor is used to cultivate grain in areas where returns farmers has received much less attention. China's con-are generally low. Relaxing such policies would benefit cerns about relying on potentially volatile foreign grainfarmers by allowing them to engage in higher value- supplies are valid, and would have to be addressed wereadded activities, or on off the farm. policies to be adjusted.
48 Sharing Rising Incomes: Disparities in China
Box 4.5 boost rural incomes if it is properly structured (boxBOX 4.5 ~~~~~~~~~~4.5). International experience shows that microfinance
s~~. programs can contri'bute to poverty reduction and be
sustainable, but only when families are able to invest inproductive activities that can generate cash flow for
repayment. Thus such programs are likely to be wellsuited to the near poor but will fail if used to aid thedestitute.
Integrating Labor markets
The benefits of increased labor market integration forthe near poor are clear. Despite considerable relaxation
in the rules and regulations governing rural-urbanmigration, forms of control and other impedimentsremain. Controls in both sender and recipient regionsreflect the government's intolerance for "blind" migra-tion that is, migration into cities without a job. Mostmigrants to China's major cities are forced out by threeno's no hukou, no housing, and no job. In addition,the uncertain status of migrants in urban areas, theabsence of a housing market, and the unavailability ofsocial services dampen the demand for migration(annex 1). The authorities' desire to control the pace of
rural-urban migration is understandable. The potentialcosts in terms of greater urban congestion, higher inci-
~~~~~ ~~~ dence of crime, and dislocation of established urban
workers may be sizable. But it is important to weigh
these costs against the considerable benefits of labor~~~~ ~ ~ ~ ~ ~ ~ ~~ mobility, not just for the individual migrants but also
4~~~~Ai4i for the economies of the host cities and the families left
behind. The government could help broaden access tomigration opportunities by strengthening job informa-
tion networks.
Caring for the urban poor
Serving the creditworthy The near-absence of poverty in urban China is unusual. Inmost countries uirban poverty contributes significantly to
Increased diversification into off-farm employment will overall poverty (figure 4.3). In China, by contrast, avail-
not only help increase the incomes of the near poor but able data indicated that no urban residents have incomesalso will reduce their vulnerability to income fluctua- below the absolute poverty line. And in 1995 just 0. 1 per-
tions. More education is key for improved market cent of the registered urban population lived below theaccess, but better rural infrastructure and credit avail- higher poverty threshold, down from a peak of 1.8 per-
ability will also help bring markets within reach and get cent in 1989. Low urban poverty reflects China's limitednew businesses started. Microfinance, a relatively new urbanization and the continued segmentation of its urban
instrument in China, has considerable potential to and rural economies. Not only is urban poverty negligi-
How Policies Affect Individual Welfare 49

ble, but urban inequality is also low by international stan-dards. It is likely that both will rise in the future. But if this Unlike in most countries, urban poverty inincrease is due to a decline in the rural-urban gap as a China is negligibleresult of greater labor mobility and increased market inte- Ratio of urban to rural poverty
gration, it should not increase overall inequality. (percent)
1.4
Who are the urban poor?1.2 * Indonesia
The characteristics of the poorest 5 percent of urban 1.0 Bangladesh
households (ranked by per capita income) can be com- Pakistan .
pared with those of the average urban resident to yield 0.8 Thailand X
information about the relative urban poor. As table 4.2 0.6
shows, poor urban households have more membersand fewer income earners. The drop in female employ- 0.4 X BraziL
ment is particularly notable. Members of poor urban 0.2
households are more likely to work in collectives, as 00 1, 0 0
domestics, or be self-employed. But above all, they are o 1000 2,000 3,000 4,000 5,000 6,000
more likely to be unemployed: only 1.8 percent of the GDP per capita (purchasing power panty dollars)Note: Data are for a recent year between 1990 and 1995. Poverty incidencemembers of the average urban household are waiting is based on nationaL poverty Lines, which vary substantiaLLy across countries.
for a job or a job assignment; in poor households the Source: World Bank data.
corresponding figure is 6.3 percent. Poor households
are underrepresented in knowledge-intensive occupa- in China is 55 for women and 60 for men. About 12tions and are far less likely to work for the Communist percent of the individuals in the sample changed jobparty and the government. They are also less likely to status between 1991 and 1995. The bulk of thesebe employed by the state or by joint ventures and are changes came from the state sector (60 percent), and
less likely to have members who are retired. Unlike in they were almost entirely for the worse. Among state
other developing and transition economies, retirement employees who changed jobs, less than 30 percent
in China does not push people into poverty, reflecting found work in other sectors; the rest retired (45 per-the still generous pensions received by retirees. cent), left the labor force (10 percent), became unem-
Information from a survey of five cities (Beijing, ployed (9 percent), or were furloughed (8 percent).Shanghai, Chongqing, Guangzhou, Shenyang) com- New entrants into the labor force went primarily intoplements these findings and provides additional private and foreign jobs, reflecting the locus of newinsight. The survey found that retirement does not job creation and the continuing decline of state andincrease the likelihood of a household falling into collective enterprises.poverty, but unemployment and furloughs do.6 Surveyresults also show a much higher incidence of unem- Dealing with rising urban povertyployment than is indicated in State Statistical Bureaudata-and one that is rising. Even aside from those China's cities have been changing rapidly and will con-who took early retirement, adding together reported tinue to do so for at least the next two decades. Chinaunemployment and those who were furloughed brings remains underurbanized. This will change, and as ittotal unemployment to 3.0 percent in 1991 and 8.2 does there will be a substantial transformation of both
percent in 1995. the structures and the faces that make up modernEarly retirement and furloughs are being used to China. Poverty and unemployment have been almost
shed excess workers in enterprises, according to the unknown to China's urban residents, but this too issurvey. Among those who had retired since 1991, 10 changing. As wages increasingly reflect productivitypercent were in their forties or younger and 38 per- differentials and production structures adjust tocent were in their fifties. The statutory retirement age China's comparative advantage in international mar-
50 Sharing Rising Incomes: Disparities in China
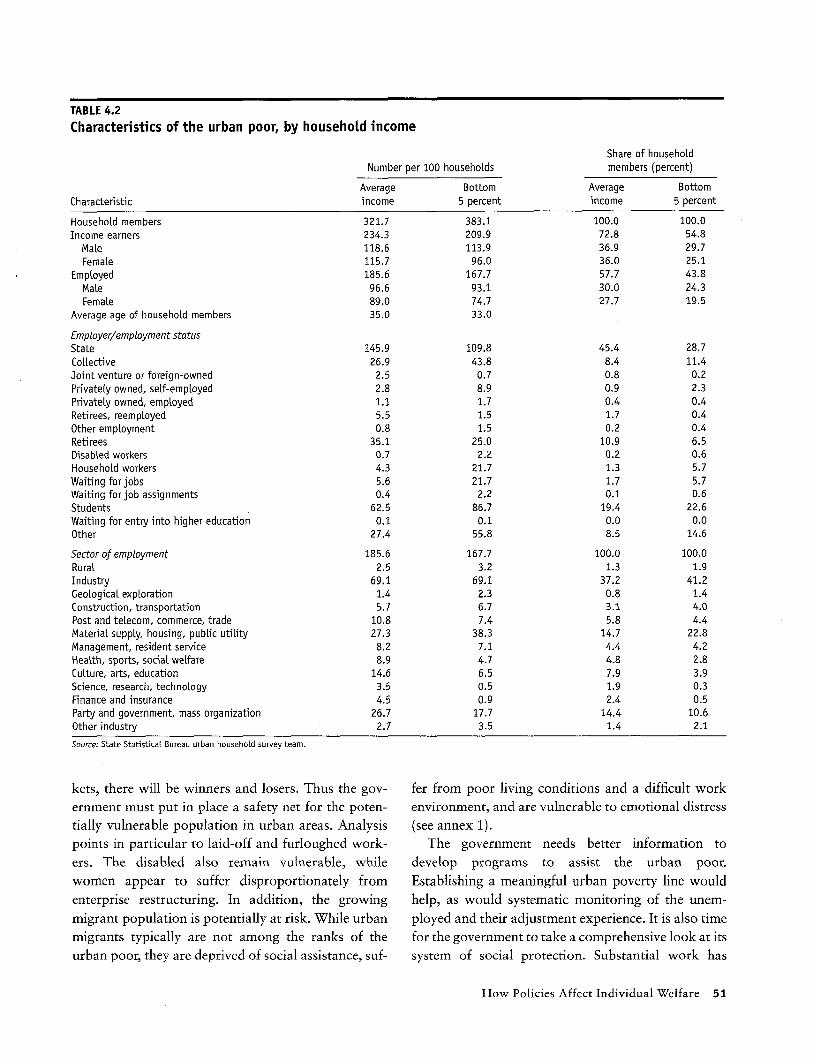
TABLE 4.2Characteristics of the urban poor, by household income
Share of householdNumber per 100 househoLds members (percent)
Average Bottom Average BottomCharacteristic income 5 percent income 5 percent
HousehoLd members 321.7 383.1 100.0 100.0Income earners 234.3 209.9 72.8 54.8
Male 118.6 113.9 36.9 29.7FemaLe 115.7 96.0 36.0 25.1
Employed 185.6 167.7 57.7 43.8Male 96.6 93.1 30.0 24.3Femate 89.0 74.7 27.7 19.5
Average age of househoLd members 35.0 33.0
Employer/employment statusState 145.9 109.8 45.4 28.7Collective 26.9 43.8 8.4 11.4Joint venture or foreign-owned 2.5 0.7 0.8 0.2Privately owned, self-employed 2.8 8.9 0.9 2.3Privately owned, empLoyed 1.1 1.7 0.4 0.4Retirees, reemployed 5.5 1.5 1.7 0.4Other empLoyment 0.8 1.5 0.2 0.4Retirees 35.1 25.0 10.9 6.5Disabled workers 0.7 2.2 0.2 0.6Household workers 4.3 21.7 1.3 5.7Waiting for jobs 5.6 21.7 1.7 5.7Waiting for job assignments 0.4 2.2 0.1 0.6Students 62.5 86.7 19.4 22.6Waiting for entry into higher education 0.1 0.1 0.0 0.0Other 27.4 55.8 8.5 14.6
Sector of employment 185.6 167.7 100.0 100.0Rural 2.5 3.2 1.3 1.9Industry 69.1 69.1 37.2 41.2GeoLogicaL expLoration 1.4 2.3 0.8 1.4Construction, transportation 5.7 6.7 3.1 4.0Post and teLecom, commerce, trade 10.8 7.4 5.8 4.4MateriaL suppLy, housing, public utiLity 27.3 38.3 14.7 22.8Management, resident service 8.2 7.1 4.4 4.2Health, sports, social welfare 8.9 4.7 4.8 2.8CuLture, arts, education 14.6 6.5 7.9 3.9Science, research, technology 3.5 0.5 1.9 0.3Finance and insurance 4.5 0.9 2.4 0.5Party and government, mass organization 26.7 17.7 14.4 10.6Other industry 2.7 3.5 1.4 2.1
Source: State Statistical Bureau urban househoLd survey team.
kets, there will be winners and losers. Thus the gov- fer from poor living conditions and a difficult work
ernment must put in place a safety net for the poten- environment, and are vulnerable to emotional distress
tially vulnerable population in urban areas. Analysis (see annex 1).points in particular to laid-off and furloughed work- The government needs better information to
ers. The disabled also remain vulnerable, while develop programs to assist the urban poor.
women appear to suffer disproportionately from Establishing a meaningful urban poverty line would
enterprise restructuring. In addition, the growing help, as would systematic monitoring of the unem-
migrant population is potentially at risk. While urban ployed and their adjustment experience. It is also time
migrants typically are not among the ranks of the for the government to take a comprehensive look at its
urban poor, they are deprived of social assistance, suf- system of social protection. Substantial work has
How Policies Affect Individual Welfare 51
already gone into analyzing the pension and health 2. Roughly half of the mean squared poverty gap (defined as thecare fn cst sEfts uincome needed to bring the poor out of poverty) for the four provinces
care finance systems. Efforts should now focus on resuLted from fluctuations in consumption, while about 40 percent ofChina's system of unemployment compensation, dis- the transient poverty was found among househoLds who are not poor
ability and other benefits (including maternity leave), on average (JaLan and RavaLLion 1996b).
and labor training and retraining schemes. The gov- 3. Using a current cross-section of consumptions, JaLan andRavaLLion (1996b) find that the fuLL cost of eLiminating chronic poverty
ernment should also strengthen job information net- wouLd be three or four times the poverty gap based on mean con-
works. Finally, lessons should be emerging from urban sumption over six years.and reemployment programs. Much 4. The poverty Line used to identify the near poor is set at 454
job creation and reemployment programs- Mucn yuan in 1990 prices, equivaLent to $1 a day of income in 1985 pur-could be learned from a systematic evaluation of these chasing power parity doLLars using the Penn WorLd Tables (Summers
programs' cost-effectiveness and the conditions for and Heston 1995).5. For a detailed discussion, see WorLd Bank (1997a).
their success or failure. 6. Less than 6 percent of those who had retired between 1991 and
1995 became 'new poor," defined as falling into the bottom two
Notes income deciLes from at Least one step above. Among sampled house-hoLds, 27 percent of the "new poor" came from those who were newLy
1. Using the definition in Chen and RavaLLion (1996). unempLoyed, furloughed, or had left the Labor force.
52 Sharing Rising Incomes: Disparities in China
Mi;gration andInequality in China
ver the past decade greater employmentopportunities and higher living standards
have lured China's peasants to the cities in unprecedentednumbers. This migration has redistributed income and insome areas appears to have increased inequality, but theexact effects cannot be measured with available data.National urban household surveys include only officialurban residents; most migrants who reside in cities are notofficially registered.
Although migration creates new challenges for China'srural and urban economies, so far its effects have beenlargely positive. Migration alleviates the pronouncedinequality between poor rural people and wealthy urban-ites and helps redistribute rural incomes because migrantssend significant portions of their earnings back to theirfamilies. Although migration may be increasing inequalityamong urban residents, national inequality would likelybe more severe in the absence of migration. Governments
53
could increase the income distribution benefits of long-term migrants. That number swells to 70 milliongreater labor mobility by providing poor rural residents when it includes people who work close enough towith more opportunities to migrate. home to return each night and self-employed workers
who travel between their home village and outside loca-Evolution of migration and tions (Rozelle and others 1997). Migrants tend to comecurrent trends from rural areas in the interior provinces and go to cities
in the richer coastal provinces; there is also substantialBecause population policies have discouraged rural res- migration within coastal areas. Emigration rates foridents from moving to cities, about 70 percent of poorer interior provinces (such as Yunnan) are lower.China's population is rural-unusual for a country at The large influx of migrants to the cities has sparkedits level of development (China State Statistical Bureau anxiety among urban residents, and officials have scram-1996). In 1948 China enacted the household registra- bled to enact policies to curb and regulate the flow. Thesetion system (hukou), designating households as rural or anxieties reflect both capacity concerns (an overflow ofurban. This system was iron-clad, and converting from the railway system during the Chinese New Year) anda rural to an urban hukou was nearly impossible. understandable fears (that migrants will increase urbanMembers of urban households could live in cities and unemployment and crime, crowd urban schools, andsmall towns, received state-subsidized grain supplies, evade birth control regulations). To try to stem "blind"and could work in government enterprises. These rights migration, recent national policies require migrants towere denied to peasants with rural hukous. obtain permits from the authorities in both the source vil-
In 1980 policymakers introduced the household lage and the destination area testifying that they areresponsibility system, which allowed households to migrating to a job. Requirements for other permits havedetermine how to allocate labor between farm and off- proliferated and vary between localities. But while thefarm activities. Although rural residents could leave the new policies create hardship for migrants, requiring pay-land, they still could not legally reside in cities. Without ment for a patchwork of permits, they have done little tourban registration, migrants are essentially second-class stem the tide. The authorities recognize some of the ben-citizens, and their stay in the city is subject to the whim efits of migration, and policy documents (including theof the authorities. And because migrants are denied Ninth Five-Year Plan) call for orderly migration to helpaccess to urban services, good jobs, and social status, alleviate poverty. Recent efforts have focused on coordi-they are discouraged from bringing their families. nation between provinces to regulate the flow of migrantsMoreover, migrants tend to retain ties to agriculture and mitigate congestion of the transport system.because it provides security, especially valued given the Whether large-scale migration continues will dependlack of a formal old-age security system in rural China. in part on whether the surplus labor force has beenSo, despite the high income potential of migration, exhausted. Chinese researchers indicate that the surplusthese drawbacks limit the duration of migration, and labor force (not including those who have alreadymigrants return frequently to their home villages. migrated) ranges from 130 million to 168 million (MasonAlthough urban migrants earn nearly three times as 1997a). If these figures are accurate, migration could con-much as rural nonfarm workers, better-educated rural tinue for the next decade given current agricultural andresidents prefer local nonfarm employment. population policies and urban growth rates. Survey work
In the early 1980s rural incomes grew rapidly, so the has shown that the shadow wage rate for agriculture isdifficulties in finding urban employment and the imped- extremely low-well below that for other rural employ-iments of the hukou system outweighed the incentives ment-supporting claims that a large surplus labor forceto migrate. But later, as the early gains from the rural still exists (Hare and Zhao 1996).reforms were exhausted, urban reforms boosted urbangrowth rates, and rising disparities spurred migration. Migrant profileRecent estimates of the current number of migrantsrange from 30 million to 200 million. Data from a Migration tends to be concentrated by area and appearsrecent survey suggest that there are around 40 million to vary widely across counties and even villages. Most
54 Sharing Rising Incomes: Disparities in China

migrants find their jobs through family and other infor- were typically less advantaged than nonmigrants onmal connections, and these connections are mostly at almost all counts: their pre-migration income levelsthe village level (China Ministry of Agriculture 1996). were up to 30 percent lower; they had less cultivatedOnly 15 percent of migrants find jobs through formal land and fewer fixed assets; more of their incomechannels, such as local labor bureaus and employment came from agriculture, and more from staple crops;offices. Most migrants are young, unmarried, and work and fewer of their household members worked inin blue-collar and service jobs. The average migrant is township and village enterprises (China Ministry ofless educated than the general population but more edu- Agriculture 1996b).cated than the rural population. Few migrants come Migration patterns are changing. Migrants nowfrom the ranks of the absolute poor, who lack even the travel farther to find work and stay away for longerfew years of schooling and basic Mandarin required for periods, although women tend to migrate shorter dis-most migrant jobs. tances than do men. Recent government policy has tried
Young, single workers migrate because job opportu- to ease the pressure on the transport system by prevent-nities are abundant and their migration costs are low. ing migrants from returning home at Spring Festival, aThe construction sector absorbs the largest share of custom that prevailed in the past. Shorter migrationmigrant workers, followed by manufacturing, light cycles are common for migrants working closer toassembly, and services. The predominance of construc- home, who may take off-farm jobs during the agricul-tion jobs is one reason men migrate more often than tural slack season and return home for the harvest or atwomen. In areas where light assembly jobs dominate, other times when they are needed. Migrants typicallyhowever, female workers may outnumber males by as return home after fewer than 200 days, and somemuch as seven to one. Joint ventures in Guangdong researchers have found evidence that workers migrateProvince that offer high-paying, relatively secure jobs for five to seven years, then stop (Rozelle and oth-prefer to hire women. This, and the increasing informa- ers 1997).tion available to women, may account for recentincreases in the proportion of female migrants (Rozelle Migration's impact on urban areasand others 1997).
In other countries educated people are the most Unlike most countries, China's development has pro-likely to migrate, but in China migrants tend to be nei- ceeded without pronounced urban overcrowding andther the best nor the worst educated in their home vil- degradation, thanks in part to policies that havelages. In the late 1980s most migrants had only an restricted migration. As a result Chinese citizens con-elementary school education, but by the mid-1990s sider urban areas to be more orderly and free of crimemost had completed middle school. Well-educated than rural areas, so any increase in urban crime isworkers tend to work in township and village enter- viewed with alarm-often out of proportion to theprises or to cultivate nonstaple crops, both of which threat it presents. Thus urban residents blame migrantsmay yield even higher incomes than migration (Hare for deteriorating living standards, mounting crimeand Zhao 1996). rates, and increasing unemployment.
Migrants tend to be poorer than the average ruralresident but, as noted, they generally are not from the Costs and benefitsranks of the absolute poor. Data show that in 1994the highest concentration of emigration from eighteen Certainly, migration has reduced the standard of livingprovinces in Sichuan came from counties with in cities. The transient population commits more thanincomes around the average for rural Sichuan and 30 percent of the crime in Beijing, 70 percent inslightly below the national poverty line. In 1995 a Shanghai, and 80 percent in Guangdong (FBIS 1996b).Ministry of Agriculture study surveyed four counties Migration may contribute indirectly to urban unem-with high migration rates in Anhui and Sichuan ployment because migrants compete for low-wage,provinces. The three that were officially designated low-status jobs, although most urban residents face lit-"poor counties" had the highest migration. Migrants tle risk of being displaced. And because migration
Annex 1 Migration and Inequality in China 55
swells the urban population, transport and services are The difference in income between urban and migrantincreasingly overcrowded and strained, and since many workers is due mainly to different occupational profiles.migrants escape the tax net, they do not contribute Migrant workers tend to fill low-wage jobs. More thantoward maintaining municipal infrastructure. 90 percent of the surveyed workers from Sichuan and
Nevertheless, cities with large migrant populations Anhui are employed in nonprofessional positions. Intend to thrive. Migrants contribute to a city's vitality by Shanghai more than 60 percent of migrant workers areproviding a low-wage workforce. And by increasing the employed in factories or in services in nonprofessionalvariety of products available to local residents, migrant- positions. Moreover, within a given occupation migrantowned businesses stimulate the urban economy (Wu workers tend to be paid less than permanent urbanand Li 1996). For example, in 1990 Dongguan, in workers. For example, a migrant textile worker inGuangdong Province, contained only 50 enterprises Shanghai makes an average of 500 yuan a month, whileand 5,000 residents. It is now home to 20,000 foreign- an officially registered urban textile worker in Shanghaiinvested enterprises and has a population of 500,000, makes 600 yuan a month (China Ministry ofof which more than 90 percent are migrants. Agriculture 1996a). Wage gaps between migrant andDongguan's economy has grown by 20 percent a year resident workers would be even wider except that 10since 1990, well above even Guangdong's high growth percent of Shanghai's migrant workers have technicalrates. and white-collar managerial positions that pay more
than 900 yuan a month.
Better off but far from equal State enterprises employ 65 percent of resident urbanworkers, and 85 percent of their remuneration com-
Migrant workers earn salaries that are many times prises employment benefits such as housing, medicalgreater than farming incomes in their home villages, care, education and daycare for children, maternityand migration reduces rural-urban income disparities benefits, vacation leave, pensions, food subsidies, andthrough remittances. But resident workers earn more compensation for job-related injuries. Few migrantmoney than migrants and have better employment ben- workers get jobs in state enterprises. For example, onlyefits. Furthermore, most migrants' access to services 14 percent of migrant workers from Anhui and Sichuandoes not improve and may even worsen when they relo- work for the state. As a result disparities and inequalitycate to the city, so the effect of migration on equality is between migrants and residents are even more pro-difficult to calculate. nounced than the data on wages suggest.
Migrant workers' consumption and savings are Employee benefits for migrants are both meager andhigher than those of their rural counterparts. But often of low quality. Employer-provided housing formigrant workers earn, consume, and save less than single migrant workers usually consists of dormitoriesurban resident workers. In 1995 the average wage of or makeshift arrangements in the workplace.migrant workers in Shanghai was 704 yuan a month, Restaurant workers may sleep in the back room, con-about four times the average rural income in source struction workers live in tent structures with no ameni-provinces that supply the Shanghai market. Migrant ties, and small traders often congregate in shacks andworkers consume a smaller share of their earnings (51 shanty towns on the outskirts of major cities.percent for migrants compared with 64 percent for res- Health and education benefits for migrants are alsoidents) and save a larger share than their Shanghai skeletal, and migrants are likely to incur high healthcounterparts. But in absolute terms, migrants' con- expenses for basic care because, while some companiessumption and savings are lower. Migrant workers from pay for treatment of job-related injuries, the compensa-Anhui and Sichuan provinces earn 1.64 yuan and 1.72 tion for migrants is far below that for regular workers.yuan an hour, compared with the national average wage Employers pay for neither routine care nor serious ill-of 2.23 yuan an hour (China Ministry of Agriculture nesses-a serious problem since migrants are much1996a and 1996b). Despite earning less than their more likely to live in crowded, unsanitary conditionsurban counterparts, migrants generally do not fall into that pose higher risks for communicable disease such asthe ranks of the urban pOOL tuberculosis.
56 Sharing Rising Incomes: Disparities in China

Children of migrants are not permitted to enroll in Migration's impact on rural areaspublic schools or are forced to pay much higher feesthan urban residents. National policy mandates that The benefits to rural households from migration arelocalities provide facilities for enrollment of all school- dramatic, particularly for poor households. All surveysage children. But this regulation is often interpreted of migrants have reported high levels of remittances.as applying only to permanent residents. To enroll, Migrants typically send home 20-50 percent of theirmigrant families often must pay fees that are up to income. A migrant from Sichuan earning 5,000 yuan aten times higher than those for children of urban year typically sends home almost 2,000 yuan, moreresidents. than twice the 1995 rural per capita income in Sichuan.
To address the lack of access to services, migrants in In Sichuan and Anhui migrant incomes account for ansome cities have grouped together into makeshift vil- average 20 percent of household income and 50 percentlages, formed according to province or county of origin. of household cash income. Households in poor regionsVillages provide migrants with a wide range of services, have a larger share of migrant income in total incomefrom shops to hospitals and schools. In Shenzhen than do households in wealthy regions.10,000 migrant children attend hut schools, minimal Migration clearly reduces income disparities andfacilities that fall below mandated national norms. At inequality between rural and urban households. Notone point local authorities closed the hut schools only does it provide more current and future income forbecause they failed inspection tests. rural households, it also reduces disparities in access to
Both income disparities and unequal access to ser- services such as health and education by providingvices are more pronounced when families migrate. resources to pay for such expenditures. In Anhui andSingle migrants can make do without full access to Sichuan remittances are used to construct homes, meethealth care, education, and housing, but for families daily living expenses, buy agricultural inputs such asthe impact can be devastating. And because migrant fertilizer, and accrue savings. About 90 percent of thefamilies tend to be large, income disparities between villagers surveyed who had built new homes in 1994urban residents and migrants increase with family were migrant families. Data on migration of themigration (FBIS 1996b). Family migration is low in absolute poor show that these families spend mostChina-Ministry of Agriculture data show that only remitted funds on productive inputs, daily necessities,6.6 percent of migrants bring families and less than 1 livestock, education, and housing. In the poorest house-percent succeed in changing to an urban hukou. But holds migration income brings families out of a graineven a small percentage can have a large effect on deficit.urban areas. For example, in Shanghai it is estimated By raising the incomes of the rural poor, migration isthat 100,000 of the city's 2.6 million migrants have reducing income disparities between the richest andmoved their families into the city, increasing the popu- poorest rural areas. Within these areas, however, migra-lation by more than 320,000. Municipal officials say tion appears to increase income disparities, especially inthat nearly all these families are poor (South China poor regions. More people migrate out of poor areas,Morning Post, 5 May 1997). but the absolute poor tend to stay behind (China
Of course, in many ways the services available to Ministry of Agriculture 1996b).migrants are no worse than what is available in rural When families migrate, the beneficial effect of migra-areas, particularly for migrants from very poor com- tion on urban-rural income disparities is diluted.munities. There is no rural pension scheme in China. Migrants send back much less in remittances to familyMost rural Chinese now pay directly for health services, members remaining in rural areas once they are joinedand catastrophic illnesses can easily impoverish even by their immediate family.middle-income rural residents. And rich migrants can The effect migration has on rural communities andafford more sophisticated care than is available in rural the rural economy (beyond the household level) isareas. Migrants face much higher education costs than unclear. The migration of young, well-educated malesin their home village, but if they can afford them the could easily cause agricultural productivity and grainquality is higher in cities. production to suffer. But many surveys have found a
Annex 1 Migration and Inequality in China 57

positive correlation between grain production (in both Migration has had positive effects on both ruralabsolute and per capita terms) and migration. Of and urban economies. Evidence does not indicate thatcourse, as surplus labor leaves rural areas, productivity migration has a negative effect on agricultural pro-would be expected to increase. But it also seems that ductivity, and it is stimulating the rural economy inagricultural experience contributes more to productiv- many ways. While migration's effect on urban infra-ity than does education (after completion of three years structure, congestion, crime, and other problems isof elementary school). With higher migration rates for clearly negative, in many ways these negative effectsmen, women's agricultural work has tended to increase, are outweighed by the positive contributionsalbeit with large regional variations. The effect of this migrants make to urban economies.phenomenon on productivity has not been widely stud- Certainly, Chinese policymakers could take stepsied. Many observers have noted that men who are to maximize the benefits of migration while helpingneeded for farm work tend to migrate short distances groups and localities adjust to the negative effects.and for jobs that allow them to return in time for the The poverty alleviation impact of migration has beenharvest. strong, but modifying current policies could heighten
Migration appears to bring other benefits to the rural this impact. For example, it appears that informationeconomy, including increased diversification and networks are a strong determinant of migration andgrowth in off-farm employment and self-employment. that they often miss the poorest areas. The ChineseMigrant families tend to engage in more nonagricul- government could increase opportunities for atural activities, and counties with a long tradition of broader range of citizens to migrate by strengtheningmigration appear to have more nonagricultural indus- these networks. County labor bureaus are a naturaltries. Village leaders say that rising migration has stim- source of information about migration opportunities,ulated the expansion of the self-employed sector, but the extent to which they supply this informationbecause remittances increase the demand for services. varies both across and within provinces.But within agriculture, nonmigrant households invest Strengthening information networks wouldmore, earn more, and engage in a more diverse range of increase migration opportunities for most of China'sactivities. Whether migrants return to rural areas will, near poor. But the absolute poor face greater obstaclesof course, determine the long-term effect of migration than information. Lack of a basic education and aon the rural economy. While more than 80 percent of weak command of Mandarin (for members of minor-surveyed migrants say that they plan to return, data on ity groups) make it more difficult for this group toreturnees are sparse (China Ministry of Agriculture migrate and make them more vulnerable to abuse.1996b; Rozelle and others 1997). Nevertheless, migration is a powerful means for help-
ing the absolute poor. And because this group tends to
Conclusion live in China's most remote, resource-poor areas,other means of improving their livelihood are often
Migration has reduced rural-urban income disparities unavailable. Experiments by the government and theat both the individual and household levels. World Bank to help the poorest migrate safely areMigration also has lowered inequality (access to ser- promising and should be replicated.vices), except in cases where families migrate. The Carrying through with urban reforms would botheffect on disparities within rural areas is less clear-cut. lower the cost of migration and mitigate some of theMigration appears to reduce income disparities negative impacts. Reforming housing, pension, andwithin rural areas and lower inequality between rich health finance so that migrants and nonmigrants payand poor regions. But within regions, and particularly the same rates for these services would reduce inequal-within poor regions, migration may increase income ity. Housing reforms would help prevent migrants fromdisparities and inequality. Migration has increased forming slum communities. Increasing access to healthincome disparities and inequality within urban areas, care would reduce the incidence of communicable dis-and the effect is much more pronounced when fami- ease. Of course, these reforms would increase the ten-lies migrate. dency for families to migrate. Consequently, the
58 Sharing Rising Incomes: Disparities in China
education system would need to be funded to accom- migrants to apply for "blue" hukous (which givemodate growing numbers of students. them temporary right of residence), should be accel-
The hukou system has dampened migration, par- erated. Streamlining the permit process by allowingticularly family migration. The impact on individual migrants to receive all necessary permits from onemigration is much less severe. Experiments with mak- source would reduce the costs and hardships migrantsing the system more flexible, such as allowing bear.
Annex 1 Migration and Inequality in China 59


I~~~~~~~~~~~~~~~~~~~~~~~~~~~I
Survey of Literatureon Inequality, IncomeDistribution, and
M4igration in China
Source Summary Abstract
Khan, A.R., and Describes rural, * Widens definition of income toothers. 1993. urban, and include all disposable income (for"Household national income example, payments in kind andIncome and Its inequalities in agricultural output for self-Distribution in 1988 and consumption), making true perChina." In Keith identifies capita income in rural areas 39 per-Griffin and Zhao contributing cent higher and in urban areas 55Renwei, eds., The factors. percent higher than State StatisticalDistribution of Bureau estimates. This adjustmentIncome in China. implies that the urban bias of non-New York: cash income raises rural-urbanSt. Martin's Press. inequality and that household and
national income are significantlyunderestimated.
* Gini coefficients: rural inequality(Gini coefficient of 0.34) is signifi-cantly higher than urban inequality(0.23); total inequality (0.38) is
-/ -;higher than both rural and urbaninequality because of large urban-rural inequality.
* National inequality: the mostimportant sources of income inequal-ity are urban wages and in-kind sub-sidies to urban workers (especially
61
a~~~~ Af:
Source Summary Abstract
housing subsidies), which are distributed relatively equallyamong the recipients but overall accrue to relatively rich urbanworkers, thus contributing 36 percent and 32 percent tonational income inequality, respectively.
* Rural income inequality: the most important factor explainingincome inequality is the difference in income from productionactivities, which accounts for almost 75 percent of income andexplains more than 60 percent of rural income inequality. Thedifference in wage income is also a significant contributor torural inequality.
* Urban income inequality: the two most important factors,wage inequality and differences in housing subsidies, con-tribute 34 percent and 24 percent, respectively, to urbaninequality. Urban bias and regressive taxes and subsidiesreduce rural incomes by 4 percent and raise urban income by39 percent. If the benefits of subsidies and burden of taxes wereneutral, rural incomes would be 23.5 percent higher and urbanincomes would be 30.9 percent lower, and the rural-urbanincome ratio would increase from 41 percent to 74 percent.
One weakness of this study is its interpretation of the con-tributing factors as "disequalizing" and "equalizing," ratherthan defining the effect of the factors depending on their over-all contribution to inequality.
Renwei, Zhao. "Three China's reforms have resulted in a dualistic system that has threeFeatures of the main characteristics:Distribution of Income * The coexistence of a regulated state sector with relatively lowduring the Transition levels of income inequality (Gini coefficient of 0.23) and ato Reform." In Keith market-oriented sector characterized by high levels of incomeGriffin and Zhao inequality (Gini of 0.49).Renwei, eds., The * Distinct time dynamics: during 1978-84 inequality declined asDistribution of the rural-urban income ratio rose from 42 percent to 54 per-Income in China. cent, mainly because rural markets were opened, the communeNew York: system was dissolved, and rural (agricultural) terms of tradeSt. Martin's Press. improved. During 1984-90 rural-urban income inequality
increased because of declining productivity growth in agricul-ture, price and enterprise reforms in urban areas, and a declinein the rural terms of trade.
* Urban nonwage payments rose rapidly after reforms wereintroduced. They now make up 30 percent of urban incomeand have a strongly disequalizing effect.
* Recommends reducing inequality by deepening reforms andreducing nonwage sources of income to improve efficiency andincentives.
62 Sharing Rising Incomes: Disparities in China

Source Summary Abstract
Khan, A. R. Describes rural income * 74 percent of rural income comes from farm and nonfarm pro-
"The Determinants of inequalities and duction activities; only 9 percent comes from wages and
Household Income in identifies contributing salaries.
Rural China." In Keith factors. * Households that are located in privileged provinces have a
Griffin and Zhao higher stock of human capital (in terms of education), produce
Renwei, eds., The for the market rather than for self-consumption, are
Distribution of focused on nonfarm activities, and receive more income fromIncome in China. production activities.
New York: * Variation in income among provinces is the most importantSt. Martin's Press. factor explaining interregional differences.
* An important source of rural income inequality results from
wage employment, which is highly unequal (62 percent goes to
the top 10 percent and 10 percent goes to the bottom 20 per-
cent). Thus most rural income accrues to a small, privilegedminority that lives in privileged regions, often close to urban
centers, is likely to be a member of the Communist Party, and
does not have a higher stock of human capital.
McKinley, Terry. 1996 * Wealth (Gini coefficient of 0.31) is distributed more equally
The Distribution of than income (Gini of 0.34) in rural China.Wealth in Rural China. * Land accounts for 59 percent of rural wealth and housing,New York: M.E. Sharpe. for 31 percent.
* Land is distributed relatively equally (Gini coefficient of 0.31).Housing (Gini of 0.49) and other productive assets, such as
financial assets, are not.- These characteristics are highly atypical for a developing coun-
try: in China the main source of rural income inequality iswage income rather than the return to assets such as land.
Riskin, Carl. Analyzes rural poverty Using official Chinese conception of poverty plus adjustments for"Income Distribution in China. regional differences in price levels, finds that:
and Poverty in Rural * 105 million (12.7 percent) Chinese were below poverty line of
China." In Keith 333 yuan in 1988.Griffin and Zhao * Most poor people (64.5 percent) are not located in designated
Renwei, eds., The poverty regions.Distribution of * Econometric analysis shows that the most powerful policyIncome in China. measures to address poverty in China are an increase in ruralNew York: wage employment, an improvement of irrigation and drainageSt. Martin's Press. facilities in disadvantaged rural areas, and investment in
human capital.
Annex 2 Survey of Literature on Inequality, Income Distribution, and Migration in China 63

Source Summary Abstract
Knight, John and Describes inequalities * In 1988 rural industries (township, village, and private enter-Song Lina. arising from rural wage prises) employed 96 million people, or 24 percent of the rural"Workers in China's employment. labor force, and between 1978 and 1988 absorbed 62 percentRural Industries." of new entrants into the labor force.In Keith * Wage employment strongly exacerbates rural income inequal-Griffin and Zhao ities because it benefits mainly the rich: richest 30 percent ofRenwei, eds., The rural population receives 84 percent of wage income.Distribution of * Most rural enterprises are concentrated in richer and suburbanIncome in China. rural areas.New York: * Wage employment biased in favor of the educated, men, andSt. Martin's Press. members of the Communist Party.
Knight, John and Describes inequalities * Urban wage distribution is highly equitable (Gini coefficient ofSong Lina. arising from urban 0.20), mainly because of administrative decisions rather than"Why Urban Wages wage employment. market forces.Differ in China." * Main disequalizing factor is noncash payments, such as hous-In Keith ing and other services provided by enterprises and authorities,Griffin and Zhao although urban income inequality is relatively equal for aRenwei, eds., The developing country and more equal than rural incomeDistribution of distribution.Income in China. * Returns to education are low, even in the private sector.New York: Discrimination exists on basis of sex and Communist partySt. Martin's Press. membership.
* One striking factor of labor market is its high degree of jobsecurity, with job tenure basically guaranteed for life.
Knight, John and Analyzes distribution * Broad distribution and relatively equitable access to education,Li Shi. of education among with a focus on primary and secondary education."The Determinants Chinese population. * Limited supply of and access to higher education.of Educational * Women have 2.3 years less education than men.Attainment." In Keith * Large urban-rural gap in educational attainment: urban peo-Griffin and Zhao ple receive an average of 9.6 years of education-about 4.1Renwei, eds., The years more than rural people.Distribution of * The strong link between provincial income and education lev-Income in China. els in rural areas exacerbates education inequalities becauseNew York: rural areas generally have lower income levels.St. Martin's Press.
Hussain, Athar, * Income inequality in urban areas (Gini coefficients inPeter Lanjouw, and 0.19-0.22 range) is lower than in rural provinces (Gini ofNicholas Stern. 1994. 0.19-0.28)."Income Inequalities * Income inequalities at national level mainly result fromin China: Evidence intraprovincial inequalities.from Household * Rural income: although farming income is the largest compo-Survey Data." nent of total income, nonfarming income is the largestWorld Development contributor to inequality.22(12): 1947-57. * Urban income: wage income accounts for more than half of
total income, but bonuses and irregular income (second jobs,
64 Sharing Rising Incomes: Disparities in China

Source Summary Abstract
commercial activities, hardship allowances) explain mosturban inequality.
* Authors conclude that with reforms and the move to marketthose components of income will rise most that contributemost to income inequalities-nonfarming activities and irreg-ular income. There are, however, no empirical facts for thisclaim.
Study excludes floating population of migrants and uses a nar-row definition of income that ignores noncash income. Studyargues that excluding migrants does not necessarily cause adownward bias because, although migrants have low-paidjobs, their families are mostly in rural areas, so their per capitaincome is not necessarily low. However, there is no empiricalevidence for this claim.
Howes, Stephen, and Analyzes changes in and * Rural output inequality rose during 1985-9 1; the main sourceAthar Hussain. 1994. components of regional was the rapid growth of the nonagricultural output of town-"Regional Growth output inequalities. ship and village enterprises.and Inequality in Uses State Statistical * Gini coefficient for total output per capita rose from 0.244 inRural China." Bureau county-level 1985 to 0.335 in 1991 as a result of three main factors:London School output data for most 1. Net output increased by 6.4 percent a year, or 45 percentof Economics. of the 2,364 counties during 1985-91; nonagricultural output grew by 13 percent
for 1985-91; broadest a year compared with agricultural output growth of 1.3definition of rural is percent a year.used, classifying 80 2. Gini coefficient for nonagricultural output (0.56 in 1991)percent of the popula- was far higher than for agricultural output (0.23 in 1991).tion as rural; uses 3. The low rise in the Gini coefficient for nonagricultural out-constant 1980 con- put implies that township and village enterprise growth is notsumer price index data. focused entirely on rich, eastern counties.
The resulting contributions to the increase in overall outputinequality are 11 percent for the increase in the Gini coefficientfor nonagricultural output, 33 percent for the Gini coefficient foragricultural output, and 55 percent for the increase in the shareof nonagricultural output.* Study disagrees with World Bank (1992) finding that poverty
reduction stagnated or even reversed during late 1980s, andargues that output for almost all counties (except the poorest5 percent) rose during 1985-90 and thus that poverty has con-tinued to decline.
It should be noted that output data and household data (such asthose used in World Bank 1992) draw very different pictures.Output data estimates are higher due to the inclusion of retainedrural output (for example, for enterprise consumption andinvestment, which does not go to households as income), thebroader definition of rural areas (which includes towns whereincome and output per capita is generally higher), and
Annex 2 Survey of Literature on Inequality, Income Distribution, and Migration in China 65

Source Summary Abstract
measurement errors in data. The central question is how muchretained rural output accrues to households in the formof, say, housing and social security benefits provided byworkers' enterprises (noncash income) and how muchis invested or consumed by enterprises without immediatelybenefiting workers. The actual figure is most likelybetween the two data estimates.
World Bank. 1995. * Disparities in output and especially consumption per capita
"China: Regional between coastal and interior regions have increased since 1978Disparities." and especially since 1985.Report 14496-CHA. * Rural inequalities are larger than urban inequalities.
* Disparities mainly result from competitive advantages of
coastal areas stemming from advantages in transport, commu-nications, and trade, which were exacerbated by market-oriented reforms since 1978, by policies that encourage eco-
nomic activities in coastal regions (international commercialpolicies, fiscal and enterprise reforms, pilot programs) andattempt to curb migration flows, and by the lack of fiscalredistribution.
e Regional social indicators (mortality rates, educational attain-ment, illiteracy) are broadly correlated with regional dispari-ties in output and per capita income and consumption.
- Based on findings for Henan and Sichuan, intraregional dis-parities are greater than interregional disparities.
* Official data underestimate the size of the floating populationliving in richer coastal provinces, causing an overestimate ofregional disparities. The floating population is likely to bearound 10 percent of the coastal population; poverty is likelyto be the most important force driving migration.
* Study stresses the need to anticipate and manage migrationflows as well as the need to reduce incentives for migration andits negative side effects by eliminating the urban bias ofpolicies.
* Study provides interesting discussion of data quality andrelated difficulties with analyzing disparities in China(appendix 2).
Jian, Tianlun, Analyzes convergence * Study finds evidence for weak convergence for 1952-65,Jeffrey Sachs, and and divergence trends in strong divergence for 1965-78, convergence for 1978-90, andAndrew Warner. 1996. GDP per capita among divergence since 1990."Trends in Regional provinces and explains * The two convergence measures are cT-convergence (standardInequality in China." trends. Uses official deviation across regions of log real GDP per capita) and j3-NBER Working Paper Chinese data for 1952- convergence (growth in per capita GDP relative to initial per5412. National Bureau 93 for twenty-eight of capita GDP).of Economic Research, thirty provinces using * Initial convergence (1978-85) occurred mainly because ofCambridge, Mass. provincial price rapid growth in rural areas resulting form reforms. Later con-
deflators. vergence (1985-90) occurred mainly because of continued
66 Sharing Rising Incomes: Disparities in China
Source Summary Abstract
growth in rural areas, especially areas near open coastal cities.Divergence since 1990 mainly due to rapid growth of coastal,urban areas, which grew by an average 7.4 percent a year fasterthan others.
* Important finding that overall convergence during 1978-90was mainly due to convergence among coastal provinces,while variance between coastal and interior regions remainedconstant in 1978-90 and then widened dramatically after1990.
* Study summarizes migration policies since 1950s and broadmarket reforms.
* Predicts continued divergence; study points out that both laborand capital are flowing into richer, urban, coastal areas ratherthan poorer, rural, interior provinces.
One of the study's weaknesses is that it excludes the floating pop-ulation of 100-150 million people due to lack of data. Thus esti-mates are likely to be biased upward since actual GDP per capitais likely to be higher in rural areas and lower in urban areas (espe-cially coastal provinces).
Yong, H.E., and Criticizes official income Argues that income inequality derives not only from marketJean-Christophe Simon. measures that ignore forces but also from corruption, rent seeking, distortions cre-1995. "La distribution other sources of income, ated through the dual price system and its biased tax/subsidydes revenus dans la such as corruption, rent system (for example, social benefits and unequal treatment intransition economique seeking, and so on. the privatization of housing), and so on.de la Chine." * Discusses shortcomings of official data that exclude these
sources of income inequalities and thus are likely to underesti-mate true disparities.
* Mentions individual cases of government distortions andcorruption.
Ying, Yvonne. 1995. Uses State Statistical * Makes similar points to above studies: income inequality and"Income, Poverty and Bureau data: China poverty fell between 1978 and 1984 and then stagnated orInequality in China Statistical Yearbook rose.during Transition." and Survey of Income * Summarizes agricultural policies since 1978 (householdResearch Paper 10. and Expenditure of responsibility system and price policies).World Bank, Urban Households in * Analyzes rural terms of trade: rise in agricultural prices duringWashington, D.C. China. 1978-84 and then stagnation, mainly due to policy reforms;
strong increase in fertilizer and pesticide prices since the late1980s; strong rise in nonfarming output and income since themid-1980s.
* Concludes that urban inequality has stagnated since 1985:paper includes quantitative analysis which shows that the elim-ination or reduction of food subsidies caused urban inequalitiesto rise, while full employment policies and state enterprises'basic wage equalization eased income disparities somewhat.
Annex 2 Survey of Literature on Inequality, Income Distribution, and Migration in China 67
Source Summary Abstract
* Analyzing rural terms of trade has important implications forpoverty analysis: it is not gross income that is most relevant,but disposable income (that is, prices) that are important-especially production costs (such as pesticide and fertilizercosts).
Deininger, Klaus, and Using more comprehensive data, the authors yield interestingLyn Squire. 1996. findings:"New Ways of Looking * Initial inequality of assets (measured by land distribution) isat Old Issues: Inequality more significant than income inequality in affecting subse-and Growth." quent growth.World Bank, Policy * Kuznets curve hypothesis does not hold for many countries:Research Department, the most important factors affecting changes in inequality areWashington, D.C. policy-related and do not necessarily depend on a country's
degree of development.
Guang Hua Wan. 1995. Describes rural migra- * In 1986, 37 percent of sample population were migrants. Of"Peasant Flood in tion and migrant charac- these, about 60 percent were intramigrants (moving withinChina: Internal teristics for 1986. Uses townships) and 40 percent were emigrants.Migration and Its 1986 village survey for * Only 4 percent of emigrants moved to big cities (that is, mostPolicy Determinants." 230 villages in eleven emigrants moved to other rural areas).Third World Quarterly regions (undertaken by * Most migrants shifted into construction (23 percent) and16 (2). the Chinese Academy industrial (34 percent) activities; less than 3 percent moved
of Social Sciences). into agriculture.* Overall, migrants were not more educated: education deterred
emigration but encouraged in-migration. The reason, accord-ing to the author, is that there is significant demand for less-skilled workers in rural towns and cities, while there is a sig-nificant demand for skilled and educated people in rural areasbecause of reforms.
* Migration to urban areas is more likely to be seasonal, whilemigration to rural areas tends to be permanent.
* Explanations: Urban reforms lagged behind rural reforms untilmid-1980s, thus reducing the rural-urban gap in terms ofincome. Study argues that the dismantling of the communesystem and the rapid growth of township, family, and cooper-ative enterprises explain a large share of intramigration flows.Study claims that the low share of rural-urban migration, itsseasonal character, and the low female share of migrants ismost likely explained by the lack or poor quality of social ser-vices for migrants in nonrural areas.
* Policy recommendations: Government should providemigrants with social services in order to ease problems relatedto short-term migration (especially concerning infrastructure).It also should encourage urban-rural migration and lessenpotential future pressure for rural-urban migration, and thusreduce the rural-urban gap, by eliminating privileges to urban
68 Sharing Rising Incomes: Disparities in China
Source Summary Abstract
residents (housing, education, health, and so on); reducingland fragmentation, which impedes agricultural productivitygrowth; and promoting rural urbanization to create jobs andreduce rural surplus labor.
The study is for 1986; thus the dynamic of migration may havechanged dramatically since then because the rural-urban gap haswidened significantly and reforms in rural areas have sloweddown. The study's finding of a negative relation between educa-tion and migration is questionable, and the finding that there is aflow of educated people from urban to rural areas is surprising.The survey's small sample may mean that villages in the sampleare not representative, and there are a number of potentialsources of measurement errors (for example, many permanentemigrants may not be included in study).
Li Debin. 1994. Describe characteristics * Floating population defined as mainly legal migrants-that is,"The Characteristics of and size of floating those with permits or those who commute on a daily basis.and Reasons for the population using official This definition excludes/ignores those who migrate illegally.Floating Population in State Statistical Bureau * In 1985 floating population was less than 10 million; in 1989Contemporary China." data for 1980-93. it was 60-80 million.Social Sciences in China * Most members of the floating population are farmers or agri-(winter): 65-72. cultural workers who leave rural areas for urban areas to find
nonagricultural jobs.Morf, Urs. 1994. * Causes of growth in floating population: increasing land frag-"The Threat of Mass mentation, growing population, and decline of cultivable landMigration in China." has created large surplus labor (about 200 million people inSwiss Review of World late 1980s); rapid growth of township and village enterprisesAffairs (April). and other private companies offer economic opportunities for
workers; rapid growth of cities and attraction of cities for ruralworkers in terms of employment and living conditions; andpolicy biases favoring cities and special economic zones.
* One of the studies argues that the slowdown in agriculturalproductivity growth can be partly explained by the migrationflow of the most capable persons (that is, young men) fromagricultural to nonagricultural jobs, leaving cultivation of theland to parents and other family members.
Sahota, Gian S. 1968. Determines migrant * Develops a simple (and somewhat incomplete) model that"An Economic Analysis characteristics and iden- defines migration as a function of average incomes withinof Internal Migration tifies migration flows regions and education levels, population densities, geographicin Brazil." Journal of among regions; uses distances, and income dispersions across regions.Political Economy household survey data * Provides interesting discussion of methodological issues; uses218-45. (population census) simultaneous equation model.
for 1960. * Basic findings are that migration is larger when education ishigher in the destination area and lower in the origin area,although the effects are not large; that the earnings differentialbetween origin and destination is the most relevant variable;
Annex 2 Survey of Literature on Inequality, Income Distribution, and Migration in China 69

Source Summary Abstract
that younger people are more sensitive to earnings differentialsand thus are more likely to migrate; that urbanization andindustrialization in the destination area are significant "pull"factors; that population density at destination was highly sig-nificant; and that income inequality was not important.
Weaknesses: data refer only to a single year, people are consid-ered migrants if they were born in a region other than their cur-rent location (even if they migrated many years ago and their cur-rent characteristics were acquired at that destination), andincome data are highly aggregated.
Todaro, Michael P. * Excellent book on migration; compares approaches to migra-1976. Internal tion (chapter 3), analyzes econometric approaches (chapter 4),Migration in and summarizes quantitative studies (chapter 5).Developing Countries. * Chapter 3 outlines and makes important additions to theGeneva: International Harris-Todaro model.Labour Organization.
Russel, Sharon Stanton. Reviews determinants * Summarizes determinants and effects of remittances (especially1986. "Remittances and effects of remit- tables 1 and 2 and figure 1).from International tances from interna- * Volume of remittances is large for many countries, totaledMigration: A Review in tional migration. more than $23 billion in early 1980s.Perspective." World * Shows that most studies have found that remittances are usedDevelopment 14(6): mainly for consumption and little for investment or saving.677-96. This pattern need not be unproductive, however, if remittances
raise labor productivity.* Cites other studies that found equalizing effect of remittances
and income distribution (in Mexico and Pakistan, forexample).
Stark, Oded, J. Edward Uses alternative Gini * Finds that remittances from international migration to theTaylor, and Shlomo indexes to show that the United States reduce inequality. The effect of remittancesYitzhaki. 1986. effect remittances have from internal migration on inequality is ambiguous."Migration, on inequality crucially * Analyzes the effect of using different weights in Gini index onRemittances and depends on weight given inequality measure: stronger weight for poor householdsInequality: A Sensitivity in index to income of makes the effect of international remittances on inequality sig-Analysis Using the different groups. Uses nificantly less favorable.Extended Gini Index." village-level data for * Points out that low migration among the poor is mainly due toDiscussion Paper 23. two Mexican villages lack of resources to afford the journey.Harvard University near the U.S.-MexicanMigration and border.Development Program,Cambidge, Mass.
70 Sharing Rising Incomes: Disparities in China

Source Summary Abstract
Lipton, Michael. 1980. Provides an overview of * Provides broad but sometimes confusing and contradictory"Migration from Rural the conceptual links review of conceptual links and empirical findings of migrationAreas of Poor Countries: between migration, effects.The Impact on Rural rural productivity, and * Argues that emigration's effect on productivity can be ambigu-Productivity and Income income inequality in ous and depends on the response of the rural population toDistribution." rural areas. out-migration and the inflow of remittances.World Development * Argues that emigration has a disequalizing effect-that is, it8: 1-24. increases intra- and interrural inequalities, as well as rural-
urban inequalities, for three reasons:1. Migrant characteristics: most are young, male, and from
poor or well-off households. Better-off, educated migrantsreceive higher payoffs from migration due to superior infor-mation, transferable skills, better networks, and better abilityto pay for the initial costs of migration. Less-skilled householdsoften lose productive family members without necessarilyreceiving significant returns, resulting in higher intraruralinequality. Villages near cities and rapidly growing areas ben-efit the most from migration, and migration from these areasis more likely and more profitable, resulting in higher inter-rural disparities.
2. Remittances: study argues that remittances mainly accrueto better-off families because they have a significant number ofmigrants with superior payoffs; that remittances are mainlyused for purposes that do not benefit the poor; and that thereis little evidence that remittances have a "trickle-down"effect.
3. Return migration: better-off people who have made accom-plishments during emigration or have acquired skills that areuseful in rural areas are the most likely to return; thus returnmigration tends to worsen both intra- and interruraldisparities.
Adams, Richard H. Analyze effect remit- * Studies compare predicted household income without migra-1992. "The Effects of tances from internal and tion with real household income with remittances from migra-Migration and international migration tion. The studies find that having an internal migrant withinRemittances on have on rural income the household raises predicted household income by $6 a yearInequality in Rural inequality. while having an international migrant raises it by $25 a yearPakistan." The Pakistan (data are from Pakistan).Development Review * Remittances have a somewhat disequalizing effect on income31 (winter): 1189-1206. inequality in four rural regions in Pakistan.
* Reasons for neutral/disequalizing effects: migrants are mostlyfrom rich or poor families, and volume of remittances is largerfor richer households.
Annex 2 Survey of Literature on Inequality, Income Distribution, and Migration in China 71

Source Summary Abstract
Adams, Richard H. Data sets focus on a small and not representative sample of rural1989. "Worker areas, studies ignore second- and third-order effects of remit-Remittances and tances, and other studies find a more disequalizing effect ofInequality in Rural remittances in Pakistan because they use different data and a bet-Egypt." Economic ter methodology.Development andCultural Change 38:45-71.
Mohtadi, Hamid. 1990. Analyzes contribution * Concludes that rural push factors were the main cause of heavy"Rural Inequality and of urban pull and rural migration flows; specifically, the land reform of the period,Rural-Push versus push factors to rural- which generated large inequalities by transforming a homoge-Urban-Pull Migration: urban migration neous society into two groups of landowners and landlessThe Case of Iran, between 1956 and 1976. wage laborers.1956-76." World * Confirms Lipton's (1980; see above) hypothesis that migrationDevelopment 18(6): of the poor is mainly caused by rural push factors (either insti-837-44. tutional factors, such as land distribution, or Malthusian fac-
tors), whereas rural-urban migration of richer, land-owningfamily members is mainly explained by urban pull factors(such as employment opportunities and higher wages andreturns to education and skills in cities; an important pull fac-tor was the oil boom of the late 1960s and the 1970s in Iran).
One weakness of this study is that it uses a narrow definition ofpull and push factors-employment and wage levels in originand destination locations.
Mohtadi, Hamid. 1986. Analyzes effect rural- * Urban inequality increased in areas where a majority of"Rural Stratification, urban migration had migrants came from landless groups. Urban inequalityRural to Urban on urban inequality in decreased in areas where most migrants belonged to land-Migration, and Urban Iran between 1956 and owning groups and families.Inequality: Evidence 1976. * The main explanation for this finding is that the land-owningfrom Iran." World class has better education, kinship, and other essentialDevelopment 14(6): resources (such as savings) to acquire better-paid jobs, usually713-25. in the formal sector, while landless groups usually had more
trouble finding jobs and generally started off with informal sec-tor jobs.
One weakness of this study is that it measures inequality not asincome inequality but uses the distribution of urban housing as aproxy for inequality.
72 Sharing Rising Incomes: Disparities in China

Source Summary Abstract
Goldstein, Sidney, and Review studies of inter- * Review population policies and migration policies since 1949,Alice Goldstein. 1990. nal migration in China emphasizing official policies as the driving force behind popu-"China." In Charles B. between 1949 and early lation movements.Nam and others, eds., 1980s. * Compare surveys and studies on migration in China prior toInternational Handbook 1980. Most of these studies are based on official Chinese data,on Internal Migration. which strongly underestimate the true number of migrants. For
example, official urban surveys estimate that there were just 10Goldstein, Sidney, and million migrants in 1982; this number ignores the many tem-Alice Goldstein. 1985. porary migrants who do not show up in official studies."Population Mobility * Describe administrative procedures and enforcement difficul-in the People's Republic ties of migration.of China." Paper 95.East-West PopulationInstitute, Honolulu.
Kam Wing Chan. 1994. Reviews the literature on * Compares empirical studies and finds major problems con-"Urbanization and migration and urbaniz- cerning the definition of "urban": estimates of urban popula-Rural-Urban Migration ation in China prior to tion for 1990 vary between 18.5 percent and 52.9 percent.in China since 1982: 1992. * Urban in-migration accounted for about three-quarters ofA New Baseline." urban population growth in 1980s. In-migration peaked inModern China 20(3): 1987-88, then declined, then increased again in 1991-92.243-81. * About 65 percent of floating population made up of temporary
migrants.* Another reason for rapid increase in size of urban population
is reclassification of areas-that is, many regions were rede-fined as urban, increasing the relative and absolute size of theurban population.
Li, Wan Lang. 1992. * Argues that migration flow in 1980s was much smaller than in"Migration, 1950s and 1960s.Urbanization and * Argues that the main reasons for migration in the 1980s wereRegional Development: family-related rather than job-related.
Toward a State Theory One weakness of the study is that its argument is based on offi-of Urban Growth inMainland China." cial data, which exclude many migrants (especially temporaryIssues and Studies migrants).(February): 84-102.
Goldstein, Sidney. 1990. Explains urbanization * Focuses on effects of urban reclassification and migration."Urbanization in China, trends and analyzes * Argues that the main factor behind strong growth in urban1982-87: Effects of factors contributing to population was reclassification of urban areas in 1984, whichMigration and urbanization in China reduced minimum population requirements and extended cityReclassification." for 1982-87; uses 1982 and town boundaries to include adjoining areas and counties.Population and census and 1987 national - Reclassification, rather than migration, accounts for most ofDevelopment Review survey to analyze urban- the dramatic increase in the labor force in towns (labor force16 (4): 673-701. ization and 1986 national grew by 231 percent) and cities (labor force grew by 33
migration survey to ana- percent).lyze internal migration. * Official data (1987 survey) identify only about 30 million
Annex 2 Survey of Literature on Inequality, Income Distribution, and Migration in China 73
Source Summary Abstract
migrants-that is, permanent migrants and migrants with per-mits. Thus it underestimates the true size and impact of migra-tion by excluding most temporary and illegal migrants.
* Most migration flows were intraprovincial (80 percent) ratherthan interprovincial (20 percent).
* Most of the migrants included in the study were young andwere moving to cities and especially to towns for nonagricul-tural jobs.
Yang, Xiushi, and Study based on official * Finds evidence that migration in Zhejiang is mainly from ruralSidney Goldstein. 1990. Chinese migration data to urban areas, is especially strong within the region (rather"Population Movement for the region of than interregional), is mostly temporary, and is mostly better-in Zhejiang Province, Zhejiang. educated people who migrate from rural to urban areas.China: The Impact of * Argues that government authorities allow temporary migra-Government Policies." tion flows but prohibit permanent migration in order to reduceInternational Migration rural surplus labor, avoid excessive strain on urban infrastruc-Review 23 (3). ture (because temporary migrants are not entitled to use all
urban infrastructure and social services), and avoid havingpeople leave rural areas and give up their land (thus reducingrural output and efficiency), and because temporary migrationflows are possibly reversible, while permanent migrationis not.
a Urges the government to pay more attention to temporarymigration because it strains urban infrastructure and leads tofundamental social and economic changes.
Bramall, Chris, and Uses State Statistical * Compares the two data sources and finds that changes inMarion E. Jones. 1993. Bureau data and inequality in the official data are severely underestimated and"Rural Income 1984-85 data from the that the true increase in inequality since 1978 has been farInequality in China Rural Policy Research larger.since 1978." The Unit of the State * The alternative data source estimates a rural Gini coefficient ofJournal of Peasant Council. 0.40 in 1984-far higher than the official data.Studies 21(1): 41-70. * The alternative data source finds that the rise in rural inequal-
ity mainly results from an increase in income inequality in thenonfarm sector. Moreover, rapid industrialization and unequalregional growth have resulted in higher interregionalinequality.
* Argues that migration is likely to exacerbate these inequalitiesbecause the experiences of other countries show that migrantsare usually young and better skilled, hence worsening rural-urban disparities.
One problem with this study is that it does not provide quantita-tive estimates of which factors have contributed to rising inequal-ities and by how much. Moreover, the claim that migration islikely to worsen rural-urban inequalities is not based on concreteevidence but rather on evidence from other countries, such asBrazil.
74 Sharing Rising Incomes: Disparities in China
Source Summary Abstract
McKinley, Terry, and Uses data from a 1988 * In 1988 rural land was distributed relatively equally in China.Keith Griffin. 1993. nationwide survey Moreover, the value of the land was highly equal by interna-"The Distribution of on landholdings of tional standards.Land in Rural China." about 10,000 rural * Equal land distribution and land value has a minor effect onThe Journal of Peasant households. income inequalities because land has become an increasinglyStudies 21(1): 71-84. less important source of income.
* The study also examines the effect of land leasing but finds thatit has a very little disequalizing effect on rural incomes.
Cornia, Giovanni * Compares the experiences of transition economies in EasternAndrea. 1994. Europe (especially Romania and Russia) with China's experi-"Income Distribution, ence since 1978.Poverty and Welfare in * Finds that poverty and inequalities have risen dramatically inTransitional Economies: Eastern Europe but have remained relatively constant/low inA Comparison Between China.Eastern Europe and * Argues that macroeconomic reforms (trade liberalization,China." Journal of price reforms, and so on) are the main cause of rising povertyInternational and disparities in Eastern Europe, and thus disputes the notionDevelopment 6(5): that the social system has failed the poor and benefits the bet-569-607. ter off. In fact, Cornia finds evidence that social systems in
Eastern Europe had a significant equalizing and moderatingeffect.
o Although overall poverty has been reduced during the initialphase of reform in China, the increase in income disparities hasbeen induced mainly by internal policy measures such asdeclining social expenditures, fiscal decentralization, and dis-mantling of the commune system.
Annex 2 Survey of Literature on Inequality, Income Distribution, and Migration in China 75


Re erences
W~~~~~~~S.
Background papersBurgess, Robin. 1997. "Diversification and Welfare in Rural China." London School of
Economics, Suntory-Toyota International Centre for Economics and Related Disciplines.Burgess, Robin, and Mamta Murthi. 1996. "Land, Nutrition and Welfare in Rural China."
London School of Economics, Suntory-Toyota International Centre for Economics andRelated Disciplines.
Burgess, Robin, and Juzhong Zhuang. 1996. "Dimensions of Gender Bias in IntrahouseholdAllocation in Rural China." London School of Economics, Suntory-Toyota InternationalCentre for Economics and Related Disciplines.
Naga, Ramses Abdul, and Robin Burgess. 1996. "Determination and Prediction ofHousehold Permanent Income." London School of Economics, Suntory-ToyotaInternational Centre for Economics and Related Disciplines.
Ravallion, Martin, and Shaohua Chen. 1997. "When Economic Reform Is Faster thanStatistical Reform: Measuring and Explaining Inequality in Rural China." World Bank,China and Mongolia Department, Washington, D.C.
Zhang, Tao, and Heng-fu Zou. 1996. "Determinants of Provincial Income Growth in China."World Bank, Policy Research Department, Washington, D.C.
Other referencesADB (Asian Development Bank). 1997. Emerging Asia: Changes and Challenges. Manila.Ahuja, Vinod, Benu Bidani, Francisco Ferreira, and Michael Walton. 1997. Everyone's
Miracle? Revisiting Poverty Reduction and Inequality in East Asia. A Directions inDevelopment book. Washington, D.C.: World Bank.
Alesina, Alberto, and Dani Rodrik. 1994. "Distributive Policies and Economic Growth."Quarterly Journal of Economics 109 (May): 465-90.
Bardhan, Pranab. 1996. "Research on Poverty and Development Twenty Years afterRedistribution with Growth." In Michael Bruno and Boris Pleskovic, eds., Annual WorldBank Conference on Development Economics 1995. Washington, D.C.: World Bank.
Bauer, J., W Feng, N.E. Riley, and X. Zhou. 1992. "Gender Inequality in Urban China:Education and Employment." Modern China 18 (3): 333-70.
77
111 :X:f

Bramall, Chris, and Marion E. Jones. 1993. "Rural Income in Rural China." International Labour Organization, AsianInequality in China since 1978." Journal of Peasant Studies 21 Employment Programme, Geneva.(1): 41-70. Griffin, Keith, and Renwei Zhao, eds. 1993. The Distribution of
Burgess, Robin, Liwei Zhu, and Yun Ren. 1996. "Chinese Urban Income in China. New York: St. Martin's Press.Household Expenditure Analysis 1986-1990." Economic and Gundlach, Erich. 1996. "Solow Meets Market Socialism:Social Research Council Series 14. London School of Regional Convergence of Output per Worker in China." KielEconomics and Political Science, Development Economics Working Paper 726. Kiel Institute of World Economics,Research Programme. Department IV, Germany.
Chen, Shaohua, and Martin Ravallion. 1996. "Data in Transition: Hare, Denise, and Shukai Zhao. 1996. "Labor Migration as aAssessing Rural Living Standards in Southern China." China Rural Development Strategy: A View from the MigrationEconomic Review 7 (1): 23-55. Origin." Paper presented at the International Conference of
China Ministry of Agriculture, Rural Economy Research Center Rural Labor in China, June 25-27, Beijing.Study Group. 1996a. "Analysis of the Income and Expenditure Howes, Stephen. 19 93a. "Income Distribution: Measurement,Patterns of Migrants in Shanghai." Beijing. Transition and Analysis of Urban China, 1981-1990." Ph.D.
. 1996b. "Zhongguo Nongcun Laodongli Liudong Yanjiu: dissertation. London School of Economics and PoliticalWaichuzhe Yu Shuchudi." Summary report presented at the Science.Ford Foundation's International Conference on China Rural . 1993b. "Income Inequality in Urban China in the 1980s:Labor Mobility, June, Beijing. Levels, Trends and Determinants." Economic and Social
China State Statistical Bureau. 1996. China Statistical Yearbook Research Council Series 3. London School of Economics,1996. Beijing. Development Economics Research Programme.
Cornia, Giovanni Andrea. 1994. "Income Distribution, Poverty Howes, Stephen, and Athar Hussain. 1994. "Regional Growthand Welfare in Transitional Economies: A Comparison between and Inequality in Rural China." London School of Economics,Eastern Europe and China." Journal of International Suntory-Toyota International Centre for Economics andDevelopment 6 (5): 569-607. Related Disciplines.
Datt, Gaurav, and Martin Ravallion. 1996. "Why Have Some Hussain, Athar. 1994. "Social Security in Present-Day China andIndian States Done Better than Others at Reducing Rural its Reform." American Economic Review Papers andPoverty?" Policy Research Working Paper 1594. World Bank, Proceedings 84 (May): 276-80.Policy Research Department, Washington, D.C. Hussain, Athar, Peter Lanjouw, and Nicholas Stern. 1994.
Deininger, Klaus, and Lyn Squire. 1996. "A New Data Set "Income Inequalities in China: Evidence from HouseholdMeasuring Income Inequality." The World Bank Economic Survey Data." World Development 22 (12): 1947-57.Review 10 (3): 565-91. Jalan, Jyotsna, and Martin Ravallion. 1996a. "Are There
Deininger, Klaus, Lyn Squire, and Tao Zhang. 1995. "Measuring Dynamic Gains from a Poor-Area Development Program?"Income Inequality: A New Data Base." World Bank, Policy Policy Research Working Paper 1695. World Bank, PolicyResearch Department, Washington, D.C. Research Department, Washington, D.C.
Entwisle, Barbara, Gail E. Henderson, Susan E. Short, Jill Bouma, . 1996b. "Transient Poverty in Rural China." Policyand Zhai Fengying. 1995. "Gender and Family Business in Research Working Paper 1616. World Bank, Policy ResearchRural China." American Sociological Review 60 (February): Department, Washington, D.C.36-57. Jian, Tianlun, Jeffrey D. Sachs, and Andrew M. Warner. 1996.
FBIS (Foreign Broadcast Information Service). 1995. "Rural "Trends in Regional Inequality in China." NBER WorkingMigrant Worker Economic Data Analyzed." Beijing. Paper 5412. National Bureau of Economic Research,
. 1996a. "PRC: Critique of Governor Responsibility Cambridge, Mass.System for Grain." Beijing. Khan, Azizur Rahman, Keith Griffin, Carl Riskin, and Zhao
. 1996b. "PRC: Urban Floating Population Causes Social Renwei. 1992. "Household Income and Its Distribution inProblems." Beijing. China." The China Quarterly 132: 1029-61.
Feng, Lu. 1996. "Why Does China's Grain Policy Tend to Knight, John, and Li Shi. 1996. "Educational Attainment and theCompromise the Efficiency Objective-A Neglected Issue for Rural-Urban Divide in China." Oxford Bulletin of EconomicsChina's Grain Policy Research." Working Paper 1996002. and Statistics 58 (1): 83-117.Peking University, China Center for Economic Research, Mason, Andrew D. 1997a. "Dimensions of the Labor Market inBeijing. China: Rural Labor Markets and Rural, Urban, and Regional
Findlay, Christopher. 1997. "Grain Sector Economic Reform in Linkages." Background paper prepared for this report. WorldChina." Paper presented at the Australian Agricultural and Bank, Washington, D.C.Resource Economics Society Conference, sponsored by the . 1997b. "Gender Issues in the China Labor Market."University of Adelaide's Chinese Economy Research Centre, Background paper prepared for this report. World Bank,January, Gold Coast. Washington, D.C.
Fishlow, Albert. 1996. "Inequality, Poverty, and Growth: Where Maurer-Fazio, Margaret, Thomas G. Rawski, and Wei Zhang.Do We Stand?" In Michael Bruno and Boris Pleskovic, eds., 1997. "Gender Wage Gaps in China's Labor Market: Size,Annual World Bank Conference on Development Economics Structure, Trends." Paper presented at the annual meeting of1995. Washington, D.C.: World Bank. the Asian Studies Association, March 13-17, Chicago.
Gelbach, Jonah B., and Lant H. Pritchett. 1995. "Does More for McKinley, Terry. 1996. The Distribution of Wealth in Ruralthe Poor Mean Less for the Poor? The Politics of Tagging." China. New York: M.E. Sharpe.Policy Research Working Paper 1523. World Bank, Policy McKinley, Terry, and Keith Griffin. 1993. "The Distribution ofResearch Department, Washington, D.C. Land in Rural China." The Journal of Peasant Studies 21 (1):
Griffin, Keith, and Ashwani Saith. 1981. "Growth and Equality 71-84.
78 Sharing Rising Incomes: Disparities in China
Meng, Xin. 1996. "Regional Wage Gap, Information Flow and Decentralized Econoniv. A World Bank Country Study.Rural-Urban Migration." Australian National University, Washington, D.C.School of Pacific and Asian Studies, Department of Economics . 1995b. "China: Regional Disparities." Report 14499-Research, Canberra. CHA. China and Mongolia Department, Washington, D.C.
Meng, Xin, and Paul Miller. 1995. "Occupational Segregation and . 1996a. "China: Higher Education Reform." ReportIts Impact on Gender Wage Discrimination in China's Rural 15573-CHA. Washington, D.C.Industrial Sector." Oxford Economic Papers 47 (1): 136-55. . 1996b. "China: Issues and Options in Health Financing."
Mody, Ashoka, and Fang-Yi Wang. 1995. "Explaining Industrial Report 152-8-CHA. China and Mongolia Department andGrowth in Coastal China: Economic Reforms ... and What Human Development Department, Washington, D.C.Else?" PSD Occasional Paper 2. World Bank, Private Sector . 1996c. "China: Pension System Reform." Report 15121-Development Department, Washington, D.C. CHA. China Resident Nilssion and China and Mongolia
Ravallion, Martin. 1997. "Poor Areas." In David Giles and Aman Department, Washington, D.C.Ullah, eds., The Handbook of Applied Economic Statistics. . 1996d. The Chinese Economy: Figbtinig Intf.tion.New York: Marcel Dekkar. Deepening Reformis. A World Bank Country Study.
Riley, Nancy E. 1995. "Chinese Women's Lives: Rhetoric and Washington, D.C.Reality." Asia-Pacific Issues 25. East-West Center, . 1996e. Povertv Reductionz anid the World Bank: ProgressHonolulu. and Challenzges in the 1990s. Washington, D.C.
Riskin, Carl. 1993. "Poverty in China's Countryside: Legacy and . 1996f. WTorld Development Report 1996: Froml PI.an toChange." In Pranab Bardhan, Mrinal Datta-Chaudhuri, and Market. New York: Oxford Universitv Press.T.N. Krishnan, eds., Development and Change: Essays in . 1997a. At Cbina s Table: Food Security Options.Honour of K.N. Ra/. Bombav: Oxford University Press. Washington, D.C.
Rozelle, Scott, Li Guo, Mlinggao Shen, and others. 1997. "Poverty, . 1997b. "Memorandum and Recommendation of theNetworks, Institutions, or Education: Testing Among President of the International Bank for Reconstruction andCompeting Hypotheses on the Determinants of Migration in Development to the Executive Directors on a Proposed Loan ofChina." Paper presented at the annual meeting of the $30 Msillion to the People's Republic of China for a QinbaAssociation for Asian Studies, Chicago. Mountains Poverty Reduction Project." Report P7090-CHA.
Summers, Robert, and Alan Heston. 1991. "The Penn World Washington, D.C.Table (Mark 5): An Expanded Set of International Wu, Guobao, Sue Richardson, and Peter Travers. 1995. "RuralComparisons, 1950-1988." Qtuarterl-v Journal of Econoniics Povertv and Its Causes in China." Working Paper 95.106: 327-68. University of Adelaide, Chinese Economy Research Unit.
Taylor, J. Edward, and Irma Adelman. 1996. Village Economies: Australia.The Design, Estimation and Use of Villageivide Economic . 1996. "NMultiple Deprivation in Rural China." WorkingMlodels. Cambridge: Cambridge Universlty Press. Paper. University of Adelaide, Chinese Economy Research Unit,
WX'atson, Andrew, and Harry X. Wu. 1994. "Regional Disparities Australia.in Rural Enterprise Growth." In Christopher Findley, Andrew Wu, Harry, and Zhou Li. 1996. "Research on Rural to UrbanX'Watson, and Harry X. Wu, eds., Rural Enterprises in China. Labour Migration in Post-Reform China: A Survey." Working
New York: St. Martin's Press. Paper 71. University of Adelaide, Chinese Economy ResearchWest, Lorraine A.. 1995. "Regional Economic Variation and Basic Unit, Australia.
Education in Rural China." Robert S. McNamara Fellowship Yang, Dennis Tao, and Hao Zhou. 1996. "Rural-Urban DisparityProgram. World Bank, Economic Development Institute, and Sectoral Labor Allocation in China." Paper presented at theWashington, D.C. annual meeting of the Association for Asian Studies, April,
World Bank. 1992. "China: Strategies for Reducing Poverty in the Honolulu, Hawaii.1990s." Report 10409-CHA. China and Mongolia Yang, L., and J.S. Zax. 1996. "Compensation for Holding upDepartment, Environment, Human Resources, and Urban Half the Sky: Gender-linked Income Differences in UrbanDevelopment Operations Division, Washington, D.C. China" University of Colorado, Department of Economics,
1995a. China: Macroecononiic Stability in a Boulder.
References 79
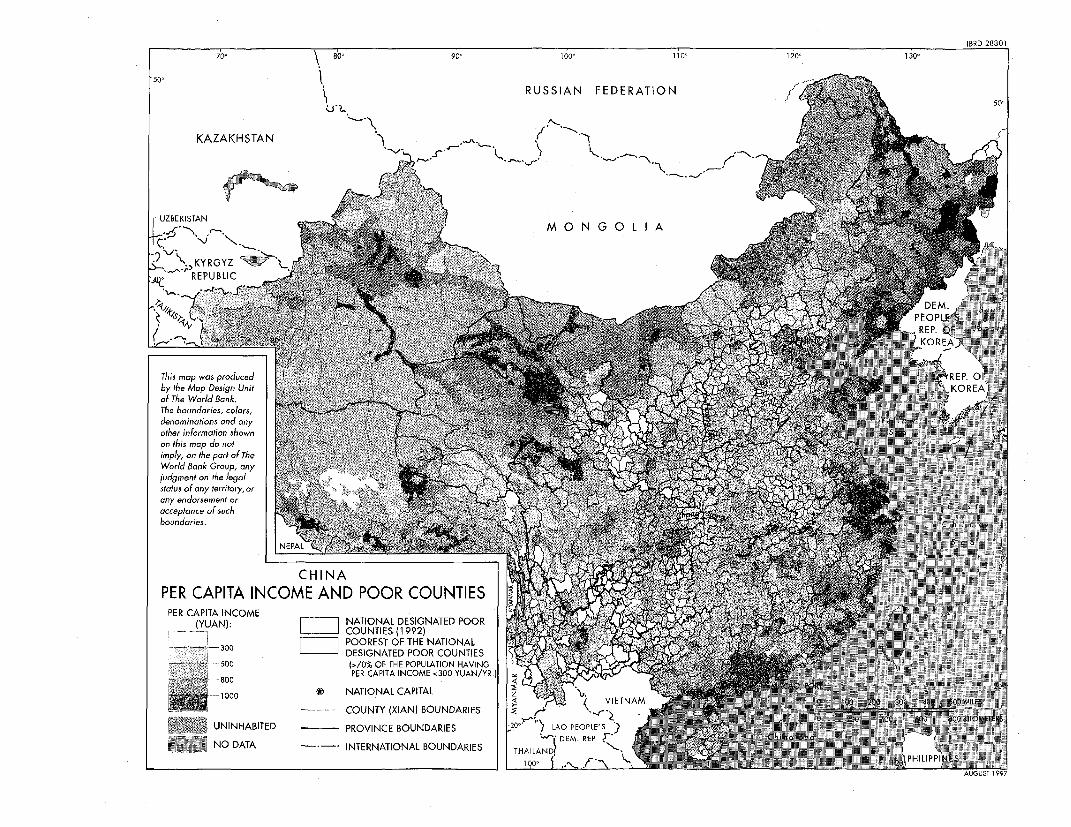
IBRD 288017O- 8b~ 9,0 1600 110O1 0 130,
5O~~~~~~~~~~~~~ k ~~~~~~~~~~~~RUSSIA N FEDERATIO N 0
KAZAKHSTAN I
UZBEKISTAN
cc KYRGYZ~-REPUIBLIC
This map was produced ~ ~ ~ ~ ~ ~ ~ ~ ~ ~ ~ ~ ~ ~ ~ ~ ~ ~ ~~ ~~~~~~~~~~~~~~~~~~~~~AGST19
li T H E W O R L D B A N K
1818 H Street, N.W.Washington, D.C. 20133 USA
Telephone: 202-477 1234
Facsimile: 202- 477 6391
Telex: MCI 64145 WORLDBANKMCI 248423 WORLDBANK
Cable Address: INTRAFRAD WASHINGTONDC
World Wide Web: http://www.worldbank.org/
E-mail: Books@world bank.org
9 780821 340752Cover design by Glenn Pierce/The Magazine Group
ISBN 0-8213-4075-1
Related Documents