Report On Infrastructure Supply Readiness In Indonesia – Achievements And Remaining Gaps Public Disclosure Authorized Public Disclosure Authorized Public Disclosure Authorized Public Disclosure Authorized Public Disclosure Authorized Public Disclosure Authorized Public Disclosure Authorized Public Disclosure Authorized

Welcome message from author
This document is posted to help you gain knowledge. Please leave a comment to let me know what you think about it! Share it to your friends and learn new things together.
Transcript

Report On InfrastructureSupply Readiness In Indonesia –Achievements And Remaining Gaps
Pub
lic D
iscl
osur
e A
utho
rized
Pub
lic D
iscl
osur
e A
utho
rized
Pub
lic D
iscl
osur
e A
utho
rized
Pub
lic D
iscl
osur
e A
utho
rized
Pub
lic D
iscl
osur
e A
utho
rized
Pub
lic D
iscl
osur
e A
utho
rized
Pub
lic D
iscl
osur
e A
utho
rized
Pub
lic D
iscl
osur
e A
utho
rized
WB406484
Typewritten Text
93259

Infrastructure Cencus 2011
Design & Layout
Ardhi Yudho
Publisher
Coordinating Ministry for People’s Welfare in cooperation
with TNP2K and PNPM Support Facility
The view expressed in this paper are those of the authors
alone and do not represent the views of the PNPM Support
Facility or any of the many individuals or organizations
acknowledged here.

Report On InfrastructureSupply Readiness In Indonesia –Achievements And Remaining Gaps
i i |
Abbreviations, Acronyms and Terms
BPS Statistics Indonesia (Badan Pusat Statistik)
D3 Diploma 3 (Associate’s Degree)
Dukun bayi Traditional Midwife
GOI Government of Indonesia
Kabupaten District
Kecamatan Sub-district
KDP Kecamatan Development Program
NTB Nusa Tenggara Barat
NTT Nusa Tenggara Timur
OLS Ordinary Least Squares
PCA Principal Components Analysis
PAUD Pendidikan Anak Usia Dini (Pre-School Education Facility)
PNPM Program Nasional Pemberdayaan Masyarakat
(National Program for Community Empowerment)
PODES Potensi Desa (Village Potential Statistics)
Polindes Pondok Bersalin Desa (Community Maternity Clinic)
Poskesdes Pos Kesehatan Desa (Community Health Post)
Posyandu Pos Pelayanan Kesehatan Terpadu (Integrated Health Service Post)
Puskesmas Pusat Kesehatan Masyarakat (Community Health Center)
Puskesmas Pembantu Auxilliary Community Health Center
S1 Sarjana 1 (Bachelor’s Degree)
SD Sekolah Dasar (Elementary School)
SLB Sekolah Luar Biasa (Special School for Diabled Students)
SMA Sekolah Menengah Atas (Senior Secondary School)
SMK Sekolah Menengah Kejuruan (Senior Secondary / Vocational School)
SMP Sekolah Menengah Pertama (Junior Secondary School)
Susenas Survei Sosial Ekonomi Nasional (National Socioeconomic Survey)
TK Taman Kanak-Kanak (Kindergarten)
WHO World Health Organization
i i i |
CONTENTS
Contents iiiExecutive Summary ivI. Introduction 1II. Data And Methodology 3
II.1. The 2011 Core Podes And The Infrastructure Census 4II.2. Methodological Approach 7
III. Health Infrastructure 9III.1. Selection of Supply Readiness Indicators 10III.2. Description of the National Patterns of Infrastructure Availability 12III.3. Composite Indices of Health Supply Readiness 18III.4. Quantifying Needs for Investment 23
IV. Education Infrastructure 27IV.1. Selection of Supply Readiness Indicators 28IV.2. Description of the National Patterns of Infrastructure Availability 30IV.3. A Composite Index of Education Supply Readiness 36IV.4. Quantifying Needs for Investment 41
V. Transportation Infrastructure 45V.1. Selection of Supply Readiness Indicators 46V.2. National Patterns of Infrastructure Availability 47V.3. Quantifying Needs for Investment 49V.4. Comparison with Health and Education Supply Readiness 50
VI. Summary Of Results And Policy Recommendations 51VI.1. National Patterns of Infrastructure Supply Readiness 52VI.2. Policy Recommendations 53
References 54Appendix 55
iv |
EXECUTIVE SUMMARY
At the request of the National Team for Poverty Reduction (TNP2K) and the Vice-President, a census of basic village
infrastructure, including health and education, has been conducted using the 2011 round of PODES, the national village
census. Based on the information from both the infrastructure census and the PODES core survey, the objective of
this analysis is twofold. First, the in-depth information on the quantity and quality of existing infrastructure is used for a
comprehensive assessment of the local-level availability of basic facilities and services. In particular, indicators that measure
the supply readiness of health and education services are developed for all districts and sub-districts in Indonesia. Second,
based on the analysis of local patterns of available infrastructure, this study aims to quantify the needs for investments in
health, education and transportation infrastructure.
The infrastructure census provides detailed facility-level information on public health and education facilities, covering a total
of 166,506 health facilities and 164,561 schools all across the country. Along with the information on the physical availability
of (public and private) health and education facilities from the PODES core survey, the data allow painting a nuanced picture
of supply readiness of health and education services in Indonesia. To this end, seven indicators are selected for both the
health and education sector, along three dimensions: (i) availability and accessibility of facilities; (ii) presence and qualification
of personnel, and (iii) physical characteristics of facilities.
All indicators represent a supply readiness norm or target, and are calculated at the sub-district level. Based on the
indicators, existent supply gaps are quantified. For both health and education, the respective indicators are then combined
into composite indices of supply readiness. While the data on transportation infrastructure in PODES is less inclusive
than what is available for the health and education sectors, a number of supply readiness indicators are also provided for
transportation infrastructure.

v |
The main findings from the analysis are:
• Overall, the results show a consistent picture of the quantity and quality of available basic infrastructure in Indonesia.
For both health and education, we observe similar spatial patterns of supply readiness across the sectors’ different
dimensions. Moreover, results are robust across sectors, with significantly positive correlations between the various
indicators of health, education and transportation infrastructure.
• In general, the largest gaps in infrastructure supply readiness are found for the Papua region, the Maluku Islands, NTT, as
well as the remote areas of Kalimantan and Sulawesi. The urban-rural divide is thereby substantial, not only with respect to
the accessibility, but also the quality of available services.
• For health, the lowest average scores are found for the provinces of Kalimantan Barat (75 %), NTT (71 %), Maluku Utara
(69 %), Maluku (66 %), Papua Barat (50 %), and Papua (39 %). The highest average levels of health supply readiness
are observed for all Javanese provinces (ranging from 99 % for DI Yogyakarta to 92 % for Banten), Bali (99 %), Bangka
Belitung (95 %), Sumatera Barat (92 %), and NTB (90 %).
• Similar patterns are found for the ranking of average education supply readiness, with DKI Jakarta (98 %) and DI
Yogyakarta (97 %) performing best, and Papua Barat (40 %) and Papua (26 %) showing the lowest average scores. These
patterns are generally confirmed by the indicators of transportation infrastructure as well.
• Despite these consistent overall trends, we observe substantial variations within regions and provinces. The availability of
the indicators at sub-district level thereby allows for the identification of such local disparities.
• Based on the indicators of supply readiness, the magnitude of existent gaps and resulting investment needs are quantified.
This particularly includes, but is not limited to, the number of citizens without easy access to health and education facilities.
Overall, it is estimated that more than 6 million people in Indonesia have no (easy) access to primary health care provision,
and around 36 million people lack access to inpatient services offered at hospitals. For education, we find that more than
9 million people live in places without junior secondary schools readily available, with this number increasing to 16.6 million
for early childhood education facilities.


1 |
I. INTRODUCTION

2 |
INTRODUCTION
Over the past decade, the Government of Indonesia has invested significant resources in community driven development
approaches to poverty reduction and small scale infrastructure provision in rural areas. Initially targeted toward the poorest
sub-districts, like the predecessor program KDP, PNPM-Rural has expanded to cover every rural sub-district and village
in Indonesia. PNPM-Rural has spent the majority of it several-billion dollar budget on block grants to communities to build
small-scale village infrastructure. A number of studies demonstrated positive returns and impacts (Olken et al., 2011; World
Bank, 2011), but there is little understanding of the infrastructure deficit remaining, the cost of addressing such a deficit via
a sustained PNPM or other approaches, and the most efficient means of doing so. To date, the GOI has developed less
comprehensive and less evidence-based approaches on key issues such as whether and how much tertiary infrastructure
contributes to poverty reduction; when and where maintenance is needed; and determining block grant allocation size. The
primary reason for the current approach is a lack of complete and comprehensive data on existing infrastructure. Lacking
good data on where and to what extent infrastructure gaps exist, a systematic and evidence-driven approach to addressing
the gap via targeting of PNPM and other programs has not been feasible.
At the request of the National Team for Poverty Reduction (TNP2K) and the Vice-President, the PNPM Support Facility (PSF)
Monitoring and Evaluation team has implemented a census of basic infrastructure for all 76,000 villages in Indonesia through
PODES 2011. The primary objective of the census is to quantify the gap of acceptable-quality working basic infrastructure
for all villages in Indonesia (main road, bridges, schools and health clinics) as an input to developing better strategies for
financing, timeframe, programming and management of national and international resources for all PNPM programs. The
collected data and the results from this analysis will allow the government to create a mechanism to estimate and track
the remaining gap of addressing the existing village infrastructure deficit at the national, regional and local levels. Moreover,
the data allows for a more systematic and evidence based approach to determining needs and priorities for PNPM moving
forward (including targeting, maintenance and block grant size), assessing the impact of community-based programs on
poverty reduction and determining local government allocation.
This report provides a detailed overview of the analysis and its main results. Section II presents the data and the overall
methodological approach. Sections III and IV describe the selection of indicators, their properties and distribution for the
health and education sector, respectively. In section V, we turn to the results for transportation infrastructure, while section VI
provides a summary with some concluding remarks and potential policy implications.

3 |
II. DATA AND METHODOLOGY

4 |
In 2011, the PNPM Support Facility (PSF) conducted a
census of basic village infrastructure, including health
and education, through the 2011 wave of PODES (Village
Potential Statistics Survey or Potensi Desa). Administered
by BPS, PODES is conducted three times per decade and
collects socio-economic information from all Indonesian rural
villages and urban neighborhoods.1
The core PODES survey includes a wide range of indicators,
ranging from population characteristics to infrastructure,
economic activities, and social life. Using the available
information on existing health, education and transportation
infrastructure, this analysis aims at providing an accurate and
up-to-date picture of the local supply of basic infrastructure
and services.
For each village, the PODES core data provides information
on (i) the type and number of existent education and health
facilities; (ii) the distance to the next facility in case a facility
is not present in the village;2 (iii) the number of physicians,
midwives and nurses; and (iv) the type and condition of
existent roads and bridges. The information on the quantity
of available health and education facilities from the PODES
core is complemented by quality-related information on
these facilities from the infrastructure census. Drawing on
the list of existent health and education facilities from the
PODES core survey, the infrastructure census was collected
directly from the facilities and provides in-depth information
on public health facilities (including the full sample of
9,212 Puskesmas, 22,883 Puskesmas Pembantu, 28,672
Poskesdes and 14,408 Polindes, as well as a sub-sample
of 91,331 Posyandu) as well as public schools (including
134,517 primary (SD), 21,530 junior secondary (SMP), and
senior secondary (6,224 SMA / 2,589 SMK) schools).
II.1. The 2011 Core Podes And The Infrastructure Census
1 PODES 2011 includes 78,600 villages/neighborhoods.
2 For health facilities, PODES additionally provides information on how easily a certain facility type can be reached from the village.
The two data sources therefore allow for a comprehensive
assessment of both the quantity and quality of health and
education infrastructure in Indonesia. As far as possible
with the given data, we also evaluate the robustness of the
survey. As the PODES core is based on responses of the
village heads, misreporting by local authorities is a major
concern. If respondents expect their answers to affect the
allocation of public funds to the village or, in general, have
doubts about the purpose of the survey, the state of the
community’s public services and facilities might not be
reported accurately. Further, relying on a single respondent
can be problematic when this person is not fully aware of the
various aspects of village life.
The reliability of the data is therefore assessed in several
ways. First, BPS and PSF implemented a range of quality
controls when collecting the data, including sending
independent consultants to verify data, spot-checking
(also to remote areas) and going back to the field for
some areas where high data error/inconsistency were
found. Second, we evaluate the consistency of the survey
information throughout the analysis (see section II.2 for the
methodological approach). In what follows, the available
information on health and education infrastructure from
both the PODES Core and Infrastructure Census dataset is
presented in more detail.

5 |
The information on existent health services available from
the PODES data can be categorized along four dimensions:
(i) physical availability and accessibility; (ii) health workforce;
(iii) services and equipment; and (iv) building characteristics.
Table II.1 gives an overview of the variables at hand for each
of these dimensions.
The PODES core data provides information on the existence
of different types of health facilities in the village, including
hospitals, maternal hospitals, polyclinics, Puskesmas,
Puskesmas Pembantu, Poskesdes, Polindes, and Posyandu,
as well as physician’s and obstetrician’s practices. In case
the respective facility is not available within the village/
neighborhood, the core includes information on a) the
distance to and b) the ease of reaching the nearest facility.
Both the core and the census include information on the
number of physicians, dentists, midwives, nurses and other
health personnel working in the facilities and villages.3
Further, the infrastructure census contains information on the
availability of a range of services and equipment at the facility
level. These variables are not available for those facilities that
are not covered by the census (i.e. hospitals, polyclinics,
physician’s and midwife’s practices). Aggregating this
information at village or sub-district level would hence only
be accurate for those sub-districts where no hospitals and
polyclinics are present (which applies to around 60 percent
of the 6,771 sub-districts). Finally, the infrastructure census
provides information on a range of building characteristics, of
which the availability of electricity and the supply of water, as
well as indicators of roof and floor quality are most suited to
assess the physical condition of facilities.
The data on education supply and infrastructure from the
Core and the infrastructure census is also categorized along
three dimensions: (i) physical availability; (ii) student numbers
and teacher characteristics; and (iii) available rooms and
facility characteristics. Table II.2 provides an overview.
Information on existent public SD, SMP, SMA and SMK is
available from both the Core and the infrastructure census,
while the Core additionally provides information on early
childhood education facilities (PAUD and Kindergarten/TK),
as well as the number of private facilities for all school types,
including academies, special schools (SLB), Islamic boarding
schools, and Madrasah diniyah. Further, the core includes
information on the distance to the nearest school for each
school type, if the respective facility is not present within the
village or neighborhood.
For all public schools the infrastructure census provides
information on the number of students (by sex and grade),
as well as the number of teachers, their type of contract
(permanent vs. temporary), and their level of education
(S1 degree or higher versus D3 degree or lower). With this
information, the average number of students per class,
student-teacher ratios, and the share of permanent and/
or teachers holding at least an S1 degree are calculated for
each school.
As for the health facilities, the school census provides
information on a range of building characteristics. We
focus on the availability of electricity and water within the
facility and indicators of roof and floor materials and quality.
Furthermore, the census contains information on available
rooms, including the number of classrooms, laboratories,
libraries, bathrooms, exercise fields, UKS rooms, and
staffrooms.
Information on Health Infrastructure
Information on Education Infrastructure
3 In part, the numbers differ substantially between the two sources, which is due to the broader focus of the Core data (including hospitals, polyclinics,
physician’s and midwife’s practices).

6 |
Table II.2: Available Information on Education Infrastructure from PODES
Dimension Indicator(S)
Physical Availability
(public and private)
• Number of Facilities per 10,000 population
• Distance to the next facility
Students and Teachers
(for public schools)
• Student-Teacher Ratios
• Number of Students per Class
• Share of permanent / S1 teachers
Available Rooms
and Facility Characteristics
(for public schools)
• Libraries
• Laboratories
• Electrification
• Water Source
• Type and condition of roof and wall
Table II.1: Available Information on Health Infrastructure from PODES
Dimension Indicator(S)
1. Physical Availability and
Accessibility
Three indicators are available:
• Number of facilities per 10,000 population
• Share of population that can easily reach the facility
• Distance to the next facility
For the following types of health facilities:
• Hospitals
• Polyclinics
• Maternal Hospitals
• Puskesmas
• Puskesmas Pembantu
• Poskesdes
• Polindes
• Physician’s practice
• Midwife’s practice
2. Health Workforce • Physicians: number within the village & distance to / ease of reaching of the next practice
• Midwives: number within the village & distance to / ease of reaching of the next practice
• Dentists: number within the village
• Nurses and other health personnel: number within the village
3. Services and Equipment The infrastructure census provides information on the availability of the following services
(in the surveyed facilities):
• Inpatient services
• Dentist services
• Pregnancy check-up
• Delivery by doctor/midwife
• Immunization services
• Family planning services
• Laboratory
• Weighing services
• Provision of vitamin A
• Provision of iron pills
Incubator availability, Vaccine storage equipment
4. Building Characteristics Electrification, Water source, Type and condition of roof and wall
7 |
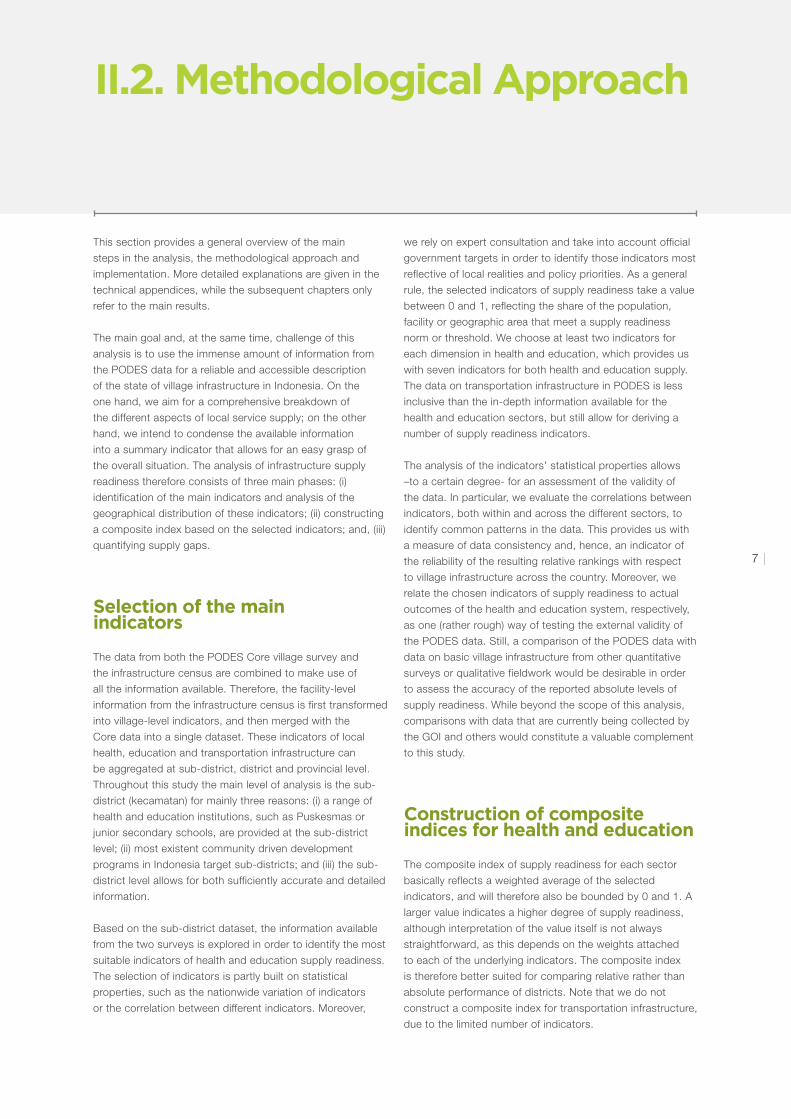
The composite index of supply readiness for each sector
basically reflects a weighted average of the selected
indicators, and will therefore also be bounded by 0 and 1. A
larger value indicates a higher degree of supply readiness,
although interpretation of the value itself is not always
straightforward, as this depends on the weights attached
to each of the underlying indicators. The composite index
is therefore better suited for comparing relative rather than
absolute performance of districts. Note that we do not
construct a composite index for transportation infrastructure,
due to the limited number of indicators.
This section provides a general overview of the main
steps in the analysis, the methodological approach and
implementation. More detailed explanations are given in the
technical appendices, while the subsequent chapters only
refer to the main results.
The main goal and, at the same time, challenge of this
analysis is to use the immense amount of information from
the PODES data for a reliable and accessible description
of the state of village infrastructure in Indonesia. On the
one hand, we aim for a comprehensive breakdown of
the different aspects of local service supply; on the other
hand, we intend to condense the available information
into a summary indicator that allows for an easy grasp of
the overall situation. The analysis of infrastructure supply
readiness therefore consists of three main phases: (i)
identification of the main indicators and analysis of the
geographical distribution of these indicators; (ii) constructing
a composite index based on the selected indicators; and, (iii)
quantifying supply gaps.
II.2. Methodological Approach
Selection of the main indicators
The data from both the PODES Core village survey and
the infrastructure census are combined to make use of
all the information available. Therefore, the facility-level
information from the infrastructure census is first transformed
into village-level indicators, and then merged with the
Core data into a single dataset. These indicators of local
health, education and transportation infrastructure can
be aggregated at sub-district, district and provincial level.
Throughout this study the main level of analysis is the sub-
district (kecamatan) for mainly three reasons: (i) a range of
health and education institutions, such as Puskesmas or
junior secondary schools, are provided at the sub-district
level; (ii) most existent community driven development
programs in Indonesia target sub-districts; and (iii) the sub-
district level allows for both sufficiently accurate and detailed
information.
Based on the sub-district dataset, the information available
from the two surveys is explored in order to identify the most
suitable indicators of health and education supply readiness.
The selection of indicators is partly built on statistical
properties, such as the nationwide variation of indicators
or the correlation between different indicators. Moreover,
we rely on expert consultation and take into account official
government targets in order to identify those indicators most
reflective of local realities and policy priorities. As a general
rule, the selected indicators of supply readiness take a value
between 0 and 1, reflecting the share of the population,
facility or geographic area that meet a supply readiness
norm or threshold. We choose at least two indicators for
each dimension in health and education, which provides us
with seven indicators for both health and education supply.
The data on transportation infrastructure in PODES is less
inclusive than the in-depth information available for the
health and education sectors, but still allow for deriving a
number of supply readiness indicators.
The analysis of the indicators’ statistical properties allows
–to a certain degree- for an assessment of the validity of
the data. In particular, we evaluate the correlations between
indicators, both within and across the different sectors, to
identify common patterns in the data. This provides us with
a measure of data consistency and, hence, an indicator of
the reliability of the resulting relative rankings with respect
to village infrastructure across the country. Moreover, we
relate the chosen indicators of supply readiness to actual
outcomes of the health and education system, respectively,
as one (rather rough) way of testing the external validity of
the PODES data. Still, a comparison of the PODES data with
data on basic village infrastructure from other quantitative
surveys or qualitative fieldwork would be desirable in order
to assess the accuracy of the reported absolute levels of
supply readiness. While beyond the scope of this analysis,
comparisons with data that are currently being collected by
the GOI and others would constitute a valuable complement
to this study.
Construction of composite indices for health and education

8 |
The choice of method for assigning weights is a crucial,
yet admittedly arbitrary, step in constructing the composite
index of infrastructure readiness in Indonesia. It is crucial
because the weights determine the relative influence of each
of the underlying indicators of the composite index. It is also
arbitrary because the choice of weights inevitably involves a
value judgement. It is therefore important to be transparent
in both the arguments for the choice of weight, and the
method for constructing the weight. We opt for assessing
three different methods for constructing weights, each with
different implicit choices, argumentation and intuition, while
aiming to keep the methods as straightforward as possible.
First, we base the weights on explicit policy preferences.
Although such a weighting scheme is clearly very arbitrary,
the advantage is that the choices explicitly reflect different
policy priorities and are open to scrutiny and debate. Here,
we propose three in principle arbitrary weighting schemes:
i. Relatively larger weights to indicators in the physical
availability dimension, which would emphasize the
important role of availability of facilities for delivering health
care and education services.
ii. Equal weights across all dimensions of accessibility. As
the number of indicators may vary across dimensions, this
could imply that the weights across indicators will not be
equal.
iii. Equal weights across the seven indicators of supply
readiness.
Second, weights are derived by means of so-called Principal
Components Analysis (PCA), a statistical method used to
summarize the information from a large number of related,
or correlated, variables.4 We derive the first principal
component, the linear combination of the selected indicators
that best captures the variation in the data, and use the
eigenvectors of the first component as relative weights
for the composite index. The advantage of PCA is that it
seems less arbitrary in that we let the covariance in the data
determine the policy priorities. However, PCA based weights
are also difficult to interpret and to relate to policy priorities.
Third, we relate the weighting scheme for the supply
readiness indicators to explicit policy objectives in terms of
actual outcomes of the health and education systems, such
as health care utilization by potential patients or average
test scores from the National Exam (Ujian Nasional, UN).
Two methods are used to assess the relative importance
of the different supply indicators for health and education
outcomes:
i. Weights are based on the supply indicators’ contribution
to the absolute level of the health or education outcomes,
by means of OLS regressions of the selected indicators on
district-level outcome variables. The estimated coefficients
are then used to construct the weights.
ii. Weights are based on the supply indicators’ contribution
to inequality in health or education outcome variables. We
measure inequality by means of a concentration index,
which we decompose into the individual contributions of
the seven supply indicators. These individual contributions
are the product of (i) the responsiveness (or elasticity)
of the outcome variables with respect to the supply
indicators, and (ii) the inequality in the distribution of
supply indicators across districts. For details on the
inequality decomposition see Appendix 1.
Existing shortcomings in infrastructure supply readiness,
and the corresponding supply needs, are then quantified
based on the main indicators, with the existing supply gap
expressed as the distance to the maximum value of 1.. We
provide different scenarios using different assumptions and
benchmarks. In particular, we distinguish between absolute
and relative levels of deprivation in terms of access to basic
infrastructure.
In general, two different approaches are possible to identify
targeting priorities. First, policy interventions can focus
on those regions where the largest share of population,
facilities, or villages is lacking certain infrastructure. A
potential policy target with this approach would be to
increase supply readiness to a value of, for example, 0.75
for all sub-districts in Indonesia. As the sub-districts lagging
behind the most are mostly rural areas with a low population
density, a relatively small number of people would benefit
from infrastructure improvements in these areas.
Alternatively, investment priorities can be determined based
on the absolute number of citizens that lack access to basic
services. With this second approach, the focus would, at
least partly, shift from remote, sparsely populated areas with
very little infrastructure available, to more urban, densely
populated areas with an overall higher level of supply
readiness, but larger numbers of citizens without access
to certain services. We will identify the magnitude of the
gaps as well those areas most eligible for infrastructure
investments based on both approaches.
Quantifying existing gaps
4 A well-known application of the PCA is the asset index, where information on the ownership of a large number of items is reduced into a single index.

9 |
III. HEALTH INFRASTRUCTURE

10 |
The PODES Core and the Infrastructure Census allow
for categorizing the available information along four main
dimensions. We derive a total of seven indicators in order
to reflect the various aspects of health care supply. In what
follows, the choice of the different indicators is motivated.
5 For all nine health facility types, the village head/respondent of the PODES core reports on whether it is “very easy”, “easy”, “difficult”, or “very
difficult” to reach the next facility(if no such facility is available in the village).
The three types of indicators at hand (number of facilities
per capita (“population-based”), distance-based, access-
based) provide different pictures of the availability of health
facilities. The population-based indicators tend to be lower
in densely populated areas and higher in sparsely populated
areas, and hence do not necessarily reflect actual availability
of services. The correlations of these indicators with other
indicators of infrastructure readiness are usually low or even
negative, which is largely driven by the substantial impact
of the population denominator on the indicator. As this
would lead to a biased mapping of available infrastructure,
no population-based indicators are included neither for the
health nor for the education sector. However, we do account
for population density when assessing the magnitude of
existing infrastructure gaps.
A more reliable measure of health care accessibility is the
“distance to the next facility” indicator. However, these
indicators show a relatively high number of missing values
(no information for up to 1,000 sub-districts). Therefore, a
“ease of reaching” indicator is constructed, which is based
on the assessment of the village head on how easy a certain
health facility can be reached from the village.5 The “ease
of reaching” dummy at village level equals 1 if a facility is
a) found within the village or b) “very easy” or “easy” to
reach (according to the village head/the core respondent).
Measuring the share of the sub-district population that can
easily reach a certain facility, these indicators indirectly
account for distance and transport infrastructure. The
correlation with the distance-based indicators is generally
high, around 0.60, which confirms the reliability of this class
of indicators.
1. Physical Availability and Accessibility
We have information on the number of physicians, midwives
and nurses in each village and by facility type. We propose
two indicators that reflect targets set by the GOI:
• Physician at Puskesmas: In each Puskesmas, at least one
physician should be present. We measure the share of
Puskesmas in a sub-district that fulfill this condition.
• Midwife in the Village: The presence of midwives is crucial
for maternity care and attended delivery. We measure the
share of the sub-district population living in villages where
a midwife is present.
2. Health Workforce
We group the nine facility types into three indicators in order
to capture different functions of the health care system:
• Access to Primary Care: share of the population that
can easily reach a polyclinic, Puskesmas, Puskesmas
Pembantu, or physician’s practice.
• Access to Secondary Care: share of the population that
can easily reach a hospital
• Access to Delivery Facilities: share of the population
that can easily reach a hospital, maternity hospital,
Puskesmas, Polindes or midwife’s practice.
The first indicator is intended to measure access to basic
health services, which requires a choice on the health
facilities to be included. For comparison, we do provide
alternative definitions of primary care, in particular using a
broader definition which includes all facility types other than
hospitals (provision of secondary care) and Posyandu (no
provision of core health services).
III.1. Selection of Supply Readiness Indicators

11 |
The World Health Organization proposes an indicator of
health professionals per 10,000 population to measure
health workforce density (WHO, 2011). However, population-
based indicators are problematic for the above stated
reasons. Indeed, the WHO indicator performs poorly, with
(i) negative or very low correlations with all other indicators
of supply readiness; and (ii) no explanatory power when
assessing the determinants of health care utilization. An
indicator that performs slightly better is based on the number
of physicians per 10,000 population, which is used as an
alternative indicator of health workforce (see Appendix 2 for
a more detailed description of population-based indicators of
health workforce).
The information on services and equipment available from
the infrastructure census is problematic for three reasons.
First, only facilities covered by the infrastructure census
are included, hence the indicators miss out on services
offered at hospitals and polyclinics as well as at physician’s
and midwife’s practices. Second, in case a service is not
available within a village, no information on the location of
the nearest facility that offers the service is available. Third,
the service categories and the information on available
equipment are relatively broadly defined and therefore not
well suited for the assessment of supply quality (for instance,
the impact of a laboratory crucially depends on equipment
and tests available). We therefore do not use the information
on services and equipment for the index.
3. Services and Equipment
Instead, the quality of health facilities is measured with two
indicators of basic amenities.
• Water Supply Puskesmas: An official target for Puskesmas
facilities is to have access to water either at the facility or
within 500 meters from the building. As no information on
the distance to the next water source is available, we use
a dummy that equals one if the next water facility can be
reached in 10 minutes or less.
• Electrification: The second indicator measures the share
of health facilities in the sub-district (excluding Posyandu)
with electricity.
We do not use indicators of building material, as these
indicators are likely to also reflect regional differences in
building styles, and, hence, not necessarily the quality of
infrastructure. Table III.1 provides an overview of the selected
indicators of health supply readiness.
4. Building Characteristics
Table III.1: Overview of Selected Health Indicators
Indicator Description
Access to Primary Care Share of Population that can easily reach a polyclinic, Puskesmas, Puskesmas Pembantu, or physi-
cian’s practice
Access to Secondary Care Share of Population that can easily reach a hospital
Access to Delivery Facility Share of Population that can easily reach a hospital, maternity hospital, Puskesmas, Polindes or mid-
wife’s practice
Physician at Puskesmas Share of Puskesmas with at least one physician present
Midwife in the village Share of Population living in villages with a midwife present
Water Supply Puskesmas Share of Puskesmas with water installation within facility or 10 min walk
Electrification Share of health facilities with electricity (excluding Posyandu)

12 |
Table III.2: Health Indicators: Descriptive Statistics
Descriptive Statistics Obs. Mean SD Min Max
Access to Primary Care 6771 0.926 0.173 0 1
Access to Secondary Care 6771 0.673 0.407 0 1
Access to Delivery Facility 6771 0.899 0.220 0 1
Physician at Puskesmas 6771 0.858 0.339 0 1
Midwife in the village 6771 0.848 0.251 0 1
Water Supply Puskesmas 6771 0.848 0.345 0 1
Electrification 6771 0.814 0.267 0 1
Descriptive statistics for the seven indicators are presented
in Table III.2, where all indicators are bounded between 0
and 1, and larger values indicate a higher degree of supply
readiness. On average, 92.6 percent of population in the
6,771 sub-districts has access to primary health services as
defined in Table III.1. When in addition access to Polindes,
Poskesdes and midwife’s practices is considered, this
average increases to 95.5 percent. Overall, basic health
care is hence readily available in many parts of Indonesia.
However, regional differences are still substantial and are
discussed in greater detail below.
Access to secondary care is more restricted, with an average
of only two thirds of the sub-district’s population living
in villages from where a hospital can easily be reached.
Delivery facilities are, on average, difficult to reach for about
ten percent of the sub-district population. The indicators of
health personnel and building characteristics show similar
sub-district averages, ranging between 0.81 for the share of
health facilities with power supply and 0.86 for the share of
Puskesmas with a physician present.
Table III.3 reports the correlations between indicators, which range between 0.30 and 0.62 (with the exception of access
to delivery facilities and access to primary care: 0.78). These significantly and uniformly positive correlations point to similar
patterns of supply readiness across different dimensions and, moreover, confirm the consistency of the chosen indicators.
Along with the, in part, substantial variations of the indicators across sub-districts, these statistical properties suggest a
reasonably robust assessment of the local availability of basic health infrastructure across Indonesia.
Table III.3: Health Indicators: Correlations
Correlations Primary Secondary Delivery Physician Midwife Water
Access to Secondary Care 0.54 1.00
Access to Delivery Facility 0.78 0.62 1.00
Physician at Puskesmas 0.42 0.36 0.47 1.00
Midwife in the village 0.60 0.53 0.65 0.50 1.00
Water Supply Puskesmas 0.37 0.30 0.40 0.49 0.43 1.00
Electrification 0.47 0.45 0.51 0.44 0.54 0.38
III.2. Description of the National Patterns of Infrastructure Availability

13 |
Before turning to the spatial patterns of health care supply, Figure III.1 provides a graphical representation of the seven
indicators’ distribution. While primary health care services are almost universally available, access to hospital treatment is
severely limited in about 20 percent of all sub-districts. In more than 80 percent of the sub-districts, Puskesmas are staffed
with at least one physician. However, large variations are observed for the village-level availability of midwives, with a total of
1,136 sub-districts in which a midwife is present in less than 50 percent of the villages. A somewhat similar picture emerges
for the two indicators of basic amenities: Water supply is a given for most Puskesmas, while electrification of health facilities
is less prevalent, with universal access to electricity found in only about 45 percent of the sub-districts.
Figure III.1: Distribution of Health Supply Readiness Indicators
Ind. 1: Access to Primary Care
Ind. 4: Share of Puskesmas with Doctor
Ind. 6: Water Available in Puskesmas
Per
cent
Per
cent
Per
cent
Ind. 2: Access to Secondary Care
Ind. 5: Midwife in Village
Ind. 7: Electrification
Ind. 3: Access to Delivery Facility0 .1 .2 .3 .4 .5 .6 .7 .8 .9 1
0 .1 .2 .3 .4 .5 .6 .7 .8 .9 1
0 .1 .2 .3 .4 .5 .6 .7 .8 .9 1
0 .1 .2 .3 .4 .5 .6 .7 .8 .9 1
0 .1 .2 .3 .4 .5 .6 .7 .8 .9 1
0 .1 .2 .3 .4 .5 .6 .7 .8 .9 1
0 .1 .2 .3 .4 .5 .6 .7 .8 .9 1
80
60
40
20
80
60
40
20
80
60
40
20
80
60
40
20
80
60
40
20
80
60
40
20
80
60
40
20
6 The data from PODES 2011 is not (yet) completely compatible with the administrative coding that underlies the most recent sub-district maps.
Therefore, a total of 38 sub-districts cannot be represented by the maps. Despite this minor incompatibilities between the PODES codes and the
mapping tools, the whole set of indicators is available for all sub-districts covered by PODES 2011.
In what follows, maps for all seven indicators present the regional patterns of infrastructure supply readiness. The same
classification is used for all indicator maps (as well as for the maps of the composite indices in the next section) in order to
simplify comparisons across the different aspects of health care supply.6
14 |
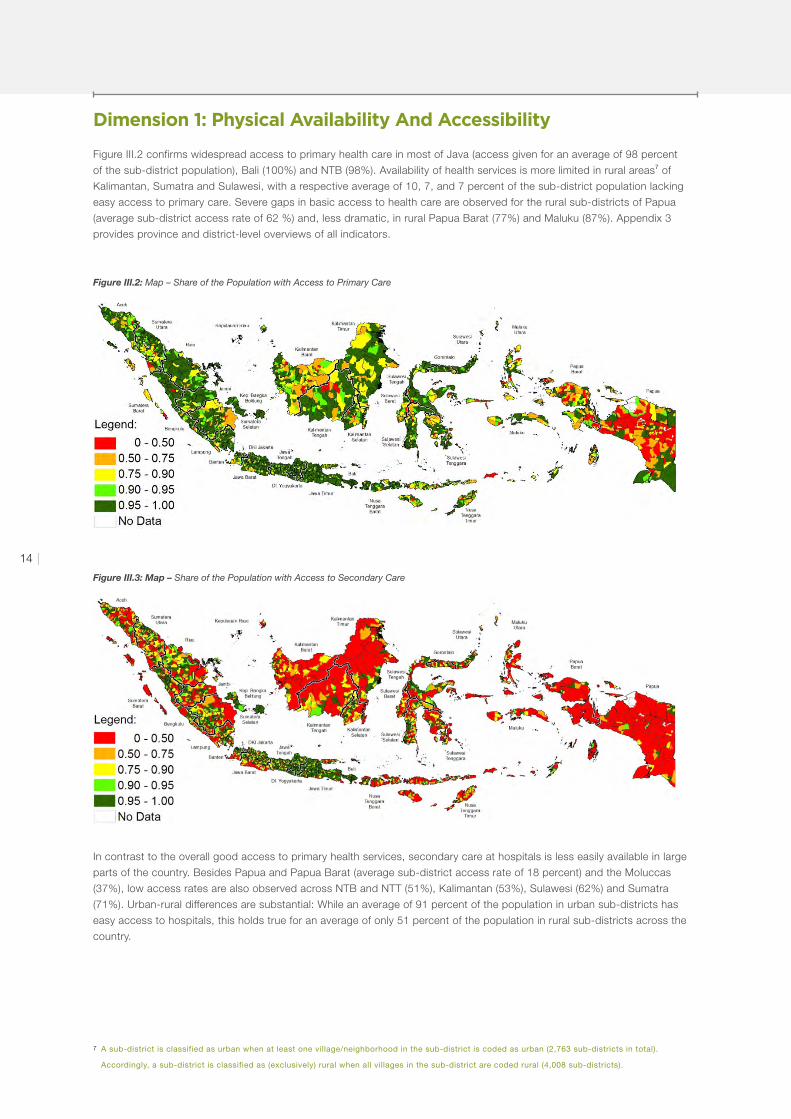
Figure III.2 confirms widespread access to primary health care in most of Java (access given for an average of 98 percent
of the sub-district population), Bali (100%) and NTB (98%). Availability of health services is more limited in rural areas7 of
Kalimantan, Sumatra and Sulawesi, with a respective average of 10, 7, and 7 percent of the sub-district population lacking
easy access to primary care. Severe gaps in basic access to health care are observed for the rural sub-districts of Papua
(average sub-district access rate of 62 %) and, less dramatic, in rural Papua Barat (77%) and Maluku (87%). Appendix 3
provides province and district-level overviews of all indicators.
In contrast to the overall good access to primary health services, secondary care at hospitals is less easily available in large
parts of the country. Besides Papua and Papua Barat (average sub-district access rate of 18 percent) and the Moluccas
(37%), low access rates are also observed across NTB and NTT (51%), Kalimantan (53%), Sulawesi (62%) and Sumatra
(71%). Urban-rural differences are substantial: While an average of 91 percent of the population in urban sub-districts has
easy access to hospitals, this holds true for an average of only 51 percent of the population in rural sub-districts across the
country.
Figure III.2: Map – Share of the Population with Access to Primary Care
Figure III.3: Map – Share of the Population with Access to Secondary Care
7 A sub-district is classified as urban when at least one village/neighborhood in the sub-district is coded as urban (2,763 sub-districts in total).
Accordingly, a sub-district is classified as (exclusively) rural when all villages in the sub-district are coded rural (4,008 sub-districts).
Dimension 1: Physical Availability And Accessibility
15 |
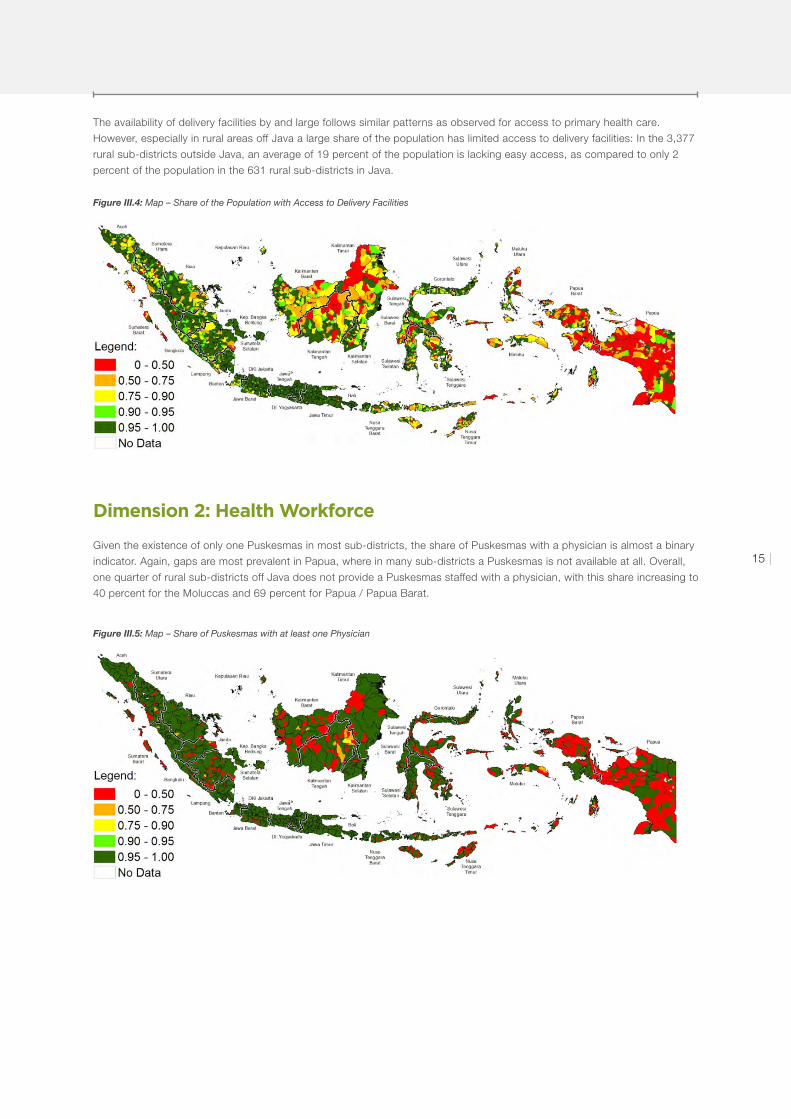
Figure III.4: Map – Share of the Population with Access to Delivery Facilities
Given the existence of only one Puskesmas in most sub-districts, the share of Puskesmas with a physician is almost a binary
indicator. Again, gaps are most prevalent in Papua, where in many sub-districts a Puskesmas is not available at all. Overall,
one quarter of rural sub-districts off Java does not provide a Puskesmas staffed with a physician, with this share increasing to
40 percent for the Moluccas and 69 percent for Papua / Papua Barat.
Figure III.5: Map – Share of Puskesmas with at least one Physician
Dimension 2: Health Workforce
The availability of delivery facilities by and large follows similar patterns as observed for access to primary health care.
However, especially in rural areas off Java a large share of the population has limited access to delivery facilities: In the 3,377
rural sub-districts outside Java, an average of 19 percent of the population is lacking easy access, as compared to only 2
percent of the population in the 631 rural sub-districts in Java.
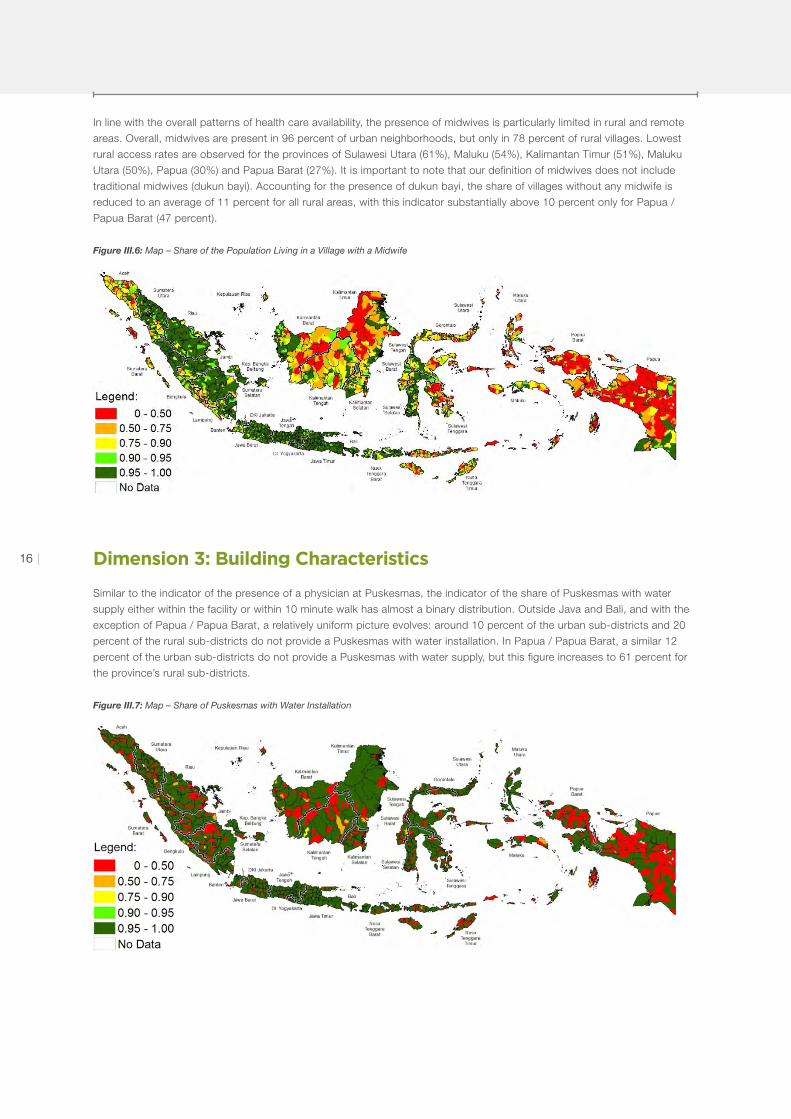
16 |
Figure III.6: Map – Share of the Population Living in a Village with a Midwife
Similar to the indicator of the presence of a physician at Puskesmas, the indicator of the share of Puskesmas with water
supply either within the facility or within 10 minute walk has almost a binary distribution. Outside Java and Bali, and with the
exception of Papua / Papua Barat, a relatively uniform picture evolves: around 10 percent of the urban sub-districts and 20
percent of the rural sub-districts do not provide a Puskesmas with water installation. In Papua / Papua Barat, a similar 12
percent of the urban sub-districts do not provide a Puskesmas with water supply, but this figure increases to 61 percent for
the province’s rural sub-districts.
Figure III.7: Map – Share of Puskesmas with Water Installation
Dimension 3: Building Characteristics
In line with the overall patterns of health care availability, the presence of midwives is particularly limited in rural and remote
areas. Overall, midwives are present in 96 percent of urban neighborhoods, but only in 78 percent of rural villages. Lowest
rural access rates are observed for the provinces of Sulawesi Utara (61%), Maluku (54%), Kalimantan Timur (51%), Maluku
Utara (50%), Papua (30%) and Papua Barat (27%). It is important to note that our definition of midwives does not include
traditional midwives (dukun bayi). Accounting for the presence of dukun bayi, the share of villages without any midwife is
reduced to an average of 11 percent for all rural areas, with this indicator substantially above 10 percent only for Papua /
Papua Barat (47 percent).

17 |
Figure III.8: Map – Share of Health Facilities with Electricity (excl. Posyandu)
The availability of electricity in health facilities varies greatly across both regions and facility types. Overall, health facilities
in Papua / Papua Barat (52 percent), the Moluccas (66 percent), and NTT / NTB (70 percent) are least likely to have access
to electricity, while almost universal supply is given in Java (97 percent) and Bali (96 percent). In Table III.4, these figures
are disaggregated by type of health facility. With the exception of Papua / Papua Barat, average electrification rates for
Puskesmas are above 90 percent across the country. Puskesmas Pembantu, Poskesdes, and Polindes have significantly less
often access to electricity, with relatively similar average electrification rates across facility types within regions.
Table III.4: Share of Health Facilities with Electricity – by Region and Facility Type
Region Puskesmas Pustu Poskesdes Polindes
Sumatra 97.4 83.3 82.2 85.5
Java & Bali 100.0 96.4 95.3 97.4
NTT & NTB 94.2 69.1 70.5 61.4
Kalimantan 98.1 75.0 74.8 73.1
Sulawesi 94.7 80.4 69.8 68.8
Maluku & North Maluku 90.5 64.3 60.6 53.6
Papua & Papua Barat 72.3 50.3 30.0 39.0

18 |
Table III.5: Sub-Indices Health – Mean Values and Correlations
Sub-Index Mean Correlations
Availability Workforce Building
Physical Availability 0.833 1.00
Health Workforce 0.853 0.63 1.00
Building Characteristics 0.831 0.55 0.65 1.00
In a next step, the information from the seven indicators is
aggregated into (i) sub-indices for each dimension, as well as
(ii) composite indices based on all indicators. The provision
of such condensed information thereby allows assessing
overall supply readiness at local levels and identifying priority
regions for future policy interventions. In general, the island
of Java and the province of Bali perform best, while the
largest gaps in infrastructure supply readiness are found for
the Papua region, the Maluku islands, NTT, as well as for the
interior of Kalimantan. Overall, 19 percent of the Indonesian
sub-districts can be considered supply ready with a
maximum score of 100 percent, while substantial gaps are
observed for one quarter of the sub-districts with a score of
below 75 percent.8 Before having a closer look at the spatial
patterns of the supply of basic health services, this section
presents the construction of the various composite indices.
To begin with, Table III.5 shows the mean values and
pairwise correlations of the sub-indices for the three major
dimensions physical availability, health workforce, and
building characteristics. The sub-indices are calculated
as simple averages of the respective indicators in each
dimension. Similar mean values and positive correlations
between 0.55 and 0.65 endorse the impression of fairly
consistent patterns of supply readiness across different
dimensions of health infrastructure.
III.3. Composite Indices of Health Supply Readiness
8 These statistics are based on version A of the composite health index, where particular weight is given to the indicators of physical availability.

19 |
Going a step further, we combine the information from all seven indicators into one global index of health supply readiness.
As discussed in section II.2., we propose six different weighting schemes for the composite index for comparison and
robustness purposes. First, the weights are determined based on policy preferences, giving (i) a total weight of 60 percent
to the three indicators of physical availability; (ii) equal weights across the three dimensions of accessibility, personnel, and
building characteristics; and (iii) equal weights across the seven indicators of supply readiness.
Second, the Principal Components Analysis (PCA) is employed to derive weights for the seven indicators. Table III.6 presents
the respective eigenvectors and weights for each indicator from the PCA analysis, which results in fairly equal weights across
all seven indicators of health supply readiness.
Third, we link the supply readiness indicators to actual outcomes of the health system, namely health care utilization by
potential patients. Outpatient utilization rates, the dependent variable in our regression model, measure the share of the
population that used outpatient services in the last month – out of those respondents reported sick. As this variable, which
is derived from the 2010 Susenas, is only available at district-level, we aggregate the seven supply readiness indicators
accordingly. Table III.7 presents the correlations between outpatient utilization rates and the seven indicators, as well as the
OLS regression estimates and resulting weights for the composite index.
Table III.6: Principal Component Analysis Health Indicators
Table III.7: OLS Regression Results: Determinants of Outpatient Utilization Rates
Indicators Eigenvector Weight
Access to Primary Care 0.408 0.155
Access to Secondary Care 0.366 0.139
Access to Delivery Facility 0.432 0.164
Physician at Puskesmas 0.345 0.131
Midwife in the village 0.410 0.156
Puskesmas Water Supply 0.310 0.118
Electrification 0.361 0.137
2.631 1.000
Indicator 1. Correlation 2. OLS I 3. OLS II 4. Weights
Access to Primary Care 0.47 0.02
(0.867)
0.02
(0.854)
0.031
Access to Secondary Care 0.51 0.09***
(0.002)
0.09***
(0.002)
0.169
Access to Delivery Facility 0.52 0.24**
(0.015)
0.24**
(0.016)
0.438
Physician at Puskesmas 0.37
Midwife in Village 0.41 -0.00
(0.917)
-0.09*
(0.053)
Personnel: Score Physicians 0.13 -0.09*
(0.061)
-0.00
(0.949)
Puskesmas Water Supply 0.43 0.09*
(0.093)
0.09*
(0.093)
0.158
Electrification 0.49 0.11***
(0.006)
0.11***
(0.005)
0.204
Observations: 497 497
R2: 0.319 0.319
P-values in parentheses. Statistical significance: * at 10%; ** at 5%; *** at 1%. Constant included.
20 |
On table III.7, Column 1 (correlation) shows that outpatient
utilization rates are strongly and positively correlated with all
supply readiness indicators, hence providing some evidence
for the external validity of the chosen indicators. To assess
these correlations further, we run simple OLS regressions
on outpatient utilization rates and obtain positive regression
coefficients for the three access indicators as well as for
the two indicators of building characteristics (column 2). For
comparison, we replace the ‘Physician at Puskesmas’ with
the ‘Physicians Score’ indicator (see Appendix 2 for details).
As the regression results do not improve (column 3), we
stick to our seven core indicators. Based on the regression
coefficients from OLS I, the weights for the composite index
are derived, where indicators with negative coefficients are
given zero weight and the weights for the remaining five
indicators are rescaled as to sum to 1 (column 4). While this
is a simple way of assessing the determinants of health care
utilization, the results provide an alternative approach to the
determination of the indicator’s weights.
A second alternative to determine weights with the help of
health outcome variables is to assess the supply indicators’
contribution to inequality in health care utilization using the
concentration index (see Appendix 1 for a more detailed
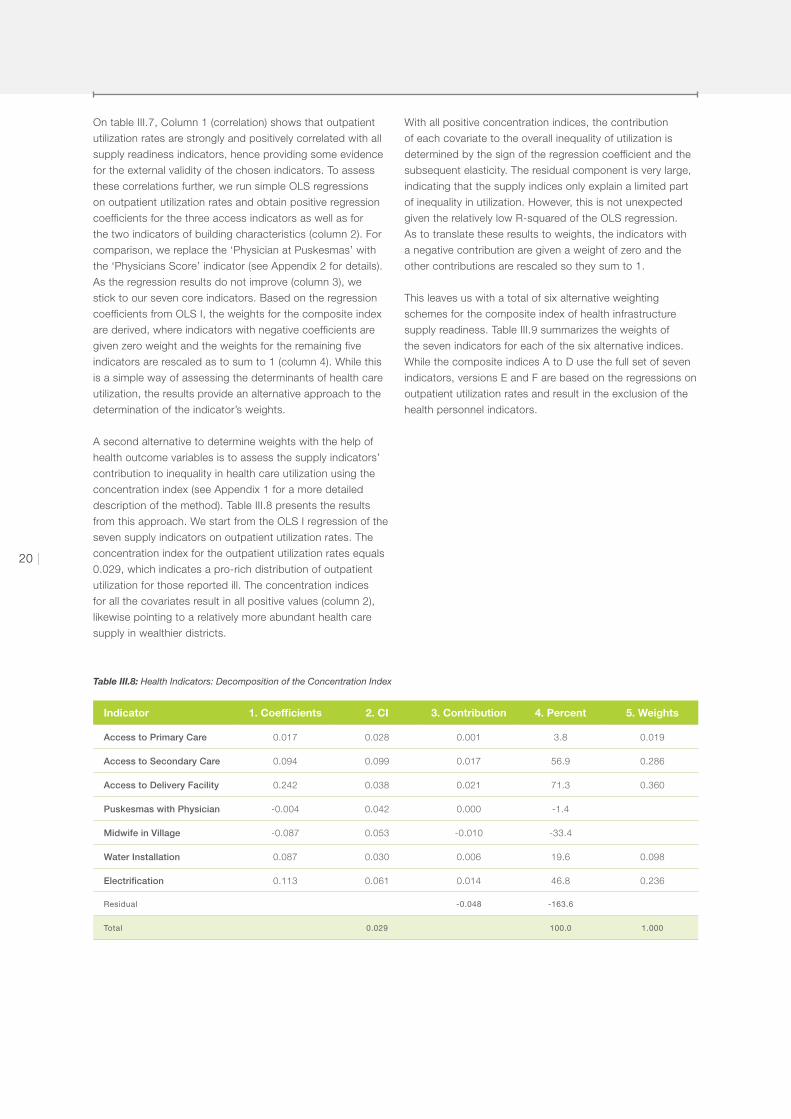
description of the method). Table III.8 presents the results
from this approach. We start from the OLS I regression of the
seven supply indicators on outpatient utilization rates. The
concentration index for the outpatient utilization rates equals
0.029, which indicates a pro-rich distribution of outpatient
utilization for those reported ill. The concentration indices
for all the covariates result in all positive values (column 2),
likewise pointing to a relatively more abundant health care
supply in wealthier districts.
With all positive concentration indices, the contribution
of each covariate to the overall inequality of utilization is
determined by the sign of the regression coefficient and the
subsequent elasticity. The residual component is very large,
indicating that the supply indices only explain a limited part
of inequality in utilization. However, this is not unexpected
given the relatively low R-squared of the OLS regression.
As to translate these results to weights, the indicators with
a negative contribution are given a weight of zero and the
other contributions are rescaled so they sum to 1.
This leaves us with a total of six alternative weighting
schemes for the composite index of health infrastructure
supply readiness. Table III.9 summarizes the weights of
the seven indicators for each of the six alternative indices.
While the composite indices A to D use the full set of seven
indicators, versions E and F are based on the regressions on
outpatient utilization rates and result in the exclusion of the
health personnel indicators.
Table III.8: Health Indicators: Decomposition of the Concentration Index
Indicator 1. Coefficients 2. CI 3. Contribution 4. Percent 5. Weights
Access to Primary Care 0.017 0.028 0.001 3.8 0.019
Access to Secondary Care 0.094 0.099 0.017 56.9 0.286
Access to Delivery Facility 0.242 0.038 0.021 71.3 0.360
Puskesmas with Physician -0.004 0.042 0.000 -1.4
Midwife in Village -0.087 0.053 -0.010 -33.4
Water Installation 0.087 0.030 0.006 19.6 0.098
Electrification 0.113 0.061 0.014 46.8 0.236
Residual -0.048 -163.6
Total 0.029 100.0 1.000

21 |
Tables III.10 and III.11 provide descriptive statistics and pairwise correlations for the six composite indices, respectively. Like
the underlying indicators, the composite indices are bounded between 0 and 1, with higher values indicating higher supply
readiness. The average Indonesian sub-district achieves a score of around 0.84 or 84 percent, dependent on the weighting
scheme used. Using composite index A as reference, both the highest possible score of 1 (1,291 sub-districts) and the
lowest possible score of 0 (35 sub-districts) are observed.
Table III.9: Overview of Weights for the Composite Health Indices
Index Primary Secondary Delivery Physician Midwife Water Electr.
A. Focus on Access 0.200 0.200 0.200 0.100 0.100 0.100 0.100
B. Equal Dimension 0.111 0.111 0.111 0.166 0.166 0.166 0.166
C. Equal Indicator 0.143 0.143 0.143 0.143 0.143 0.143 0.143
D. PCA 0.155 0.139 0.164 0.131 0.156 0.118 0.137
E. Utilization OLS 0.031 0.169 0.438 0.158 0.204
F. Utilization CI 0.019 0.286 0.360 0.098 0.236
Table III.10: Composite Health Indices: Descriptive Statistics
Descriptives n Mean SD Min Max
Index A: Focus on Access 6771 0.836 0.212 0 1
Index B: Equal Weights Dimensions 6771 0.839 0.214 0 1
Index C: Equal Weights Indicators 6771 0.838 0.212 0 1
Index D: PCA 6771 0.841 0.209 0 1
Index E: Utilization OLS 6771 0.836 0.218 0 1
Index F: Utilization CI 6771 0.809 0.235 0 1.00
Electrification 6771 0.814 0.267 0 1
Interestingly enough, the alternative weighting schemes have little impact on the distribution of the composite indices. This
is confirmed by extremely high correlations between the different versions of the composite indices. Versions A to D are
almost identical, due to similar weights and the positive correlations between the seven sub-indicators. Even when the health
personnel indicators are excluded for the regression-based weighting schemes (versions E and F), correlations are still above
0.95 (with the exception of version B and E).
Table III.11: Composite Health Indices: Correlations
Correlations A B C D E
Index B: Equal Weights Dimensions 0.97 1.00
Index C: Equal Weights Indicators 0.99 1.00 1.00
Index D: PCA 0.99 0.99 1.00 1.00
Index E: Utilization OLS 0.98 0.95 0.96 0.97 1.00
Index F: Utilization CI 0.97 0.92 0.95 0.95 0.99
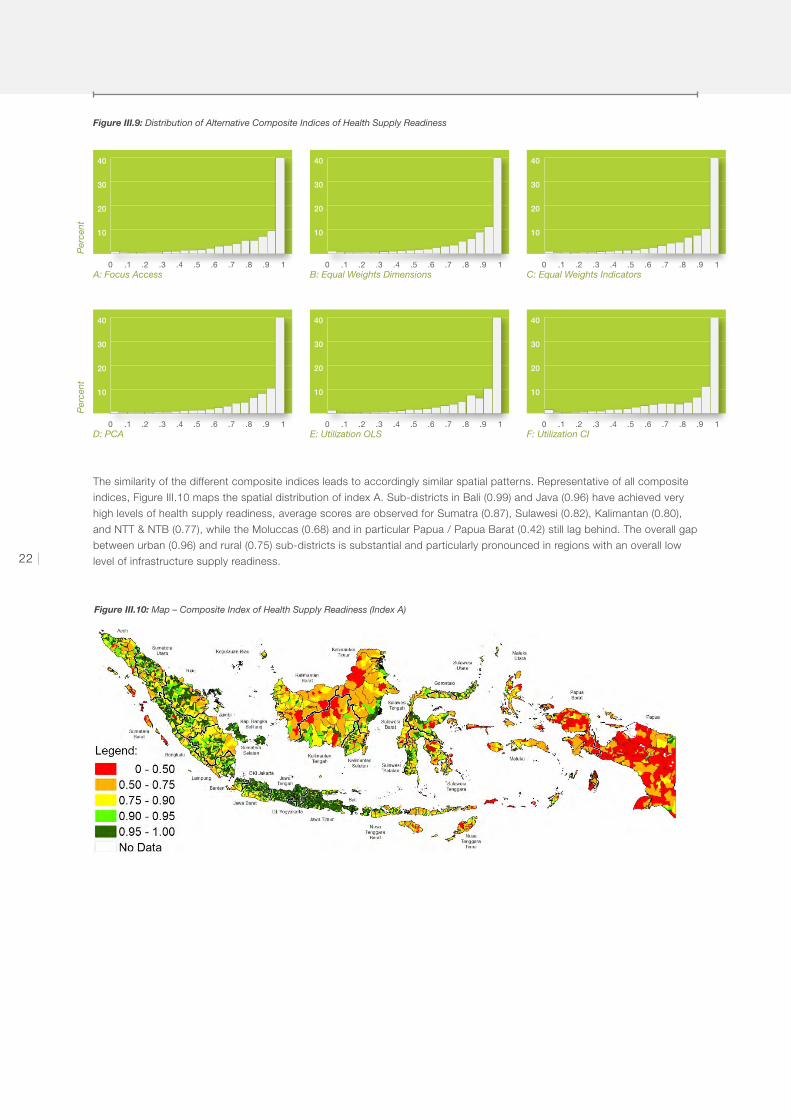
Finally, the similarity of the different composite indicators is confirmed by their almost identical distribution (Figure III.9). While
the potential user of the indices can decide on his or her preferred weighting scheme, this choice will actually not alter the
results substantially.
22 |
The similarity of the different composite indices leads to accordingly similar spatial patterns. Representative of all composite
indices, Figure III.10 maps the spatial distribution of index A. Sub-districts in Bali (0.99) and Java (0.96) have achieved very
high levels of health supply readiness, average scores are observed for Sumatra (0.87), Sulawesi (0.82), Kalimantan (0.80),
and NTT & NTB (0.77), while the Moluccas (0.68) and in particular Papua / Papua Barat (0.42) still lag behind. The overall gap
between urban (0.96) and rural (0.75) sub-districts is substantial and particularly pronounced in regions with an overall low
level of infrastructure supply readiness.
Figure III.9: Distribution of Alternative Composite Indices of Health Supply Readiness
A: Focus Access
D: PCA
Per
cent
Per
cent
B: Equal Weights Dimensions
E: Utilization OLS
C: Equal Weights Indicators
F: Utilization CI
0 .1 .2 .3 .4 .5 .6 .7 .8 .9 1
0 .1 .2 .3 .4 .5 .6 .7 .8 .9 1
0 .1 .2 .3 .4 .5 .6 .7 .8 .9 1
0 .1 .2 .3 .4 .5 .6 .7 .8 .9 1
0 .1 .2 .3 .4 .5 .6 .7 .8 .9 1
0 .1 .2 .3 .4 .5 .6 .7 .8 .9 1
40
30
20
10
40
30
20
10
40
30
20
10
40
30
20
10
40
30
20
10
40
30
20
10
Figure III.10: Map – Composite Index of Health Supply Readiness (Index A)
23 |
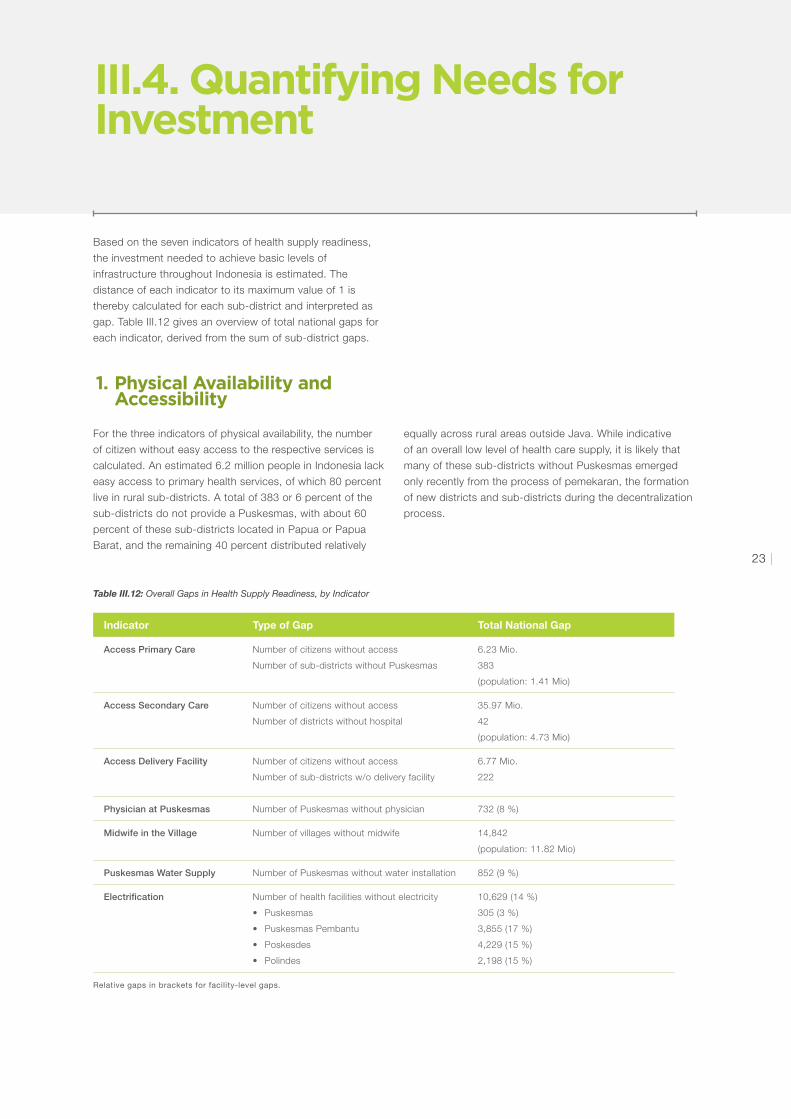
III.4. Quantifying Needs for Investment
Based on the seven indicators of health supply readiness,
the investment needed to achieve basic levels of
infrastructure throughout Indonesia is estimated. The
distance of each indicator to its maximum value of 1 is
thereby calculated for each sub-district and interpreted as
gap. Table III.12 gives an overview of total national gaps for
each indicator, derived from the sum of sub-district gaps.
For the three indicators of physical availability, the number
of citizen without easy access to the respective services is
calculated. An estimated 6.2 million people in Indonesia lack
easy access to primary health services, of which 80 percent
live in rural sub-districts. A total of 383 or 6 percent of the
sub-districts do not provide a Puskesmas, with about 60
percent of these sub-districts located in Papua or Papua
Barat, and the remaining 40 percent distributed relatively
1. Physical Availability and Accessibility
Table III.12: Overall Gaps in Health Supply Readiness, by Indicator
Relative gaps in brackets for facility-level gaps.
Indicator Type of Gap Total National Gap
Access Primary Care Number of citizens without access
Number of sub-districts without Puskesmas
6.23 Mio.
383
(population: 1.41 Mio)
Access Secondary Care Number of citizens without access
Number of districts without hospital
35.97 Mio.
42
(population: 4.73 Mio)
Access Delivery Facility Number of citizens without access
Number of sub-districts w/o delivery facility
6.77 Mio.
222
Physician at Puskesmas Number of Puskesmas without physician 732 (8 %)
Midwife in the Village Number of villages without midwife 14,842
(population: 11.82 Mio)
Puskesmas Water Supply Number of Puskesmas without water installation 852 (9 %)
Electrification Number of health facilities without electricity
• Puskesmas
• Puskesmas Pembantu
• Poskesdes
• Polindes
10,629 (14 %)
305 (3 %)
3,855 (17 %)
4,229 (15 %)
2,198 (15 %)
equally across rural areas outside Java. While indicative
of an overall low level of health care supply, it is likely that
many of these sub-districts without Puskesmas emerged
only recently from the process of pemekaran, the formation
of new districts and sub-districts during the decentralization
process.

24 |
In 694 sub-districts, less than 75 percent of the population
can easily reach primary health care providers. A policy goal
aiming at minimum access rates to primary health care of
75 percent across all sub-districts would require providing
access to a total of 1.31 million people. Table III.13 gives an
overview of the regional distribution of (i) the sub-districts
with access rates below 75 percent; and (ii) the number of
people without easy access to primary care, secondary care
and delivery services, respectively. The figures reveal the
different distributions of relative and absolute gaps. Out of
the 694 sub-districts with access rates below 75 percent,
42 percent are located in Papua and 17 percent in Sumatra.
However, out of the 6.23 million people without access to
primary care, ‘only’ 15 percent live in Papua or Papua Barat,
while 29 and 27 percent of the citizens without access are
found in Java and Sumatra, respectively.
Map III.11 describes the absolute number of people without
access to primary care by sub-district. In Papua, for instance,
more than 5,000 citizens without access are found in a total of
42 sub-districts (which equals 7 percent of the sub-districts in
the province). 46 such sub-districts are located in Jawa Barat,
35 in Jawa Tengah, 29 in Sumatera Utara, 25 in Jawa Timur,
27 in Kalimantan Barat, and 20 in NTT and Banten each.
Table III.13: Access to Health Services – Absolute and Relative Gaps
‘Share Kec. below 0.75’ reports the regional distribution of the 694 sub-districts with an indicator score below 0.75 (e.g. 16.7 % of the 694 sub-districts are found in Sumatra). ‘Share People’ reports the regional share in the total number of people without access.
Region Primary Care Secondary Care Delivery Facilities
Share Kec. below 0.75
Share People Share Kec. below 0.75
Share People Share Kec. below 0.75
Share People
Sumatra 16.7 25.6 25.5 28.5 14.4 25.9
Java & Bali 5.2 28.5 11.2 29.5 1.8 8.7
NTT & NTB 9.2 7.9 9.3 8.8 8.7 10.5
Kalimantan 10.2 10.4 12.7 11.7 12.8 15.3
Sulawesi 10.8 9.3 16.5 12.3 12.6 16.9
Maluku & North Maluku 5.8 3.4 5.4 3.2 6.5 5.0
Papua & Papua Barat 42.1 14.9 19.5 5.7 40.2 17.7
Absolute Numbers 694 6.23 Mio. 2,578 35.97 Mio. 956 6.77 Mio.
Figure III.11: Map – Number of Citizens without Access to Primary Health Care
25 |
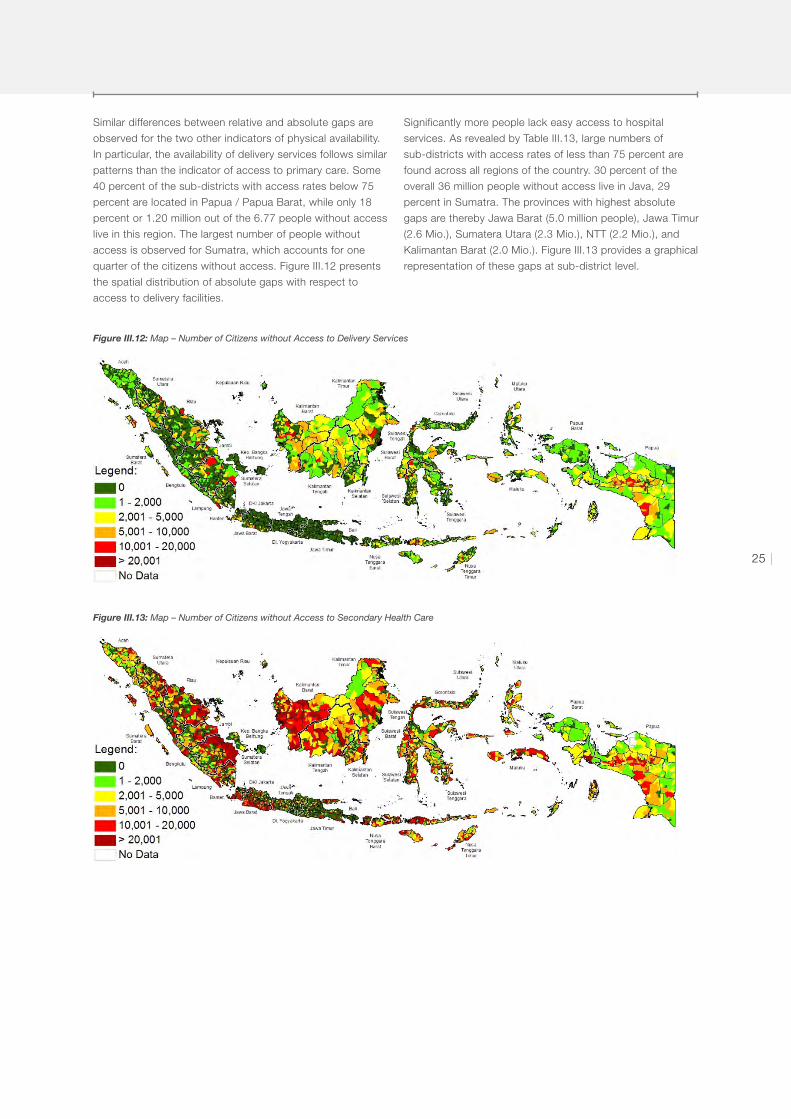
Similar differences between relative and absolute gaps are
observed for the two other indicators of physical availability.
In particular, the availability of delivery services follows similar
patterns than the indicator of access to primary care. Some
40 percent of the sub-districts with access rates below 75
percent are located in Papua / Papua Barat, while only 18
percent or 1.20 million out of the 6.77 people without access
live in this region. The largest number of people without
access is observed for Sumatra, which accounts for one
quarter of the citizens without access. Figure III.12 presents
the spatial distribution of absolute gaps with respect to
access to delivery facilities.
Significantly more people lack easy access to hospital
services. As revealed by Table III.13, large numbers of
sub-districts with access rates of less than 75 percent are
found across all regions of the country. 30 percent of the
overall 36 million people without access live in Java, 29
percent in Sumatra. The provinces with highest absolute
gaps are thereby Jawa Barat (5.0 million people), Jawa Timur
(2.6 Mio.), Sumatera Utara (2.3 Mio.), NTT (2.2 Mio.), and
Kalimantan Barat (2.0 Mio.). Figure III.13 provides a graphical
representation of these gaps at sub-district level.
Figure III.12: Map – Number of Citizens without Access to Delivery Services
Figure III.13: Map – Number of Citizens without Access to Secondary Health Care

26 |
Figure III.14: Map – Number of Citizens Living in Villages without Midwife
Turning to the indicators of health personnel, we find
that 732 of the existing Puskesmas are not staffed with
a physician. Most of the Puskesmas without a physician
present are thereby found in Papua (109), NTT (67), Papua
Barat (55), Maluku (52), and Sulawesi Tenggara (51). If the
383 sub-districts currently without a Puskesmas were to
be equipped with such a community health center, a total
of 1,049 physicians would need to be hired to achieve the
policy goal of staffing each Puskesmas with at least one
physician.
The GOI target of having one midwife per village is not (yet)
fulfilled in 14,148 or 27 percent of the Indonesian villages.
A total of 11.82 million people live in these villages, with the
highest numbers of people without access to a midwife in
the village found for Papa (1.33 Mio.), NTT (0.99 Mio.), NAD
(0.79 Mio.), Sumatera Utara (0.72 Mio.), Jawa Barat (0.65
Mio.), Kalimantan Barat (0.59 Mio.), and Sulawesi Utara (0.59
Mio.). Figure III.14 illustrates these spatial patterns.
The assessment of existing gaps with respect to building
characteristics is comparably straightforward. We observe
852 Puskesmas without water supply within the facility or
10 min walk, and a total of 10,629 health facilities without
electricity.9 Most important should be to provide electricity for
the 305 Puskesmas without power supply, of which 93 are
located in Papua, 34 in Sulawesi Tenggara, 27 in NTT, and
20 in Sumatera Utara.
2. Health Workforce 3. Building Characteristics
9 Included are Puskesmas, Puskesmas Pembantu, Poskesdes, Polindes.

27 |
IV. EDUCATION INFRASTRUCTURE
28 |
Similar to the analysis of health care supply readiness,
the available information on education infrastructure is
categorized along three dimensions, and seven indicators
are derived to capture the different aspects of the school
system.
IV.1. Selection of Supply Readiness Indicators
10 As no information on the ease of reaching education facilities is available from the PODES core data, and as the data on distances to the nearest
schools are available from all sub-districts, the distance indicators are used to assess the physical availability of education facilities.
11 The distance to the next SMP is missing for 84 sub-districts (1 in Sumatera Utara, 7 in Papua Barat, 76 in Papua), where no SMP is available at all. The
“Access to SMP” indicator is coded zero for these sub-districts.
12 Alternatively, the share of SMP schools with at least 70 percent of the school’s teachers holding an S1 degree could be used. Given the generally low
number of SMPs per sub-district, this would result in a categorical indicator with few different values. The share of S1 teachers among SMP teachers
in the sub-district therefore provides a more continuous indicator, which better reflects the entire distribution of teacher qualification.
The two types of indicators available (population-based,
distance-based) offer different pictures of the availability
of education facilities. As discussed before, per capita
measures tend to be largely driven by the population
denominator and do not necessarily reflect the density of
supply. Indicators of the distance to the next facility are more
reliable measures of education accessibility, and we focus
on two indicators:10 (i) access to early childhood education
(ECED) facilities and (ii) access to junior secondary schools
(SMP):
1. Access to ECED. This indicator is composed out of two
variables at village level: (i) the existence of an Early
Childhood Education Post (PAUD) in the village; and (ii)
the existence of a Kindergarten/TK in the village or within
1 km from the village. The “Access to ECED” indicator
measures the share of the sub-district population that lives
in a village for which at least one of the two conditions is
fulfilled.
2. Access to SMP: share of the sub-district population that
lives in a village with a SMP within 6 km, which is an
official MSS (Minimum Service Standard) target for remote
areas. For comparison, the same indicator is constructed
for a maximum distance of 3 km from the village.11
We do not use the distance to elementary schools (SD) as a
national indicator of supply readiness, since the data show
almost universal physical access to primary education for
most regions. However, substantial shares of the populations
in sub-districts in Aceh (11 percent on average), Papua Barat
(16 percent), and Papua (41 percent) have no SD available
within 1 km from the village, and this indicator could be
employed for local targeting.
1. Physical Availability and Accessibility
The infrastructure census provides detailed data at school
level, including information on the number of students
and the number and qualification of teachers. While this
allows for the calculation of the frequently used indicators
of student-teacher ratios (STR) and average numbers of
students per class, we do not include these variables in
the index for the following reasons. The average number
of students per class is strongly correlated with population
density and constitutes a weak proxy for education quality.
In fact, we find positive correlations between average class
size and all other indicators of supply readiness used for
the index. Likewise, low student-teacher ratios especially in
small schools often indicate an over-hiring of teachers rather
than excellent learning conditions (World Bank, 2010). For
instance, the MSS target for SD schools is to have at least
one teacher per 32 students, which is fulfilled in 97 percent
of the sub-districts. Such an indicator would hence possess
neither sufficient explanatory nor statistical power.
We focus instead on the qualification of teachers, measured
by the share of teachers holding a bachelor’s (S1) degree.
Based on the MSS for elementary and junior secondary
schools, we construct the following two indicators:
3. Teacher Qualification SD: According to the MSS, each
elementary school (SD) should employ at least two
teachers with S1 qualification. We therefore calculate the
share of SD in a sub-district fulfilling this condition.
4. Teacher Qualification SMP: Another MSS target states that
70 percent of the teachers at junior secondary schools
(SMP) should hold an S1 degree. The indicator measures
the average share of teachers with an S1 degree at SMP
schools in a given sub-district.12
2. Quality of Teaching

29 |
The school census provides information on existent rooms and facilities in each school, and we include one indicator of
available school facilities:
5. Laboratory in SMP: According to the MSS, each SMP should provide a natural science lab for its students. We proxy this
target through the share of SMP in the sub-district that provide a laboratory.
Finally, the characteristics of the school buildings are assessed through two indicators of electricity and water supply:
6. Electrification: Share of schools with electricity.
7. Water Supply: Share of schools with water available in the student’s bathroom.
It is important to note that the indicators of teacher qualification and facility characteristics are derived from the infrastructure
census and hence based on information from public schools only, while the indicators of accessibility derived from the
PODES core incorporate both public and private school facilities. Table IV.1 provides an overview of the seven selected
indicators of education supply readiness.
3. Available Rooms and Facility Characteristics
Table IV.1: Overview of Selected Education Indicators
Indicator Description
Access to ECED Share of the population living in villages with an early childhood education post (PAUD) in the village or
a Kindergarten/TK within 1 km of the village
Access to SMP Share of the population living in villages with a SMP within 6 (3) km
Teacher Qualification SD Share of SD with at least 2 teachers holding an S1 degree
Teacher Qualification SMP Average Share of SMP teachers holding an S1 degree
Laboratory in SMP Share of SMP with laboratory
Electrification Share of schools with electricity
Water Supply Share of schools with water available in the student’s bathroom

30 |
Table IV.2: Education Indicators: Descriptive Statistics
Table IV.3: Education Indicators: Correlations
Descriptive Statistics Obs. Mean SD Min Max
Access to ECED 6771 0.810 0.297 0 1
Access to SMP (6 km) 6771 0.887 0.216 0 1
Access to SMP (3 km) 6771 0.789 0.242 0 1
Teacher Qualification SD 6771 0.728 0.333 0 1
Teacher Qualification SMP 6771 0.756 0.250 0 1
Laboratory in SMP 6771 0.621 0.365 0 1
Electrification 6771 0.795 0.295 0 1
Water in Bathroom 6771 0.751 0.265 0 1
Correlations ECED SMP 6 km SMP 3 km S1 SD S1 SMP Lab SMP Electr.
Access to SMP (6 km) 0.68 1.00
Access to SMP (3 km) 0.68 0.87 1.00
Teacher Qualification SD 0.66 0.57 0.56 1.00
Teacher Qualification SMP 0.57 0.58 0.52 0.59 1.00
Laboratory in SMP 0.50 0.44 0.42 0.55 0.54 1.00
Electrification 0.65 0.58 0.55 0.68 0.55 0.54 1.00
Water in Bathroom 0.67 0.57 0.55 0.60 0.53 0.52 0.63
Consistent with the indicators of health (and transportation)
infrastructure, all seven education indicators are bounded
between 0 and 1, with larger values indicating larger supply
readiness. The descriptive statistics in Table IV.2 reveal that,
on average, about one fifth of the sub-district population has
no access to ECED facilities in the immediate vicinity. Junior
secondary schools are available within 6 km from the village
for an average of 89 percent of the sub-district population,
while an average of only 79 percent lives in places with
a SMP facility within 3 km distance. The sub-district
averages observed for the teacher qualification and building
IV.2. Description of the National Patterns of Infrastructure Availability
characteristics indicators show similar sub-district mean
values (0.73 to 0.80), while laboratories are available in only
62 percent of the SMP in the average sub-district.
All indicators are thereby positively correlated (Table IV.3),
with correlations ranging between 0.44 and 0.68. Similar to
the results for the health sector, we find consistent patterns
of infrastructure readiness across different dimensions of
education supply: areas with a high density of education
facilities are hence likely to provide more educated teaching
staff and better equipped schools as well.

31 |
Figure IV.1 provides a graphical overview of the distribution
of the education indicators. In 49 percent of the sub-
districts universal access to ECED facilities is given, while
in a total of 1,057 sub-districts less than 50 percent of the
population has access to these services. Junior secondary
schools are available within 3 km in 96 percent of the urban
neighborhoods, but only in 71 percent of the rural villages.
The MSS goal of a SMP facility within 6 km of villages in
remote areas is fulfilled for 86 percent of the rural villages.
However, we observe 173 sub-districts in which no village
has such access to junior secondary education.
The variations in average teacher qualification prove to be
even more substantial. On the one hand, in 32 percent of
the sub-districts, every SD school fulfills the target of having
at least two teachers with an S1 degree; on the other hand,
577 sub-districts do not have a single elementary school
In what follows, maps of all seven indicators present the regional patterns of infrastructure supply readiness.
The same classification as for the health indicators is used in order to simplify comparison.
Figure IV.1: Distribution of Education Supply Readiness Indicators
Share Villages with ECED Facility
Share Villages with ECED Facility
Share SD with at least 2 S1 Teachers
Per
cent
Per
cent
Share Villages with SMP within 6 km
Share Villages with SMP within 6 km
Share S1 Teachers in SMP
Share Villages with SMP within 3 km
Share Villages with SMP within 3 km
0 .1 .2 .3 .4 .5 .6 .7 .8 .9 1
0 .1 .2 .3 .4 .5 .6 .7 .8 .9 1
50
40
30
20
10
50
40
30
20
10
0 .1 .2 .3 .4 .5 .6 .7 .8 .9 1
0 .1 .2 .3 .4 .5 .6 .7 .8 .9 1
50
40
30
20
10
50
40
30
20
10
0 .1 .2 .3 .4 .5 .6 .7 .8 .9 1
50
40
30
20
10
Per
cent
0 .1 .2 .3 .4 .5 .6 .7 .8 .9 1
50
40
30
20
10
0 .1 .2 .3 .4 .5 .6 .7 .8 .9 1
50
40
30
20
10
0 .1 .2 .3 .4 .5 .6 .7 .8 .9 1
50
40
30
20
10
with at least two teachers holding an S1 degree. Large
disparities are also observed for the share of SMP teachers
with an S1 degree: In 877 or 13 percent of the sub-districts,
an average of less than 50 percent of the teaching force at
public junior secondary schools has an S1 degree, while
this rate is found above 90 percent in about one third of the
sub-districts.
Along similar lines, 16 percent of the sub-districts do not
provide a single SMP school equipped with a laboratory,
while in 37 percent of the sub-districts all SMP facilities
provide a laboratory. The availability of electricity and of
water in the student’s bathroom is also distributed unequally
across the country. In 44 percent of the sub-districts all
public schools have access to electricity; at the same time,
electricity is available in less than 50 percent of all public
schools in a total of 998 sub-districts.

32 |
While early childhood education facilities are readily available
in urban areas across the country (access given in 98
percent of urban neighborhoods), their prevalence in rural
areas is less common and characterized by huge regional
differences. High availability in Java and Bali (95 percent
of rural villages) is contrasted by substantially lower figures
for Sumatra (64%), Kalimantan (64%), NTT (63%), Maluku
/ Maluku Utara (49%), and Papua / Papua Barat (16%).
Moreover, substantial variations are present within regions
and provinces. For instance, striking differences in the
availability of ECED facilities are found between rural villages
in neighboring Sumatera Utara (48%) and Sumatera Barat
(96%). Likewise substantial variation is observed within the
province of Sulawesi Selatan, where universal availability of
ECED facilities is given in half of the rural sub-districts, but
13 percent of the rural sub-districts still report easy access
to ECED facilities for less than 50 percent of the population.
Figure IV.2: Map – Share of the Population with Access to ECED Facilities
Figure IV.3: Map – Share of the Population with SMP within 6 km from the Village
Dimension 1: Physical Availability And Accessibility
As for early childhood education facilities, access to junior
secondary schools is almost universally given in urban areas.
In 99 percent of the 13,361 urban neighborhoods across
Indonesia, a SMP is available within 6 km distance, in 96
percent within 3 km. The MSS goal of a SMP within 6 km
in remote areas is not fulfilled in 14 percent of Indonesia’s
rural villages, with the largest gaps in the Maluku provinces
(20%), Kalimantan (26%), and Papua / Papua Barat (52%).
Comparably comprehensive supply is found for rural villages
in Sulawesi (gap: 9%) and Sumatra (11%), with notable
differences across provinces in these regions. While the
average gap is even smaller for the rural areas of Java (4%)
and Bali (5%), the picture changes when the 3km distance
threshold is applied: only 81 percent of rural villages in Java
and 75 percent in Bali provide access to SMP education
facilities within 3 km. Interestingly, a relatively high supply
density in this sense is observed for the rural villages of
Sumatera Barat (84%), Sulawesi Utara (85%), Gorontalo
(86%), and NTB (92%).

33 |
Overall, 84 percent of the 134,290 public SD schools
covered by the infrastructure census employ at least two
teachers with an S1 degree. This MSS target is often fulfilled
in Bali (99%), the provinces of Java (96%), Sulawesi Selatan
(94%), and NTB (92%). Lowest rates of SD schools with at
least two teachers holding a bachelor’s degree are found for
Kalimantan Barat (47%), Maluku (41%), NTT (32%), Papua
Barat (30%), Maluku Utara (30%), and Papua (29%). Urban-
rural differences are thereby substantial, with 97 percent of
the urban SD schools meeting the MSS target, but only 78
percent of the schools in rural villages.
Figure IV.4: Map – Share of SD Schools with at least 2 ‘S1 Teachers’
Figure IV.3: Figure IV.5: Map – Average Share of SMP Teachers holding an S1 degree
Dimension 2: Teacher Qualification
In three out of four SMP schools, at least 70 percent of
the teachers hold an S1 degree, which is the MSS target.
When aggregating this information to the sub-district level,
the average share of SMP teachers with an S1 degree is
particularly high in urban sub-districts (85 percent vs. 61
percent in rural areas). While the overall mean value for
Javanese sub-districts is at a high 91 percent, an average
of only 86 and 73 percent of the SMP teachers holds an S1
degree in Java Barat and Banten, respectively. Comparably
high(er) sub-district averages are reported for Kalimantan
Selatan (88%) and Sulawesi Selatan (85%); lowest sub-
district averages from NTT (45%), Papua Barat (40%),
Kalimantan Barat (38%), Maluku (24%), and Papua (16%).

34 |
The indicator for SMP school laboratories shows the lowest
average score of all education supply readiness indicators,
as only 64 percent of all 21,486 public SMP schools provide
a laboratory for their students. SMP schools in urban areas
are quite well equipped (90 percent with laboratory), while
facilities in rural villages lag behind substantially (55 percent
with laboratory). The variation within regions thereby tends to
be larger than the variation across island groups. In Java, for
instance, the relatively good provision of SMP schools with
laboratories in Jawa Tengah (86 percent) is contrasted by a
low 54 percent of SMP schools with laboratories in Banten.
Figure IV.6: Map – Share of SMP with Laboratory
Figure IV.7: Map – Share of Schools with Electricity
Dimension 3: Facility Characteristics
The availability of electricity in schools varies greatly across
regions, with the overall spatial distribution being similar to
the patterns observed for the other indicators of education
supply readiness. Schools in urban areas usually have
access to electricity (99%), while power supply is given for
only 82 percent of the schools in rural areas. Across regions,
elementary schools show the lowest, and senior secondary
schools the highest rates of electrification. Table IV.4
provides an overview of the share of schools that provide
electricity and water in the student’s bathrooms, respectively,
by region and type of school.

35 |Figure IV.8: Map – Share of Schools with Water in the Student’s Bathroom
The second indicator of building characteristics shows a similar distribution across regions and school types: Water in the
student’s bathroom is provided in 82 percent of the country’s 164,561 public schools, with an overall availability of 95 percent
in urban areas and 76 percent in rural areas. Water supply is generally less predominant than electrification, though this trend
is reversed for the SD level in some regions (in particular Kalimantan).
Looking at differences across provinces, comparably low levels of water supply at public schools are observed for rural
areas in Aceh (67%), Sumatera Barat (60%), Banten (66%), Sulawesi Tengah (67%), and Sulawesi Barat (63%), as well as for
schools in the Moluccas (53%) and Papua / Papua Barat (38%).
Table IV.4: Share of Schools with Electricity and Water Supply – by Region and School Type
RegionElectricity Water in Student’s Bathroom
SD SMP SMA SMK SD SMP SMA SMK
Sumatra 80.7 86.8 95.1 90.7 73.7 79.6 88.7 84.1
Java & Bali 98.3 99.3 100 99.8 87.9 95.3 98.6 96.9
NTT & NTB 70.6 78.4 90.5 92.5 73.9 79.7 86.1 85.0
Kalimantan 68.7 82.7 92.4 93.0 80.7 86.0 92.9 93.8
Sulawesi 71.7 83.5 91.7 91.4 75.3 80.6 84.0 83.1
Maluku & North Maluku 58.7 64.2 77.3 76.0 56.2 60.0 59.9 61.0
Papua & Papua Barat 47.3 64.1 78.9 84.0 39.7 51.5 61.3 62.7

36 |
Table IV.5: Sub-Indices Education – Mean Values and Correlations
Sub-Index Mean Correlations
Availability Workforce Building
Physical Availability 0.823 1.00
Health Workforce 0.742 0.74 1.00
Building Characteristics 0.722 0.73 0.77 1.00
In order to summarize the information from the seven
indicators, we aggregate them into sub-indices for each
dimension as well as composite indices based on all
indicators. In general, the regional patterns of the supply
of basic education services in Indonesia are in line with the
results observed for the health sector. With the islands of
Java and Bali – on average – performing best and the region
of Papua lacking behind most, 25 percent of the sub-district
achieve a supply readiness score of 95 percent or better,
while 30 percent obtain a score of below 75 percent.13
Before discussing the composite indices of education supply
readiness in more detail, a brief description of the underlying
calculations is given.
Table IV.5 presents the mean values and pairwise
correlations of the sub-indices for the three dimensions
physical availability, teacher qualification, and facility
characteristics. The sub-indices are calculated as simple
averages of the respective indicators in each dimension. The
strong positive correlations among the sub-indices confirm
fairly consistent patterns of supply readiness across different
dimensions of the school system.
Similar to the composite indices of health supply readiness
(see section III.3), we combine the information from
the seven education indicators into one global index of
education supply readiness. We use the same three methods
as for the health sector to derive the seven indicators’
weights for the composite index: First, the weights are
determined based on policy preferences with three in
principle arbitrary weighting schemes: (i) a particularly
focus on facility availability, with the two access indicators
accounting for a total of 50 percent of the composite index
and the five remaining indicators accounting for 10 percent
each; and (ii) equal weights across the three dimensions
accessibility, teacher qualification, and facility characteristics.
For comparison, an alternative indicator of SMP availability is
used, with the threshold of accessibility being reduced from
6 km to 3 km.
IV.3. A Composite Index of Education Supply Readiness
13 These statistics are based on version A of the composite health index, where particular weight is given to the indicators of physical availability.

37 |
Second, weights are derived from a principal components
analysis of the seven indicators. Table IV.6 presents the
eigenvectors from the first principal component and the
resulting weights. As the weights are fairly similar across
indicators, we do not include an additional composite index
with equal weights across indicators (as is done for health).
Finally, we also link the supply readiness indicators to actual
outcomes of the education system; here using the average
SMP-level test scores from the 2010 national exam (UN) at
district level. Again, two methods are employed to assess
the relative importance of the different supply indicators for
the SMP students’ performance in the national exam: (i)
OLS regressions of the seven indicators are run on average
test scores at district level and the estimated coefficients
are used as weights; and (ii) based on the these OLS
regressions, concentration indices are used to account
for the indicator’s contribution to inequality in education
outcomes. Table IV.7 presents correlations between the
test scores and the seven indicators, as well as the OLS
regression estimates and the resulting weights for the
composite index.
Table IV.6: Principal Component Analysis Education Indicators
Indicators Eigenvector Weight
Access to ECED 0.401 0.152
Access to SMP (6 km) 0.372 0.141
Teacher Qualification SD 0.394 0.149
Teacher Qualification SMP 0.365 0.138
Laboratory in SMP 0.339 0.128
Electrification 0.391 0.148
Water in Bathroom 0.381 0.144
2.824 1.000
Table IV.7: OLS Regression Results: Determinants of Average UN Test Scores (SMP)
Indicator 1. Correlation 2. OLS I 3. OLS II 4. Weights
Access to ECED 0.29 -5.58***
(0.001)
-5.86***
(0.000)
Access to SMP (6 km) 0.37 7.66***
(0.000)
7.18***
(0.000)
0.302
Teacher Qualification SD 0.47 6.96***
(0.000)
6.53***
(0.000)
0.275
Teacher Qualification SMP 0.35 -2.17
(0.267)
Laboratories in SMP 0.46 6.29***
(0.000)
6.08***
(0.000)
0.256
Electrification 0.43 3.98**
(0.010)
3.95**
(0.011)
0.166
Water in Bathroom 0.27 -7.61***
(0.000)
-7.74***
(0.000)
Observations: 479 479
R2: 0.320 0.319
P-values in parentheses. Statistical significance: * at 10%; ** at 5%; *** at 1%. Constant included.

38 |
Column 1 shows significantly positive correlations between
the indicators of education supply readiness and the average
UN score, hence confirming the choice of indicators. To
assess these positive correlations further, we run simple
OLS regressions on test score averages at district level and
obtain positive regression coefficients for four out of the
seven control variables / indicators (column 2). In column
3, the insignificant indicator of SMP teacher qualification
is excluded and the weights for the composite index are
derived from the estimated coefficients (column 4)14. While
this is a simple way of assessing the determinants of
education outcomes, the results provide one alternative
approach to the determination of weights.
The second alternative to determine weights based on
regression estimates uses the concept of the concentration
index to assess the indicator’s contribution to inequality
in test scores (a more detailed description of the method
is given in Appendix 1). Table IV.8 presents the results for
this approach. We start from the OLS II regression of the
seven supply indicators on average SMP test scores. The
concentration index for the outpatient utilization rates equals
0.0064, which indicates a slightly pro-rich distribution of
(higher) test scores. Decomposing the concentration indices
for all covariates results in all positive values (column 2),
which points to relatively higher average test scores in
wealthier districts.
With all positive concentration indices, the contribution
of each covariate to the overall inequality in test scores is
determined by the sign of the regression coefficient and the
subsequent elasticity. The residual component is relatively
small, indicating that the supply indices explain a substantial
part of inequality in education outcomes. As to translate
these results to weights, the indicators with a negative
contribution are given a weight of zero and the other
contributions are rescaled so they sum to 1.
Table IV.8: Education Indicators: Decomposition of the Concentration Index
Indicator 1. Coefficients 2. CI 3. Contribution 4. Percent 5. Weights
Access to ECED -5.86 0.0833 -0.0055 -86.4
Access to SMP (6 km) 7.18 0.0425 0.0038 59.1 0.194
Teacher Qualification SD 6.53 0.1088 0.0072 112.3 0.367
Teacher Qualification SMP
Laboratory in SMP 6.08 0.1026 0.0054 84.4 0.276
Electrification 3.95 0.0733 0.0032 50.2 0.163
Water in Bathroom -7.74 0.0858 -0.0070 -109.6
Residual -0.0007 -10.0
Total 0.0064 100.0 1.000
14 Similar to the approach for the health index, indicators with negative regression coefficient is given zero weight, and the remaining coefficients are
rescaled in order to sum to 1.

39 |
This leaves us with a total of six alternative weighting
schemes for the composite index of education infrastructure
supply readiness. Table IV.9 summarizes the weights of
the seven indicators for each of the six alternative indices.
While the composite indices A to C use the full set of seven
indicators, versions D and E are based on the regressions on
UN test scores and result in the exclusion of three indicators.
Tables IV.10 and IV.11 provide descriptive statistics
and pairwise correlations for the six composite indices,
respectively. Like the underlying indicators, the composite
indices are bounded between 0 and 1, with higher values
indicating higher supply readiness. The average Indonesian
sub-district achieves a score of around 0.77 or 77 percent,
dependent on the weighting scheme used.15 Using
Table IV.9: Overview of Weights for the Composite Education Indices
Table IV.10: Composite Education Indices: Descriptive Statistics
Table IV.11: Composite Education Indices: Correlations
Index ECED SMP 6 km S1 SD S1 SMP Lab SMP Electr. Bathroom
A. Focus Access 0.250 0.250 0.100 0.100 0.100 0.100 0.100
A1. SMP Distance 3 km 0.250 0.250 (3km) 0.100 0.100 0.100 0.100 0.100
B. Equal Dimension 0.166 0.166 0.166 0.166 0.111 0.111 0.111
C. PCA 0.152 0.141 0.149 0.138 0.128 0.148 0.144
D. Utilization OLS 0.302 0.275 0.256 0.166
E. Utilization CI 0.194 0.367 0.276 0.163
Descriptives Obs. Mean SD Min Max
A. Focus Access 6771 0.789 0.227 0 1
A1: SMP Distance 3 km 6771 0.765 0.231 0 1
B. Equal Dimension 6771 0.771 0.230 0 1
C. PCA 6771 0.766 0.231 0 1
D. Utilization OLS 6771 0.759 0.245 0 1.00
E. Utilization CI 6771 0.740 0.260 0 1
Correlations A A1 B C D
A1: SMP Distance 3 km 0.99 1.00
B: B: Equal Dimension 0.99 0.98 1.00
C: C: PCA 0.99 0.98 1.00 1.00
D: D: Utilization OLS 0.95 0.94 0.97 0.97 1.00
E: E: Utilization CI 0.93 0.92 0.96 0.96 1.00
composite index A as reference, both the highest possible
score of 1 (36 sub-districts) and the lowest possible score of
0 (99 sub-districts) are observed.
The alternative weighting schemes have little impact on the
distribution of the composite indices. This is confirmed by
extremely high correlations between the different versions of
the composite indices. Versions A to C are almost identical,
which is due to similar weights and the positive correlations
between the seven sub-indicators. Even with the reduced
set of underlying indicators (versions D and E), correlations
are still above 0.92. Finally, the similarity of the different
composite indicators is confirmed by their almost identical
distribution (Figure IV.9).
15 Index E provides a slightly lower average score due to the relatively large weight given to the indices of teacher qualification in SD and laboratories in
SMP, which both show relatively low averages themselves.

40 |
The similarity of the different composite indices translates
into accordingly similar spatial patterns. Representative of all
composite indices, Figure IV.10 maps the spatial distribution
of index A.
Figure IV.9: Distribution of Alternative Composite Indices of Education Supply Readiness
A: Focus Availability
C: PCA
A1: Index A with SMP 3 km
D: Utilization OLS
B: Equal Weights Dimensions
E: Utilization CI
Per
cent
Per
cent
0 .1 .2 .3 .4 .5 .6 .7 .8 .9 1
0 .1 .2 .3 .4 .5 .6 .7 .8 .9 1
0 .1 .2 .3 .4 .5 .6 .7 .8 .9 1
0 .1 .2 .3 .4 .5 .6 .7 .8 .9 1
0 .1 .2 .3 .4 .5 .6 .7 .8 .9 1
0 .1 .2 .3 .4 .5 .6 .7 .8 .9 1
25
20
15
10
5
25
20
15
10
5
25
20
15
10
5
25
20
15
10
5
25
20
15
10
5
25
20
15
10
5
Figure IV.10: Map – Composite Index of Education Supply Readiness (Index A)
On average, sub-districts in Bali (0.96) and Java (0.94)
achieve the highest levels of education supply readiness,
average scores are observed for Sulawesi (0.81), Sumatra
(0.80), Kalimantan (0.74), and NTT & NTB (0.72), while the
Moluccas (0.60) and in particular Papua / Papua Barat (0.30)
lag behind substantially. The overall gap between urban
(0.93) and rural (0.70) sub-districts is likewise significant.
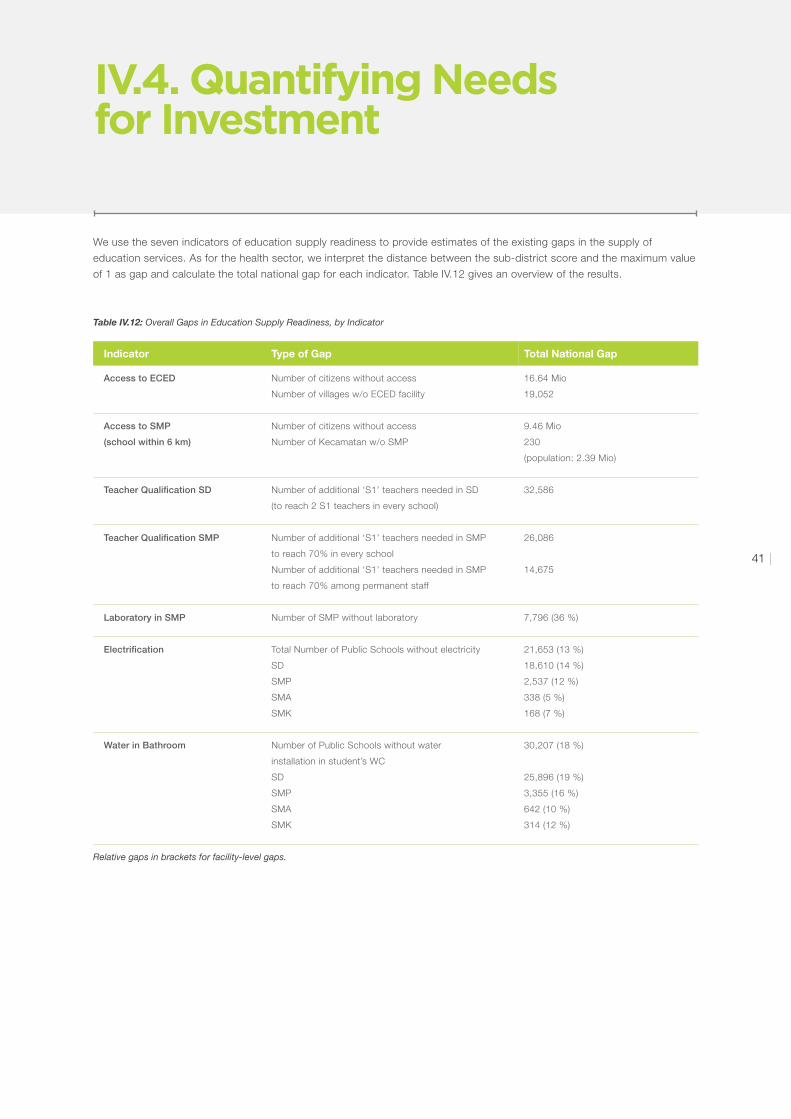
41 |
Table IV.12: Overall Gaps in Education Supply Readiness, by Indicator
Relative gaps in brackets for facility-level gaps.
Indicator Type of Gap Total National Gap
Access to ECED Number of citizens without access
Number of villages w/o ECED facility
16.64 Mio
19,052
Access to SMP
(school within 6 km)
Number of citizens without access
Number of Kecamatan w/o SMP
9.46 Mio
230
(population: 2.39 Mio)
Teacher Qualification SD Number of additional ‘S1’ teachers needed in SD
(to reach 2 S1 teachers in every school)
32,586
Teacher Qualification SMP Number of additional ‘S1’ teachers needed in SMP
to reach 70% in every school
Number of additional ‘S1’ teachers needed in SMP
to reach 70% among permanent staff
26,086
14,675
Laboratory in SMP Number of SMP without laboratory 7,796 (36 %)
Electrification Total Number of Public Schools without electricity
SD
SMP
SMA
SMK
21,653 (13 %)
18,610 (14 %)
2,537 (12 %)
338 (5 %)
168 (7 %)
Water in Bathroom Number of Public Schools without water
installation in student’s WC
SD
SMP
SMA
SMK
30,207 (18 %)
25,896 (19 %)
3,355 (16 %)
642 (10 %)
314 (12 %)
We use the seven indicators of education supply readiness to provide estimates of the existing gaps in the supply of
education services. As for the health sector, we interpret the distance between the sub-district score and the maximum value
of 1 as gap and calculate the total national gap for each indicator. Table IV.12 gives an overview of the results.
IV.4. Quantifying Needs for Investment

42 |
For the two indicators of physical availability, the number
of citizen without easy access to the respective services is
calculated. As no village-level information on the number
of children at different ages is available, an estimate of the
number of ‘eligible’ children without easy access cannot be
provided. Drawing on total population numbers instead, we
find 16.6 million people with no immediate access to early
childhood development facilities. Out of the 19,052 villages
with no ECED facility in the village or within 1 km distance,
99 percent are in rural areas. A similar urban-rural divide is
observed for access to junior secondary schools, with an
SMP available within 6 km (3 km) in 99 percent (96 percent)
of all urban neighborhoods.
Table IV.13: Access to Education Facilities – Absolute and Relative Gaps
‘Share Kec. below 0.75’ reports the regional distribution of the 694 sub-districts with an indicator score below 0.75.‘Share People’ reports the regional share in the total number of people without access.
Region
Access to ECED SMP within 6 km
Share Kec.
below 0.75
Share People Share Kec.
below 0.75
Share People
Sumatra 34.2 41.2 16.3 27.7
Java & Bali 3.1 13.7 3.6 26.4
NTT & NTB 7.6 8.4 7.5 6.6
Kalimantan 11.4 12.4 18.8 14.7
Sulawesi 9.6 8.2 6.3 7.6
Maluku & North Maluku 6.2 4.1 4.1 2.3
Papua & Papua Barat 28.1 12.0 43.5 14.6
Absolute Numbers 1,77 16.64 Mio. 978 9.46 Mio.
Table IV.13 provides an overview of the regional distribution
of (i) the sub-districts with access rates below 75 percent;
and (ii) the number of people without easy access to ECED
facilities and SMP, respectively. Most sub-districts with
access rates to ECED facilities below 75 percent are found
in Sumatra (34 % of the 1,770 sub-districts) and Papua (28
%). When looking at the absolute numbers of people without
easy access (hence accounting for population densities), the
picture changes, with 41 percent of these citizens living in
Sumatra, but only 12 percent in the Papua provinces.
1. Physical Availability and Accessibility
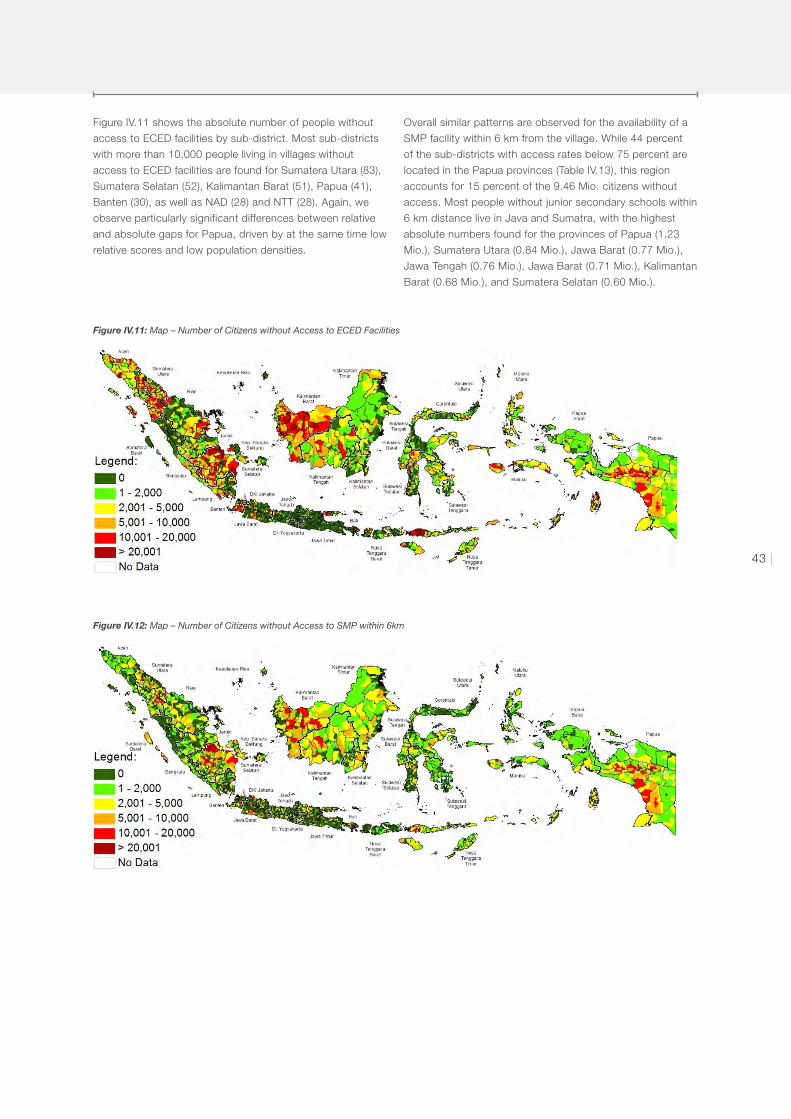
43 |
Figure IV.11: Map – Number of Citizens without Access to ECED Facilities
Figure IV.12: Map – Number of Citizens without Access to SMP within 6km
Figure IV.11 shows the absolute number of people without
access to ECED facilities by sub-district. Most sub-districts
with more than 10,000 people living in villages without
access to ECED facilities are found for Sumatera Utara (83),
Sumatera Selatan (52), Kalimantan Barat (51), Papua (41),
Banten (30), as well as NAD (28) and NTT (28). Again, we
observe particularly significant differences between relative
and absolute gaps for Papua, driven by at the same time low
relative scores and low population densities.
Overall similar patterns are observed for the availability of a
SMP facility within 6 km from the village. While 44 percent
of the sub-districts with access rates below 75 percent are
located in the Papua provinces (Table IV.13), this region
accounts for 15 percent of the 9.46 Mio. citizens without
access. Most people without junior secondary schools within
6 km distance live in Java and Sumatra, with the highest
absolute numbers found for the provinces of Papua (1.23
Mio.), Sumatera Utara (0.84 Mio.), Jawa Barat (0.77 Mio.),
Jawa Tengah (0.76 Mio.), Jawa Barat (0.71 Mio.), Kalimantan
Barat (0.68 Mio.), and Sumatera Selatan (0.60 Mio.).
44 |
Turning to the indicators of teacher qualification, we
calculate the number of additional teachers with an S1
degree needed to reach the targets of (i) at least two ‘S1’
teachers in each SD school and (ii) at least 70 percent of
teachers with S1 degree in each SMP school, respectively.
Under the assumption of a constant total teaching force,
32,586 SD teachers and 26,086 SMP teachers would
need to obtain a bachelor’s degree or be replaced by new
teachers with this qualification. However, these numbers may
be seen as upper-bound estimates for at least two reasons.
First, we also consider temporarily hired teachers here. For
instance, the number of additionally needed SMP teachers
with an S1 degree decreases to 14,675 when the 70 percent
goal is to be achieved among permanent staff only. Second,
recent studies point to an over-supply of teachers especially
in small schools in rural areas (World Bank, 2010), which
would call into question the underlying assumption of a
constant teaching force.
Nevertheless, the numbers provide insight into the
spatial distribution of teacher (under)qualification. Out
of the estimated 32,856 additional SD teachers with S1
qualification, 11.1 percent would need to be hired in
2. Teacher Qualification
The assessment of existing gaps with respect to building
characteristics reveals that a total of 21,653 public schools
lack electricity and 30,207 schools do not provide water
in the student’s bathroom. Most of these schools are
elementary schools, which account for 86 percent of the
schools both without electricity and water in the student’s
bathroom. Most of the schools without electricity are thereby
found in Sumatra (7,337), Sulawesi (4,701) and Kalimantan
(4,010). Water in the student’s bathroom is not available in
10,256 public schools in Sumatra, 8,276 in Java, 4,379 in
Sulawesi, and 2,574 in Kalimantan
3. Building Characteristics
Sumatera Utara, 10.4 percent in Kalimantan Barat, 9.6
percent in NTT, as well as 7.5 and 6.4 percent in the Maluku
and Papua provinces, respectively. At SMP level, the target
of having at least 70 percent of the teaching force holding
an S1 degree would require the qualification/replacement of
2,180 ‘non-S1 teachers’ in the province of Sumatera Utara,
2,094 in NAD, 2,012 in Jawa Barat, 1,832 in Kalimantan
Barat, 1,739 in NTT, and 1,713 in Maluku.
45 |
V. TRANSPORTATION INFRASTRUCTURE

46 |
The analysis of transportation infrastructure draws on the
transportation module of the PODES core, which provides
some information on the physical availability and accessibility
of infrastructure. Within this dimension we discern three
categories and six indicators.
V.1. Selection of Supply Readiness Indicators
16 Only villages with at least one bridge are considered for this indicator, which prevents us from calculating this indicator for a total of 301 sub-districts
that lack any bridges.
The information available on road characteristics is based
on subjective assessment of the type and quality of the main
road in a village.
• Surface of the Main Road: This indicator reflects the
share of villages for which the main road has a hardened
surface, made of either asphalt/concrete or gravel/stone.
The main road is defined as the widest road heading to
the highway that leads to the nearest district head’s office.
• Condition of the Main Road: share of the villages for which
the main road is considered to be in “good” condition,
which implies that the road suffers from no or just minor
damages (in contrast to damage along most or all of the
road).
1. Characteristics of Main Roads
The village census asks village heads about the condition of
the existing bridges in the village and the requirements for
new bridges in the villages, providing the following indicators:
• Condition of the Bridges: share of the villages for which
the bridges are considered to be in “good” condition or to
suffer from just minor damage (in contrast to moderate or
heavy damages).16
• Need for New Bridges: share of the villages that indicate
that additional bridges are required.
Finally, we use information on the availability of public
transport from the village head’s office to (i) the offices of
the sub-district head; and (ii) the district regent or major. We
focus only on public transport that follows a fixed route.
• Public Transport to Sub-district Head: share of the villages
where public transport to the office of the sub-district
head is available and follows a fixed route.
• Public Transport to Regent/Major: share of the villages
where public transport to the office of the regent or major
is available and follows a fixed route.
The six indicators of infrastructure supply readiness are listed
in Table V.1 below.
2. Characteristics of Bridges
3. Availability of Public Transport
Dimension Indicator Description
Characteristics Main Road
Surface of Main Road Share of villages with main road surface being either asphalt/
concrete or gravel/stone etc.
Condition of Main Road Share of villages with main road with no or minor damages
Characteristics BridgesCondition of Bridges Share of villages with bridges with no or minor damages
Need for New Bridges Share of villages that report no need for new bridge(s)
Availability of Public Transport
Public Transport to
Sub-district Head
Share of villages with public transport with fixed route to the
office of the sub-district head
Public Transport to
Regent/Mayor
Share of Villages with public transport with fixed route to the
office of the regent/major
Table V.1: Available Information on Transportation Infrastructure from PODES
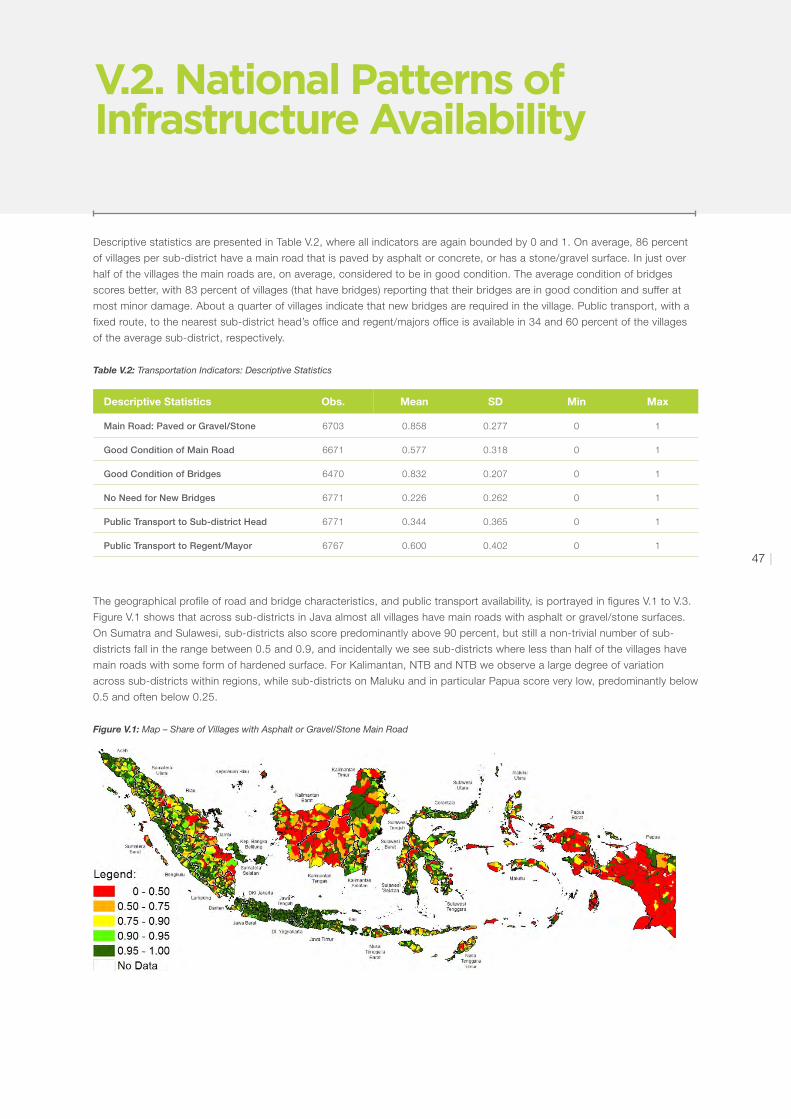
47 |
Table V.2: Transportation Indicators: Descriptive Statistics
Descriptive Statistics Obs. Mean SD Min Max
Main Road: Paved or Gravel/Stone 6703 0.858 0.277 0 1
Good Condition of Main Road 6671 0.577 0.318 0 1
Good Condition of Bridges 6470 0.832 0.207 0 1
No Need for New Bridges 6771 0.226 0.262 0 1
Public Transport to Sub-district Head 6771 0.344 0.365 0 1
Public Transport to Regent/Mayor 6767 0.600 0.402 0 1
Descriptive statistics are presented in Table V.2, where all indicators are again bounded by 0 and 1. On average, 86 percent
of villages per sub-district have a main road that is paved by asphalt or concrete, or has a stone/gravel surface. In just over
half of the villages the main roads are, on average, considered to be in good condition. The average condition of bridges
scores better, with 83 percent of villages (that have bridges) reporting that their bridges are in good condition and suffer at
most minor damage. About a quarter of villages indicate that new bridges are required in the village. Public transport, with a
fixed route, to the nearest sub-district head’s office and regent/majors office is available in 34 and 60 percent of the villages
of the average sub-district, respectively.
The geographical profile of road and bridge characteristics, and public transport availability, is portrayed in figures V.1 to V.3.
Figure V.1 shows that across sub-districts in Java almost all villages have main roads with asphalt or gravel/stone surfaces.
On Sumatra and Sulawesi, sub-districts also score predominantly above 90 percent, but still a non-trivial number of sub-
districts fall in the range between 0.5 and 0.9, and incidentally we see sub-districts where less than half of the villages have
main roads with some form of hardened surface. For Kalimantan, NTB and NTB we observe a large degree of variation
across sub-districts within regions, while sub-districts on Maluku and in particular Papua score very low, predominantly below
0.5 and often below 0.25.
V.2. National Patterns of Infrastructure Availability
Figure V.1: Map – Share of Villages with Asphalt or Gravel/Stone Main Road
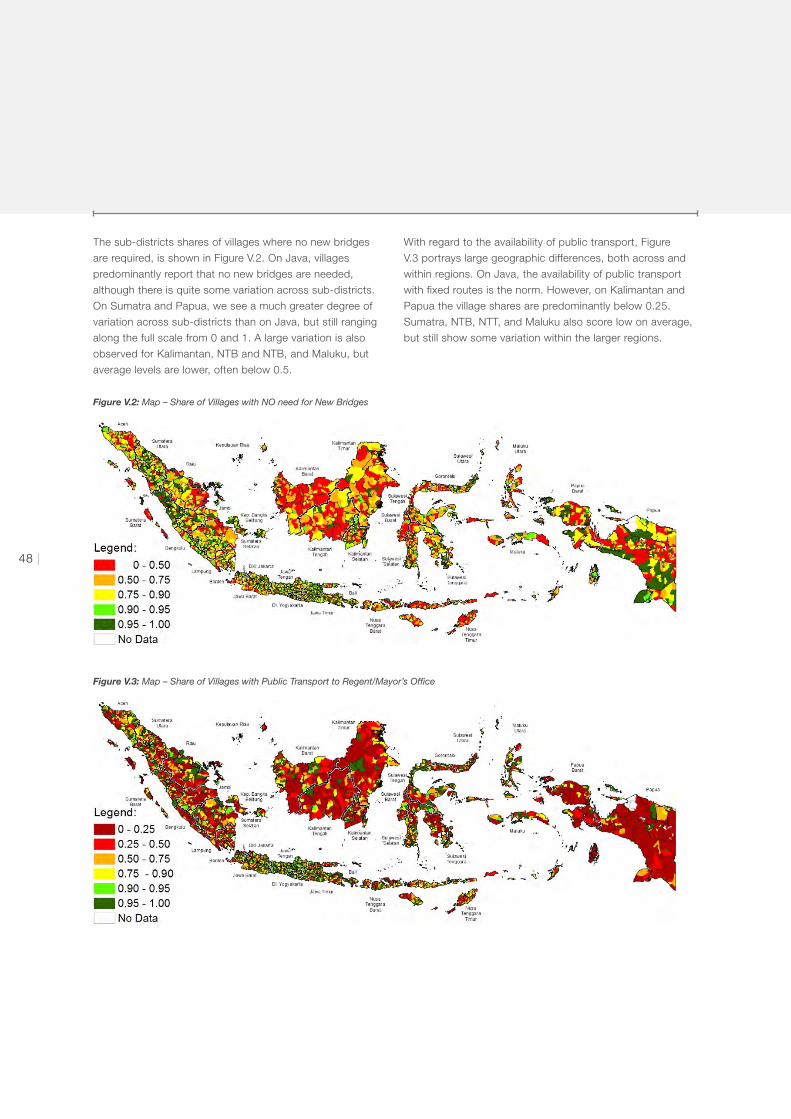
48 |
Figure V.2: Map – Share of Villages with NO need for New Bridges
Figure V.3: Map – Share of Villages with Public Transport to Regent/Mayor’s Office
The sub-districts shares of villages where no new bridges
are required, is shown in Figure V.2. On Java, villages
predominantly report that no new bridges are needed,
although there is quite some variation across sub-districts.
On Sumatra and Papua, we see a much greater degree of
variation across sub-districts than on Java, but still ranging
along the full scale from 0 and 1. A large variation is also
observed for Kalimantan, NTB and NTB, and Maluku, but
average levels are lower, often below 0.5.
With regard to the availability of public transport, Figure
V.3 portrays large geographic differences, both across and
within regions. On Java, the availability of public transport
with fixed routes is the norm. However, on Kalimantan and
Papua the village shares are predominantly below 0.25.
Sumatra, NTB, NTT, and Maluku also score low on average,
but still show some variation within the larger regions.
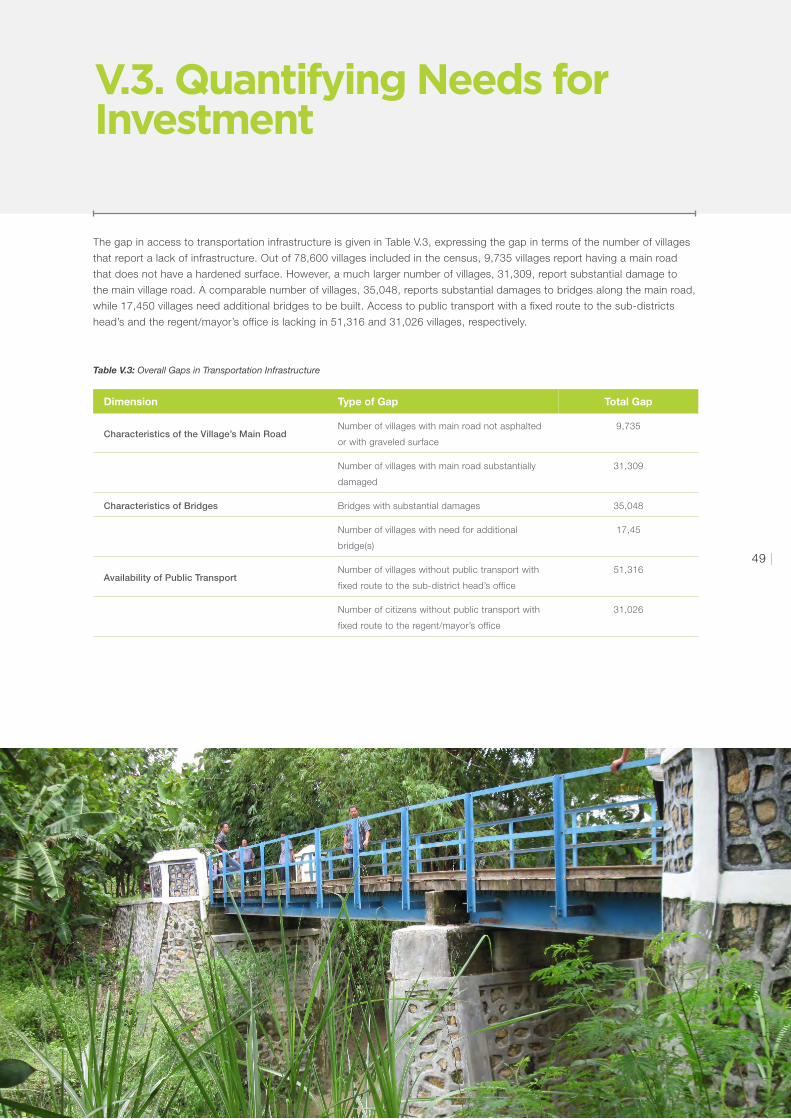
49 |
The gap in access to transportation infrastructure is given in Table V.3, expressing the gap in terms of the number of villages
that report a lack of infrastructure. Out of 78,600 villages included in the census, 9,735 villages report having a main road
that does not have a hardened surface. However, a much larger number of villages, 31,309, report substantial damage to
the main village road. A comparable number of villages, 35,048, reports substantial damages to bridges along the main road,
while 17,450 villages need additional bridges to be built. Access to public transport with a fixed route to the sub-districts
head’s and the regent/mayor’s office is lacking in 51,316 and 31,026 villages, respectively.
V.3. Quantifying Needs for Investment
Table V.3: Overall Gaps in Transportation Infrastructure
Dimension Type of Gap Total Gap
Characteristics of the Village’s Main RoadNumber of villages with main road not asphalted
or with graveled surface
9,735
Number of villages with main road substantially
damaged
31,309
Characteristics of Bridges Bridges with substantial damages 35,048
Number of villages with need for additional
bridge(s)
17,45
Availability of Public TransportNumber of villages without public transport with
fixed route to the sub-district head’s office
51,316
Number of citizens without public transport with
fixed route to the regent/mayor’s office
31,026
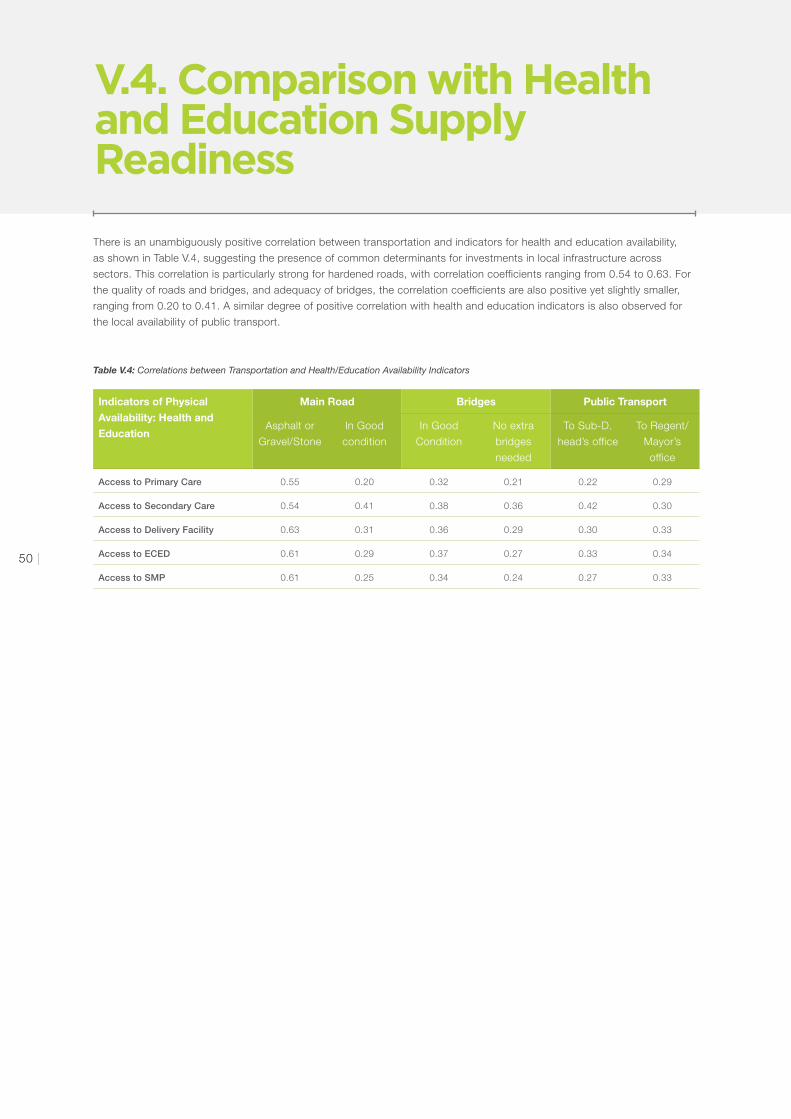
50 |
There is an unambiguously positive correlation between transportation and indicators for health and education availability,
as shown in Table V.4, suggesting the presence of common determinants for investments in local infrastructure across
sectors. This correlation is particularly strong for hardened roads, with correlation coefficients ranging from 0.54 to 0.63. For
the quality of roads and bridges, and adequacy of bridges, the correlation coefficients are also positive yet slightly smaller,
ranging from 0.20 to 0.41. A similar degree of positive correlation with health and education indicators is also observed for
the local availability of public transport.
V.4. Comparison with Health and Education Supply Readiness
Table V.4: Correlations between Transportation and Health/Education Availability Indicators
Indicators of Physical
Availability: Health and
Education
Main Road Bridges Public Transport
Asphalt or
Gravel/Stone
In Good
condition
In Good
Condition
No extra
bridges
needed
To Sub-D.
head’s office
To Regent/
Mayor’s
office
Access to Primary Care 0.55 0.20 0.32 0.21 0.22 0.29
Access to Secondary Care 0.54 0.41 0.38 0.36 0.42 0.30
Access to Delivery Facility 0.63 0.31 0.36 0.29 0.30 0.33
Access to ECED 0.61 0.29 0.37 0.27 0.33 0.34
Access to SMP 0.61 0.25 0.34 0.24 0.27 0.33

51 |
VI. SUMMARY OF RESULTS AND POLICY RECOMMENDATIONS
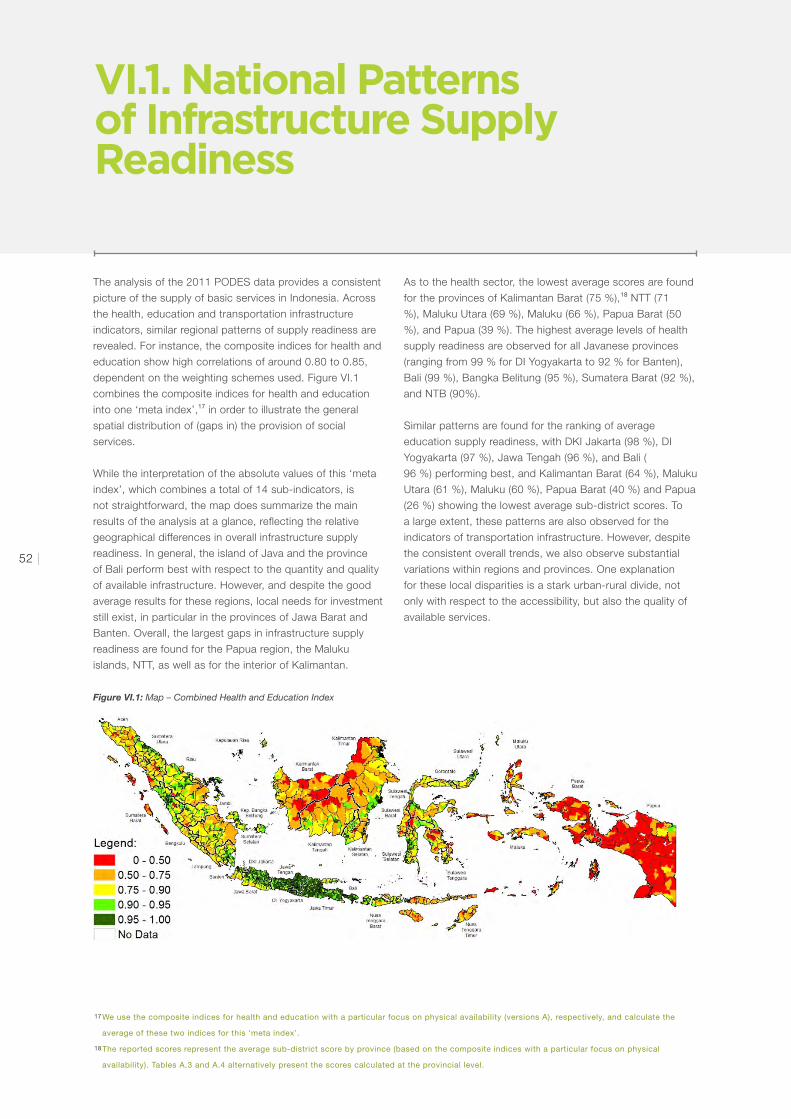
52 |
VI.1. National Patterns of Infrastructure Supply Readiness
The analysis of the 2011 PODES data provides a consistent
picture of the supply of basic services in Indonesia. Across
the health, education and transportation infrastructure
indicators, similar regional patterns of supply readiness are
revealed. For instance, the composite indices for health and
education show high correlations of around 0.80 to 0.85,
dependent on the weighting schemes used. Figure VI.1
combines the composite indices for health and education
into one ‘meta index’,17 in order to illustrate the general
spatial distribution of (gaps in) the provision of social
services.
While the interpretation of the absolute values of this ‘meta
index’, which combines a total of 14 sub-indicators, is
not straightforward, the map does summarize the main
results of the analysis at a glance, reflecting the relative
geographical differences in overall infrastructure supply
readiness. In general, the island of Java and the province
of Bali perform best with respect to the quantity and quality
of available infrastructure. However, and despite the good
average results for these regions, local needs for investment
still exist, in particular in the provinces of Jawa Barat and
Banten. Overall, the largest gaps in infrastructure supply
readiness are found for the Papua region, the Maluku
islands, NTT, as well as for the interior of Kalimantan.
Figure VI.1: Map – Combined Health and Education Index
As to the health sector, the lowest average scores are found
for the provinces of Kalimantan Barat (75 %),18 NTT (71
%), Maluku Utara (69 %), Maluku (66 %), Papua Barat (50
%), and Papua (39 %). The highest average levels of health
supply readiness are observed for all Javanese provinces
(ranging from 99 % for DI Yogyakarta to 92 % for Banten),
Bali (99 %), Bangka Belitung (95 %), Sumatera Barat (92 %),
and NTB (90%).
Similar patterns are found for the ranking of average
education supply readiness, with DKI Jakarta (98 %), DI
Yogyakarta (97 %), Jawa Tengah (96 %), and Bali (
96 %) performing best, and Kalimantan Barat (64 %), Maluku
Utara (61 %), Maluku (60 %), Papua Barat (40 %) and Papua
(26 %) showing the lowest average sub-district scores. To
a large extent, these patterns are also observed for the
indicators of transportation infrastructure. However, despite
the consistent overall trends, we also observe substantial
variations within regions and provinces. One explanation
for these local disparities is a stark urban-rural divide, not
only with respect to the accessibility, but also the quality of
available services.
17 We use the composite indices for health and education with a particular focus on physical availability (versions A), respectively, and calculate the
average of these two indices for this ‘meta index’.
18 The reported scores represent the average sub-district score by province (based on the composite indices with a particular focus on physical
availability). Tables A.3 and A.4 alternatively present the scores calculated at the provincial level.

53 |
The 2011 PODES infrastructure census provides detailed and up-to-date information on the availability and quality of basic
infrastructure in Indonesia. The various indicators developed through this analysis may, therefore, constitute a valuable
tool for informing national and local governments, international organizations, and NGOs alike, on regional variation in
infrastructure investment needs. Potential applications of these data include:
• Improve targeting of PNPM and other government programs: Based on a complete and comprehensive picture of
remaining deficits in the provision of basic infrastructure, the indicators can contribute to an improved targeting of PNPM
and other government programs.
• Contribute to the provision, assessment, and improvement of social services in Indonesia: Actively disseminating the data
can foster its usage by the various public and private stakeholders that are engaged in the provision of social services in
Indonesia. This awareness of the data would thereby also help avoid the costly collection of already existent information.
• Support efforts to improve transparency and accountability at local level: Regional and local inequities can be identified
given the implementation of the analysis at sub-district level. The public dissemination of the indicators may contribute to
increased transparency, and, hence, political accountability at local level.
• Provide the basis for follow-up analyses and the continuous monitoring of infrastructure supply readiness: The present
assessment of the local supply of basic services offers various opportunities for follow-up analyses.
– The results from the PODES data should be compared with related surveys of local health and education infrastructure
in order to further evaluate the reliability of the data and to bring together available information, where possible. The
assessment of the quality of the provided indicators may also be complemented by qualitative fieldwork.
– If data on cost values are available, the results can also be used to estimates the financing gap of addressing the
existing infrastructure deficit at the national, regional and local levels
– Combining the PODES indicators with other socio-economic datasets will facilitate research into the determinants of
local service supply, demand, and outcomes.
– To this end, it is not only desirable to regularly conduct the PODES core survey, but also to repeat the infrastructure
census in the future, thus enabling continuous monitoring of the quantity and quality of village infrastructure. Keeping
track of changes over time will enable a more rigorous evaluation of social programs.
If the infrastructure census is conducted again in the future, we suggest the following changes and amendments:
• The health survey covers a subset of public health facilities. Subject to budget restrictions, other public and private
facilities, such as hospitals or polyclinics, should be included for completeness.
• The information on the services offered by health facilities could be expanded and, in part, be rendered more precisely.
In particular, further information on available medical equipment, supplies, and treatments would provide an interesting
supplement to assess the quality of services.
• The education survey is confined to public facilities. Again subject to budgetary constraints, the inclusion of private facilities
would be particularly useful in the area of secondary schooling, where private schools account for a substantial share of
the existent facilities. Moreover, no facility-level information is collected on early childhood education facilities.
VI.2. Policy Recommendations

54 |
• Olken B., J. Onishi and S. Wong (2011), ‘ Indonesia’s PNPM Generasi Program: Final Impact
Evaluation Report’, Unpublished Draft.
• World Bank (2011), ‘ Program Keluarga Harapan: Impact Evaluation Report of Indonesia’s
Household Conditional Cash Transfer Program’, World Bank Office Jakarta, Unpublished Draft.
• World Bank (2010), ‘Transforming Indonesia’s Teaching Force, Volume 1: Executive Summary’,
Report No. 53732-ID, The World Bank Office Jakarta.
• World Health Organization (2011), ‘Measuring Service Availability and Readiness: Service
Availability Indicators’, Geneva.
REFERENCES

55 |
Appendix 1: Decomposition of Concentration Indices
An alternative method for determining weights is to assess the policy priority of the various indices in terms of their
contribution to inequality in access to health care and education services, respectively. In what follows, we describe the
method for the determination of weights for the composite health index. The approach for the composite education index
follows the methodology, using test scores from the national exams instead of utilization rates as outcome variable.
Inequality in health care utilization can be expressed in terms of a concentration index:
where h is health care utilization, μ is the mean of h, and r is the district fractional rank in the national distribution of some
welfare measure.
The determinants of health care utilization can be assessed through a linear regression:
Inequality in health care utilization can then be decomposition into individual contributions of these determinants:
While the regression coefficients describe what determines average health care utilization, the decomposed CI describes
to what extent these determinants contribute to inequality in health care utilization across districts. This contribution is
the product of (1) the responsiveness (or elasticity) of health care utilization with respect to various types of health care
supply, and (2) inequality in the distribution of this health care supply across districts. For example, variable x may be a
good predictor of health care utilization, but it will only contribute to inequality of health care utilization if it is itself unequally
distributed. That is, if x is equally distributed across districts, then the effect of changing x will be similar across districts.
APPENDIX

56 |
Appendix 2: Alternative Indicators of Health Personnel
For comparison, the following four population-based indicators of health workforce are briefly described:
• Number of Physicians per 10,000 Population [Target: 1 Physician per 10,000]
• Number of Midwives per 10,000 Population
• Number of Nurses per 10,000 Population
• Number of Core Medical Professionals (Physicians, Midwives, Nurses) per 10,000 Population [WHO Target: 23]
Table A.1 provides descriptive statistics for the six indicators. In the average sub-district, 1.6 physicians, 7.2 midwives, and
9.5 nurses are available per 10,000 inhabitants, which results in 18.3 core health professionals per 10,000 population. We
calculate score indicators for the availability of physicians and core health professionals, using 1 physician and 23 core health
professionals per 10,000 population as target, respectively. Table A.2 reports the correlations between the population-based
indicators and the seven core indicators selected for the index. The consistently insignificant or negative correlations point to
a structurally different picture of health service supply that is obtained from population-based indicators, as compared to the
results from all seven core indicators of health supply readiness.
Descriptives n Mean SD Min Max
Physicians per 10,000 Population 6771 1.6 2.7 0 52.1
Midwives per 10,000 Population 6771 7.2 7.0 0 208.5
Nurses per 10,000 Population 6771 9.5 13.1 0 300.8
Core Medical Professionals per
10,000 Pop.
6771 18.3 17.9 0 433.2
Core Medical Professionals Score
(23=100)
6771 0.621 0.289 0 1
Physicians Score (max=1)* 6771 0.637 0.415 0 1
Correlation with the other Index-Variables
Primary Secondary Delivery Physician Midwife Water Electr.
Physicians per 10,000 Pop. 0.07 0.11 0.07 0.16 0.02 0.08 0.10
Midwives per 10,000 Pop. 0.03 -0.13 -0.04 -0.03 0.05 -0.05 -0.04
Nurses per 10,000 Pop. -0.08 -0.31 -0.21 -0.13 -0.30 -0.09 -0.17
Core Medical Pro’s per 10,000 -0.04 -0.26 -0.16 -0.09 -0.20 -0.08 -0.12
Core Medical Pro’s; Score 0.06 -0.23 -0.08 -0.02 -0.16 -0.02 -0.12
Physicians; Score 0.26 0.24 0.27 0.42 0.24 0.27 0.24
Table A.1: Alternative Health Personnel Indicators: Descriptive Statistics
Table A.2: Alternative Health Personnel Indicators: Correlations of with Core Indicators
The Physicians Score takes on the value 1 for sub-districts that fulfill the target of 1 physician per 10,000 population. In this special case, the indicator represents a truncated version of the Physicians per 10,000 population indicator.

57 |
This impression is confirmed by the graphical representation of the population-based indicators. Figures A.1 and A.2 describe
the spatial distribution of the two score indicators of health personnel. The maps reveal that the population-based indicators
are heavily driven by the population denominator, resulting in higher scores especially in Papua and Kalimantan, while
densely populated areas in Java perform relatively poorly. Similar geographical patterns are generally observed for indicators
which are based on per capita measures. We therefore do not use this type of indicator as to avoid a biased assessment of
available basic infrastructure.
Figure A.1: Map – Core Medical Professionals per 10,000 Population – Score (Target: 23)
Figure A.2: Map – Physicians per 10,000 Population – Score (Target: 1)

58
|
Ap
pend
ix 3
: Pro
vin
ce-
and
Dis
tric
t-le
vel O
verv
iew
s
Pro
vin
ceP
hys
ical
Ava
ilab
ility
Hea
lth
Per
son
nel
Bu
ildin
g C
har
acte
rist
ics
Co
mp
osi
te In
dic
es
Pri
mar
yS
eco
nd
ary
Del
iver
yS
ub
Ind
exG
P P
usk
.M
idw
ife
Su
bIn
dex
Wat
er P
.E
lect
rici
tyS
ub
Ind
exA
cces
sE
qu
al D
.E
qu
al I.
PC
AO
LS
CI
Nan
gg
roe
Ace
h D
arus
sala
m0.
970.
740.
960.
890.
970.
830.
900.
850.
910.
880.
890.
890.
890.
890.
900.
88
Sum
ater
a U
tara
0.96
0.83
0.95
0.91
0.92
0.95
0.93
0.89
0.85
0.87
0.91
0.90
0.91
0.91
0.90
0.88
Sum
ater
a B
arat
0.99
0.87
0.99
0.95
0.98
0.99
0.99
0.91
0.90
0.90
0.95
0.95
0.95
0.95
0.94
0.92
Ria
u0.
980.
770.
960.
900.
980.
980.
980.
860.
800.
830.
900.
900.
900.
910.
880.
86
Jam
bi
0.98
0.77
0.97
0.91
0.94
0.95
0.94
0.87
0.80
0.83
0.90
0.89
0.90
0.90
0.89
0.86
Sum
ater
a S
elat
an0.
950.
780.
960.
900.
890.
960.
920.
900.
820.
860.
890.
890.
890.
900.
890.
87
Ben
gku
lu0.
970.
820.
970.
920.
920.
880.
900.
780.
820.
800.
890.
870.
880.
890.
880.
87
Lam
pun
g0.
970.
770.
980.
910.
970.
970.
970.
920.
770.
840.
910.
910.
910.
910.
890.
86
Kep
ulau
an B
ang
ka B
elit
ung
1.
000.
921.
000.
971.
000.
970.
990.
950.
930.
940.
970.
970.
970.
970.
960.
95
Kep
ulau
an R
iau
1.00
0.89
0.99
0.96
0.97
0.98
0.98
0.96
0.88
0.92
0.95
0.95
0.95
0.95
0.94
0.93
DK
I Jak
arta
1.00
1.00
1.00
1.00
0.98
0.99
0.99
0.98
1.00
0.99
1.00
0.99
0.99
0.99
1.00
1.00
Jaw
a B
arat
0.99
0.88
0.99
0.96
0.98
0.99
0.98
0.94
0.96
0.95
0.96
0.96
0.96
0.96
0.96
0.95
Jaw
a Te
ngah
0.98
0.95
1.00
0.98
0.99
0.99
0.99
0.98
0.95
0.96
0.98
0.98
0.98
0.98
0.97
0.97
DI Y
og
yaka
rta
1.00
0.99
1.00
1.00
1.00
0.97
0.99
0.96
0.98
0.97
0.99
0.98
0.99
0.99
0.99
0.99
Jaw
a T
imur
0.99
0.93
1.00
0.97
0.98
1.00
0.99
0.98
0.98
0.98
0.98
0.98
0.98
0.98
0.98
0.97
Ban
ten
0.98
0.88
0.98
0.95
0.97
0.97
0.97
0.97
0.97
0.97
0.96
0.96
0.96
0.96
0.96
0.95
Bal
i1.
000.
981.
000.
990.
990.
990.
990.
970.
960.
970.
990.
980.
990.
990.
990.
98
Nus
a Te
ngg
ara
Bar
at0.
990.
800.
970.
920.
970.
920.
950.
970.
920.
940.
930.
940.
940.
940.
930.
91
Nus
a Te
ngg
ara
Tim
ur0.
910.
530.
880.
770.
800.
790.
800.
830.
590.
710.
760.
760.
760.
760.
750.
71
Kal
iman
tan
Bar
at0.
920.
580.
900.
800.
830.
870.
850.
870.
670.
770.
800.
810.
810.
810.
790.
75
Kal
iman
tan
Teng
ah0.
960.
640.
890.
830.
860.
860.
860.
880.
730.
800.
830.
830.
830.
830.
820.
78
Kal
iman
tan
Sel
atan
0.97
0.81
0.97
0.92
0.98
0.92
0.95
0.87
0.91
0.89
0.92
0.92
0.92
0.92
0.91
0.90
Kal
iman
tan
Tim
ur0.
980.
800.
940.
900.
960.
900.
930.
950.
830.
890.
910.
910.
910.
910.
890.
87
Sul
awes
i Uta
ra0.
980.
830.
960.
920.
950.
750.
850.
950.
870.
910.
910.
900.
900.
900.
920.
90
Sul
awes
i Ten
gah
0.96
0.66
0.92
0.85
0.81
0.86
0.83
0.91
0.73
0.82
0.84
0.83
0.84
0.84
0.84
0.80
Sul
awes
i Sel
atan
0.97
0.81
0.94
0.91
0.94
0.95
0.94
0.93
0.84
0.88
0.91
0.91
0.91
0.91
0.89
0.87
Sul
awes
i Ten
gg
ara
0.96
0.62
0.94
0.84
0.79
0.80
0.79
0.86
0.59
0.72
0.81
0.79
0.79
0.80
0.80
0.76
Go
ront
alo
0.97
0.75
0.95
0.89
0.96
0.79
0.88
0.84
0.82
0.83
0.88
0.87
0.87
0.87
0.88
0.85
Sul
awes
i Bar
at0.
920.
660.
870.
810.
890.
900.
900.
750.
750.
750.
820.
820.
820.
820.
790.
77
Mal
uku
0.93
0.57
0.87
0.79
0.68
0.83
0.76
0.74
0.63
0.68
0.76
0.74
0.75
0.76
0.75
0.72
Mal
uku
Uta
ra0.
900.
550.
870.
770.
720.
680.
700.
870.
710.
790.
760.
750.
760.
760.
780.
74
Pap
ua B
arat
0.91
0.62
0.85
0.79
0.56
0.69
0.62
0.77
0.69
0.73
0.75
0.72
0.73
0.73
0.77
0.74
Pap
ua0.
710.
400.
630.
580.
600.
540.
570.
680.
450.
570.
570.
570.
570.
570.
560.
53
Tab
le A
.3: H
ealth
Ind
icat
ors
and
Com
pos
ite In
dic
es –
Pro
vinc
e-le
vel S
core
s19
19 T
he
re
po
rte
d i
nd
ica
tor
sco
res
are
ca
lcu
late
d a
t p
rovi
nc
ial
leve
l, e
.g.
me
asu
rin
g t
he
sh
are
of
the
pro
vin
cia
l p
op
ula
tio
n w
ith
ea
sy a
cc
ess
to
pri
ma
ry h
ea
lth
ca
re.
Th
ese
sc
ore
s d
iffe
r fr
om
ave
rag
e s
ub
-dis
tric
t sc
ore
s b
y p
rovi
nc
e,
wh
ere
eq
ua
l w
eig
ht
is
giv
en
to
ea
ch
su
b-d
istr
ict
irre
spe
cti
ve o
f p
op
ula
tio
n s
ize
.
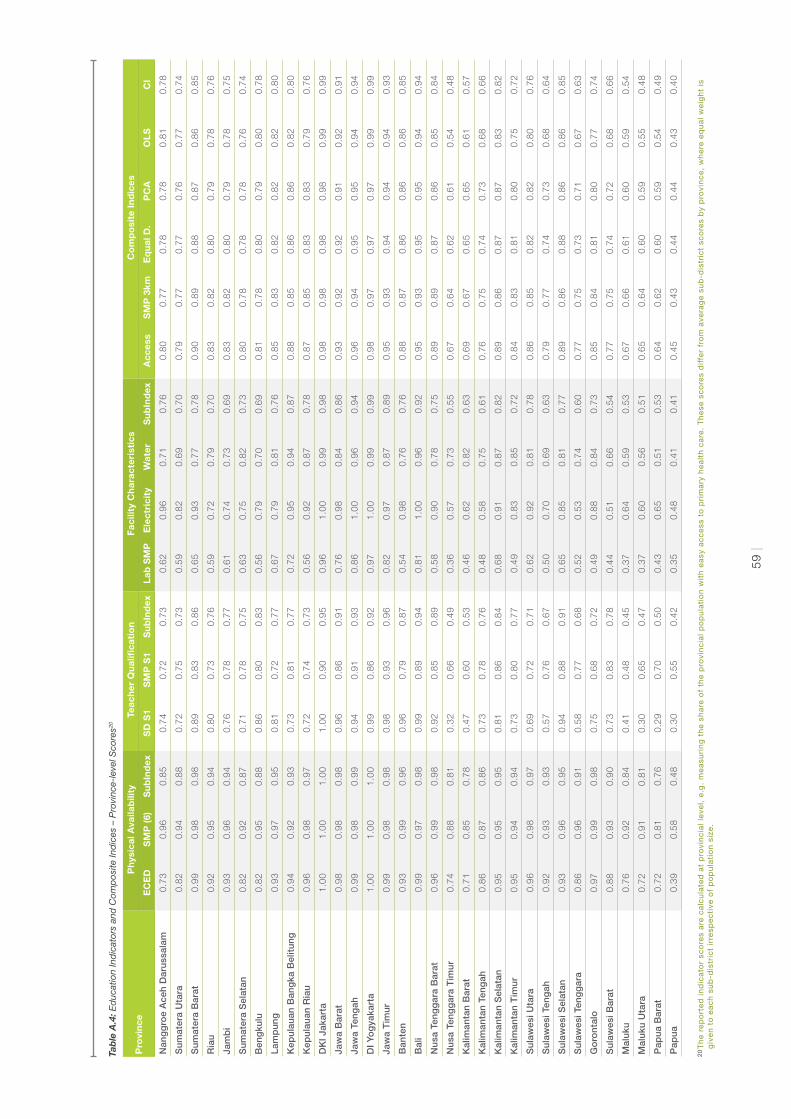
59
|
19 T
he
re
po
rte
d i
nd
ica
tor
sco
res
are
ca
lcu
late
d a
t p
rovi
nc
ial
leve
l, e
.g.
me
asu
rin
g t
he
sh
are
of
the
pro
vin
cia
l p
op
ula
tio
n w
ith
ea
sy a
cc
ess
to
pri
ma
ry h
ea
lth
ca
re.
Th
ese
sc
ore
s d
iffe
r fr
om
ave
rag
e s
ub
-dis
tric
t sc
ore
s b
y p
rovi
nc
e,
wh
ere
eq
ua
l w
eig
ht
is
giv
en
to
ea
ch
su
b-d
istr
ict
irre
spe
cti
ve o
f p
op
ula
tio
n s
ize
.
Pro
vin
ceP
hys
ical
Ava
ilab
ility
Teac
her
Qu
alifi
cati
on
Fac
ility
Ch
arac
teri
stic
sC
om
po
site
Ind
ices
EC
ED
SM
P (6
)S
ub
Ind
exS
D S
1S
MP
S1
Su
bIn
dex
Lab
SM
PE
lect
rici
tyW
ater
Su
bIn
dex
Acc
ess
SM
P 3
kmE
qu
al D
. P
CA
OL
SC
I
Nan
gg
roe
Ace
h D
arus
sala
m0.
730.
960.
850.
740.
720.
730.
620.
960.
710.
760.
800.
770.
780.
780.
810.
78
Sum
ater
a U
tara
0.82
0.94
0.88
0.72
0.75
0.73
0.59
0.82
0.69
0.70
0.79
0.77
0.77
0.76
0.77
0.74
Sum
ater
a B
arat
0.99
0.98
0.98
0.89
0.83
0.86
0.65
0.93
0.77
0.78
0.90
0.89
0.88
0.87
0.86
0.85
Ria
u0.
920.
950.
940.
800.
730.
760.
590.
720.
790.
700.
830.
820.
800.
790.
780.
76
Jam
bi
0.93
0.96
0.94
0.76
0.78
0.77
0.61
0.74
0.73
0.69
0.83
0.82
0.80
0.79
0.78
0.75
Sum
ater
a S
elat
an0.
820.
920.
870.
710.
780.
750.
630.
750.
820.
730.
800.
780.
780.
780.
760.
74
Ben
gku
lu0.
820.
950.
880.
860.
800.
830.
560.
790.
700.
690.
810.
780.
800.
790.
800.
78
Lam
pun
g0.
930.
970.
950.
810.
720.
770.
670.
790.
810.
760.
850.
830.
820.
820.
820.
80
Kep
ulau
an B
ang
ka B
elit
ung
0.
940.
920.
930.
730.
810.
770.
720.
950.
940.
870.
880.
850.
860.
860.
820.
80
Kep
ulau
an R
iau
0.96
0.98
0.97
0.72
0.74
0.73
0.56
0.92
0.87
0.78
0.87
0.85
0.83
0.83
0.79
0.76
DK
I Jak
arta
1.00
1.00
1.00
1.00
0.90
0.95
0.96
1.00
0.99
0.98
0.98
0.98
0.98
0.98
0.99
0.99
Jaw
a B
arat
0.98
0.98
0.98
0.96
0.86
0.91
0.76
0.98
0.84
0.86
0.93
0.92
0.92
0.91
0.92
0.91
Jaw
a Te
ngah
0.99
0.98
0.99
0.94
0.91
0.93
0.86
1.00
0.96
0.94
0.96
0.94
0.95
0.95
0.94
0.94
DI Y
og
yaka
rta
1.00
1.00
1.00
0.99
0.86
0.92
0.97
1.00
0.99
0.99
0.98
0.97
0.97
0.97
0.99
0.99
Jaw
a T
imur
0.99
0.98
0.98
0.98
0.93
0.96
0.82
0.97
0.87
0.89
0.95
0.93
0.94
0.94
0.94
0.93
Ban
ten
0.93
0.99
0.96
0.96
0.79
0.87
0.54
0.98
0.76
0.76
0.88
0.87
0.86
0.86
0.86
0.85
Bal
i0.
990.
970.
980.
990.
890.
940.
811.
000.
960.
920.
950.
930.
950.
950.
940.
94
Nus
a Te
ngg
ara
Bar
at0.
960.
990.
980.
920.
850.
890.
580.
900.
780.
750.
890.
890.
870.
860.
850.
84
Nus
a Te
ngg
ara
Tim
ur0.
740.
880.
810.
320.
660.
490.
360.
570.
730.
550.
670.
640.
620.
610.
540.
48
Kal
iman
tan
Bar
at0.
710.
850.
780.
470.
600.
530.
460.
620.
820.
630.
690.
670.
650.
650.
610.
57
Kal
iman
tan
Teng
ah0.
860.
870.
860.
730.
780.
760.
480.
580.
750.
610.
760.
750.
740.
730.
680.
66
Kal
iman
tan
Sel
atan
0.95
0.95
0.95
0.81
0.86
0.84
0.68
0.91
0.87
0.82
0.89
0.86
0.87
0.87
0.83
0.82
Kal
iman
tan
Tim
ur0.
950.
940.
940.
730.
800.
770.
490.
830.
850.
720.
840.
830.
810.
800.
750.
72
Sul
awes
i Uta
ra0.
960.
980.
970.
690.
720.
710.
620.
920.
810.
780.
860.
850.
820.
820.
800.
76
Sul
awes
i Ten
gah
0.92
0.93
0.93
0.57
0.76
0.67
0.50
0.70
0.69
0.63
0.79
0.77
0.74
0.73
0.68
0.64
Sul
awes
i Sel
atan
0.93
0.96
0.95
0.94
0.88
0.91
0.65
0.85
0.81
0.77
0.89
0.86
0.88
0.86
0.86
0.85
Sul
awes
i Ten
gg
ara
0.86
0.96
0.91
0.58
0.77
0.68
0.52
0.53
0.74
0.60
0.77
0.75
0.73
0.71
0.67
0.63
Go
ront
alo
0.97
0.99
0.98
0.75
0.68
0.72
0.49
0.88
0.84
0.73
0.85
0.84
0.81
0.80
0.77
0.74
Sul
awes
i Bar
at0.
880.
930.
900.
730.
830.
780.
440.
510.
660.
540.
770.
750.
740.
720.
680.
66
Mal
uku
0.76
0.92
0.84
0.41
0.48
0.45
0.37
0.64
0.59
0.53
0.67
0.66
0.61
0.60
0.59
0.54
Mal
uku
Uta
ra0.
720.
910.
810.
300.
650.
470.
370.
600.
560.
510.
650.
640.
600.
590.
550.
48
Pap
ua B
arat
0.72
0.81
0.76
0.29
0.70
0.50
0.43
0.65
0.51
0.53
0.64
0.62
0.60
0.59
0.54
0.49
Pap
ua0.
390.
580.
480.
300.
550.
420.
350.
480.
410.
410.
450.
430.
440.
440.
430.
40
Tab
le A
.4: E
duc
atio
n In
dic
ator
s an
d C
omp
osite
Ind
ices
– P
rovi
nce-
leve
l Sco
res20
20 T
he
re
po
rte
d i
nd
ica
tor
sco
res
are
ca
lcu
late
d a
t p
rovi
nc
ial
leve
l, e
.g.
me
asu
rin
g t
he
sh
are
of
the
pro
vin
cia
l p
op
ula
tio
n w
ith
ea
sy a
cc
ess
to
pri
ma
ry h
ea
lth
ca
re.
Th
ese
sc
ore
s d
iffe
r fr
om
ave
rag
e s
ub
-dis
tric
t sc
ore
s b
y p
rovi
nc
e,
wh
ere
eq
ua
l w
eig
ht
is
giv
en
to
ea
ch
su
b-d
istr
ict
irre
spe
cti
ve o
f p
op
ula
tio
n s
ize
.

60
|
Dis
tric
tB
PS
Co
de
Ph
ysic
al A
vaila
bili
tyH
ealt
h P
erso
nn
elB
uild
ing
Ch
arac
teri
stic
sC
om
po
site
Ind
ices
Pri
mar
yS
eco
nd
ary
Del
iver
yS
ub
Ind
exG
P P
usk
.M
idw
ife
Su
bIn
dex
Wat
er P
.E
lect
rici
tyS
ub
Ind
exA
cces
sE
qu
al D
.E
qu
al I.
PC
AO
LS
CI
Nan
gg
roe
Ace
h D
erus
sala
m0.
970.
740.
960.
890.
970.
830.
900.
850.
910.
880.
890.
890.
890.
890.
900.
88
Sim
eulu
e11
010.
990.
530.
740.
750.
750.
800.
780.
750.
880.
810.
770.
780.
780.
780.
740.
72
Ace
h S
ing
kil
1102
0.96
0.56
0.91
0.81
0.91
0.86
0.88
0.82
0.80
0.81
0.82
0.83
0.83
0.83
0.81
0.77
Ace
h S
elat
an11
030.
970.
710.
950.
880.
950.
770.
860.
670.
740.
710.
840.
810.
820.
830.
820.
80
Ace
h Te
ngg
ara
1104
0.98
0.75
0.98
0.91
0.89
0.74
0.82
0.79
0.86
0.83
0.87
0.85
0.86
0.86
0.89
0.87
Ace
h T
imur
1105
0.93
0.53
0.94
0.80
0.92
0.86
0.89
0.85
0.95
0.90
0.84
0.86
0.85
0.86
0.86
0.81
Ace
h Te
ngah
1106
0.93
0.62
0.98
0.84
1.00
0.88
0.94
0.79
0.92
0.85
0.86
0.88
0.87
0.88
0.87
0.84
Ace
h B
arat
1107
0.95
0.74
0.93
0.87
1.00
0.72
0.86
0.77
0.77
0.77
0.85
0.83
0.84
0.84
0.84
0.82
Ace
h B
esar
1108
0.99
0.85
0.99
0.94
1.00
0.86
0.93
0.92
0.96
0.94
0.94
0.94
0.94
0.94
0.95
0.94
Pid
ie11
090.
990.
850.
990.
941.
000.
670.
830.
880.
970.
930.
920.
900.
910.
900.
940.
93
Bir
euen
1110
0.95
0.77
0.97
0.90
1.00
0.90
0.95
0.94
0.98
0.96
0.92
0.93
0.93
0.93
0.93
0.91
Ace
h U
tara
1111
0.97
0.46
0.95
0.80
1.00
0.69
0.84
0.79
0.91
0.85
0.82
0.83
0.82
0.83
0.83
0.78
Ace
h B
arat
Day
a11
121.
000.
860.
990.
950.
920.
880.
900.
770.
940.
850.
920.
900.
910.
910.
920.
92
Gay
o L
ues
1113
0.94
0.57
0.90
0.80
1.00
0.93
0.97
1.00
0.89
0.94
0.86
0.90
0.89
0.89
0.86
0.81
Ace
h Ta
mia
ng11
140.
960.
910.
990.
951.
000.
970.
991.
000.
980.
990.
970.
980.
970.
970.
980.
96
Nag
an R
aya
1115
0.97
0.79
0.98
0.91
1.00
0.73
0.86
0.85
0.94
0.89
0.90
0.89
0.89
0.89
0.92
0.90
Ace
h Ja
ya11
160.
980.
780.
990.
921.
000.
840.
920.
880.
650.
760.
890.
870.
870.
880.
870.
84
Ben
er M
eria
h11
170.
950.
680.
960.
861.
000.
880.
940.
900.
970.
930.
890.
910.
900.
910.
900.
87
Pid
ie ja
ya11
180.
990.
940.
990.
971.
000.
860.
930.
900.
950.
930.
960.
940.
950.
950.
960.
96
Ban
da
Ace
h11
711.
001.
001.
001.
001.
000.
970.
980.
911.
000.
950.
990.
980.
980.
980.
990.
99
Sab
ang
1172
1.00
1.00
1.00
1.00
1.00
1.00
1.00
1.00
1.00
1.00
1.00
1.00
1.00
1.00
1.00
1.00
Lang
sa11
731.
000.
981.
000.
991.
000.
960.
981.
001.
001.
000.
990.
990.
990.
991.
000.
99
Lho
kseu
maw
e11
741.
001.
001.
001.
001.
000.
980.
990.
830.
990.
910.
980.
970.
970.
980.
970.
98
Sub
ulus
sala
m11
750.
880.
390.
890.
721.
000.
970.
980.
800.
820.
810.
790.
840.
820.
830.
780.
72
Sum
ater
a U
tara
0.96
0.83
0.95
0.91
0.92
0.95
0.93
0.89
0.85
0.87
0.91
0.90
0.91
0.91
0.90
0.88
Nia
s12
010.
690.
310.
530.
510.
630.
360.
490.
630.
390.
510.
510.
500.
500.
500.
480.
45
Man
dai
ling
nat
al12
020.
880.
680.
940.
830.
880.
930.
900.
850.
900.
870.
850.
870.
860.
870.
870.
84
Tap
anul
i Sel
atan
1203
0.89
0.67
0.95
0.84
0.88
0.93
0.90
0.88
0.89
0.88
0.86
0.87
0.87
0.87
0.88
0.85
Tap
anul
i Ten
gah
1204
0.96
0.73
0.98
0.89
0.90
0.97
0.94
0.81
0.87
0.84
0.89
0.89
0.89
0.89
0.89
0.86
Tap
anul
i Uta
ra12
050.
900.
630.
920.
821.
000.
960.
980.
890.
940.
920.
870.
910.
890.
890.
870.
84
Tob
a S
amo
sir
1206
0.87
0.74
0.90
0.84
1.00
0.98
0.99
0.89
0.97
0.93
0.89
0.92
0.91
0.91
0.88
0.87
Lab
uhan
Bat
u12
070.
980.
820.
970.
920.
920.
990.
960.
850.
520.
680.
880.
850.
860.
870.
830.
81
Asa
han
1208
0.97
0.87
0.94
0.93
1.00
0.99
0.99
1.00
0.90
0.95
0.95
0.96
0.95
0.95
0.93
0.92
Sim
alun
gun
1209
0.98
0.87
0.98
0.94
1.00
0.99
0.99
0.91
0.81
0.86
0.94
0.93
0.93
0.94
0.92
0.90
Dai
ri12
100.
970.
640.
910.
840.
890.
970.
930.
830.
760.
800.
850.
860.
850.
860.
820.
79
Tab
le A
.5: H
ealth
Ind
icat
ors
and
Com
pos
ite In
dic
es –
Dis
tric
t-le
vel S
core
s
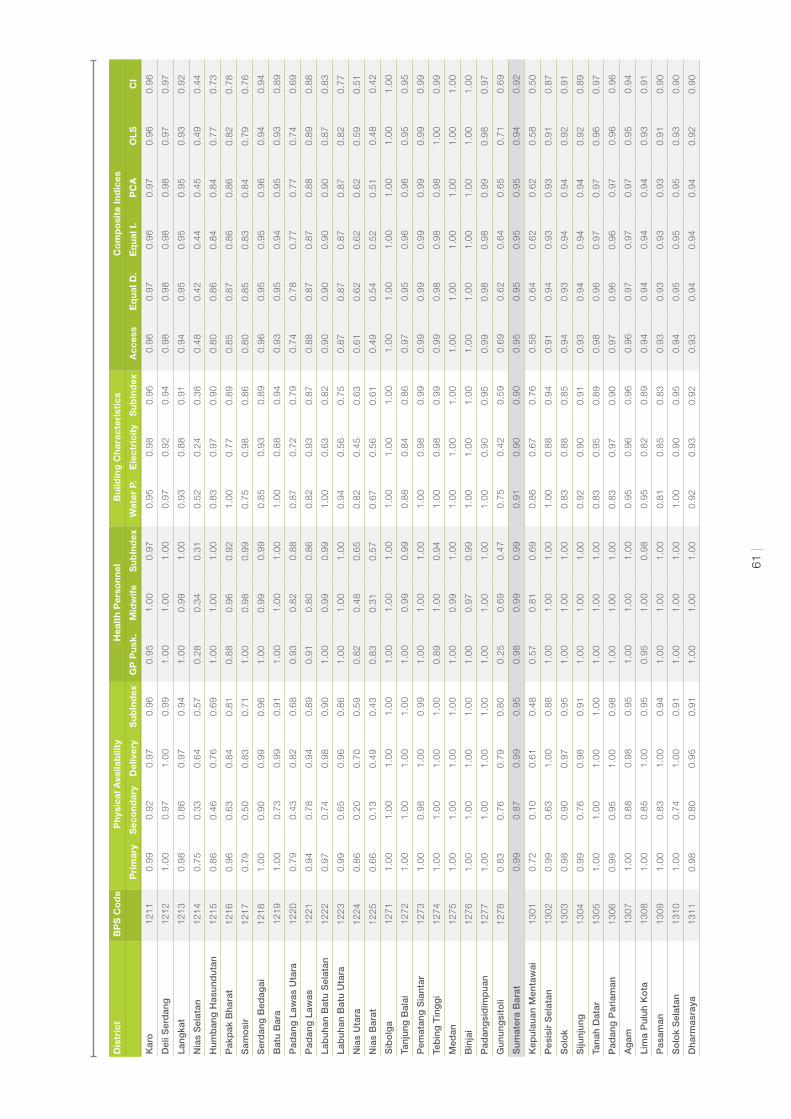
61 |
Kar
o12
110.
990.
920.
970.
960.
951.
000.
970.
950.
980.
960.
960.
970.
960.
970.
960.
96
Del
i Ser
dan
g12
121.
000.
971.
000.
991.
001.
001.
000.
970.
920.
940.
980.
980.
980.
980.
970.
97
Lang
kat
1213
0.98
0.86
0.97
0.94
1.00
0.99
1.00
0.93
0.88
0.91
0.94
0.95
0.95
0.95
0.93
0.92
Nia
s S
elat
an12
140.
750.
330.
640.
570.
280.
340.
310.
520.
240.
380.
480.
420.
440.
450.
490.
44
Hum
ban
g H
asun
dut
an12
150.
860.
460.
760.
691.
001.
001.
000.
830.
970.
900.
800.
860.
840.
840.
770.
73
Pak
pak
Bha
rat
1216
0.96
0.63
0.84
0.81
0.88
0.96
0.92
1.00
0.77
0.89
0.85
0.87
0.86
0.86
0.82
0.78
Sam
osi
r12
170.
790.
500.
830.
711.
000.
980.
990.
750.
980.
860.
800.
850.
830.
840.
790.
76
Ser
dan
g B
edag
ai12
181.
000.
900.
990.
961.
000.
990.
990.
850.
930.
890.
960.
950.
950.
960.
940.
94
Bat
u B
ara
1219
1.00
0.73
0.99
0.91
1.00
1.00
1.00
1.00
0.88
0.94
0.93
0.95
0.94
0.95
0.93
0.89
Pad
ang
Law
as U
tara
1220
0.79
0.43
0.82
0.68
0.93
0.82
0.88
0.87
0.72
0.79
0.74
0.78
0.77
0.77
0.74
0.69
Pad
ang
Law
as12
210.
940.
780.
940.
890.
910.
800.
860.
820.
930.
870.
880.
870.
870.
880.
890.
88
Lab
uhan
Bat
u S
elat
an12
220.
970.
740.
980.
901.
000.
990.
991.
000.
630.
820.
900.
900.
900.
900.
870.
83
Lab
uhan
Bat
u U
tara
1223
0.99
0.65
0.96
0.86
1.00
1.00
1.00
0.94
0.56
0.75
0.87
0.87
0.87
0.87
0.82
0.77
Nia
s U
tara
1224
0.86
0.20
0.70
0.59
0.82
0.48
0.65
0.82
0.45
0.63
0.61
0.62
0.62
0.62
0.59
0.51
Nia
s B
arat
1225
0.66
0.13
0.49
0.43
0.83
0.31
0.57
0.67
0.56
0.61
0.49
0.54
0.52
0.51
0.48
0.42
Sib
olg
a12
711.
001.
001.
001.
001.
001.
001.
001.
001.
001.
001.
001.
001.
001.
001.
001.
00
Tanj
ung
Bal
ai12
721.
001.
001.
001.
001.
000.
990.
990.
880.
840.
860.
970.
950.
960.
960.
950.
95
Pem
atan
g S
iant
ar12
731.
000.
981.
000.
991.
001.
001.
001.
000.
980.
990.
990.
990.
990.
990.
990.
99
Teb
ing
Tin
gg
i12
741.
001.
001.
001.
000.
891.
000.
941.
000.
980.
990.
990.
980.
980.
981.
000.
99
Med
an12
751.
001.
001.
001.
001.
000.
991.
001.
001.
001.
001.
001.
001.
001.
001.
001.
00
Bin
jai
1276
1.00
1.00
1.00
1.00
1.00
0.97
0.99
1.00
1.00
1.00
1.00
1.00
1.00
1.00
1.00
1.00
Pad
ang
sid
imp
uan
1277
1.00
1.00
1.00
1.00
1.00
1.00
1.00
1.00
0.90
0.95
0.99
0.98
0.98
0.99
0.98
0.97
Gun
ung
sito
li12
780.
830.
760.
790.
800.
250.
690.
470.
750.
420.
590.
690.
620.
640.
650.
710.
69
Sum
ater
a B
arat
0.99
0.87
0.99
0.95
0.98
0.99
0.99
0.91
0.90
0.90
0.95
0.95
0.95
0.95
0.94
0.92
Kep
ulau
an M
enta
wai
1301
0.72
0.10
0.61
0.48
0.57
0.81
0.69
0.86
0.67
0.76
0.58
0.64
0.62
0.62
0.58
0.50
Pes
isir
Sel
atan
1302
0.99
0.63
1.00
0.88
1.00
1.00
1.00
1.00
0.88
0.94
0.91
0.94
0.93
0.93
0.91
0.87
So
lok
1303
0.98
0.90
0.97
0.95
1.00
1.00
1.00
0.83
0.88
0.85
0.94
0.93
0.94
0.94
0.92
0.91
Siju
njun
g13
040.
990.
760.
980.
911.
001.
001.
000.
920.
900.
910.
930.
940.
940.
940.
920.
89
Tana
h D
atar
1305
1.00
1.00
1.00
1.00
1.00
1.00
1.00
0.83
0.95
0.89
0.98
0.96
0.97
0.97
0.96
0.97
Pad
ang
Par
iam
an13
060.
990.
951.
000.
981.
001.
001.
000.
830.
970.
900.
970.
960.
960.
970.
960.
96
Ag
am13
071.
000.
880.
980.
951.
001.
001.
000.
950.
960.
960.
960.
970.
970.
970.
950.
94
Lim
a P
uluh
Ko
ta13
081.
000.
851.
000.
950.
951.
000.
980.
950.
820.
890.
940.
940.
940.
940.
930.
91
Pas
aman
1309
1.00
0.83
1.00
0.94
1.00
1.00
1.00
0.81
0.85
0.83
0.93
0.93
0.93
0.93
0.91
0.90
So
lok
Sel
atan
1310
1.00
0.74
1.00
0.91
1.00
1.00
1.00
1.00
0.90
0.95
0.94
0.95
0.95
0.95
0.93
0.90
Dha
rmas
raya
1311
0.98
0.80
0.95
0.91
1.00
1.00
1.00
0.92
0.93
0.92
0.93
0.94
0.94
0.94
0.92
0.90
Dis
tric
tB
PS
Co
de
Ph
ysic
al A
vaila
bili
tyH
ealt
h P
erso
nn
elB
uild
ing
Ch
arac
teri
stic
sC
om
po
site
Ind
ices
Pri
mar
yS
eco
nd
ary
Del
iver
yS
ub
Ind
exG
P P
usk
.M
idw
ife
Su
bIn
dex
Wat
er P
.E
lect
rici
tyS
ub
Ind
exA
cces
sE
qu
al D
.E
qu
al I.
PC
AO
LS
CI

62
|
Dis
tric
tB
PS
Co
de
Ph
ysic
al A
vaila
bili
tyH
ealt
h P
erso
nn
elB
uild
ing
Ch
arac
teri
stic
sC
om
po
site
Ind
ices
Pri
mar
yS
eco
nd
ary
Del
iver
yS
ub
Ind
exG
P P
usk
.M
idw
ife
Su
bIn
dex
Wat
er P
.E
lect
rici
tyS
ub
Ind
exA
cces
sE
qu
al D
.E
qu
al I.
PC
AO
LS
CI
Pas
aman
Bar
at13
120.
990.
850.
990.
940.
941.
000.
970.
880.
860.
870.
930.
930.
930.
940.
920.
91
Pad
ang
1371
1.00
0.99
1.00
1.00
1.00
0.99
1.00
0.95
0.91
0.93
0.98
0.97
0.98
0.98
0.97
0.97
So
lok
1372
1.00
1.00
1.00
1.00
1.00
1.00
1.00
0.75
0.94
0.85
0.97
0.95
0.96
0.96
0.95
0.96
Saw
ah L
unto
1373
1.00
1.00
1.00
1.00
1.00
0.98
0.99
1.00
0.95
0.97
0.99
0.99
0.99
0.99
0.99
0.99
Pad
ang
Pan
jang
1374
1.00
1.00
1.00
1.00
1.00
1.00
1.00
1.00
0.93
0.96
0.99
0.99
0.99
0.99
0.98
0.98
Buk
itti
ngg
i13
751.
001.
001.
001.
000.
881.
000.
941.
000.
850.
920.
970.
950.
960.
960.
970.
96
Pay
akum
buh
1376
1.00
1.00
1.00
1.00
1.00
0.96
0.98
1.00
0.90
0.95
0.99
0.98
0.98
0.98
0.98
0.98
Par
iam
an13
771.
001.
001.
001.
001.
001.
001.
001.
001.
001.
001.
001.
001.
001.
001.
001.
00
Ria
u0.
980.
770.
960.
900.
980.
980.
980.
860.
800.
830.
900.
900.
900.
910.
880.
86
Kua
ntan
Sin
gin
gi
1401
0.99
0.78
0.96
0.91
0.91
0.97
0.94
0.91
0.79
0.85
0.90
0.90
0.90
0.91
0.89
0.87
Ind
rag
iri H
ulu
1402
0.96
0.67
0.96
0.86
1.00
0.97
0.99
0.79
0.84
0.81
0.88
0.89
0.88
0.89
0.86
0.83
Ind
rag
iri H
ilir
1403
0.97
0.47
0.88
0.78
0.92
0.98
0.95
0.80
0.75
0.77
0.81
0.83
0.83
0.83
0.78
0.73
Pel
alaw
an14
040.
960.
720.
920.
871.
000.
991.
000.
830.
700.
770.
870.
880.
880.
880.
830.
80
Sia
k14
050.
980.
920.
980.
961.
000.
990.
990.
930.
920.
930.
960.
960.
960.
960.
950.
95
Kam
par
1406
0.99
0.80
0.98
0.92
1.00
0.98
0.99
0.89
0.73
0.81
0.91
0.91
0.91
0.91
0.88
0.86
Ro
kan
Hul
u14
070.
990.
910.
980.
961.
000.
991.
000.
900.
790.
850.
940.
930.
940.
940.
920.
91
Ben
gka
lis14
080.
990.
840.
960.
931.
000.
970.
990.
910.
820.
870.
930.
930.
930.
930.
900.
89
Ro
kan
Hili
r14
090.
980.
620.
990.
860.
940.
980.
960.
880.
860.
870.
880.
900.
890.
900.
880.
84
Kep
ulau
an M
eran
ti14
100.
890.
380.
890.
721.
000.
940.
970.
630.
720.
670.
760.
790.
780.
790.
730.
68
Pek
anb
aru
1471
1.00
0.98
1.00
0.99
1.00
1.00
1.00
1.00
0.88
0.94
0.98
0.98
0.98
0.98
0.97
0.96
Dum
ai14
730.
990.
990.
990.
991.
001.
001.
000.
670.
920.
790.
950.
930.
940.
950.
930.
94
Jam
bi
0.98
0.77
0.97
0.91
0.94
0.95
0.94
0.87
0.80
0.83
0.90
0.89
0.90
0.90
0.89
0.86
Ker
inci
1501
0.98
0.80
0.98
0.92
1.00
0.71
0.86
1.00
0.84
0.92
0.91
0.90
0.90
0.90
0.92
0.90
Mer
ang
in15
020.
960.
740.
980.
890.
950.
970.
960.
790.
800.
800.
890.
880.
880.
890.
870.
85
Sar
ola
ngun
1503
0.92
0.63
0.97
0.84
0.92
0.95
0.93
0.92
0.76
0.84
0.86
0.87
0.87
0.87
0.86
0.82
Bat
ang
Har
i15
041.
000.
640.
940.
861.
000.
990.
991.
000.
710.
860.
890.
900.
900.
900.
850.
81
Mua
ro J
amb
i15
050.
980.
760.
970.
901.
000.
970.
991.
000.
940.
970.
930.
950.
940.
940.
930.
90
Tanj
ung
Jab
ung
Tim
ur15
060.
980.
440.
910.
780.
710.
990.
850.
650.
650.
650.
760.
760.
760.
770.
740.
69
Tanj
ung
Jab
ung
Bar
at15
071.
000.
570.
920.
830.
940.
990.
970.
750.
660.
700.
830.
830.
830.
840.
780.
74
Teb
o15
080.
990.
760.
990.
910.
931.
000.
960.
860.
910.
880.
920.
920.
920.
920.
910.
89
Bun
go
1509
1.00
0.98
0.99
0.99
0.94
0.97
0.96
0.78
0.75
0.76
0.94
0.90
0.92
0.92
0.91
0.91
Jam
bi
1571
1.00
1.00
1.00
1.00
0.95
0.98
0.97
0.95
1.00
0.98
0.99
0.98
0.98
0.98
0.99
0.99
Sun
gai
Pen
uh15
720.
990.
980.
990.
991.
000.
620.
810.
830.
930.
880.
930.
890.
910.
910.
950.
96
Sum
ater
a S
elat
an0.
950.
780.
960.
900.
890.
960.
920.
900.
820.
860.
890.
890.
890.
900.
890.
87
Og
an K
om
erin
g U
lu16
010.
990.
810.
960.
920.
871.
000.
930.
930.
850.
890.
920.
910.
920.
920.
910.
89
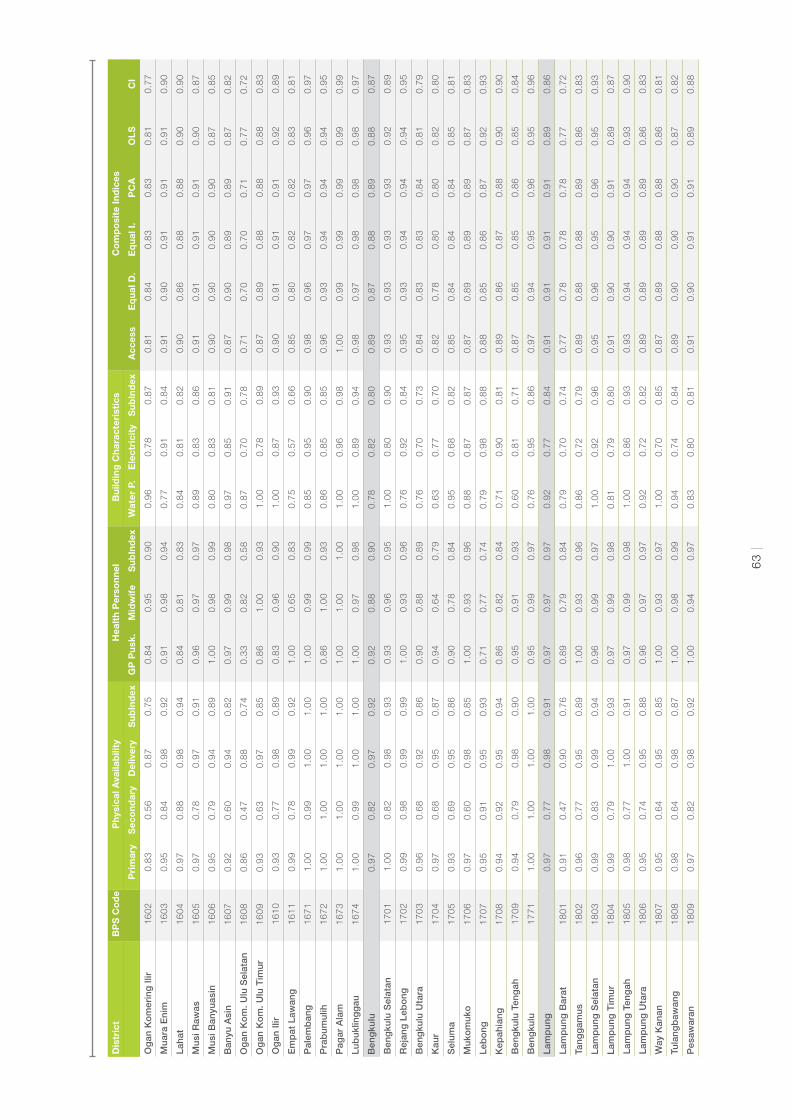
63
|
Og
an K
om
erin
g Il
ir16
020.
830.
560.
870.
750.
840.
950.
900.
960.
780.
870.
810.
840.
830.
830.
810.
77
Mua
ra E
nim
1603
0.95
0.84
0.98
0.92
0.91
0.98
0.94
0.77
0.91
0.84
0.91
0.90
0.91
0.91
0.91
0.90
Laha
t16
040.
970.
880.
980.
940.
840.
810.
830.
840.
810.
820.
900.
860.
880.
880.
900.
90
Mus
i Raw
as16
050.
970.
780.
970.
910.
960.
970.
970.
890.
830.
860.
910.
910.
910.
910.
900.
87
Mus
i Ban
yuas
in16
060.
950.
790.
940.
891.
000.
980.
990.
800.
830.
810.
900.
900.
900.
900.
870.
85
Ban
yu A
sin
1607
0.92
0.60
0.94
0.82
0.97
0.99
0.98
0.97
0.85
0.91
0.87
0.90
0.89
0.89
0.87
0.82
Og
an K
om
. Ulu
Sel
atan
1608
0.86
0.47
0.88
0.74
0.33
0.82
0.58
0.87
0.70
0.78
0.71
0.70
0.70
0.71
0.77
0.72
Og
an K
om
. Ulu
Tim
ur16
090.
930.
630.
970.
850.
861.
000.
931.
000.
780.
890.
870.
890.
880.
880.
880.
83
Og
an Il
ir16
100.
930.
770.
980.
890.
830.
960.
901.
000.
870.
930.
900.
910.
910.
910.
920.
89
Em
pat
Law
ang
1611
0.99
0.78
0.99
0.92
1.00
0.65
0.83
0.75
0.57
0.66
0.85
0.80
0.82
0.82
0.83
0.81
Pal
emb
ang
1671
1.00
0.99
1.00
1.00
1.00
0.99
0.99
0.85
0.95
0.90
0.98
0.96
0.97
0.97
0.96
0.97
Pra
bum
ulih
1672
1.00
1.00
1.00
1.00
0.86
1.00
0.93
0.86
0.85
0.85
0.96
0.93
0.94
0.94
0.94
0.95
Pag
ar A
lam
1673
1.00
1.00
1.00
1.00
1.00
1.00
1.00
1.00
0.96
0.98
1.00
0.99
0.99
0.99
0.99
0.99
Lub
uklin
gg
au16
741.
000.
991.
001.
001.
000.
970.
981.
000.
890.
940.
980.
970.
980.
980.
980.
97
Ben
gku
lu0.
970.
820.
970.
920.
920.
880.
900.
780.
820.
800.
890.
870.
880.
890.
880.
87
Ben
gku
lu S
elat
an17
011.
000.
820.
980.
930.
930.
960.
951.
000.
800.
900.
930.
930.
930.
930.
920.
89
Rej
ang
Leb
ong
1702
0.99
0.98
0.99
0.99
1.00
0.93
0.96
0.76
0.92
0.84
0.95
0.93
0.94
0.94
0.94
0.95
Ben
gku
lu U
tara
1703
0.96
0.68
0.92
0.86
0.90
0.88
0.89
0.76
0.70
0.73
0.84
0.83
0.83
0.84
0.81
0.79
Kau
r17
040.
970.
680.
950.
870.
940.
640.
790.
630.
770.
700.
820.
780.
800.
800.
820.
80
Sel
uma
1705
0.93
0.69
0.95
0.86
0.90
0.78
0.84
0.95
0.68
0.82
0.85
0.84
0.84
0.84
0.85
0.81
Muk
om
uko
1706
0.97
0.60
0.98
0.85
1.00
0.93
0.96
0.88
0.87
0.87
0.87
0.89
0.89
0.89
0.87
0.83
Leb
ong
1707
0.95
0.91
0.95
0.93
0.71
0.77
0.74
0.79
0.98
0.88
0.88
0.85
0.86
0.87
0.92
0.93
Kep
ahia
ng17
080.
940.
920.
950.
940.
860.
820.
840.
710.
900.
810.
890.
860.
870.
880.
900.
90
Ben
gku
lu T
eng
ah17
090.
940.
790.
980.
900.
950.
910.
930.
600.
810.
710.
870.
850.
850.
860.
850.
84
Ben
gku
lu17
711.
001.
001.
001.
000.
950.
990.
970.
760.
950.
860.
970.
940.
950.
960.
950.
96
Lam
pun
g0.
970.
770.
980.
910.
970.
970.
970.
920.
770.
840.
910.
910.
910.
910.
890.
86
Lam
pun
g B
arat
1801
0.91
0.47
0.90
0.76
0.89
0.79
0.84
0.79
0.70
0.74
0.77
0.78
0.78
0.78
0.77
0.72
Tang
gam
us18
020.
960.
770.
950.
891.
000.
930.
960.
860.
720.
790.
890.
880.
880.
890.
860.
83
Lam
pun
g S
elat
an18
030.
990.
830.
990.
940.
960.
990.
971.
000.
920.
960.
950.
960.
950.
960.
950.
93
Lam
pun
g T
imur
1804
0.99
0.79
1.00
0.93
0.97
0.99
0.98
0.81
0.79
0.80
0.91
0.90
0.90
0.91
0.89
0.87
Lam
pun
g T
eng
ah18
050.
980.
771.
000.
910.
970.
990.
981.
000.
860.
930.
930.
940.
940.
940.
930.
90
Lam
pun
g U
tara
1806
0.95
0.74
0.95
0.88
0.96
0.97
0.97
0.92
0.72
0.82
0.89
0.89
0.89
0.89
0.86
0.83
Way
Kan
an18
070.
950.
640.
950.
851.
000.
930.
971.
000.
700.
850.
870.
890.
880.
880.
860.
81
Tula
ngb
awan
g18
080.
980.
640.
980.
871.
000.
980.
990.
940.
740.
840.
890.
900.
900.
900.
870.
82
Pes
awar
an18
090.
970.
820.
980.
921.
000.
940.
970.
830.
800.
810.
910.
900.
910.
910.
890.
88
Dis
tric
tB
PS
Co
de
Ph
ysic
al A
vaila
bili
tyH
ealt
h P
erso
nn
elB
uild
ing
Ch
arac
teri
stic
sC
om
po
site
Ind
ices
Pri
mar
yS
eco
nd
ary
Del
iver
yS
ub
Ind
exG
P P
usk
.M
idw
ife
Su
bIn
dex
Wat
er P
.E
lect
rici
tyS
ub
Ind
exA
cces
sE
qu
al D
.E
qu
al I.
PC
AO
LS
CI

64
|
Pri
ngse
wu
1810
1.00
0.97
1.00
0.99
1.00
0.98
0.99
1.00
0.66
0.83
0.96
0.94
0.94
0.95
0.92
0.91
Mes
uji
1811
0.92
0.25
0.98
0.72
1.00
0.98
0.99
0.56
0.71
0.63
0.75
0.78
0.77
0.79
0.73
0.66
Tula
ng B
awan
g B
arat
1812
0.96
0.67
0.99
0.87
0.80
0.99
0.90
1.00
0.65
0.83
0.87
0.86
0.87
0.87
0.87
0.82
Ban
dar
Lam
pun
g18
711.
001.
001.
001.
001.
001.
001.
000.
960.
870.
910.
980.
970.
980.
980.
970.
96
Met
ro18
721.
001.
001.
001.
001.
001.
001.
001.
000.
900.
950.
990.
980.
990.
990.
980.
97
Kep
ulau
an B
ang
ka B
elit
ung
1.00
0.92
1.00
0.97
1.00
0.97
0.99
0.95
0.93
0.94
0.97
0.97
0.97
0.97
0.96
0.95
Ban
gka
1901
0.99
0.94
1.00
0.98
1.00
0.99
1.00
1.00
0.93
0.97
0.98
0.98
0.98
0.98
0.97
0.96
Bel
itun
g19
021.
000.
951.
000.
981.
001.
001.
000.
890.
940.
910.
970.
970.
970.
970.
960.
96
Ban
gka
Bar
at19
030.
990.
700.
990.
891.
000.
950.
971.
000.
950.
970.
920.
950.
940.
940.
930.
90
Ban
gka
Ten
gah
1904
1.00
0.98
1.00
0.99
1.00
1.00
1.00
1.00
0.91
0.96
0.99
0.98
0.99
0.99
0.98
0.97
Ban
gka
Sel
atan
1905
1.00
0.89
1.00
0.96
1.00
0.97
0.99
0.88
0.95
0.91
0.96
0.95
0.95
0.96
0.95
0.94
Bel
itun
g T
imur
1906
1.00
0.99
1.00
1.00
1.00
0.94
0.97
1.00
0.91
0.96
0.98
0.97
0.98
0.98
0.98
0.98
Pan
gka
l Pin
ang
1971
1.00
1.00
1.00
1.00
1.00
0.94
0.97
0.89
0.90
0.89
0.97
0.95
0.96
0.96
0.96
0.96
Kep
ulau
an R
iau
1.00
0.89
0.99
0.96
0.97
0.98
0.98
0.96
0.88
0.92
0.95
0.95
0.95
0.95
0.94
0.93
Kar
imun
2101
1.00
0.84
0.98
0.94
1.00
1.00
1.00
1.00
0.83
0.91
0.95
0.95
0.95
0.95
0.93
0.91
Bin
tan
2102
0.99
0.88
1.00
0.96
1.00
0.99
0.99
1.00
0.88
0.94
0.96
0.96
0.96
0.96
0.95
0.94
Nat
una
2103
0.98
0.44
0.95
0.79
0.92
0.78
0.85
0.85
0.84
0.84
0.81
0.83
0.82
0.83
0.83
0.77
Ling
ga
2104
1.00
0.58
0.99
0.86
0.86
0.86
0.86
0.86
0.87
0.86
0.86
0.86
0.86
0.86
0.87
0.83
Kep
ulau
an A
nam
bas
2105
0.97
0.24
0.88
0.70
1.00
0.93
0.97
1.00
0.88
0.94
0.80
0.87
0.84
0.84
0.79
0.71
Bat
am21
711.
000.
971.
000.
991.
001.
001.
001.
000.
990.
990.
990.
990.
990.
990.
990.
99
Tanj
ung
Pin
ang
2172
1.00
1.00
1.00
1.00
1.00
1.00
1.00
1.00
0.81
0.91
0.98
0.97
0.97
0.97
0.96
0.95
DK
I Jak
arta
1.00
1.00
1.00
1.00
0.98
0.99
0.99
0.98
1.00
0.99
1.00
0.99
0.99
0.99
1.00
1.00
Kep
ulau
an S
erib
u31
011.
000.
241.
000.
751.
001.
001.
000.
831.
000.
920.
830.
890.
870.
880.
850.
77
Jaka
rta
Sel
atan
3171
1.00
1.00
1.00
1.00
0.99
1.00
0.99
0.99
1.00
0.99
1.00
1.00
1.00
1.00
1.00
1.00
Jaka
rta
Tim
ur31
721.
001.
001.
001.
000.
981.
000.
990.
981.
000.
991.
000.
990.
990.
991.
001.
00
Jaka
rta
Pus
at31
731.
001.
001.
001.
001.
000.
960.
981.
001.
001.
001.
000.
990.
990.
991.
001.
00
Jaka
rta
Bar
at31
741.
001.
001.
001.
000.
950.
990.
971.
001.
001.
000.
990.
990.
990.
991.
001.
00
Jaka
rta
Uta
ra31
751.
001.
001.
001.
000.
981.
000.
990.
961.
000.
980.
990.
990.
990.
990.
991.
00
Jaw
a B
arat
0.99
0.88
0.99
0.96
0.98
0.99
0.98
0.94
0.96
0.95
0.96
0.96
0.96
0.96
0.96
0.95
Bo
go
r32
010.
990.
911.
000.
971.
000.
990.
990.
930.
980.
950.
970.
970.
970.
970.
970.
96
Suk
abum
i32
020.
960.
740.
980.
890.
930.
980.
960.
970.
910.
940.
910.
930.
920.
930.
920.
89
Cia
njur
3203
0.95
0.67
0.97
0.86
0.98
0.97
0.98
0.98
0.93
0.95
0.90
0.93
0.92
0.92
0.91
0.87
Ban
dun
g32
041.
000.
950.
990.
980.
980.
980.
980.
920.
960.
940.
970.
970.
970.
970.
970.
97
Gar
ut32
050.
980.
680.
990.
890.
780.
970.
870.
910.
920.
910.
890.
890.
890.
900.
910.
88
Tasi
kmal
aya
3206
0.98
0.73
0.99
0.90
1.00
1.00
1.00
0.90
0.98
0.94
0.93
0.95
0.94
0.94
0.93
0.90
Dis
tric
tB
PS
Co
de
Ph
ysic
al A
vaila
bili
tyH
ealt
h P
erso
nn
elB
uild
ing
Ch
arac
teri
stic
sC
om
po
site
Ind
ices
Pri
mar
yS
eco
nd
ary
Del
iver
yS
ub
Ind
exG
P P
usk
.M
idw
ife
Su
bIn
dex
Wat
er P
.E
lect
rici
tyS
ub
Ind
exA
cces
sE
qu
al D
.E
qu
al I.
PC
AO
LS
CI

65
|
Cia
mis
3207
0.99
0.78
0.99
0.92
0.98
1.00
0.99
0.90
0.98
0.94
0.94
0.95
0.95
0.95
0.94
0.92
Kun
ing
an32
080.
990.
930.
990.
970.
951.
000.
970.
970.
960.
960.
970.
970.
970.
970.
970.
96
Cir
ebo
n32
091.
000.
961.
000.
990.
980.
990.
990.
960.
990.
980.
980.
980.
980.
980.
980.
98
Maj
alen
gka
3210
0.99
0.95
1.00
0.98
1.00
1.00
1.00
0.97
0.97
0.97
0.98
0.98
0.98
0.98
0.98
0.97
Sum
edan
g32
110.
990.
941.
000.
981.
001.
001.
000.
940.
920.
930.
970.
970.
970.
970.
960.
96
Ind
ram
ayu
3212
1.00
0.92
1.00
0.97
0.98
0.99
0.98
0.94
0.91
0.93
0.97
0.96
0.96
0.97
0.96
0.95
Sub
ang
3213
0.98
0.85
1.00
0.94
1.00
1.00
1.00
0.98
0.98
0.98
0.96
0.97
0.97
0.97
0.96
0.95
Pur
wak
arta
3214
0.97
0.85
0.98
0.94
1.00
0.98
0.99
0.95
0.96
0.96
0.95
0.96
0.96
0.96
0.95
0.94
Kar
awan
g32
150.
990.
971.
000.
991.
001.
001.
001.
000.
991.
000.
990.
990.
990.
990.
990.
99
Bek
asi
3216
0.98
0.93
1.00
0.97
1.00
0.99
1.00
0.92
0.98
0.95
0.97
0.97
0.97
0.97
0.97
0.96
Ban
dun
g B
arat
3217
0.97
0.78
1.00
0.92
1.00
0.99
1.00
0.81
0.95
0.88
0.92
0.93
0.93
0.93
0.92
0.90
Bo
go
r32
711.
000.
991.
001.
001.
000.
910.
951.
001.
001.
000.
990.
980.
990.
981.
001.
00
Suk
abum
i32
721.
001.
001.
001.
001.
000.
960.
981.
001.
001.
001.
000.
990.
990.
991.
001.
00
Ban
dun
g32
731.
001.
001.
001.
001.
000.
940.
970.
891.
000.
940.
980.
970.
980.
980.
980.
99
Cir
ebo
n32
741.
001.
001.
001.
001.
001.
001.
001.
001.
001.
001.
001.
001.
001.
001.
001.
00
Bek
asi
3275
1.00
1.00
1.00
1.00
1.00
1.00
1.00
1.00
1.00
1.00
1.00
1.00
1.00
1.00
1.00
1.00
Dep
ok
3276
1.00
0.99
1.00
1.00
1.00
0.99
0.99
0.97
1.00
0.98
0.99
0.99
0.99
0.99
0.99
0.99
Cim
ahi
3277
1.00
1.00
1.00
1.00
1.00
1.00
1.00
1.00
0.94
0.97
0.99
0.99
0.99
0.99
0.99
0.99
Tasi
kmal
aya
3278
1.00
0.94
1.00
0.98
1.00
1.00
1.00
0.90
0.96
0.93
0.97
0.97
0.97
0.97
0.97
0.96
Ban
jar
3279
1.00
1.00
1.00
1.00
0.90
1.00
0.95
1.00
1.00
1.00
0.99
0.98
0.99
0.99
1.00
1.00
Jaw
a Te
ngah
0.98
0.95
1.00
0.98
0.99
0.99
0.99
0.98
0.95
0.96
0.98
0.98
0.98
0.98
0.97
0.97
Cila
cap
3301
0.97
0.87
1.00
0.94
1.00
1.00
1.00
1.00
0.97
0.99
0.96
0.98
0.97
0.97
0.97
0.95
Ban
yum
as33
020.
980.
981.
000.
991.
000.
990.
990.
920.
970.
950.
980.
980.
980.
980.
980.
98
Pur
bal
ing
ga
3303
0.99
0.93
1.00
0.97
0.95
1.00
0.98
1.00
0.97
0.99
0.98
0.98
0.98
0.98
0.98
0.97
Ban
jarn
egar
a33
040.
980.
941.
000.
971.
001.
001.
000.
910.
970.
940.
970.
970.
970.
970.
970.
96
Keb
umen
3305
0.96
0.94
0.98
0.96
1.00
0.99
0.99
0.97
0.95
0.96
0.97
0.97
0.97
0.97
0.97
0.96
Pur
wo
rejo
3306
0.96
0.90
1.00
0.95
1.00
0.89
0.95
0.96
0.94
0.95
0.95
0.95
0.95
0.95
0.96
0.95
Wo
noso
bo
3307
0.96
0.81
0.98
0.92
1.00
1.00
1.00
1.00
0.92
0.96
0.94
0.96
0.95
0.95
0.94
0.92
Mag
elan
g33
080.
990.
991.
000.
990.
970.
990.
981.
000.
970.
990.
990.
990.
990.
990.
990.
99
Bo
yola
li33
090.
970.
910.
990.
961.
000.
990.
990.
970.
940.
950.
960.
970.
970.
970.
960.
95
Kla
ten
3310
1.00
1.00
1.00
1.00
1.00
1.00
1.00
0.97
0.94
0.95
0.99
0.98
0.99
0.99
0.98
0.98
Suk
oha
rjo
3311
1.00
0.98
1.00
0.99
1.00
1.00
1.00
1.00
0.97
0.98
0.99
0.99
0.99
0.99
0.99
0.98
Wo
nog
iri
3312
1.00
0.94
0.99
0.98
0.97
1.00
0.99
0.94
0.90
0.92
0.97
0.96
0.96
0.96
0.95
0.95
Kar
ang
anya
r33
130.
990.
970.
990.
981.
001.
001.
001.
000.
950.
980.
980.
990.
990.
990.
980.
98
Sra
gen
3314
1.00
0.98
1.00
0.99
1.00
1.00
1.00
1.00
0.97
0.99
0.99
0.99
0.99
0.99
0.99
0.99
Dis
tric
tB
PS
Co
de
Ph
ysic
al A
vaila
bili
tyH
ealt
h P
erso
nn
elB
uild
ing
Ch
arac
teri
stic
sC
om
po
site
Ind
ices
Pri
mar
yS
eco
nd
ary
Del
iver
yS
ub
Ind
exG
P P
usk
.M
idw
ife
Su
bIn
dex
Wat
er P
.E
lect
rici
tyS
ub
Ind
exA
cces
sE
qu
al D
.E
qu
al I.
PC
AO
LS
CI

66
|
Gro
bo
gan
3315
0.97
0.92
1.00
0.96
1.00
1.00
1.00
1.00
0.91
0.96
0.97
0.97
0.97
0.97
0.97
0.95
Blo
ra33
160.
970.
890.
990.
951.
000.
980.
990.
961.
000.
980.
960.
970.
970.
970.
970.
96
Rem
ban
g33
170.
980.
930.
970.
961.
000.
960.
980.
940.
990.
960.
960.
970.
970.
970.
960.
96
Pat
i33
180.
990.
981.
000.
991.
001.
001.
000.
970.
960.
960.
990.
980.
980.
980.
980.
98
Kud
us33
191.
001.
001.
001.
001.
001.
001.
001.
001.
001.
001.
001.
001.
001.
001.
001.
00
Jep
ara
3320
1.00
0.98
1.00
0.99
1.00
1.00
1.00
1.00
0.91
0.95
0.99
0.98
0.98
0.98
0.98
0.97
Dem
ak33
210.
970.
921.
000.
961.
001.
001.
001.
000.
870.
930.
970.
970.
970.
970.
960.
94
Sem
aran
g33
221.
000.
971.
000.
991.
001.
001.
001.
000.
980.
990.
990.
990.
990.
990.
990.
99
Tem
ang
gun
g33
230.
980.
931.
000.
970.
910.
990.
951.
000.
980.
990.
970.
970.
970.
970.
980.
97
Ken
dal
3324
0.98
0.90
1.00
0.96
0.97
0.99
0.98
1.00
0.95
0.97
0.97
0.97
0.97
0.97
0.97
0.96
Bat
ang
3325
0.99
0.97
1.00
0.99
1.00
1.00
1.00
1.00
0.93
0.97
0.98
0.98
0.98
0.98
0.98
0.97
Pek
alo
ngan
3326
0.96
0.91
1.00
0.96
1.00
0.99
0.99
0.96
0.94
0.95
0.96
0.97
0.97
0.97
0.96
0.95
Pem
alan
g33
270.
990.
941.
000.
981.
000.
991.
001.
000.
950.
980.
980.
980.
980.
980.
980.
97
Teg
al33
280.
990.
981.
000.
990.
931.
000.
960.
930.
950.
940.
970.
960.
970.
970.
970.
97
Bre
bes
3329
0.98
0.92
1.00
0.97
0.97
1.00
0.99
1.00
0.86
0.93
0.96
0.96
0.96
0.96
0.96
0.94
Mag
elan
g33
711.
000.
971.
000.
991.
000.
950.
981.
000.
940.
970.
980.
980.
980.
980.
980.
98
Sur
akar
ta33
721.
001.
001.
001.
001.
000.
910.
951.
001.
001.
000.
990.
980.
990.
991.
001.
00
Sal
atig
a33
731.
001.
001.
001.
001.
001.
001.
001.
001.
001.
001.
001.
001.
001.
001.
001.
00
Sem
aran
g33
741.
000.
991.
001.
001.
000.
870.
930.
971.
000.
990.
980.
970.
980.
980.
990.
99
Pek
alo
ngan
3375
1.00
1.00
1.00
1.00
1.00
0.95
0.98
1.00
1.00
1.00
1.00
0.99
0.99
0.99
1.00
1.00
Teg
al33
761.
001.
001.
001.
000.
861.
000.
931.
001.
001.
000.
990.
980.
980.
981.
001.
00
DI Y
og
yaka
rta
1.00
0.99
1.00
1.00
1.00
0.97
0.99
0.96
0.98
0.97
0.99
0.98
0.99
0.99
0.99
0.99
Kul
on
Pro
go
3401
1.00
1.00
1.00
1.00
1.00
1.00
1.00
0.86
0.98
0.92
0.98
0.97
0.98
0.98
0.97
0.98
Ban
tul
3402
1.00
1.00
1.00
1.00
1.00
1.00
1.00
0.96
0.99
0.98
1.00
0.99
0.99
0.99
0.99
0.99
Gun
ung
Kid
ul34
031.
000.
970.
990.
991.
000.
980.
991.
000.
950.
980.
990.
990.
990.
990.
980.
98
Sle
man
3404
1.00
1.00
1.00
1.00
1.00
1.00
1.00
1.00
1.00
1.00
1.00
1.00
1.00
1.00
1.00
1.00
Yog
yaka
rta
3471
1.00
1.00
1.00
1.00
1.00
0.78
0.89
0.94
1.00
0.97
0.97
0.95
0.96
0.96
0.99
0.99
Jaw
a T
imur
0.99
0.93
1.00
0.97
0.98
1.00
0.99
0.98
0.98
0.98
0.98
0.98
0.98
0.98
0.98
0.97
Pac
itan
3501
0.97
0.77
1.00
0.91
1.00
0.98
0.99
1.00
0.99
1.00
0.95
0.97
0.96
0.96
0.96
0.93
Po
noro
go
3502
0.99
0.96
1.00
0.99
1.00
0.99
1.00
1.00
0.98
0.99
0.99
0.99
0.99
0.99
0.99
0.98
Tren
gg
alek
3503
0.97
0.78
0.99
0.92
1.00
1.00
1.00
1.00
0.97
0.99
0.95
0.97
0.96
0.96
0.95
0.93
Tulu
ngag
ung
3504
1.00
0.99
1.00
0.99
1.00
0.99
1.00
1.00
0.98
0.99
0.99
0.99
0.99
0.99
0.99
0.99
Blit
ar35
051.
000.
961.
000.
990.
921.
000.
960.
960.
990.
970.
980.
970.
970.
980.
980.
98
Ked
iri
3506
1.00
0.99
1.00
0.99
1.00
1.00
1.00
0.89
0.97
0.93
0.98
0.97
0.98
0.98
0.97
0.98
Mal
ang
3507
0.99
0.94
1.00
0.98
0.95
0.99
0.97
1.00
0.97
0.99
0.98
0.98
0.98
0.98
0.98
0.97
Dis
tric
tB
PS
Co
de
Ph
ysic
al A
vaila
bili
tyH
ealt
h P
erso
nn
elB
uild
ing
Ch
arac
teri
stic
sC
om
po
site
Ind
ices
Pri
mar
yS
eco
nd
ary
Del
iver
yS
ub
Ind
exG
P P
usk
.M
idw
ife
Su
bIn
dex
Wat
er P
.E
lect
rici
tyS
ub
Ind
exA
cces
sE
qu
al D
.E
qu
al I.
PC
AO
LS
CI

67 |
Lum
ajan
g35
081.
000.
981.
000.
991.
001.
001.
001.
000.
990.
990.
990.
990.
990.
990.
990.
99
Jem
ber
3509
1.00
0.99
1.00
1.00
0.98
1.00
0.99
0.98
0.96
0.97
0.99
0.99
0.99
0.99
0.99
0.98
Ban
yuw
ang
i35
101.
000.
941.
000.
981.
001.
001.
001.
000.
960.
980.
980.
990.
980.
990.
980.
97
Bo
ndo
wo
so35
110.
990.
940.
970.
970.
921.
000.
961.
000.
990.
990.
970.
970.
970.
970.
970.
97
Sit
ubo
ndo
3512
0.98
0.93
1.00
0.97
1.00
1.00
1.00
1.00
0.98
0.99
0.98
0.99
0.98
0.98
0.98
0.97
Pro
bo
ling
go
3513
0.98
0.94
1.00
0.97
0.91
0.98
0.94
0.94
0.99
0.96
0.97
0.96
0.96
0.96
0.98
0.97
Pas
urua
n35
140.
990.
951.
000.
981.
001.
001.
001.
000.
980.
990.
990.
990.
990.
990.
990.
98
Sid
oar
jo35
151.
001.
001.
001.
001.
001.
001.
001.
001.
001.
001.
001.
001.
001.
001.
001.
00
Mo
joke
rto
3516
1.00
1.00
1.00
1.00
1.00
1.00
1.00
1.00
1.00
1.00
1.00
1.00
1.00
1.00
1.00
1.00
Jom
ban
g35
171.
000.
981.
000.
990.
970.
990.
980.
970.
980.
980.
990.
980.
980.
990.
990.
99
Ng
anju
k35
181.
000.
971.
000.
991.
001.
001.
000.
950.
990.
970.
990.
990.
990.
990.
990.
98
Mad
iun
3519
1.00
0.97
1.00
0.99
1.00
1.00
1.00
0.92
0.98
0.95
0.98
0.98
0.98
0.98
0.98
0.98
Mag
etan
3520
1.00
1.00
1.00
1.00
1.00
0.99
1.00
1.00
0.98
0.99
1.00
1.00
1.00
1.00
1.00
1.00
Ng
awi
3521
1.00
0.97
1.00
0.99
0.96
1.00
0.98
1.00
0.98
0.99
0.99
0.99
0.99
0.99
0.99
0.99
Bo
jone
go
ro35
220.
990.
921.
000.
971.
001.
001.
001.
000.
980.
990.
980.
990.
980.
980.
980.
97
Tub
an35
231.
000.
981.
000.
990.
880.
990.
930.
970.
990.
980.
980.
970.
970.
970.
990.
99
Lam
ong
an35
240.
980.
900.
990.
960.
971.
000.
981.
000.
990.
990.
970.
980.
980.
980.
980.
96
Gre
sik
3525
1.00
0.85
1.00
0.95
0.97
0.99
0.98
0.97
1.00
0.98
0.96
0.97
0.97
0.97
0.97
0.95
Ban
gka
lan
3526
0.96
0.76
0.99
0.91
0.95
0.99
0.97
0.91
0.96
0.93
0.93
0.94
0.93
0.94
0.93
0.91
Sam
pan
g35
270.
900.
590.
990.
830.
950.
990.
970.
950.
980.
970.
880.
920.
910.
910.
910.
87
Pam
ekas
an35
280.
960.
841.
000.
930.
950.
990.
970.
950.
990.
970.
950.
960.
950.
960.
960.
95
Sum
enep
3529
0.95
0.58
0.98
0.84
1.00
1.00
1.00
0.97
0.92
0.94
0.89
0.93
0.91
0.91
0.90
0.85
Ked
iri
3571
1.00
1.00
1.00
1.00
1.00
0.99
1.00
1.00
0.98
0.99
1.00
1.00
1.00
1.00
1.00
0.99
Blit
ar35
721.
001.
001.
001.
001.
001.
001.
001.
001.
001.
001.
001.
001.
001.
001.
001.
00
Mal
ang
3573
1.00
1.00
1.00
1.00
1.00
0.99
0.99
1.00
1.00
1.00
1.00
1.00
1.00
1.00
1.00
1.00
Pro
bo
ling
go
3574
1.00
1.00
1.00
1.00
1.00
0.99
0.99
1.00
1.00
1.00
1.00
1.00
1.00
1.00
1.00
1.00
Pas
urua
n35
751.
001.
001.
001.
001.
000.
990.
991.
001.
001.
001.
001.
001.
001.
001.
001.
00
Mo
joke
rto
3576
1.00
1.00
1.00
1.00
1.00
1.00
1.00
1.00
0.97
0.99
1.00
1.00
1.00
1.00
0.99
0.99
Mad
iun
3577
1.00
1.00
1.00
1.00
1.00
0.99
1.00
1.00
1.00
1.00
1.00
1.00
1.00
1.00
1.00
1.00
Sur
abay
a35
781.
001.
001.
001.
000.
981.
000.
990.
960.
990.
980.
990.
990.
990.
990.
990.
99
Bat
u35
791.
001.
001.
001.
001.
001.
001.
001.
001.
001.
001.
001.
001.
001.
001.
001.
00
Ban
ten
0.98
0.88
0.98
0.95
0.97
0.97
0.97
0.97
0.97
0.97
0.96
0.96
0.96
0.96
0.96
0.95
Pan
deg
lang
3601
0.90
0.55
0.94
0.79
0.92
0.91
0.91
0.94
0.98
0.96
0.85
0.89
0.88
0.88
0.88
0.84
Leb
ak36
020.
920.
640.
930.
831.
000.
900.
950.
930.
990.
960.
880.
910.
900.
900.
890.
86
Tang
eran
g36
030.
990.
951.
000.
980.
980.
990.
980.
980.
940.
960.
980.
970.
980.
980.
980.
97
Dis
tric
tB
PS
Co
de
Ph
ysic
al A
vaila
bili
tyH
ealt
h P
erso
nn
elB
uild
ing
Ch
arac
teri
stic
sC
om
po
site
Ind
ices
Pri
mar
yS
eco
nd
ary
Del
iver
yS
ub
Ind
exG
P P
usk
.M
idw
ife
Su
bIn
dex
Wat
er P
.E
lect
rici
tyS
ub
Ind
exA
cces
sE
qu
al D
.E
qu
al I.
PC
AO
LS
CI

68
|
Ser
ang
3604
0.98
0.90
1.00
0.96
0.97
0.95
0.96
1.00
0.94
0.97
0.96
0.96
0.96
0.96
0.97
0.95
Tang
eran
g36
711.
001.
001.
001.
001.
000.
991.
001.
001.
001.
001.
001.
001.
001.
001.
001.
00
Cile
go
n36
721.
001.
001.
001.
000.
881.
000.
941.
000.
920.
960.
980.
970.
970.
970.
980.
98
Ser
ang
3673
1.00
1.00
1.00
1.00
1.00
0.96
0.98
1.00
1.00
1.00
1.00
0.99
0.99
0.99
1.00
1.00
Tang
eran
g S
elat
an36
741.
001.
001.
001.
001.
001.
001.
001.
001.
001.
001.
001.
001.
001.
001.
001.
00
Bal
i1.
000.
981.
000.
990.
990.
990.
990.
970.
960.
970.
990.
980.
990.
990.
990.
98
Jem
bra
na51
011.
001.
001.
001.
001.
001.
001.
001.
000.
980.
991.
001.
001.
001.
001.
001.
00
Tab
anan
5102
1.00
1.00
1.00
1.00
1.00
0.99
1.00
0.95
1.00
0.98
0.99
0.99
0.99
0.99
0.99
0.99
Bad
ung
5103
1.00
1.00
1.00
1.00
1.00
1.00
1.00
1.00
0.99
1.00
1.00
1.00
1.00
1.00
1.00
1.00
Gia
nyar
5104
1.00
1.00
1.00
1.00
1.00
1.00
1.00
1.00
0.99
0.99
1.00
1.00
1.00
1.00
1.00
1.00
Klu
ngku
ng51
051.
000.
761.
000.
921.
001.
001.
001.
000.
920.
960.
940.
960.
950.
950.
940.
91
Ban
gli
5106
1.00
1.00
1.00
1.00
1.00
0.96
0.98
0.91
0.95
0.93
0.98
0.97
0.98
0.98
0.98
0.98
Kar
ang
Ase
m51
071.
001.
001.
001.
001.
001.
001.
001.
000.
840.
920.
980.
970.
980.
980.
970.
96
Bul
elen
g51
081.
000.
961.
000.
981.
000.
970.
980.
950.
980.
970.
980.
980.
980.
980.
980.
98
Den
pas
ar51
711.
001.
001.
001.
000.
910.
990.
951.
001.
001.
000.
990.
980.
990.
991.
001.
00
Nus
a Te
ngg
ara
Bar
at0.
990.
800.
970.
920.
970.
920.
950.
970.
920.
940.
930.
940.
940.
940.
930.
91
Lom
bo
k B
arat
5201
1.00
0.91
0.99
0.96
1.00
0.90
0.95
0.93
0.92
0.93
0.95
0.95
0.95
0.95
0.95
0.94
Lom
bo
k Te
ngah
5202
0.99
0.77
0.97
0.91
1.00
0.95
0.97
1.00
0.94
0.97
0.94
0.95
0.95
0.95
0.93
0.91
Lom
bo
k T
imur
5203
0.99
0.92
0.98
0.97
1.00
0.84
0.92
1.00
0.97
0.98
0.96
0.96
0.96
0.96
0.97
0.96
Sum
baw
a52
040.
980.
690.
930.
870.
880.
960.
920.
920.
910.
910.
890.
900.
890.
900.
880.
85
Do
mp
u52
050.
970.
700.
950.
871.
000.
970.
980.
890.
840.
870.
890.
910.
900.
910.
880.
85
Bim
a52
060.
990.
590.
940.
840.
950.
980.
971.
000.
870.
930.
880.
910.
900.
900.
880.
83
Sum
baw
a B
arat
5207
0.98
0.28
0.95
0.74
1.00
0.97
0.98
0.89
0.93
0.91
0.82
0.88
0.86
0.86
0.83
0.75
Lom
bo
k U
tara
5208
0.97
0.57
1.00
0.85
1.00
0.99
0.99
1.00
0.98
0.99
0.91
0.94
0.93
0.93
0.92
0.87
Mat
aram
5271
1.00
0.98
1.00
0.99
1.00
0.95
0.97
1.00
0.98
0.99
0.99
0.99
0.99
0.99
0.99
0.99
Bim
a52
721.
000.
910.
950.
951.
001.
001.
001.
000.
980.
990.
970.
980.
980.
980.
960.
95
Nus
a Te
ngg
ara
Tim
ur0.
910.
530.
880.
770.
800.
790.
800.
830.
590.
710.
760.
760.
760.
760.
750.
71
Sum
ba
Bar
at53
010.
870.
610.
920.
801.
000.
750.
871.
000.
520.
760.
810.
810.
810.
810.
800.
74
Sum
ba
Tim
ur53
020.
910.
430.
850.
730.
800.
820.
810.
850.
570.
710.
740.
750.
750.
750.
730.
67
Kup
ang
5303
0.96
0.47
0.77
0.73
0.70
0.83
0.76
0.78
0.46
0.62
0.72
0.70
0.71
0.71
0.66
0.61
Tim
or
Teng
ah S
elat
an53
040.
810.
330.
840.
660.
670.
700.
680.
740.
470.
600.
650.
650.
650.
660.
660.
60
Tim
or
Teng
ah U
tara
5305
0.93
0.73
0.98
0.88
0.52
0.89
0.71
0.80
0.66
0.73
0.82
0.77
0.79
0.80
0.84
0.81
Bel
u53
060.
910.
560.
940.
800.
480.
890.
690.
780.
540.
660.
750.
720.
730.
740.
770.
72
Alo
r53
070.
830.
460.
770.
690.
730.
650.
690.
820.
430.
620.
670.
670.
670.
670.
660.
61
Lem
bat
a53
080.
920.
740.
910.
861.
000.
820.
910.
890.
770.
830.
860.
870.
860.
860.
850.
83
Dis
tric
tB
PS
Co
de
Ph
ysic
al A
vaila
bili
tyH
ealt
h P
erso
nn
elB
uild
ing
Ch
arac
teri
stic
sC
om
po
site
Ind
ices
Pri
mar
yS
eco
nd
ary
Del
iver
yS
ub
Ind
exG
P P
usk
.M
idw
ife
Su
bIn
dex
Wat
er P
.E
lect
rici
tyS
ub
Ind
exA
cces
sE
qu
al D
.E
qu
al I.
PC
AO
LS
CI

69
|
Flo
res
Tim
ur53
090.
960.
520.
980.
820.
890.
680.
790.
790.
690.
740.
800.
780.
790.
790.
810.
76
Sik
ka53
100.
940.
720.
960.
870.
950.
980.
970.
860.
680.
770.
870.
870.
870.
880.
850.
82
End
e53
110.
870.
620.
900.
800.
960.
650.
811.
000.
460.
730.
790.
780.
780.
780.
780.
72
Ng
ada
5312
0.94
0.80
0.95
0.90
0.80
0.77
0.78
0.80
0.77
0.79
0.85
0.82
0.83
0.84
0.86
0.85
Man
gg
arai
5313
0.93
0.62
0.87
0.80
1.00
0.86
0.93
0.82
0.58
0.70
0.81
0.81
0.81
0.81
0.76
0.72
Ro
te N
dao
5314
0.94
0.31
0.67
0.64
0.92
0.69
0.80
0.92
0.89
0.90
0.72
0.78
0.76
0.76
0.70
0.65
Man
gg
arai
Bar
at53
150.
780.
190.
690.
550.
830.
770.
800.
830.
480.
660.
620.
670.
650.
650.
590.
51
Sum
ba
Teng
ah53
160.
940.
300.
950.
730.
830.
660.
750.
670.
600.
630.
710.
700.
710.
720.
720.
65
Sum
ba
Bar
at D
aya
5317
0.92
0.38
0.89
0.73
0.80
0.86
0.83
0.60
0.51
0.56
0.72
0.71
0.71
0.72
0.68
0.63
Nag
ekeo
5318
0.97
0.48
0.95
0.80
1.00
0.79
0.89
1.00
0.85
0.93
0.84
0.87
0.86
0.86
0.86
0.80
Man
gg
arai
Tim
ur53
190.
860.
320.
820.
670.
900.
590.
750.
850.
470.
660.
680.
690.
690.
690.
670.
60
Sab
u R
aiju
a53
200.
890.
290.
820.
670.
830.
570.
700.
670.
300.
480.
640.
620.
630.
630.
600.
53
Kup
ang
5371
1.00
1.00
1.00
1.00
1.00
0.97
0.99
0.90
0.98
0.94
0.99
0.98
0.98
0.98
0.98
0.98
Kal
iman
tan
Bar
at0.
920.
580.
900.
800.
830.
870.
850.
870.
670.
770.
800.
810.
810.
810.
790.
75
Sam
bas
6101
0.98
0.53
0.97
0.83
0.89
0.96
0.93
0.96
0.89
0.93
0.87
0.89
0.88
0.89
0.88
0.83
Ben
gka
yang
6102
0.91
0.71
0.89
0.84
0.53
0.86
0.70
0.71
0.56
0.63
0.77
0.72
0.74
0.75
0.77
0.74
Land
ak61
030.
930.
540.
920.
790.
810.
840.
830.
810.
470.
640.
770.
750.
760.
770.
750.
69
Po
ntia
nak
6104
0.99
0.81
0.99
0.93
0.86
0.98
0.92
0.71
0.87
0.79
0.90
0.88
0.89
0.90
0.89
0.88
San
gg
au61
050.
920.
500.
860.
761.
001.
001.
000.
940.
570.
760.
810.
840.
830.
830.
760.
70
Ket
apan
g61
060.
880.
370.
820.
690.
770.
770.
770.
810.
730.
770.
720.
740.
740.
740.
730.
67
Sin
tang
6107
0.78
0.34
0.84
0.65
0.81
0.61
0.71
0.76
0.63
0.69
0.67
0.68
0.68
0.68
0.70
0.63
Kap
uas
Hul
u61
080.
820.
360.
770.
650.
740.
700.
721.
000.
560.
780.
690.
720.
710.
700.
700.
63
Sek
adau
6109
0.93
0.39
0.90
0.74
0.92
0.82
0.87
0.83
0.59
0.71
0.76
0.77
0.77
0.77
0.74
0.67
Mel
awi
6110
0.72
0.30
0.68
0.57
1.00
0.58
0.79
0.70
0.58
0.64
0.63
0.67
0.65
0.65
0.60
0.55
Kay
ong
Uta
ra61
110.
920.
430.
940.
770.
860.
930.
890.
860.
760.
810.
800.
820.
810.
820.
800.
74
Kub
u R
aya
6112
0.96
0.59
0.91
0.82
0.80
0.99
0.89
0.90
0.80
0.85
0.84
0.85
0.85
0.85
0.83
0.79
Po
ntia
nak
6171
1.00
1.00
1.00
1.00
0.91
0.98
0.95
1.00
0.97
0.99
0.99
0.98
0.98
0.98
0.99
0.99
Sin
gka
wan
g61
721.
001.
001.
001.
001.
000.
920.
961.
000.
640.
820.
960.
930.
940.
940.
930.
91
Kal
iman
tan
Teng
ah0.
960.
640.
890.
830.
860.
860.
860.
880.
730.
800.
830.
830.
830.
830.
820.
78
Ko
taw
arin
gin
Bar
at62
010.
980.
740.
960.
901.
000.
970.
990.
930.
910.
920.
920.
930.
930.
930.
910.
88
Ko
taw
arin
gin
Tim
ur62
020.
960.
690.
900.
850.
850.
810.
831.
000.
770.
880.
850.
850.
850.
850.
860.
82
Kap
uas
6203
0.91
0.58
0.85
0.78
0.83
0.84
0.83
0.74
0.76
0.75
0.79
0.79
0.79
0.79
0.77
0.74
Bar
ito
Sel
atan
6204
0.97
0.69
0.92
0.86
0.80
0.90
0.85
0.80
0.60
0.70
0.83
0.80
0.81
0.82
0.80
0.77
Bar
ito
Uta
ra62
050.
990.
560.
870.
810.
670.
960.
811.
000.
760.
880.
820.
830.
830.
830.
820.
77
Suk
amar
a62
061.
000.
600.
970.
861.
000.
890.
951.
000.
800.
900.
880.
900.
900.
900.
880.
83
Dis
tric
tB
PS
Co
de
Ph
ysic
al A
vaila
bili
tyH
ealt
h P
erso
nn
elB
uild
ing
Ch
arac
teri
stic
sC
om
po
site
Ind
ices
Pri
mar
yS
eco
nd
ary
Del
iver
yS
ub
Ind
exG
P P
usk
.M
idw
ife
Su
bIn
dex
Wat
er P
.E
lect
rici
tyS
ub
Ind
exA
cces
sE
qu
al D
.E
qu
al I.
PC
AO
LS
CI
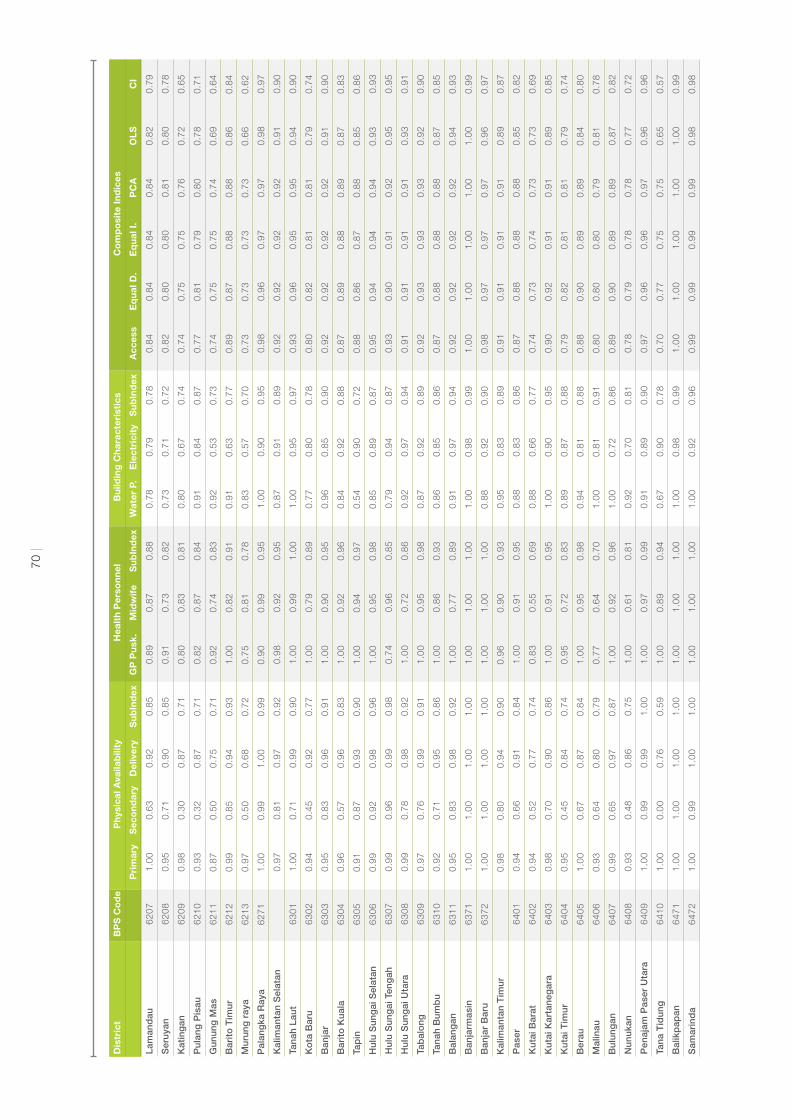
70 |
Lam
and
au62
071.
000.
630.
920.
850.
890.
870.
880.
780.
790.
780.
840.
840.
840.
840.
820.
79
Ser
uyan
6208
0.95
0.71
0.90
0.85
0.91
0.73
0.82
0.73
0.71
0.72
0.82
0.80
0.80
0.81
0.80
0.78
Kat
ing
an62
090.
980.
300.
870.
710.
800.
830.
810.
800.
670.
740.
740.
750.
750.
760.
720.
65
Pul
ang
Pis
au62
100.
930.
320.
870.
710.
820.
870.
840.
910.
840.
870.
770.
810.
790.
800.
780.
71
Gun
ung
Mas
6211
0.87
0.50
0.75
0.71
0.92
0.74
0.83
0.92
0.53
0.73
0.74
0.75
0.75
0.74
0.69
0.64
Bar
ito
Tim
ur62
120.
990.
850.
940.
931.
000.
820.
910.
910.
630.
770.
890.
870.
880.
880.
860.
84
Mur
ung
ray
a62
130.
970.
500.
680.
720.
750.
810.
780.
830.
570.
700.
730.
730.
730.
730.
660.
62
Pal
ang
ka R
aya
6271
1.00
0.99
1.00
0.99
0.90
0.99
0.95
1.00
0.90
0.95
0.98
0.96
0.97
0.97
0.98
0.97
Kal
iman
tan
Sel
atan
0.97
0.81
0.97
0.92
0.98
0.92
0.95
0.87
0.91
0.89
0.92
0.92
0.92
0.92
0.91
0.90
Tana
h La
ut63
011.
000.
710.
990.
901.
000.
991.
001.
000.
950.
970.
930.
960.
950.
950.
940.
90
Ko
ta B
aru
6302
0.94
0.45
0.92
0.77
1.00
0.79
0.89
0.77
0.80
0.78
0.80
0.82
0.81
0.81
0.79
0.74
Ban
jar
6303
0.95
0.83
0.96
0.91
1.00
0.90
0.95
0.96
0.85
0.90
0.92
0.92
0.92
0.92
0.91
0.90
Bar
ito
Kua
la63
040.
960.
570.
960.
831.
000.
920.
960.
840.
920.
880.
870.
890.
880.
890.
870.
83
Tap
in63
050.
910.
870.
930.
901.
000.
940.
970.
540.
900.
720.
880.
860.
870.
880.
850.
86
Hul
u S
ung
ai S
elat
an63
060.
990.
920.
980.
961.
000.
950.
980.
850.
890.
870.
950.
940.
940.
940.
930.
93
Hul
u S
ung
ai T
eng
ah63
070.
990.
960.
990.
980.
740.
960.
850.
790.
940.
870.
930.
900.
910.
920.
950.
95
Hul
u S
ung
ai U
tara
6308
0.99
0.78
0.98
0.92
1.00
0.72
0.86
0.92
0.97
0.94
0.91
0.91
0.91
0.91
0.93
0.91
Tab
alo
ng63
090.
970.
760.
990.
911.
000.
950.
980.
870.
920.
890.
920.
930.
930.
930.
920.
90
Tana
h B
umb
u63
100.
920.
710.
950.
861.
000.
860.
930.
860.
850.
860.
870.
880.
880.
880.
870.
85
Bal
ang
an63
110.
950.
830.
980.
921.
000.
770.
890.
910.
970.
940.
920.
920.
920.
920.
940.
93
Ban
jarm
asin
6371
1.00
1.00
1.00
1.00
1.00
1.00
1.00
1.00
0.98
0.99
1.00
1.00
1.00
1.00
1.00
0.99
Ban
jar
Bar
u63
721.
001.
001.
001.
001.
001.
001.
000.
880.
920.
900.
980.
970.
970.
970.
960.
97
Kal
iman
tan
Tim
ur0.
980.
800.
940.
900.
960.
900.
930.
950.
830.
890.
910.
910.
910.
910.
890.
87
Pas
er64
010.
940.
660.
910.
841.
000.
910.
950.
880.
830.
860.
870.
880.
880.
880.
850.
82
Kut
ai B
arat
6402
0.94
0.52
0.77
0.74
0.83
0.55
0.69
0.88
0.66
0.77
0.74
0.73
0.74
0.73
0.73
0.69
Kut
ai K
arta
neg
ara
6403
0.98
0.70
0.90
0.86
1.00
0.91
0.95
1.00
0.90
0.95
0.90
0.92
0.91
0.91
0.89
0.85
Kut
ai T
imur
6404
0.95
0.45
0.84
0.74
0.95
0.72
0.83
0.89
0.87
0.88
0.79
0.82
0.81
0.81
0.79
0.74
Ber
au64
051.
000.
670.
870.
841.
000.
950.
980.
940.
810.
880.
880.
900.
890.
890.
840.
80
Mal
inau
6406
0.93
0.64
0.80
0.79
0.77
0.64
0.70
1.00
0.81
0.91
0.80
0.80
0.80
0.79
0.81
0.78
Bul
ung
an64
070.
990.
650.
970.
871.
000.
920.
961.
000.
720.
860.
890.
900.
890.
890.
870.
82
Nun
ukan
6408
0.93
0.48
0.86
0.75
1.00
0.61
0.81
0.92
0.70
0.81
0.78
0.79
0.78
0.78
0.77
0.72
Pen
ajam
Pas
er U
tara
6409
1.00
0.99
0.99
1.00
1.00
0.97
0.99
0.91
0.89
0.90
0.97
0.96
0.96
0.97
0.96
0.96
Tana
Tid
ung
6410
1.00
0.00
0.76
0.59
1.00
0.89
0.94
0.67
0.90
0.78
0.70
0.77
0.75
0.75
0.65
0.57
Bal
ikp
apan
6471
1.00
1.00
1.00
1.00
1.00
1.00
1.00
1.00
0.98
0.99
1.00
1.00
1.00
1.00
1.00
0.99
Sam
arin
da
6472
1.00
0.99
1.00
1.00
1.00
1.00
1.00
1.00
0.92
0.96
0.99
0.99
0.99
0.99
0.98
0.98
Dis
tric
tB
PS
Co
de
Ph
ysic
al A
vaila
bili
tyH
ealt
h P
erso
nn
elB
uild
ing
Ch
arac
teri
stic
sC
om
po
site
Ind
ices
Pri
mar
yS
eco
nd
ary
Del
iver
yS
ub
Ind
exG
P P
usk
.M
idw
ife
Su
bIn
dex
Wat
er P
.E
lect
rici
tyS
ub
Ind
exA
cces
sE
qu
al D
.E
qu
al I.
PC
AO
LS
CI

71 |
Tara
kan
6473
1.00
1.00
1.00
1.00
1.00
1.00
1.00
1.00
1.00
1.00
1.00
1.00
1.00
1.00
1.00
1.00
Bo
ntan
g64
741.
001.
001.
001.
000.
670.
860.
771.
001.
001.
000.
950.
920.
930.
941.
001.
00
Sul
awes
i Uta
ra0.
980.
830.
960.
920.
950.
750.
850.
950.
870.
910.
910.
900.
900.
900.
920.
90
Bo
laan
g M
ong
ond
ow
7101
0.98
0.76
0.97
0.90
1.00
0.72
0.86
1.00
0.91
0.96
0.91
0.91
0.91
0.90
0.93
0.90
Min
ahas
a71
020.
980.
940.
980.
971.
000.
700.
851.
000.
850.
930.
940.
910.
920.
920.
950.
94
Kep
ulau
an S
ang
ihe
7103
0.93
0.59
0.89
0.80
0.94
0.57
0.75
1.00
0.86
0.93
0.82
0.83
0.82
0.82
0.85
0.81
Kep
ulau
an T
alau
d71
040.
940.
670.
860.
820.
680.
620.
650.
840.
790.
820.
790.
760.
770.
770.
810.
79
Min
ahas
a S
elat
an71
050.
990.
911.
000.
971.
000.
730.
871.
000.
850.
930.
940.
920.
930.
920.
950.
94
Min
ahas
a U
tara
7106
0.97
0.81
0.95
0.91
1.00
0.84
0.92
0.90
0.82
0.86
0.90
0.89
0.90
0.90
0.89
0.87
Bo
laan
g M
ong
. Uta
ra71
070.
980.
540.
980.
831.
000.
700.
850.
880.
890.
880.
840.
850.
850.
850.
870.
82
Sia
u Ta
gul
and
ang
Bia
ro71
080.
920.
490.
870.
761.
000.
620.
810.
750.
920.
830.
780.
800.
800.
800.
800.
76
Min
ahas
a Te
ngg
ara
7109
0.99
0.88
0.96
0.94
1.00
0.57
0.78
1.00
0.92
0.96
0.92
0.90
0.90
0.90
0.95
0.93
Bo
laan
g M
ong
. Sel
atan
7110
0.96
0.28
0.91
0.72
0.80
0.64
0.72
1.00
0.95
0.98
0.77
0.80
0.79
0.79
0.83
0.75
Bo
laan
g M
ong
. Tim
ur71
110.
980.
660.
960.
871.
000.
560.
781.
000.
970.
980.
870.
880.
880.
870.
920.
88
Man
ado
7171
1.00
0.99
1.00
0.99
1.00
0.83
0.91
1.00
0.85
0.92
0.96
0.94
0.95
0.95
0.97
0.96
Bit
ung
7172
0.96
0.83
0.95
0.91
1.00
0.85
0.92
1.00
0.86
0.93
0.92
0.92
0.92
0.92
0.92
0.90
Tom
oho
n71
731.
001.
001.
001.
001.
000.
960.
981.
000.
930.
960.
990.
980.
980.
980.
980.
98
Ko
tam
ob
agu
7174
1.00
1.00
1.00
1.00
1.00
0.99
0.99
1.00
0.93
0.96
0.99
0.99
0.99
0.99
0.99
0.98
Sul
awes
i Ten
gah
0.96
0.66
0.92
0.85
0.81
0.86
0.83
0.91
0.73
0.82
0.84
0.83
0.84
0.84
0.84
0.80
Ban
gg
ai K
epul
auan
7201
0.90
0.27
0.77
0.65
0.80
0.55
0.68
0.87
0.56
0.71
0.67
0.68
0.67
0.67
0.66
0.59
Ban
gg
ai72
020.
990.
740.
980.
900.
710.
810.
760.
860.
640.
750.
840.
800.
820.
830.
850.
82
Mo
row
ali
7203
0.95
0.56
0.84
0.78
0.65
0.84
0.74
0.88
0.63
0.76
0.77
0.76
0.76
0.77
0.76
0.72
Po
so72
041.
000.
850.
980.
940.
850.
980.
910.
950.
800.
870.
920.
910.
920.
920.
920.
90
Do
ngg
ala
7205
0.97
0.61
0.88
0.82
0.86
0.90
0.88
1.00
0.85
0.93
0.85
0.87
0.87
0.86
0.85
0.81
Toli-
Toli
7206
0.98
0.68
0.96
0.87
0.86
0.90
0.88
0.79
0.63
0.71
0.84
0.82
0.83
0.84
0.82
0.79
Buo
l72
070.
970.
800.
950.
910.
820.
770.
790.
730.
690.
710.
850.
810.
820.
830.
840.
83
Par
igi M
out
ong
7208
0.95
0.36
0.95
0.76
0.79
0.87
0.83
1.00
0.86
0.93
0.80
0.84
0.83
0.83
0.84
0.76
Tojo
Una
-Una
7209
0.88
0.60
0.72
0.73
0.69
0.69
0.69
1.00
0.72
0.86
0.75
0.76
0.76
0.75
0.75
0.71
Sig
i72
100.
940.
820.
940.
900.
930.
890.
910.
930.
810.
870.
900.
890.
900.
900.
890.
87
Pal
u72
711.
001.
001.
001.
001.
001.
001.
001.
000.
880.
940.
990.
980.
980.
980.
980.
97
Dis
tric
tB
PS
Co
de
Ph
ysic
al A
vaila
bili
tyH
ealt
h P
erso
nn
elB
uild
ing
Ch
arac
teri
stic
sC
om
po
site
Ind
ices
Pri
mar
yS
eco
nd
ary
Del
iver
yS
ub
Ind
exG
P P
usk
.M
idw
ife
Su
bIn
dex
Wat
er P
.E
lect
rici
tyS
ub
Ind
exA
cces
sE
qu
al D
.E
qu
al I.
PC
AO
LS
CI

72 |
Sul
awes
i Sel
atan
0.97
0.81
0.94
0.91
0.94
0.95
0.94
0.93
0.84
0.88
0.91
0.91
0.91
0.91
0.89
0.87
Sel
ayar
7301
0.99
0.50
0.81
0.76
0.77
0.83
0.80
1.00
0.74
0.87
0.79
0.81
0.80
0.80
0.78
0.72
Bul
ukum
ba
7302
1.00
0.71
0.98
0.89
0.94
0.99
0.97
0.83
0.78
0.81
0.89
0.89
0.89
0.90
0.87
0.84
Ban
taen
g73
030.
980.
870.
980.
941.
000.
980.
990.
750.
930.
840.
930.
930.
930.
930.
920.
92
Jene
po
nto
7304
1.00
0.90
0.99
0.96
0.83
0.97
0.90
0.94
0.76
0.85
0.93
0.91
0.91
0.92
0.92
0.90
Taka
lar
7305
1.00
0.97
0.97
0.98
1.00
0.97
0.99
1.00
0.91
0.95
0.98
0.97
0.98
0.98
0.97
0.96
Go
wa
7306
1.00
0.81
0.97
0.93
0.91
0.98
0.95
0.91
0.73
0.82
0.91
0.90
0.90
0.91
0.89
0.86
Sin
jai
7307
1.00
0.76
0.92
0.89
0.80
1.00
0.90
0.93
0.73
0.83
0.88
0.88
0.88
0.88
0.86
0.83
Mar
os
7308
0.97
0.82
0.90
0.90
1.00
0.98
0.99
0.79
0.77
0.78
0.89
0.89
0.89
0.90
0.85
0.84
Pan
gka
jene
Dan
Kep
.73
090.
950.
700.
860.
830.
950.
980.
971.
000.
930.
970.
890.
920.
910.
910.
870.
84
Bar
ru73
101.
000.
860.
990.
950.
900.
980.
941.
000.
840.
920.
940.
940.
940.
940.
940.
92
Bo
ne73
110.
960.
670.
900.
840.
830.
860.
850.
920.
720.
820.
840.
840.
840.
840.
830.
79
So
pp
eng
7312
1.00
0.94
0.99
0.98
1.00
1.00
1.00
0.94
0.93
0.93
0.97
0.97
0.97
0.97
0.96
0.96
Waj
o73
130.
980.
780.
950.
900.
960.
920.
940.
960.
950.
950.
920.
930.
930.
930.
920.
90
Sid
enre
ng R
app
ang
7314
0.99
0.87
0.99
0.95
1.00
1.00
1.00
1.00
0.95
0.97
0.96
0.97
0.97
0.97
0.96
0.95
Pin
rang
7315
0.97
0.88
0.95
0.93
1.00
0.99
0.99
1.00
0.93
0.96
0.95
0.96
0.96
0.96
0.94
0.93
Enr
ekan
g73
160.
990.
490.
870.
781.
000.
930.
960.
920.
960.
940.
850.
900.
880.
880.
830.
79
Luw
u73
170.
900.
670.
820.
800.
950.
990.
970.
900.
800.
850.
840.
870.
860.
860.
810.
78
Tana
To
raja
7318
0.83
0.58
0.80
0.74
0.84
0.85
0.85
0.89
0.73
0.81
0.77
0.80
0.79
0.79
0.76
0.73
Luw
u U
tara
7322
0.94
0.76
0.91
0.87
1.00
0.95
0.98
0.92
0.84
0.88
0.89
0.91
0.90
0.90
0.87
0.85
Luw
u T
imur
7325
1.00
0.78
0.95
0.91
1.00
0.99
1.00
1.00
0.83
0.91
0.93
0.94
0.94
0.94
0.91
0.88
Tora
ja U
tara
7326
0.85
0.55
0.79
0.73
0.91
0.86
0.89
0.91
0.83
0.87
0.79
0.83
0.81
0.81
0.78
0.74
Mak
assa
r73
711.
000.
980.
990.
991.
000.
930.
960.
970.
920.
950.
980.
970.
970.
970.
970.
97
Par
e-P
are
7372
1.00
1.00
1.00
1.00
1.00
1.00
1.00
1.00
0.92
0.96
0.99
0.99
0.99
0.99
0.98
0.98
Pal
op
o73
730.
990.
970.
990.
981.
000.
970.
990.
900.
890.
890.
970.
950.
960.
960.
950.
95
Sul
awes
i Ten
gg
ara
0.96
0.62
0.94
0.84
0.79
0.80
0.79
0.86
0.59
0.72
0.81
0.79
0.79
0.80
0.80
0.76
But
on
7401
0.99
0.46
0.95
0.80
0.97
0.86
0.91
0.94
0.55
0.74
0.81
0.82
0.82
0.82
0.78
0.71
Mun
a74
020.
960.
590.
900.
810.
590.
790.
690.
710.
590.
650.
760.
720.
730.
740.
750.
72
Ko
naw
e74
030.
930.
680.
920.
850.
800.
620.
710.
800.
620.
710.
790.
750.
770.
770.
800.
77
Ko
laka
7404
0.98
0.67
0.95
0.87
0.86
0.92
0.89
1.00
0.62
0.81
0.86
0.85
0.86
0.86
0.85
0.80
Ko
naw
e S
elat
an74
050.
960.
630.
950.
850.
820.
520.
670.
860.
670.
770.
790.
760.
770.
770.
820.
78
Bo
mb
ana
7406
0.85
0.21
0.83
0.63
0.81
0.70
0.76
0.81
0.49
0.65
0.66
0.68
0.67
0.67
0.65
0.57
Wak
ato
bi
7407
1.00
0.52
0.98
0.83
0.53
0.96
0.74
0.88
0.35
0.62
0.77
0.73
0.75
0.76
0.76
0.69
Ko
laka
Uta
ra74
080.
960.
330.
930.
740.
750.
920.
841.
000.
820.
910.
790.
830.
820.
820.
820.
74
But
on
Uta
ra74
090.
930.
000.
870.
600.
780.
690.
730.
780.
350.
570.
620.
630.
630.
640.
600.
49
Dis
tric
tB
PS
Co
de
Ph
ysic
al A
vaila
bili
tyH
ealt
h P
erso
nn
elB
uild
ing
Ch
arac
teri
stic
sC
om
po
site
Ind
ices
Pri
mar
yS
eco
nd
ary
Del
iver
yS
ub
Ind
exG
P P
usk
.M
idw
ife
Su
bIn
dex
Wat
er P
.E
lect
rici
tyS
ub
Ind
exA
cces
sE
qu
al D
.E
qu
al I.
PC
AO
LS
CI

73 |
Ko
naw
e U
tara
7410
0.89
0.43
0.89
0.74
1.00
0.46
0.73
0.83
0.60
0.72
0.73
0.73
0.73
0.73
0.74
0.68
Ken
dar
i74
711.
000.
991.
001.
001.
000.
980.
990.
930.
660.
790.
960.
930.
940.
940.
920.
91
Bau
-Bau
7472
1.00
1.00
1.00
1.00
0.69
0.97
0.83
0.81
0.60
0.71
0.91
0.85
0.87
0.88
0.89
0.89
Go
ront
alo
0.97
0.75
0.95
0.89
0.96
0.79
0.88
0.84
0.82
0.83
0.88
0.87
0.87
0.87
0.88
0.85
Bo
alem
o75
010.
990.
500.
940.
811.
000.
800.
900.
900.
790.
850.
830.
850.
850.
850.
830.
77
Go
ront
alo
7502
0.97
0.78
0.93
0.89
1.00
0.85
0.92
0.90
0.83
0.87
0.89
0.89
0.89
0.89
0.88
0.86
Po
huw
ato
7503
0.97
0.72
0.97
0.88
0.94
0.71
0.82
0.69
0.78
0.73
0.84
0.81
0.82
0.83
0.84
0.82
Bo
ne B
ola
ngo
7504
0.94
0.80
0.96
0.90
0.94
0.71
0.83
0.72
0.73
0.73
0.85
0.82
0.83
0.83
0.85
0.83
Go
ront
alo
Uta
ra75
050.
980.
560.
960.
830.
920.
510.
721.
000.
830.
920.
830.
820.
820.
820.
870.
82
Go
ront
alo
7571
1.00
1.00
1.00
1.00
1.00
0.95
0.98
1.00
0.97
0.99
0.99
0.99
0.99
0.99
0.99
0.99
Sul
awes
i Bar
at0.
920.
660.
870.
810.
890.
900.
900.
750.
750.
750.
820.
820.
820.
820.
790.
77
Maj
ene
7601
0.97
0.93
0.96
0.96
0.78
0.94
0.86
1.00
0.83
0.92
0.93
0.91
0.92
0.92
0.94
0.93
Po
lew
ali M
and
ar76
020.
910.
810.
870.
860.
950.
940.
950.
800.
800.
800.
870.
870.
870.
870.
830.
83
Mam
asa
7603
0.85
0.26
0.61
0.57
0.88
0.68
0.78
0.69
0.74
0.71
0.64
0.69
0.67
0.67
0.60
0.55
Mam
uju
7604
0.90
0.58
0.91
0.80
0.86
0.90
0.88
0.72
0.67
0.69
0.79
0.79
0.79
0.80
0.78
0.74
Mam
uju
Uta
ra76
050.
990.
510.
920.
811.
000.
930.
960.
640.
760.
700.
820.
820.
820.
830.
780.
74
Mal
uku
0.93
0.57
0.87
0.79
0.68
0.83
0.76
0.74
0.63
0.68
0.76
0.74
0.75
0.76
0.75
0.72
Mal
uku
Teng
gar
a B
arat
8101
0.94
0.59
0.82
0.78
0.45
0.70
0.58
0.91
0.43
0.67
0.72
0.68
0.69
0.70
0.72
0.67
Mal
uku
Teng
gar
a81
020.
960.
520.
860.
780.
690.
890.
790.
690.
440.
560.
740.
710.
720.
730.
700.
65
Mal
uku
Teng
ah81
030.
970.
590.
930.
830.
780.
930.
860.
720.
740.
730.
820.
810.
810.
820.
800.
77
Bur
u81
040.
940.
670.
880.
830.
890.
840.
871.
000.
850.
930.
860.
870.
870.
870.
860.
83
Kep
ulau
an A
ru81
050.
870.
460.
780.
700.
700.
590.
650.
450.
470.
460.
640.
600.
620.
630.
610.
58
Ser
am B
agia
n B
arat
8106
0.97
0.27
0.96
0.73
0.50
0.93
0.71
0.88
0.66
0.77
0.74
0.74
0.74
0.75
0.77
0.68
Ser
am B
agia
n T
imur
8107
0.83
0.14
0.66
0.54
0.36
0.51
0.43
0.64
0.57
0.61
0.53
0.53
0.53
0.54
0.56
0.49
Mal
uku
Bar
at D
aya
8108
0.68
0.04
0.50
0.40
0.78
0.58
0.68
0.67
0.35
0.51
0.48
0.53
0.51
0.51
0.42
0.35
Bur
u S
elat
an81
090.
660.
220.
530.
470.
750.
410.
580.
630.
400.
510.
500.
520.
510.
510.
470.
42
Am
bo
n81
711.
001.
001.
001.
000.
820.
970.
890.
910.
920.
920.
960.
940.
950.
950.
970.
97
Tual
8172
0.99
0.82
0.94
0.91
0.60
0.91
0.76
0.80
0.46
0.63
0.83
0.77
0.79
0.80
0.80
0.78
Dis
tric
tB
PS
Co
de
Ph
ysic
al A
vaila
bili
tyH
ealt
h P
erso
nn
elB
uild
ing
Ch
arac
teri
stic
sC
om
po
site
Ind
ices
Pri
mar
yS
eco
nd
ary
Del
iver
yS
ub
Ind
exG
P P
usk
.M
idw
ife
Su
bIn
dex
Wat
er P
.E
lect
rici
tyS
ub
Ind
exA
cces
sE
qu
al D
.E
qu
al I.
PC
AO
LS
CI

74 |
Mal
uku
Uta
ra0.
900.
550.
870.
770.
720.
680.
700.
870.
710.
790.
760.
750.
760.
760.
780.
74
Hal
mah
era
Bar
at82
010.
920.
580.
930.
811.
000.
700.
850.
900.
650.
770.
810.
810.
810.
810.
810.
76
Hal
mah
era
Teng
ah82
021.
000.
210.
780.
660.
880.
920.
901.
000.
790.
890.
760.
820.
800.
800.
730.
64
Kep
ulau
an S
ula
8203
0.81
0.32
0.69
0.60
0.62
0.53
0.57
0.77
0.60
0.68
0.61
0.62
0.62
0.62
0.62
0.57
Hal
mah
era
Sel
atan
8204
0.81
0.42
0.89
0.71
0.30
0.51
0.40
0.83
0.51
0.67
0.64
0.59
0.61
0.62
0.72
0.66
Hal
mah
era
Uta
ra82
050.
920.
730.
860.
841.
000.
680.
840.
820.
750.
790.
830.
820.
820.
820.
810.
79
Hal
mah
era
Tim
ur82
060.
880.
090.
810.
600.
860.
670.
771.
000.
750.
870.
690.
740.
720.
720.
710.
61
Pul
au M
oro
tai
8207
0.82
0.32
0.67
0.60
1.00
0.62
0.81
0.80
0.85
0.82
0.69
0.75
0.73
0.72
0.67
0.63
Tern
ate
8271
0.99
0.95
0.99
0.98
1.00
0.79
0.90
0.88
0.95
0.91
0.95
0.93
0.93
0.93
0.96
0.96
Tid
ore
Kep
ulau
an82
721.
000.
641.
000.
880.
710.
870.
790.
860.
940.
900.
870.
860.
860.
870.
900.
87
Pap
ua B
arat
0.91
0.62
0.85
0.79
0.56
0.69
0.62
0.77
0.69
0.73
0.75
0.72
0.73
0.73
0.77
0.74
Fak
fak
9101
0.95
0.73
0.87
0.85
0.89
0.79
0.84
0.89
0.62
0.75
0.83
0.81
0.82
0.82
0.80
0.77
Kai
man
a91
020.
810.
070.
630.
500.
570.
640.
600.
860.
790.
830.
590.
640.
620.
620.
610.
53
Telu
k W
ond
ama
9103
0.97
0.02
0.84
0.61
0.67
0.44
0.55
0.83
0.68
0.76
0.63
0.64
0.64
0.64
0.67
0.57
Telu
k B
intu
ni91
040.
900.
190.
790.
630.
610.
650.
630.
830.
650.
740.
650.
670.
660.
660.
670.
59
Man
okw
ari
9105
0.90
0.78
0.88
0.86
0.59
0.71
0.65
0.77
0.59
0.68
0.78
0.73
0.75
0.76
0.79
0.78
So
rong
Sel
atan
9106
0.84
0.46
0.80
0.70
0.27
0.35
0.31
0.55
0.46
0.50
0.58
0.50
0.53
0.54
0.63
0.59
So
rong
9107
0.92
0.67
0.85
0.81
0.35
0.75
0.55
0.76
0.73
0.75
0.75
0.70
0.72
0.73
0.78
0.76
Raj
a A
mp
at91
080.
830.
250.
660.
580.
500.
450.
480.
720.
790.
760.
600.
610.
600.
600.
640.
58
Tam
bra
uw91
090.
550.
000.
510.
350.
500.
280.
390.
750.
630.
690.
430.
480.
460.
450.
490.
41
May
bra
t91
100.
750.
080.
580.
470.
500.
210.
360.
500.
670.
580.
470.
470.
470.
470.
510.
45
So
rong
9171
1.00
0.99
0.99
0.99
1.00
0.91
0.96
1.00
0.97
0.99
0.98
0.98
0.98
0.98
0.99
0.98
Pap
ua0.
710.
400.
630.
580.
600.
540.
570.
680.
450.
570.
570.
570.
570.
570.
560.
53
Mer
auke
9401
0.98
0.68
0.80
0.82
0.75
0.97
0.86
0.88
0.54
0.71
0.81
0.80
0.80
0.80
0.74
0.71
Jaya
wija
ya94
020.
720.
440.
730.
631.
000.
430.
720.
830.
170.
500.
620.
620.
620.
610.
580.
52
Jaya
pur
a94
030.
930.
560.
900.
800.
700.
660.
680.
750.
860.
810.
780.
760.
770.
770.
810.
78
Nab
ire
9404
0.95
0.82
0.88
0.88
0.44
0.87
0.66
0.89
0.56
0.72
0.81
0.76
0.77
0.78
0.81
0.79
Kep
ulau
an Y
apen
9408
0.93
0.57
0.82
0.77
0.75
0.66
0.70
0.63
0.26
0.44
0.69
0.64
0.66
0.67
0.64
0.60
Bia
k N
umfo
r94
090.
920.
710.
870.
830.
590.
750.
670.
760.
820.
790.
790.
760.
770.
780.
820.
80
Pan
iai
9410
0.37
0.22
0.44
0.34
0.40
0.29
0.34
0.50
0.18
0.34
0.34
0.34
0.34
0.34
0.36
0.32
Pun
cak
Jaya
9411
0.29
0.14
0.27
0.23
0.38
0.23
0.30
0.38
0.20
0.29
0.26
0.28
0.27
0.27
0.25
0.23
Mim
ika
9412
0.91
0.85
0.89
0.88
0.54
0.77
0.65
0.92
0.53
0.73
0.81
0.75
0.77
0.78
0.81
0.79
Bo
ven
Dig
oel
9413
0.78
0.18
0.75
0.57
0.38
0.65
0.52
0.54
0.59
0.56
0.56
0.55
0.55
0.57
0.59
0.53
Map
pi
9414
0.59
0.29
0.47
0.45
0.60
0.34
0.47
1.00
0.65
0.83
0.53
0.58
0.56
0.55
0.56
0.51
Asm
at94
150.
460.
130.
330.
311.
000.
620.
810.
890.
710.
800.
510.
640.
590.
570.
470.
42
Dis
tric
tB
PS
Co
de
Ph
ysic
al A
vaila
bili
tyH
ealt
h P
erso
nn
elB
uild
ing
Ch
arac
teri
stic
sC
om
po
site
Ind
ices
Pri
mar
yS
eco
nd
ary
Del
iver
yS
ub
Ind
exG
P P
usk
.M
idw
ife
Su
bIn
dex
Wat
er P
.E
lect
rici
tyS
ub
Ind
exA
cces
sE
qu
al D
.E
qu
al I.
PC
AO
LS
CI
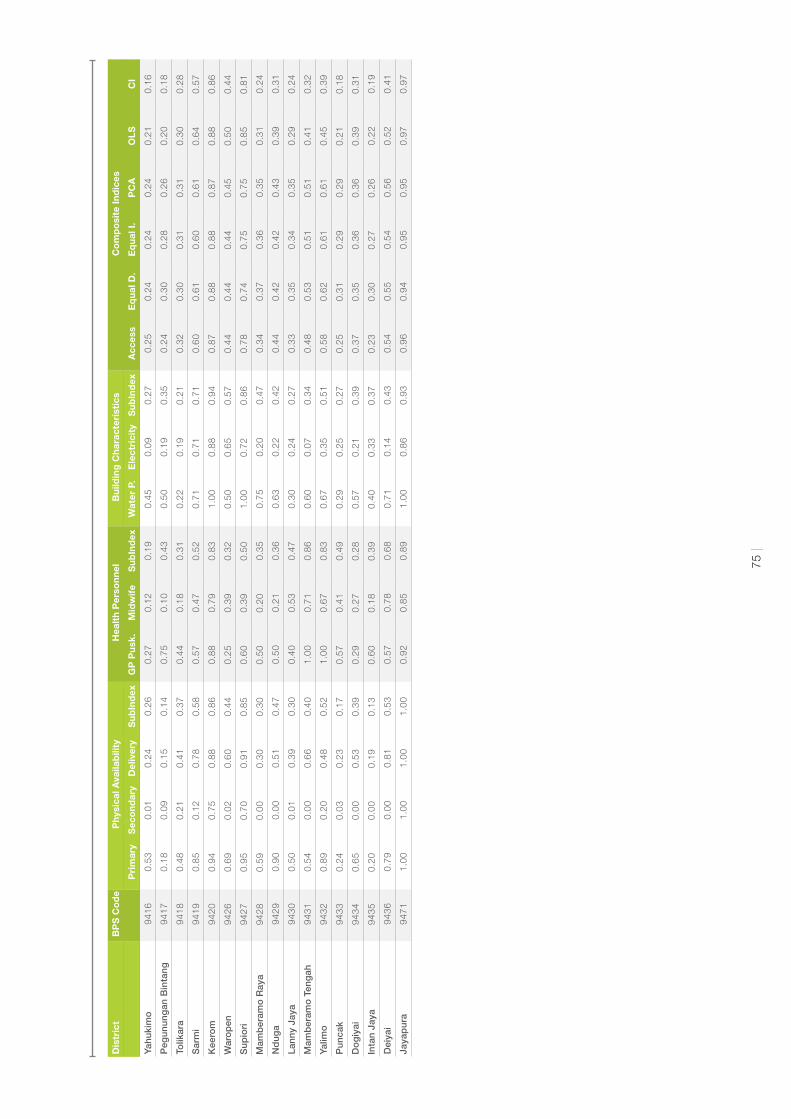
75 |
Yahu
kim
o94
160.
530.
010.
240.
260.
270.
120.
190.
450.
090.
270.
250.
240.
240.
240.
210.
16
Peg
unun
gan
Bin
tang
9417
0.18
0.09
0.15
0.14
0.75
0.10
0.43
0.50
0.19
0.35
0.24
0.30
0.28
0.26
0.20
0.18
Tolik
ara
9418
0.48
0.21
0.41
0.37
0.44
0.18
0.31
0.22
0.19
0.21
0.32
0.30
0.31
0.31
0.30
0.28
Sar
mi
9419
0.85
0.12
0.78
0.58
0.57
0.47
0.52
0.71
0.71
0.71
0.60
0.61
0.60
0.61
0.64
0.57
Kee
rom
9420
0.94
0.75
0.88
0.86
0.88
0.79
0.83
1.00
0.88
0.94
0.87
0.88
0.88
0.87
0.88
0.86
War
op
en94
260.
690.
020.
600.
440.
250.
390.
320.
500.
650.
570.
440.
440.
440.
450.
500.
44
Sup
iori
9427
0.95
0.70
0.91
0.85
0.60
0.39
0.50
1.00
0.72
0.86
0.78
0.74
0.75
0.75
0.85
0.81
Mam
ber
amo
Ray
a94
280.
590.
000.
300.
300.
500.
200.
350.
750.
200.
470.
340.
370.
360.
350.
310.
24
Nd
uga
9429
0.90
0.00
0.51
0.47
0.50
0.21
0.36
0.63
0.22
0.42
0.44
0.42
0.42
0.43
0.39
0.31
Lann
y Ja
ya94
300.
500.
010.
390.
300.
400.
530.
470.
300.
240.
270.
330.
350.
340.
350.
290.
24
Mam
ber
amo
Ten
gah
9431
0.54
0.00
0.66
0.40
1.00
0.71
0.86
0.60
0.07
0.34
0.48
0.53
0.51
0.51
0.41
0.32
Yalim
o94
320.
890.
200.
480.
521.
000.
670.
830.
670.
350.
510.
580.
620.
610.
610.
450.
39
Pun
cak
9433
0.24
0.03
0.23
0.17
0.57
0.41
0.49
0.29
0.25
0.27
0.25
0.31
0.29
0.29
0.21
0.18
Do
giy
ai94
340.
650.
000.
530.
390.
290.
270.
280.
570.
210.
390.
370.
350.
360.
360.
390.
31
Inta
n Ja
ya94
350.
200.
000.
190.
130.
600.
180.
390.
400.
330.
370.
230.
300.
270.
260.
220.
19
Dei
yai
9436
0.79
0.00
0.81
0.53
0.57
0.78
0.68
0.71
0.14
0.43
0.54
0.55
0.54
0.56
0.52
0.41
Jaya
pur
a94
711.
001.
001.
001.
000.
920.
850.
891.
000.
860.
930.
960.
940.
950.
950.
970.
97
Dis
tric
tB
PS
Co
de
Ph
ysic
al A
vaila
bili
tyH
ealt
h P
erso
nn
elB
uild
ing
Ch
arac
teri
stic
sC
om
po
site
Ind
ices
Pri
mar
yS
eco
nd
ary
Del
iver
yS
ub
Ind
exG
P P
usk
.M
idw
ife
Su
bIn
dex
Wat
er P
.E
lect
rici
tyS
ub
Ind
exA
cces
sE
qu
al D
.E
qu
al I.
PC
AO
LS
CI
Kementerian Koordinator Kesejahteraan Rakyat
Jl. Medan Merdeka Barat No. 3
Jakarta Pusat 10110 Indonesia
Phone (62-21) 3459077
Fax (62-21) 3459077
PNPM Support Facility
Jl. Diponegoro No. 72 Menteng
Jakarta Pusat 10310 Indonesia
Phone (62-21) 3148175
Fax (62-21) 3190209
Related Documents