Page INDONESIA THE RISE OF METROPOLITAN REGIONS: TOWARDS INCLUSIVE AND SUSTAINABLE REGIONAL DEVELOPMENT Public Disclosure Authorized Public Disclosure Authorized Public Disclosure Authorized Public Disclosure Authorized Public Disclosure Authorized Public Disclosure Authorized Public Disclosure Authorized Public Disclosure Authorized

Welcome message from author
This document is posted to help you gain knowledge. Please leave a comment to let me know what you think about it! Share it to your friends and learn new things together.
Transcript
Page
INDONESIA
THE RISE OF METROPOLITAN REGIONS:
TOWARDS INCLUSIVE AND SUSTAINABLE REGIONAL DEVELOPMENT
Pub
lic D
iscl
osur
e A
utho
rized
Pub
lic D
iscl
osur
e A
utho
rized
Pub
lic D
iscl
osur
e A
utho
rized
Pub
lic D
iscl
osur
e A
utho
rized
Pub
lic D
iscl
osur
e A
utho
rized
Pub
lic D
iscl
osur
e A
utho
rized
Pub
lic D
iscl
osur
e A
utho
rized
Pub
lic D
iscl
osur
e A
utho
rized
wb406484
Typewritten Text
71740
wb406484
Typewritten Text
i
PREFACE In recent years, Indonesia has made great strides in economic growth and development. This growth has
been accompanied by rapid urbanization that has transformed Indonesian cities. Urbanization has the
potential to boost national economic growth by facilitating the emergence of agglomeration and
localization economies. Increasing urbanization presents Indonesia with an opportunity to leverage the
transformation taking place to ensure that it is harnessed for economic growth and, more importantly,
sustained improvements in the quality of life of its community members.
To ensure that urbanization and demographic growth generate optimal levels of economic growth, the
Government of Indonesia (GOI) needs to foster the development of agglomeration and localization
economies. In turn, these economies can drive increases in the economic productivity of cities and
metropolitan regions. At the national level, Indonesia needs an overall national urban development
strategy for guiding local activities and for fostering effective sub-national government coordination of
development plans and activities.
Unfortunately, research shows that over the last four decades, Indonesia has not derived optimal returns on
urban development, as can be seen by comparisons with the level of benefit derived by other Asian
countries passing through similar processes of urbanization. Urbanization in Indonesia is driving the
emergence of metropolitan areas whose boundaries stretch beyond the jurisdiction of administratively
defined cities, creating an urgent need for mechanisms that optimize and coordinate development beyond
the formal city unit.
The spatial structure of urban growth and development will critically shape the rate and quality of
economic growth over the next 15 years. This structure wil determine the quality of life for urban dwellers
and define the level of competitiveness of Indonesia‘s cities. To foster productive economic clusters of
economic activity, the GOI needs to encourage efficient urban spatial structures; appropriate and timely
investments in critical large-scale infrastructure in cities; the provision of spatially comprehensive basic
services; effective urban management; strengthening of institutional capacity; and proactive horizontal and
vertical coordination of local government actions.
The purpose of this report on Indonesia‘s regional and urban development is to provide a comprehensive
assessment of the country‘s spatial patterns of urbanization and economic development and to evaluate
the extent to which Indonesia‘s urbanization has fostered increases in agglomeration economies and
economic productivity growth. The study provides the analytical work to evaluate such performance and to
identify key issues, constraints and opportunities for promoting faster and more inclusive growth. The
overarching goal of the study is to provide a timely and rigorous analysis of regional and urban
development in order to foster informed policy discussion at the central, provincial and local government
levels.
Page ii
ACKNOWLEDGEMENTS This study on Indonesia‘s regional and urban economic development was funded by AusAID, the Swiss
Economic Development Cooperation, and the World Bank. The team conducted a series of in-depth case
studies of Indonesia‘s national urban planning laws, case studies on transportation and inter-city
connectivity, access to local water and sanitation services, local roads, and metro-level case studies of
Jakarta, Makassar, Medan and Surabaya. This report was prepared by a team led by Peter Ellis and
included David Dowall, Jennifer Day, Thalyta E. Yuwono, Blane Lewis, Arish Dastur, Renata Simatupang,
Arlan Rahman, Rumayya Batubara, Harun al-Rasyid Lubis, Edy Priyono, Arief Ramadhian, Wilmar Salim,
Rulli Setiawan, the Urban and Regional Development Institute.
The report benefited from guidance from Franz Drees-Gross and Sonia Hammam. Valuable inputs were
received from Lili Liu, Yan F. Zhang, Enrique Blanco-Armas, and Taimur Samad. A larger group from within
the World Bank, including Somik Lall, Nancy Lozano Gracia and Hyoung Gun Wang from the Urban
Anchor, contributed to the report, for which contribution the team expresses its gratitude. Victor Vergara
provided the team with valuable inputs and coordinated the team‘s work with the World Bank‘s ECO2
initiative. Jemima Sy provided input and data related to basic service accessibility. Ahya Ihsan, Cut Dian
Agustina, and Sukmawah Yuningsih provided additional data and information for the report.
The team would especially like to express its gratitude to the team from the Government of Indonesia that
provided valuable insights, close involvement, and support for the report, included Max Pohan (Deputy of
Regional and Local Autonomy, Bappenas), Hayu Parasati (Bappenas), Velix Vernando Wanggai
(Presidential Special Staff on Local Autonomy and Regional Development), Bambang Susantono (Vice
Minister for Ministry of Transportation), Fauzi Bowo (Governor of DKI Jakarta), Sarwo Handayani (Head
of Bappeda DKI Jakarta), Tri Rismaharini (Mayor of Surabaya), Rahudman Harahap (Mayor of Medan)
and Ilham Arief Sirajuddin (Mayor of Makassar).
Disclaimer: The views expressed in this report are those of the authors and do not constitute official policy
positions of either the World Bank, the Government of Indonesia, or any government institution.
Page iii
TABLE OF CONTENTS Preface i
Acknowledgements ii
Executive Summary ix
Chapter 1 Overview and Methodology 1
Chapter 2 Urbanization and Metropolitan Growth 5
Regional Development Policy: People vs. Place Prosperity 5
Urbanization pattern and trajectory 9
Urbanization trends in Indonesia‘s seven island regions 11
Poverty in urban areas 12
Agglomeration Index and metropolitan regions 13
Infrastructure investment‘s role 15
Factor markets 15
Functionally defined metropolitan regions 16
Evolving spatial structure of metropolitan regions 18
The shifting hierarchy of Indonesia‘s urban system 23
Future trends in urbanization 2010-2050 24
Conclusion 25
Policy recommendations 26
Chapter 3 Leveraging Urbanization and Agglomeration 27
Urbanization and economic development go hand in hand 27
Indonesia has not fully leveraged the economic benefits of rapid urbanization 29
Seven island regions‘ patterns of GRDP and per capita GRDP trends 33
Per capita trends across islands 34
Trends in gross GRDP and per capita GRDP for urban and rural areas 35
GRDP trends in metropolitan regions 37
A closer look at Indonesia‘s top 10 agglomeration areas in terms of GRDP growth and levels and growth of per capita GRDP 38
Central city cores of metropolitan regions drive GRDP 39
Linking urbanization and regional economic development 42
Conclusion 43
Policy recommendations 44
Chapter 4 Economic Performance of Metropolitan Regions 45
What constrains agglomeration economies in Indonesia metropolitan areas? 45
Spatial structure and the location of economic activities 45
Access to markets and shipping hubs 47
Page iv
Higher value added production boosts economic productivity 48
A multivariate assessment of what is driving agglomeration economies 50
Economic performance and agglomeration economies 54
Infrastructure and connectivity matter 59
Integrating the story 61
Conclusion 61
Policy recommendations 62
Chapter 5 Infrastructure Investments and Urban Development 63
Local government capital spending 63
Local government capital spending and economic growth 64
Insufficient infrastructure as a constraint to economic productivity 66
Conclusion 68
Policy recommendations 69
Chapter 6 Spatial Drivers of Metropolitan Development 70
Urbanization and sprawl 70
Does inappropriate spatial planning undermine economic productivity? 72
Metropolitan coordination 74
Indonesia‘s complex land and property rights system 75
Large-scale industrial, residential and commercial districts 78
Conclusion 80
Policy recommendations 81
Chapter 7 Conclusion 82
Central government actions 82
Policy actions for large metropolitan regions 83
Policy initiatives for smaller metropolitan areas 84
References
Annex 1 Agglomeration Index and Metropolitan Regions 86
Annex 2 Gravity Indices 93
Annex 3 PRODY and EXPY 96
Annex 4 Capital Spending, Urbanization, and Demographic Change 102
Annex 5 Development trends in Jakarta, Makassar, Medan and Surabaya 105
Jakarta Metropolitan Region (Jabodetabek) 105
Makassar Metropolitan Region (Mamminasata) 110
Medan Metropolitan Region (Mebidang) 116
Surabaya Metropolitan Region (Gerbangkertosusila) 121
Comparison of the economic geography of the four metropolitan regions 125
Page v
LIST OF TABLES Table 2. 1 Economic corridors in the Master Plan for Acceleration and Expansion of Indonesia‘s Economic Development (MP3EI) 7
Table 2. 2 Urban and rural population, Indonesia 1971-2010 10
Table 2. 3 Total population of Indonesia‘s seven island regions, 1993-2007 12
Table 2. 4 Indonesian agglomerations, population 1996-2007 17
Table 2. 5 Total population in metropolitan, urban and rural areas, 1996-2007 19
Table 2. 6 Population trends by urban core and suburban ring in 21 multi districts metros, 1996-2007 19
Table 2. 7 Land use patterns in the four metropolitan areas, 2000-2005 21
Table 2. 8 Population density per square kilometer in the four metropolitan areas, 2000-2005 22
Table 2. 9 Relationship between the size of urban metropolitan areas, small kota and population growth 23
Table 2. 10 Number of metropolitan areas in each size category by year 24
Table 2. 11 United Nation‘s population projections of Indonesia‘s 11 largest cities, 2010-2025 25
Table 3. 1 CAGR by 7 island regions by cyclical period 34
Table 3. 2 Trends in per capita Real GRDP 34
Table 3. 3 Per capita GRDP CAGR by 7-island regions by cyclical period 35
Table 3. 4 GRDP urban and rural CAGR by cyclical period 36
Table 3. 5 Real GRDP Makassar, Medan, JMR and Surabaya 37
Table 3. 6 Real GRDP per capita Makassar, Medan, JMR and Surabaya 37
Table 3. 7 Real GRDP growth by 10 agglomeration, other urban and national 39
Table 3. 8 Real GRDP by metropolitan core and suburbs, 1993-2007 40
Table 4. 1 OLS regressions modeling for real per capita GRDP growth (IDR) 51
Table 4. 2 Metropolitan agglomeration by population size (2007) 55
Table 5. 1 Determinants of economic growth by district 65
Table 5. 2 Access to water, sanitation, electricity and road, 2008 67
Table 6. 1 Relationship between economic density and productivity 71
Table 6. 2 Comparison between public and private sector land acquisition 77
Table 6. 3 Industrial estates in Jakarta Metropolitan Region 80
Table A1. 1 List of Metropolitan Areas based on Government Regulations No. 26 2008, Attachment 2 87
Table A1. 2 Metropolitan agglomerations by size 91
Table A1. 3 Metropolitan agglomeration by population size (2007) 92
Table A2. 1 Assumed travel speeds for Accessibility Index computation 94
Table A3. 1 Manufacturing sub-sectors in Indonesia, by PRODY Rank 100
Table A5. 1 Population size and density of city/district in Jabodetabek 106
Table A5. 2 Composition of GRDP by sector in Jabodetabek, 1993 and 2008 by percent 108
Table A5. 3 Built-up area of city/district in Jabodetabek, 1992 and 2005 109
Page vi
Table A5. 4 Population size and density of city/district in Mamminasata 111
Table A5. 5 Composition of real GRDP by sector in Mamminasata, 1993 and 2008 113
Table A5. 6 Land use of Mamminasata in 2003 (Km2) 115
Table A5. 7 Population size and density of city/district in Mebidang 117
Table A5. 8 Composition of real GRDP by sector in Mebidang, 1993 and 2008 (percent) 119
Table A5. 9 Built-up area of city/district in Mebidang, 2000 and 2005 120
Table A5. 10 Population of Surabaya metropolitan region by district, 1990-2010 122
Table A5. 11 Population density by district in GKS, 1990 – 2010 122
Table A5. 12 Real GRDP by sector in GKS 2008 123
Table A5. 13 Built-up area of city/district in Surabaya metropolitan region, 2000 and 2005 124
Table A5. 14 Population in four metropolitan regions, 1993-2007 125
Page vii
LIST OF FIGURES AND BOX
Figure 1 Economic density is dominant in Java xi
Figure 2. 1 Compound annual growth urbanization rate 1970-2010 9
Figure 2. 2 Urban and rural population, 1970-2010 10
Figure 2. 4 Poverty ratio versus GRDP per capita for districts in metropolitan agglomerations, 2007 13
Figure 2. 5 Population in agglomeration region, 2007 18
Figure 2. 6 Java – Bali – Lombok Metropolitan Regions using the Agglomeration Index 18
Figure 2. 7 Distribution of population, core city versus suburban ring, 21 multi-district metros, 1996-2007 20
Figure 2. 8 Population change by central core and suburban ring, 21 multi district metros, 1996-2007 21
Figure 2. 9 Urban and rural population projections for Indonesia, 2010-2050 24
Figure 3. 1 Urbanization and per capita GDP across countries, 2005 28
Figure 3. 2 Indonesia urbanization and real GDP per capita, 1960-2007 29
Figure 3. 3 Urban share of population and GDP, 1993-2007 30
Figure 3. 4 Comparison of GDP and urban population growth 1970-2007, indexed 1970 = 100 31
Figure 3. 5 Compound annual rate of GDP change by sector 1985-2007 32
Figure 3. 6 Real GRDP non oil and gas 1993 - 2007 33
Figure 3. 7 Real GRDP non oil and gas urban and rural districts 36
Figure 3. 8 Per capita real GRDP by size of agglomeration area 38
Figure 4. 1 Total of GRDP generated in urban core and peripheral districts, for metropolitan regions with peripheral districts 46
Figure 4. 2 Strong periphery boost overall Metro area growth 47
Figure 4. 3 Per capita GRDP growth with better accessibility to population centers 48
Figure 4. 4 Textile firm growth improves when textile firms are clustered 48
Figure 4. 5 GRDP per capita versus EXPY, 2007 50
Figure 4. 6 GRDP growth versus initial EXPY, 2001-2007 50
Figure 4. 7 Time and cost to start a business 54
Figure 4. 8 Size categories classified by agglomeration type, 1993 - 2007 56
Figure 4. 9 Growth in GRDP per capita in core versus non-core districts of metropolitan regions, 2001-2007 58
Figure 4. 10 Average GRDP per capita in core versus non-core districts of metropolitan regions, 2007 58
Figure 4. 11 Average population densities in metropolitan agglomerations 59
Figure 4. 12 Percent of manufacturing energy that is self-generated by manufacturing firms, by urban size 60
Figure 4. 13 EXPY values for different metropolitan size classifications 60
Figure 5. 1 Size distribution of local government capital spending, 2001 – 2008 64
Page viii
Figure 5. 2 Local government capital spending declines with urban population size, 2007 66
Figure 6. 1 Relationship between economic density in 8 metro areas and productivity, 2005 72
Figure 6. 2 Location of large-scale housing estates in the JMR 79
Figure A1. 1 Agglomeration formation in island regions 88
Figure A3. 1 Indonesian subnational EXPY values for 1993 through 2006 98
Figure A3. 2 Indonesian subnational EXPY values for 2001 and 2006 99
Figure A3. 3 EXPY values for all reporting countries, 2001 99
Figure A5. 1 Map of Jakarta Metropolitan Region 106
Figure A5. 2 Urbanization trends in the JMR between 1983 and 2005 110
Figure A5. 3 Makassar Metropolitan Region and population density in 2003 112
Figure A5. 4 Land coverage map of Makassar Metropolitan Region in 2003 114
Figure A5. 5 Photos of peripheral development in Makassar 116
Figure A5. 6 Map of Medan Metropolitan Region 118
Figure A5. 7 Photos of peripheral development in Medan Metropolitan Region 120
Figure A5. 8 Surabaya Metropolitan Region 121
Figure A5. 9 Location of industrial estates in Surabaya Metropolitan Region 125
Page ix
EXECUTIVE SUMMARY
THE RISE OF METROPOLITAN REGIONS: TOWARDS INCLUSIVE AND
SUSTAINABLE REGIONAL DEVELOPMENT
Indonesia has urbanized rapidly and will continue to do so into the mid-term future. By 2025,
approximately 67.5 percent of Indonesia‘s population will live in urban areas. Urbanization is occurring
across the country at varying rates, although at a faster rate in some island regions outside Java-Bali. This
suggests that in the future, urbanization related challenges that have affected Jakarta and Java-Bali will
similarly affect these other regions.
Urbanization creates significant opportunities for Indonesia, with urbanization’s potential to boost
regional economic growth and create vibrant cities and metropolitan areas. Urbanization and the
agglomeration economies that it can generate should be an important element in Indonesia‘s development
as a middle income country. If managed properly, urbanization can generate the productivity gains,
economic opportunities and rising incomes needed to support the increasingly large proportion of
Indonesia‘s middle income earners.
Indonesia has the potential to substantially increase its economic returns from urbanization. Research
in the period over the last 30 years confirms that most countries in the East Asia region experienced growth
in economic output as they become increasingly urbanized. Consider that in the period from 1970 to 2006,
every 1 percent increase in urban population correlated with an average 6 percent increase in per capita
GDP for India and China; an 8 percent increase in per capita GDP for Vietnam; and a 10 percent
increase in per capita GDP for Thailand. However in some Asian countries, including the Philippines and
Indonesia, similar rates of increase in urbanization relate to less than 2 percent increase of per capita
GDP. It is important to consider that each country‘s patterns of urbanization and economic growth have
been unique and contingent on a wide range of variables. In the case of Indonesia, unique challenges
relate, amongst other matters, to the difficulty of connecting growth centers in an archipelagic country,
together with fundamental challenges in spatial planning, metropolitan management and the functioning of
land markets, connective and strategic infrastructure, all of which are underpinned by persistent
institutional challenges. However, similar issues are being addressed successfully in other middle income
countries. Similarly, Indonesia is at a stage of urbanization where it too can take action.
Larger cities in general are more economically productive and competitive than smaller cities and rural
areas because of positive externalities known as agglomeration. There are broadly two types of
agglomeration economies: urbanization economies and localization economies. Large cities create
opportunities for the establishment of localization economies through the clustering of related activities,
while urbanization economies may emerge in dense urban areas where the transaction cost of doing
business are lower and opportunities for knowledge spillover is high. With the benefits of agglomeration,
Page x
businesses within such economies tend to be more economically productive, as demonstrated by a faster
rate of growth in GRDP than in smaller cities and rural areas.
Using the Agglomeration Index method, this study identifies 44 agglomeration areas in Indonesia. The
majority of these agglomeration areas are located in Java, Bali and Sumatra, in which islands most of the
urban population now resides. In other islands, the study identifies only a limited numbers of agglomeration
areas. There is only one agglomeration (Jayapura) on the vast island of Papua and also only one in the
Maluku archipelago, while Kalimantan and Sulawesi have five and six agglomeration areas, respectively.
In terms of size of population, Indonesia has two megacities with populations of more than 10 million
population (Jakarta and Surabaya), four metropolitan areas with populations in the range of 5 – 10
million, 13 metropolitans with populations in the range of 1 – 5 million and eight medium-sized
metropolitan areas with populations in the range of 0.5 – 1 million.
Medium-sized metropolitan areas (those with populations in the range of 0.5 – 1 million) have
performed better than cities in any other size class in terms of generating benefits from agglomeration
economies. Over the last 20 years, the medium-sized cities have seen the strongest per capita growth in
GRDP. This has been accompanied by strong to moderate population growth. The megacities (Jakarta and
Surabaya) have performed well, despite a continuing influx of newcomers and serious infrastructure
challenges. However, their economies grew at lower rates than those of the medium-sized cities relative to
their rates of growth in population. Among cities of all size categories, the small cities have performed
least well, experiencing declines in population and per capita GRDPs. Analysis of trends in land,
population, infrastructure, investment climate, and economic sector data indicate that the medium-sized
cities have been able to leverage urbanization for economic growth.
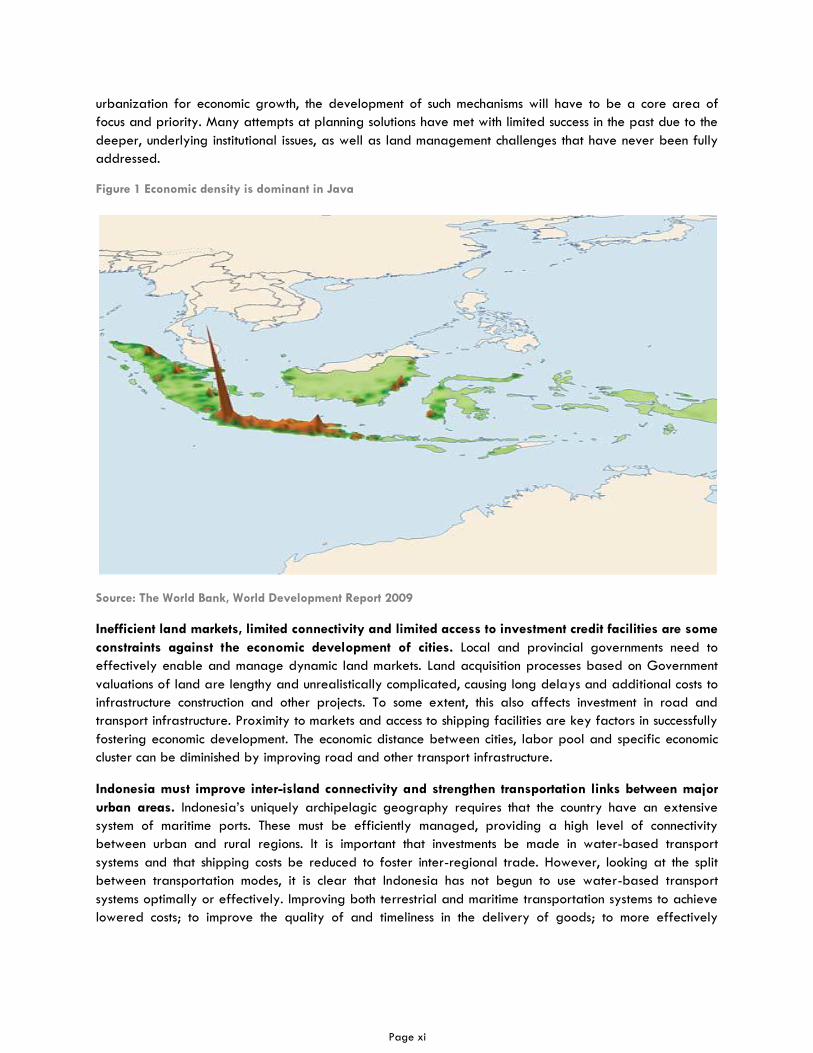
The Jakarta Metropolitan Region (JMR) in particular, and the Java-Bali regions in general, will
continue to play an important role in economic development. Figure 1 shows the high demographic and
economic concentration across Java and on Bali, especially in the country‘s two largest metropolitan
regions, Jakarta and Surabaya. Despite the relatively high levels of productivity Jakarta and Surabaya,
these metro areas urgently need to improve their economic efficiency and to develop facilities to ensure
the quality of life of their residents. Their economies face a number of constraints, including congestion,
poor spatial planning at the regional level, poorly functioning land markets, inadequate transportation
systems, a massive infrastructure backlog, pollution.
The core cities lead in economic output; however the urban periphery should also play an important
role as a driver of growth and agglomeration. Research shows that cities that rely to a greater degree
on their peripheries for the location of productive facilities generate higher rates of GRDP per capita and
a faster rate of economic growth. This fact points to three phenomena:
a) Many metro regions are gradually de-concentrating their centers as they grow into their
peripheries;
b) Periphery areas need to be prepared to receive industry; and
c) This expansion spans across multiple jurisdictions, often with conflicting interests.
These phenomena call urgent attention to the need for mechanisms that optimize and coordinate
development at a scale more complex and much larger than a city: rather, these mechanisms must operate
at the scale of metropolitan areas that may include one or more cities. If Indonesia is to leverage
Page xi
urbanization for economic growth, the development of such mechanisms will have to be a core area of
focus and priority. Many attempts at planning solutions have met with limited success in the past due to the
deeper, underlying institutional issues, as well as land management challenges that have never been fully
addressed.
Figure 1 Economic density is dominant in Java
Source: The World Bank, World Development Report 2009
Inefficient land markets, limited connectivity and limited access to investment credit facilities are some
constraints against the economic development of cities. Local and provincial governments need to
effectively enable and manage dynamic land markets. Land acquisition processes based on Government
valuations of land are lengthy and unrealistically complicated, causing long delays and additional costs to
infrastructure construction and other projects. To some extent, this also affects investment in road and
transport infrastructure. Proximity to markets and access to shipping facilities are key factors in successfully
fostering economic development. The economic distance between cities, labor pool and specific economic
cluster can be diminished by improving road and other transport infrastructure.
Indonesia must improve inter-island connectivity and strengthen transportation links between major
urban areas. Indonesia‘s uniquely archipelagic geography requires that the country have an extensive
system of maritime ports. These must be efficiently managed, providing a high level of connectivity
between urban and rural regions. It is important that investments be made in water-based transport
systems and that shipping costs be reduced to foster inter-regional trade. However, looking at the split
between transportation modes, it is clear that Indonesia has not begun to use water-based transport
systems optimally or effectively. Improving both terrestrial and maritime transportation systems to achieve
lowered costs; to improve the quality of and timeliness in the delivery of goods; to more effectively
Page xii
facilitate people movement will generate manifold benefits related to the increased economic integration
between regions and the opportunities to develop supply chains between small, medium and large cities.
Indonesia’s surface transportation network is inadequate. Highway construction and maintenance has
not kept pace with the country‘s need to develop strong linkages between regions. In the case of Java and
Sumatra, the GOI should consider the construction and further development of trans-Java and trans-
Sumatra highways to increase the efficiency of surface transportation. On Java, a trans-Java corridor
would create strong linkages between Jakarta and Surabaya, as well as with and between the secondary
cities, such as Bandung, Semarang and Yogyakarta.
Capital expenditure on infrastructure is insufficient in the metropolitan areas. Local governments in
rapidly urbanizing areas need to increase both the level and effectiveness of their capital expenditures.
Otherwise, they risk facing severe constraints to economic growth in the future. Capital expenditure on
infrastructure by local governments has a significant and positive influence on district economic growth. At
present, local governments that are relatively more urbanized and/or that have relatively larger urban
populations spend less on capital projects than other local governments. Capital expenditure needs to be
increased in more urbanized local districts.
The Master Plan for Acceleration and Expansion of Indonesia’s Economic Development (MP3EI) was
formulated on the assumption that each region needs to be treated differently in terms of policy and
investment. For example, in Java, the plan promotes improvements to intra-island connectivity through
improved road networks and other strategies intended to support greater development of higher valued
manufacturing. In Sumatra, the plan supports the development of the natural resource economy and
processing capacities for natural resources. In Sulawesi, the plan supports improvements to maritime
connectivity, with the primary focus of economic development being on agribusiness and fisheries.
In summary, Indonesia needs to leverage the positive impacts from its rapid pace of urbanization to a
far greater degree than it has so far. Indonesia has come to a significant turning point: the manner in which
the country urbanizes over the next 15 to 20 years is of crucial long term significance to the country‘s
socio-economic development. Urbanization is a path dependant process. Once a city is built, the
constructed area of the city, together with the institutional relations that develop and define the systems of
management of the city, become increasingly locked-in. In such situations the most important task is to
ensure that initial conditions are correct and implemented in the right sequence, as these conditions will
either powerfully enable or constrain the future growth of that city and its economy. This underscores the
need to take the necessary and appropriate action before the opportunity passes.
PROPOSED POLICY ACTIONS
The GOI needs a multi-faceted strategy for managing urbanization to further leverage regional
growth. Indonesia‘s urban development strategy needs to focus on two main points: (i) ensuring greater
consistency between spatial planning and investment priorities between the different tiers of government
(national, provincial and local); and (ii) the stratification of local governments according to size
characteristics (two largest metropolitan regions; second tier metropolitan areas, rapidly agglomerating
medium-sized cities, and small cities).
The GOI needs to link urbanization trends with the Economic Transformation Master Plan (MP3EI).
Agglomerations are areas of economic activity that the Government can support to boost regional growth.
Supporting such agglomerations would be much more effective and less risky than endeavors to create
Page xiii
new growth poles. The Master Plan for Regional Development has already identified many existing growth
centers and should focus on encouraging local economic initiatives to support these centers.
The GOI needs to improve consistency between spatial plans and investments. Spatial planning must
be coordinated between different levels of government and between districts into which metropolitan
areas fall, so that plans and investment priorities are more closely aligned with investment priorities.
Investment plans for large-scale infrastructure also need to be developed, with these plans needing to take
into account impacts on urban land markets. A higher level of investment is needed in critical infrastructure
(electrical power, transit, surface and maritime transportation networks and basic services). For example,
industrial and business and consumer services districts need to be developed and provided with better
transportation facilities to ensure accessibility to residential zones.
Investment must be increased in Indonesia’s two largest cities, Jakarta and Surabaya. In this report,
cities are defined on the basis of the Agglomeration Index. The Jakarta and Surabaya metropolitan
regions need to promote agglomeration economies. Priorities must include institutional reforms and
investments to improve spatial structure through metropolitan level planning that spans multiple jurisdictions;
support better functioning land markets; improve resilience to natural disasters, such as flooding; and
enhance the quality of life through greater environmental sustainability. Industrial policies to attract a
greater proportion of higher value added activities are needed. To ensure the availability of the human
resources required to these activities, higher quality educational and training institutions are also required.
Major attention needs to be focused on the second tier of metropolitan cities, which are currently
stagnating. Some of Indonesia‘s major second tier cities, including Bandung, Yogyakarta, Cirebon and
Semarang, have not experienced increases in real per capita GRDP over the last 15 years. In the period
from 1993 to 2007, productivity in the cities declined by an average of 10 percent, which is equal to 0.7
percent Compound Annual Growth Rate (CAGR). Central, provincial and district governments need to
upgrade and expand physical and social infrastructure and urban services; to improve the spatial
efficiency (higher densities, industrial and business services centers); to ensure that urban land markets
function more efficiently; and to implement measures to achieve better intra-metropolitan connectivity and
better coordination in the development of metropolitan regions. Importantly, these large metropolitan
areas need to be better linked with larger city regions. Institutional reforms are also needed to improve
the business climate and to reduce the costs of doing business in Indonesia.
The GOI should promote growth in rapidly agglomerating metropolitan and medium-sized cities. In
general, these cities have adequate infrastructure and do not suffer from poor spatial structure. However,
they need higher quality and more expensive infrastructure, particularly infrastructure that supports
connectivity with major centers and ports. As these cities continue to agglomerate, they should maintain
their capital investment programs. Maintaining sound spatial planning and land management can help
these cities enhance productivity, while investment in regional transportation facilities can provide an
additional boost for these cities.
Within small cities the focus should be on the delivery of basic services. These small urban areas have
inadequate infrastructure, inadequate supply of skilled labor and low level of access to markets in major
metropolitan regions, impeding their ability to compete. Rural and lagging regions need to be better
connected to large and medium-sized metropolitan centers. The small cities also need to invest more
heavily in basic infrastructure and to ensure more effective inter-governmental coordination and
management. These cities need to improve their level of access to larger and more prosperous regions; to
improve land market performance; and to create a more positive business climate.

Page xiv
Urbanization presents an opportunity for Indonesia. Urban areas are major contributors to and key
drivers of growth in non-oil GDP. Linking the patterns of urban development to the MP3EI presents on
opportunity to focus on ensuring that existing growth centers perform even better and play an even more
significant role. This is much more likely to be successful than endeavors to establish new growth poles,
which is a very risky and potentially very expensive strategy. Differentiating policy approaches on the
basis of variations in city size will also help the GOI to ensure that its support to different cities is
appropriate to their needs.
Page 1
CHAPTER 1
OVERVIEW AND METHODOLOGY
The objective of this report is to analyze Indonesia‘s regional and urban economic development. The report
will analyze the role of urbanization in shaping agglomeration economies, along with the determinants of
competitiveness in affecting the development of urban (metropolitan) areas, particularly large urban
areas. The report is part of an ongoing engagement and partnership between the World Bank and the
Government of Indonesia (GOI), represented primarily by Bappenas (THE NATIONAL DEVELOPMENT PLANNING
AGENCY). The report is intended to assist and provide input for GOI institutions and agencies as these
institutions and agencies develop a more comprehensive framework for regional and urban economic
development. It will achieve this by defining the role of large cities as centers of economic growth. The
report will be an important contribution to improved understanding of the constraints and steps needed to
improve urban and regional economic growth, competitiveness and service delivery.
The aim of this report is to describe and outline issues related to the major priorities for Indonesia‘s
national urban development strategy. It includes:
(i) An overall descriptive assessment of spatial urban and regional development trends over time;
(ii) An analysis of the relative impact of factors such as location, industrial concentration and
scale, diversity of economic activities, as well as governance and institutional performance on
metropolitan area economic development;
(iii) An identification of the critical constraints to regional and urban economic development based
on the analytical work; and
(iv) A series of policy suggestions for promoting balanced and sustainable urban and regional
development across Indonesia.
One of the major contributions of the research that supports this report is the development of an integrated
and consistent time series database of regional and urban development indicators disaggregated to the
district (kabupaten/kota) level. This database aggregates data from a variety of sources and covering the
period from 1993 to 2007. This allows us to explore spatial and sectoral trends during the pre-1997 crisis
period and the post-crisis ―big bang‖ decentralization period.
The analysis relies on descriptive statistics, multivariate econometric analysis and qualitative case studies.
The report begins with a description of urbanization and economic development trends across Indonesia.
The descriptive analysis examines the range of city-region agglomerations over time, in terms of urban
and total population change; migration; economic activity; access to basic urban infrastructure services;
and institutional performance. Using the results of both the multivariate analysis and the case studies, we
proceed to assess the performance of cities and urban regions over time in terms of population growth,
urbanization, economic output, income, service access and attempt to link this performance with government
policy actions and the structural characteristics of respective local economies. Our intent is to identify
constraints to regional and urban development that are the result of structural characteristics and/or
government policies, programs and investments. Based on the results of the analysis, we will make policy
recommendations for local and central governments on how major urban areas can be enhanced to
improve their competitiveness and prosperity. The remainder of this chapter outlines the structure of the
report.
Chapter One: Overview and Methodology
Page 2
Chapter 2 (“Urbanization and Metropolitan Growth”) provides an overview of the urbanization process.
The data shows that urbanization is occurring across Indonesia and that, in some instances, Outer Island
regions are urbanizing faster than Java-Bali, where most of the urban population currently resides. In terms
of the rate of incidence of poverty, the data shows that poverty rates are typically higher in rural areas,
particularly remote rural areas, than in cities in most regions of Indonesia. This chapter also explores likely
future trends in urbanization, providing estimates of the population growth in 11 large cities. These
projections show that between 2010 and 2025, the population of these cities is expected to increase by
an average of 309,000 persons per year.
Chapter 3 (“Leveraging Urbanization and Agglomeration”) explores the extent to which Indonesia‘s
cities are leveraging the benefits that might be derived from agglomeration economies. The
agglomerations are functionally-defined urban metropolitan areas, with this definition being used in
recognition of the fact that urbanization in Indonesia extends beyond the seven GOI-defined metropolitan
regions. We employ the Agglomeration Index (AI) framework developed by Uchida and Nelson (2008) to
cluster districts into metropolitan agglomerations, using this framework to identify 44 metropolitan regions
in Indonesia. The AI allows us to define metropolitan agglomerations meaningfully and to analyze spatial,
demographic, and economic trends at the metropolitan scale.
Chapter 4 (“Economic Performance of Metropolitan Regions”) reviews the economic performance of
existing metropolitan regions. Using a gravity model, we compute spatial accessibility to population
centers and to manufacturing locations for selected industries. The gravity indices provide a measure of the
proximity of a district to regional attractions. This chapter shows that while Indonesia as a whole has not
fully leveraged the economic benefits of rapid urbanization, mid-sized cities have performed best in terms
of deriving these benefits.
Chapter 5 (“Infrastructure Investments and Urban Development”) analyzes the relationship between
public capital expenditures and economic productivity. We explore the role of investment in infrastructure
in boosting metropolitan economic growth. There is emerging evidence in Indonesia that increased
infrastructure spending at the local level contributes to economic growth. Recent analysis shows that as
district capital spending rises as a proportion of GRDP, its rate of economic growth also increases.
Chapter 6 (“Spatial Drivers of Metropolitan Development”) examines the spatial drivers of metropolitan
development. Here we examine how well Indonesian metropolitan regions are planned and how planning
is enforced. We also examine the role of inter-governmental coordination to manage urban development
that straddles district or provincial boundaries. The chapter shows the urban planning in Indonesia needs to
be strengthened, particularly in large metropolitan areas. In the conclusion, we identify a range of critical
urban planning challenges and recommendations on how these challenges should be addressed.
Chapter 7 (“Conclusion”) summarizes the report‘s main findings and recommendations for leveraging
urbanization to support metropolitan economic growth and to improve the quality of life of Indonesia‘s
urban and non-urban community members. This chapter draws conclusions on the urbanization trends across
the country and sets out policy recommendations for the central government. It also sets out recommended
policy actions for metropolitan areas and policy initiatives for smaller metropolitan areas.
Technical Annexes explain the main analytic tools used in the report. In particular, it explains the use of
the Agglomeration Index to define metropolitan regions (Annex 1); Gravity Indices to explore the link
between metropolitan areas and surrounding districts (see Annex 2 for a description of the gravity
models); PRODY and EXPY to assess the degree of sophistication of a metropolitan area‘s manufacturing
Chapter One: Overview and Methodology
Page 3
sector(Annex 3); and the Barro-style growth model to explain the relationship between public capital
expenditure, district growth, and urbanization (Annex 5).
Annex 6 provides an assessment of development trends in four major metropolitan areas of Jakarta,
Makassar, Medan and Surabaya. The two largest metro areas (Jakarta Metro Area and Surabaya Metro
Area) are developing polycentric spatial structures with multiple nodes surrounding the traditional city
center. Overall, the trends for four metropolitan areas indicate that spatial economic transformation is
underway in all of them, with suburbanization and economic transformation pushing development outward.
QUANTITATIVE DATA
Quantitative data used in this analysis were drawn largely from surveys conducted and compiled by
Statistics Indonesia (Badan Pusat Statistik/BPS).In general, we draw on surveys which provide
representative samples for each district and which are conducted annually. In some cases, however,
databases are available every few years. The National Socio-Economic Survey (SUSENAS) is conducted
annually by BPS. Since 1993, it has been a nationally-representative sample. For our study, Susenas
provides population and demographic data, including data related to the incidence of poverty. The
Village Potential Statistics (PODES) are drawn from a census conducted approximately every three years,
with these sensors measuring village demographics; access to infrastructure; and economic status and
performance. Where necessary, we trend-extrapolate data for intercensal years. Industrial Statistics
(Statistik Industri, a census of large and medium-scale manufacturing operations) provides annual
establishment-level data on all manufacturing establishments with more than twenty registered employees.
The Regional Finance Information System (SIKD) provides data related to public investment in infrastructure
development. We also use the United Nations‘ national accounts for international comparisons and draw
on multiple reports for secondary data. These sources are cited appropriately throughout the report.
We also use data on Gross Regional Domestic Product (GRDP). There are a number of issues with the
GRDP data. District-level GRDP data are estimated from provincial totals, which are produced by BPS
offices at the national, provincial, and district levels. Although all offices are required to follow common
procedures to produce the estimations of GRDP, this dispersion of responsibility does raise some questions
regarding the reliability of the outputs. Between 1993 and 2005, for instance, sub-totals produced by
summing district GRDPs within a province did not match provincial totals, with variations ranging from
between 91 and 105 percent of the published provincial totals (McCulloch and Sjahrir 2008).Values in
2006 and 2007 also fit into this range. Despite these issues, the GRDP district-level data is still used in the
analysis, since it is necessary to include indicators of economic activity at this level in order to study
agglomeration economies. In addition to using BPS-prepared statistics, we compute several spatial
indicators using BPS GIS data and the datasets described immediately above.
QUALITATIVE DATA
To analyze institutional patterns and constraints, we employ an extensive qualitative research framework
relying on a series of qualitative surveys of national and local laws, regulations and practices. We also
conduct detailed case studies in the Jakarta, Medan, Surabaya and Makassar metropolitan regions. The
surveys and case studies focus on local, national and provincial urban planning and administrative laws,
policies, and practices to better understand how current legislation and institutional practices affect trans-
district urbanization. We examine these issues through a review of applicable laws, decrees and policies
pertaining to spatial planning, inter-governmental coordination, business climate, infrastructure planning
and finance, and access to private financial capital. Combined with extensive literature reviews, we use
these surveys and case studies to identify constraints to agglomeration across the country and to frame

Chapter One: Overview and Methodology
Page 4
recommendations on how to address these constraints and to leverage opportunities to boost
agglomeration.
Page 5
CHAPTER 2
URBANIZATION AND METROPOLITAN GROWTH
This chapter reviews past and future trends related to Indonesia‘s urbanization and the development of its metropolitan regions. First, we examine historical urbanization trends on the basis of United Nations tabulations of urban, rural and total populations from 1971 to 2010. Next, we explore population and urbanization trends in each of the country‘s seven major metropolitan regions. Finally, we develop an Agglomeration Index (AI) for Indonesia in order to define functionally-based metropolitan regions.
Indonesia, like other rapidly developing economies, is going through a process of significant urbanization. While Indonesia‘s geographical situation as a complex archipelago of more than 17,000 islands create special challenges, other developing countries have also had to attempt to grapple with spatially uneven development. As the World Development Report of 2009 states:
“No country has grown to middle income without industrializing and urbanizing. None has grown to high income without
vibrant cities.”
Spatially concentrated urbanization and economic development go hand-in-hand. High levels of population density and low-cost access to factor inputs have facilitated the transformation of economies from agrarian to industrial and to service activities. Regions that can manage rural to urban transition successfully are able to rapidly expand their economies and to experience increased average incomes and improved living standards.
According to a 2005 survey of developing countries, almost 75 percent of the responding nations expressed a strong desire to implement policies to reduce migration to urban areas or to reverse migration flows from urban to rural areas (United Nations, 2007). While cities face challenges of congestion, pollution and higher costs, the creation of agglomeration economies and rising incomes means that the benefits of size outweigh the perceived costs. Through investments in infrastructure, better urban planning and more efficient spatial structure, cities can mitigate the effects of these adverse conditions and become more competitive. In East Asia, there are numerous examples of such positive reversals, including the cases of Bangkok, Beijing, Seoul and Tokyo. The success of these cities implies that making cities more productive and efficient is more feasible than attempting to stop or redirect urban growth.
The stopping or limitation of urbanization is commonly proposed or discussed in many developing countries (Renaud, 1981). Such proposals and ideas are driven primarily by the rapid rates of urbanization in low and middle-income developing countries; the proliferation of ―mega-cities‖ with populations over 10 million; widespread urban pollution and congestion; limited urban services; and the perception that cities are economically and socially dysfunctional and draw resources away from rural areas. These concerns frequently prompt policy-makers to call for policies to limit the growth of large cities; stem migration flows to cities; and to seek options for building new towns, growth poles and new special economic zones.
REGIONAL DEVELOPMENT POLICY: PEOPLE VS. PLACE PROSPERITY
Designing and implementing effective forms of regional development is a complex process. In many cases, policy-makers are not fully aware of the drivers that shape urban and regional development. Consequently, these policymakers frame policy initiatives that are ineffective or counterproductive. As many management and policy experts have commented: If you cannot explain, understand or measure performance, you cannot possibly hope to shape it in ways that achieve desired outcomes.
The Government of Indonesia has stressed the importance of spatial equity among the seven Island regions, as mentioned in the Master Plan for Expansion and Acceleration of Indonesia‘s Economic
Chapter Two: Urban and Metropolitan Growth
Page 6
Development (MP3EI). In turn, this has sparked great interest among central and sub-national government decision-makers to consider how to promote development of strategic locations to ―reduce the dominance of Island of Java and increase growth of the rest of Indonesia.‖ One option discussed is moving the capital city out of Jakarta, although the experience from other countries (Brazil, Nigeria, and Pakistan, to name a few, Baskoro, 2010) show that moving the capital had very little, if any, impact on urban development in the former capital cities.
One useful way to characterize regional development policy is to think of it in terms of the promotion of people prosperity versus place prosperity. The question implied by this distinction is: Should governments spend scarce resources to attempt to build up lagging regions (a focus on place)? Or should they consider policy instruments to enhance ―people prosperity‖ through education and human capital development or through the promotion of labor mobility and migration? An underlying theme that cuts across these questions and debates is the notion that the Indonesian Government should foster place prosperity over people prosperity. The dilemma implied by the distinction between people versus place prosperity is not unique to Indonesia, nor is it new. It is a longstanding question that regional development planners and economists have debated for years. Governments have launched hundreds of initiatives to promote either people prosperity or place prosperity, without resolving or settling the distinction.
In terms of promoting both people and place prosperity, the Indonesian Government has launched the ―Master Plan for Acceleration and Expansion of Indonesia‘s Economic Development‖ (MP3EI). The MP3EI Plan combines both sector and regional development approaches, which in turn are integrated with the development of Economic Corridors. The objective of this initiative is to boost economic development by clustering and sharpening economic activities in certain regions. It provides strategic direction for investors, guiding these investors to targeted investment locations where the Government will concentrate on providing major support and guidance. The main strategy of the economic transformation is to develop centers of growth in each region through the promotion of Economic Corridors, strengthening connectivity and integration between regions to lower logistics cost and building synergy between centers of growth in different regions. The development of Economic Corridors is based on the spatial conditions of each of Indonesia‘s major islands, with each Economic Corridor leveraging its specific advantages (see Table 2.1 below).
The master plan will spur growth in some development corridors, such as the east coast of Sumatra; the northern regions of Java, Bali and Nusa Tenggara; the west and east coasts of Kalimantan; and the west coast of Sulawesi. Economic centers, such as Special Economic Zones (SEZ) and Free Trade Zones (FTZ), will be developed alongside the corridor to support investment and to boost the economic attractiveness of the region. They will also facilitate the subsequent development of massive infrastructure projects to support the economic activities of these corridors. The flow of resources, goods and services will foster urbanization in areas adjacent to each corridor. Moreover, the proposed programs for the development of transportation infrastructure, such as the trans-Java expressway, the trans-Java railway, and the trans-Sumatra highway, will connect regions and integrate economic activities throughout Indonesia.
Chapter Two: Urban and Metropolitan Growth
Page 7
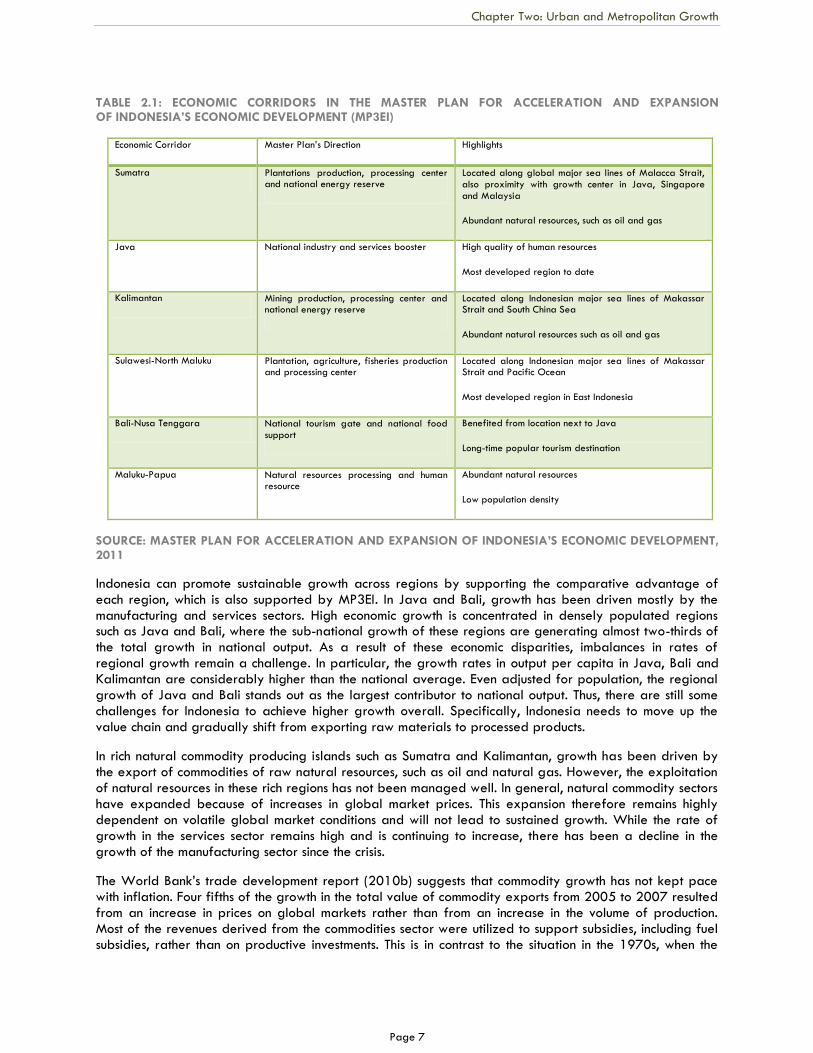
TABLE 2.1: ECONOMIC CORRIDORS IN THE MASTER PLAN FOR ACCELERATION AND EXPANSION OF INDONESIA’S ECONOMIC DEVELOPMENT (MP3EI)
Economic Corridor Master Plan‘s Direction Highlights
Sumatra Plantations production, processing center and national energy reserve
Located along global major sea lines of Malacca Strait, also proximity with growth center in Java, Singapore and Malaysia
Abundant natural resources, such as oil and gas
Java National industry and services booster High quality of human resources
Most developed region to date
Kalimantan Mining production, processing center and national energy reserve
Located along Indonesian major sea lines of Makassar Strait and South China Sea
Abundant natural resources such as oil and gas
Sulawesi-North Maluku Plantation, agriculture, fisheries production and processing center
Located along Indonesian major sea lines of Makassar Strait and Pacific Ocean
Most developed region in East Indonesia
Bali-Nusa Tenggara National tourism gate and national food support
Benefited from location next to Java
Long-time popular tourism destination
Maluku-Papua Natural resources processing and human resource
Abundant natural resources
Low population density
SOURCE: MASTER PLAN FOR ACCELERATION AND EXPANSION OF INDONESIA’S ECONOMIC DEVELOPMENT, 2011
Indonesia can promote sustainable growth across regions by supporting the comparative advantage of each region, which is also supported by MP3EI. In Java and Bali, growth has been driven mostly by the manufacturing and services sectors. High economic growth is concentrated in densely populated regions such as Java and Bali, where the sub-national growth of these regions are generating almost two-thirds of the total growth in national output. As a result of these economic disparities, imbalances in rates of regional growth remain a challenge. In particular, the growth rates in output per capita in Java, Bali and Kalimantan are considerably higher than the national average. Even adjusted for population, the regional growth of Java and Bali stands out as the largest contributor to national output. Thus, there are still some challenges for Indonesia to achieve higher growth overall. Specifically, Indonesia needs to move up the value chain and gradually shift from exporting raw materials to processed products.
In rich natural commodity producing islands such as Sumatra and Kalimantan, growth has been driven by the export of commodities of raw natural resources, such as oil and natural gas. However, the exploitation of natural resources in these rich regions has not been managed well. In general, natural commodity sectors have expanded because of increases in global market prices. This expansion therefore remains highly dependent on volatile global market conditions and will not lead to sustained growth. While the rate of growth in the services sector remains high and is continuing to increase, there has been a decline in the growth of the manufacturing sector since the crisis.
The World Bank‘s trade development report (2010b) suggests that commodity growth has not kept pace with inflation. Four fifths of the growth in the total value of commodity exports from 2005 to 2007 resulted from an increase in prices on global markets rather than from an increase in the volume of production. Most of the revenues derived from the commodities sector were utilized to support subsidies, including fuel subsidies, rather than on productive investments. This is in contrast to the situation in the 1970s, when the
Chapter Two: Urban and Metropolitan Growth
Page 8
Indonesian Government used the commodity windfall to improve infrastructure and to revamp its agricultural sector.
As Indonesia‘s decentralization and regional autonomy reforms of 2001 assumes that a large part of growth policy will be made at the district (kabupaten/kota) level, it is crucial to ensure that sub-national policy-making supports the promotion of dynamic sectors in the regions. Besides the promotion of economic corridors, government policies also focus on economic integration to encourage inclusive growth. To improve spatial equity, the Government has attempted to develop a limited number of dispersed centers of economic activity across the country. However, international experience suggests that growth poles should be carefully located based on rigorous economic analysis, as the record of such initiatives is mixed, with a significant proportion of both successes and failures.
Many countries have tried some very aggressive measures to foster more inclusive and spatially balanced growth. The range of policy tools is wide, including: attempts to control internal migration (China and the former Soviet Union); the formation of growth poles (Brazil, Venezuela, France and Canada); offering financial incentives for firms to locate in lagging regions (the Tennessee Valley Authority, Canada‘s Department of Regional Economic Expansion); the creation of economic zones (Malaysia, India, Thailand,
BOX 2.1: “GO WEST”: CHINA’S EFFORTS TO DEVELOP ITS LAGGING WESTERN REGION
The large western region of China has historically lagged behind the coastal East, despite its mineral and energy resources. This has largely been the result of its harsh climate and difficult terrain. The Western region is very large, covering more than 70 percent of China‘s total land area and consisting of 13 provinces. However, it is sparsely populated, With less than 30 percent of China‘s population. The GDP per capita in Western China is less than half of that in the East. Although the West has a larger absolute number of towns and cities, due to its large size, the density of urban centers across the region is far lower. The private sector is also less dynamic than in the East, which has around 3.5 times the number of private enterprises per town than the West and North-East.
In 1999, the Chinese government announced its China Western Development or ―Go West‖ policy, targeting the Western region for development with the intention of reducing economic disparity between the coast and the interior; promoting national unity; and utilizing natural resources more efficiently. The Government‘s emphasis was on encouraging private investment in the West, using only limited public funds. The long-term strategy was to target existing metropolitan centers with established economic bases, which were intended to act as engines of growth, providing employment that would attract rural migrants.
The key policies outlined by the Government to promote regional growth included:
Infrastructure development: Transport, including national and provincial highways, rail systems, and airports;
communications; energy; irrigation; and urban infrastructure
Environmental protection: Controlling floods, draughts, and sandstorms
Sectoral and economic adjustment: Promoting sectors that take advantage of the West‘s comparative advantage,
e.g., minerals and tourism, and encouraging high-tech industries to locate in the West
Human capital and R&D: Improving funding and support for research facilities, technical training, and college
education, and using incentives such as higher compensation to attract talent to the West
Foreign Direct Investment and trade: Preferential treatment and incentives to encourage FDI and private investment
to the West, and opening up more areas for FDI investment; and
Targeted poverty alleviation.
The policy has had mixed results so far. Economic and population growth has increased in the West since the policy was implemented, but growth rates in the East continue to exceed the West, resulting in a larger gap between the two regions.
As Indonesia attempts to develop its own lagging region in the East, it can draw lessons from China‘s ―Go West‖ experience. As
in Western China, established urban agglomerations in Eastern Indonesia present an opportunity to boost regional development,
acting as strategic points of entry that can lead to economic growth in surrounding areas.
Chapter Two: Urban and Metropolitan Growth
Page 9
and Vietnam); or the establishment of new towns (the UK, the United States and India).
URBANIZATION PATTERN AND TRAJECTORY
Urban population data in this section are based on traditional estimates of urbanization trends using Government‘s definitions and administrative boundaries. In the case of Indonesia, BPS defines urban areas as follows: 1) in areas that have a population density of 5,000 persons per square kilometer; 2) areas in which 25 percent or less of the households work in the agricultural sector; and 3) areas in which there are eight or more specific kinds of urban facilities, including primary schools or equivalent; junior high schools or equivalent; senior high schools or equivalent; cinemas; hospitals, maternity hospitals/mother-child hospitals; primary health care centers; roads that can accommodate three and four wheeled motorized vehicles; telephones; post offices; markets with buildings; shopping centers; banks; factories; restaurants; public electricity; and part equipment rental services.
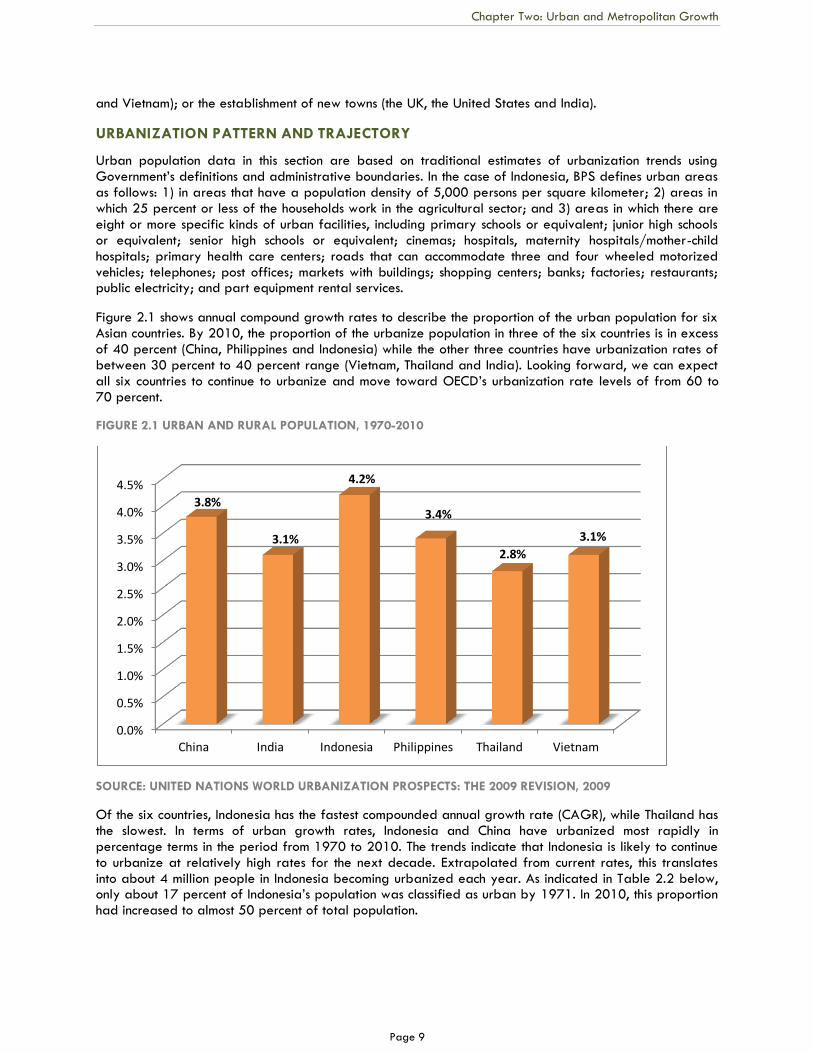
Figure 2.1 shows annual compound growth rates to describe the proportion of the urban population for six Asian countries. By 2010, the proportion of the urbanize population in three of the six countries is in excess of 40 percent (China, Philippines and Indonesia) while the other three countries have urbanization rates of between 30 percent to 40 percent range (Vietnam, Thailand and India). Looking forward, we can expect all six countries to continue to urbanize and move toward OECD‘s urbanization rate levels of from 60 to 70 percent.
FIGURE 2.1 URBAN AND RURAL POPULATION, 1970-2010
SOURCE: UNITED NATIONS WORLD URBANIZATION PROSPECTS: THE 2009 REVISION, 2009
Of the six countries, Indonesia has the fastest compounded annual growth rate (CAGR), while Thailand has the slowest. In terms of urban growth rates, Indonesia and China have urbanized most rapidly in percentage terms in the period from 1970 to 2010. The trends indicate that Indonesia is likely to continue to urbanize at relatively high rates for the next decade. Extrapolated from current rates, this translates into about 4 million people in Indonesia becoming urbanized each year. As indicated in Table 2.2 below, only about 17 percent of Indonesia‘s population was classified as urban by 1971. In 2010, this proportion had increased to almost 50 percent of total population.
0.0%
0.5%
1.0%
1.5%
2.0%
2.5%
3.0%
3.5%
4.0%
4.5%
China India Indonesia Philippines Thailand Vietnam
3.8%
3.1%
4.2%
3.4%
2.8%
3.1%
Chapter Two: Urban and Metropolitan Growth
Page 10
TABLE 2.2 URBAN AND RURAL POPULATION, INDONESIA 1971-2010 (MILLIONS)
Year Urban Population Rural Population Total Population Percent urban
1971 20.5 98.9 119.4 17.2%
1980 32.8 114.1 146.9 22.4%
1990 55.5 123.8 179.3 30.9%
2000 85.8 117.7 203.5 42.2%
2010 118.3 119.3 237.6 49.8%
SOURCE: BPS, VARIOUS YEARS
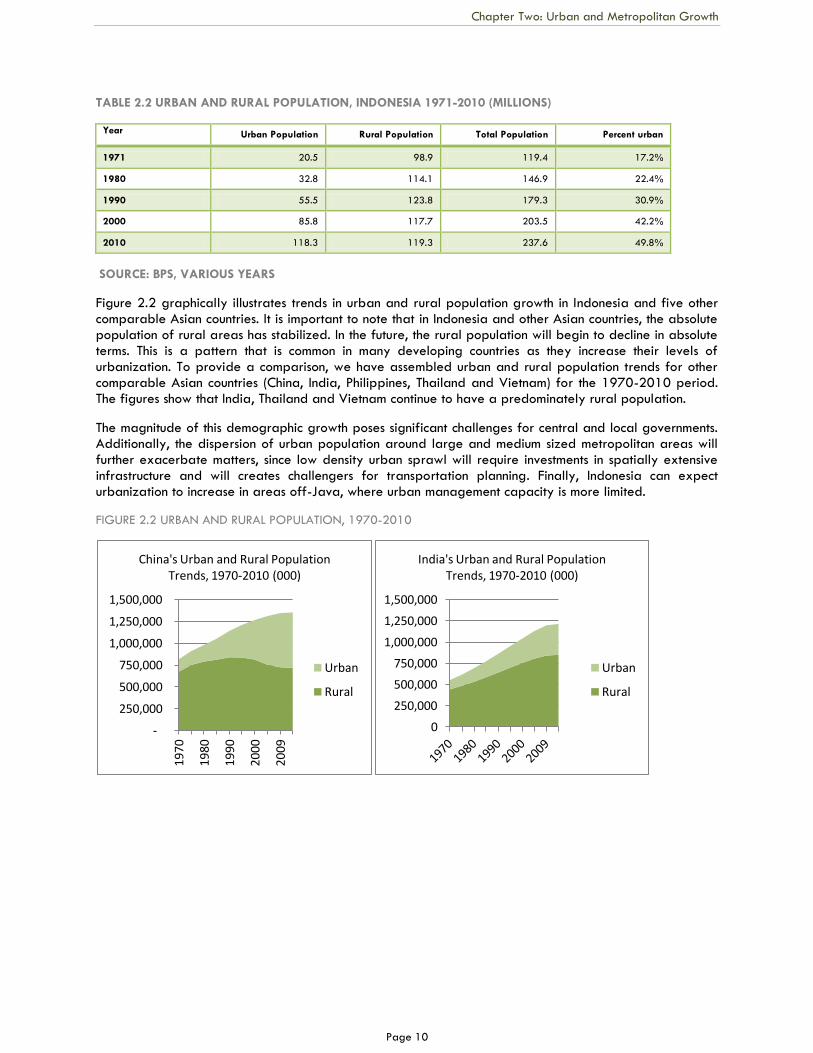
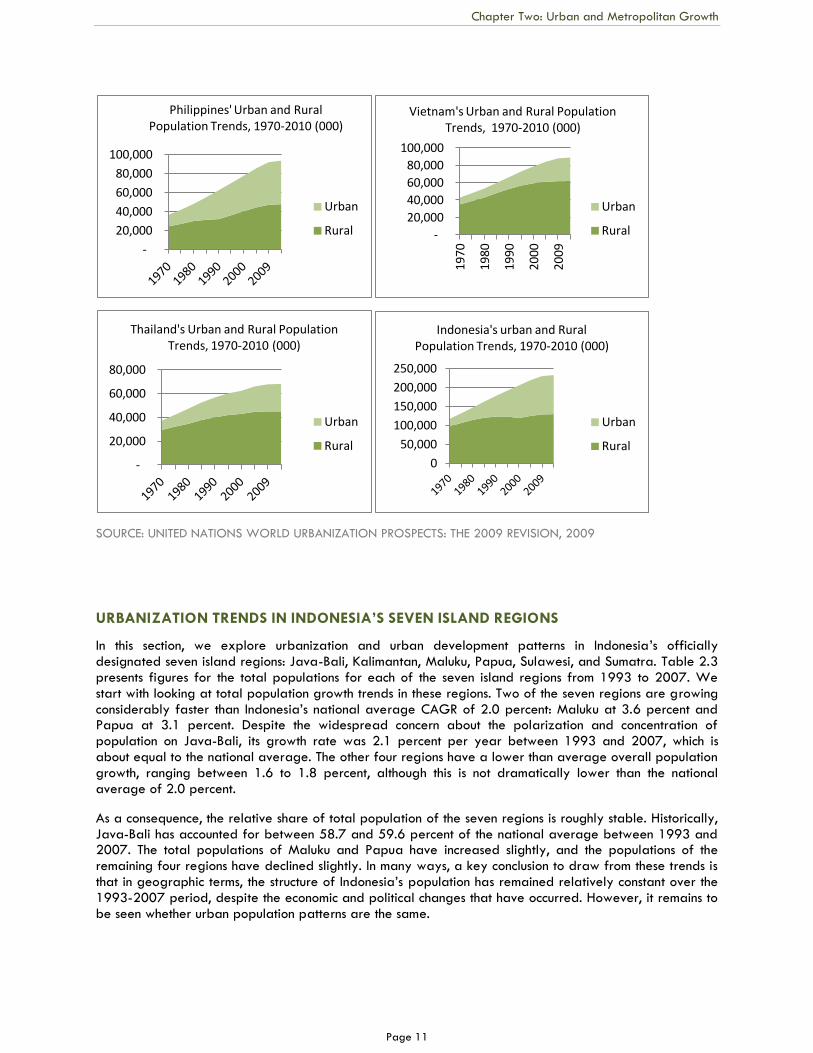
Figure 2.2 graphically illustrates trends in urban and rural population growth in Indonesia and five other comparable Asian countries. It is important to note that in Indonesia and other Asian countries, the absolute population of rural areas has stabilized. In the future, the rural population will begin to decline in absolute terms. This is a pattern that is common in many developing countries as they increase their levels of urbanization. To provide a comparison, we have assembled urban and rural population trends for other comparable Asian countries (China, India, Philippines, Thailand and Vietnam) for the 1970-2010 period. The figures show that India, Thailand and Vietnam continue to have a predominately rural population.
The magnitude of this demographic growth poses significant challenges for central and local governments. Additionally, the dispersion of urban population around large and medium sized metropolitan areas will further exacerbate matters, since low density urban sprawl will require investments in spatially extensive infrastructure and will creates challengers for transportation planning. Finally, Indonesia can expect urbanization to increase in areas off-Java, where urban management capacity is more limited.
FIGURE 2.2 URBAN AND RURAL POPULATION, 1970-2010
-
250,000
500,000
750,000
1,000,000
1,250,000
1,500,000
1970
1980
1990
2000
2009
China's Urban and Rural Population Trends, 1970-2010 (000)
Urban
Rural
0
250,000
500,000
750,000
1,000,000
1,250,000
1,500,000
India's Urban and Rural Population Trends, 1970-2010 (000)
Urban
Rural
Chapter Two: Urban and Metropolitan Growth
Page 11
SOURCE: UNITED NATIONS WORLD URBANIZATION PROSPECTS: THE 2009 REVISION, 2009
URBANIZATION TRENDS IN INDONESIA’S SEVEN ISLAND REGIONS
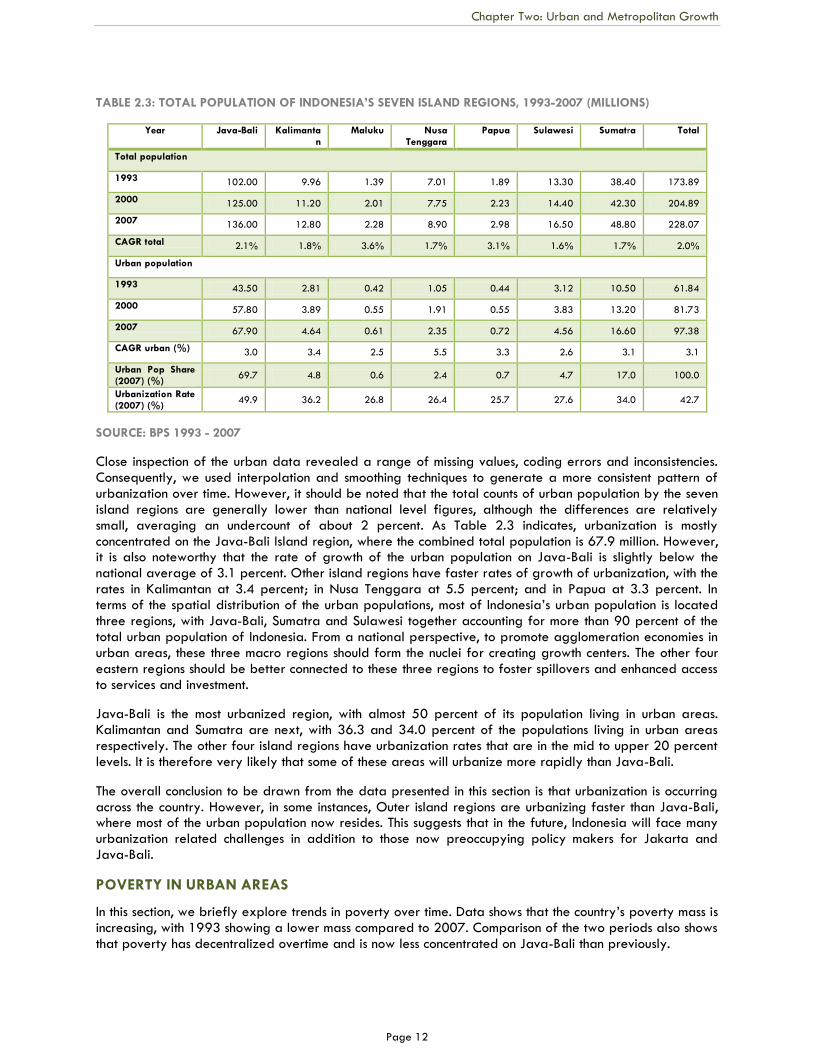
In this section, we explore urbanization and urban development patterns in Indonesia‘s officially designated seven island regions: Java-Bali, Kalimantan, Maluku, Papua, Sulawesi, and Sumatra. Table 2.3 presents figures for the total populations for each of the seven island regions from 1993 to 2007. We start with looking at total population growth trends in these regions. Two of the seven regions are growing considerably faster than Indonesia‘s national average CAGR of 2.0 percent: Maluku at 3.6 percent and Papua at 3.1 percent. Despite the widespread concern about the polarization and concentration of population on Java-Bali, its growth rate was 2.1 percent per year between 1993 and 2007, which is about equal to the national average. The other four regions have a lower than average overall population growth, ranging between 1.6 to 1.8 percent, although this is not dramatically lower than the national average of 2.0 percent.
As a consequence, the relative share of total population of the seven regions is roughly stable. Historically, Java-Bali has accounted for between 58.7 and 59.6 percent of the national average between 1993 and 2007. The total populations of Maluku and Papua have increased slightly, and the populations of the remaining four regions have declined slightly. In many ways, a key conclusion to draw from these trends is that in geographic terms, the structure of Indonesia‘s population has remained relatively constant over the 1993-2007 period, despite the economic and political changes that have occurred. However, it remains to be seen whether urban population patterns are the same.
-
20,000
40,000
60,000
80,000
100,000
Philippines' Urban and Rural Population Trends, 1970-2010 (000)
Urban
Rural -
20,000
40,000
60,000
80,000
100,000
1970
1980
1990
2000
2009
Vietnam's Urban and Rural Population Trends, 1970-2010 (000)
Urban
Rural
-
20,000
40,000
60,000
80,000
Thailand's Urban and Rural Population Trends, 1970-2010 (000)
Urban
Rural
0
50,000
100,000
150,000
200,000
250,000
Indonesia's urban and Rural Population Trends, 1970-2010 (000)
Urban
Rural
Chapter Two: Urban and Metropolitan Growth
Page 12
TABLE 2.3: TOTAL POPULATION OF INDONESIA’S SEVEN ISLAND REGIONS, 1993-2007 (MILLIONS)
Year Java-Bali Kalimantan
Maluku Nusa Tenggara
Papua Sulawesi Sumatra Total
Total population
1993 102.00 9.96 1.39 7.01 1.89 13.30 38.40 173.89
2000 125.00 11.20 2.01 7.75 2.23 14.40 42.30 204.89
2007 136.00 12.80 2.28 8.90 2.98 16.50 48.80 228.07
CAGR total 2.1% 1.8% 3.6% 1.7% 3.1% 1.6% 1.7% 2.0%
Urban population
1993 43.50 2.81 0.42 1.05 0.44 3.12 10.50 61.84
2000 57.80 3.89 0.55 1.91 0.55 3.83 13.20 81.73
2007 67.90 4.64 0.61 2.35 0.72 4.56 16.60 97.38
CAGR urban (%) 3.0 3.4 2.5 5.5 3.3 2.6 3.1 3.1
Urban Pop Share (2007) (%)
69.7 4.8 0.6 2.4 0.7 4.7 17.0 100.0
Urbanization Rate (2007) (%)
49.9 36.2 26.8 26.4 25.7 27.6 34.0 42.7
SOURCE: BPS 1993 - 2007
Close inspection of the urban data revealed a range of missing values, coding errors and inconsistencies. Consequently, we used interpolation and smoothing techniques to generate a more consistent pattern of urbanization over time. However, it should be noted that the total counts of urban population by the seven island regions are generally lower than national level figures, although the differences are relatively small, averaging an undercount of about 2 percent. As Table 2.3 indicates, urbanization is mostly concentrated on the Java-Bali Island region, where the combined total population is 67.9 million. However, it is also noteworthy that the rate of growth of the urban population on Java-Bali is slightly below the national average of 3.1 percent. Other island regions have faster rates of growth of urbanization, with the rates in Kalimantan at 3.4 percent; in Nusa Tenggara at 5.5 percent; and in Papua at 3.3 percent. In terms of the spatial distribution of the urban populations, most of Indonesia‘s urban population is located three regions, with Java-Bali, Sumatra and Sulawesi together accounting for more than 90 percent of the total urban population of Indonesia. From a national perspective, to promote agglomeration economies in urban areas, these three macro regions should form the nuclei for creating growth centers. The other four eastern regions should be better connected to these three regions to foster spillovers and enhanced access to services and investment.
Java-Bali is the most urbanized region, with almost 50 percent of its population living in urban areas. Kalimantan and Sumatra are next, with 36.3 and 34.0 percent of the populations living in urban areas respectively. The other four island regions have urbanization rates that are in the mid to upper 20 percent levels. It is therefore very likely that some of these areas will urbanize more rapidly than Java-Bali.
The overall conclusion to be drawn from the data presented in this section is that urbanization is occurring across the country. However, in some instances, Outer island regions are urbanizing faster than Java-Bali, where most of the urban population now resides. This suggests that in the future, Indonesia will face many urbanization related challenges in addition to those now preoccupying policy makers for Jakarta and Java-Bali.
POVERTY IN URBAN AREAS
In this section, we briefly explore trends in poverty over time. Data shows that the country‘s poverty mass is increasing, with 1993 showing a lower mass compared to 2007. Comparison of the two periods also shows that poverty has decentralized overtime and is now less concentrated on Java-Bali than previously.
Chapter Two: Urban and Metropolitan Growth
Page 13
While the total number of Indonesians living in poverty increased from 26.0 million persons in 1993 to 37.3 million persons in 2007, the proportion of those living in poverty declined from 17.8 percent of the population in 1993 to 16.6 percent of the population in 2007 (these counts and percentages are tentative, as many districts did not report poverty data in 1993; the 1993 percentage is adjusted for un-reporting). Poverty rates are generally lower in urban areas for both 1993 and 2007.
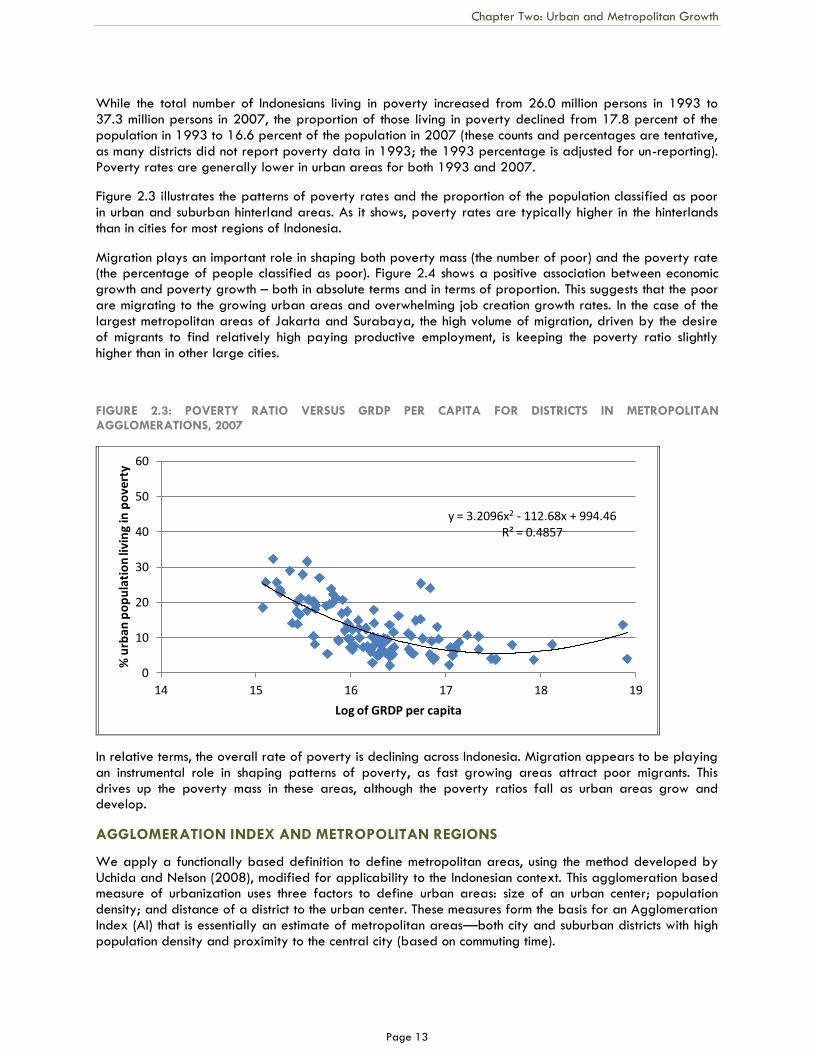
Figure 2.3 illustrates the patterns of poverty rates and the proportion of the population classified as poor in urban and suburban hinterland areas. As it shows, poverty rates are typically higher in the hinterlands than in cities for most regions of Indonesia.
Migration plays an important role in shaping both poverty mass (the number of poor) and the poverty rate (the percentage of people classified as poor). Figure 2.4 shows a positive association between economic growth and poverty growth – both in absolute terms and in terms of proportion. This suggests that the poor are migrating to the growing urban areas and overwhelming job creation growth rates. In the case of the largest metropolitan areas of Jakarta and Surabaya, the high volume of migration, driven by the desire of migrants to find relatively high paying productive employment, is keeping the poverty ratio slightly higher than in other large cities.
FIGURE 2.3: POVERTY RATIO VERSUS GRDP PER CAPITA FOR DISTRICTS IN METROPOLITAN AGGLOMERATIONS, 2007
In relative terms, the overall rate of poverty is declining across Indonesia. Migration appears to be playing an instrumental role in shaping patterns of poverty, as fast growing areas attract poor migrants. This drives up the poverty mass in these areas, although the poverty ratios fall as urban areas grow and develop.
AGGLOMERATION INDEX AND METROPOLITAN REGIONS
We apply a functionally based definition to define metropolitan areas, using the method developed by Uchida and Nelson (2008), modified for applicability to the Indonesian context. This agglomeration based measure of urbanization uses three factors to define urban areas: size of an urban center; population density; and distance of a district to the urban center. These measures form the basis for an Agglomeration Index (AI) that is essentially an estimate of metropolitan areas—both city and suburban districts with high population density and proximity to the central city (based on commuting time).
y = 3.2096x2 - 112.68x + 994.46 R² = 0.4857
0
10
20
30
40
50
60
14 15 16 17 18 19
% u
rba
n p
op
ula
tio
n li
vin
g in
po
vert
y
Log of GRDP per capita
Chapter Two: Urban and Metropolitan Growth
Page 14
Economic research points to the effects of agglomeration economies to explain why larger cities are more economically productive and competitive than smaller cities and rural areas. The term ―agglomeration economy‖ refers to positive externalities: firms benefit from locating close to one another and can therefore produce goods or services at lower than average cost. There are broadly two types of agglomeration economies: localization economies and urbanization economies. In the case of urbanization economies, the production costs of firms, particularly those related to industrial, service and other activities, decrease as the size of an industry‘s output increases. Localization economies are internal to specific industries and explain the formation of specialized industrial districts. Examples of localization economies include the Silicon Valley; textile districts; financial service centers; or advertising and marketing districts. Establishments operating in these particular sectors benefit by locating or clustering around similar producers.
Density and proximity significantly shape the impact of localization economies. If firms in certain sectors do not cluster and are spread across a large region, it is often more difficult to exploit localization economies. As Henderson (2005) and Rosenthal and Strange (2004) suggest, the benefits of localization economies attenuate with distance. Infrastructure quality, particularly transportation and telecommunication services, can foster the formation of geographically larger clusters of firms. However, at some point, distance and, more generally, remoteness annihilates the benefits of industrial and service clusters. Location and access matter a great deal. Transportation infrastructure can help overcome some of these constraints but there are ultimately limits.
The theory related to agglomeration provides an explanation regarding why industry and services are located in the cities. There are two fundamental reasons: economic efficiency gains and consumption advantages (Henderson 1986, Quigley 1998, and Venables 2009). Historically, efficiency gains were largely geographic: cities tended to locate near seaports or waterways, enabling them to ship their outputs at lower costs and, in the case of rivers, to tap into hydropower. This is clearly the case in many Southeast Asia countries, where cities such as Jakarta, Bangkok, Kuala Lumpur, Ho Chi Minh City and Manila were established and grew near the waterways. In China, coastal cities and those along major rivers grew faster than those inland. Over time, these locational advantages spawned other efficiencies, such as economies of scale, scope, diversity. City size plays an important role in driving these non-locational advantages.
As in the case of localization economies, distance and density matter. Urbanization economies typically thrive in dense urban areas where the transaction costs of doing business are lower and opportunities for knowledge spillovers abound. One common finding is that the effects of localization economies tend to be stronger than for urbanization economies. This result holds up in both developed and developing country cities (Overman and Venables 2005).
Overall, the theoretical and empirical evidence points to the economic benefits of large cities. Large cities provide opportunities for localization economies through the clustering of related activities. Therefore, they are able to offer a more diverse range of services that benefits both economic activities and consumers. Given this, it is no surprise that economic activities tend to cluster in larger cities and urban regions. However, as in most cases, there can be potential disadvantages to locating in very large cities.
When large metropolitan regions benefit from agglomeration economies, either through localization or urbanization economies, businesses tend to be more economically productive. This can be measured in a variety of ways, but due to data limitations, we focus on non-oil and gas GRDP (Gross Regional Domestic Product) per capita as a proxy for productivity. In cases when a metropolitan area‘s GRDP per capita is rising, this implies that the region is becoming more economically productive due to agglomeration economies. On the other hand, if GRDP per capita is flat or falling, this implies that agglomeration diseconomies are reducing the economic competitiveness of metropolitan areas.
Chapter Two: Urban and Metropolitan Growth
Page 15
INFRASTRUCTURE INVESTMENT’S ROLE
The quality and extent of infrastructure can and does play a significant role in helping cities and urban regions exploit opportunities associated with both localization and urbanization agglomeration economies. The principal way that this works is that if the public sector invests in infrastructure systems (roads, water supply, wastewater treatment, electricity, education, solid waste management and other services), then private industry will not have to pay for such capital expenditures. A study by Lee, Anas and Oh (1999) on the impacts of infrastructure deficiencies in Indonesia indicates significant potential cost savings that could be derived from the public provision of such infrastructure. Particularly because infrastructure investment is discreet and subject to economies of scale, governments can provide larger systems than individual firms would be incentivized to build, and they therefore can do so at lower average costs.
Infrastructure systems can foster the formation of industrial clusters by increasing the level of con activity of firms with each other. Special Economic Zones (SEZs) or industrial districts can be designed to attract the development of complementary businesses that can benefit from knowledge spillovers and reduced costs in the procurement of intermediate inputs. There are obvious advantages for the development of appropriate educational services—such services can be designed to train skilled workforces to increase productivity by focusing on required skills.
Access to and the quality of transportation infrastructure can radically impact the size of the labor market, by making it easier or more difficult for workers to commute to work. In the case of Jakarta, the lack of an efficient transit system makes it difficult for workers to travel to central city (DKI) job centers. Over time, because of increasing congestion and the difficulties faced by businesses and real estate developers to gain access to land in DKI, industrial, residential and commercial development has decentralized out of the city center. As Jakarta has decentralized, transportation infrastructure has become even more vitally necessary to connect suburban activity centers to one another. Without efficient connectivity, it will be difficult for Jakarta to foster agglomeration economies or derive associated benefits.
FACTOR MARKETS
Another extremely important factor driving agglomeration economies is the ease of access to factor inputs such as land, labor and finance capital. In the case of access to land, urban planning and land management plays a critical role. As we will discuss later in Chapter 6 (―Spatial Drivers of Metropolitan Development‖), the complex and inefficient processes associated with land assembly and redevelopment in Indonesia make it very difficult for Jakarta, Surabaya, Medan, Bandung and other large cities to modernize their spatial structures and to redevelop areas for higher intensity uses. Constraints to land assembly and redevelopment means that businesses are either locked into current locations or that they have a sub-optimal level of connectivity with service providers or other related businesses. Existing areas of the central city are completely developed, with much land being primarily used for kampung or high-end residential or commercial developments. Due to the difficulty and expense of assembling land, there is a tendency for modern residential community projects to locate in outer suburban areas. Industrial development has also expanded into the suburban fringes of the Jakarta Metropolitan Region, since it is also easier and cheaper to assemble land in these areas. The expansion of the toll road system has facilitated this spatial restructuring. With the expansion of the toll road system, Jakarta is transforming itself from a monocentric to polycentric spatial structure (Henderson, Kuncoro and Nasution, 1996).
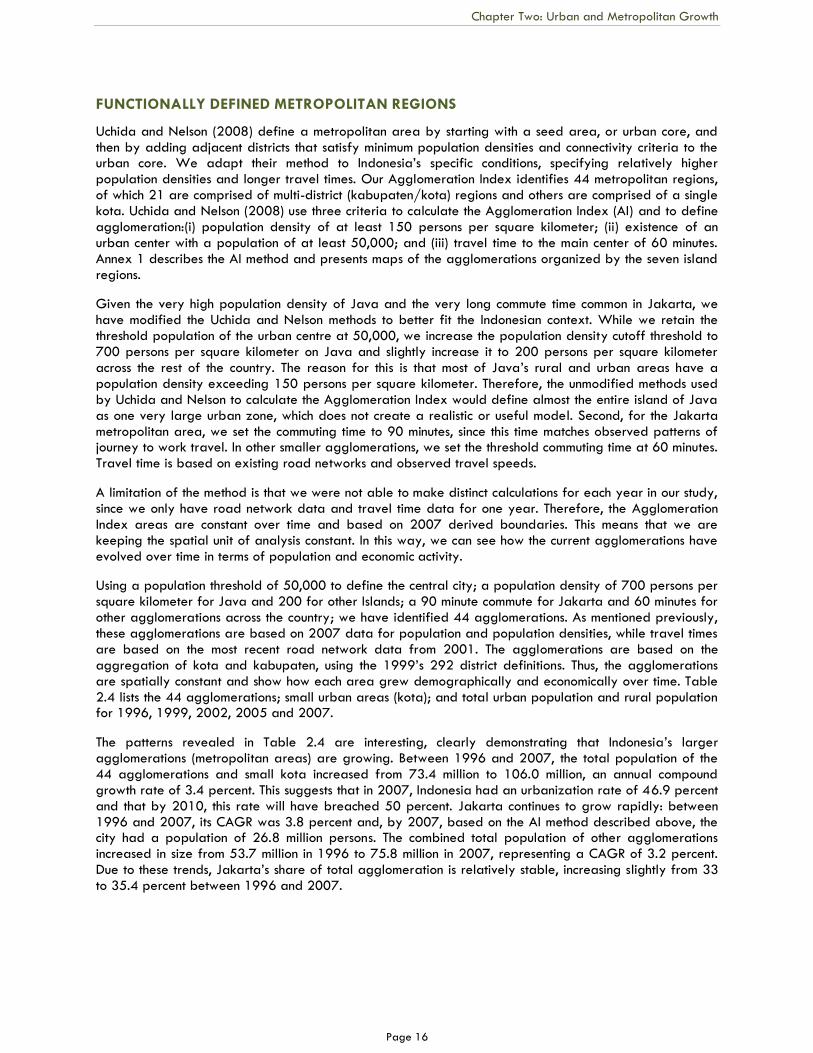
Chapter Two: Urban and Metropolitan Growth
Page 16
FUNCTIONALLY DEFINED METROPOLITAN REGIONS
Uchida and Nelson (2008) define a metropolitan area by starting with a seed area, or urban core, and then by adding adjacent districts that satisfy minimum population densities and connectivity criteria to the urban core. We adapt their method to Indonesia‘s specific conditions, specifying relatively higher population densities and longer travel times. Our Agglomeration Index identifies 44 metropolitan regions, of which 21 are comprised of multi-district (kabupaten/kota) regions and others are comprised of a single kota. Uchida and Nelson (2008) use three criteria to calculate the Agglomeration Index (AI) and to define agglomeration:(i) population density of at least 150 persons per square kilometer; (ii) existence of an urban center with a population of at least 50,000; and (iii) travel time to the main center of 60 minutes. Annex 1 describes the AI method and presents maps of the agglomerations organized by the seven island regions.
Given the very high population density of Java and the very long commute time common in Jakarta, we have modified the Uchida and Nelson methods to better fit the Indonesian context. While we retain the threshold population of the urban centre at 50,000, we increase the population density cutoff threshold to 700 persons per square kilometer on Java and slightly increase it to 200 persons per square kilometer across the rest of the country. The reason for this is that most of Java‘s rural and urban areas have a population density exceeding 150 persons per square kilometer. Therefore, the unmodified methods used by Uchida and Nelson to calculate the Agglomeration Index would define almost the entire island of Java as one very large urban zone, which does not create a realistic or useful model. Second, for the Jakarta metropolitan area, we set the commuting time to 90 minutes, since this time matches observed patterns of journey to work travel. In other smaller agglomerations, we set the threshold commuting time at 60 minutes. Travel time is based on existing road networks and observed travel speeds.
A limitation of the method is that we were not able to make distinct calculations for each year in our study, since we only have road network data and travel time data for one year. Therefore, the Agglomeration Index areas are constant over time and based on 2007 derived boundaries. This means that we are keeping the spatial unit of analysis constant. In this way, we can see how the current agglomerations have evolved over time in terms of population and economic activity.
Using a population threshold of 50,000 to define the central city; a population density of 700 persons per square kilometer for Java and 200 for other Islands; a 90 minute commute for Jakarta and 60 minutes for other agglomerations across the country; we have identified 44 agglomerations. As mentioned previously, these agglomerations are based on 2007 data for population and population densities, while travel times are based on the most recent road network data from 2001. The agglomerations are based on the aggregation of kota and kabupaten, using the 1999‘s 292 district definitions. Thus, the agglomerations are spatially constant and show how each area grew demographically and economically over time. Table 2.4 lists the 44 agglomerations; small urban areas (kota); and total urban population and rural population for 1996, 1999, 2002, 2005 and 2007.
The patterns revealed in Table 2.4 are interesting, clearly demonstrating that Indonesia‘s larger agglomerations (metropolitan areas) are growing. Between 1996 and 2007, the total population of the 44 agglomerations and small kota increased from 73.4 million to 106.0 million, an annual compound growth rate of 3.4 percent. This suggests that in 2007, Indonesia had an urbanization rate of 46.9 percent and that by 2010, this rate will have breached 50 percent. Jakarta continues to grow rapidly: between 1996 and 2007, its CAGR was 3.8 percent and, by 2007, based on the AI method described above, the city had a population of 26.8 million persons. The combined total population of other agglomerations increased in size from 53.7 million in 1996 to 75.8 million in 2007, representing a CAGR of 3.2 percent. Due to these trends, Jakarta‘s share of total agglomeration is relatively stable, increasing slightly from 33 to 35.4 percent between 1996 and 2007.
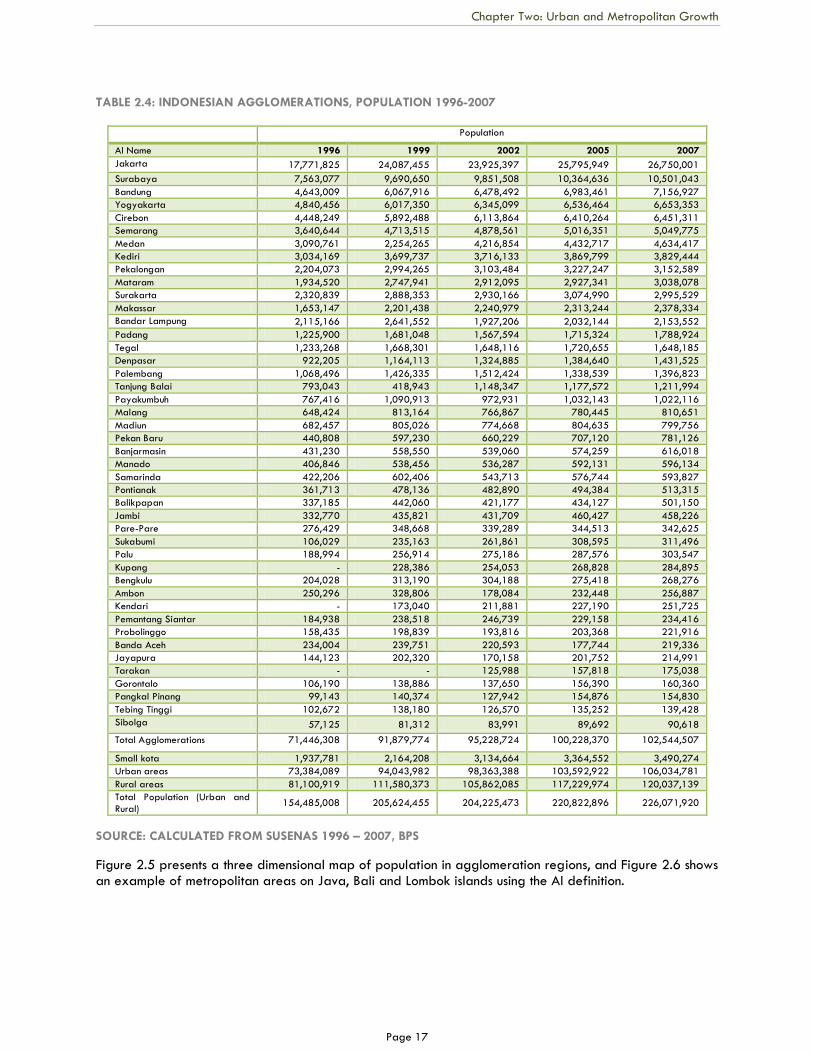
Chapter Two: Urban and Metropolitan Growth
Page 17
TABLE 2.4: INDONESIAN AGGLOMERATIONS, POPULATION 1996-2007
Population
AI Name 1996 1999 2002 2005 2007
Jakarta 17,771,825 24,087,455 23,925,397 25,795,949 26,750,001
Surabaya 7,563,077 9,690,650 9,851,508 10,364,636 10,501,043
Bandung 4,643,009 6,067,916 6,478,492 6,983,461 7,156,927
Yogyakarta 4,840,456 6,017,350 6,345,099 6,536,464 6,653,353
Cirebon 4,448,249 5,892,488 6,113,864 6,410,264 6,451,311
Semarang 3,640,644 4,713,515 4,878,561 5,016,351 5,049,775
Medan 3,090,761 2,254,265 4,216,854 4,432,717 4,634,417
Kediri 3,034,169 3,699,737 3,716,133 3,869,799 3,829,444
Pekalongan 2,204,073 2,994,265 3,103,484 3,227,247 3,152,589
Mataram 1,934,520 2,747,941 2,912,095 2,927,341 3,038,078
Surakarta 2,320,839 2,888,353 2,930,166 3,074,990 2,995,529
Makassar 1,653,147 2,201,438 2,240,979 2,313,244 2,378,334
Bandar Lampung 2,115,166 2,641,552 1,927,206 2,032,144 2,153,552
Padang 1,225,900 1,681,048 1,567,594 1,715,324 1,788,924
Tegal 1,233,268 1,668,301 1,648,116 1,720,655 1,648,185
Denpasar 922,205 1,164,113 1,324,885 1,384,640 1,431,525
Palembang 1,068,496 1,426,335 1,512,424 1,338,539 1,396,823
Tanjung Balai 793,043 418,943 1,148,347 1,177,572 1,211,994
Payakumbuh 767,416 1,090,913 972,931 1,032,143 1,022,116
Malang 648,424 813,164 766,867 780,445 810,651
Madiun 682,457 805,026 774,668 804,635 799,756
Pekan Baru 440,808 597,230 660,229 707,120 781,126
Banjarmasin 431,230 558,550 539,060 574,259 616,018
Manado 406,846 538,456 536,287 592,131 596,134
Samarinda 422,206 602,406 543,713 576,744 593,827
Pontianak 361,713 478,136 482,890 494,384 513,315
Balikpapan 337,185 442,060 421,177 434,127 501,150
Jambi 332,770 435,821 431,709 460,427 458,226
Pare-Pare 276,429 348,668 339,289 344,513 342,625
Sukabumi 106,029 235,163 261,861 308,595 311,496
Palu 188,994 256,914 275,186 287,576 303,547
Kupang - 228,386 254,053 268,828 284,895
Bengkulu 204,028 313,190 304,188 275,418 268,276
Ambon 250,296 328,806 178,084 232,448 256,887
Kendari - 173,040 211,881 227,190 251,725
Pemantang Siantar 184,938 238,518 246,739 229,158 234,416
Probolinggo 158,435 198,839 193,816 203,368 221,916
Banda Aceh 234,004 239,751 220,593 177,744 219,336
Jayapura 144,123 202,320 170,158 201,752 214,991
Tarakan - - 125,988 157,818 175,038
Gorontalo 106,190 138,886 137,650 156,390 160,360
Pangkal Pinang 99,143 140,374 127,942 154,876 154,830
Tebing Tinggi 102,672 138,180 126,570 135,252 139,428
Sibolga 57,125 81,312 83,991 89,692 90,618
Total Agglomerations 71,446,308 91,879,774 95,228,724 100,228,370 102,544,507
Small kota 1,937,781 2,164,208 3,134,664 3,364,552 3,490,274
Urban areas 73,384,089 94,043,982 98,363,388 103,592,922 106,034,781
Rural areas 81,100,919 111,580,373 105,862,085 117,229,974 120,037,139
Total Population (Urban and
Rural) 154,485,008 205,624,455 204,225,473 220,822,896 226,071,920
SOURCE: CALCULATED FROM SUSENAS 1996 – 2007, BPS
Figure 2.5 presents a three dimensional map of population in agglomeration regions, and Figure 2.6 shows an example of metropolitan areas on Java, Bali and Lombok islands using the AI definition.
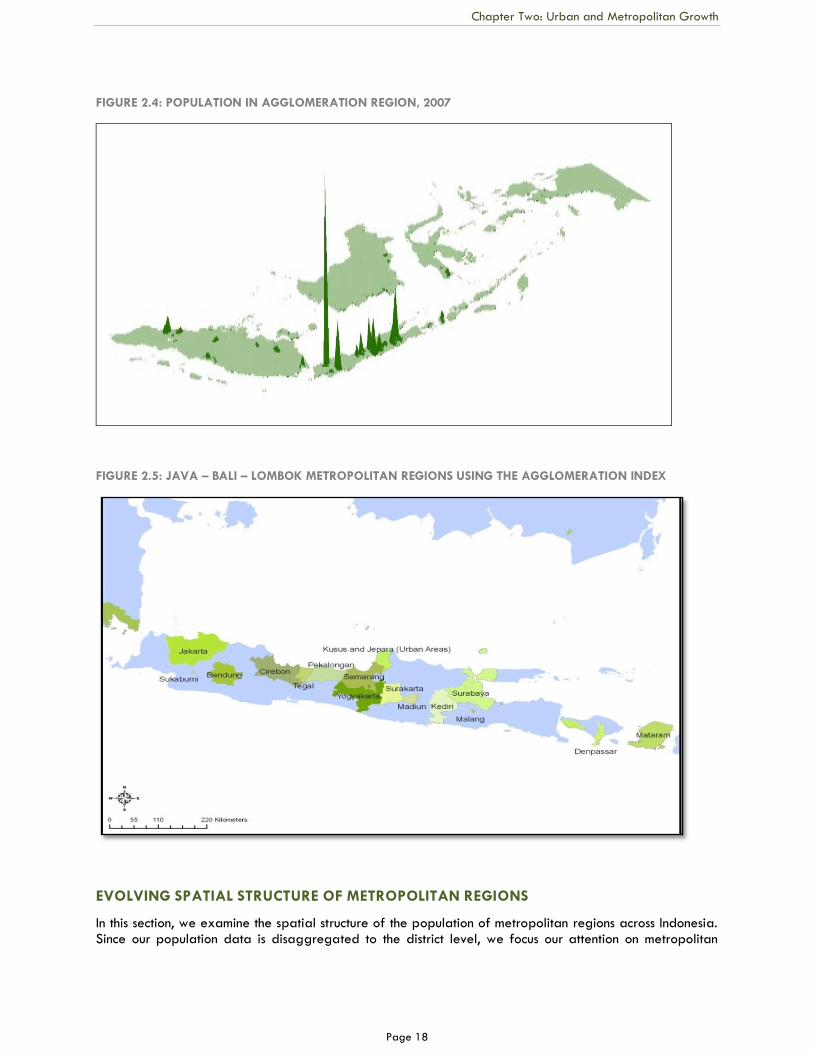
Chapter Two: Urban and Metropolitan Growth
Page 18
FIGURE 2.4: POPULATION IN AGGLOMERATION REGION, 2007
FIGURE 2.5: JAVA – BALI – LOMBOK METROPOLITAN REGIONS USING THE AGGLOMERATION INDEX
EVOLVING SPATIAL STRUCTURE OF METROPOLITAN REGIONS
In this section, we examine the spatial structure of the population of metropolitan regions across Indonesia. Since our population data is disaggregated to the district level, we focus our attention on metropolitan
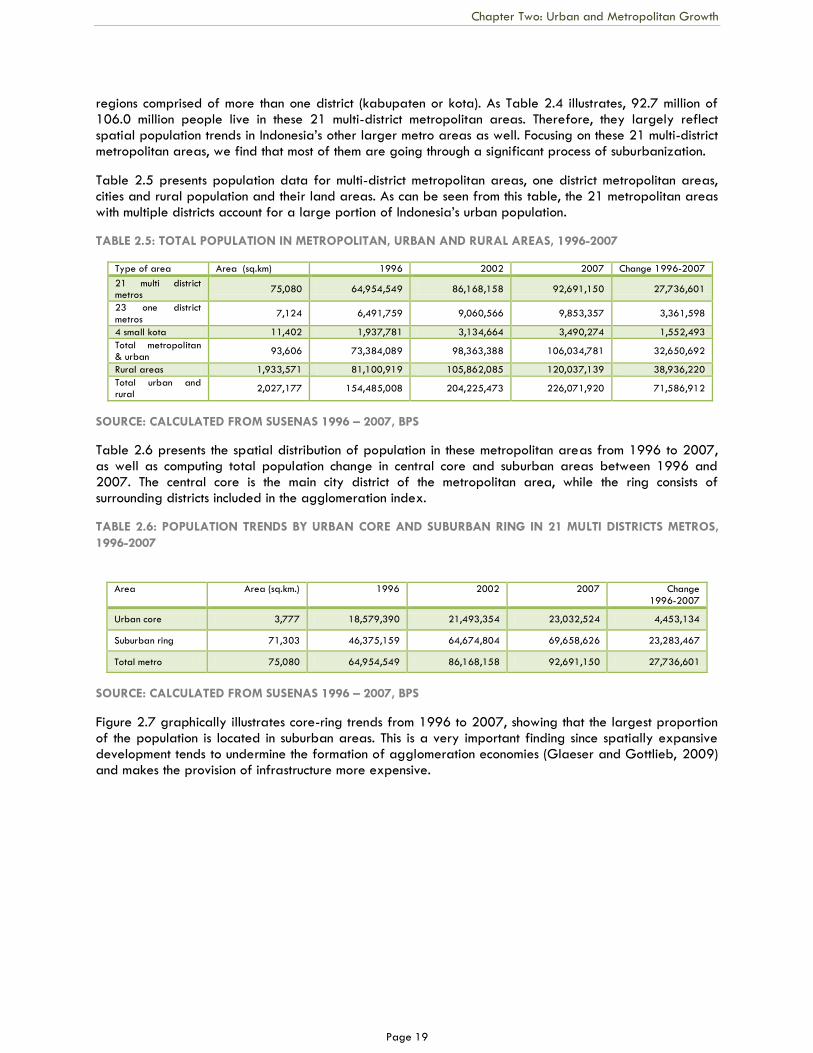
Chapter Two: Urban and Metropolitan Growth
Page 19
regions comprised of more than one district (kabupaten or kota). As Table 2.4 illustrates, 92.7 million of 106.0 million people live in these 21 multi-district metropolitan areas. Therefore, they largely reflect spatial population trends in Indonesia‘s other larger metro areas as well. Focusing on these 21 multi-district metropolitan areas, we find that most of them are going through a significant process of suburbanization.
Table 2.5 presents population data for multi-district metropolitan areas, one district metropolitan areas, cities and rural population and their land areas. As can be seen from this table, the 21 metropolitan areas with multiple districts account for a large portion of Indonesia‘s urban population.
TABLE 2.5: TOTAL POPULATION IN METROPOLITAN, URBAN AND RURAL AREAS, 1996-2007
Type of area Area (sq.km) 1996 2002 2007 Change 1996-2007
21 multi district metros
75,080 64,954,549 86,168,158 92,691,150 27,736,601
23 one district
metros 7,124 6,491,759 9,060,566 9,853,357 3,361,598
4 small kota 11,402 1,937,781 3,134,664 3,490,274 1,552,493
Total metropolitan & urban
93,606 73,384,089 98,363,388 106,034,781 32,650,692
Rural areas 1,933,571 81,100,919 105,862,085 120,037,139 38,936,220
Total urban and rural
2,027,177 154,485,008 204,225,473 226,071,920 71,586,912
SOURCE: CALCULATED FROM SUSENAS 1996 – 2007, BPS
Table 2.6 presents the spatial distribution of population in these metropolitan areas from 1996 to 2007, as well as computing total population change in central core and suburban areas between 1996 and 2007. The central core is the main city district of the metropolitan area, while the ring consists of surrounding districts included in the agglomeration index.
TABLE 2.6: POPULATION TRENDS BY URBAN CORE AND SUBURBAN RING IN 21 MULTI DISTRICTS METROS,
1996-2007
SOURCE: CALCULATED FROM SUSENAS 1996 – 2007, BPS
Figure 2.7 graphically illustrates core-ring trends from 1996 to 2007, showing that the largest proportion of the population is located in suburban areas. This is a very important finding since spatially expansive development tends to undermine the formation of agglomeration economies (Glaeser and Gottlieb, 2009) and makes the provision of infrastructure more expensive.
Area Area (sq.km.) 1996 2002 2007 Change
1996-2007
Urban core 3,777 18,579,390 21,493,354 23,032,524 4,453,134
Suburban ring 71,303 46,375,159 64,674,804 69,658,626 23,283,467
Total metro 75,080 64,954,549 86,168,158 92,691,150 27,736,601
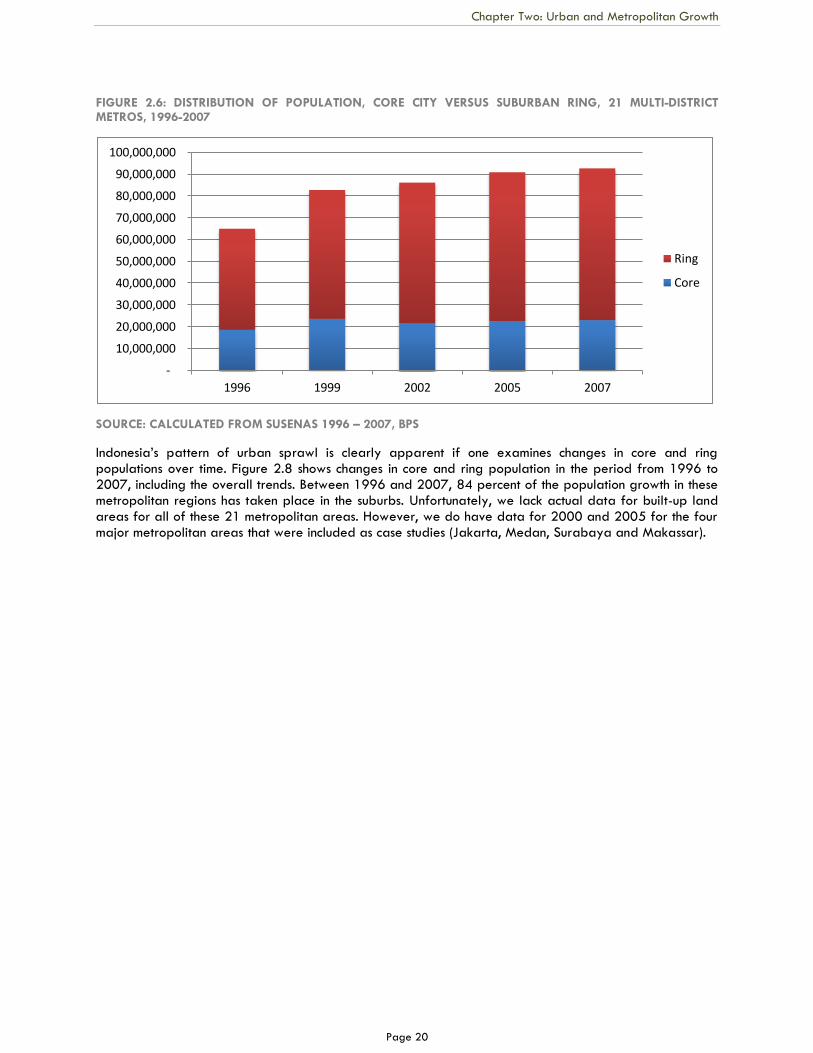
Chapter Two: Urban and Metropolitan Growth
Page 20
FIGURE 2.6: DISTRIBUTION OF POPULATION, CORE CITY VERSUS SUBURBAN RING, 21 MULTI-DISTRICT METROS, 1996-2007
SOURCE: CALCULATED FROM SUSENAS 1996 – 2007, BPS
Indonesia‘s pattern of urban sprawl is clearly apparent if one examines changes in core and ring populations over time. Figure 2.8 shows changes in core and ring population in the period from 1996 to 2007, including the overall trends. Between 1996 and 2007, 84 percent of the population growth in these metropolitan regions has taken place in the suburbs. Unfortunately, we lack actual data for built-up land areas for all of these 21 metropolitan areas. However, we do have data for 2000 and 2005 for the four major metropolitan areas that were included as case studies (Jakarta, Medan, Surabaya and Makassar).
-
10,000,000
20,000,000
30,000,000
40,000,000
50,000,000
60,000,000
70,000,000
80,000,000
90,000,000
100,000,000
1996 1999 2002 2005 2007
Ring
Core
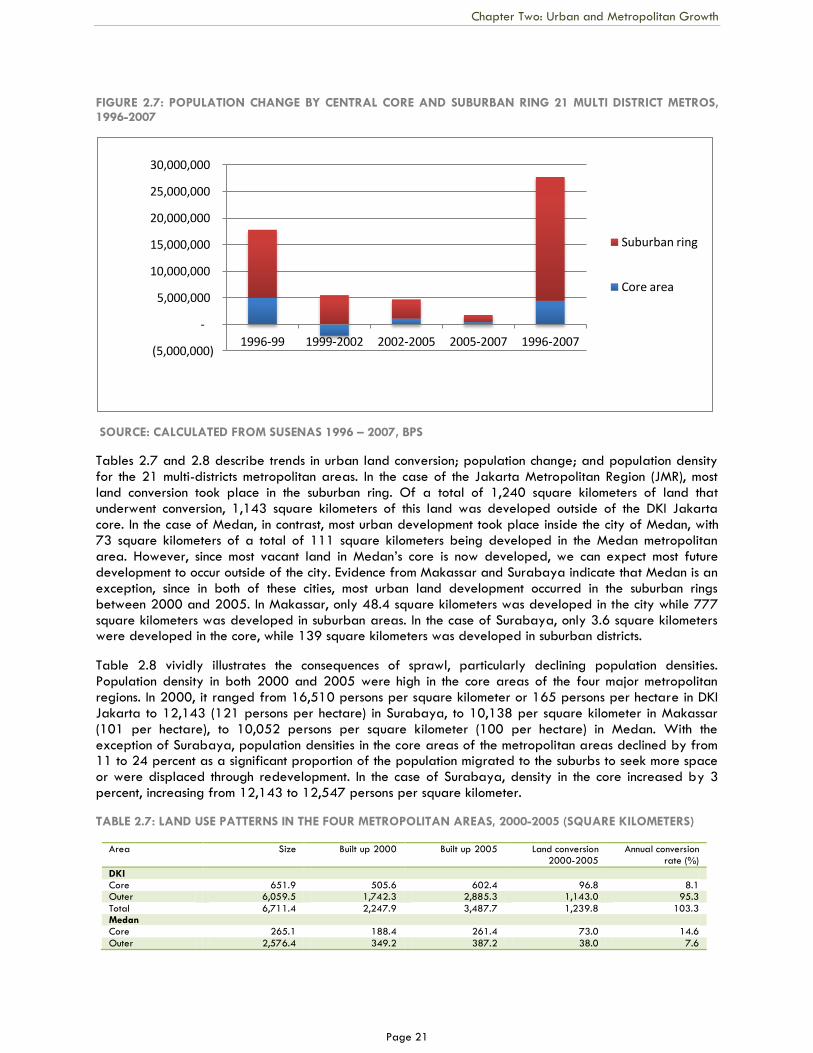
Chapter Two: Urban and Metropolitan Growth
Page 21
FIGURE 2.7: POPULATION CHANGE BY CENTRAL CORE AND SUBURBAN RING 21 MULTI DISTRICT METROS, 1996-2007
SOURCE: CALCULATED FROM SUSENAS 1996 – 2007, BPS
Tables 2.7 and 2.8 describe trends in urban land conversion; population change; and population density for the 21 multi-districts metropolitan areas. In the case of the Jakarta Metropolitan Region (JMR), most land conversion took place in the suburban ring. Of a total of 1,240 square kilometers of land that underwent conversion, 1,143 square kilometers of this land was developed outside of the DKI Jakarta core. In the case of Medan, in contrast, most urban development took place inside the city of Medan, with 73 square kilometers of a total of 111 square kilometers being developed in the Medan metropolitan area. However, since most vacant land in Medan‘s core is now developed, we can expect most future development to occur outside of the city. Evidence from Makassar and Surabaya indicate that Medan is an exception, since in both of these cities, most urban land development occurred in the suburban rings between 2000 and 2005. In Makassar, only 48.4 square kilometers was developed in the city while 777 square kilometers was developed in suburban areas. In the case of Surabaya, only 3.6 square kilometers were developed in the core, while 139 square kilometers was developed in suburban districts.
Table 2.8 vividly illustrates the consequences of sprawl, particularly declining population densities. Population density in both 2000 and 2005 were high in the core areas of the four major metropolitan regions. In 2000, it ranged from 16,510 persons per square kilometer or 165 persons per hectare in DKI Jakarta to 12,143 (121 persons per hectare) in Surabaya, to 10,138 per square kilometer in Makassar (101 per hectare), to 10,052 persons per square kilometer (100 per hectare) in Medan. With the exception of Surabaya, population densities in the core areas of the metropolitan areas declined by from 11 to 24 percent as a significant proportion of the population migrated to the suburbs to seek more space or were displaced through redevelopment. In the case of Surabaya, density in the core increased by 3 percent, increasing from 12,143 to 12,547 persons per square kilometer.
TABLE 2.7: LAND USE PATTERNS IN THE FOUR METROPOLITAN AREAS, 2000-2005 (SQUARE KILOMETERS)
Area Size
Built up 2000 Built up 2005 Land conversion 2000-2005
Annual conversion rate (%)
DKI Core 651.9 505.6 602.4 96.8 8.1 Outer 6,059.5 1,742.3 2,885.3 1,143.0 95.3
Total 6,711.4 2,247.9 3,487.7 1,239.8 103.3 Medan Core 265.1 188.4 261.4 73.0 14.6
Outer 2,576.4 349.2 387.2 38.0 7.6
(5,000,000)
-
5,000,000
10,000,000
15,000,000
20,000,000
25,000,000
30,000,000
1996-99 1999-2002 2002-2005 2005-2007 1996-2007
Suburban ring
Core area
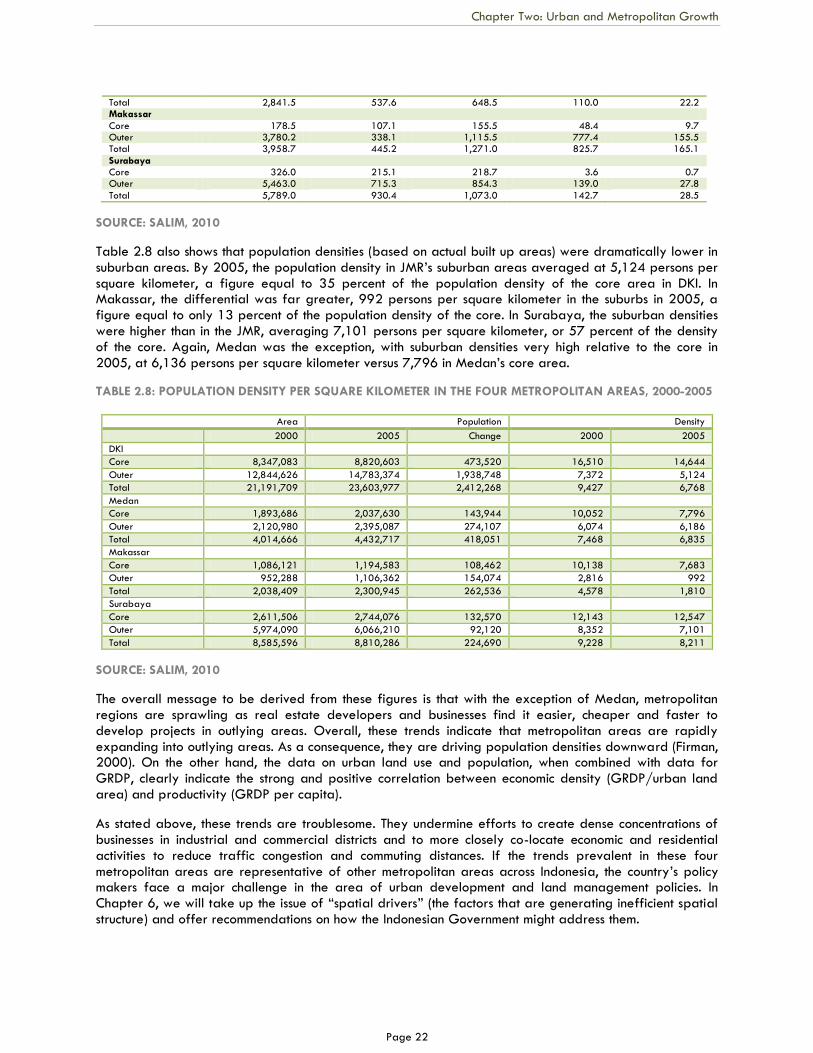
Chapter Two: Urban and Metropolitan Growth
Page 22
Total 2,841.5 537.6 648.5 110.0 22.2 Makassar
Core 178.5 107.1 155.5 48.4 9.7 Outer 3,780.2 338.1 1,115.5 777.4 155.5 Total 3,958.7 445.2 1,271.0 825.7 165.1
Surabaya Core 326.0 215.1 218.7 3.6 0.7 Outer 5,463.0 715.3 854.3 139.0 27.8
Total 5,789.0 930.4 1,073.0 142.7 28.5
SOURCE: SALIM, 2010
Table 2.8 also shows that population densities (based on actual built up areas) were dramatically lower in suburban areas. By 2005, the population density in JMR‘s suburban areas averaged at 5,124 persons per square kilometer, a figure equal to 35 percent of the population density of the core area in DKI. In Makassar, the differential was far greater, 992 persons per square kilometer in the suburbs in 2005, a figure equal to only 13 percent of the population density of the core. In Surabaya, the suburban densities were higher than in the JMR, averaging 7,101 persons per square kilometer, or 57 percent of the density of the core. Again, Medan was the exception, with suburban densities very high relative to the core in 2005, at 6,136 persons per square kilometer versus 7,796 in Medan‘s core area.
TABLE 2.8: POPULATION DENSITY PER SQUARE KILOMETER IN THE FOUR METROPOLITAN AREAS, 2000-2005
Area Population Density
2000 2005 Change 2000 2005
DKI
Core 8,347,083 8,820,603 473,520 16,510 14,644
Outer 12,844,626 14,783,374 1,938,748 7,372 5,124
Total 21,191,709 23,603,977 2,412,268 9,427 6,768
Medan
Core 1,893,686 2,037,630 143,944 10,052 7,796
Outer 2,120,980 2,395,087 274,107 6,074 6,186
Total 4,014,666 4,432,717 418,051 7,468 6,835
Makassar
Core 1,086,121 1,194,583 108,462 10,138 7,683
Outer 952,288 1,106,362 154,074 2,816 992
Total 2,038,409 2,300,945 262,536 4,578 1,810
Surabaya
Core 2,611,506 2,744,076 132,570 12,143 12,547
Outer 5,974,090 6,066,210 92,120 8,352 7,101
Total 8,585,596 8,810,286 224,690 9,228 8,211
SOURCE: SALIM, 2010
The overall message to be derived from these figures is that with the exception of Medan, metropolitan regions are sprawling as real estate developers and businesses find it easier, cheaper and faster to develop projects in outlying areas. Overall, these trends indicate that metropolitan areas are rapidly expanding into outlying areas. As a consequence, they are driving population densities downward (Firman, 2000). On the other hand, the data on urban land use and population, when combined with data for GRDP, clearly indicate the strong and positive correlation between economic density (GRDP/urban land area) and productivity (GRDP per capita).
As stated above, these trends are troublesome. They undermine efforts to create dense concentrations of businesses in industrial and commercial districts and to more closely co-locate economic and residential activities to reduce traffic congestion and commuting distances. If the trends prevalent in these four metropolitan areas are representative of other metropolitan areas across Indonesia, the country‘s policy makers face a major challenge in the area of urban development and land management policies. In Chapter 6, we will take up the issue of ―spatial drivers‖ (the factors that are generating inefficient spatial structure) and offer recommendations on how the Indonesian Government might address them.
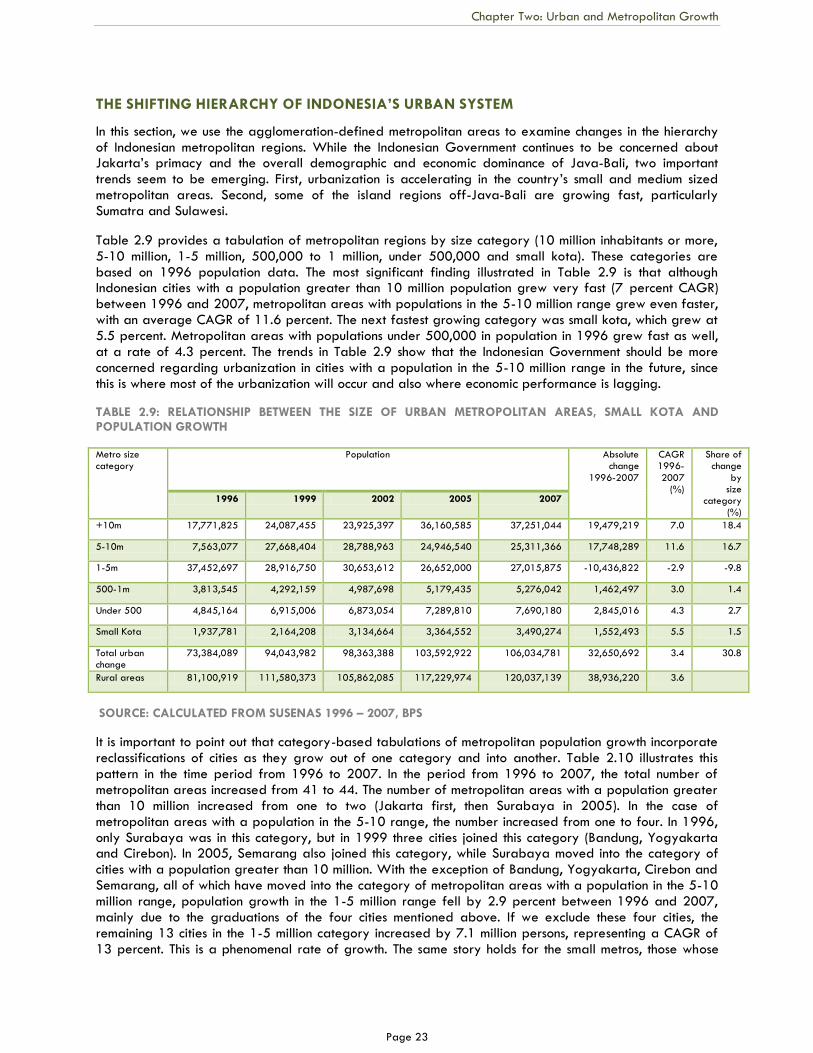
Chapter Two: Urban and Metropolitan Growth
Page 23
THE SHIFTING HIERARCHY OF INDONESIA’S URBAN SYSTEM
In this section, we use the agglomeration-defined metropolitan areas to examine changes in the hierarchy of Indonesian metropolitan regions. While the Indonesian Government continues to be concerned about Jakarta‘s primacy and the overall demographic and economic dominance of Java-Bali, two important trends seem to be emerging. First, urbanization is accelerating in the country‘s small and medium sized metropolitan areas. Second, some of the island regions off-Java-Bali are growing fast, particularly Sumatra and Sulawesi.
Table 2.9 provides a tabulation of metropolitan regions by size category (10 million inhabitants or more, 5-10 million, 1-5 million, 500,000 to 1 million, under 500,000 and small kota). These categories are based on 1996 population data. The most significant finding illustrated in Table 2.9 is that although Indonesian cities with a population greater than 10 million population grew very fast (7 percent CAGR) between 1996 and 2007, metropolitan areas with populations in the 5-10 million range grew even faster, with an average CAGR of 11.6 percent. The next fastest growing category was small kota, which grew at 5.5 percent. Metropolitan areas with populations under 500,000 in population in 1996 grew fast as well, at a rate of 4.3 percent. The trends in Table 2.9 show that the Indonesian Government should be more concerned regarding urbanization in cities with a population in the 5-10 million range in the future, since this is where most of the urbanization will occur and also where economic performance is lagging.
TABLE 2.9: RELATIONSHIP BETWEEN THE SIZE OF URBAN METROPOLITAN AREAS, SMALL KOTA AND POPULATION GROWTH
Metro size category
Population Absolute change
1996-2007
CAGR 1996-
2007 (%)
Share of change
by size
category (%)
1996 1999 2002 2005 2007
+10m 17,771,825 24,087,455 23,925,397 36,160,585 37,251,044 19,479,219 7.0 18.4
5-10m 7,563,077 27,668,404 28,788,963 24,946,540 25,311,366 17,748,289 11.6 16.7
1-5m 37,452,697 28,916,750 30,653,612 26,652,000 27,015,875 -10,436,822 -2.9 -9.8
500-1m 3,813,545 4,292,159 4,987,698 5,179,435 5,276,042 1,462,497 3.0 1.4
Under 500 4,845,164 6,915,006 6,873,054 7,289,810 7,690,180 2,845,016 4.3 2.7
Small Kota 1,937,781 2,164,208 3,134,664 3,364,552 3,490,274 1,552,493 5.5 1.5
Total urban change
73,384,089 94,043,982 98,363,388 103,592,922 106,034,781 32,650,692 3.4 30.8
Rural areas 81,100,919 111,580,373 105,862,085 117,229,974 120,037,139 38,936,220 3.6
SOURCE: CALCULATED FROM SUSENAS 1996 – 2007, BPS
It is important to point out that category-based tabulations of metropolitan population growth incorporate reclassifications of cities as they grow out of one category and into another. Table 2.10 illustrates this pattern in the time period from 1996 to 2007. In the period from 1996 to 2007, the total number of metropolitan areas increased from 41 to 44. The number of metropolitan areas with a population greater than 10 million increased from one to two (Jakarta first, then Surabaya in 2005). In the case of metropolitan areas with a population in the 5-10 range, the number increased from one to four. In 1996, only Surabaya was in this category, but in 1999 three cities joined this category (Bandung, Yogyakarta and Cirebon). In 2005, Semarang also joined this category, while Surabaya moved into the category of cities with a population greater than 10 million. With the exception of Bandung, Yogyakarta, Cirebon and Semarang, all of which have moved into the category of metropolitan areas with a population in the 5-10 million range, population growth in the 1-5 million range fell by 2.9 percent between 1996 and 2007, mainly due to the graduations of the four cities mentioned above. If we exclude these four cities, the remaining 13 cities in the 1-5 million category increased by 7.1 million persons, representing a CAGR of 13 percent. This is a phenomenal rate of growth. The same story holds for the small metros, those whose
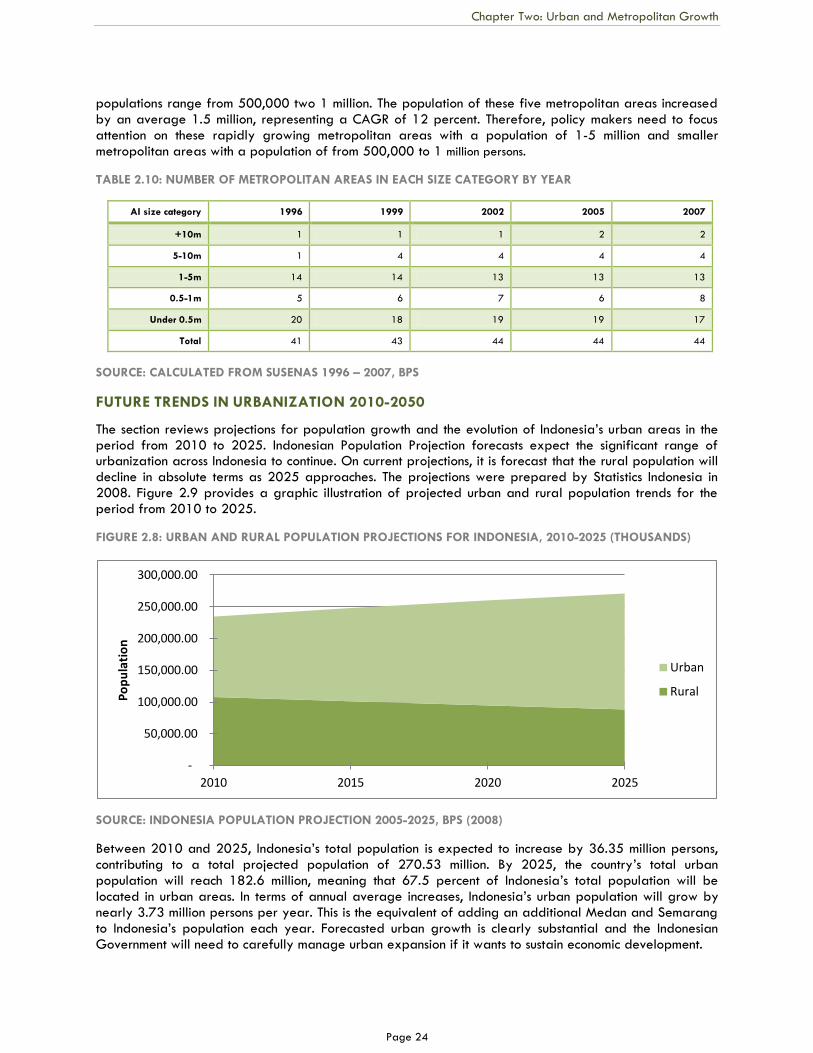
Chapter Two: Urban and Metropolitan Growth
Page 24
populations range from 500,000 two 1 million. The population of these five metropolitan areas increased by an average 1.5 million, representing a CAGR of 12 percent. Therefore, policy makers need to focus attention on these rapidly growing metropolitan areas with a population of 1-5 million and smaller metropolitan areas with a population of from 500,000 to 1 million persons.
TABLE 2.10: NUMBER OF METROPOLITAN AREAS IN EACH SIZE CATEGORY BY YEAR
AI size category 1996 1999 2002 2005 2007
+10m 1 1 1 2 2
5-10m 1 4 4 4 4
1-5m 14 14 13 13 13
0.5-1m 5 6 7 6 8
Under 0.5m 20 18 19 19 17
Total 41 43 44 44 44
SOURCE: CALCULATED FROM SUSENAS 1996 – 2007, BPS
FUTURE TRENDS IN URBANIZATION 2010-2050
The section reviews projections for population growth and the evolution of Indonesia‘s urban areas in the period from 2010 to 2025. Indonesian Population Projection forecasts expect the significant range of urbanization across Indonesia to continue. On current projections, it is forecast that the rural population will decline in absolute terms as 2025 approaches. The projections were prepared by Statistics Indonesia in 2008. Figure 2.9 provides a graphic illustration of projected urban and rural population trends for the period from 2010 to 2025.
FIGURE 2.8: URBAN AND RURAL POPULATION PROJECTIONS FOR INDONESIA, 2010-2025 (THOUSANDS)
SOURCE: INDONESIA POPULATION PROJECTION 2005-2025, BPS (2008)
Between 2010 and 2025, Indonesia‘s total population is expected to increase by 36.35 million persons, contributing to a total projected population of 270.53 million. By 2025, the country‘s total urban population will reach 182.6 million, meaning that 67.5 percent of Indonesia‘s total population will be located in urban areas. In terms of annual average increases, Indonesia‘s urban population will grow by nearly 3.73 million persons per year. This is the equivalent of adding an additional Medan and Semarang to Indonesia‘s population each year. Forecasted urban growth is clearly substantial and the Indonesian Government will need to carefully manage urban expansion if it wants to sustain economic development.
-
50,000.00
100,000.00
150,000.00
200,000.00
250,000.00
300,000.00
2010 2015 2020 2025
Po
pu
lati
on
Urban
Rural

Chapter Two: Urban and Metropolitan Growth
Page 25
An important question relates to where these 3.7 million people will locate. Over the years, Jakarta has served as the country‘s unquestioned prime city and the location of choice for the vast majority of migrants from rural areas. However, the population is increasing in other urban centers as well, thereby relieving some pressure on Jakarta. For example, Jakarta‘s CAGR has consistently declined in the period from 1985 to 2000, falling from 4.5 to 0.2 percent per year. In the period from 2000 to 2005, Jakarta‘s growth rate increased to 0.9 percent, but this has fallen back to 0.7 percent during the period from 2005 to 2010. However, since the Jakarta figures are for DKI and not the surrounding urban areas, including Bogor, Bekasi, Depok and Tangerang, the metropolitan area‘s population growth has been larger in absolute terms and in terms of proportion as the city suburbanizes.
TABLE 2.11: UNITED NATION’S POPULATION PROJECTIONS OF INDONESIA’S 11 LARGEST CITIES, 2010-2025
(THOUSANDS)
City 2010 2015 2020 2025 CAGR 2010-2025 (%)
Absolute annual increase
Jakarta 9,210 9,709 10,256 10,850 1.1 109
Surabaya 2,509 2,576 2,738 2,923 1.0 28
Bandung 2,412 2,568 2,739 2,925 1.3 34
Medan 2,131 2,266 2,419 2,586 1.3 30
Semarang 1,296 1,334 1,424 1,528 1.1 15
Makassar 1,294 1,409 1,512 1,621 1.5 22
Palembang 1,244 1,271 1,356 1,456 1.1 14
Bogor 1,044 1,162 1,251 1,344 1.7 20
Bandar Lampung
799 842 903 972 1.3 12
Malang 786 830 891 959 1.3 12
Pekan Baru 769 834 898 967 1.5 13
Total 23,494 24,801 26,387 28,131 1.2 309
SOURCE: UNITED NATIONS WORLD URBANIZATION PROSPECTS: THE 2009 REVISION, 2009
Table 2.11 provides United Nations‘ estimates of the population growth of 11 large cities between 2010 and 2025. Projected annual rates of population growth pose significant challenges to urban policy makers across Indonesia. Despite the fact that Jakarta is the slowest growing in percentage terms, it will account for more than one third of the total urban population increase, contributing 109,000 persons per year. The challenges will be even greater in smaller and medium sized cities. In the period from 2010 to 2025, the 11 largest cities will see their populations grow from 23.5 million to 28.1 million, representing a total increase of 4.6 million persons, or approximately 309,000 per year. At the national level, in the period from 2010 to 2025, Indonesia‘s urban population will increase by 30.5 million persons. This means that only 15.2 percent of Indonesian‘s urban population increase will occur in the 11 largest cities, while nearly 85 percent of urban population growth will occur in cities with populations under 750,000 population in 2010. Consequently, small and medium sized cities will absorb 25.8 million persons between 2010 and 2025, amounting to a total of 1.7 million persons per year. Most of the urban population growth will take place in these small and medium sized cities.
CONCLUSION
Indonesia is urbanizing rapidly. This trend will continue into the next decade. Currently, Indonesia has the largest share of urban population and the fastest rate of growth in the proportion of its population in urban areas in Asia. This presents some challenges for governments, including challenges related to the provision of basic services to the increasing number of urban residents; job creation; urban poverty eradication; spatial planning and coordination; and various others.
Larger cities are generally more economically productive than smaller cities and rural areas due to agglomeration economy, the condition where businesses benefit from close proximity to other businesses in the same sector, enabling them to produce goods and services at lower costs. To analyze the presence of agglomeration effects, we use the Agglomeration Index method and control for size of the metropolitan
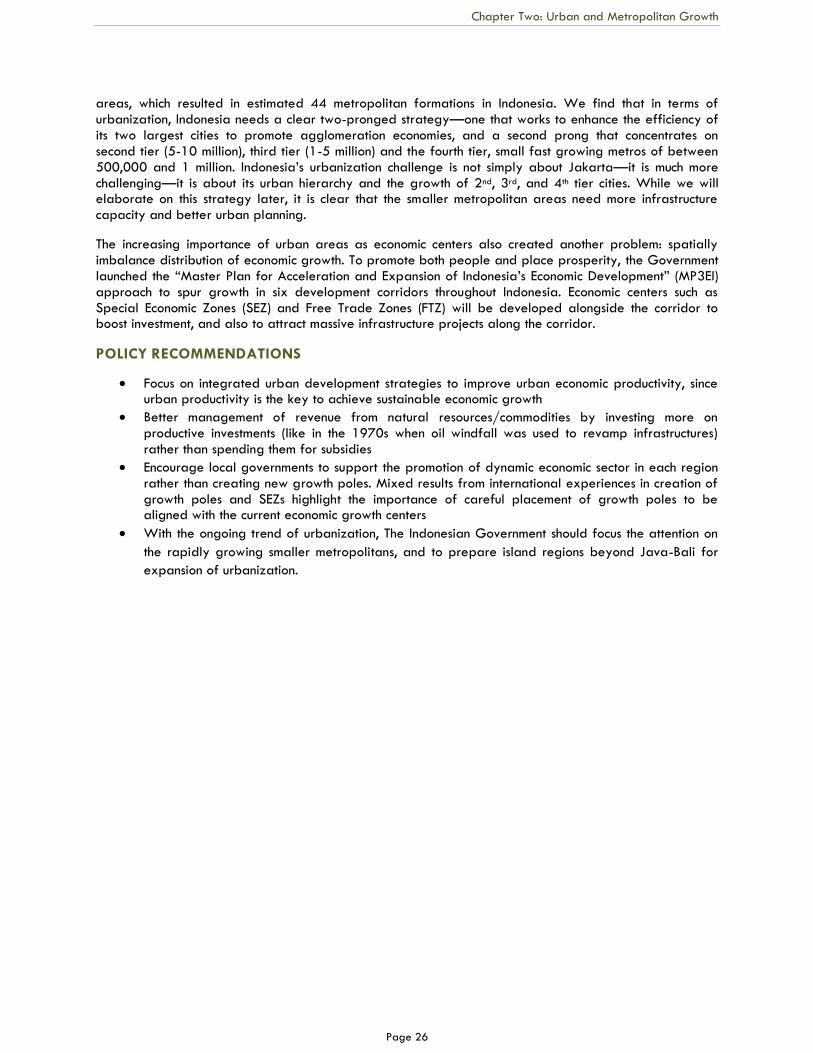
Chapter Two: Urban and Metropolitan Growth
Page 26
areas, which resulted in estimated 44 metropolitan formations in Indonesia. We find that in terms of urbanization, Indonesia needs a clear two-pronged strategy—one that works to enhance the efficiency of its two largest cities to promote agglomeration economies, and a second prong that concentrates on second tier (5-10 million), third tier (1-5 million) and the fourth tier, small fast growing metros of between 500,000 and 1 million. Indonesia‘s urbanization challenge is not simply about Jakarta—it is much more challenging—it is about its urban hierarchy and the growth of 2nd, 3rd, and 4th tier cities. While we will elaborate on this strategy later, it is clear that the smaller metropolitan areas need more infrastructure capacity and better urban planning.
The increasing importance of urban areas as economic centers also created another problem: spatially imbalance distribution of economic growth. To promote both people and place prosperity, the Government launched the ―Master Plan for Acceleration and Expansion of Indonesia‘s Economic Development‖ (MP3EI) approach to spur growth in six development corridors throughout Indonesia. Economic centers such as Special Economic Zones (SEZ) and Free Trade Zones (FTZ) will be developed alongside the corridor to boost investment, and also to attract massive infrastructure projects along the corridor.
POLICY RECOMMENDATIONS
Focus on integrated urban development strategies to improve urban economic productivity, since urban productivity is the key to achieve sustainable economic growth
Better management of revenue from natural resources/commodities by investing more on productive investments (like in the 1970s when oil windfall was used to revamp infrastructures) rather than spending them for subsidies
Encourage local governments to support the promotion of dynamic economic sector in each region rather than creating new growth poles. Mixed results from international experiences in creation of growth poles and SEZs highlight the importance of careful placement of growth poles to be aligned with the current economic growth centers
With the ongoing trend of urbanization, The Indonesian Government should focus the attention on
the rapidly growing smaller metropolitans, and to prepare island regions beyond Java-Bali for
expansion of urbanization.
Page 27
CHAPTER 3 LEVERAGING URBANIZATION AND
AGGLOMERATION Building on the demographic analysis presented in Chapter 2 (―Urbanization and Metropolitan Growth‖), this chapter reviews trends in urban development in Indonesia in the period from 1993 to 2007. Working with time series data, we assess trends at the national, island, and urban and rural levels. In Chapter 4 (―Economic Performance of Metropolitan Regions‖), we will deepen the analysis and explore the relationship between productivity growth and metropolitan characteristics.
Indonesia has an important opportunity to take advantage of the country‘s rapid urbanization to encourage economic productivity. As we suggested in Chapter 2, urbanization is normally associated with increases in output and productivity. These increases are normally the result of 1) the formation of urban agglomeration economies (increases in productivity associated with larger bases of economic activity in general), which are usually referred to as urbanization economies; and of 2) increases in economic activity within specific industrial sectors, usually referred to as localization economies. It is important to state at the outset that compared to other Asian countries, Indonesia has not leveraged the benefits of urbanization to achieve increases in economic productivity as well as other countries. This and the next chapter examine economic performance in Indonesia in the period from 1993 to 2007. We contend that Indonesia has not successfully leveraged urban population growth to bring about agglomeration economies. In addition, it has not achieved increases in economic productivity that are proportional to increases in population. However, we also argue that some of Indonesia‘s metropolitan regions have been relatively successful at generating returns on agglomeration and that other regions can learn from the experiences of these regions.
URBANIZATION AND ECONOMIC DEVELOPMENT GO HAND IN HAND
As shown in Figure 3.1, empirical evidence showing a cross sectional performance of low, medium and high income countries clearly shows that countries do not industrialize without urbanizing.
As discussed in Chapter 1 (―Overview and Methodology‖), spatially concentrated urbanization and economic development go hand-in-hand. High levels of population density and efficient, low cost access to factor inputs have allowed economies to transform from primarily agrarian to industrial and to service activities. Sub-national regions that can manage the rural to urban transition successfully are able to rapidly grow their economies; to increase incomes; and to raise living standards. Those that cannot do so tend to lag economically and socially. These uneven patterns of economic development have raised policy dilemmas for governments for decades.
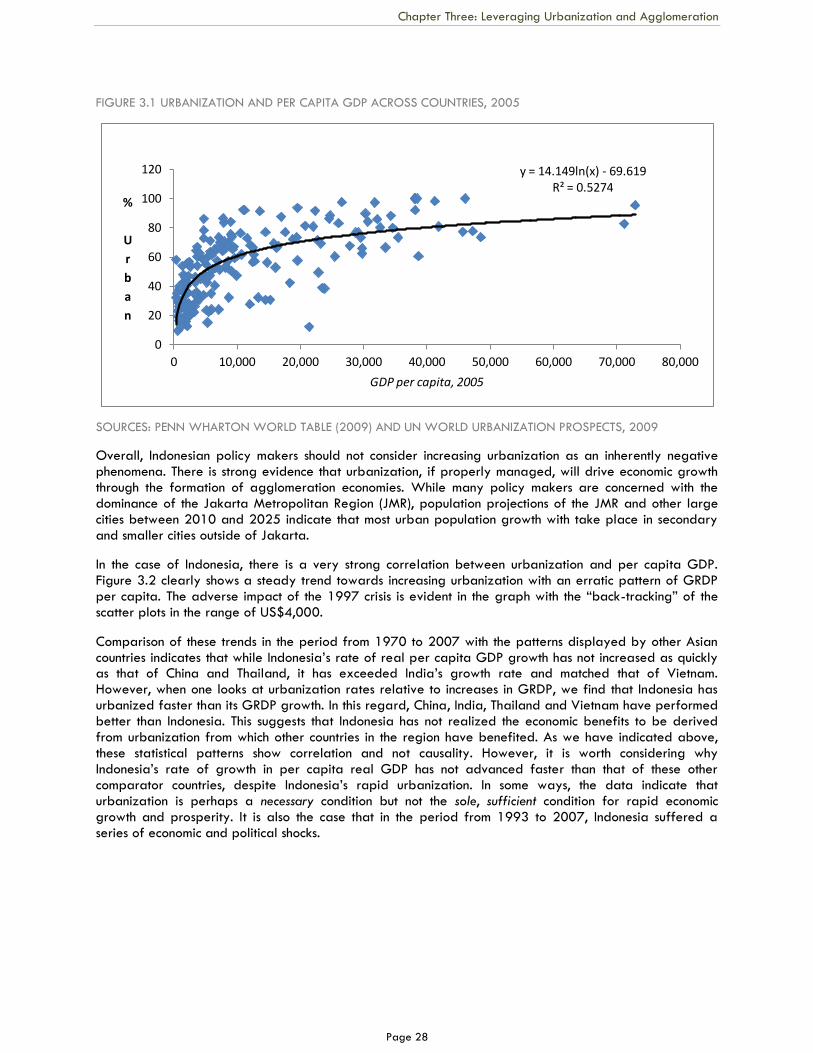
Chapter Three: Leveraging Urbanization and Agglomeration
Page 28
FIGURE 3.1 URBANIZATION AND PER CAPITA GDP ACROSS COUNTRIES, 2005
SOURCES: PENN WHARTON WORLD TABLE (2009) AND UN WORLD URBANIZATION PROSPECTS, 2009
Overall, Indonesian policy makers should not consider increasing urbanization as an inherently negative phenomena. There is strong evidence that urbanization, if properly managed, will drive economic growth through the formation of agglomeration economies. While many policy makers are concerned with the dominance of the Jakarta Metropolitan Region (JMR), population projections of the JMR and other large cities between 2010 and 2025 indicate that most urban population growth with take place in secondary and smaller cities outside of Jakarta.
In the case of Indonesia, there is a very strong correlation between urbanization and per capita GDP. Figure 3.2 clearly shows a steady trend towards increasing urbanization with an erratic pattern of GRDP per capita. The adverse impact of the 1997 crisis is evident in the graph with the ―back-tracking‖ of the scatter plots in the range of US$4,000.
Comparison of these trends in the period from 1970 to 2007 with the patterns displayed by other Asian countries indicates that while Indonesia‘s rate of real per capita GDP growth has not increased as quickly as that of China and Thailand, it has exceeded India‘s growth rate and matched that of Vietnam. However, when one looks at urbanization rates relative to increases in GRDP, we find that Indonesia has urbanized faster than its GRDP growth. In this regard, China, India, Thailand and Vietnam have performed better than Indonesia. This suggests that Indonesia has not realized the economic benefits to be derived from urbanization from which other countries in the region have benefited. As we have indicated above, these statistical patterns show correlation and not causality. However, it is worth considering why Indonesia‘s rate of growth in per capita real GDP has not advanced faster than that of these other comparator countries, despite Indonesia‘s rapid urbanization. In some ways, the data indicate that urbanization is perhaps a necessary condition but not the sole, sufficient condition for rapid economic growth and prosperity. It is also the case that in the period from 1993 to 2007, Indonesia suffered a series of economic and political shocks.
y = 14.149ln(x) - 69.619 R² = 0.5274
0
20
40
60
80
100
120
0 10,000 20,000 30,000 40,000 50,000 60,000 70,000 80,000
%
U
r
b
a
n
GDP per capita, 2005
Urbanization and per capita GDP across countries, 2005
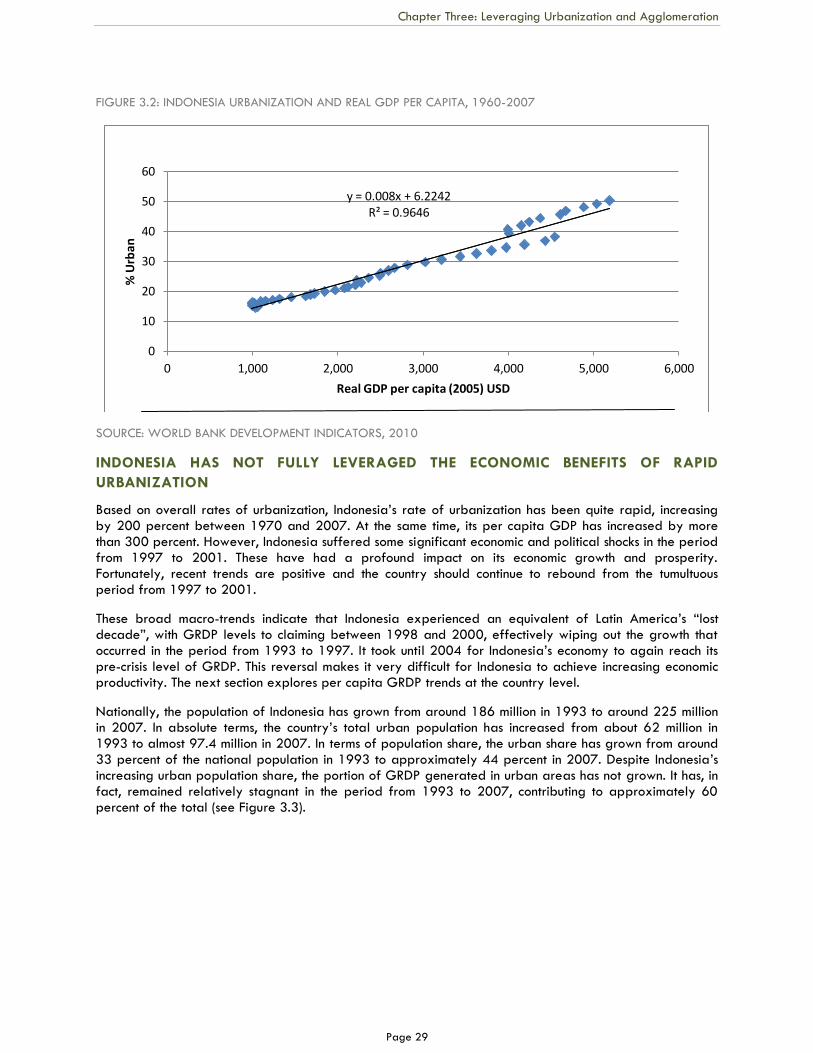
Chapter Three: Leveraging Urbanization and Agglomeration
Page 29
FIGURE 3.2: INDONESIA URBANIZATION AND REAL GDP PER CAPITA, 1960-2007
SOURCE: WORLD BANK DEVELOPMENT INDICATORS, 2010
INDONESIA HAS NOT FULLY LEVERAGED THE ECONOMIC BENEFITS OF RAPID
URBANIZATION
Based on overall rates of urbanization, Indonesia‘s rate of urbanization has been quite rapid, increasing by 200 percent between 1970 and 2007. At the same time, its per capita GDP has increased by more than 300 percent. However, Indonesia suffered some significant economic and political shocks in the period from 1997 to 2001. These have had a profound impact on its economic growth and prosperity. Fortunately, recent trends are positive and the country should continue to rebound from the tumultuous period from 1997 to 2001.
These broad macro-trends indicate that Indonesia experienced an equivalent of Latin America‘s ―lost decade‖, with GRDP levels to claiming between 1998 and 2000, effectively wiping out the growth that occurred in the period from 1993 to 1997. It took until 2004 for Indonesia‘s economy to again reach its pre-crisis level of GRDP. This reversal makes it very difficult for Indonesia to achieve increasing economic productivity. The next section explores per capita GRDP trends at the country level.
Nationally, the population of Indonesia has grown from around 186 million in 1993 to around 225 million in 2007. In absolute terms, the country‘s total urban population has increased from about 62 million in 1993 to almost 97.4 million in 2007. In terms of population share, the urban share has grown from around 33 percent of the national population in 1993 to approximately 44 percent in 2007. Despite Indonesia‘s increasing urban population share, the portion of GRDP generated in urban areas has not grown. It has, in fact, remained relatively stagnant in the period from 1993 to 2007, contributing to approximately 60 percent of the total (see Figure 3.3).
y = 0.008x + 6.2242 R² = 0.9646
0
10
20
30
40
50
60
0 1,000 2,000 3,000 4,000 5,000 6,000
% U
rban
Real GDP per capita (2005) USD
Urbanization and per capita real GDP, 1960-2007, Indonesia
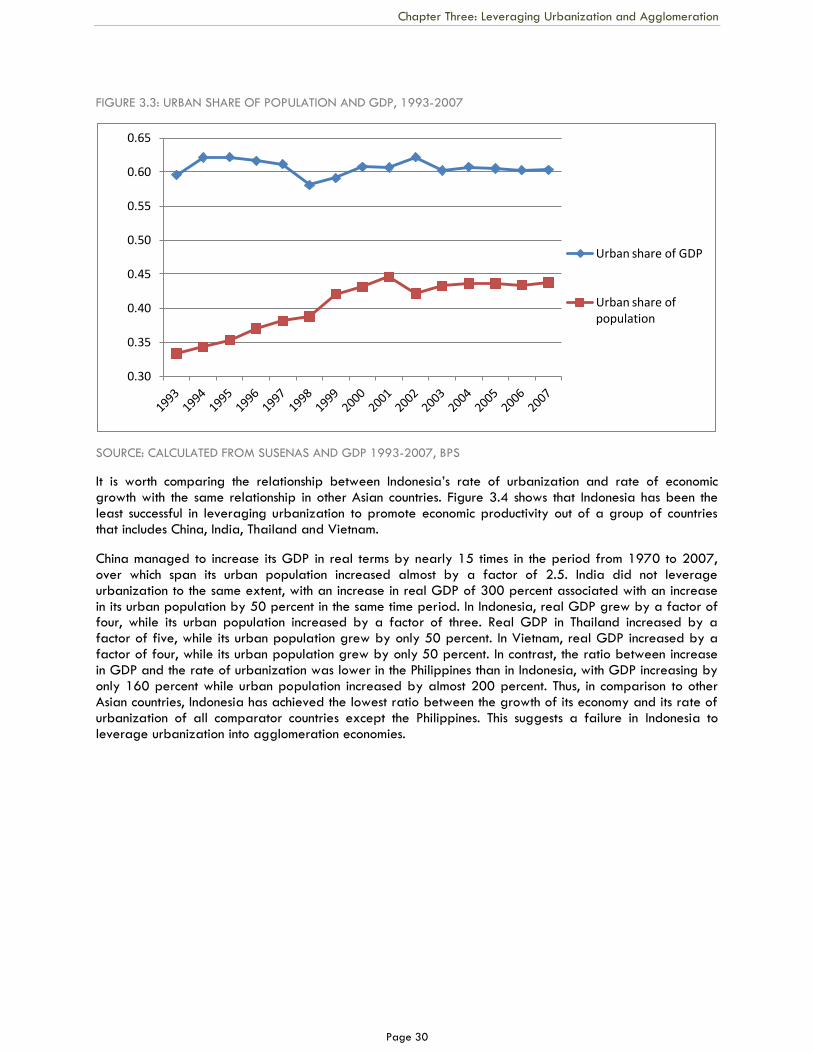
Chapter Three: Leveraging Urbanization and Agglomeration
Page 30
FIGURE 3.3: URBAN SHARE OF POPULATION AND GDP, 1993-2007
SOURCE: CALCULATED FROM SUSENAS AND GDP 1993-2007, BPS
It is worth comparing the relationship between Indonesia‘s rate of urbanization and rate of economic growth with the same relationship in other Asian countries. Figure 3.4 shows that Indonesia has been the least successful in leveraging urbanization to promote economic productivity out of a group of countries that includes China, India, Thailand and Vietnam.
China managed to increase its GDP in real terms by nearly 15 times in the period from 1970 to 2007, over which span its urban population increased almost by a factor of 2.5. India did not leverage urbanization to the same extent, with an increase in real GDP of 300 percent associated with an increase in its urban population by 50 percent in the same time period. In Indonesia, real GDP grew by a factor of four, while its urban population increased by a factor of three. Real GDP in Thailand increased by a factor of five, while its urban population grew by only 50 percent. In Vietnam, real GDP increased by a factor of four, while its urban population grew by only 50 percent. In contrast, the ratio between increase in GDP and the rate of urbanization was lower in the Philippines than in Indonesia, with GDP increasing by only 160 percent while urban population increased by almost 200 percent. Thus, in comparison to other Asian countries, Indonesia has achieved the lowest ratio between the growth of its economy and its rate of urbanization of all comparator countries except the Philippines. This suggests a failure in Indonesia to leverage urbanization into agglomeration economies.
0.30
0.35
0.40
0.45
0.50
0.55
0.60
0.65
Urban share of GDP
Urban share of population
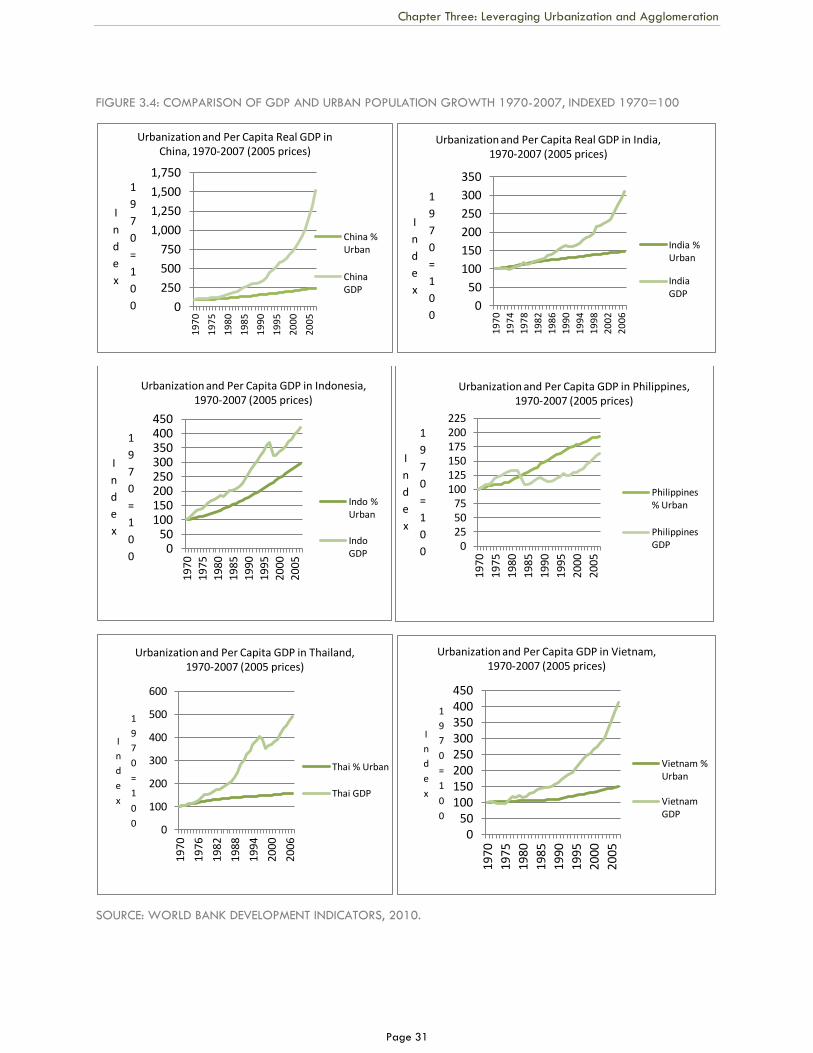
Chapter Three: Leveraging Urbanization and Agglomeration
Page 31
FIGURE 3.4: COMPARISON OF GDP AND URBAN POPULATION GROWTH 1970-2007, INDEXED 1970=100
SOURCE: WORLD BANK DEVELOPMENT INDICATORS, 2010.
0
250
500
750
1,000
1,250
1,500
1,750
19
70
19
75
19
80
19
85
19
90
19
95
20
00
20
05
I
n
d
e
x
1
9
7
0
=
1
0
0
Urbanization and Per Capita Real GDP in China, 1970-2007 (2005 prices)
China % Urban
China GDP
0
50
100
150
200
250
300
350
19
70
19
74
19
78
19
82
19
86
19
90
19
94
19
98
20
02
20
06
I
n
d
e
x
1
9
7
0
=
1
0
0
Urbanization and Per Capita Real GDP in India, 1970-2007 (2005 prices)
India % Urban
India GDP
0 50
100 150 200 250 300 350 400 450
19
70
1975
19
80
19
85
19
90
19
95
20
00
20
05
I
n
d
e
x
1
9
7
0
=
1
0
0
Urbanization and Per Capita GDP in Indonesia, 1970-2007 (2005 prices)
Indo % Urban
Indo GDP
0 25 50 75
100 125 150 175 200 225
19
70
19
75
19
80
19
85
19
90
19
95
2000
20
05
I
n
d
e
x
1
9
7
0
=
1
0
0
Urbanization and Per Capita GDP in Philippines, 1970-2007 (2005 prices)
Philippines % Urban
Philippines GDP
0
100
200
300
400
500
600
197
0
197
6
1982
198
8
1994
200
0
200
6
I
n
d
e
x
1
9
7
0
=
1
0
0
Urbanization and Per Capita GDP in Thailand, 1970-2007 (2005 prices)
Thai % Urban
Thai GDP
0 50
100 150 200 250 300 350 400 450
1970
1975
1980
1985
1990
1995
2000
2005
I
n
d
e
x
1
9
7
0
=
1
0
0
Urbanization and Per Capita GDP in Vietnam, 1970-2007 (2005 prices)
Vietnam % Urban
Vietnam GDP
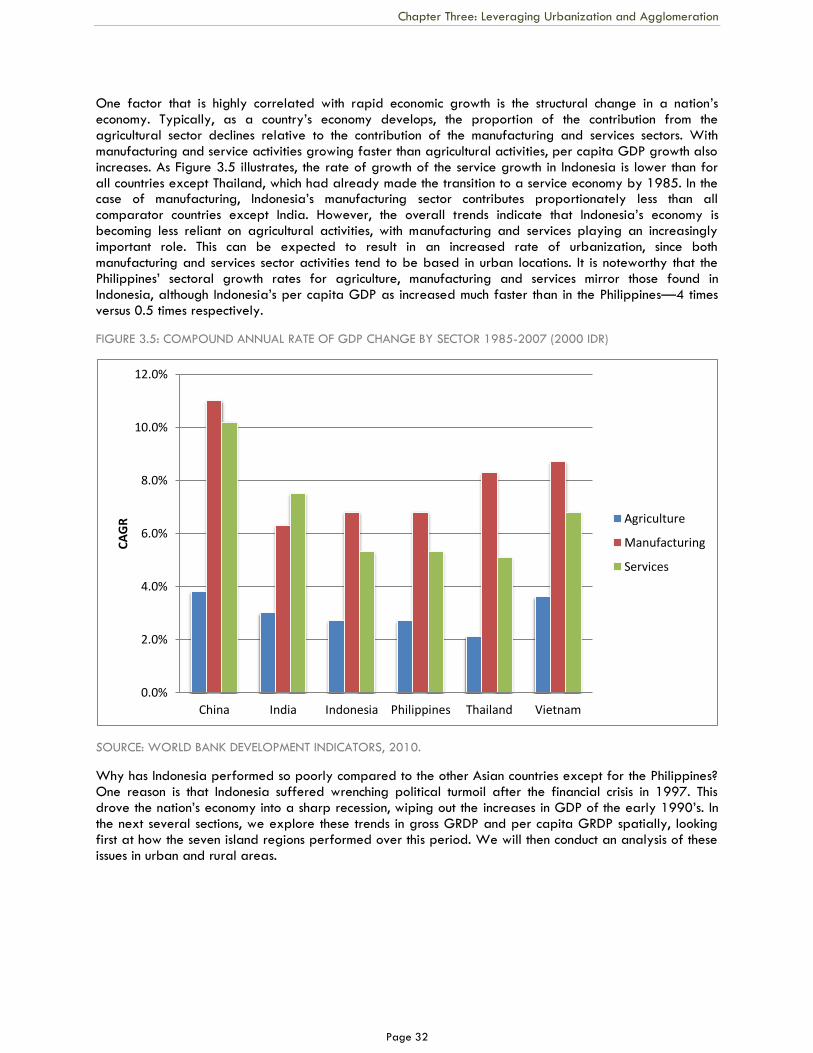
Chapter Three: Leveraging Urbanization and Agglomeration
Page 32
One factor that is highly correlated with rapid economic growth is the structural change in a nation‘s economy. Typically, as a country‘s economy develops, the proportion of the contribution from the agricultural sector declines relative to the contribution of the manufacturing and services sectors. With manufacturing and service activities growing faster than agricultural activities, per capita GDP growth also increases. As Figure 3.5 illustrates, the rate of growth of the service growth in Indonesia is lower than for all countries except Thailand, which had already made the transition to a service economy by 1985. In the case of manufacturing, Indonesia‘s manufacturing sector contributes proportionately less than all comparator countries except India. However, the overall trends indicate that Indonesia‘s economy is becoming less reliant on agricultural activities, with manufacturing and services playing an increasingly important role. This can be expected to result in an increased rate of urbanization, since both manufacturing and services sector activities tend to be based in urban locations. It is noteworthy that the Philippines‘ sectoral growth rates for agriculture, manufacturing and services mirror those found in Indonesia, although Indonesia‘s per capita GDP as increased much faster than in the Philippines—4 times versus 0.5 times respectively.
FIGURE 3.5: COMPOUND ANNUAL RATE OF GDP CHANGE BY SECTOR 1985-2007 (2000 IDR)
SOURCE: WORLD BANK DEVELOPMENT INDICATORS, 2010.
Why has Indonesia performed so poorly compared to the other Asian countries except for the Philippines? One reason is that Indonesia suffered wrenching political turmoil after the financial crisis in 1997. This drove the nation‘s economy into a sharp recession, wiping out the increases in GDP of the early 1990‘s. In the next several sections, we explore these trends in gross GRDP and per capita GRDP spatially, looking first at how the seven island regions performed over this period. We will then conduct an analysis of these issues in urban and rural areas.
0.0%
2.0%
4.0%
6.0%
8.0%
10.0%
12.0%
China India Indonesia Philippines Thailand Vietnam
CA
GR
Agriculture
Manufacturing
Services
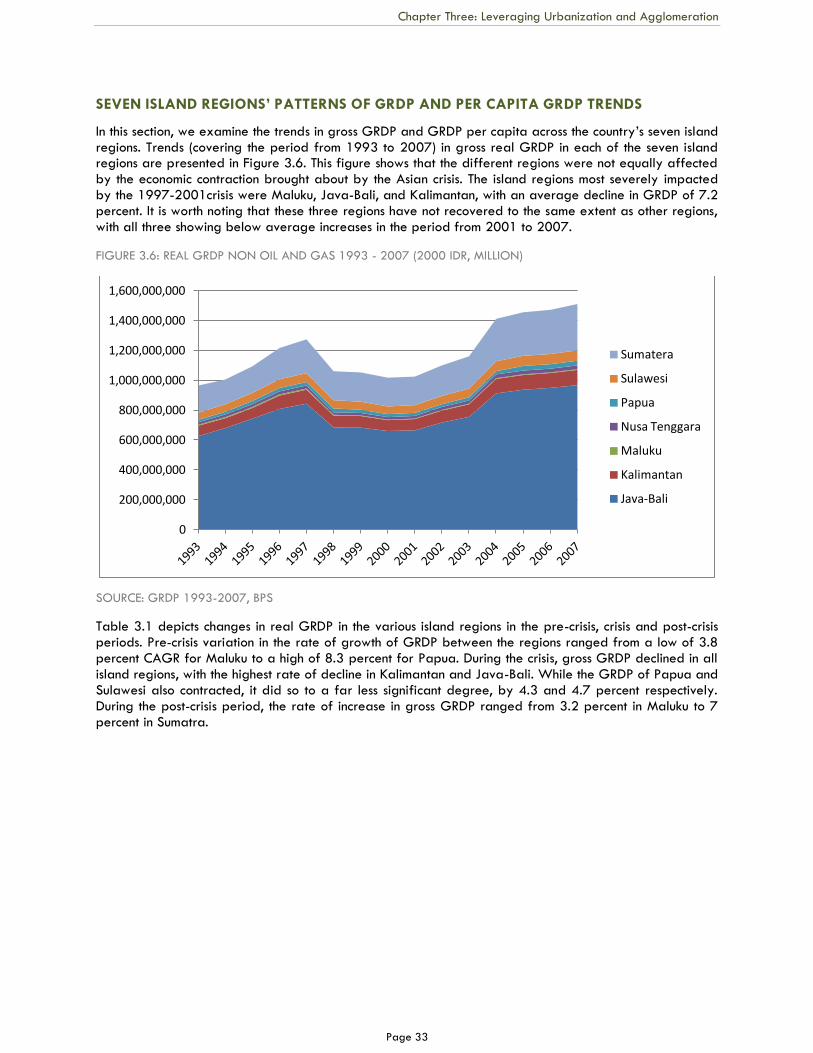
Chapter Three: Leveraging Urbanization and Agglomeration
Page 33
SEVEN ISLAND REGIONS’ PATTERNS OF GRDP AND PER CAPITA GRDP TRENDS
In this section, we examine the trends in gross GRDP and GRDP per capita across the country‘s seven island regions. Trends (covering the period from 1993 to 2007) in gross real GRDP in each of the seven island regions are presented in Figure 3.6. This figure shows that the different regions were not equally affected by the economic contraction brought about by the Asian crisis. The island regions most severely impacted by the 1997-2001crisis were Maluku, Java-Bali, and Kalimantan, with an average decline in GRDP of 7.2 percent. It is worth noting that these three regions have not recovered to the same extent as other regions, with all three showing below average increases in the period from 2001 to 2007.
FIGURE 3.6: REAL GRDP NON OIL AND GAS 1993 - 2007 (2000 IDR, MILLION)
SOURCE: GRDP 1993-2007, BPS
Table 3.1 depicts changes in real GRDP in the various island regions in the pre-crisis, crisis and post-crisis periods. Pre-crisis variation in the rate of growth of GRDP between the regions ranged from a low of 3.8 percent CAGR for Maluku to a high of 8.3 percent for Papua. During the crisis, gross GRDP declined in all island regions, with the highest rate of decline in Kalimantan and Java-Bali. While the GRDP of Papua and Sulawesi also contracted, it did so to a far less significant degree, by 4.3 and 4.7 percent respectively. During the post-crisis period, the rate of increase in gross GRDP ranged from 3.2 percent in Maluku to 7 percent in Sumatra.
0
200,000,000
400,000,000
600,000,000
800,000,000
1,000,000,000
1,200,000,000
1,400,000,000
1,600,000,000
Sumatera
Sulawesi
Papua
Nusa Tenggara
Maluku
Kalimantan
Java-Bali
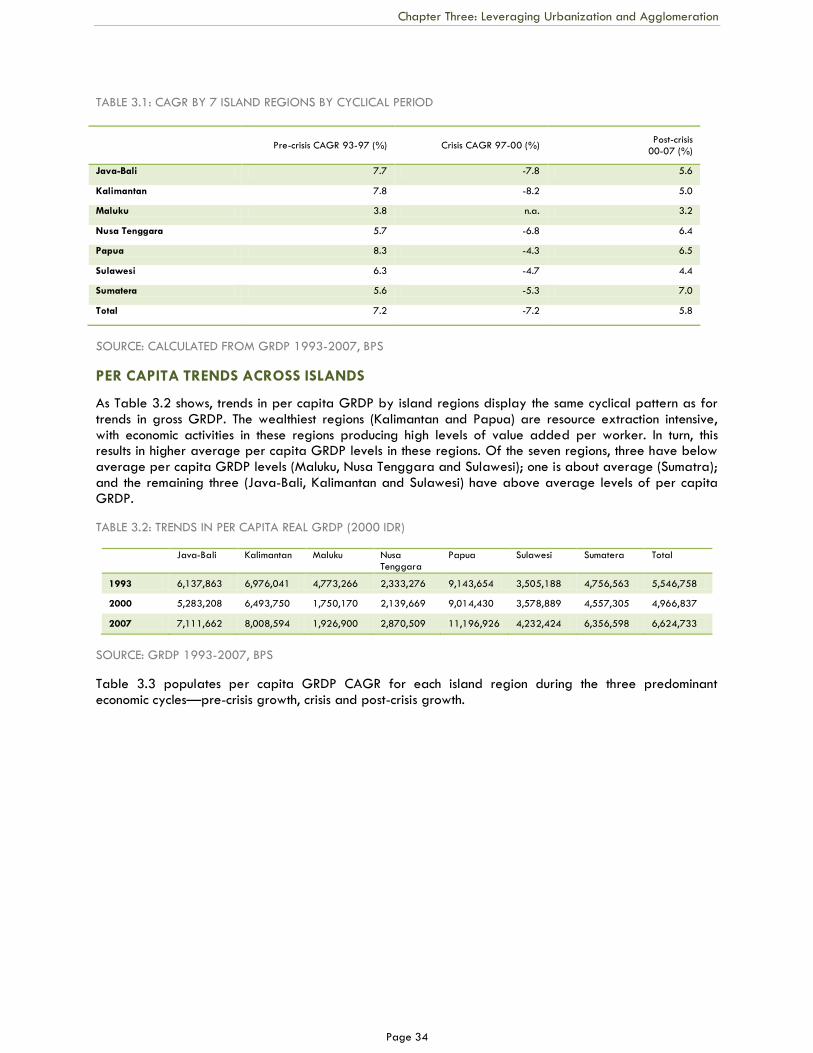
Chapter Three: Leveraging Urbanization and Agglomeration
Page 34
TABLE 3.1: CAGR BY 7 ISLAND REGIONS BY CYCLICAL PERIOD
Pre-crisis CAGR 93-97 (%) Crisis CAGR 97-00 (%) Post-crisis
00-07 (%)
Java-Bali 7.7 -7.8 5.6
Kalimantan 7.8 -8.2 5.0
Maluku 3.8 n.a. 3.2
Nusa Tenggara 5.7 -6.8 6.4
Papua 8.3 -4.3 6.5
Sulawesi 6.3 -4.7 4.4
Sumatera 5.6 -5.3 7.0
Total 7.2 -7.2 5.8
SOURCE: CALCULATED FROM GRDP 1993-2007, BPS
PER CAPITA TRENDS ACROSS ISLANDS
As Table 3.2 shows, trends in per capita GRDP by island regions display the same cyclical pattern as for trends in gross GRDP. The wealthiest regions (Kalimantan and Papua) are resource extraction intensive, with economic activities in these regions producing high levels of value added per worker. In turn, this results in higher average per capita GRDP levels in these regions. Of the seven regions, three have below average per capita GRDP levels (Maluku, Nusa Tenggara and Sulawesi); one is about average (Sumatra); and the remaining three (Java-Bali, Kalimantan and Sulawesi) have above average levels of per capita GRDP.
TABLE 3.2: TRENDS IN PER CAPITA REAL GRDP (2000 IDR)
Java-Bali Kalimantan Maluku Nusa Tenggara
Papua Sulawesi Sumatera Total
1993 6,137,863 6,976,041 4,773,266 2,333,276 9,143,654 3,505,188 4,756,563 5,546,758
2000 5,283,208 6,493,750 1,750,170 2,139,669 9,014,430 3,578,889 4,557,305 4,966,837
2007 7,111,662 8,008,594 1,926,900 2,870,509 11,196,926 4,232,424 6,356,598 6,624,733
SOURCE: GRDP 1993-2007, BPS
Table 3.3 populates per capita GRDP CAGR for each island region during the three predominant economic cycles—pre-crisis growth, crisis and post-crisis growth.
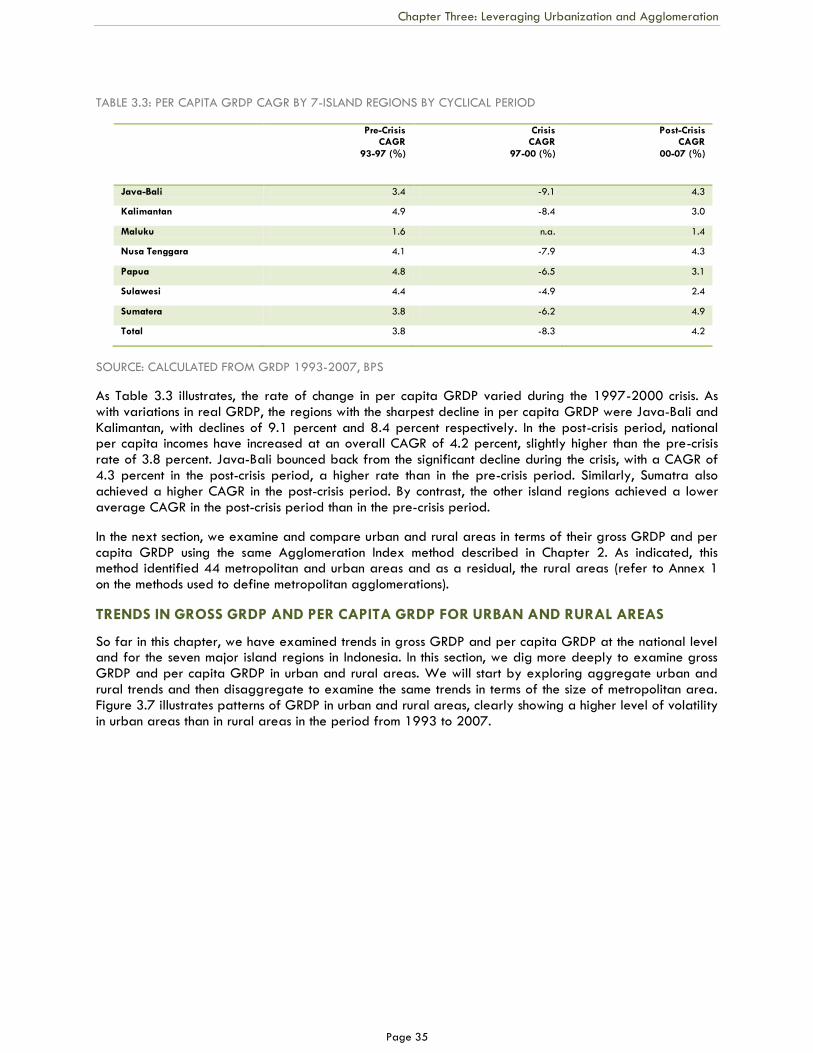
Chapter Three: Leveraging Urbanization and Agglomeration
Page 35
TABLE 3.3: PER CAPITA GRDP CAGR BY 7-ISLAND REGIONS BY CYCLICAL PERIOD
Pre-Crisis CAGR
93-97 (%)
Crisis CAGR
97-00 (%)
Post-Crisis CAGR
00-07 (%)
Java-Bali 3.4 -9.1 4.3
Kalimantan 4.9 -8.4 3.0
Maluku 1.6 n.a. 1.4
Nusa Tenggara 4.1 -7.9 4.3
Papua 4.8 -6.5 3.1
Sulawesi 4.4 -4.9 2.4
Sumatera 3.8 -6.2 4.9
Total 3.8 -8.3 4.2
SOURCE: CALCULATED FROM GRDP 1993-2007, BPS
As Table 3.3 illustrates, the rate of change in per capita GRDP varied during the 1997-2000 crisis. As with variations in real GRDP, the regions with the sharpest decline in per capita GRDP were Java-Bali and Kalimantan, with declines of 9.1 percent and 8.4 percent respectively. In the post-crisis period, national per capita incomes have increased at an overall CAGR of 4.2 percent, slightly higher than the pre-crisis rate of 3.8 percent. Java-Bali bounced back from the significant decline during the crisis, with a CAGR of 4.3 percent in the post-crisis period, a higher rate than in the pre-crisis period. Similarly, Sumatra also achieved a higher CAGR in the post-crisis period. By contrast, the other island regions achieved a lower average CAGR in the post-crisis period than in the pre-crisis period.
In the next section, we examine and compare urban and rural areas in terms of their gross GRDP and per capita GRDP using the same Agglomeration Index method described in Chapter 2. As indicated, this method identified 44 metropolitan and urban areas and as a residual, the rural areas (refer to Annex 1 on the methods used to define metropolitan agglomerations).
TRENDS IN GROSS GRDP AND PER CAPITA GRDP FOR URBAN AND RURAL AREAS
So far in this chapter, we have examined trends in gross GRDP and per capita GRDP at the national level and for the seven major island regions in Indonesia. In this section, we dig more deeply to examine gross GRDP and per capita GRDP in urban and rural areas. We will start by exploring aggregate urban and rural trends and then disaggregate to examine the same trends in terms of the size of metropolitan area. Figure 3.7 illustrates patterns of GRDP in urban and rural areas, clearly showing a higher level of volatility in urban areas than in rural areas in the period from 1993 to 2007.
Chapter Three: Leveraging Urbanization and Agglomeration
Page 36
FIGURE 3.7: REAL GRDP NON OIL AND GAS URBAN AND RURAL DISTRICTS (2000 IDR, MILLION)
SOURCE: GRDP 1993-2007, BPS
It is worth noting that the proportion of national GRDP to which urban areas contribute remained relatively constant in the period from 1993 to 2007, amounting to between 61-63 percent of total national output. Since the proportion of the population living in urban areas also remained relatively constant during this period (45-46 percent), this is not surprising. However, it does not suggest any significant agglomeration economy impact over time. It is important to note that while the proportion of Indonesia‘s total GRDP to which urban areas contribute (agglomerations) has remained approximately the same in the period from 1993 to 2007, Indonesia‘s urban population increased from 85.8 million to 103.7 million in the same period.
TABLE 3.4: GRDP URBAN AND RURAL CAGR BY CYCLICAL PERIOD
Period Rural (%) Urban (%) Total (%)
1993-1997 5.3 5.5 5.5
1997-2000 -8.0 -4.2 -6.4
2000-2007 4.0 2.7 3.5
1993-2007 1.7 3.1 1.9
SOURCE: CALCULATED FROM GRDP 1993-2007, BPS
As Table 3.4 shows, during the pre-crisis growth cycle, the rates of increase in per capita GRDP were similar in urban areas and in rural areas at 5.5 percent and 5.3 percent respectively. However, during the crisis, rural areas suffered a much greater decline in per capita GRDP than did urban areas, at -8.0 percent and -4.2 percent respectively. Since the crisis, the rate of increase has been higher in rural areas than in urban areas, at an average annual rate of 4.0 percent and 2.7 percent respectively. Clearly, demographic trends, particularly internal migration, affected the respective rates of increase or decline in per capita GRDP, as households and workers relocated to cities during periods of growth and then retreated to their rural homes when the economy faltered. This resulted in per capita income being more pro-cyclical in rural areas than in urban areas—at variance with the aggregate GRDP trends shown above.
-
200,000,000
400,000,000
600,000,000
800,000,000
1,000,000,000
1,200,000,000
1,400,000,000
1,600,000,000
1993 1994 1995 1996 1997 1998 1999 2000 2001 2002 2003 2004 2005 2006 2007
GRDP (nog) urban and rural districts (constant 2000 IDR), millions
Urban
Rural
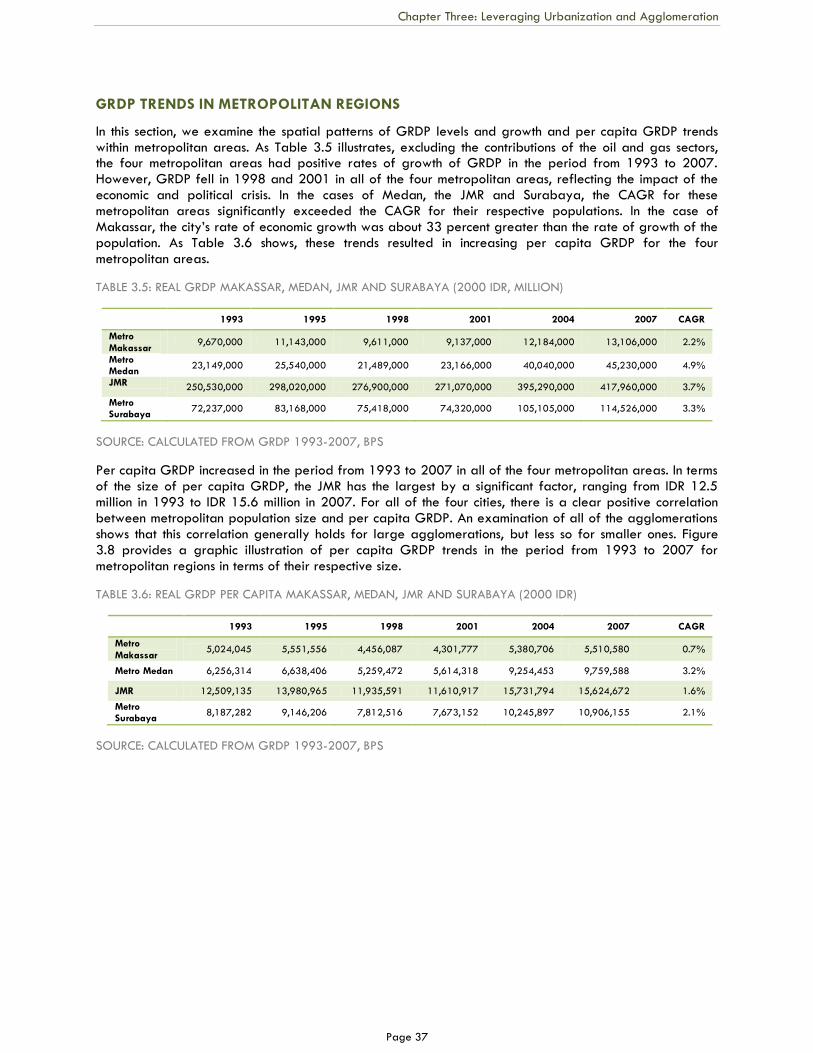
Chapter Three: Leveraging Urbanization and Agglomeration
Page 37
GRDP TRENDS IN METROPOLITAN REGIONS
In this section, we examine the spatial patterns of GRDP levels and growth and per capita GRDP trends within metropolitan areas. As Table 3.5 illustrates, excluding the contributions of the oil and gas sectors, the four metropolitan areas had positive rates of growth of GRDP in the period from 1993 to 2007. However, GRDP fell in 1998 and 2001 in all of the four metropolitan areas, reflecting the impact of the economic and political crisis. In the cases of Medan, the JMR and Surabaya, the CAGR for these metropolitan areas significantly exceeded the CAGR for their respective populations. In the case of Makassar, the city‘s rate of economic growth was about 33 percent greater than the rate of growth of the population. As Table 3.6 shows, these trends resulted in increasing per capita GRDP for the four metropolitan areas.
TABLE 3.5: REAL GRDP MAKASSAR, MEDAN, JMR AND SURABAYA (2000 IDR, MILLION)
1993 1995 1998 2001 2004 2007 CAGR
Metro
Makassar 9,670,000 11,143,000 9,611,000 9,137,000 12,184,000 13,106,000 2.2%
Metro Medan
23,149,000 25,540,000 21,489,000 23,166,000 40,040,000 45,230,000 4.9%
JMR 250,530,000 298,020,000 276,900,000 271,070,000 395,290,000 417,960,000 3.7%
Metro Surabaya
72,237,000 83,168,000 75,418,000 74,320,000 105,105,000 114,526,000 3.3%
SOURCE: CALCULATED FROM GRDP 1993-2007, BPS
Per capita GRDP increased in the period from 1993 to 2007 in all of the four metropolitan areas. In terms of the size of per capita GRDP, the JMR has the largest by a significant factor, ranging from IDR 12.5 million in 1993 to IDR 15.6 million in 2007. For all of the four cities, there is a clear positive correlation between metropolitan population size and per capita GRDP. An examination of all of the agglomerations shows that this correlation generally holds for large agglomerations, but less so for smaller ones. Figure 3.8 provides a graphic illustration of per capita GRDP trends in the period from 1993 to 2007 for metropolitan regions in terms of their respective size.
TABLE 3.6: REAL GRDP PER CAPITA MAKASSAR, MEDAN, JMR AND SURABAYA (2000 IDR)
1993 1995 1998 2001 2004 2007 CAGR
Metro
Makassar 5,024,045 5,551,556 4,456,087 4,301,777 5,380,706 5,510,580 0.7%
Metro Medan 6,256,314 6,638,406 5,259,472 5,614,318 9,254,453 9,759,588 3.2%
JMR 12,509,135 13,980,965 11,935,591 11,610,917 15,731,794 15,624,672 1.6%
Metro Surabaya
8,187,282 9,146,206 7,812,516 7,673,152 10,245,897 10,906,155 2.1%
SOURCE: CALCULATED FROM GRDP 1993-2007, BPS
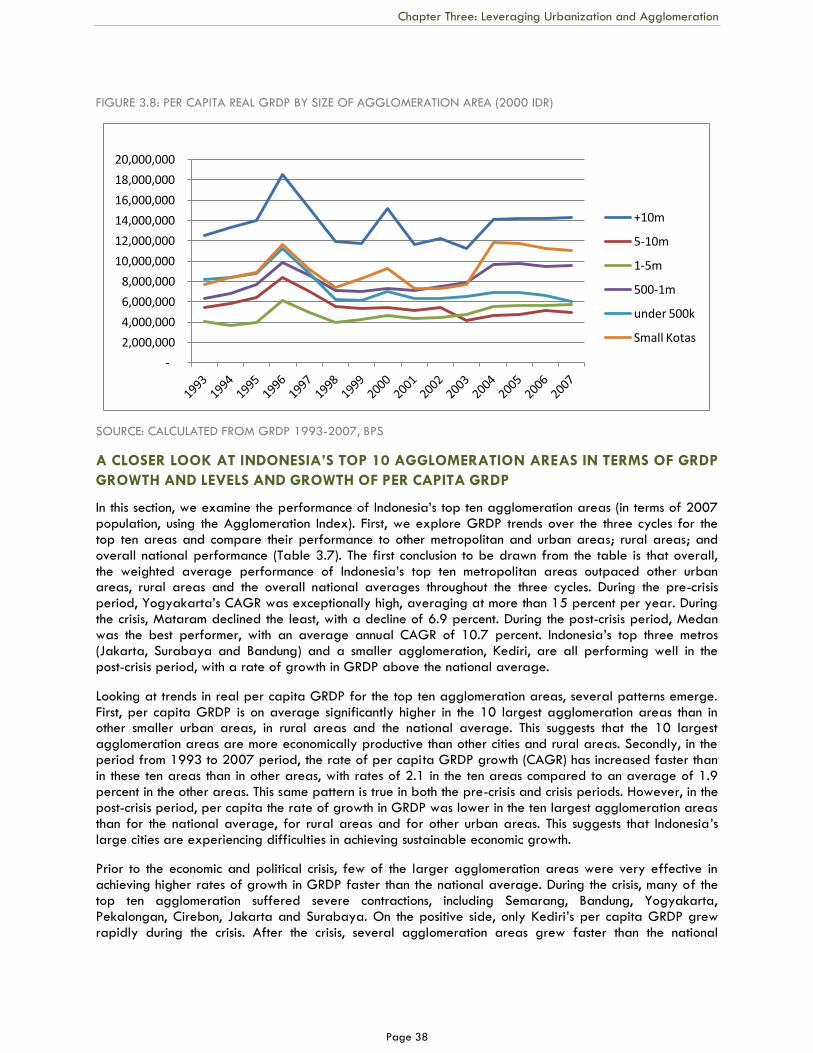
Chapter Three: Leveraging Urbanization and Agglomeration
Page 38
FIGURE 3.8: PER CAPITA REAL GRDP BY SIZE OF AGGLOMERATION AREA (2000 IDR)
SOURCE: CALCULATED FROM GRDP 1993-2007, BPS
A CLOSER LOOK AT INDONESIA’S TOP 10 AGGLOMERATION AREAS IN TERMS OF GRDP
GROWTH AND LEVELS AND GROWTH OF PER CAPITA GRDP
In this section, we examine the performance of Indonesia‘s top ten agglomeration areas (in terms of 2007 population, using the Agglomeration Index). First, we explore GRDP trends over the three cycles for the top ten areas and compare their performance to other metropolitan and urban areas; rural areas; and overall national performance (Table 3.7). The first conclusion to be drawn from the table is that overall, the weighted average performance of Indonesia‘s top ten metropolitan areas outpaced other urban areas, rural areas and the overall national averages throughout the three cycles. During the pre-crisis period, Yogyakarta‘s CAGR was exceptionally high, averaging at more than 15 percent per year. During the crisis, Mataram declined the least, with a decline of 6.9 percent. During the post-crisis period, Medan was the best performer, with an average annual CAGR of 10.7 percent. Indonesia‘s top three metros (Jakarta, Surabaya and Bandung) and a smaller agglomeration, Kediri, are all performing well in the post-crisis period, with a rate of growth in GRDP above the national average.
Looking at trends in real per capita GRDP for the top ten agglomeration areas, several patterns emerge. First, per capita GRDP is on average significantly higher in the 10 largest agglomeration areas than in other smaller urban areas, in rural areas and the national average. This suggests that the 10 largest agglomeration areas are more economically productive than other cities and rural areas. Secondly, in the period from 1993 to 2007 period, the rate of per capita GRDP growth (CAGR) has increased faster than in these ten areas than in other areas, with rates of 2.1 in the ten areas compared to an average of 1.9 percent in the other areas. This same pattern is true in both the pre-crisis and crisis periods. However, in the post-crisis period, per capita the rate of growth in GRDP was lower in the ten largest agglomeration areas than for the national average, for rural areas and for other urban areas. This suggests that Indonesia‘s large cities are experiencing difficulties in achieving sustainable economic growth.
Prior to the economic and political crisis, few of the larger agglomeration areas were very effective in achieving higher rates of growth in GRDP faster than the national average. During the crisis, many of the top ten agglomeration suffered severe contractions, including Semarang, Bandung, Yogyakarta, Pekalongan, Cirebon, Jakarta and Surabaya. On the positive side, only Kediri‘s per capita GRDP grew rapidly during the crisis. After the crisis, several agglomeration areas grew faster than the national
-
2,000,000
4,000,000
6,000,000
8,000,000
10,000,000
12,000,000
14,000,000
16,000,000
18,000,000
20,000,000
Per capita GRDP (constant 2000 IDR) by size of metropolitan area
+10m
5-10m
1-5m
500-1m
under 500k
Small Kotas
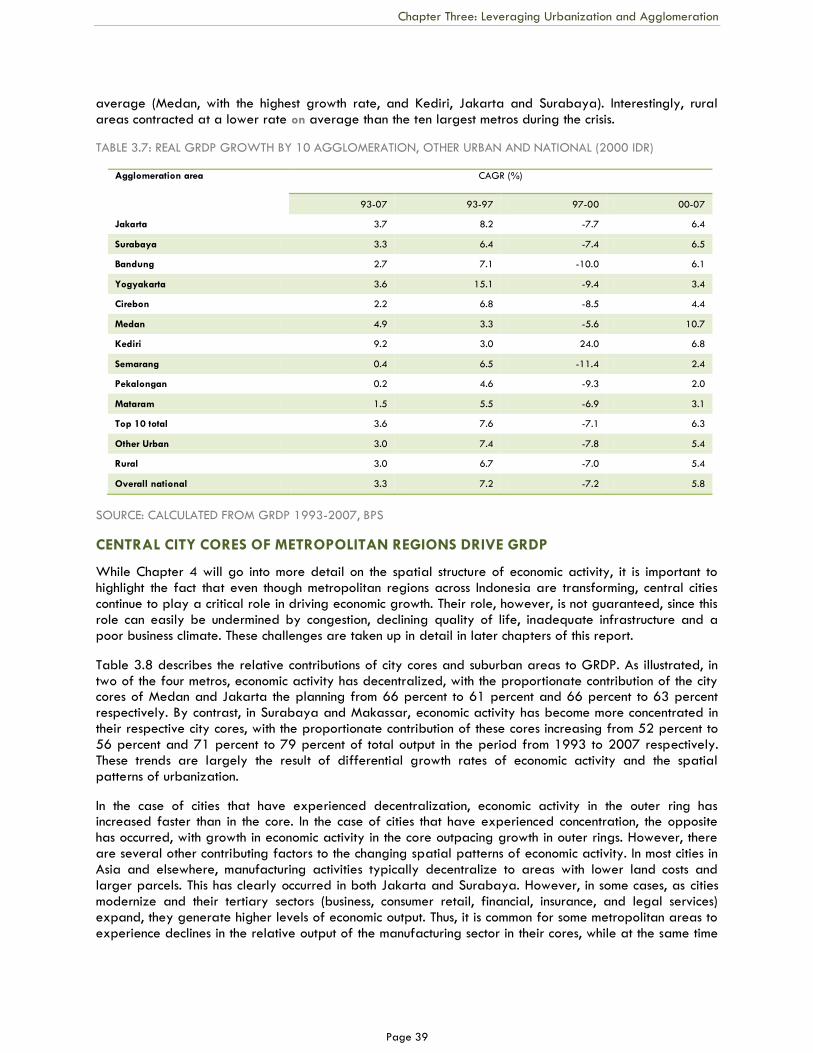
Chapter Three: Leveraging Urbanization and Agglomeration
Page 39
average (Medan, with the highest growth rate, and Kediri, Jakarta and Surabaya). Interestingly, rural areas contracted at a lower rate on average than the ten largest metros during the crisis.
TABLE 3.7: REAL GRDP GROWTH BY 10 AGGLOMERATION, OTHER URBAN AND NATIONAL (2000 IDR)
Agglomeration area CAGR (%)
93-07 93-97 97-00 00-07
Jakarta 3.7 8.2 -7.7 6.4
Surabaya 3.3 6.4 -7.4 6.5
Bandung 2.7 7.1 -10.0 6.1
Yogyakarta 3.6 15.1 -9.4 3.4
Cirebon 2.2 6.8 -8.5 4.4
Medan 4.9 3.3 -5.6 10.7
Kediri 9.2 3.0 24.0 6.8
Semarang 0.4 6.5 -11.4 2.4
Pekalongan 0.2 4.6 -9.3 2.0
Mataram 1.5 5.5 -6.9 3.1
Top 10 total 3.6 7.6 -7.1 6.3
Other Urban 3.0 7.4 -7.8 5.4
Rural 3.0 6.7 -7.0 5.4
Overall national 3.3 7.2 -7.2 5.8
SOURCE: CALCULATED FROM GRDP 1993-2007, BPS
CENTRAL CITY CORES OF METROPOLITAN REGIONS DRIVE GRDP
While Chapter 4 will go into more detail on the spatial structure of economic activity, it is important to highlight the fact that even though metropolitan regions across Indonesia are transforming, central cities continue to play a critical role in driving economic growth. Their role, however, is not guaranteed, since this role can easily be undermined by congestion, declining quality of life, inadequate infrastructure and a poor business climate. These challenges are taken up in detail in later chapters of this report.
Table 3.8 describes the relative contributions of city cores and suburban areas to GRDP. As illustrated, in two of the four metros, economic activity has decentralized, with the proportionate contribution of the city cores of Medan and Jakarta the planning from 66 percent to 61 percent and 66 percent to 63 percent respectively. By contrast, in Surabaya and Makassar, economic activity has become more concentrated in their respective city cores, with the proportionate contribution of these cores increasing from 52 percent to 56 percent and 71 percent to 79 percent of total output in the period from 1993 to 2007 respectively. These trends are largely the result of differential growth rates of economic activity and the spatial patterns of urbanization.
In the case of cities that have experienced decentralization, economic activity in the outer ring has increased faster than in the core. In the case of cities that have experienced concentration, the opposite has occurred, with growth in economic activity in the core outpacing growth in outer rings. However, there are several other contributing factors to the changing spatial patterns of economic activity. In most cities in Asia and elsewhere, manufacturing activities typically decentralize to areas with lower land costs and larger parcels. This has clearly occurred in both Jakarta and Surabaya. However, in some cases, as cities modernize and their tertiary sectors (business, consumer retail, financial, insurance, and legal services) expand, they generate higher levels of economic output. Thus, it is common for some metropolitan areas to experience declines in the relative output of the manufacturing sector in their cores, while at the same time
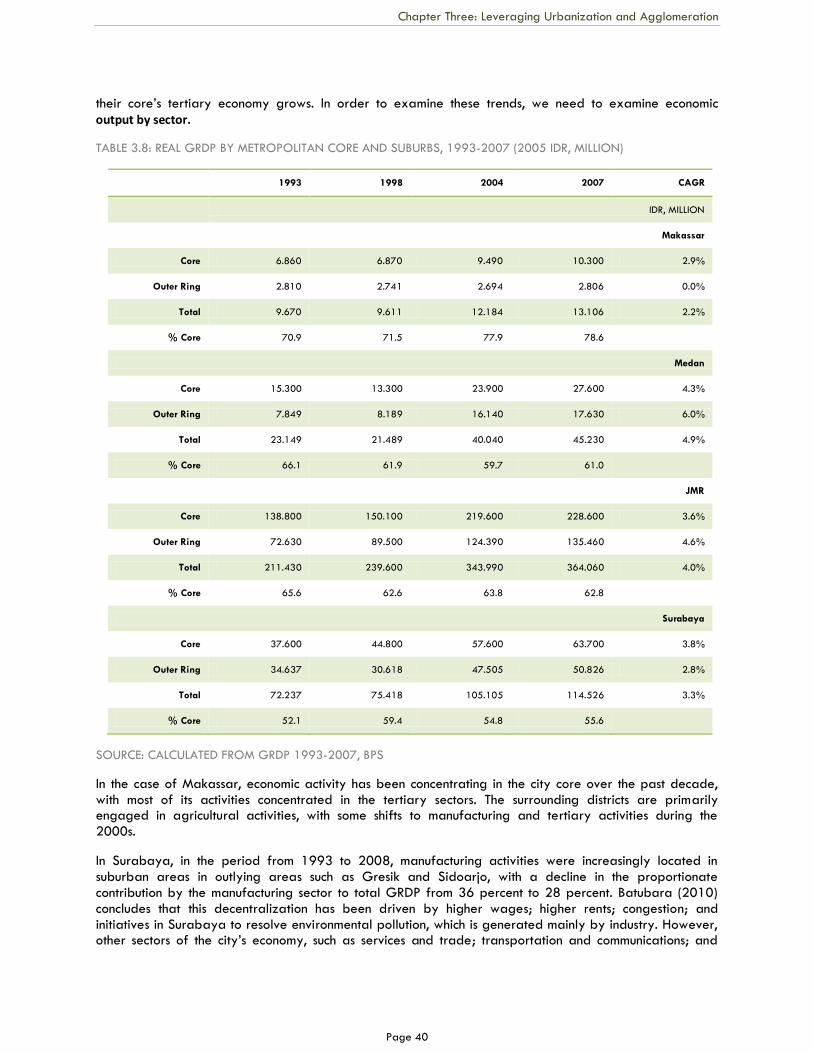
Chapter Three: Leveraging Urbanization and Agglomeration
Page 40
their core‘s tertiary economy grows. In order to examine these trends, we need to examine economic
output by sector.
TABLE 3.8: REAL GRDP BY METROPOLITAN CORE AND SUBURBS, 1993-2007 (2005 IDR, MILLION)
1993 1998 2004 2007 CAGR
IDR, MILLION
Makassar
Core 6.860 6.870 9.490 10.300 2.9%
Outer Ring 2.810 2.741 2.694 2.806 0.0%
Total 9.670 9.611 12.184 13.106 2.2%
% Core 70.9 71.5 77.9 78.6
Medan
Core 15.300 13.300 23.900 27.600 4.3%
Outer Ring 7.849 8.189 16.140 17.630 6.0%
Total 23.149 21.489 40.040 45.230 4.9%
% Core 66.1 61.9 59.7 61.0
JMR
Core 138.800 150.100 219.600 228.600 3.6%
Outer Ring 72.630 89.500 124.390 135.460 4.6%
Total 211.430 239.600 343.990 364.060 4.0%
% Core 65.6 62.6 63.8 62.8
Surabaya
Core 37.600 44.800 57.600 63.700 3.8%
Outer Ring 34.637 30.618 47.505 50.826 2.8%
Total 72.237 75.418 105.105 114.526 3.3%
% Core 52.1 59.4 54.8 55.6
SOURCE: CALCULATED FROM GRDP 1993-2007, BPS
In the case of Makassar, economic activity has been concentrating in the city core over the past decade, with most of its activities concentrated in the tertiary sectors. The surrounding districts are primarily engaged in agricultural activities, with some shifts to manufacturing and tertiary activities during the 2000s.
In Surabaya, in the period from 1993 to 2008, manufacturing activities were increasingly located in suburban areas in outlying areas such as Gresik and Sidoarjo, with a decline in the proportionate contribution by the manufacturing sector to total GRDP from 36 percent to 28 percent. Batubara (2010) concludes that this decentralization has been driven by higher wages; higher rents; congestion; and initiatives in Surabaya to resolve environmental pollution, which is generated mainly by industry. However, other sectors of the city‘s economy, such as services and trade; transportation and communications; and
Chapter Three: Leveraging Urbanization and Agglomeration
Page 41
consumer services; have expanded. These structural shifts have enabled Surabaya to continue to experience increased GRDP while at the same time undergoing a decentralization of manufacturing activities. As Batubara reports, outlying districts have established industrial estates to accommodate these activities. The government has also strived to provide critical infrastructure to support the manufacturing sector in the suburbs.
The JMR has been undergoing significant decentralization since the 1980s (Henderson, Kuncoro and Nasution, 1996). Decentralization has been driven by both push and pull factors. Significant push factors include rising land costs and the difficulty of assembling land for manufacturing and commercial and residential development; rising wages; and increased congestion. Significant pull factors include the development of toll roads in the period from 1986 to 1991, with these roads making suburban locations more accessible. In addition, with lower densities, land assembly has been easier. Residential development in suburban new towns has increased the labor supply for businesses. At the same time, the formation of industrial estates has made it easier for both foreign and domestic businesses to establish new facilities. Over time, these push and pull factors have transformed Jakarta from a monocentric to a polycentric metropolis.
In 1980, the central city (DKI) had an extremely high population density, amounting to 42,000 persons per square kilometer. This is higher than similarly sized metropolitan areas such as Sao Paulo and Buenos Aires (Henderson, et al., 1996). Densities decline with distance from the center of the city (Monas), but the density gradient has been ―flattening‖ since the 1980s, as accessibility to suburban areas improves. However, as Henderson, et al., point out, the gradient was relatively steep in 1980, reflecting the poor level of accessibility at the time. Since the 1990s, with tolls roads and the establishment of a more effective mass transportation system, densities in suburban areas have increased as residential development has intensified. However, congestion continues to plague the JMR. For a metropolitan region of Jakarta‘s size, an effective mass transit system is a critical essential.
The JMR‘s road system lacks an adequate hierarchical structure, especially in the suburbs, where developers build large-scale residential estates while making minimal attempts to coordinate these estates with interconnected arterial roads. This forces traffic onto major roads and compounds congestion. Aside from toll road construction, overall road development has woefully lagged behind increases in the volume of traffic. For example, in DKI, in 1990, there were 2.7 million registered vehicles and 4,448 kilometers of roads, a ratio of approximately 600 vehicles per kilometer of road. In 2000, the number of registered vehicles had increased to 3.3 million while the size of the road network had increased to 6,528 kilometers, representing an improved ratio of 500 vehicles per kilometer of road. However, by 2008, the number of registered vehicles had increased by around 300 percent to 9.6 million vehicles, while road construction had remained virtually stagnant, increasing to barely 6,544 kilometers. This resulted in a spike in the ratio to 1,474.
Another reason for the lack of a well-organized hierarchical road system is the fact that land use planning and regulation is weak and not forward-looking. Land use planning in the JMR and other large metropolitan areas does not keep pace with development. Even worse, even when plans are relatively up to date, they are rarely enforced systematically.
In the case of the JMR and the other mega-metropolitan areas, growth in aggregate GRDP was positive in the period from 1993 to 2007, with significant increases during the pre- and post-crisis periods. However, per capita GRDP for the metropolitan areas with populations greater than 10 million has been essentially flat since 2004. During the crisis, the JMR‘s aggregate GRDP contracted by an average of 7.7 percent per year for a three-year period, representing a total decline of 21 percent in the period from 1997 to 2000. In the case of rate of per capita growth in GRDP, Jakarta and Surabaya have both had increases during the pre and post-crisis periods, but these were relatively modest.
Both aggregate and per capita growth rates vary according to the size of metropolitan areas. These variations are sometimes not consistent with agglomeration economic theory. Indonesia‘s large metropolitan areas, those with populations in the range of 5 to 10 million, have experienced lower rates of both
Chapter Three: Leveraging Urbanization and Agglomeration
Page 42
aggregate and per capita growth than metropolitan areas with populations in the range of 1 to 5 million. Metropolitan areas with populations in the range of 500,000 to 1 million also perform better than those populations in the range of 5 to 10 million. While some of this variation is due to reclassifications of cities from one category to another as a result of growing populations, per capita trends suggest that medium and small towns are more economically efficient than those with populations in the range of 5 to 10 million. In summary, this suggests an s-shaped productivity curve, with high productivity in metropolitan areas with populations greater than 10 million; lesser productivity in those with populations in the range of 5 to 10 million; and an increase in productivity in medium sized cities (populations in the range of 500,000 to 1 million) and small towns (populations less than 500,000).
LINKING URBANIZATION AND REGIONAL ECONOMIC DEVELOPMENT
An underlying theme that cuts across these questions and debates is whether the GOI should prioritize place prosperity or people prosperity. The dilemma posed by this dichotomy is not unique to Indonesia, nor is it new. It has been a longstanding question that regional development planners and economists have debated for years, with governments launching hundreds of often contradictory and inconsistent programs that sometimes prioritize one and sometimes the other.
In economic terms, should the GOI encourage the formation of agglomeration economies in Jakarta, Surabaya, Medan, Makassar and other large cities? If yes, how can this best be accomplished? Alternatively, should the government attempt to improve spatial equity by developing dispersed centers of economic activity across the country?
The overarching objective of this report is to explain and understand the spatial patterns of urbanization and associated economic development through the use of detailed statistical analyses and qualitative assessments. In subsequent chapters, we will use these methods to examine the factors that cause some regions to grow and others to lag or decline, and to understand how policies, institutional performance, investment in infrastructure, location, and access to factor inputs drive urban economic development across Indonesia. Ultimately, with a deeper understanding of these drivers of growth and the interactions between them, we hope to articulate a range of practical policy initiatives that the GOI might consider to foster more spatially inclusive development without sapping the existing vibrancy of large, well-established centers of economic activity. In short, the Government should promote growth and improved living standards throughout Indonesia by building on the established dynamism of the country‘s main centers of economic activity.
The GOI is in the midst of wide-ranging policy discussion regarding the meanings by which to improve the living standards of its 237.6 million citizens (2010 Population Census). The debate is complex and multi-dimensional, covering questions such as: How can Indonesia’s economy become more internationally competitive? How can poverty be reduced? How can more people gain access to basic services—water, sanitation, electricity, healthcare and education? Should economic development and urbanization be more spatially balanced and equitable? Should the growth of metropolitan Jakarta be checked? Should the capital be moved out of Jakarta? Is it possible to create new growth poles and economic zones in lagging regions to foster more spatially balanced growth?
The issues raised by these questions are common to many developing countries (Renaud, 1981). They are driven primarily by the rapid rates of urbanization in low- and middle-income developing countries; the proliferation of mega-cities with populations of more than 10 million; widespread urban pollution and congestion; limited urban services; and the perception that cities are economically and socially dysfunctional and draw resources away from rural areas. These concerns frequently prompt policy-makers to call for policies to limit the growth of large cities, to stem the flow of migration to cities; and to build new towns and special economic zones or otherwise encourage new growth zones.
According a United Nations survey of developing countries conducted in 2005, almost 75 percent of the responding nations expressed a strong desire to implement policies to reduce or reverse the flow migration to urban areas (United Nations, 2007). As Lars Reutersward, Head of UN Habitat states: ―Cities in the
Chapter Three: Leveraging Urbanization and Agglomeration
Page 43
developed world have historically been engines of economic growth, but many cities in the Third World area so dysfunctional that they have become drags on economic progress‖ (United Nations, 2007). This dysfunctionality is often referred to as agglomeration diseconomies. In such cases, cities become so congested, polluted and expensive to do business in that the costs associated with size outweigh the benefits. However, agglomeration diseconomies need not be permanent or irreversible. Though investments in infrastructure, better urban planning and more efficient spatial structure, cities can reverse these adverse conditions and become more competitive. In East Asia, there are numerous examples of such positive reversals, including the cases of Bangkok, Beijing, Seoul and Tokyo. Making cities more productive and more efficient may be more feasible than attempting to stop or redirect urban growth through the means mentioned above. However, given the widespread apprehension of the effects of urbanization, the case for these alternative approaches must be made strongly. For many policy makers, including those in Indonesia, these approaches may seem counterintuitive.
International experience with deliberate initiatives to establish new growth poles is mixed, with many examples of both success and failure. Many policymakers point to certain Chinese cases as examples of success. However, upon closer examination, there have been a number of significant failures in this area in China as well. There is an inherent tension associated with the selection of locations for growth pole initiatives. On the one hand, to achieve their intended aims, growth poles should be located in economically lagging or relatively undeveloped areas. On the other hand, the placement of such initiatives in remote and poorly integrated areas will make their success less likely. Similarly, the selection of economic activities to be promoted through the growth pole also creates dilemmas. While these activities may be selected on the basis of their likelihood of generating high levels of employment and spillovers, this may run against market realities. Policy makers need to ask: Is there sufficient demand for growth pole activities? Or can the growth pole compete with existing domestic and international activity centers? In summary, there are three major types of risks associated with the establishment of growth pole initiatives. These include: siting mistakes; cluster mistakes and incomplete or asymmetric implementation and enforcement.
Common methods of growth pole initiatives include the establishment of special economic zones (SEZs); industrial estates; and new towns and urban activity centers or districts (FIAS, 2007b). Implementing a growth pole strategy requires significant public expenditures. Investments in infrastructure; acquisition of land; provision of economic incentives; and aggressive marketing are typically required. Before committing to such investments, policymakers need to answer what and where questions associated with the establishment of one or more growth poles. This is not easy or straightforward, particularly given the need to determine whether the creation of new growth poles involves a more effective investment than leveraging existing ones.
Current policy interest in growth poles overlooks the fact that there are alternative strategies to promote spatial equity, such as local economic development initiatives and fiscal transfers to boost the development of lagging regions, both of which are common methods in North America and Western Europe. To help foster more informed debate and policy dialogue, this report examines the spatial pattern of economic prosperity and growth across Indonesia‘s metropolitan areas and rural regions.
CONCLUSION
There is very strong positive correlation between increased urbanization and higher rates of growth GRDP in Indonesia. This implies that increasing urbanization, if properly managed, will drive economic growth through the formation of agglomeration economies. However, we find that Indonesia has not optimally leveraged the economic benefits from rapid urbanization.
This chapter has explored trends in aggregate and per capita GRDP at the national, island region, urban, rural and metro size level, including a closer look at Indonesia‘s ten largest metropolitan areas (by 2007 population). Overall, Indonesia has experienced erratic patterns of economic growth and decline in the period from 1993 to 2007, with growth from 1993 to 1997, decline from 1997 to 2000 and a return to growth starting in 2000. Throughout the entire period, the rate of urbanization in Indonesia was faster than its rate of economic growth. The main reason for this is that Indonesia suffered wrenching political
Chapter Three: Leveraging Urbanization and Agglomeration
Page 44
turmoil after the financial crisis, with many regions and metropolitan areas suffering residual effects that have made it difficult to return to growth after the crisis.
Compared to rural areas, per capita GRDP is consistently higher in Indonesia‘s larger metropolitan areas. This is consistent with theory, reflecting the existence of agglomeration economies and the higher productivity of larger cities. However, the rate of growth of real per capita GRDP in urban areas has been sluggish, markedly lower than in other high growth Asia regions. In comparison with other countries in the region, Indonesia has been less successful in achieving a rate of economic growth higher than it rate of urbanization than any other country in the region except the Philippines. In turn, this indicates Indonesia‘s relative lack of success in leveraging the benefits from urbanization to promote economic productivity.
POLICY RECOMMENDATIONS
Policy makers should focus on achieving properly managed urbanization, rather than
considering increased urbanization and the growing dominance of metropolitan areas as
problems in themselves;
Policymakers should implement measures to improve productivity in urban areas, rather than
attempting to stop or redirect urban growth by redirecting migration, establishing new towns,
growth poles and SEZs and other similar means;
Policymakers should support local economic development initiatives to boost the development
of lagging regions instead of forming new growth poles and SEZs.
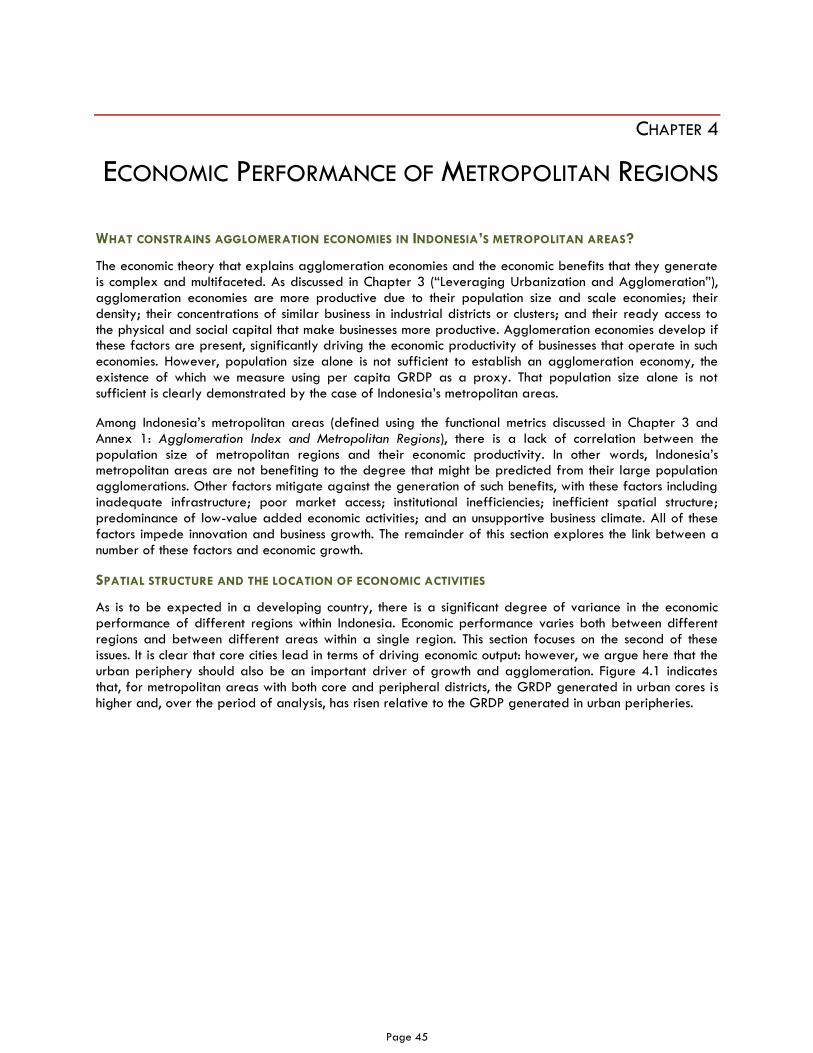
Page 45
CHAPTER 4
ECONOMIC PERFORMANCE OF METROPOLITAN REGIONS
WHAT CONSTRAINS AGGLOMERATION ECONOMIES IN INDONESIA’S METROPOLITAN AREAS?
The economic theory that explains agglomeration economies and the economic benefits that they generate is complex and multifaceted. As discussed in Chapter 3 (―Leveraging Urbanization and Agglomeration‖), agglomeration economies are more productive due to their population size and scale economies; their density; their concentrations of similar business in industrial districts or clusters; and their ready access to the physical and social capital that make businesses more productive. Agglomeration economies develop if these factors are present, significantly driving the economic productivity of businesses that operate in such economies. However, population size alone is not sufficient to establish an agglomeration economy, the existence of which we measure using per capita GRDP as a proxy. That population size alone is not sufficient is clearly demonstrated by the case of Indonesia‘s metropolitan areas.
Among Indonesia‘s metropolitan areas (defined using the functional metrics discussed in Chapter 3 and Annex 1: Agglomeration Index and Metropolitan Regions), there is a lack of correlation between the population size of metropolitan regions and their economic productivity. In other words, Indonesia‘s metropolitan areas are not benefiting to the degree that might be predicted from their large population agglomerations. Other factors mitigate against the generation of such benefits, with these factors including inadequate infrastructure; poor market access; institutional inefficiencies; inefficient spatial structure; predominance of low-value added economic activities; and an unsupportive business climate. All of these factors impede innovation and business growth. The remainder of this section explores the link between a number of these factors and economic growth.
SPATIAL STRUCTURE AND THE LOCATION OF ECONOMIC ACTIVITIES
As is to be expected in a developing country, there is a significant degree of variance in the economic performance of different regions within Indonesia. Economic performance varies both between different regions and between different areas within a single region. This section focuses on the second of these issues. It is clear that core cities lead in terms of driving economic output: however, we argue here that the urban periphery should also be an important driver of growth and agglomeration. Figure 4.1 indicates that, for metropolitan areas with both core and peripheral districts, the GRDP generated in urban cores is higher and, over the period of analysis, has risen relative to the GRDP generated in urban peripheries.
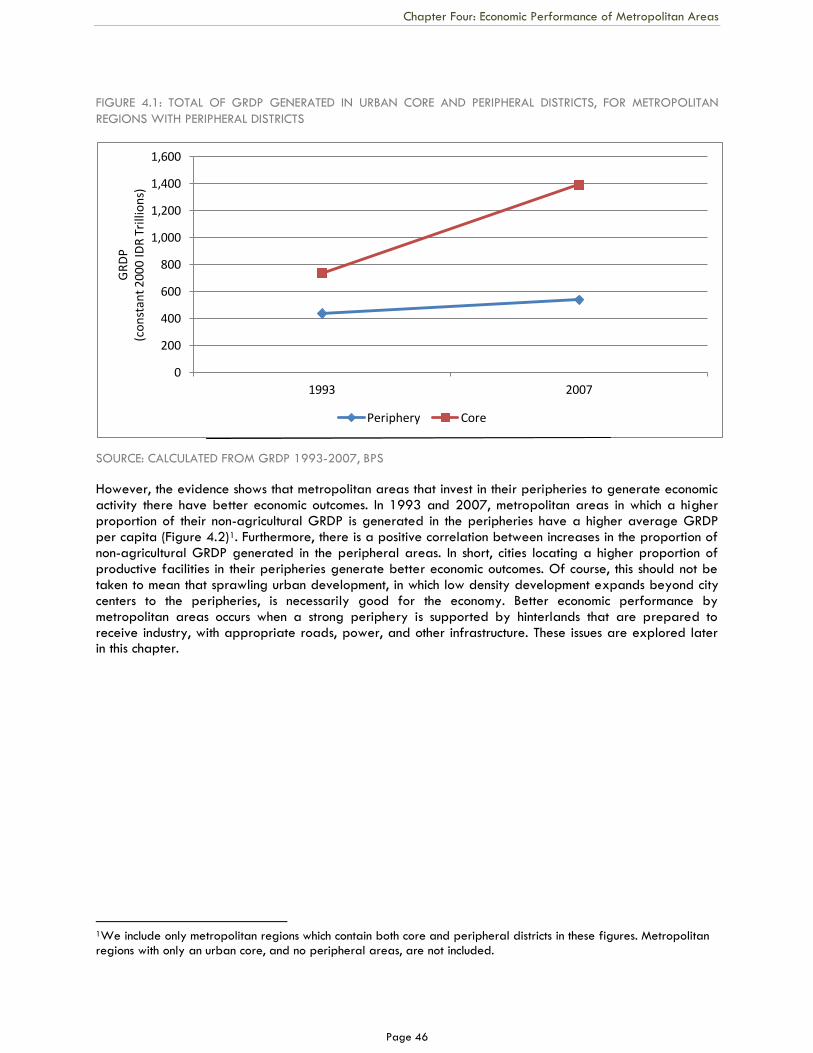
Chapter Four: Economic Performance of Metropolitan Areas
Page 46
FIGURE 4.1: TOTAL OF GRDP GENERATED IN URBAN CORE AND PERIPHERAL DISTRICTS, FOR METROPOLITAN
REGIONS WITH PERIPHERAL DISTRICTS
SOURCE: CALCULATED FROM GRDP 1993-2007, BPS
However, the evidence shows that metropolitan areas that invest in their peripheries to generate economic activity there have better economic outcomes. In 1993 and 2007, metropolitan areas in which a higher proportion of their non-agricultural GRDP is generated in the peripheries have a higher average GRDP per capita (Figure 4.2)1. Furthermore, there is a positive correlation between increases in the proportion of non-agricultural GRDP generated in the peripheral areas. In short, cities locating a higher proportion of productive facilities in their peripheries generate better economic outcomes. Of course, this should not be taken to mean that sprawling urban development, in which low density development expands beyond city centers to the peripheries, is necessarily good for the economy. Better economic performance by metropolitan areas occurs when a strong periphery is supported by hinterlands that are prepared to receive industry, with appropriate roads, power, and other infrastructure. These issues are explored later in this chapter.
1We include only metropolitan regions which contain both core and peripheral districts in these figures. Metropolitan regions with only an urban core, and no peripheral areas, are not included.
0
200
400
600
800
1,000
1,200
1,400
1,600
1993 2007
GR
DP
(c
on
stan
t 20
00 ID
R T
rilli
on
s)
Periphery Core
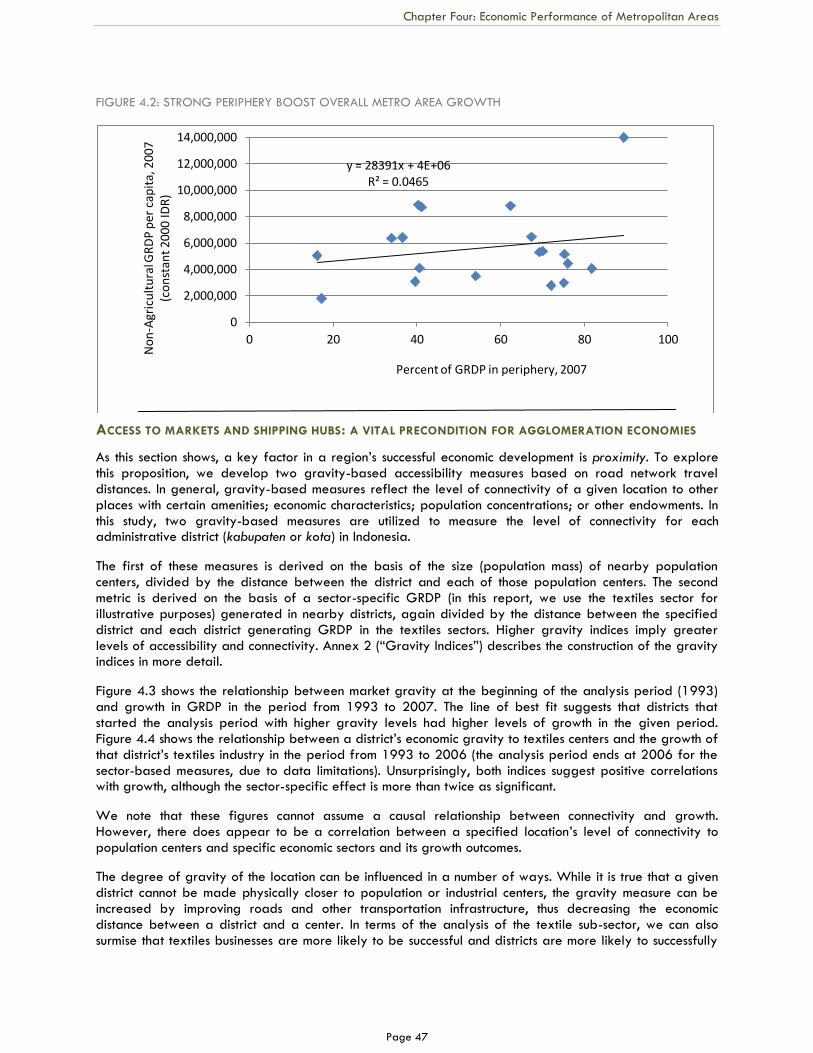
Chapter Four: Economic Performance of Metropolitan Areas
Page 47
FIGURE 4.2: STRONG PERIPHERY BOOST OVERALL METRO AREA GROWTH
ACCESS TO MARKETS AND SHIPPING HUBS: A VITAL PRECONDITION FOR AGGLOMERATION ECONOMIES
As this section shows, a key factor in a region‘s successful economic development is proximity. To explore this proposition, we develop two gravity-based accessibility measures based on road network travel distances. In general, gravity-based measures reflect the level of connectivity of a given location to other places with certain amenities; economic characteristics; population concentrations; or other endowments. In this study, two gravity-based measures are utilized to measure the level of connectivity for each administrative district (kabupaten or kota) in Indonesia.
The first of these measures is derived on the basis of the size (population mass) of nearby population centers, divided by the distance between the district and each of those population centers. The second metric is derived on the basis of a sector-specific GRDP (in this report, we use the textiles sector for illustrative purposes) generated in nearby districts, again divided by the distance between the specified district and each district generating GRDP in the textiles sectors. Higher gravity indices imply greater levels of accessibility and connectivity. Annex 2 (―Gravity Indices‖) describes the construction of the gravity indices in more detail.
Figure 4.3 shows the relationship between market gravity at the beginning of the analysis period (1993) and growth in GRDP in the period from 1993 to 2007. The line of best fit suggests that districts that started the analysis period with higher gravity levels had higher levels of growth in the given period. Figure 4.4 shows the relationship between a district‘s economic gravity to textiles centers and the growth of that district‘s textiles industry in the period from 1993 to 2006 (the analysis period ends at 2006 for the sector-based measures, due to data limitations). Unsurprisingly, both indices suggest positive correlations with growth, although the sector-specific effect is more than twice as significant.
We note that these figures cannot assume a causal relationship between connectivity and growth. However, there does appear to be a correlation between a specified location‘s level of connectivity to population centers and specific economic sectors and its growth outcomes.
The degree of gravity of the location can be influenced in a number of ways. While it is true that a given district cannot be made physically closer to population or industrial centers, the gravity measure can be increased by improving roads and other transportation infrastructure, thus decreasing the economic distance between a district and a center. In terms of the analysis of the textile sub-sector, we can also surmise that textiles businesses are more likely to be successful and districts are more likely to successfully
y = 28391x + 4E+06 R² = 0.0465
0
2,000,000
4,000,000
6,000,000
8,000,000
10,000,000
12,000,000
14,000,000
0 20 40 60 80 100
No
n-A
gric
ult
ura
l GR
DP
per
cap
ita,
200
7 (c
on
stan
t 20
00 ID
R)
Percent of GRDP in periphery, 2007
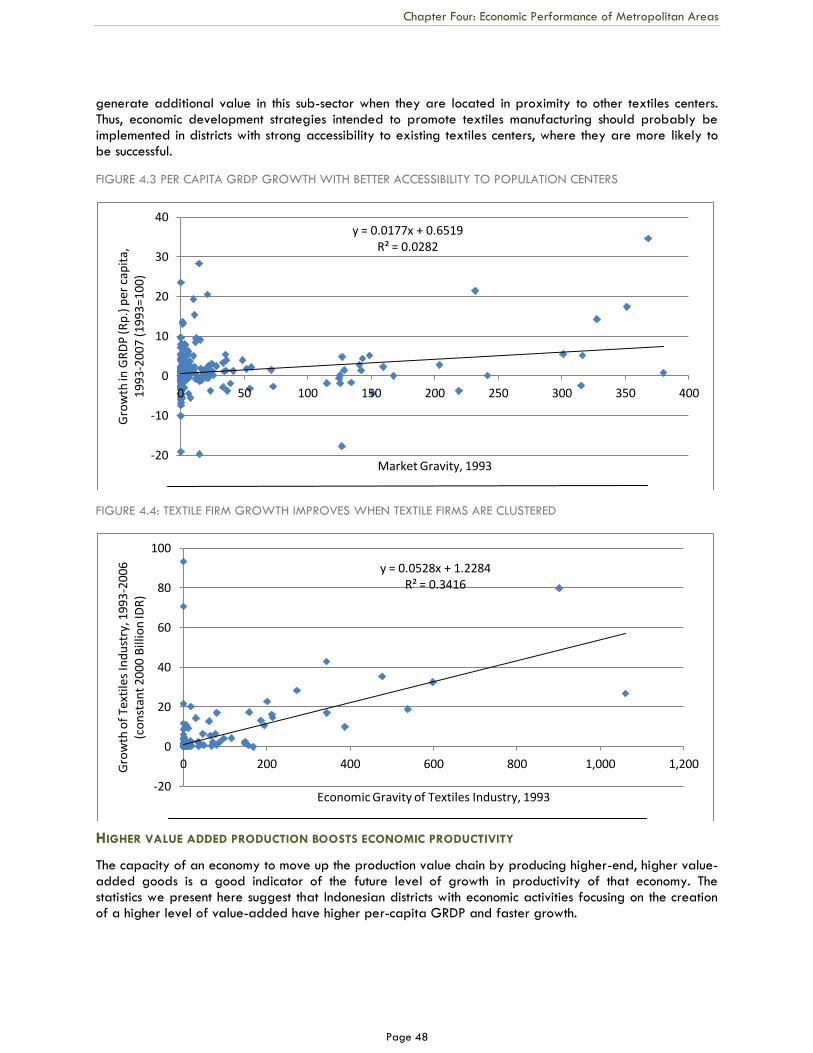
Chapter Four: Economic Performance of Metropolitan Areas
Page 48
generate additional value in this sub-sector when they are located in proximity to other textiles centers. Thus, economic development strategies intended to promote textiles manufacturing should probably be implemented in districts with strong accessibility to existing textiles centers, where they are more likely to be successful.
FIGURE 4.3 PER CAPITA GRDP GROWTH WITH BETTER ACCESSIBILITY TO POPULATION CENTERS
FIGURE 4.4: TEXTILE FIRM GROWTH IMPROVES WHEN TEXTILE FIRMS ARE CLUSTERED
HIGHER VALUE ADDED PRODUCTION BOOSTS ECONOMIC PRODUCTIVITY
The capacity of an economy to move up the production value chain by producing higher-end, higher value-added goods is a good indicator of the future level of growth in productivity of that economy. The statistics we present here suggest that Indonesian districts with economic activities focusing on the creation of a higher level of value-added have higher per-capita GRDP and faster growth.
y = 0.0177x + 0.6519 R² = 0.0282
-20
-10
0
10
20
30
40
0 50 100 150 200 250 300 350 400
Gro
wth
in G
RD
P (R
p.)
per
cap
ita,
19
93-2
007
(199
3=1
00)
Market Gravity, 1993
y = 0.0528x + 1.2284 R² = 0.3416
-20
0
20
40
60
80
100
0 200 400 600 800 1,000 1,200 Gro
wth
of
Text
iles
Ind
ust
ry, 1
993
-200
6 (c
on
stan
t 2
000
Bill
ion
IDR
)
Economic Gravity of Textiles Industry, 1993
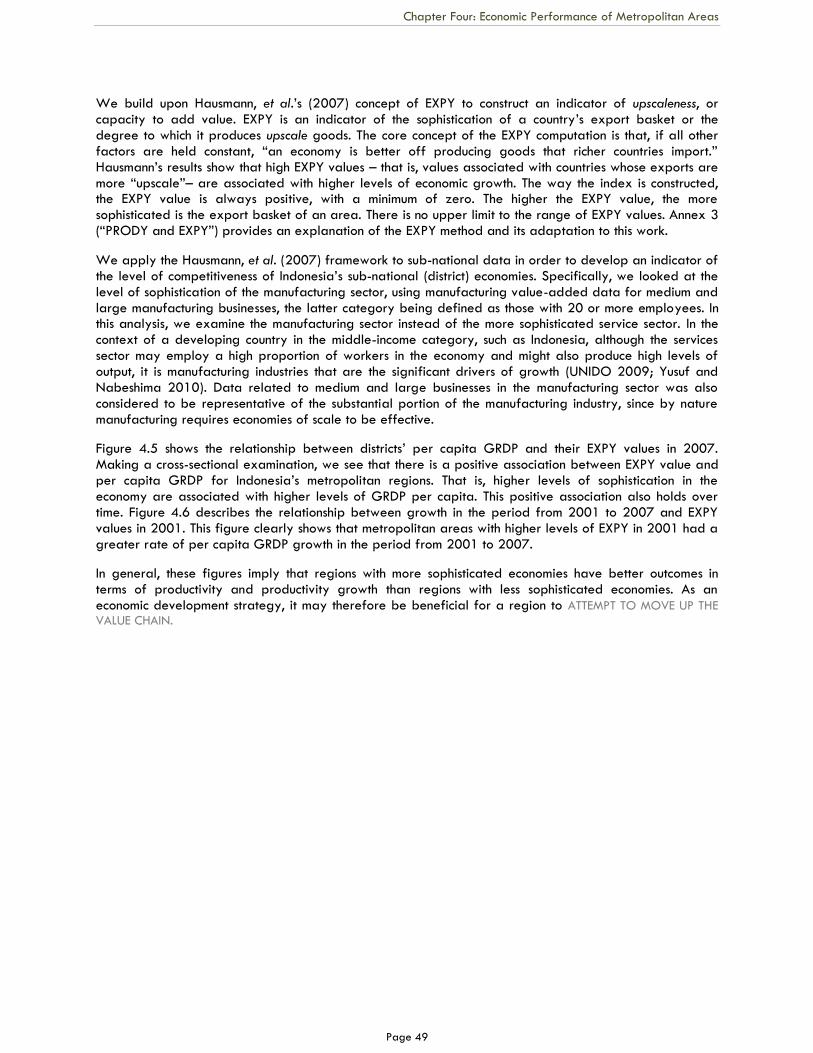
Chapter Four: Economic Performance of Metropolitan Areas
Page 49
We build upon Hausmann, et al.‘s (2007) concept of EXPY to construct an indicator of upscaleness, or capacity to add value. EXPY is an indicator of the sophistication of a country‘s export basket or the degree to which it produces upscale goods. The core concept of the EXPY computation is that, if all other factors are held constant, ―an economy is better off producing goods that richer countries import.‖ Hausmann‘s results show that high EXPY values – that is, values associated with countries whose exports are more ―upscale‖– are associated with higher levels of economic growth. The way the index is constructed, the EXPY value is always positive, with a minimum of zero. The higher the EXPY value, the more sophisticated is the export basket of an area. There is no upper limit to the range of EXPY values. Annex 3 (―PRODY and EXPY‖) provides an explanation of the EXPY method and its adaptation to this work.
We apply the Hausmann, et al. (2007) framework to sub-national data in order to develop an indicator of the level of competitiveness of Indonesia‘s sub-national (district) economies. Specifically, we looked at the level of sophistication of the manufacturing sector, using manufacturing value-added data for medium and large manufacturing businesses, the latter category being defined as those with 20 or more employees. In this analysis, we examine the manufacturing sector instead of the more sophisticated service sector. In the context of a developing country in the middle-income category, such as Indonesia, although the services sector may employ a high proportion of workers in the economy and might also produce high levels of output, it is manufacturing industries that are the significant drivers of growth (UNIDO 2009; Yusuf and Nabeshima 2010). Data related to medium and large businesses in the manufacturing sector was also considered to be representative of the substantial portion of the manufacturing industry, since by nature manufacturing requires economies of scale to be effective.
Figure 4.5 shows the relationship between districts‘ per capita GRDP and their EXPY values in 2007. Making a cross-sectional examination, we see that there is a positive association between EXPY value and per capita GRDP for Indonesia‘s metropolitan regions. That is, higher levels of sophistication in the economy are associated with higher levels of GRDP per capita. This positive association also holds over time. Figure 4.6 describes the relationship between growth in the period from 2001 to 2007 and EXPY values in 2001. This figure clearly shows that metropolitan areas with higher levels of EXPY in 2001 had a greater rate of per capita GRDP growth in the period from 2001 to 2007.
In general, these figures imply that regions with more sophisticated economies have better outcomes in terms of productivity and productivity growth than regions with less sophisticated economies. As an economic development strategy, it may therefore be beneficial for a region to ATTEMPT TO MOVE UP THE
VALUE CHAIN.
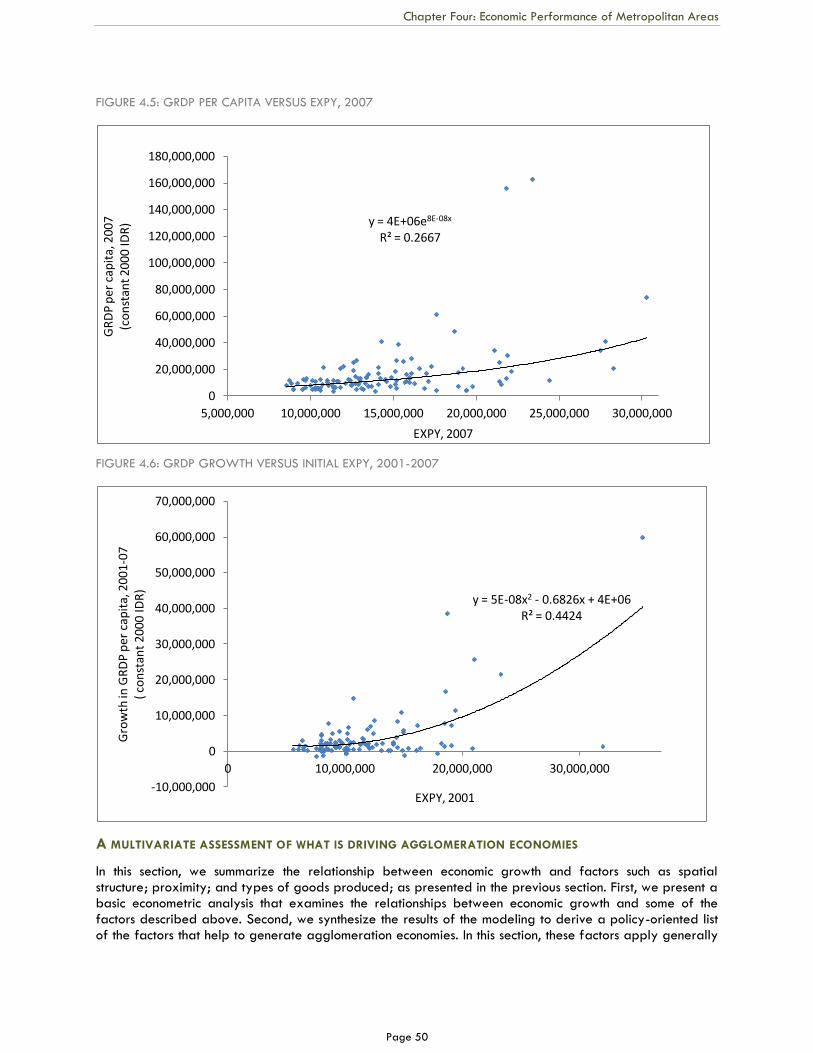
Chapter Four: Economic Performance of Metropolitan Areas
Page 50
FIGURE 4.5: GRDP PER CAPITA VERSUS EXPY, 2007
FIGURE 4.6: GRDP GROWTH VERSUS INITIAL EXPY, 2001-2007
A MULTIVARIATE ASSESSMENT OF WHAT IS DRIVING AGGLOMERATION ECONOMIES
In this section, we summarize the relationship between economic growth and factors such as spatial structure; proximity; and types of goods produced; as presented in the previous section. First, we present a basic econometric analysis that examines the relationships between economic growth and some of the factors described above. Second, we synthesize the results of the modeling to derive a policy-oriented list of the factors that help to generate agglomeration economies. In this section, these factors apply generally
y = 4E+06e8E-08x R² = 0.2667
0
20,000,000
40,000,000
60,000,000
80,000,000
100,000,000
120,000,000
140,000,000
160,000,000
180,000,000
5,000,000 10,000,000 15,000,000 20,000,000 25,000,000 30,000,000
GR
DP
per
cap
ita,
200
7
(co
nst
ant
2000
IDR
)
EXPY, 2007
y = 5E-08x2 - 0.6826x + 4E+06 R² = 0.4424
-10,000,000
0
10,000,000
20,000,000
30,000,000
40,000,000
50,000,000
60,000,000
70,000,000
0 10,000,000 20,000,000 30,000,000
Gro
wth
in G
RD
P p
er c
apit
a, 2
001
-07
( c
on
stan
t 20
00 ID
R)
EXPY, 2001
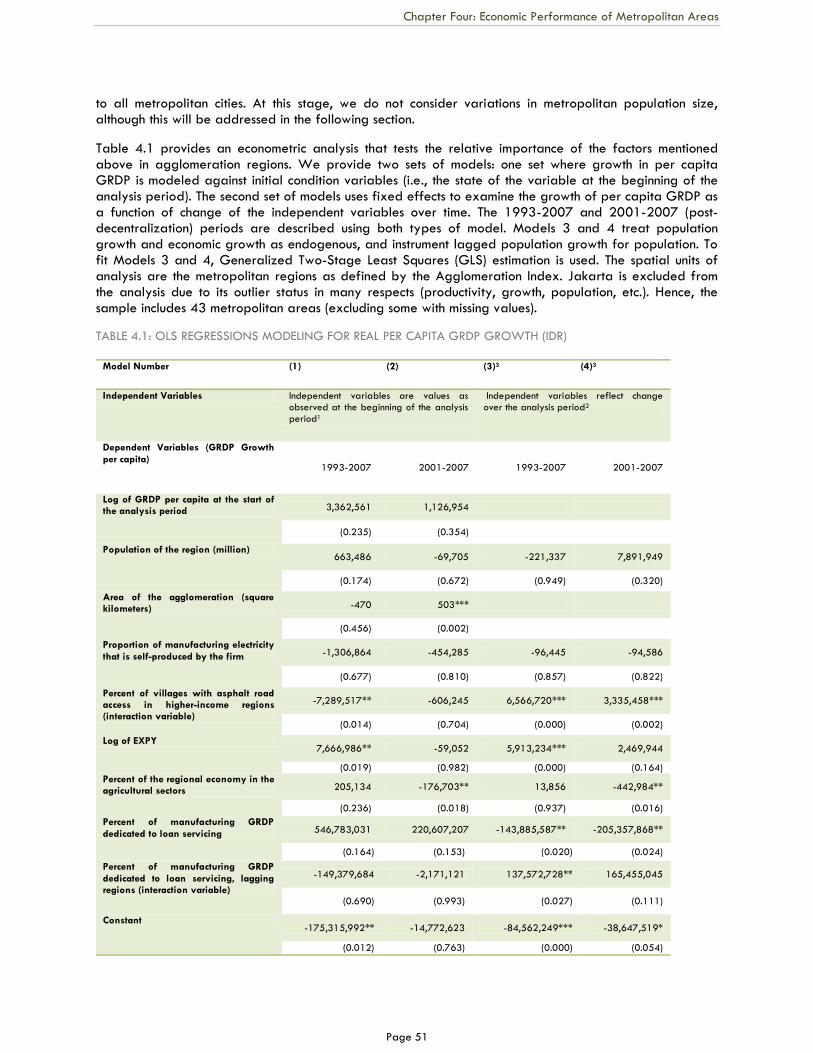
Chapter Four: Economic Performance of Metropolitan Areas
Page 51
to all metropolitan cities. At this stage, we do not consider variations in metropolitan population size, although this will be addressed in the following section.
Table 4.1 provides an econometric analysis that tests the relative importance of the factors mentioned above in agglomeration regions. We provide two sets of models: one set where growth in per capita GRDP is modeled against initial condition variables (i.e., the state of the variable at the beginning of the analysis period). The second set of models uses fixed effects to examine the growth of per capita GRDP as a function of change of the independent variables over time. The 1993-2007 and 2001-2007 (post-decentralization) periods are described using both types of model. Models 3 and 4 treat population growth and economic growth as endogenous, and instrument lagged population growth for population. To fit Models 3 and 4, Generalized Two-Stage Least Squares (GLS) estimation is used. The spatial units of analysis are the metropolitan regions as defined by the Agglomeration Index. Jakarta is excluded from the analysis due to its outlier status in many respects (productivity, growth, population, etc.). Hence, the sample includes 43 metropolitan areas (excluding some with missing values).
TABLE 4.1: OLS REGRESSIONS MODELING FOR REAL PER CAPITA GRDP GROWTH (IDR)
Model Number (1) (2) (3)3 (4)3
Independent Variables Independent variables are values as observed at the beginning of the analysis period1
Independent variables reflect change over the analysis period2
Dependent Variables (GRDP Growth
per capita) 1993-2007 2001-2007 1993-2007 2001-2007
Log of GRDP per capita at the start of the analysis period 3,362,561 1,126,954
(0.235) (0.354)
Population of the region (million) 663,486 -69,705 -221,337 7,891,949
(0.174) (0.672) (0.949) (0.320)
Area of the agglomeration (square kilometers) -470 503***
(0.456) (0.002)
Proportion of manufacturing electricity
that is self-produced by the firm -1,306,864 -454,285 -96,445 -94,586
(0.677) (0.810) (0.857) (0.822)
Percent of villages with asphalt road access in higher-income regions (interaction variable)
-7,289,517** -606,245 6,566,720*** 3,335,458***
(0.014) (0.704) (0.000) (0.002)
Log of EXPY 7,666,986** -59,052 5,913,234*** 2,469,944
(0.019) (0.982) (0.000) (0.164) Percent of the regional economy in the agricultural sectors 205,134 -176,703** 13,856 -442,984**
(0.236) (0.018) (0.937) (0.016)
Percent of manufacturing GRDP
dedicated to loan servicing 546,783,031 220,607,207 -143,885,587** -205,357,868**
(0.164) (0.153) (0.020) (0.024)
Percent of manufacturing GRDP
dedicated to loan servicing, lagging regions (interaction variable)
-149,379,684 -2,171,121 137,572,728** 165,455,045
(0.690) (0.993) (0.027) (0.111)
Constant -175,315,992** -14,772,623 -84,562,249*** -38,647,519*
(0.012) (0.763) (0.000) (0.054)
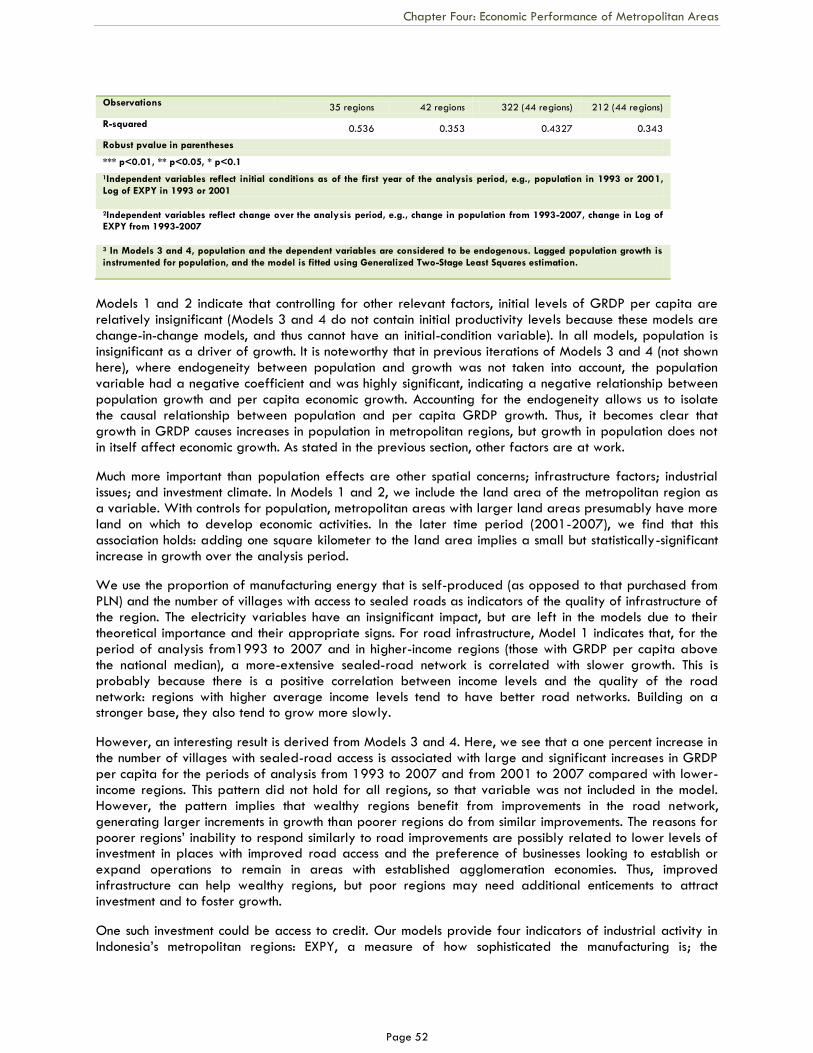
Chapter Four: Economic Performance of Metropolitan Areas
Page 52
Observations 35 regions 42 regions 322 (44 regions) 212 (44 regions)
R-squared 0.536 0.353 0.4327 0.343
Robust pvalue in parentheses
*** p<0.01, ** p<0.05, * p<0.1
1Independent variables reflect initial conditions as of the first year of the analysis period, e.g., population in 1993 or 2001,
Log of EXPY in 1993 or 2001
2Independent variables reflect change over the analysis period, e.g., change in population from 1993-2007, change in Log of EXPY from 1993-2007
3 In Models 3 and 4, population and the dependent variables are considered to be endogenous. Lagged population growth is
instrumented for population, and the model is fitted using Generalized Two-Stage Least Squares estimation.
Models 1 and 2 indicate that controlling for other relevant factors, initial levels of GRDP per capita are relatively insignificant (Models 3 and 4 do not contain initial productivity levels because these models are change-in-change models, and thus cannot have an initial-condition variable). In all models, population is insignificant as a driver of growth. It is noteworthy that in previous iterations of Models 3 and 4 (not shown here), where endogeneity between population and growth was not taken into account, the population variable had a negative coefficient and was highly significant, indicating a negative relationship between population growth and per capita economic growth. Accounting for the endogeneity allows us to isolate the causal relationship between population and per capita GRDP growth. Thus, it becomes clear that growth in GRDP causes increases in population in metropolitan regions, but growth in population does not in itself affect economic growth. As stated in the previous section, other factors are at work.
Much more important than population effects are other spatial concerns; infrastructure factors; industrial issues; and investment climate. In Models 1 and 2, we include the land area of the metropolitan region as a variable. With controls for population, metropolitan areas with larger land areas presumably have more land on which to develop economic activities. In the later time period (2001-2007), we find that this association holds: adding one square kilometer to the land area implies a small but statistically-significant increase in growth over the analysis period.
We use the proportion of manufacturing energy that is self-produced (as opposed to that purchased from PLN) and the number of villages with access to sealed roads as indicators of the quality of infrastructure of the region. The electricity variables have an insignificant impact, but are left in the models due to their theoretical importance and their appropriate signs. For road infrastructure, Model 1 indicates that, for the period of analysis from1993 to 2007 and in higher-income regions (those with GRDP per capita above the national median), a more-extensive sealed-road network is correlated with slower growth. This is probably because there is a positive correlation between income levels and the quality of the road network: regions with higher average income levels tend to have better road networks. Building on a stronger base, they also tend to grow more slowly.
However, an interesting result is derived from Models 3 and 4. Here, we see that a one percent increase in the number of villages with sealed-road access is associated with large and significant increases in GRDP per capita for the periods of analysis from 1993 to 2007 and from 2001 to 2007 compared with lower-income regions. This pattern did not hold for all regions, so that variable was not included in the model. However, the pattern implies that wealthy regions benefit from improvements in the road network, generating larger increments in growth than poorer regions do from similar improvements. The reasons for poorer regions‘ inability to respond similarly to road improvements are possibly related to lower levels of investment in places with improved road access and the preference of businesses looking to establish or expand operations to remain in areas with established agglomeration economies. Thus, improved infrastructure can help wealthy regions, but poor regions may need additional enticements to attract investment and to foster growth.
One such investment could be access to credit. Our models provide four indicators of industrial activity in Indonesia‘s metropolitan regions: EXPY, a measure of how sophisticated the manufacturing is; the
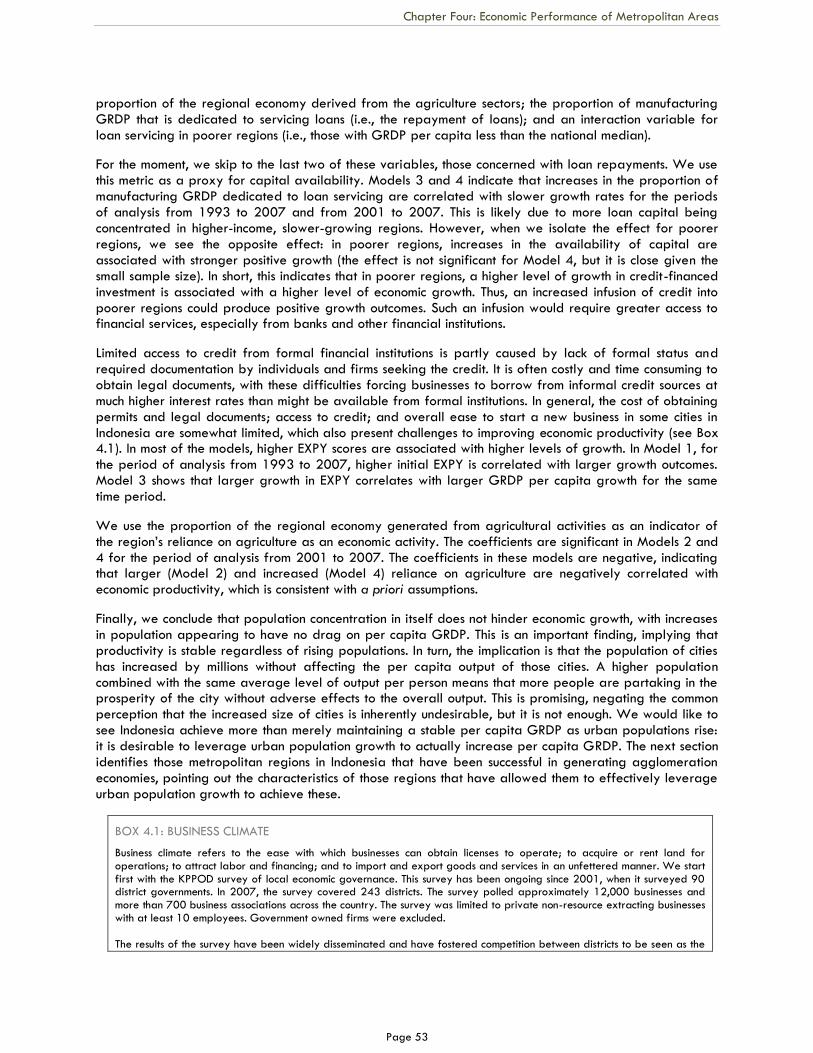
Chapter Four: Economic Performance of Metropolitan Areas
Page 53
proportion of the regional economy derived from the agriculture sectors; the proportion of manufacturing GRDP that is dedicated to servicing loans (i.e., the repayment of loans); and an interaction variable for loan servicing in poorer regions (i.e., those with GRDP per capita less than the national median).
For the moment, we skip to the last two of these variables, those concerned with loan repayments. We use this metric as a proxy for capital availability. Models 3 and 4 indicate that increases in the proportion of manufacturing GRDP dedicated to loan servicing are correlated with slower growth rates for the periods of analysis from 1993 to 2007 and from 2001 to 2007. This is likely due to more loan capital being concentrated in higher-income, slower-growing regions. However, when we isolate the effect for poorer regions, we see the opposite effect: in poorer regions, increases in the availability of capital are associated with stronger positive growth (the effect is not significant for Model 4, but it is close given the small sample size). In short, this indicates that in poorer regions, a higher level of growth in credit-financed investment is associated with a higher level of economic growth. Thus, an increased infusion of credit into poorer regions could produce positive growth outcomes. Such an infusion would require greater access to financial services, especially from banks and other financial institutions.
Limited access to credit from formal financial institutions is partly caused by lack of formal status and required documentation by individuals and firms seeking the credit. It is often costly and time consuming to obtain legal documents, with these difficulties forcing businesses to borrow from informal credit sources at much higher interest rates than might be available from formal institutions. In general, the cost of obtaining permits and legal documents; access to credit; and overall ease to start a new business in some cities in Indonesia are somewhat limited, which also present challenges to improving economic productivity (see Box 4.1). In most of the models, higher EXPY scores are associated with higher levels of growth. In Model 1, for the period of analysis from 1993 to 2007, higher initial EXPY is correlated with larger growth outcomes. Model 3 shows that larger growth in EXPY correlates with larger GRDP per capita growth for the same time period.
We use the proportion of the regional economy generated from agricultural activities as an indicator of the region‘s reliance on agriculture as an economic activity. The coefficients are significant in Models 2 and 4 for the period of analysis from 2001 to 2007. The coefficients in these models are negative, indicating that larger (Model 2) and increased (Model 4) reliance on agriculture are negatively correlated with economic productivity, which is consistent with a priori assumptions.
Finally, we conclude that population concentration in itself does not hinder economic growth, with increases in population appearing to have no drag on per capita GRDP. This is an important finding, implying that productivity is stable regardless of rising populations. In turn, the implication is that the population of cities has increased by millions without affecting the per capita output of those cities. A higher population combined with the same average level of output per person means that more people are partaking in the prosperity of the city without adverse effects to the overall output. This is promising, negating the common perception that the increased size of cities is inherently undesirable, but it is not enough. We would like to see Indonesia achieve more than merely maintaining a stable per capita GRDP as urban populations rise: it is desirable to leverage urban population growth to actually increase per capita GRDP. The next section identifies those metropolitan regions in Indonesia that have been successful in generating agglomeration economies, pointing out the characteristics of those regions that have allowed them to effectively leverage urban population growth to achieve these.
BOX 4.1: BUSINESS CLIMATE
Business climate refers to the ease with which businesses can obtain licenses to operate; to acquire or rent land for operations; to attract labor and financing; and to import and export goods and services in an unfettered manner. We start first with the KPPOD survey of local economic governance. This survey has been ongoing since 2001, when it surveyed 90 district governments. In 2007, the survey covered 243 districts. The survey polled approximately 12,000 businesses and more than 700 business associations across the country. The survey was limited to private non-resource extracting businesses with at least 10 employees. Government owned firms were excluded. The results of the survey have been widely disseminated and have fostered competition between districts to be seen as the
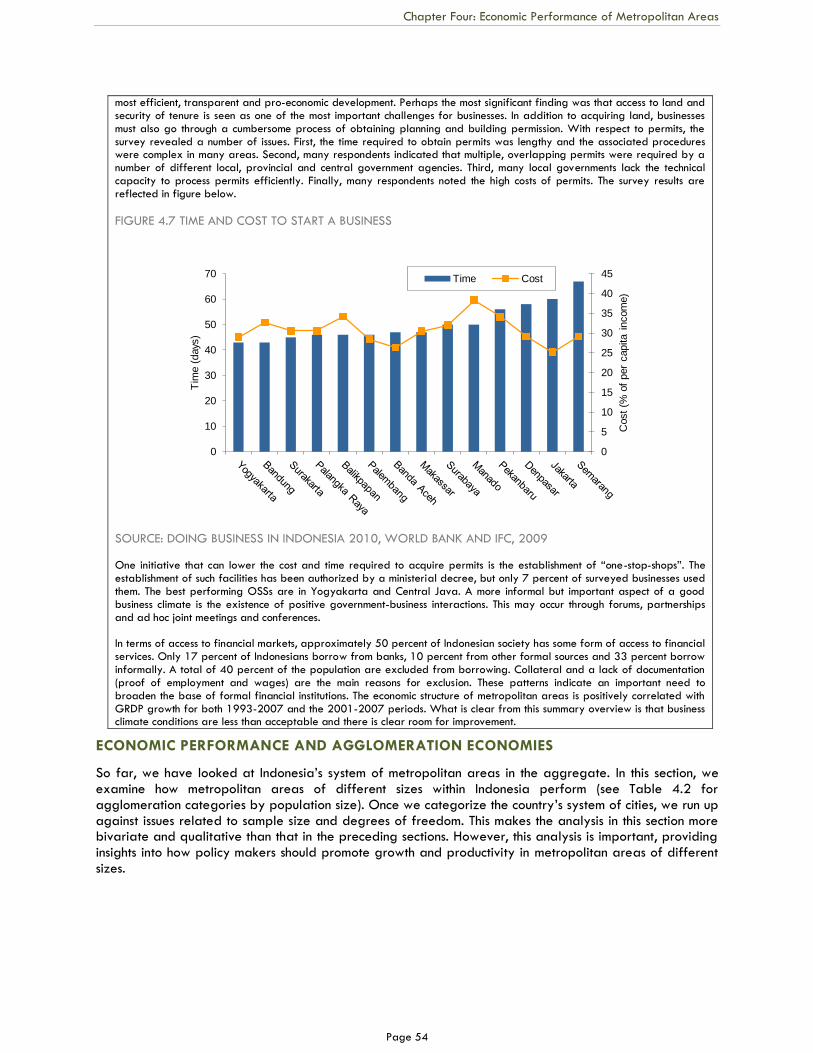
Chapter Four: Economic Performance of Metropolitan Areas
Page 54
most efficient, transparent and pro-economic development. Perhaps the most significant finding was that access to land and security of tenure is seen as one of the most important challenges for businesses. In addition to acquiring land, businesses must also go through a cumbersome process of obtaining planning and building permission. With respect to permits, the survey revealed a number of issues. First, the time required to obtain permits was lengthy and the associated procedures were complex in many areas. Second, many respondents indicated that multiple, overlapping permits were required by a number of different local, provincial and central government agencies. Third, many local governments lack the technical capacity to process permits efficiently. Finally, many respondents noted the high costs of permits. The survey results are reflected in figure below.
FIGURE 4.7 TIME AND COST TO START A BUSINESS
SOURCE: DOING BUSINESS IN INDONESIA 2010, WORLD BANK AND IFC, 2009 One initiative that can lower the cost and time required to acquire permits is the establishment of ―one-stop-shops‖. The establishment of such facilities has been authorized by a ministerial decree, but only 7 percent of surveyed businesses used them. The best performing OSSs are in Yogyakarta and Central Java. A more informal but important aspect of a good business climate is the existence of positive government-business interactions. This may occur through forums, partnerships and ad hoc joint meetings and conferences. In terms of access to financial markets, approximately 50 percent of Indonesian society has some form of access to financial services. Only 17 percent of Indonesians borrow from banks, 10 percent from other formal sources and 33 percent borrow informally. A total of 40 percent of the population are excluded from borrowing. Collateral and a lack of documentation (proof of employment and wages) are the main reasons for exclusion. These patterns indicate an important need to broaden the base of formal financial institutions. The economic structure of metropolitan areas is positively correlated with GRDP growth for both 1993-2007 and the 2001-2007 periods. What is clear from this summary overview is that business climate conditions are less than acceptable and there is clear room for improvement.
ECONOMIC PERFORMANCE AND AGGLOMERATION ECONOMIES
So far, we have looked at Indonesia‘s system of metropolitan areas in the aggregate. In this section, we examine how metropolitan areas of different sizes within Indonesia perform (see Table 4.2 for agglomeration categories by population size). Once we categorize the country‘s system of cities, we run up against issues related to sample size and degrees of freedom. This makes the analysis in this section more bivariate and qualitative than that in the preceding sections. However, this analysis is important, providing insights into how policy makers should promote growth and productivity in metropolitan areas of different sizes.
0
5
10
15
20
25
30
35
40
45
0
10
20
30
40
50
60
70
Cost
(% o
f per
capita i
ncom
e)
Tim
e (
days
)
Time Cost
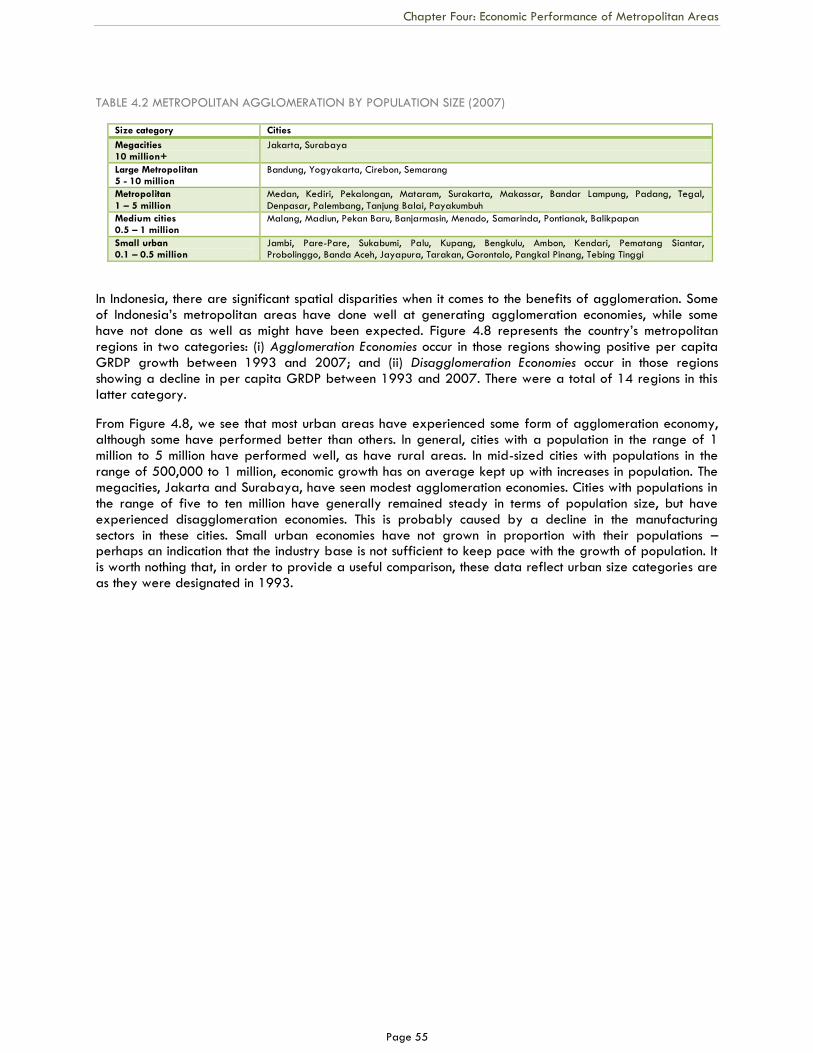
Chapter Four: Economic Performance of Metropolitan Areas
Page 55
TABLE 4.2 METROPOLITAN AGGLOMERATION BY POPULATION SIZE (2007)
Size category Cities
Megacities 10 million+
Jakarta, Surabaya
Large Metropolitan 5 - 10 million
Bandung, Yogyakarta, Cirebon, Semarang
Metropolitan
1 – 5 million
Medan, Kediri, Pekalongan, Mataram, Surakarta, Makassar, Bandar Lampung, Padang, Tegal,
Denpasar, Palembang, Tanjung Balai, Payakumbuh
Medium cities 0.5 – 1 million
Malang, Madiun, Pekan Baru, Banjarmasin, Menado, Samarinda, Pontianak, Balikpapan
Small urban 0.1 – 0.5 million
Jambi, Pare-Pare, Sukabumi, Palu, Kupang, Bengkulu, Ambon, Kendari, Pematang Siantar, Probolinggo, Banda Aceh, Jayapura, Tarakan, Gorontalo, Pangkal Pinang, Tebing Tinggi
In Indonesia, there are significant spatial disparities when it comes to the benefits of agglomeration. Some of Indonesia‘s metropolitan areas have done well at generating agglomeration economies, while some have not done as well as might have been expected. Figure 4.8 represents the country‘s metropolitan regions in two categories: (i) Agglomeration Economies occur in those regions showing positive per capita GRDP growth between 1993 and 2007; and (ii) Disagglomeration Economies occur in those regions showing a decline in per capita GRDP between 1993 and 2007. There were a total of 14 regions in this latter category.
From Figure 4.8, we see that most urban areas have experienced some form of agglomeration economy, although some have performed better than others. In general, cities with a population in the range of 1 million to 5 million have performed well, as have rural areas. In mid-sized cities with populations in the range of 500,000 to 1 million, economic growth has on average kept up with increases in population. The megacities, Jakarta and Surabaya, have seen modest agglomeration economies. Cities with populations in the range of five to ten million have generally remained steady in terms of population size, but have experienced disagglomeration economies. This is probably caused by a decline in the manufacturing sectors in these cities. Small urban economies have not grown in proportion with their populations – perhaps an indication that the industry base is not sufficient to keep pace with the growth of population. It is worth nothing that, in order to provide a useful comparison, these data reflect urban size categories are as they were designated in 1993.
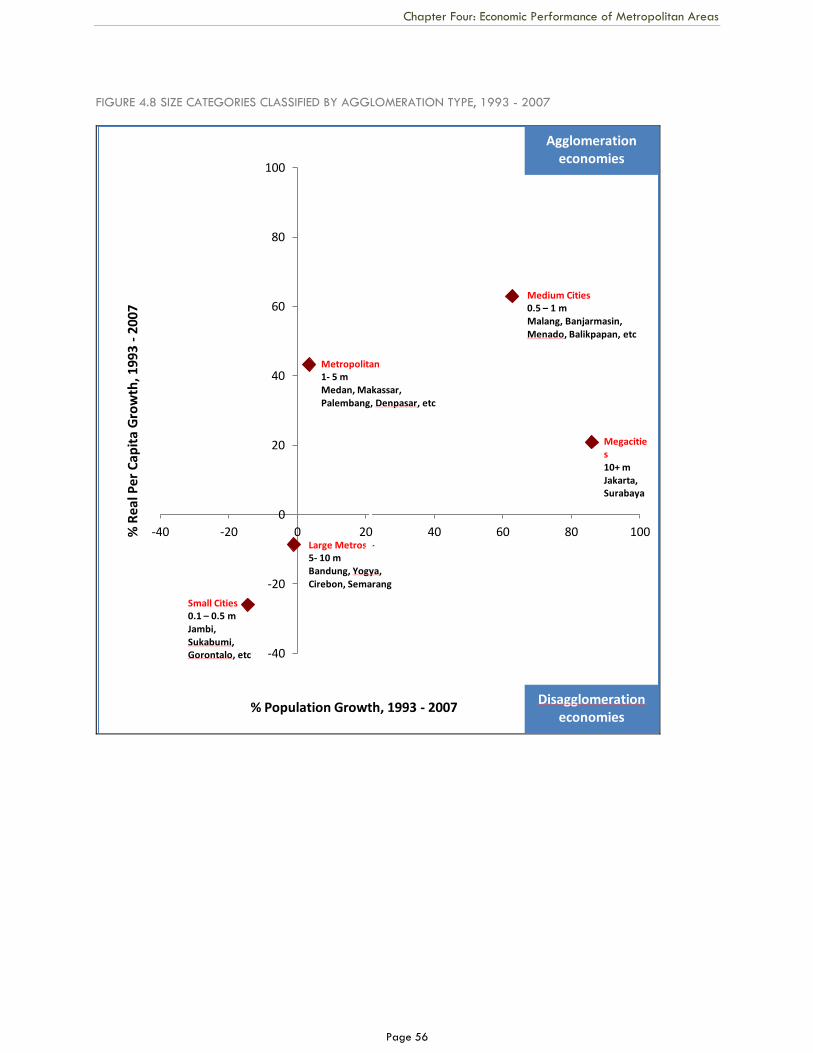
Chapter Four: Economic Performance of Metropolitan Areas
Page 56
FIGURE 4.8 SIZE CATEGORIES CLASSIFIED BY AGGLOMERATION TYPE, 1993 - 2007
-40
-20
0
20
40
60
80
100
-40 -20 0 20 40 60 80 100 % R
eal
Pe
r C
apit
a G
row
th, 1
99
3 -
200
7
Large Metros 5- 10 m Bandung, Yogya, Cirebon, Semarang
Metropolitan 1- 5 m Medan, Makassar, Palembang, Denpasar, etc
Medium Cities 0.5 – 1 m Malang, Banjarmasin, Menado, Balikpapan, etc
Megacities 10+ m Jakarta, Surabaya
Small Cities 0.1 – 0.5 m Jambi, Sukabumi, Gorontalo, etc
% Population Growth, 1993 - 2007
Agglomeration economies
Disagglomeration economies
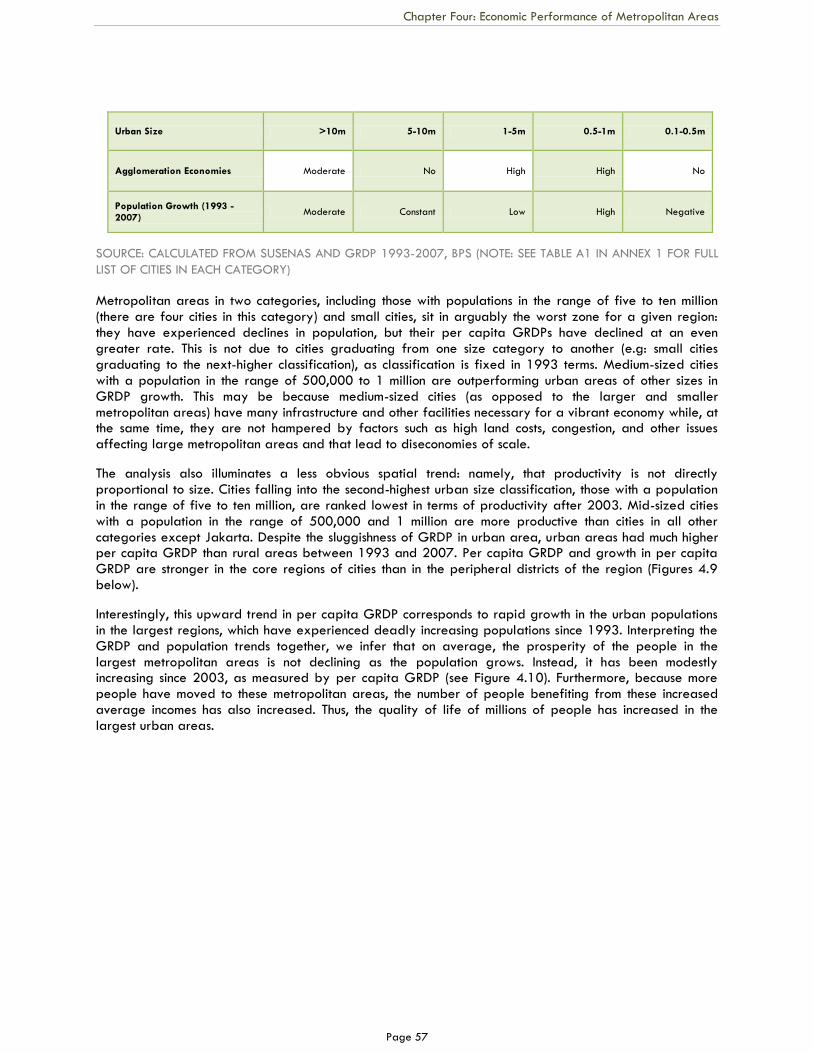
Chapter Four: Economic Performance of Metropolitan Areas
Page 57
Urban Size >10m 5-10m 1-5m 0.5-1m 0.1-0.5m
Agglomeration Economies Moderate No High High No
Population Growth (1993 -2007)
Moderate Constant Low High Negative
SOURCE: CALCULATED FROM SUSENAS AND GRDP 1993-2007, BPS (NOTE: SEE TABLE A1 IN ANNEX 1 FOR FULL
LIST OF CITIES IN EACH CATEGORY)
Metropolitan areas in two categories, including those with populations in the range of five to ten million (there are four cities in this category) and small cities, sit in arguably the worst zone for a given region: they have experienced declines in population, but their per capita GRDPs have declined at an even greater rate. This is not due to cities graduating from one size category to another (e.g: small cities graduating to the next-higher classification), as classification is fixed in 1993 terms. Medium-sized cities with a population in the range of 500,000 to 1 million are outperforming urban areas of other sizes in GRDP growth. This may be because medium-sized cities (as opposed to the larger and smaller metropolitan areas) have many infrastructure and other facilities necessary for a vibrant economy while, at the same time, they are not hampered by factors such as high land costs, congestion, and other issues affecting large metropolitan areas and that lead to diseconomies of scale.
The analysis also illuminates a less obvious spatial trend: namely, that productivity is not directly proportional to size. Cities falling into the second-highest urban size classification, those with a population in the range of five to ten million, are ranked lowest in terms of productivity after 2003. Mid-sized cities with a population in the range of 500,000 and 1 million are more productive than cities in all other categories except Jakarta. Despite the sluggishness of GRDP in urban area, urban areas had much higher per capita GRDP than rural areas between 1993 and 2007. Per capita GRDP and growth in per capita GRDP are stronger in the core regions of cities than in the peripheral districts of the region (Figures 4.9 below).
Interestingly, this upward trend in per capita GRDP corresponds to rapid growth in the urban populations in the largest regions, which have experienced deadly increasing populations since 1993. Interpreting the GRDP and population trends together, we infer that on average, the prosperity of the people in the largest metropolitan areas is not declining as the population grows. Instead, it has been modestly increasing since 2003, as measured by per capita GRDP (see Figure 4.10). Furthermore, because more people have moved to these metropolitan areas, the number of people benefiting from these increased average incomes has also increased. Thus, the quality of life of millions of people has increased in the largest urban areas.
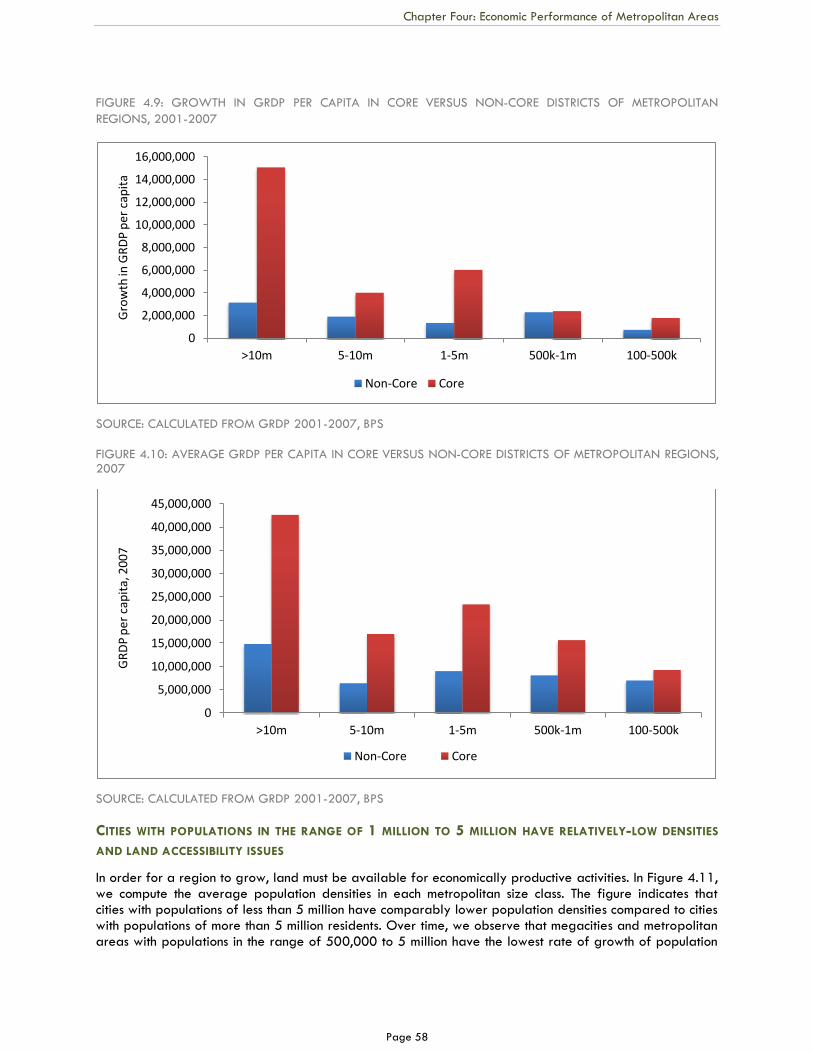
Chapter Four: Economic Performance of Metropolitan Areas
Page 58
FIGURE 4.9: GROWTH IN GRDP PER CAPITA IN CORE VERSUS NON-CORE DISTRICTS OF METROPOLITAN
REGIONS, 2001-2007
SOURCE: CALCULATED FROM GRDP 2001-2007, BPS
FIGURE 4.10: AVERAGE GRDP PER CAPITA IN CORE VERSUS NON-CORE DISTRICTS OF METROPOLITAN REGIONS, 2007
SOURCE: CALCULATED FROM GRDP 2001-2007, BPS
CITIES WITH POPULATIONS IN THE RANGE OF 1 MILLION TO 5 MILLION HAVE RELATIVELY-LOW DENSITIES
AND LAND ACCESSIBILITY ISSUES
In order for a region to grow, land must be available for economically productive activities. In Figure 4.11, we compute the average population densities in each metropolitan size class. The figure indicates that cities with populations of less than 5 million have comparably lower population densities compared to cities with populations of more than 5 million residents. Over time, we observe that megacities and metropolitan areas with populations in the range of 500,000 to 5 million have the lowest rate of growth of population
0
2,000,000
4,000,000
6,000,000
8,000,000
10,000,000
12,000,000
14,000,000
16,000,000
>10m 5-10m 1-5m 500k-1m 100-500k
Gro
wth
in G
RD
P p
er c
apit
a
Non-Core Core
0
5,000,000
10,000,000
15,000,000
20,000,000
25,000,000
30,000,000
35,000,000
40,000,000
45,000,000
>10m 5-10m 1-5m 500k-1m 100-500k
GR
DP
pe
r ca
pit
a, 2
00
7
Non-Core Core
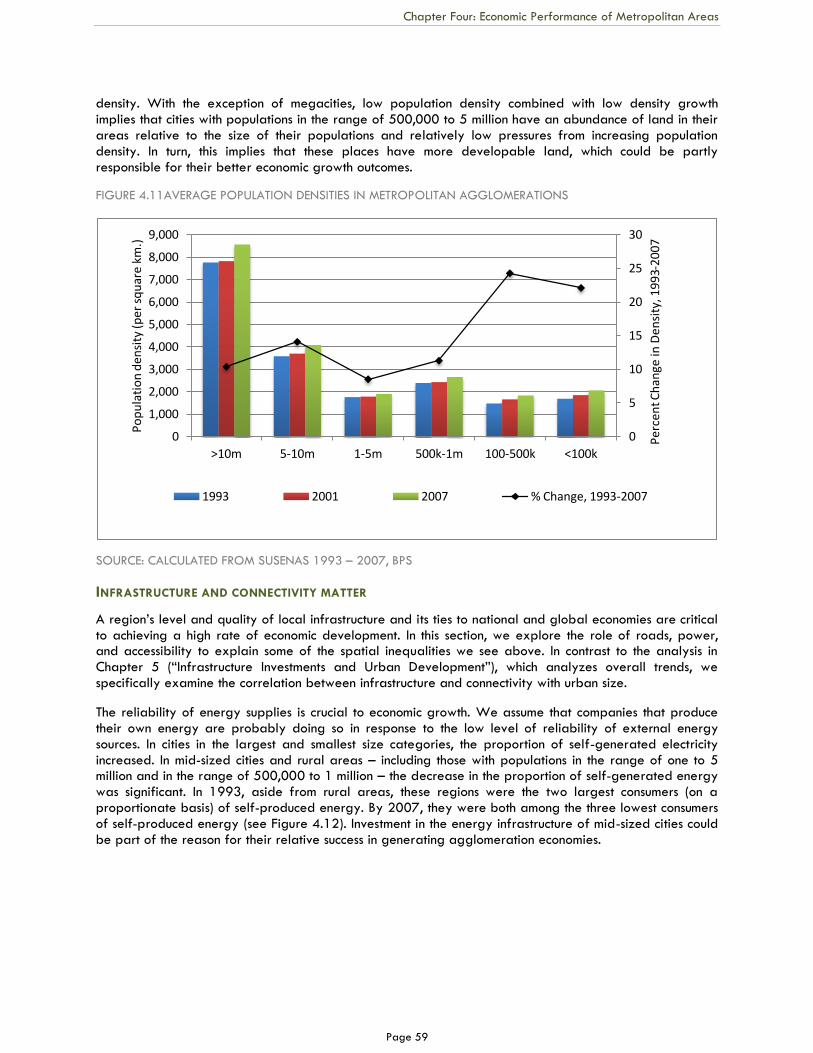
Chapter Four: Economic Performance of Metropolitan Areas
Page 59
density. With the exception of megacities, low population density combined with low density growth implies that cities with populations in the range of 500,000 to 5 million have an abundance of land in their areas relative to the size of their populations and relatively low pressures from increasing population density. In turn, this implies that these places have more developable land, which could be partly responsible for their better economic growth outcomes.
FIGURE 4.11AVERAGE POPULATION DENSITIES IN METROPOLITAN AGGLOMERATIONS
SOURCE: CALCULATED FROM SUSENAS 1993 – 2007, BPS
INFRASTRUCTURE AND CONNECTIVITY MATTER
A region‘s level and quality of local infrastructure and its ties to national and global economies are critical to achieving a high rate of economic development. In this section, we explore the role of roads, power, and accessibility to explain some of the spatial inequalities we see above. In contrast to the analysis in Chapter 5 (―Infrastructure Investments and Urban Development‖), which analyzes overall trends, we specifically examine the correlation between infrastructure and connectivity with urban size.
The reliability of energy supplies is crucial to economic growth. We assume that companies that produce their own energy are probably doing so in response to the low level of reliability of external energy sources. In cities in the largest and smallest size categories, the proportion of self-generated electricity increased. In mid-sized cities and rural areas – including those with populations in the range of one to 5 million and in the range of 500,000 to 1 million – the decrease in the proportion of self-generated energy was significant. In 1993, aside from rural areas, these regions were the two largest consumers (on a proportionate basis) of self-produced energy. By 2007, they were both among the three lowest consumers of self-produced energy (see Figure 4.12). Investment in the energy infrastructure of mid-sized cities could be part of the reason for their relative success in generating agglomeration economies.
0
5
10
15
20
25
30
0
1,000
2,000
3,000
4,000
5,000
6,000
7,000
8,000
9,000
>10m 5-10m 1-5m 500k-1m 100-500k <100k
Pe
rce
nt C
han
ge in
De
nsi
ty, 1
99
3-2
00
7
Po
pu
lati
on
den
sity
(per
sq
uar
e km
.)
1993 2001 2007 % Change, 1993-2007
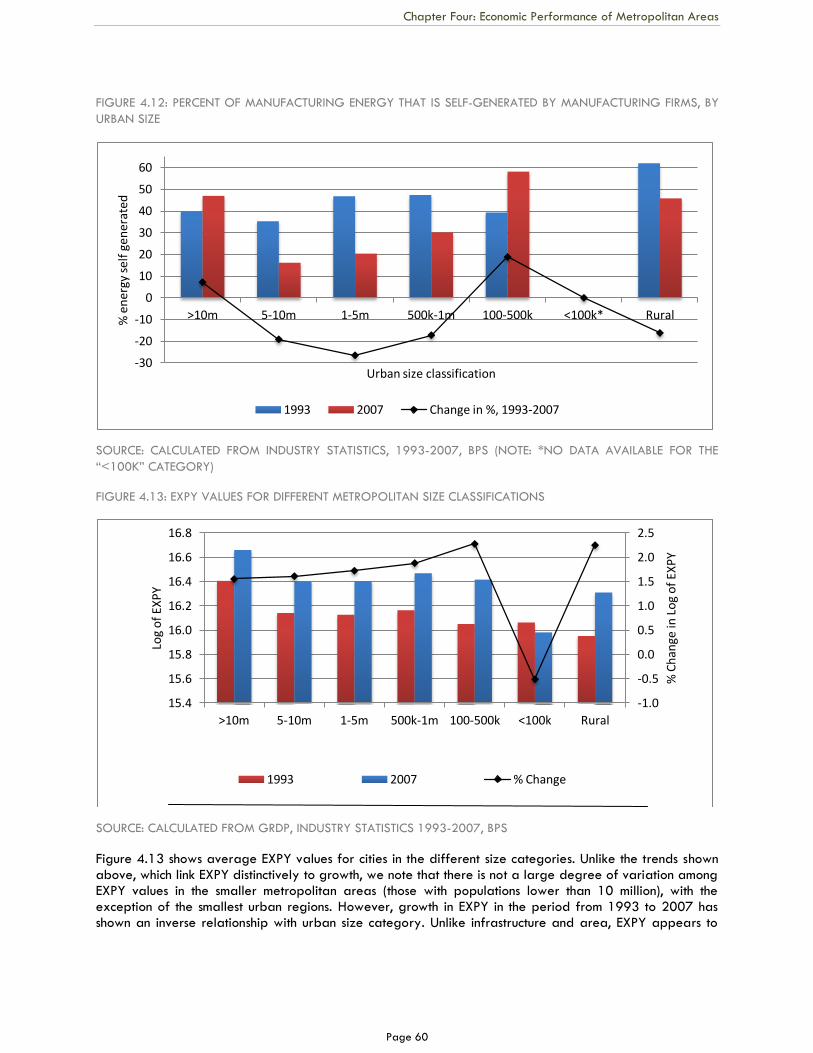
Chapter Four: Economic Performance of Metropolitan Areas
Page 60
FIGURE 4.12: PERCENT OF MANUFACTURING ENERGY THAT IS SELF-GENERATED BY MANUFACTURING FIRMS, BY
URBAN SIZE
SOURCE: CALCULATED FROM INDUSTRY STATISTICS, 1993-2007, BPS (NOTE: *NO DATA AVAILABLE FOR THE
―<100K‖ CATEGORY)
FIGURE 4.13: EXPY VALUES FOR DIFFERENT METROPOLITAN SIZE CLASSIFICATIONS
SOURCE: CALCULATED FROM GRDP, INDUSTRY STATISTICS 1993-2007, BPS
Figure 4.13 shows average EXPY values for cities in the different size categories. Unlike the trends shown above, which link EXPY distinctively to growth, we note that there is not a large degree of variation among EXPY values in the smaller metropolitan areas (those with populations lower than 10 million), with the exception of the smallest urban regions. However, growth in EXPY in the period from 1993 to 2007 has shown an inverse relationship with urban size category. Unlike infrastructure and area, EXPY appears to
-30
-20
-10
0
10
20
30
40
50
60
>10m 5-10m 1-5m 500k-1m 100-500k <100k* Rural % e
ner
gy s
elf
gen
erat
ed
Urban size classification
1993 2007 Change in %, 1993-2007
-1.0
-0.5
0.0
0.5
1.0
1.5
2.0
2.5
15.4
15.6
15.8
16.0
16.2
16.4
16.6
16.8
>10m 5-10m 1-5m 500k-1m 100-500k <100k Rural
% C
han
ge in
Lo
g o
f EX
PY
Log
of
EXP
Y
1993 2007 % Change
Chapter Four: Economic Performance of Metropolitan Areas
Page 61
be less related to agglomeration size and more related to location-specific factors such as access to shipping hubs.
Urban regions with populations in the ranges of one to 5 million and of 500,000 to one million showed strong growth in a number of key sectors. Apart from rural areas, only mid-sized cities with populations in the range of 100,000 and 5 million saw growth in manufacturing sectors, with the largest gains amongst those in the one to 5 million population category. Over the analysis period, only agglomeration areas in the 500,000 to 1 million population category and one to 5 million population category experienced increasing share of GRDP generated in the financial services and construction sectors. Cities with populations in the range of 500,000 to 1 million saw the largest increase in the trade, restaurant, and hotel sector. The largest growth in mining (excluding oil and gas) occurred in cities with populations in the range of one to ten million. Growth in these sectors could be because of the strong support in terms of land availability, infrastructure, and energy factors.
One key element for growth is investment. When businesses improve or expand operations, growth occurs. Whether businesses invest can depend on many factors, including availability of investment capital; incentives and disincentives for companies to invest money in growing output; stable regulatory and governance environments; fair taxation systems; etc. We use the proportion of manufacturing value-added in the district that is dedicated to the repayment of loan interest as an indicator of the level of capital investment in that district. This variable was included to provide a proxy for the amount of investment capital that is accessed by industry in metropolitan and rural regions. We find that growth in the proportion of manufacturing value added dedicated to the repayment of investment interest since 1993 has been substantial – in some cases more than twenty times the investment capital available – and is highest in metropolitan areas with populations in the range of 5 to 10 million and 1 to 5 million. It could also be a proxy for companies that have preferential access to capital (SOEs and big enterprises), which might explain the negative results for the overall relationship.
INTEGRATING THE STORY
By far, cities with populations in the range of 1 to 5 million and of 500,000 to 1 million have created more favorable conditions for growth than other cities. They are favorable in terms of a majority of the factors described here, unlike metropolitan areas that fall into other size categories, which are not favorable with regards to most factors. This implies that there are a variety of factors that explain why cities in the size categories have been so successful at generating agglomeration economies, but that the combination of favorable factors has produced agglomeration in aggregate.
CONCLUSION
This chapter examines the extent of agglomeration in metropolitan areas with varying population sizes and the degree to which they have successfully leveraged the advantages of agglomeration economies. As discussed in previous chapters, Indonesia overall has not fully leveraged the economic benefits of rapid urbanization. Nationally, the proportion of GRDP generated in urban areas has remained relatively stable at around 60 percent, while proportion of the total population living in urban areas has increased steadily in the period from 1993 to 2007. It is clear that the rapid growth in urbanization does not in itself result in high economic growth. It is also clear that many regions have failed to generate agglomeration economies.
Compared to cities falling into other size categories, the mid-sized cities have performed best in terms of leveraging the advantages of agglomeration economies. Cities with populations in the range of 500,000 to 5 million have on average been best able to grow their economies at a level equal to, or faster than, the rate of growth of their population. Analysis of trends in land availability, population, infrastructure, investment climate, and economic sector data, indicate that these mid-sized cities have been successful at leveraging population growth because this growth has been combined with conducive conditions and investment. No one factor improves economic productivity, but the combination of targeted investment in many areas can have positive effects.
Chapter Four: Economic Performance of Metropolitan Areas
Page 62
Mid-sized cities‘ productivity (GRDP per capita) still lags far behind Jakarta‘s. Given Jakarta‘s large population, we expect marginal growth there to yield less gain than marginal growth in smaller cities. Still, these high-agglomerating mid-sized regions have benefitted from the combination of their significant populations and their lack of agglomeration diseconomies that we see in Jakarta (e.g., congestion, shortage of land and high rents). Our data indicates that a variety of interventions can increase the viability of a metropolitan area – particularly since growth is more closely related to infrastructure, accessibility, and industrial factors than to population.
Many regions in other size categories can learn from the experience of the mid-sized regions. Most successful metropolitan regions have lessons to offer to outsiders, although some factors that make some of these regions relatively productive cannot be mimicked (e.g., land availability for the development of housing and industry) which allows for economic growth. Land availability is constrained in larger, more-dense regions, as land in these areas is relatively expensive. However, even dense smaller metropolitan regions can formulate settlement patterns and provide land for productive use by taking advantage of their hinterlands.
Unlike land availability, some of the strengths of mid-sized cities can be emulated by other regions. Reliable energy, for instance, is likely to strengthen any region‘s economic outcomes. Similarly, increased connectivity to major ports of entry and major markets and increasing the capital available for investment are likely to have positive impacts.
With metropolitan areas growing at different paces, spatial inequalities within and between regions is inevitable and should be tolerated. This is consistent with a core finding in the World Development Report (World Bank, 2009) that spatially-uneven development in the short term can lead to larger returns in the longer term, as evidenced by the experience of countries such as China. Obviously, these spatial inequalities need to be addressed in the future by investing in infrastructure and improving access to basic services in the least developed regions.
POLICY RECOMMENDATIONS
Ensure that the periurban areas are better prepared to receive industry and to otherwise engage
in economic activity by improving road systems, the availability of electrical power, and other
infrastructure to support economic activities in the core cities;
Increase the sophistication of regional economies by facilitating and encouraging a move to higher
value added production, such as producing and exporting higher value added products which are
in demand by international market. This is possible if policy makers align economic development
strategies with each location‘s specific economic characteristics and comparative advantages,
instead of designing new growth centers and economic zones in areas that lack these
characteristics and advantages;
Improve access to investment credit and encourage the development of a more conducive business
climate to increase economic productivity and induce a higher rate of growth, especially in poorer
regions. Specific urban development strategies must be formulated for metropolitan areas in each
size category, since different sized metropolitan areas must overcome different challenges if they
are to reap the benefits of agglomeration economies.
Page 63
CHAPTER 5
INFRASTRUCTURE INVESTMENTS AND URBAN
DEVELOPMENT
This chapter examines local government capital spending and the effect of this expenditure on regional
economic growth. The period of analysis is from 2003 to 2007, the years for which actual data for capital
spending by district governments is available.
Public capital can provide a significant stimulus for economic growth through both its direct and indirect effects. Public capital may be seen as a government-controlled factor of production, or an intermediate good. Increases in the stock of that capital may thus directly stimulate growth in economic output. Indirect effects derived from the possible efficiency-enhancing externalities associated with public capital, such as those related to improvements to health, education, and communications facilities, among others, planning, in turn, facilitate increases in economic output (Straub, 2008).
Urbanization generally supports economic growth, with the empirical association between urbanization and the level and rate of growth of economic output being well-established. However, association is not the same thing as causality: as previous chapters have shown, urbanization itself does not cause these outcomes. Rather, they are the result of the existence and the degree of strength of agglomeration economies. Agglomeration economies facilitate productivity gains that are derived from the increased specialization, reduced transaction costs, improved education, and closer proximity between economic actors that exist in urban areas. It is these agglomeration economies, not urbanization in itself, that have the potential to stimulate economic growth (Quigley, 2008).
LOCAL GOVERNMENT CAPITAL SPENDING
At present, the total value of sub-national government (provincial and kabupaten/kota) capital spending amounts to approximately 1.5-2.0 percent of total national GDP. Expenditure by such governments and their agencies represents about half of the total value of public capital spending in Indonesia. Local government spending accounts for an estimated 85 percent of the sub-national total. Capital spending by district governments currently comprises approximately 25 percent of total local expenditure budgets.
The relative level of local government capital spending may seem to be of reasonable magnitude. However, local capital spending appears significantly lower when this is offset against the depreciation of local public assets. On the basis of plausible assumptions regarding the age of local public assets, the value of local government investment offset against the depreciation in the value of these assets is estimated to be only somewhere between 5-10 percent of local expenditure budgets (Lewis and Oosterman, 2010).
Capital spending by urban local governments is especially limited. In fact, the value of per capita local government capital spending steadily decreases as districts become more urbanized (i.e. as the proportion of the population that resides in urban areas rises). Figure 5.1 shows local government capital expenditure as a function of district urbanization levels, measured in quintiles.
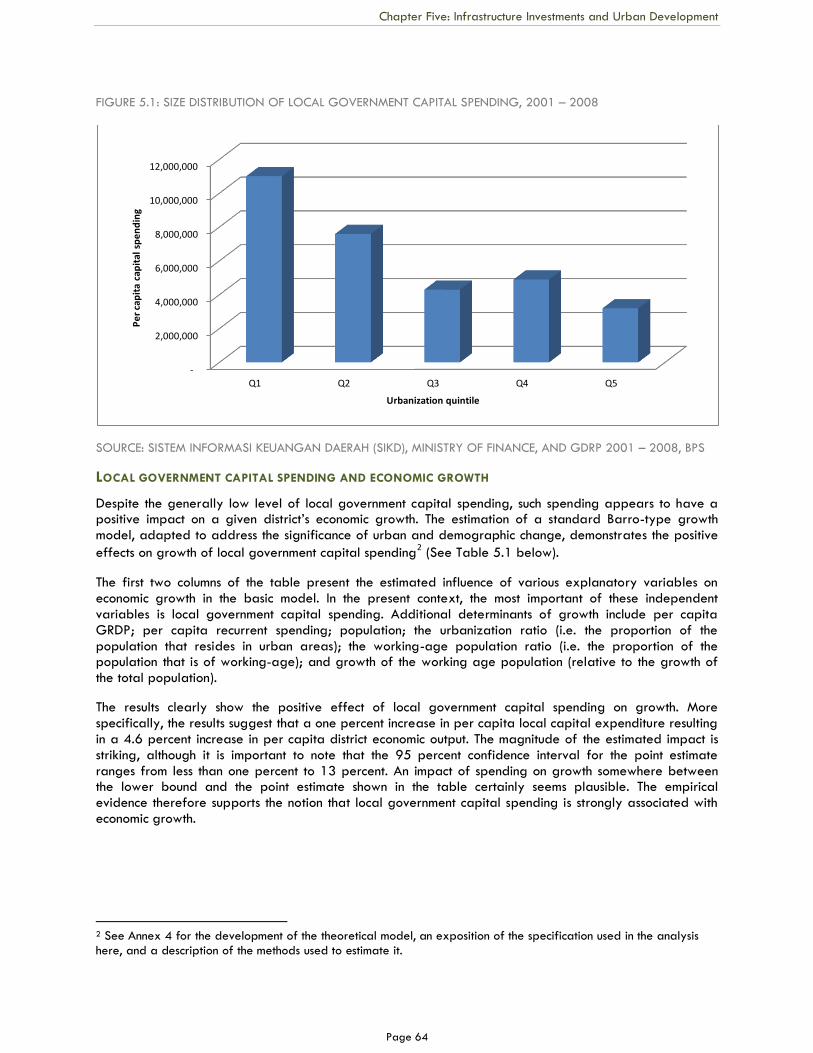
Chapter Five: Infrastructure Investments and Urban Development
Page 64
FIGURE 5.1: SIZE DISTRIBUTION OF LOCAL GOVERNMENT CAPITAL SPENDING, 2001 – 2008
SOURCE: SISTEM INFORMASI KEUANGAN DAERAH (SIKD), MINISTRY OF FINANCE, AND GDRP 2001 – 2008, BPS
LOCAL GOVERNMENT CAPITAL SPENDING AND ECONOMIC GROWTH
Despite the generally low level of local government capital spending, such spending appears to have a positive impact on a given district‘s economic growth. The estimation of a standard Barro-type growth model, adapted to address the significance of urban and demographic change, demonstrates the positive
effects on growth of local government capital spending2 (See Table 5.1 below).
The first two columns of the table present the estimated influence of various explanatory variables on economic growth in the basic model. In the present context, the most important of these independent variables is local government capital spending. Additional determinants of growth include per capita GRDP; per capita recurrent spending; population; the urbanization ratio (i.e. the proportion of the population that resides in urban areas); the working-age population ratio (i.e. the proportion of the population that is of working-age); and growth of the working age population (relative to the growth of the total population).
The results clearly show the positive effect of local government capital spending on growth. More specifically, the results suggest that a one percent increase in per capita local capital expenditure resulting in a 4.6 percent increase in per capita district economic output. The magnitude of the estimated impact is striking, although it is important to note that the 95 percent confidence interval for the point estimate ranges from less than one percent to 13 percent. An impact of spending on growth somewhere between the lower bound and the point estimate shown in the table certainly seems plausible. The empirical evidence therefore supports the notion that local government capital spending is strongly associated with economic growth.
2 See Annex 4 for the development of the theoretical model, an exposition of the specification used in the analysis here, and a description of the methods used to estimate it.
-
2,000,000
4,000,000
6,000,000
8,000,000
10,000,000
12,000,000
Q1 Q2 Q3 Q4 Q5
Pe
r ca
pit
a ca
pit
al s
pe
nd
ing
Urbanization quintile
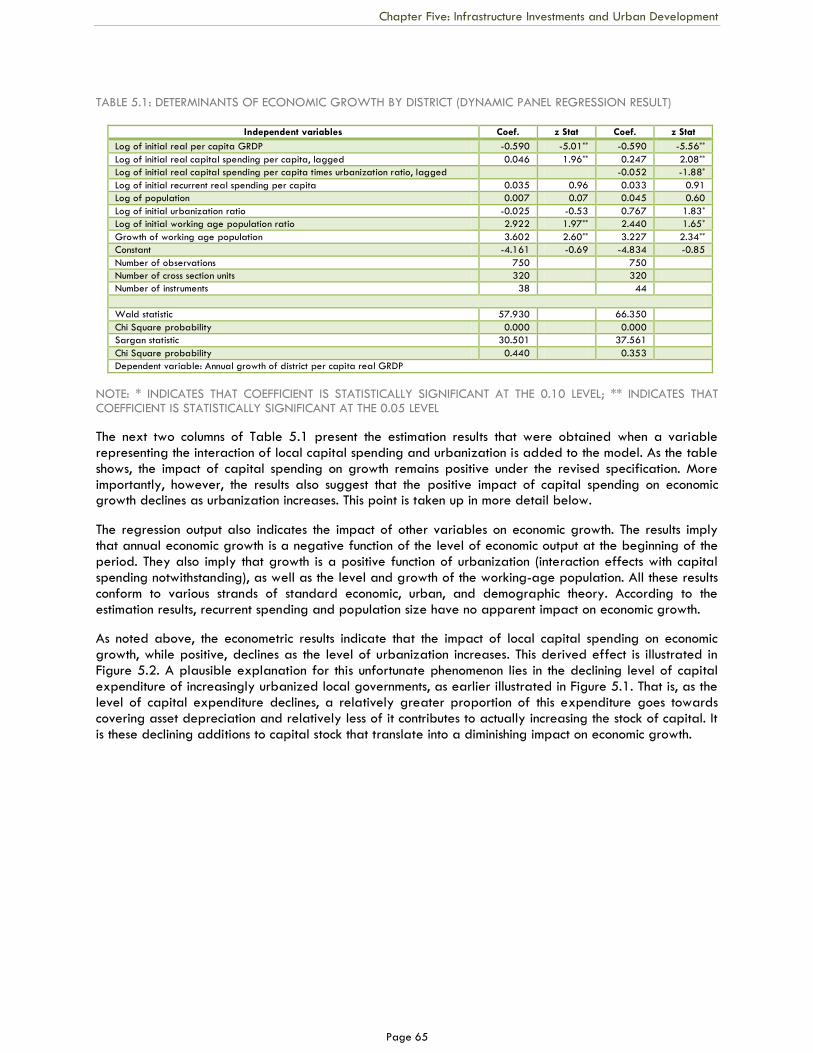
Chapter Five: Infrastructure Investments and Urban Development
Page 65
TABLE 5.1: DETERMINANTS OF ECONOMIC GROWTH BY DISTRICT (DYNAMIC PANEL REGRESSION RESULT)
Independent variables Coef. z Stat Coef. z Stat
Log of initial real per capita GRDP -0.590 -5.01** -0.590 -5.56**
Log of initial real capital spending per capita, lagged 0.046 1.96** 0.247 2.08**
Log of initial real capital spending per capita times urbanization ratio, lagged -0.052 -1.88*
Log of initial recurrent real spending per capita 0.035 0.96 0.033 0.91
Log of population 0.007 0.07 0.045 0.60
Log of initial urbanization ratio -0.025 -0.53 0.767 1.83*
Log of initial working age population ratio 2.922 1.97** 2.440 1.65*
Growth of working age population 3.602 2.60** 3.227 2.34**
Constant -4.161 -0.69 -4.834 -0.85
Number of observations 750 750
Number of cross section units 320 320
Number of instruments 38 44
Wald statistic 57.930 66.350
Chi Square probability 0.000 0.000
Sargan statistic 30.501 37.561
Chi Square probability 0.440 0.353
Dependent variable: Annual growth of district per capita real GRDP
NOTE: * INDICATES THAT COEFFICIENT IS STATISTICALLY SIGNIFICANT AT THE 0.10 LEVEL; ** INDICATES THAT COEFFICIENT IS STATISTICALLY SIGNIFICANT AT THE 0.05 LEVEL
The next two columns of Table 5.1 present the estimation results that were obtained when a variable representing the interaction of local capital spending and urbanization is added to the model. As the table shows, the impact of capital spending on growth remains positive under the revised specification. More importantly, however, the results also suggest that the positive impact of capital spending on economic growth declines as urbanization increases. This point is taken up in more detail below.
The regression output also indicates the impact of other variables on economic growth. The results imply that annual economic growth is a negative function of the level of economic output at the beginning of the period. They also imply that growth is a positive function of urbanization (interaction effects with capital spending notwithstanding), as well as the level and growth of the working-age population. All these results conform to various strands of standard economic, urban, and demographic theory. According to the estimation results, recurrent spending and population size have no apparent impact on economic growth.
As noted above, the econometric results indicate that the impact of local capital spending on economic growth, while positive, declines as the level of urbanization increases. This derived effect is illustrated in Figure 5.2. A plausible explanation for this unfortunate phenomenon lies in the declining level of capital expenditure of increasingly urbanized local governments, as earlier illustrated in Figure 5.1. That is, as the level of capital expenditure declines, a relatively greater proportion of this expenditure goes towards covering asset depreciation and relatively less of it contributes to actually increasing the stock of capital. It is these declining additions to capital stock that translate into a diminishing impact on economic growth.
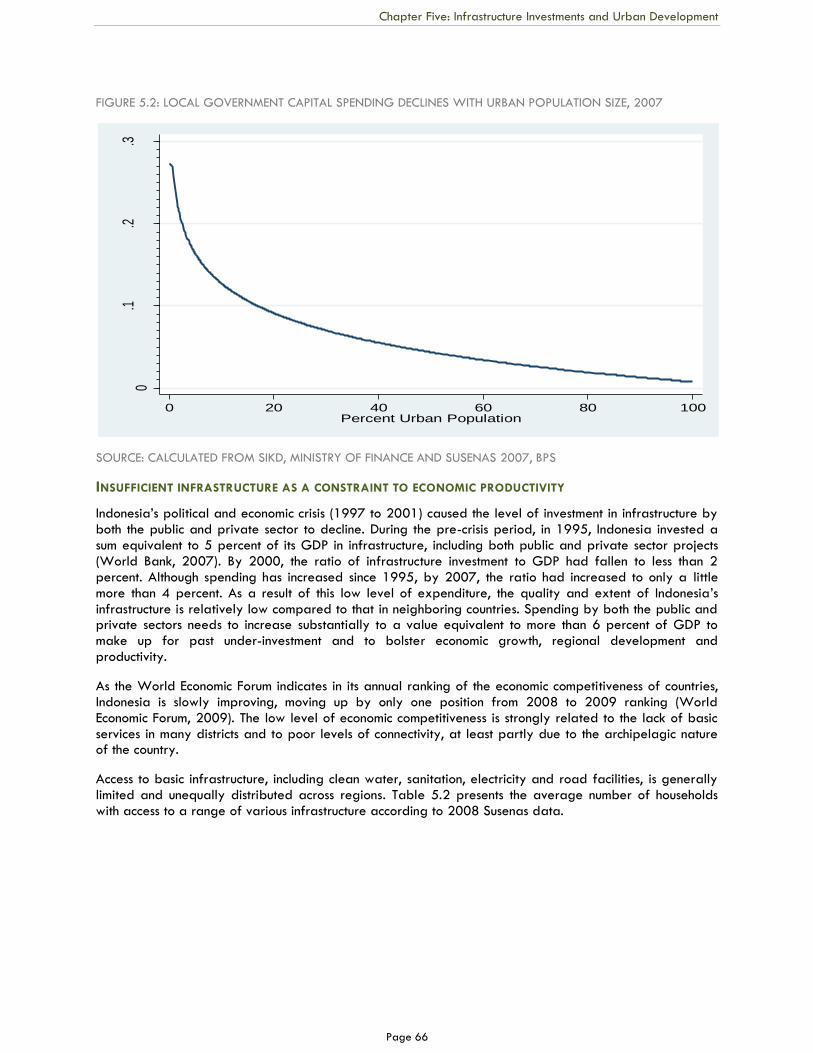
Chapter Five: Infrastructure Investments and Urban Development
Page 66
FIGURE 5.2: LOCAL GOVERNMENT CAPITAL SPENDING DECLINES WITH URBAN POPULATION SIZE, 2007
SOURCE: CALCULATED FROM SIKD, MINISTRY OF FINANCE AND SUSENAS 2007, BPS
INSUFFICIENT INFRASTRUCTURE AS A CONSTRAINT TO ECONOMIC PRODUCTIVITY
Indonesia‘s political and economic crisis (1997 to 2001) caused the level of investment in infrastructure by both the public and private sector to decline. During the pre-crisis period, in 1995, Indonesia invested a sum equivalent to 5 percent of its GDP in infrastructure, including both public and private sector projects (World Bank, 2007). By 2000, the ratio of infrastructure investment to GDP had fallen to less than 2 percent. Although spending has increased since 1995, by 2007, the ratio had increased to only a little more than 4 percent. As a result of this low level of expenditure, the quality and extent of Indonesia‘s infrastructure is relatively low compared to that in neighboring countries. Spending by both the public and private sectors needs to increase substantially to a value equivalent to more than 6 percent of GDP to make up for past under-investment and to bolster economic growth, regional development and productivity.
As the World Economic Forum indicates in its annual ranking of the economic competitiveness of countries, Indonesia is slowly improving, moving up by only one position from 2008 to 2009 ranking (World Economic Forum, 2009). The low level of economic competitiveness is strongly related to the lack of basic services in many districts and to poor levels of connectivity, at least partly due to the archipelagic nature of the country.
Access to basic infrastructure, including clean water, sanitation, electricity and road facilities, is generally limited and unequally distributed across regions. Table 5.2 presents the average number of households with access to a range of various infrastructure according to 2008 Susenas data.
0.1
.2.3
Perc
enta
ge In
crea
se in
Eco
nom
ic O
utpu
t
0 20 40 60 80 100Percent Urban Population
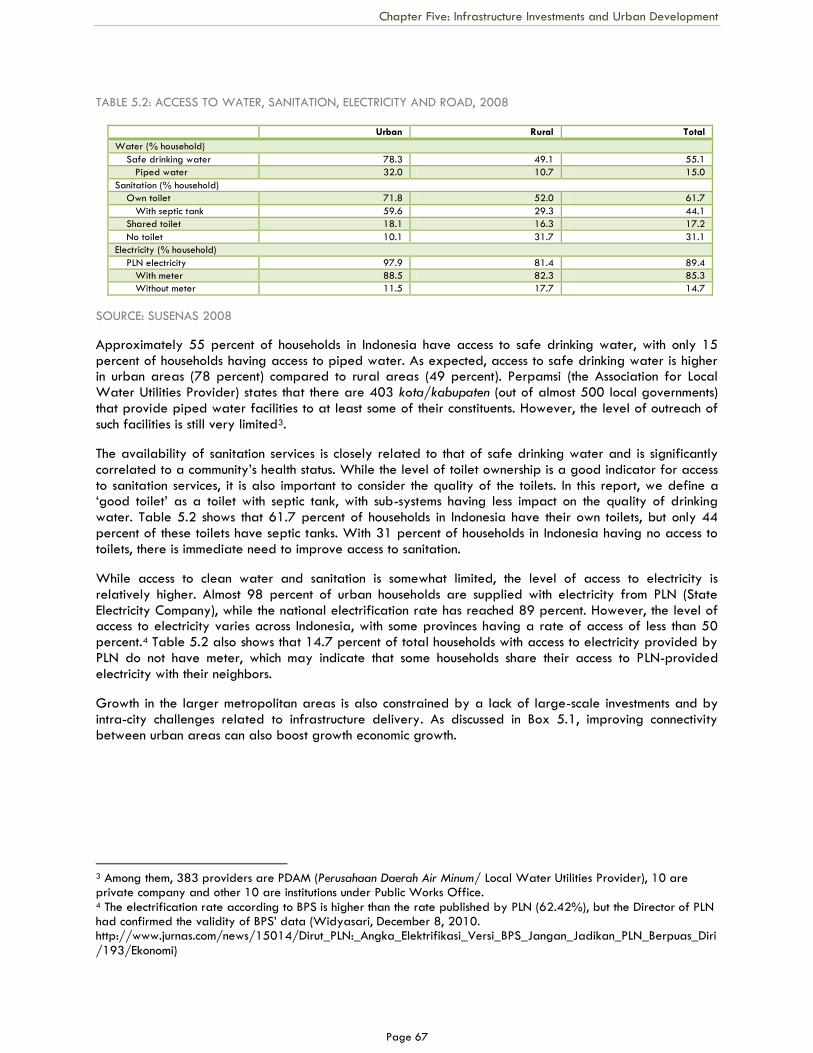
Chapter Five: Infrastructure Investments and Urban Development
Page 67
TABLE 5.2: ACCESS TO WATER, SANITATION, ELECTRICITY AND ROAD, 2008
Urban Rural Total
Water (% household)
Safe drinking water 78.3 49.1 55.1
Piped water 32.0 10.7 15.0
Sanitation (% household)
Own toilet 71.8 52.0 61.7
With septic tank 59.6 29.3 44.1
Shared toilet 18.1 16.3 17.2
No toilet 10.1 31.7 31.1
Electricity (% household)
PLN electricity 97.9 81.4 89.4
With meter 88.5 82.3 85.3
Without meter 11.5 17.7 14.7
SOURCE: SUSENAS 2008
Approximately 55 percent of households in Indonesia have access to safe drinking water, with only 15 percent of households having access to piped water. As expected, access to safe drinking water is higher in urban areas (78 percent) compared to rural areas (49 percent). Perpamsi (the Association for Local Water Utilities Provider) states that there are 403 kota/kabupaten (out of almost 500 local governments) that provide piped water facilities to at least some of their constituents. However, the level of outreach of such facilities is still very limited3.
The availability of sanitation services is closely related to that of safe drinking water and is significantly correlated to a community‘s health status. While the level of toilet ownership is a good indicator for access to sanitation services, it is also important to consider the quality of the toilets. In this report, we define a ‗good toilet‘ as a toilet with septic tank, with sub-systems having less impact on the quality of drinking water. Table 5.2 shows that 61.7 percent of households in Indonesia have their own toilets, but only 44 percent of these toilets have septic tanks. With 31 percent of households in Indonesia having no access to toilets, there is immediate need to improve access to sanitation.
While access to clean water and sanitation is somewhat limited, the level of access to electricity is relatively higher. Almost 98 percent of urban households are supplied with electricity from PLN (State Electricity Company), while the national electrification rate has reached 89 percent. However, the level of access to electricity varies across Indonesia, with some provinces having a rate of access of less than 50 percent.4 Table 5.2 also shows that 14.7 percent of total households with access to electricity provided by PLN do not have meter, which may indicate that some households share their access to PLN-provided electricity with their neighbors.
Growth in the larger metropolitan areas is also constrained by a lack of large-scale investments and by intra-city challenges related to infrastructure delivery. As discussed in Box 5.1, improving connectivity between urban areas can also boost growth economic growth.
3 Among them, 383 providers are PDAM (Perusahaan Daerah Air Minum/ Local Water Utilities Provider), 10 are private company and other 10 are institutions under Public Works Office. 4 The electrification rate according to BPS is higher than the rate published by PLN (62.42%), but the Director of PLN had confirmed the validity of BPS‘ data (Widyasari, December 8, 2010. http://www.jurnas.com/news/15014/Dirut_PLN:_Angka_Elektrifikasi_Versi_BPS_Jangan_Jadikan_PLN_Berpuas_Diri/193/Ekonomi)
Chapter Five: Infrastructure Investments and Urban Development
Page 68
BOX 5.1: INDONESIAN CONNECTIVITY
Indonesia‘s road network is inadequate. It is highly congested, with road construction bailing to keep pace with the country‘s level of vehicle ownership: in the period from 2000 to 2004, the network expanded by 12 percent while the number of vehicles per 1,000 persons increased by 80 percent (World Bank, 2005a). Road construction is needed to better link the country‘s cities, through means such as the proposed trans-Java highway. Road construction is also necessary to facilitate circulation within metropolitan areas, through means such as ring roads, radial corridors, more paved roads and the provision of mass transit systems. Unfortunately, intercity road construction is constrained by the failure of many concessionaires to successfully launch projects. Inadequate road maintenance is also an issue. With the decentralization of government responsibilities, the quality and extent of provincial and district roads is deteriorating, with only 52 percent of district roads being paved (World Bank, 2004). In 1997, the total value of investments in roads averaged at 2.2 percent of the country‘s GDP: in 2007, the ratio of expenditure on roads to GDP had fallen to 0.7 percent. On the other hand, between 1987 and 2008, the number of vehicles per kilometer of road increased from 35.1 to 149.1.
Congestion hampers transportation in the country‘s largest cities. Traffic congestion continues to act as a constraint in large cities, such as Jakarta, Bandung, Medan, Surabaya, and in many satellite towns, such as Bogor, Bekasi, and Tangerang. Public transport, including buses, minibuses, and taxis, is commonly used despite the poor quality of these public transportation facilities. In the case of Java and Sumatra, the GOI should consider constructing trans-Java and trans-Sumatera railways and highways to increase the efficiency of survey transportation, particularly railways. On Java, a trans-Java corridor would create a strong linkage between Jakarta and Surabaya, as well as linking in secondary cities such as Bandung, Semarang and Yogyakarta. Rail lines on Java should be upgraded through the development of new train-sets and rail infrastructure and signally systems. Java is the only island in Indonesia that has a good level of railway connectivity. Given the fact that Java is Indonesia‘s most developed island, with about 70% of Indonesia‘s total population, the rail system has to be expanded to cater for the upcoming demands of city commuters, logistic services and mobility intra-island. It is not uncommon to see large trucks and containers congest streets in major cities in Java nor to see long queues at ferry harbor is for Sumatra and Bali. Such issues could be addressed through a massive expansion of the railway network, as the Java railway network has already reached the West Java city of Cilegon, where the Merak harbor that provides access to Sumatra is located, and Banyuwangi, where the Ketapang harbor that provide access to Bali is located. Unfortunately, the development of the railway network in Java has not been conducted at the same rate as road development. It is significant that since Indonesian Independence, no new railway lines have been built exclusively by the Government of Indonesia, which has concentrated at the most upgrading existing tracks.
Indonesia‘s archipelagic geography requires that the country to have an extensive system of well managed maritime ports that can provide good connections between urban and rural regions. In addition, to foster interregional trade, it is necessary that shipping costs be reduced. Such a reduction in costs will require the development of a more competitive environment with the involvement of both domestic and international operators. Indonesia‘s main port, Tanjung Priok, is expected to see an increasing container traffic from 4,000,000 TEUs in 2008 to 10,500,000 TEUs (World Bank, 2010a). It is therefore in urgent need of expansion and upgrading, particularly to provide improved access to the JMR and surrounding markets.
Improving the quality of terrestrial and maritime transportation and lowering costs will generate manifold benefits, including an increased level of economic integration between regions and greater opportunities to develop supply chains between small-medium and large cities. In the Master Plan for Acceleration and Expansion of Indonesia‘s Economic Development, improvements in connectivity is identified as a primary requirement to spur. By ensuring the integration of interregional transportation systems, transportation costs can be minimized and distribution chains can be made more efficient. Thus, the GOI should encourage development by connecting economic corridors seamlessly. For example, building the Sunda Strait Bridge between Java and Sumatra will significantly add value to economic growth between two corridors and result in increased levels of urbanization, particularly in the southern part of Sumatra. Another bridge that might provide significant benefits would be between Java and Bali. In terms of intra-corridor development, constructing a bridge between Sumatra and the Riau Islands, and between Sumatra and Bangka and Belitung will also encourage growth in the region. Other possible initiatives include the construction of bridges to connect the islands of Nusa Tenggara (Sumbawa, Komodo, Flores, Lembata, and Alor) so distribution of goods and service can flow more seamlessly, thereby increasing economic growth in a region that lags significantly behind many other regions of Indonesia. Additionally, enhanced connectivity will provide poor and disadvantaged members of communities with better access to services found in larger urban areas. Through regional integration, this will foster growth in average incomes by increasing employment opportunities and creating other economic opportunities. Finally, improved connectivity may result in more inclusive development by connecting lagging regions with economic growth centers.
CONCLUSION
At first glance, local governments seem to devote a reasonable share of their budgets to capital expenditure, with such expenditure comprising on average around 25 percent of district level budgets. However, the level of such spending appears significantly lower when it is offset against depreciation in
Chapter Five: Infrastructure Investments and Urban Development
Page 69
the value of local public assets. In particular, capital expenditure by urban local governments, as opposed to rural district governments, appears to be especially limited when considered in this light.
Despite the low level of net local public investment, it is clear that is there is a significant positive correlation between the level of local government capital expenditure and economic growth. However, the significance of the positive correlation declines as the share of a given district is urban population increases. The latter result derives directly from the extremely limited capital spending of urbanizing local governments. The outcome suggests that the dearth of local capital spending in urban areas constrains the effectiveness of agglomeration economies.
The low level of investment in infrastructure also constrains economic productivity and competitiveness. As the recent World Economic Forum survey indicates, Indonesia continues to lag in term of competitiveness, as reflected by the lack and uneven distribution of basic services. This is at least partly due to challenges related to connectivity, which challenges are exacerbated by the archipelagic nature of the country.
POLICY RECOMMENDATIONS
Local governments need to increase their level of capital expenditure in order to stimulate economic growth. This is especially true for local governments of districts with a large proportion of their constituents in urban areas;
To encourage increased local capital spending, GOI should consider increasing the pool of finance
through transfers to urbanizing local governments in which agglomeration economies are strong
and the potential for economic growth is high.
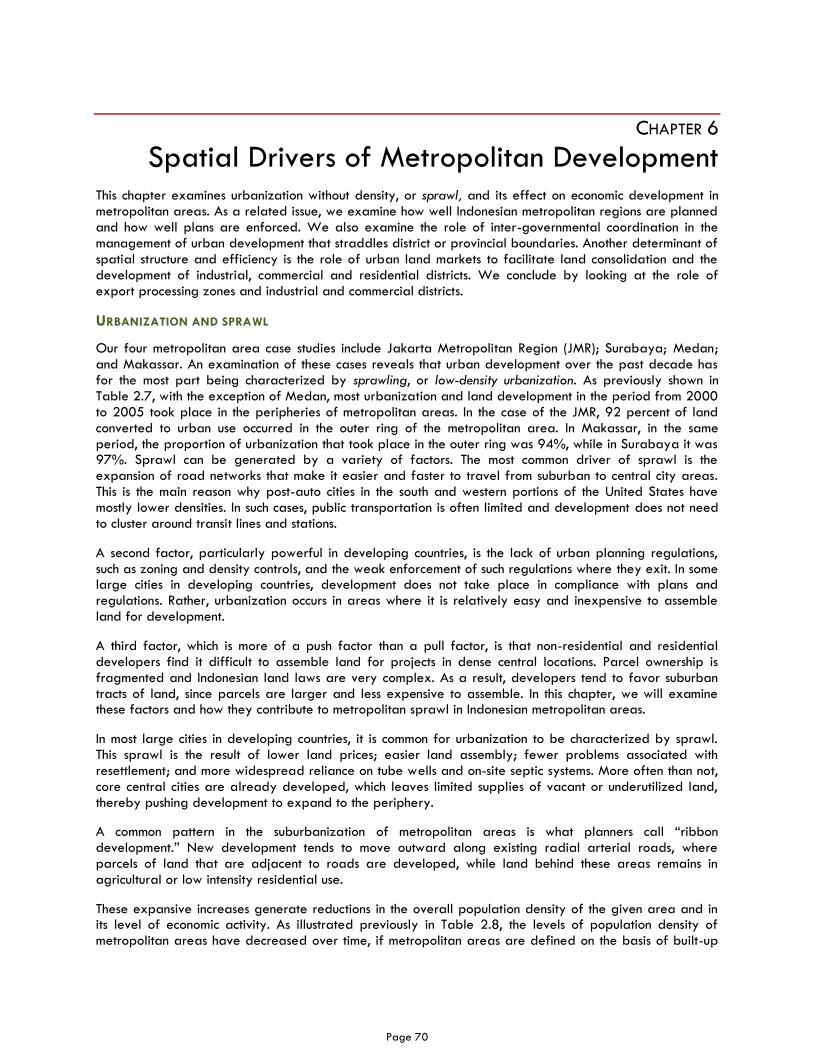
Page 70
CHAPTER 6
Spatial Drivers of Metropolitan Development This chapter examines urbanization without density, or sprawl, and its effect on economic development in metropolitan areas. As a related issue, we examine how well Indonesian metropolitan regions are planned and how well plans are enforced. We also examine the role of inter-governmental coordination in the management of urban development that straddles district or provincial boundaries. Another determinant of spatial structure and efficiency is the role of urban land markets to facilitate land consolidation and the development of industrial, commercial and residential districts. We conclude by looking at the role of export processing zones and industrial and commercial districts.
URBANIZATION AND SPRAWL
Our four metropolitan area case studies include Jakarta Metropolitan Region (JMR); Surabaya; Medan; and Makassar. An examination of these cases reveals that urban development over the past decade has for the most part being characterized by sprawling, or low-density urbanization. As previously shown in Table 2.7, with the exception of Medan, most urbanization and land development in the period from 2000 to 2005 took place in the peripheries of metropolitan areas. In the case of the JMR, 92 percent of land converted to urban use occurred in the outer ring of the metropolitan area. In Makassar, in the same period, the proportion of urbanization that took place in the outer ring was 94%, while in Surabaya it was 97%. Sprawl can be generated by a variety of factors. The most common driver of sprawl is the expansion of road networks that make it easier and faster to travel from suburban to central city areas. This is the main reason why post-auto cities in the south and western portions of the United States have mostly lower densities. In such cases, public transportation is often limited and development does not need to cluster around transit lines and stations.
A second factor, particularly powerful in developing countries, is the lack of urban planning regulations, such as zoning and density controls, and the weak enforcement of such regulations where they exit. In some large cities in developing countries, development does not take place in compliance with plans and regulations. Rather, urbanization occurs in areas where it is relatively easy and inexpensive to assemble land for development.
A third factor, which is more of a push factor than a pull factor, is that non-residential and residential developers find it difficult to assemble land for projects in dense central locations. Parcel ownership is fragmented and Indonesian land laws are very complex. As a result, developers tend to favor suburban tracts of land, since parcels are larger and less expensive to assemble. In this chapter, we will examine these factors and how they contribute to metropolitan sprawl in Indonesian metropolitan areas.
In most large cities in developing countries, it is common for urbanization to be characterized by sprawl. This sprawl is the result of lower land prices; easier land assembly; fewer problems associated with resettlement; and more widespread reliance on tube wells and on-site septic systems. More often than not, core central cities are already developed, which leaves limited supplies of vacant or underutilized land, thereby pushing development to expand to the periphery.
A common pattern in the suburbanization of metropolitan areas is what planners call ―ribbon development.‖ New development tends to move outward along existing radial arterial roads, where parcels of land that are adjacent to roads are developed, while land behind these areas remains in agricultural or low intensity residential use.
These expansive increases generate reductions in the overall population density of the given area and in its level of economic activity. As illustrated previously in Table 2.8, the levels of population density of metropolitan areas have decreased over time, if metropolitan areas are defined on the basis of built-up
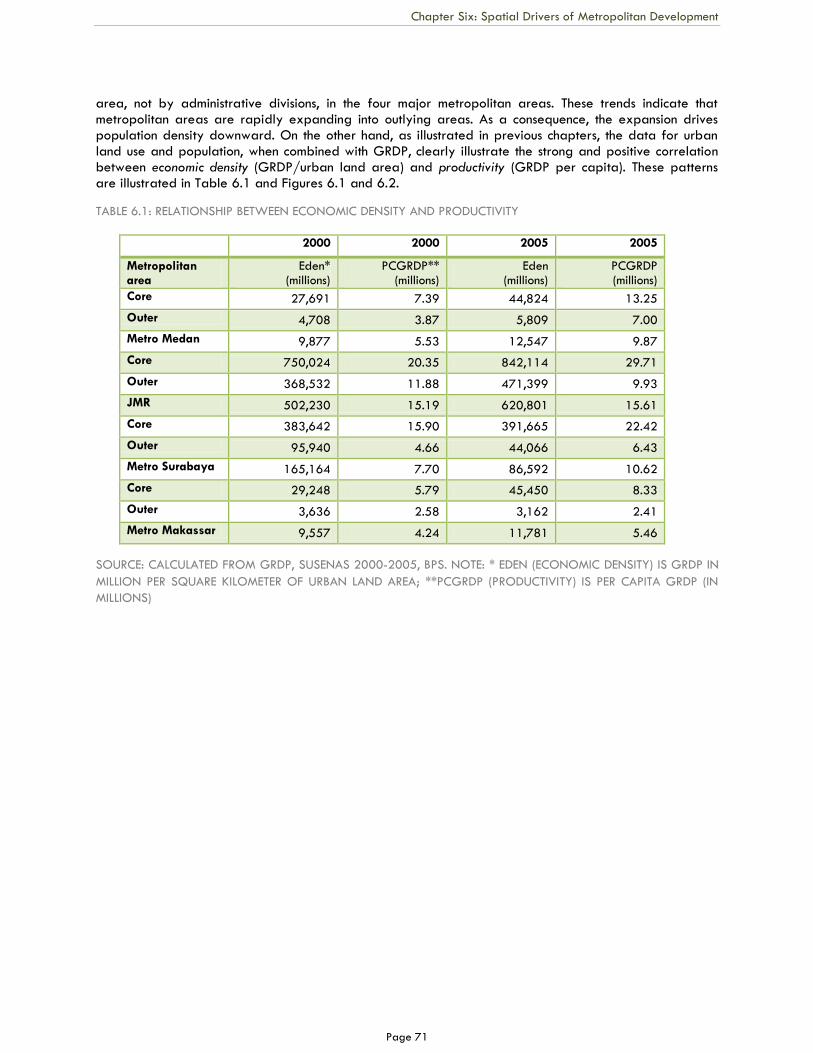
Chapter Six: Spatial Drivers of Metropolitan Development
Page 71
area, not by administrative divisions, in the four major metropolitan areas. These trends indicate that metropolitan areas are rapidly expanding into outlying areas. As a consequence, the expansion drives population density downward. On the other hand, as illustrated in previous chapters, the data for urban land use and population, when combined with GRDP, clearly illustrate the strong and positive correlation between economic density (GRDP/urban land area) and productivity (GRDP per capita). These patterns are illustrated in Table 6.1 and Figures 6.1 and 6.2.
TABLE 6.1: RELATIONSHIP BETWEEN ECONOMIC DENSITY AND PRODUCTIVITY
2000 2000 2005 2005
Metropolitan area
Eden* (millions)
PCGRDP** (millions)
Eden (millions)
PCGRDP (millions)
Core 27,691 7.39 44,824 13.25
Outer 4,708 3.87 5,809 7.00
Metro Medan 9,877 5.53 12,547 9.87
Core 750,024 20.35 842,114 29.71
Outer 368,532 11.88 471,399 9.93
JMR 502,230 15.19 620,801 15.61
Core 383,642 15.90 391,665 22.42
Outer 95,940 4.66 44,066 6.43
Metro Surabaya 165,164 7.70 86,592 10.62
Core 29,248 5.79 45,450 8.33
Outer 3,636 2.58 3,162 2.41
Metro Makassar 9,557 4.24 11,781 5.46
SOURCE: CALCULATED FROM GRDP, SUSENAS 2000-2005, BPS. NOTE: * EDEN (ECONOMIC DENSITY) IS GRDP IN
MILLION PER SQUARE KILOMETER OF URBAN LAND AREA; **PCGRDP (PRODUCTIVITY) IS PER CAPITA GRDP (IN
MILLIONS)
Chapter Six: Spatial Drivers of Metropolitan Development
Page 72
FIGURE 6.1: RELATIONSHIP BETWEEN ECONOMIC DENSITY IN 8 METRO AREAS AND PRODUCTIVITY, 2005
SOURCE: CALCULATED FROM GRDP 2005, BPS
Figure 6.1 indicates that the relationship between economic density (as measured by GRDP per square kilometer of urban land area) and productivity are highly positively correlated. Unfortunately, we do not have urban land use data for metropolitan areas other than Medan, Jakarta, Surabaya and Makassar, so we are unable to test this relationship for other cities in Indonesia.
Generalizing from the results so far, we can anticipate that sprawl will lead to lower economic density and that this will lead to lower rates of productivity. This conforms with economic theory pertaining to agglomeration economies (World Development Report, 2009). Urban policies promoting lower density development will, all other factors being equal, result in lower levels of economic productivity.
DOES INAPPROPRIATE SPATIAL PLANNING UNDERMINE ECONOMIC PRODUCTIVITY?
In this section, we examine how inappropriate spatial planning constrains economic growth and productivity. The research for this section comes from a series of case studies conducted for the JMR (URDI, 2010a); the Medan Metropolitan Region (Salim, 2010); the Surabaya Metropolitan Region (Setiawan, 2010); and the Makassar Metropolitan Region (Salim, 2010). In addition a survey of national planning laws was undertaken to assess broader contextual issues (URDI, 2010b).
Spatial planning, particularly at the metropolitan level, has been largely ineffective in promoting efficient spatial patterns and creating opportunities for the promotion of agglomeration economies. There are numerous reasons for this lack of effectiveness:
a. Out-of-date plans;
b. Failure to formally adopt plans so that they are enforceable;
c. Chaotic policy changes driven by political turmoil make planning responsibilities unclear;
d. Poor regional coordination across districts and provinces;
e. Limited technical capacity, the lack of financial resources and the failure to link capital investment
programs with strategies to ensure implementation of plans and construction of infrastructure
systems necessary to achieve plan objectives;
f. Inter-district conflicts over land use designations; poor quality and out of date planning
information;
y = 3E-05x + 6.5853 R² = 0.723
0.0
5.0
10.0
15.0
20.0
25.0
30.0
35.0
- 100,000 200,000 300,000 400,000 500,000 600,000 700,000 800,000 900,000
Pe
r ca
pit
a G
RD
P
Economic density
Relationship between economic density and productivity, 2005
Chapter Six: Spatial Drivers of Metropolitan Development
Page 73
g. Inconsistencies between regional district and local plans; and
h. The general failure of government to enforce plans and implement effective enforcement
mechanisms to implement plans.
Over the past one to two decades, urban planning in Indonesia has been chaotic, fluid and confusing. While the ―big bang‖ decentralization has clearly devolved decision making and budgeting to lower levels of government, the formation of new districts, provinces, island regions, and nation strategic urban centers has acted as an extremely significant constraint against efficient planning. In most cases, the adoption of new planning laws and the coordination of laws in attempt to promote cooperation between local governments have not worked. Conflicts exist in Medan, Surabaya and Jakarta regarding the demarcation of responsibilities and authorities and regarding land use area designations (watershed and conservation areas, conversion of agricultural land to urban uses and methods for developing consensus between sub districts, districts and provinces). The problem is not in the formulation of the laws as such, since most laws pertaining to coordination are adequate. Rather, the problem is that significant stakeholders are sometimes not included in the coordination committees or, when committees meet, agreement between the different stakeholders cannot be achieved.
Another problem is that in most large metropolitan areas, it takes years to prepare new plans. Frequently, despite the massive amounts of work that has gone into these plans, they are not formally adopted. Therefore, they cannot serve as a legal framework for the enforcement of land use (zoning) and development controls. Even when plans are prepared and adopted, they are often not enforced. Our case study of Surabaya uncovered scores of inconsistencies between the stipulations of formal plans and what actually takes place on the ground. In other cases, local urban technical plans are not consistent with district or kota plans. Again, this is clearly demonstrated by our case studies of Surabaya and Medan.
While overall ―big bang‖ decentralization has been highly praised for devolving decision making and budgeting to the local levels, the rapidity and scale of the process has often overwhelmed planners. As the GOI adds new provinces and districts and passes new laws for spatial coordination, planning institutions across the country have been extremely challenged to keep up with changes. This has resulted in a slowdown in planning and has generated confusion about who is in charge and how conflicts should be resolved. In instances when conflicts do surface, planners and government officials retreat and do not work to solve them. This results in poor intergovernmental coordination. In all of our case studies, weak or ineffectual coordination was the norm, with the case of Makassar as a possible exception.
This lack of coordination is now significantly affecting metropolitan urbanization. With most new urbanization taking place outside central cities, metropolitan areas cannot effectively plan for future growth or develop budgeting mechanisms to finance needed infrastructure. In some of the most egregious cases, infrastructure investments are entirely and coordinated, with road projects stopping at district or provincial boundaries or other obvious signs of poor coordination being displayed. In other cases, independently developed urban land use plans do not consider the economic transformations that are occurring in a region and land use is not structured to boost higher rates of economic development. This may be one of the most significant factors holding back the development of metropolitan areas with populations in the range of 5 to 10 million. These metropolitan areas urgently need to implement more coordinated land use and better spatial planning to foster economic efficiency.
Despite active partnership with leading academics and experts in urban planning and the creation of other urban planning programs in the country, urban planning capacities continue to be too limited to overcome the many challenges that we outlined in this section. Planners need to better understand how physical planning is linked with infrastructure and financial programming. Plans need to be better framed and more explicit regarding the source of financing for infrastructure to drive plan implementation. This is a continuing problem across most of Indonesia‘s small, medium and large metropolitan regions.
Indonesia has made remarkable progress toward decentralization and its overhaul of its formerly centralized budgeting systems is admirable. What is necessary now is to focus on spatial planning: to make it more effective, better aligned with economic development and environmental sustainability objectivities
Chapter Six: Spatial Drivers of Metropolitan Development
Page 74
and more closely linked with infrastructure investment and capital improvement programming. Planning also needs to be better able to coordinate the formulation of spatial policy at the metropolitan level.
METROPOLITAN COORDINATION
As urbanization continues, urban activity often spills over beyond the jurisdiction of the original municipality in which urban activity originated, resulting in a larger metropolitan area encompassing several municipalities. While a metro area of this kind functions as a single system in terms of its economy; its land and housing markets; its transportation patterns; and its ecology; it often continues to be administered as though it were still a group of independent cities. Often, the higher level of government, the district or province, is too large to facilitate efficient planning, extending far beyond the urbanized area, or encompassing several separate cities, towns and villages. An intermediate administrative level is required which can manage and govern metropolitan areas of the type described above as a single, distinct unit. Local governments within metro areas need not be dissolved or disempowered entirely: in fact, it is important to maintain these smaller units of government in order to bring decision-making processes closer to citizens. What is required is a means of coordinating the activities of these municipalities in a way that acknowledges the interlinked, interdependent nature of their development.
Without an effective system of metropolitan governance, urban areas risk becoming increasingly dysfunctional. In fast-growing cities, land in the periphery of urban areas is often more affordable than in city centers, which encourages urban expansion into adjacent municipalities. However, if public transportation systems are not coordinated between municipalities, the residents of these peripheral areas may be forced to take long trips in private vehicles in order to reach the city centre, leading to increased congestion and carbon emissions. If secondary business districts emerge in adjacent jurisdictions, transportation patterns within the original centre may change in ways that its transportation systems cannot handle. Lack of metropolitan coordination may also cause cities to miss opportunities to benefit from economies of scale in financing and to adequately maintain infrastructure for basic service provision. Ecological systems, such as rivers, forests, and coastal regions, which are threatened by urban activities, can often survive only if protected in their entirety, which requires consensus and cooperation between several adjacent municipalities.
Cities around the world continue to experiment with institutional structures that can effectively govern such multi-jurisdictional metro areas. Institutions for metropolitan governance may take a number of forms in terms of their composition, financing and responsibilities. For example, the Metropolitan Coordination Executive Committee of Mexico City, which coordinates activities relating to environmental protection; transport; water; solid waste management; and public security; is staffed by officials from federal, state and municipal levels of government. Transportation and port facilities in the New York City metropolitan area are administered by the Port Authority of New York and New Jersey, which is managed by two states, funded by revenue from tolls, fees and charges for use of their facilities. It also works closely with the Regional Plan Association, a non-governmental organization which provides long-term integrated planning for the metropolitan region. Several metropolitan areas in India are administered by development authorities that are instituted and funded by state governments, but which also sometimes supplement their funds through transfers from nationally administered urban development funds. In Indonesia, the Kartamantul Joint Secretariat, which coordinates infrastructure development in the metropolitan area surrounding the city of Yogyakarta, has been praised as a successful, bottom-up model of metropolitan governance. Box 6.1 outlines the current coordination problems within the largest metropolitan area in Indonesia, JMR.
Chapter Six: Spatial Drivers of Metropolitan Development
Page 75
BOX 6.1: COORDINATION ISSUES IN THE JAKARTA METROPOLITAN REGION
Development issues faced by JMR have been intensively studied since the 1990s, such as by Firman (1992, 1996) and Dharmapatni and Firman (1995). The past and present challenges that Jakarta faces and will continue to face in the future, with several strategies undertaken by national or provincial governments to tackle those issues, have also been discussed in Salim and Firman (forthcoming). Rakodi and Firman (2009) have also identified several areas for reform to address the issue of governance for JMR. In the past, the national government and the Jakarta provincial government have tried to limit urban development toward the South of Jakarta and Bogor, as these areas are the main water recharge areas for the aquifer which serves the groundwater table of the whole region. Urban development is thus promoted on the East-West axis toward Bekasi and Tangerang districts. However, development activities into the uphill areas in the South are still increasing, as the area (known as Puncak area in Bogor District) offers beautiful sites for recreation. In turn, open spaces in that area have been converted into built-up areas for accommodations, restaurants and other public facilities. Another related environmental concern in this area is that two main rivers (Ciliwung and Cisadane) that flow to the north coast (Jakarta Bay) also have their springs in the mountainous areas of Bogor district.
In order to protect the environment and in anticipation of further development in that area, a Presidential Instruction (No. 13 of 1976) was promulgated to integrate policies of Jakarta‘s provincial government with those of its surrounding region, notably the West Java provincial government, in the area of the management of land that has national strategic value, such as Puncak, through inter-regional cooperation. This instruction established a Jabotabek Planning Team in Bappenas, with the Bappenas Regional Deputy as Chair and Director General of Cipta Karya and Governors of DKI Jakarta and West Java as members. At the same time, the Development Cooperation Board of Jabotabek (BKSP Jabotabek) was established by a Joint Decree of the Governors of West Java and DKI Jakarta in May 1976, with this board intended to serve as the official body to coordinate development in Jabotabek area. Several studies have been commissioned since then, such as Jabotabek Metropolitan Planning Study, Jakarta-Puncak Clearinghouse Study of Critical Lands and West Java Urban Development Project. The findings of these studies have been followed up through a set of regulatory frameworks to manage development in the Puncak area, such as Presidential Decree No. 48 of 1983 and Presidential Decree No. 79 of 1985 on Spatial General Plan of Puncak Area, which was revised to become the Presidential Decree No. 114 of 1999 regarding the Spatial Management of Bopunjur (Bogor-Puncak-Cianjur) Area. However, as with the case of many plans that remain unimplemented in Indonesia, this Presidential Decree was not powerful enough to ensure that the spatial management plan for Puncak Area is fully implemented. Urban development is steadily encroaching on the conservation zone in Mt. Salak, in the Puncak area. Lack of law enforcement in spatial management has been identified as the primary factor in the failure to properly implement land use and similar plans. Thus, one of the breakthroughs of the new Spatial Management Act (Law No. 26 of 2007) is the provision of severe sanctions for those who violate the stipulations of any spatial management plans.
The weak coordination between government agencies is another factor in the failure to manage development in the JMR. Although BKSP Jabotabek has been established since 1976, this body has had limited resources and authorities to fulfill its coordinating function. The Jabotabek Metropolitan Development Plan resulted from the Jabotabek Metropolitan Planning Study, which was intended to guide development in Jabotabek. However, it was never instituted as a legal statutory plan. Thus, it served only as an advisory plan and the West Java province never formally adopted the plan (Stolte, 1995). Therefore, BKSP Jabotabek has never been able to coordinate development in Jabotabek, as there has been no legal document that can be used as common reference by the governments of West Java and DKI Jakarta or the national government and its agencies. Conflicts of interest between agencies also characterize the lack of coordination in the governing of Jabotabek, with these conflict being beyond BKSP Jabotabek‘s capacity to resolve.
New regulations have now been launched in order to improve the coordination function of development in Jakarta Metropolitan Area, through, amongst other instruments, the Decree of the Minister of Home Affairs Regulation (Permendagri) No. 6 of 2006 regarding BKSP Jabodetabekjur and Presidential Regulation No. 54 of 2008 regarding Spatial Management of Jabodetabek-Punjur Area). However, there is still potential for conflicts of interest due to a lack of clarity regarding the allocation of responsibility and authority for the coordination of development in the area, body, given the prior existence of BKSP Jabodetabekjur. Moreover, it has not specified which ministry has the authority to coordinate. Meanwhile, Law No. 29 of 2007 regarding the Governance of Jakarta as a Capital City stipulates that all governments in the area should cooperate under an interregional cooperating body on the basis of agreement between governments, which suggests the revitalization of BKSP Jabotabekjur.
SOURCE: URDI, 2010A.
INDONESIA’S COMPLEX LAND AND PROPERTY RIGHTS SYSTEM
Although inadequate urban planning is a major impediment to creating efficient, prosperous and livable cities in Indonesia, a second issue of equal and perhaps greater importance is Indonesia‘s system of land and property rights (Struyk, Hoffman and Katsura, 1990). There are two significant, related aspects to the land and property rights issue, relating to: 1) the public acquisition of land for public purposes, such as the
Chapter Six: Spatial Drivers of Metropolitan Development
Page 76
acquisition of rights-of-way; and 2) the acquisition of parcels of land for residential, commercial and industrial real estate development projects by the private sector. As this section discusses, the acquisition of land for public purposes is very time consuming and can be expensive (Zevallos, 2008 and World Bank, n. d.). This slows down infrastructure investment project execution and makes it difficult for local and central governments to address infrastructure backlogs. Regarding private sector land acquisition and assembly, the complexity of the process often requires government participation in the process and is based on negotiations that can extend for years.
Public land acquisition consists of the following nine steps:
Definition of project area;
The implementation of land freezes to prevent private sales of land within the project area;
Establishment of the Land Provision Committee/Panitia Pengadaan Tanah (LPC/P2T) to facilitate the negotiations between the government institution requiring the land and the affected land owners;
The socialization of affected communities;
Appraisal of the value of affected assets;
Deliberations on the compensation;
Compensation payment or offer;
Resolution of objections raised by the land owners regarding the form and/or amount of compensation; and
Expropriation proceedings if negotiations fail.
First, district heads, mayors and in some cases governors must approve of the definition of the project area. To do so, they issue a ―determination of location‖ for the project and the lands that need to be acquired. Once this is accomplished, land within the location is frozen and cannot be sold to other parties, with the intent being to avoid land speculation. The length of the freeze depends on the size of the project: one year for projects covering a land area of 25 hectares or less; two years for projects covering a land area of between 25 and 50 hectares; and three years if the project covers a land area in excess of 50 hectares. Governments are required to acquire the land within these time periods, although extensions many be granted. Local governments establish a Land Provision Committee to facilitate land acquisition negotiations between landowners and the government. During the initial phases, the LPC informs affected parties of the project and its implications and impacts. Finally, the LPC conducts an inventory of land parcels and property.
The value of affected land is determined by a land appraising institution licensed by the National Land Agency and appointed by the District Heads/Mayors or the GOI. 5 In cases where there is no Land Appraising Institution in the district or city where the project is located or in the surrounding municipalities, the District Heads/Mayors or the GOI establish a Land Appraisal Team, which appraises the land based on the Selling Value of Taxable Objects (Nilai Jual Objek Pajak/NJOP) or by observing the NJOP of the current year. The Land Appraisal Team can consider other factors affecting land price, such as location.6
Once properties are appraised, deliberations between the government and the landowners commence, with such deliberations lasting up to 120 days. At the end of the period, the LPC makes an offer to all landowners, which may take the form of cash, resettlement or a combination of the two. Owners can object to the amount and form of compensation within 14 days, with the LPC having 30 days to respond. If the landowners reject the final offer, the project cannot be shifted to another area. Instead, the LPC relies on the revocation of land use rights as stipulated in the Agrarian Eminent Domain Procedures (World Bank,
5 ―Land Price Appraising Institutions‖ are defined in Article 1 of the BPN Implementation Guidelines No. 3/2007 as ―professional and independent institutions that possess the skill and ability in land appraisal‖. Land Appraising Institutions must be licensed by the National Land Agency (BPN Implementation Guidelines, Article 25, subsection 2). 6BPN Implementation Guidelines No. 3/2007, Article 26, subsection (1); Article 28.
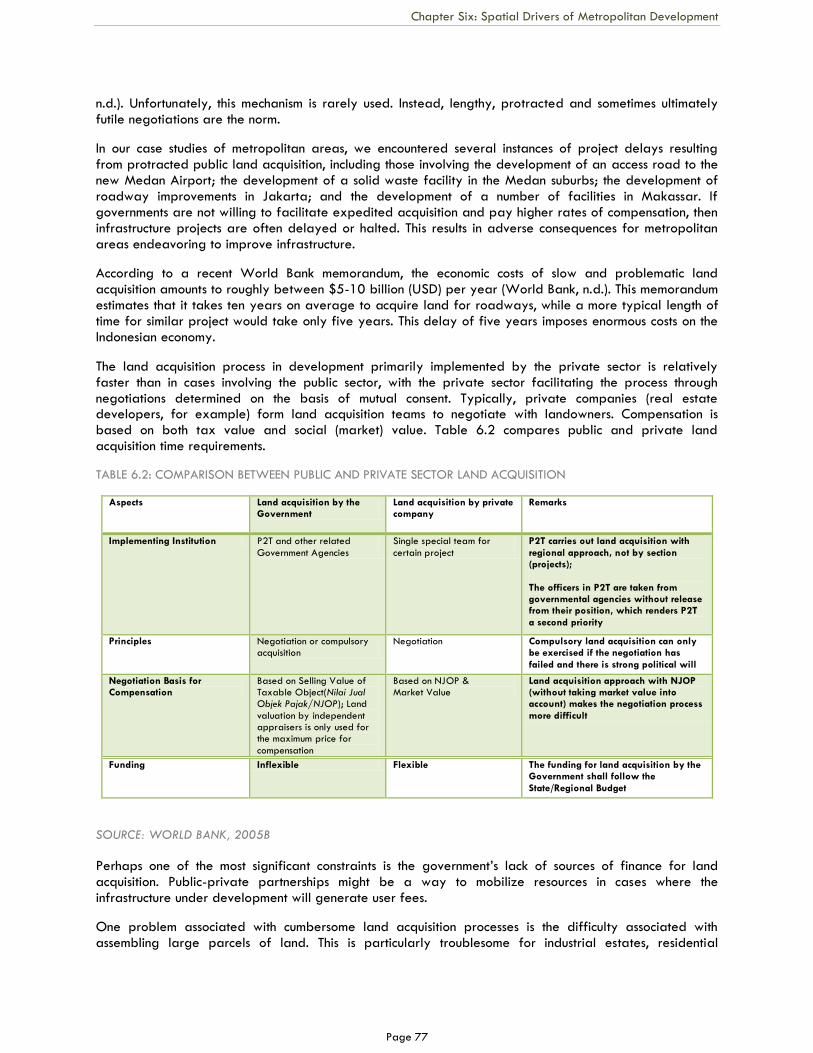
Chapter Six: Spatial Drivers of Metropolitan Development
Page 77
n.d.). Unfortunately, this mechanism is rarely used. Instead, lengthy, protracted and sometimes ultimately futile negotiations are the norm.
In our case studies of metropolitan areas, we encountered several instances of project delays resulting from protracted public land acquisition, including those involving the development of an access road to the new Medan Airport; the development of a solid waste facility in the Medan suburbs; the development of roadway improvements in Jakarta; and the development of a number of facilities in Makassar. If governments are not willing to facilitate expedited acquisition and pay higher rates of compensation, then infrastructure projects are often delayed or halted. This results in adverse consequences for metropolitan areas endeavoring to improve infrastructure.
According to a recent World Bank memorandum, the economic costs of slow and problematic land acquisition amounts to roughly between $5-10 billion (USD) per year (World Bank, n.d.). This memorandum estimates that it takes ten years on average to acquire land for roadways, while a more typical length of time for similar project would take only five years. This delay of five years imposes enormous costs on the Indonesian economy.
The land acquisition process in development primarily implemented by the private sector is relatively faster than in cases involving the public sector, with the private sector facilitating the process through negotiations determined on the basis of mutual consent. Typically, private companies (real estate developers, for example) form land acquisition teams to negotiate with landowners. Compensation is based on both tax value and social (market) value. Table 6.2 compares public and private land acquisition time requirements.
TABLE 6.2: COMPARISON BETWEEN PUBLIC AND PRIVATE SECTOR LAND ACQUISITION
Aspects Land acquisition by the Government
Land acquisition by private company
Remarks
Implementing Institution P2T and other related
Government Agencies
Single special team for
certain project
P2T carries out land acquisition with
regional approach, not by section (projects);
The officers in P2T are taken from governmental agencies without release from their position, which renders P2T
a second priority
Principles Negotiation or compulsory acquisition
Negotiation Compulsory land acquisition can only be exercised if the negotiation has
failed and there is strong political will
Negotiation Basis for Compensation
Based on Selling Value of Taxable Object(Nilai Jual Objek Pajak/NJOP); Land
valuation by independent appraisers is only used for the maximum price for
compensation
Based on NJOP & Market Value
Land acquisition approach with NJOP (without taking market value into account) makes the negotiation process
more difficult
Funding Inflexible Flexible The funding for land acquisition by the Government shall follow the
State/Regional Budget
SOURCE: WORLD BANK, 2005B
Perhaps one of the most significant constraints is the government‘s lack of sources of finance for land acquisition. Public-private partnerships might be a way to mobilize resources in cases where the infrastructure under development will generate user fees.
One problem associated with cumbersome land acquisition processes is the difficulty associated with assembling large parcels of land. This is particularly troublesome for industrial estates, residential
Chapter Six: Spatial Drivers of Metropolitan Development
Page 78
subdivisions and large commercial centers. Since land ownership patterns vary with the level of urbanization, it is frequently more efficient to claim projects in suburban areas, with few land parcels per hectare. In addition to acquiring less expensive land, the time involved in the acquisition process can be reduced and costs lowered. According to interviews with members of Real Estate Indonesia in 2010, the cost savings resulting from the lower number of land parcels in the suburbs is one of the reasons that developers build large-scale residential estates in those areas.
LARGE-SCALE INDUSTRIAL, RESIDENTIAL AND COMMERCIAL DISTRICTS
A common strategy for overcoming urban planning failures and for dealing with complex land acquisition processes is to externalize these failures by building large-scale industrial, residential and commercial projects. Large scale projects give developers the opportunity to achieve economies of scale in the provision of infrastructure (for example, by drilling one water well for all users in the project or by providing wastewater treatment at one plant) and to economize on land acquisition. However, large scale projects typically take place on the periphery of urban regions and foster sprawl. In the case of industrial districts, they move industrial activity to suburban areas, which can undermine the formation of agglomeration economies.
Figure 6.2 illustrates suburban patterns for residential developments, while Table 6.3 presents a tabulation of industrial estates in the Jakarta Metropolitan Region. Most of the estates in both classes are located in suburban districts.
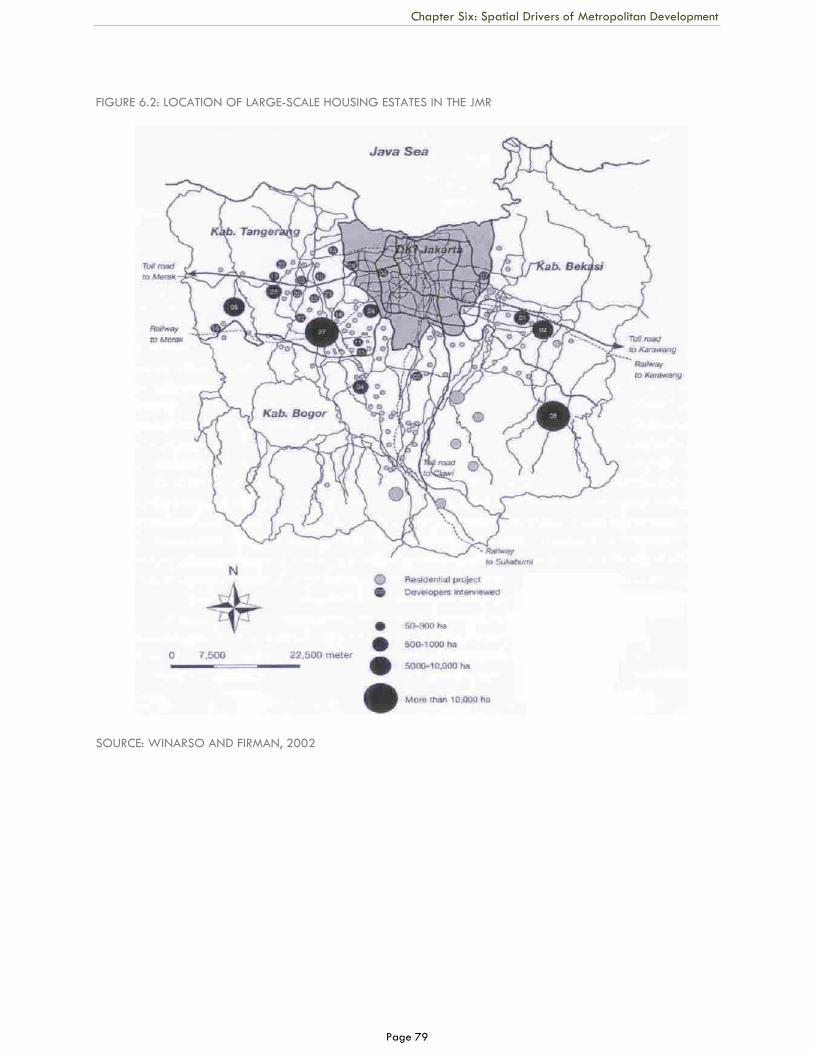
Chapter Six: Spatial Drivers of Metropolitan Development
Page 79
FIGURE 6.2: LOCATION OF LARGE-SCALE HOUSING ESTATES IN THE JMR
SOURCE: WINARSO AND FIRMAN, 2002
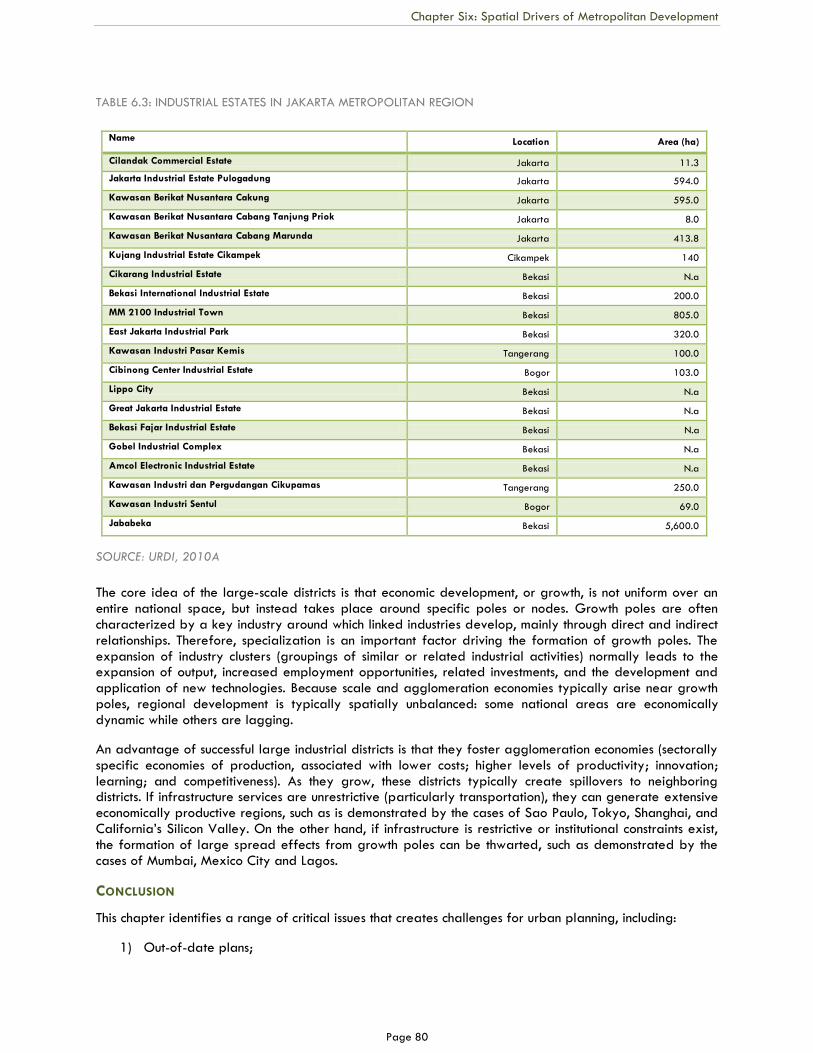
Chapter Six: Spatial Drivers of Metropolitan Development
Page 80
TABLE 6.3: INDUSTRIAL ESTATES IN JAKARTA METROPOLITAN REGION
Name Location Area (ha)
Cilandak Commercial Estate Jakarta 11.3
Jakarta Industrial Estate Pulogadung Jakarta 594.0
Kawasan Berikat Nusantara Cakung Jakarta 595.0
Kawasan Berikat Nusantara Cabang Tanjung Priok Jakarta 8.0
Kawasan Berikat Nusantara Cabang Marunda Jakarta 413.8
Kujang Industrial Estate Cikampek Cikampek 140
Cikarang Industrial Estate Bekasi N.a
Bekasi International Industrial Estate Bekasi 200.0
MM 2100 Industrial Town Bekasi 805.0
East Jakarta Industrial Park Bekasi 320.0
Kawasan Industri Pasar Kemis Tangerang 100.0
Cibinong Center Industrial Estate Bogor 103.0
Lippo City Bekasi N.a
Great Jakarta Industrial Estate Bekasi N.a
Bekasi Fajar Industrial Estate Bekasi N.a
Gobel Industrial Complex Bekasi N.a
Amcol Electronic Industrial Estate Bekasi N.a
Kawasan Industri dan Pergudangan Cikupamas Tangerang 250.0
Kawasan Industri Sentul Bogor 69.0
Jababeka Bekasi 5,600.0
SOURCE: URDI, 2010A
The core idea of the large-scale districts is that economic development, or growth, is not uniform over an entire national space, but instead takes place around specific poles or nodes. Growth poles are often characterized by a key industry around which linked industries develop, mainly through direct and indirect relationships. Therefore, specialization is an important factor driving the formation of growth poles. The expansion of industry clusters (groupings of similar or related industrial activities) normally leads to the expansion of output, increased employment opportunities, related investments, and the development and application of new technologies. Because scale and agglomeration economies typically arise near growth poles, regional development is typically spatially unbalanced: some national areas are economically dynamic while others are lagging.
An advantage of successful large industrial districts is that they foster agglomeration economies (sectorally specific economies of production, associated with lower costs; higher levels of productivity; innovation; learning; and competitiveness). As they grow, these districts typically create spillovers to neighboring districts. If infrastructure services are unrestrictive (particularly transportation), they can generate extensive economically productive regions, such as is demonstrated by the cases of Sao Paulo, Tokyo, Shanghai, and California‘s Silicon Valley. On the other hand, if infrastructure is restrictive or institutional constraints exist, the formation of large spread effects from growth poles can be thwarted, such as demonstrated by the cases of Mumbai, Mexico City and Lagos.
CONCLUSION
This chapter identifies a range of critical issues that creates challenges for urban planning, including:
1) Out-of-date plans;
Chapter Six: Spatial Drivers of Metropolitan Development
Page 81
2) Failure to formally adopt plans so that they are enforceable;
3) Chaotic policy changes driven by political turmoil make planning responsibilities unclear;
4) Poor regional coordination across districts and provinces;
5) Limited technical capacity, lack of financial resources and the failure to link capital investment
programs with strategies to ensure implementation of plans and construction of infrastructure
systems necessary to achieve plan objectives;
6) Inter-district conflicts over land use designations; poor quality and out of date planning
information;
7) Inconsistencies between regional district and local plans; and
8) The general failure of government to enforce plans and implement effective enforcement
mechanisms.
These deficiencies are undermining metropolitan-level urban planning and coordination of development across districts. If not corrected, these deficiencies will impede the formation of agglomeration economies and ultimately economic prosperity.
Indonesia‘s urban land and property markets are extremely complex, making it very time consuming to acquire land for infrastructure and to assemble land for urban development. The World Bank estimates that the cost of Indonesia‘s dysfunctional land and property rights system is between $5 and $10 billion (USD) per year due to slow project execution and halted projects. The private sector procedures for acquisition are more flexible and appear to work much faster. Finally, because of ineffective urban planning; cumbersome land acquisition processes; and infrastructure limitations; many developers are shifting to large-scale development projects. While large-scale development projects have their merits (they can foster agglomeration economies; reduce infrastructure costs; and make it easier for both domestic and foreign firms to enter the market as users of space), they also have the potential to contribute to urban sprawl and disconnected urban development.
POLICY RECOMMENDATIONS
The GOI should focus on spatial planning, making it better aligned with economic development and environmental sustainability objectivities. Spatial planning also need to linked more closely with infrastructure investment and capital improvement programming;
There is a need to establish effective metropolitan coordination agencies which have sufficient authority to make and enforce decisions regarding metropolitan development policies and investments;
There is a need to modify procedures to enhance the efficiency of land acquisition.
Page 82
CHAPTER 7
CONCLUSION
The overarching message and conclusion of this report is that Indonesia needs to leverage urbanization to
foster socio-economic development to a much greater extent than it has done so far. Compared to India,
China, Vietnam and other Asian countries, Indonesia has not managed to generate a full ―urban dividend:‖
despite its significant rate of urbanization, Indonesia has not reaped the benefits associated the process to
the same extent that other countries have done.
Clearly, some of the challenges faced by Indonesia are unique. For example, Indonesia‘s geography is
unique and creates unique challenges: the country covers more than 2 million square kilometers across a
5,000 kilometer span and consists of more than 14,000 islands. At the same time, other challenges faced
by Indonesia are familiar to most Asian countries: amongst others, such challenges relate to multi-
jurisdictional metropolitan management; challenges with land and housing markets; challenges with
strategic infrastructure and regional economic development; challenges of local government capacity and
decentralization; and the other such issues discussed in the report.
The sustainable management of Indonesia‘s economic, social and environmental development is enormously
complex. How should policy makers facilitate a more balanced and equitable distribution of income and
prosperity? How can the country develop a system of cities to foster agglomeration economies without
generating hyper-urban primacy around Jakarta? What are the forms of policy incentives that might
effectively increase economic productivity, and how should their implementation be sequenced over time? How
should they be distributed over space?
While each of the core issues identified in this report certainly requires more specific analysis, targeted
strategies, and detailed policy recommendations, what follows is a big picture view of the emerging major
priorities for Indonesia‘s national urban policy. The GOI needs a multi-faceted and differentiated strategy
for managing urbanization to better leverage growth. The GOI should attempt to deliver a portfolio of
services, policy initiatives and investments to the country‘s diverse system of metropolitan, small urban and
rural regions. The possible portfolio of actions and interventions might include the following four types of
actions:
CENTRAL GOVERNMENT ACTIONS
1. Given Indonesia’s complex geography, the GOI needs to significantly improve connectivity
between metropolitan regions and between urban and rural regions. Investments in terrestrial
and maritime transportation are thus urgently needed: Moving goods and people across
regions is an expensive and time consuming process. Inter-city expressways are needed to
connect cities, productive centers and productive facilities in Java and Sumatra, as well as in
some areas of Sulawesi and Eastern Kalimantan. As indicated in this report, Indonesia‘s
uniquely archipelagic geography requires that the country also have an extensive system of
maritime ports which are efficiently managed and which serve well to connect urban and rural
regions. It is important that investments be made in water-based transportation systems and that
shipping costs are reduced to foster inter-regional trade. In addition, Tanjung Priok, the country‘s
Chapter Seven: Conclusion
Page 83
largest port, needs immediate expansion, while additional port expansion is also needed
across the country;
2. The GOI needs to fully implement its numerous laws and regulations regarding
intergovernmental coordination and metropolitan scale management of spatial planning: The
lack of intergovernmental coordination hampers effective spatial planning. District plans are not
well aligned with the plans of contiguous districts and they are not consistent with provincial level
and other networked plans for their provinces. National laws and regulations mandating the
preparation of local, district- and provincial-level plans should be amended to ensure that they
incorporate infrastructure capital investment programs needed for spatial plan implementation. In the
case studies completed for this project, we encountered numerous cases where planning was not
integrated with infrastructure and financing programs. Part of this limitation is due to unclear
legislation; lack of compliance; and limited local capacity to link spatial and infrastructure
planning with financial programming. At present, spatial plans do not appear to fully inform the
financial budgeting process of local government agencies;
3. Indonesia’s complex land and property rights system needs reform: Complex land rights
systems hamper economic development. In the public sector, costly and time-consuming processes
related to the acquisition of rights-of-way for infrastructure projects impede the construction of
infrastructure. Private sector entities acquire land much more efficiently than the public sector, since
these entities tend to be more flexible and realistic regarding compensation. However, the
complexity of the acquisition process mitigate against development in city cores and drives private
sector entities to suburban areas where land parcels are larger and therefore fewer transactions
are typically needed, reducing the complexity of transactions. This promotes fragmented urban
development and undermines the formation of agglomeration economies and urban revitalization.
The development of systems of guided urbanization, involving measures such as land pooling and
readjustment, might be part of a broader solution.
4. The GOI should link the implementation of the Master Plan for Acceleration and Expansion of
Indonesia’s Economic Development (MP3EI) to urbanization and metropolitan development:
The focus of development planning should be on improving the efficiency of urban areas and
capitalizing on the benefits from urbanization, rather than merely creating new growth centers and
Special Economic Zones, particularly if these are designed without careful consideration of the
specific comparative advantages that might justify their establishment.
POLICY ACTIONS FOR LARGE METROPOLITAN REGIONS
1. Coordination on strategic infrastructure investment and regional economic development is
vital: While at present the administrative boundaries of metropolitan areas to a large extent
demarcate budget and planning boundaries, they do not adequately reflect the spatial limits of
economic activities or the dynamics of regional markets. Issues that affect these activities and
markets need to be coordinated across administrative boundaries. If the various budgets and
plans of neighboring administrative units are disharmonious, the resulting ‗regional economy‘ in
which the varying administrative units participate suffers significantly. In short, mechanisms need to
be in place for effective metropolitan management in Indonesia. This is a crucial priority for large
metropolitan regions, particularly those spatially located in areas under the administration of a
number of different administrations.
Chapter Seven: Conclusion
Page 84
Indonesia‘s large metropolitan areas are not leveraging their human resources to produce rapid
increases in economic productivity. Although Jakarta and Surabaya have relatively high levels of
productivity, their rate of growth in productivity is relatively low, averaging less than 1.5 percent
in real terms between 1993 and 2007. Metropolitan areas with populations in the range of 5 to
10 million range actually experienced a decline in real productivity in this time period. Such
sluggishness appears to be at least partly due to challenges related to transportation and land
use. These large metropolitan regions are highly congested; they do not have adequate systems of
transit to facilitate commuting; they have inefficient spatial and land use patterns, and they have
problems facilitating the movement of goods. These large cities urgently need well targeted
investment in infrastructure, together with systems that facilitate smart land use planning, including
transit and traffic management and urban design solutions to reduce congestion.
2. Most, if not all, of Indonesia’s large cities are experiencing a shift in spatial structure, moving
from a mono-centric spatial structure to polycentric structures: In most cases, the development of
new centers of economic activity is poorly planned and poorly integrated with investments in
transit, residential development and urban services. Planning in these cities needs to be improved to
facilitate more efficient spatial structures that are networked at the intra-metropolitan level.
3. Large cities need to consider macro-scale revitalization and repurposing of older central city
and suburban areas: This will require advanced planning skills and more importantly, new
mechanisms to foster land consolidation. For example, these cities need to develop large-scale
industrial districts, and financial and business services centers. Some of these will need to be in the
urban peripheries, others in activity centers.
4. Large metropolitan regions should develop indicators to measure their performance relative to
other Indonesian metropolitan regions and to gauge progress over time in terms of meeting
urban development goals: These indicators should be jointly developed by cities and use
consistent metrics to ensure apple-to-apple comparisons.
POLICY INITIATIVES FOR SMALLER METROPOLITAN AREAS
1. Looking forward, most of Indonesia’s urban population growth will take place in small to
medium size cities with populations of less than 5 million. Therefore, these cities will need
considerable technical and financial support to accommodate their expected growth: As
discussed, cities with populations in the range of 1 to 5 million are growing very fast, with average
annual rates of increase in population of 2.4 percent between 1993 and 2007. Cities with
populations in the range of 500,000 to 1 million grew even faster, at an average annual rate of
3.4 percent. Although these cities are not experiencing the levels of congestion, lack of
infrastructure and pollution that cities with populations of more than 5 million face, they are likely
to experience a rapid deterioration in service levels and quality of life unless they effectively
address the challenges posed by rapid growth. Unfortunately, they lack technical and financial
capacity to manage rapid development;
2. On the other hand, many small cities are not growing and need assistance to increase
prosperity for their residents: For example, cities with populations in the range of 100,000 to
500,000 actually lost population between 1993 and 2007, with average declines of more than
two percent per year. These cities will need to develop economic development strategies to foster
economic growth to support their constituents. They should also be better connected to nearby
larger cities to provide access to market and social services;
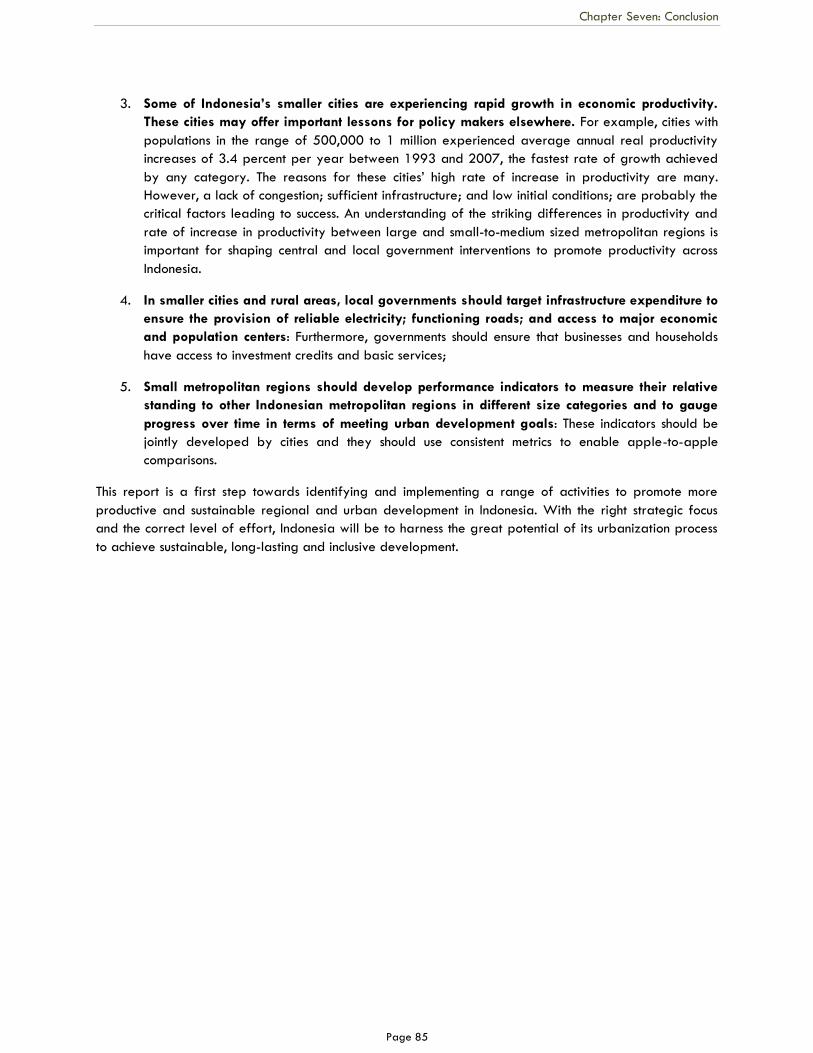
Chapter Seven: Conclusion
Page 85
3. Some of Indonesia’s smaller cities are experiencing rapid growth in economic productivity.
These cities may offer important lessons for policy makers elsewhere. For example, cities with
populations in the range of 500,000 to 1 million experienced average annual real productivity
increases of 3.4 percent per year between 1993 and 2007, the fastest rate of growth achieved
by any category. The reasons for these cities‘ high rate of increase in productivity are many.
However, a lack of congestion; sufficient infrastructure; and low initial conditions; are probably the
critical factors leading to success. An understanding of the striking differences in productivity and
rate of increase in productivity between large and small-to-medium sized metropolitan regions is
important for shaping central and local government interventions to promote productivity across
Indonesia.
4. In smaller cities and rural areas, local governments should target infrastructure expenditure to
ensure the provision of reliable electricity; functioning roads; and access to major economic
and population centers: Furthermore, governments should ensure that businesses and households
have access to investment credits and basic services;
5. Small metropolitan regions should develop performance indicators to measure their relative
standing to other Indonesian metropolitan regions in different size categories and to gauge
progress over time in terms of meeting urban development goals: These indicators should be
jointly developed by cities and they should use consistent metrics to enable apple-to-apple
comparisons.
This report is a first step towards identifying and implementing a range of activities to promote more
productive and sustainable regional and urban development in Indonesia. With the right strategic focus
and the correct level of effort, Indonesia will be to harness the great potential of its urbanization process
to achieve sustainable, long-lasting and inclusive development.
Page 86
Annex 1
Agglomeration Index and Metropolitan Regions This annex describes the construction of the Agglomeration Index we developed to identify and define the boundaries of metropolitan areas in Indonesia.
As of 2008, BPS identifies nine metropolitan areas, as shown in Table A1.1. However, recognizing that urbanization affects a considerably larger number of areas than those identified by BPS, we employ the framework developed by Uchida and Nelson (2008) to identify clustered districts as metropolitan agglomerations. Uchida and Nelson start with a seed area, or urban core, and construct metropolitan areas by adding districts. In order for a spatial area to be added to the metropolitan region, it must satisfy two criteria:
1. Minimum population density of 150 people per square kilometer
2. Maximum travel time from a large urban center of 60 minutes
In addition, a third criterion requires the entire metropolitan region to have a population equal to or greater than 50,000 to be classified as metropolitan.
Uchida and Nelson‘s method provides a good framework. However, it was developed to be appropriate for an international context. Since we specifically examining Indonesia, we adapt their method to the country‘s specific conditions. We modify their framework as follows:
1. We specify density thresholds at the 20th percentile of non-kota districts and use different density
thresholds for Java-Bali and off-Java-Bali regions. The density threshold for Java-Bali was 710
persons per square kilometer, while the threshold for all other regions was 150 persons per
square kilometer.
2. We use a maximum travel time of 90 minutes for Jakarta and Surabaya, and 60 minutes for other
cities. We measure travel times and distances from the centroid of the origin district to the centroid
of the destination district.
It is noteworthy that we developed a set of metropolitan agglomerations by clustering districts based on the pre-decentralization configuration. In addition, it is important to note that we developed a single set of metropolitan agglomerations based on 2007 data. On this basis, we then assume that the metropolitan areas so defined are constant in time back to 1993. That is, regardless of the year, we assume that the same set of districts comprises a metropolitan agglomeration. We do this to ensure that the comparison of metropolitan characteristics over time is for consistent set of spatial areas.
Our Agglomeration Index identifies 44 agglomerations, some of which consist of a single city and some with one or more cities at the core of multi-district metropolitan area.
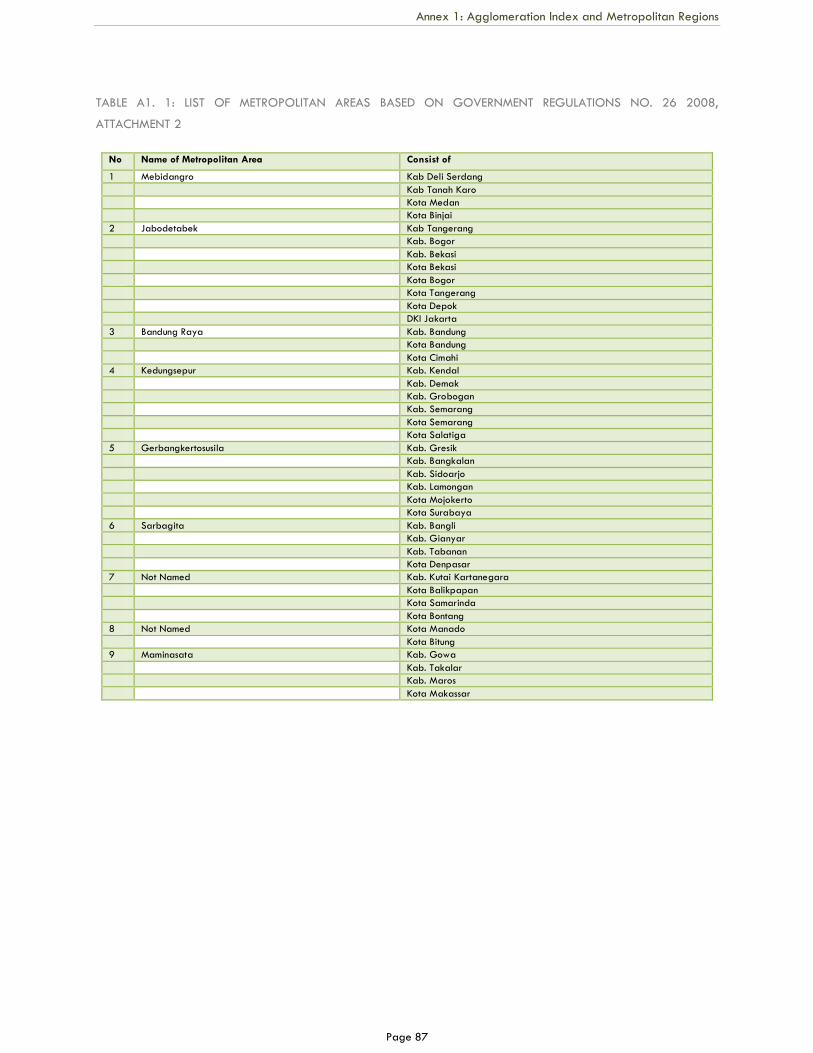
Annex 1: Agglomeration Index and Metropolitan Regions
Page 87
TABLE A1. 1: LIST OF METROPOLITAN AREAS BASED ON GOVERNMENT REGULATIONS NO. 26 2008,
ATTACHMENT 2
No Name of Metropolitan Area Consist of
1 Mebidangro Kab Deli Serdang
Kab Tanah Karo
Kota Medan
Kota Binjai
2 Jabodetabek Kab Tangerang
Kab. Bogor
Kab. Bekasi
Kota Bekasi
Kota Bogor
Kota Tangerang
Kota Depok
DKI Jakarta
3 Bandung Raya Kab. Bandung
Kota Bandung
Kota Cimahi
4 Kedungsepur Kab. Kendal
Kab. Demak
Kab. Grobogan
Kab. Semarang
Kota Semarang
Kota Salatiga
5 Gerbangkertosusila Kab. Gresik
Kab. Bangkalan
Kab. Sidoarjo
Kab. Lamongan
Kota Mojokerto
Kota Surabaya
6 Sarbagita Kab. Bangli
Kab. Gianyar
Kab. Tabanan
Kota Denpasar
7 Not Named Kab. Kutai Kartanegara
Kota Balikpapan
Kota Samarinda
Kota Bontang
8 Not Named Kota Manado
Kota Bitung
9 Maminasata Kab. Gowa
Kab. Takalar
Kab. Maros
Kota Makassar
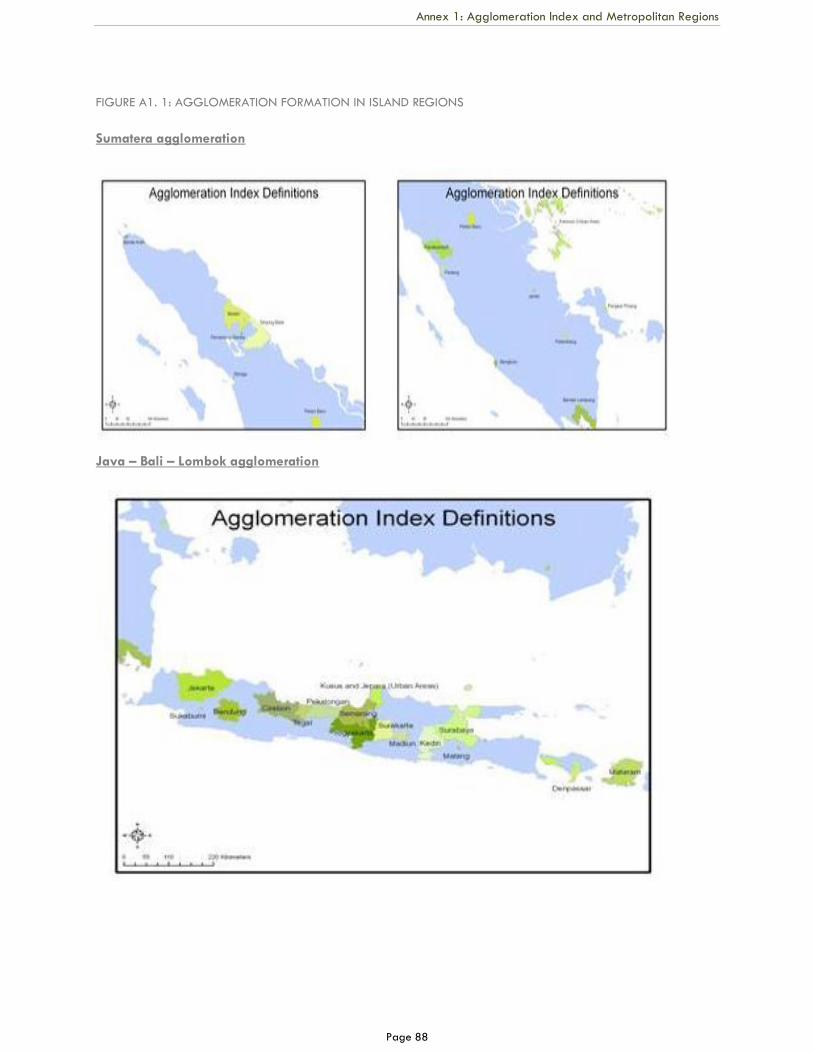
Annex 1: Agglomeration Index and Metropolitan Regions
Page 88
FIGURE A1. 1: AGGLOMERATION FORMATION IN ISLAND REGIONS
Sumatera agglomeration
Java – Bali – Lombok agglomeration
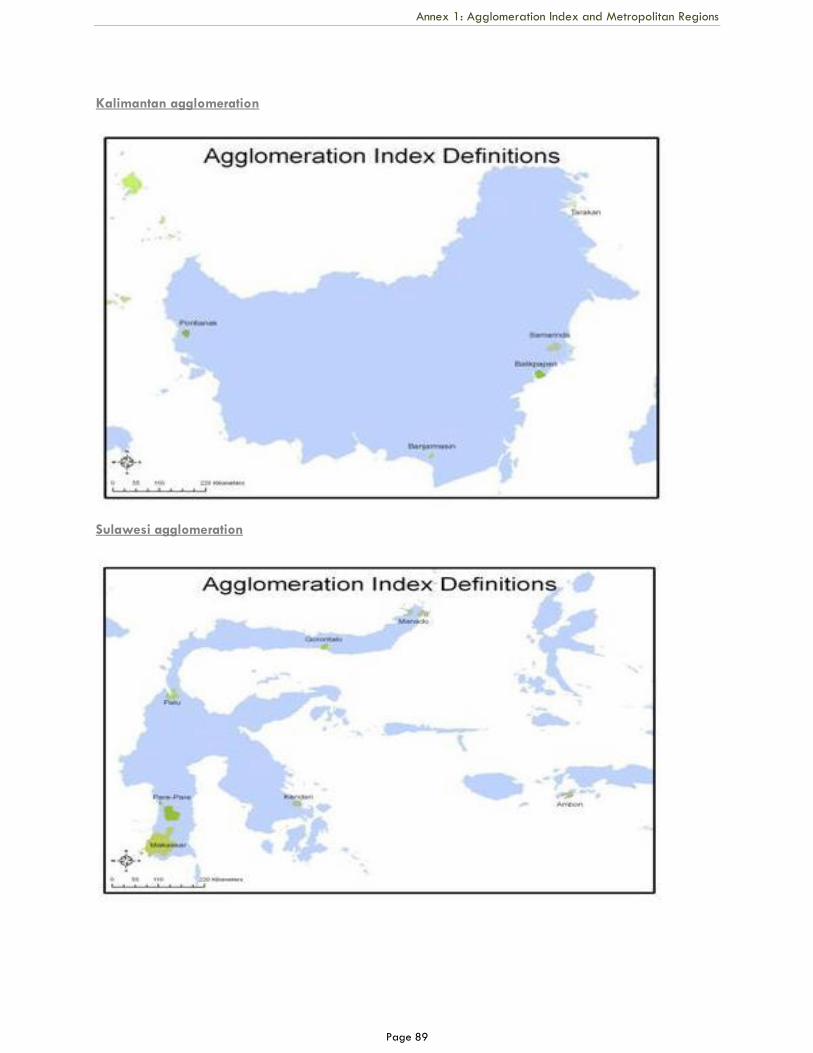
Annex 1: Agglomeration Index and Metropolitan Regions
Page 89
Kalimantan agglomeration
Sulawesi agglomeration
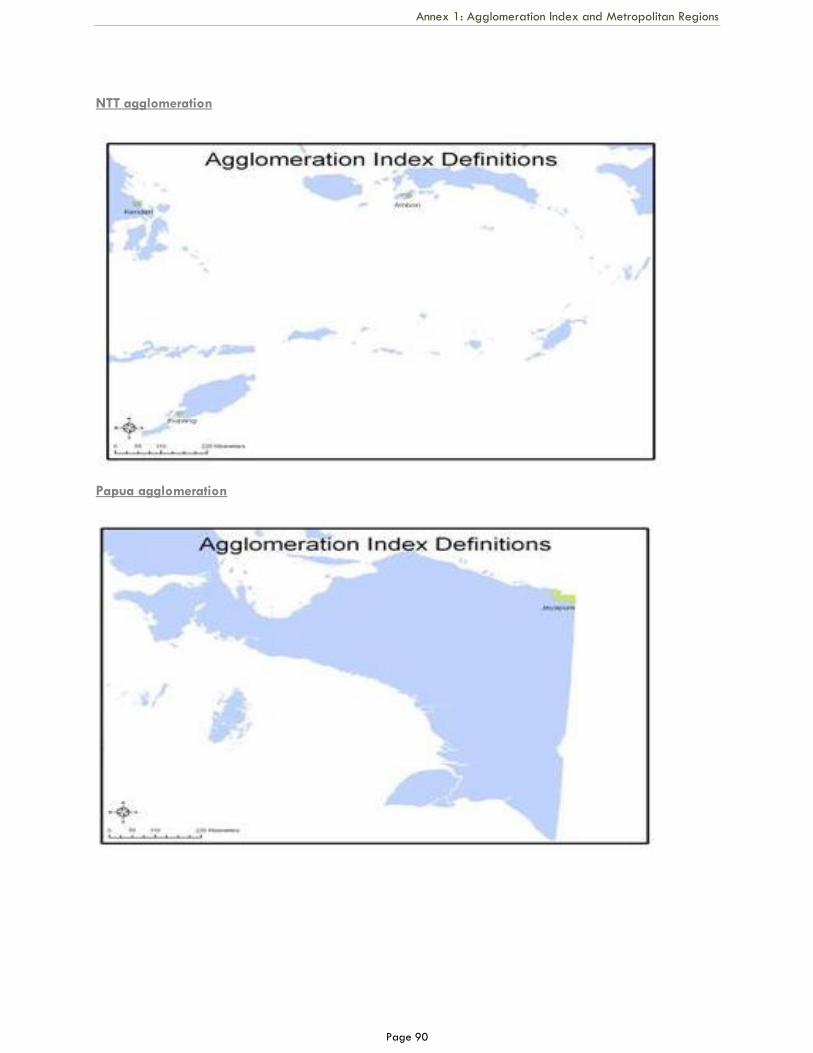
Annex 1: Agglomeration Index and Metropolitan Regions
Page 90
NTT agglomeration
Papua agglomeration
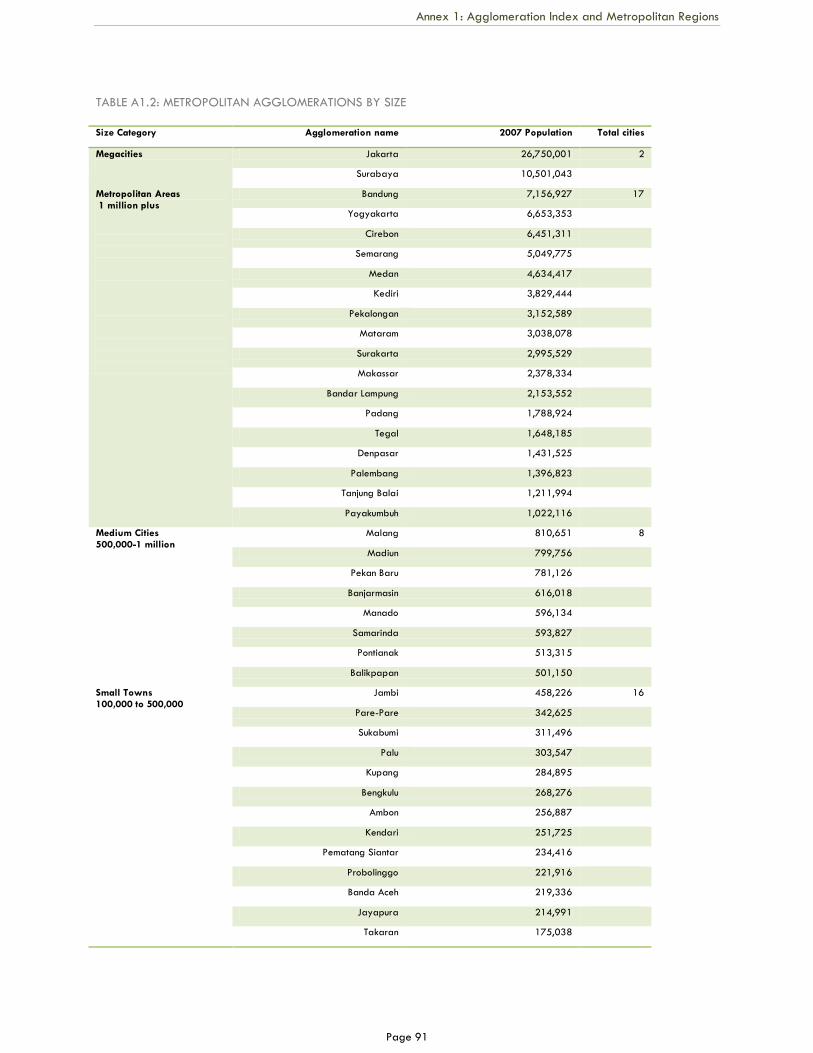
Annex 1: Agglomeration Index and Metropolitan Regions
Page 91
TABLE A1.2: METROPOLITAN AGGLOMERATIONS BY SIZE
Size Category Agglomeration name 2007 Population Total cities
Megacities
Jakarta 26,750,001 2
Surabaya 10,501,043
Metropolitan Areas 1 million plus
Bandung 7,156,927 17
Yogyakarta 6,653,353
Cirebon 6,451,311
Semarang 5,049,775
Medan 4,634,417
Kediri 3,829,444
Pekalongan 3,152,589
Mataram 3,038,078
Surakarta 2,995,529
Makassar 2,378,334
Bandar Lampung 2,153,552
Padang 1,788,924
Tegal 1,648,185
Denpasar 1,431,525
Palembang 1,396,823
Tanjung Balai 1,211,994
Payakumbuh 1,022,116
Medium Cities 500,000-1 million
Malang 810,651 8
Madiun 799,756
Pekan Baru 781,126
Banjarmasin 616,018
Manado 596,134
Samarinda 593,827
Pontianak 513,315
Balikpapan 501,150
Small Towns 100,000 to 500,000
Jambi 458,226 16
Pare-Pare 342,625
Sukabumi 311,496
Palu 303,547
Kupang 284,895
Bengkulu 268,276
Ambon 256,887
Kendari 251,725
Pematang Siantar 234,416
Probolinggo 221,916
Banda Aceh 219,336
Jayapura 214,991
Takaran 175,038
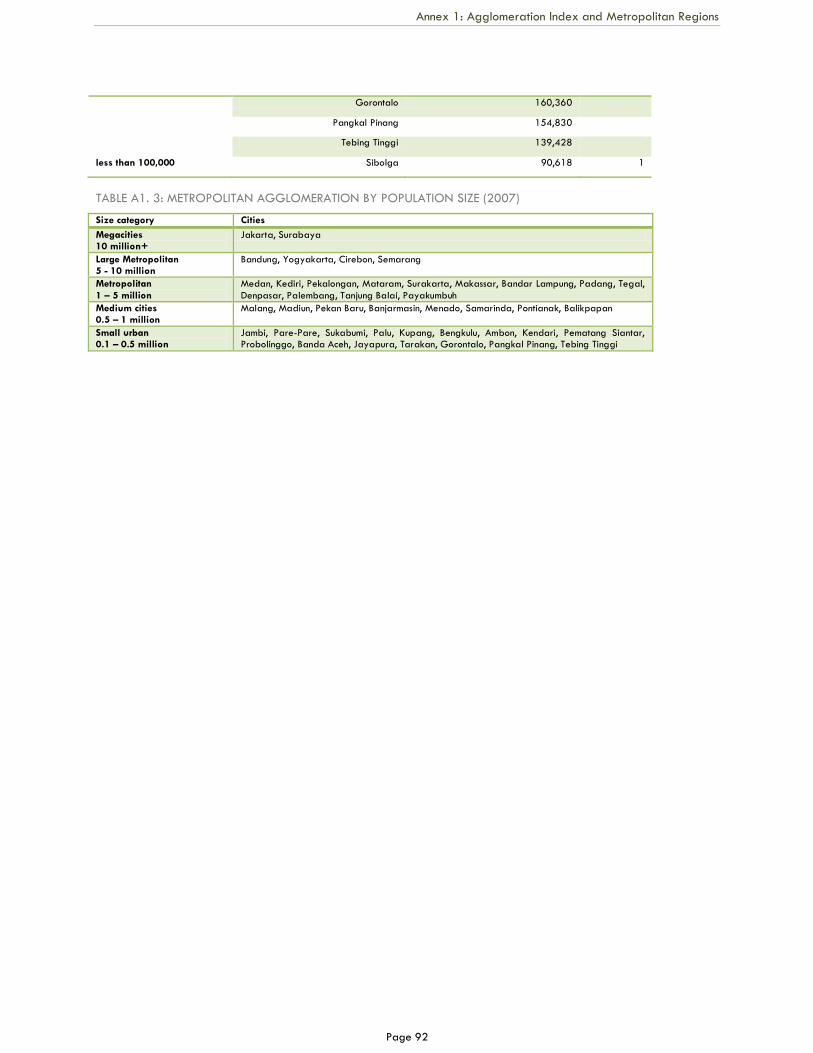
Annex 1: Agglomeration Index and Metropolitan Regions
Page 92
Gorontalo 160,360
Pangkal Pinang 154,830
Tebing Tinggi 139,428
less than 100,000 Sibolga 90,618 1
TABLE A1. 3: METROPOLITAN AGGLOMERATION BY POPULATION SIZE (2007)
Size category Cities
Megacities 10 million+
Jakarta, Surabaya
Large Metropolitan 5 - 10 million
Bandung, Yogyakarta, Cirebon, Semarang
Metropolitan
1 – 5 million
Medan, Kediri, Pekalongan, Mataram, Surakarta, Makassar, Bandar Lampung, Padang, Tegal,
Denpasar, Palembang, Tanjung Balai, Payakumbuh
Medium cities 0.5 – 1 million
Malang, Madiun, Pekan Baru, Banjarmasin, Menado, Samarinda, Pontianak, Balikpapan
Small urban 0.1 – 0.5 million
Jambi, Pare-Pare, Sukabumi, Palu, Kupang, Bengkulu, Ambon, Kendari, Pematang Siantar, Probolinggo, Banda Aceh, Jayapura, Tarakan, Gorontalo, Pangkal Pinang, Tebing Tinggi

Page 93
ANNEX 2
GRAVITY INDICES We developed two gravity indices to help us understand the role of spatial proximity and economic distance as factors that facilitate constrain growth in Indonesia.
A gravity index provides a measure of the proximity of a place to regional attractions, weighted by the distance that must be traversed to reach those attractions. The general formula for a gravity index is as follows:
GIi = j [ATTRACTIONj]
e(ED)ij
where:
i denotes a spatial area (in our case, a district)
j denotes an attraction (in our case, metropolitan and economic centers)
GIi is the gravity index for a given district
ATTRACTIONi= denotes the attractive force of a population or economic center
is a modeler-determined decay coefficient
EDij is a measure of economic distance, e.g., time or physical distance between origin i and
destination j.
Higher gravity indices denote higher levels of accessibility to the attracting areas. We use this principle to develop two sets of gravity indices:
1) Market gravity; 2) Sectoral economic gravity.
MARKET GRAVITY
Our concept of market gravity (denoted mgravity in the models) provides a measure of the distance that a district lies from its regional metropolitan centers.
For ATTRACTION, we use the population of a metropolitan agglomeration as per our Agglomeration Index (for the construction of the Agglomeration Index, see Appendix 1).
For TD, we use the road network travel time from district i to Agglomeration j, computed using ArcGIS. We estimate travel times based on assumed travel speeds for Class 1 through 4 roads. Table A2.1 gives the assumed travel speed for each class of road, based on the location of the road. There is very little information in the literature on road speeds in Indonesia. Thus, these estimates are based on experiential accounts of comparison of expatriate reported travel-times given in an expatriate website7, and limited travel-time information for Jakarta given by Suryo et al (2007).
These assumed travel speeds are a more than a simple measure of travel distance between districts and
metropolitan centers because they reflect the quality of the road network. For , we use 1 for land travel and 2 for water travel, under the rationale that water-based travel will be slower than land travel.
7http://www.ssafara.net/SSA_Chapters/Jakarta/Relocation_Information/
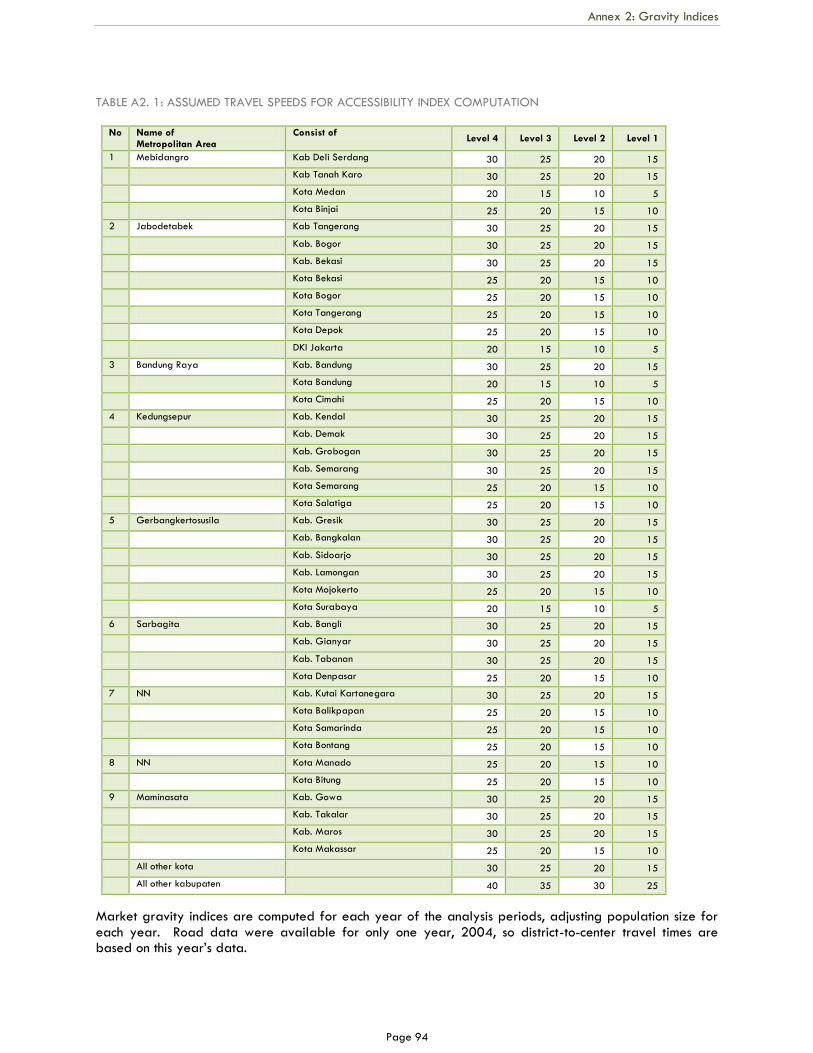
Annex 2: Gravity Indices
Page 94
TABLE A2. 1: ASSUMED TRAVEL SPEEDS FOR ACCESSIBILITY INDEX COMPUTATION
No Name of Metropolitan Area
Consist of Level 4 Level 3 Level 2 Level 1
1 Mebidangro Kab Deli Serdang 30 25 20 15
Kab Tanah Karo 30 25 20 15
Kota Medan 20 15 10 5
Kota Binjai 25 20 15 10
2 Jabodetabek Kab Tangerang 30 25 20 15
Kab. Bogor 30 25 20 15
Kab. Bekasi 30 25 20 15
Kota Bekasi 25 20 15 10
Kota Bogor 25 20 15 10
Kota Tangerang 25 20 15 10
Kota Depok 25 20 15 10
DKI Jakarta 20 15 10 5
3 Bandung Raya Kab. Bandung 30 25 20 15
Kota Bandung 20 15 10 5
Kota Cimahi 25 20 15 10
4 Kedungsepur Kab. Kendal 30 25 20 15
Kab. Demak 30 25 20 15
Kab. Grobogan 30 25 20 15
Kab. Semarang 30 25 20 15
Kota Semarang 25 20 15 10
Kota Salatiga 25 20 15 10
5 Gerbangkertosusila Kab. Gresik 30 25 20 15
Kab. Bangkalan 30 25 20 15
Kab. Sidoarjo 30 25 20 15
Kab. Lamongan 30 25 20 15
Kota Mojokerto 25 20 15 10
Kota Surabaya 20 15 10 5
6 Sarbagita Kab. Bangli 30 25 20 15
Kab. Gianyar 30 25 20 15
Kab. Tabanan 30 25 20 15
Kota Denpasar 25 20 15 10
7 NN Kab. Kutai Kartanegara 30 25 20 15
Kota Balikpapan 25 20 15 10
Kota Samarinda 25 20 15 10
Kota Bontang 25 20 15 10
8 NN Kota Manado 25 20 15 10
Kota Bitung 25 20 15 10
9 Maminasata Kab. Gowa 30 25 20 15
Kab. Takalar 30 25 20 15
Kab. Maros 30 25 20 15
Kota Makassar 25 20 15 10
All other kota 30 25 20 15
All other kabupaten 40 35 30 25
Market gravity indices are computed for each year of the analysis periods, adjusting population size for each year. Road data were available for only one year, 2004, so district-to-center travel times are based on this year‘s data.
Annex 2: Gravity Indices
Page 95
SECTOR ECONOMIC GRAVITY
In addition to the gravity of a place to large population centers, we were also interested in the economic gravity of a place to economic centers – that is, in the economic draw of nearby districts, weighted by their proximity. We compute sector gravity indices for each of the studied economic sectors (textiles; electric machinery; paper and products; and printing and publishing), for each of the analysis years. Again, we use road-based travel times derived from 2004 data. For ATTRACTION, we use the manufacturing value-
added produced by a district j. For , we use a value of 1 for over-land travel. We include only on-island attractions for the sector gravity computations, under the rationale that activity taking place on another island would be minimally accessible, and thus, this component of the gravity index would be negligible.
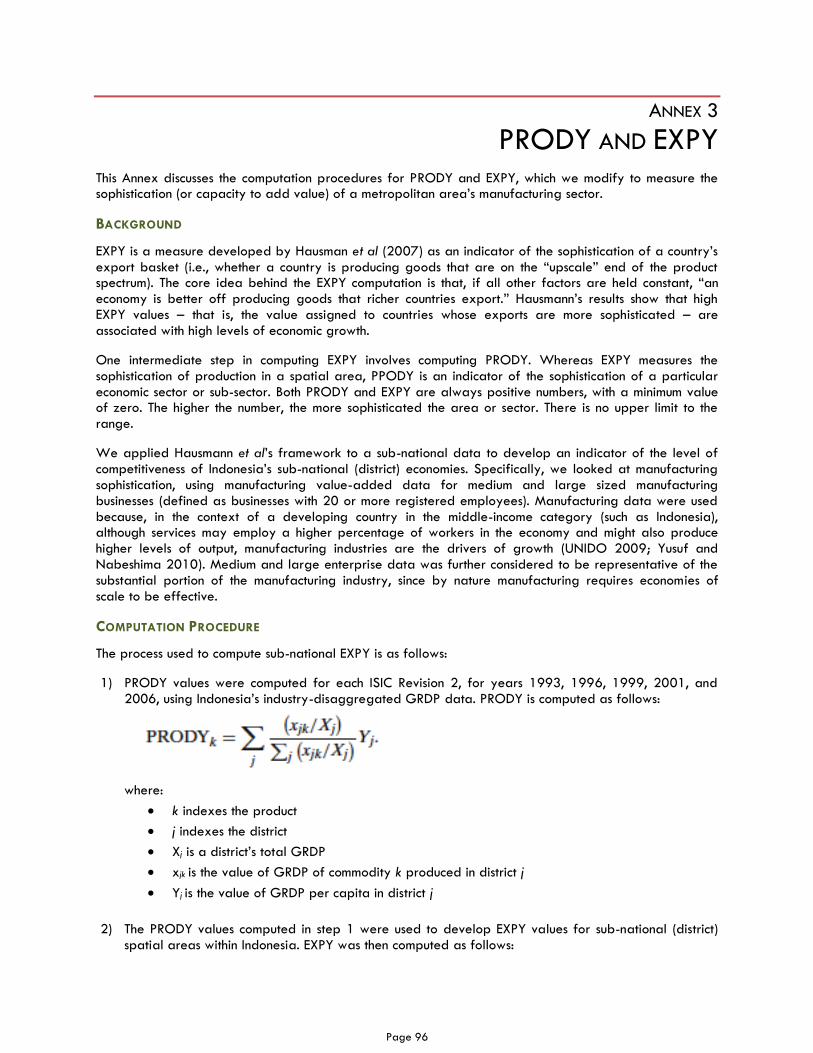
Page 96
ANNEX 3
PRODY AND EXPY This Annex discusses the computation procedures for PRODY and EXPY, which we modify to measure the sophistication (or capacity to add value) of a metropolitan area‘s manufacturing sector.
BACKGROUND
EXPY is a measure developed by Hausman et al (2007) as an indicator of the sophistication of a country‘s export basket (i.e., whether a country is producing goods that are on the ―upscale‖ end of the product spectrum). The core idea behind the EXPY computation is that, if all other factors are held constant, ―an economy is better off producing goods that richer countries export.‖ Hausmann‘s results show that high EXPY values – that is, the value assigned to countries whose exports are more sophisticated – are associated with high levels of economic growth.
One intermediate step in computing EXPY involves computing PRODY. Whereas EXPY measures the sophistication of production in a spatial area, PPODY is an indicator of the sophistication of a particular economic sector or sub-sector. Both PRODY and EXPY are always positive numbers, with a minimum value of zero. The higher the number, the more sophisticated the area or sector. There is no upper limit to the range.
We applied Hausmann et al‘s framework to a sub-national data to develop an indicator of the level of competitiveness of Indonesia‘s sub-national (district) economies. Specifically, we looked at manufacturing sophistication, using manufacturing value-added data for medium and large sized manufacturing businesses (defined as businesses with 20 or more registered employees). Manufacturing data were used because, in the context of a developing country in the middle-income category (such as Indonesia), although services may employ a higher percentage of workers in the economy and might also produce higher levels of output, manufacturing industries are the drivers of growth (UNIDO 2009; Yusuf and Nabeshima 2010). Medium and large enterprise data was further considered to be representative of the substantial portion of the manufacturing industry, since by nature manufacturing requires economies of scale to be effective.
COMPUTATION PROCEDURE
The process used to compute sub-national EXPY is as follows:
1) PRODY values were computed for each ISIC Revision 2, for years 1993, 1996, 1999, 2001, and 2006, using Indonesia‘s industry-disaggregated GRDP data. PRODY is computed as follows:
where:
k indexes the product
j indexes the district
Xj is a district‘s total GRDP
xjk is the value of GRDP of commodity k produced in district j
Yj is the value of GRDP per capita in district j
2) The PRODY values computed in step 1 were used to develop EXPY values for sub-national (district) spatial areas within Indonesia. EXPY was then computed as follows:
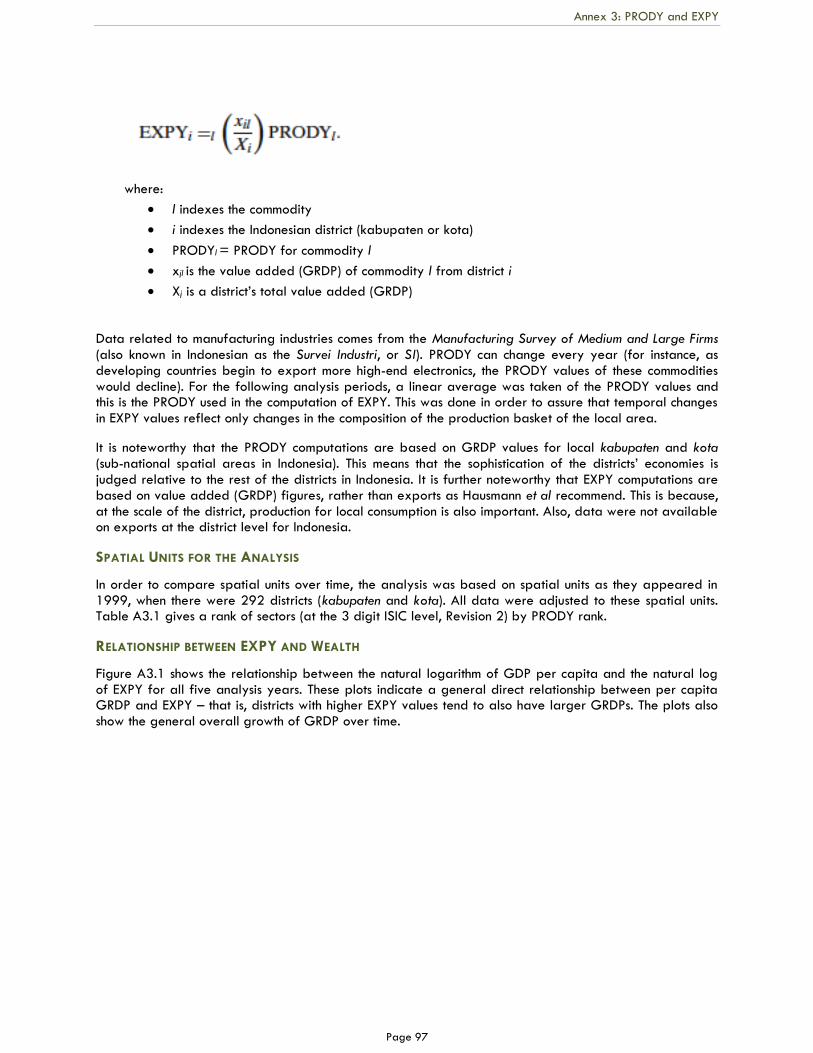
Annex 3: PRODY and EXPY
Page 97
where:
l indexes the commodity
i indexes the Indonesian district (kabupaten or kota)
PRODYl = PRODY for commodity l
xjl is the value added (GRDP) of commodity l from district i
Xj is a district‘s total value added (GRDP)
Data related to manufacturing industries comes from the Manufacturing Survey of Medium and Large Firms (also known in Indonesian as the Survei Industri, or SI). PRODY can change every year (for instance, as developing countries begin to export more high-end electronics, the PRODY values of these commodities would decline). For the following analysis periods, a linear average was taken of the PRODY values and this is the PRODY used in the computation of EXPY. This was done in order to assure that temporal changes in EXPY values reflect only changes in the composition of the production basket of the local area.
It is noteworthy that the PRODY computations are based on GRDP values for local kabupaten and kota (sub-national spatial areas in Indonesia). This means that the sophistication of the districts‘ economies is judged relative to the rest of the districts in Indonesia. It is further noteworthy that EXPY computations are based on value added (GRDP) figures, rather than exports as Hausmann et al recommend. This is because, at the scale of the district, production for local consumption is also important. Also, data were not available on exports at the district level for Indonesia.
SPATIAL UNITS FOR THE ANALYSIS
In order to compare spatial units over time, the analysis was based on spatial units as they appeared in 1999, when there were 292 districts (kabupaten and kota). All data were adjusted to these spatial units. Table A3.1 gives a rank of sectors (at the 3 digit ISIC level, Revision 2) by PRODY rank.
RELATIONSHIP BETWEEN EXPY AND WEALTH
Figure A3.1 shows the relationship between the natural logarithm of GDP per capita and the natural log of EXPY for all five analysis years. These plots indicate a general direct relationship between per capita GRDP and EXPY – that is, districts with higher EXPY values tend to also have larger GRDPs. The plots also show the general overall growth of GRDP over time.

Annex 3: PRODY and EXPY
Page 98
FIGURE A3. 1: INDONESIAN SUBNATIONAL EXPY VALUES FOR 1993 THROUGH 2006
DATA: BPS, INDONESIA INDUSTRY SURVEY
The plots indicate that Indonesia‘s economy became more sophisticated in the period from 1993 to 2001, but that it has declined in sophistication in the period from 2001 to 2006. From 1993 to 2001, the plots become more tightly clustered near the higher end of the EXPY range. This is an indication that economic activity is moving toward the upscale end of the range. However, in 2006, a significant portion of districts also show activity at the low end of the cluster again – an indication of a downscale movement in manufacturing output.
Figure A3.2 show plots of EXPY versus GRDP per capita at a more-detailed level. These plots agree in general with the shape of an EXPY plot based on Hausmann et al‘s formula using national accounts and exports, as shown in Figure A3.3.
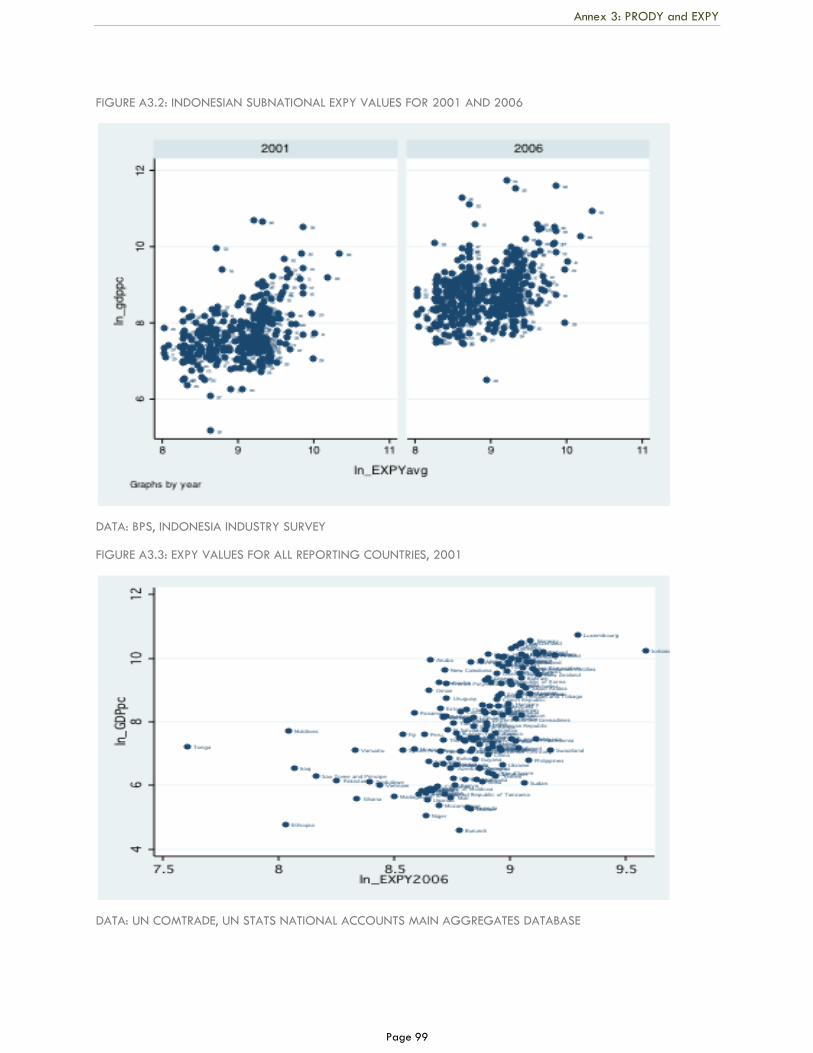
Annex 3: PRODY and EXPY
Page 99
FIGURE A3.2: INDONESIAN SUBNATIONAL EXPY VALUES FOR 2001 AND 2006
DATA: BPS, INDONESIA INDUSTRY SURVEY
FIGURE A3.3: EXPY VALUES FOR ALL REPORTING COUNTRIES, 2001
DATA: UN COMTRADE, UN STATS NATIONAL ACCOUNTS MAIN AGGREGATES DATABASE

Annex 3: PRODY and EXPY
Page 100
TABLE A3.1: MANUFACTURING SUB-SECTORS IN INDONESIA, BY PRODY RANK
ISIC, Rev. 2, 4 digit PRODY ISIC, Rev. 2, 3 digit ISIC, Rev. 2, 3 digit description
3851 4.93E+07 385 Professional and scientific equipment
3825 4.40E+07 382 Machinery, except electrical
3512 4.35E+07 351 Industrial chemicals
3523 4.26E+07 352 Other chemicals
3843 4.10E+07 384 Transport equipment
3511 3.71E+07 351 Industrial chemicals
3839 3.67E+07 383 Machinery, electric
3620 3.35E+07 362 Glass and products
3831 3.15E+07 383 Machinery, electric
3133 2.84E+07 313 Beverages
3832 2.77E+07 383 Machinery, electric
3132 2.64E+07 313 Beverages
3411 2.37E+07 341 Paper and products
3853 2.35E+07 385 Professional and scientific equipment
3420 2.24E+07 342 Printing and publishing
3560 2.23E+07 356 Plastic products
3140 2.19E+07 314 Tobacco
3710 2.16E+07 371 Iron and steel
3821 2.13E+07 382 Machinery, except electrical
3529 2.05E+07 352 Other chemicals
3822 2.03E+07 382 Machinery, except electrical
3829 1.99E+07 382 Machinery, except electrical
3819 1.92E+07 381 Fabricated metal products
3521 1.79E+07 352 Other chemicals
3844 1.67E+07 384 Transport equipment
3824 1.63E+07 382 Machinery, except electrical
3115 1.61E+07 311 Food products
3119 1.61E+07 311 Food products
3240 1.61E+07 324 Footwear, except rubber or plastic
3699 1.61E+07 369 Other non-metallic mineral products
3813 1.59E+07 381 Fabricated metal products
3902 1.59E+07 390 Other manufactured products
3812 1.54E+07 381 Fabricated metal products
3215 1.41E+07 321 Textiles
3213 1.39E+07 321 Textiles
3112 1.33E+07 311 Food products
3513 1.31E+07 351 Industrial chemicals
3559 1.29E+07 355 Rubber products
3311 1.28E+07 331 Wood products, except furniture

Annex 3: PRODY and EXPY
Page 101
3610 1.28E+07 361 Pottery, china, earthenware
3131 1.26E+07 313 Beverages
3212 1.24E+07 321 Textiles
3530 1.14E+07 353 Petroleum refineries
3122 1.13E+07 312 Food products
3522 1.11E+07 352 Other chemicals
3551 1.10E+07 355 Rubber products
3121 1.06E+07 312 Food products
3233 1.02E+07 323 Leather products
3211 1.01E+07 321 Textiles
3720 1.01E+07 372 Non-ferrous metals
3214 9.96E+06 321 Textiles
3901 9.84E+06 390 Other manufactured products
3134 9.77E+06 313 Beverages
3231 9.33E+06 323 Leather products
3117 9.28E+06 311 Food products
3320 9.11E+06 332 Furniture, except metal
3903 8.81E+06 390 Other manufactured products
3111 8.72E+06 311 Food products
3811 8.40E+06 381 Fabricated metal products
3114 8.39E+06 311 Food products
3219 7.56E+06 321 Textiles
3540 7.39E+06 354
Miscellaneous petroleum and coal products
3118 6.95E+06 311 Food products
3412 6.93E+06 341 Paper and products
3116 6.91E+06 311 Food products
3113 6.55E+06 311 Food products
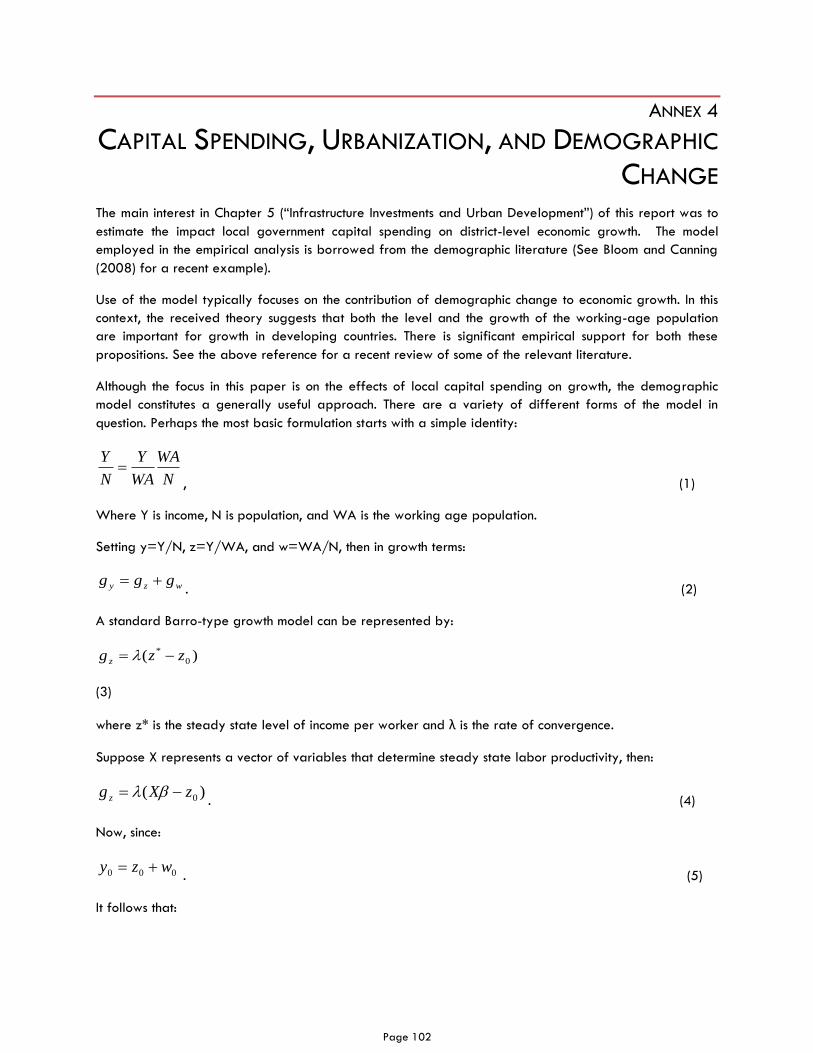
Page 102
ANNEX 4
CAPITAL SPENDING, URBANIZATION, AND DEMOGRAPHIC
CHANGE The main interest in Chapter 5 (―Infrastructure Investments and Urban Development‖) of this report was to
estimate the impact local government capital spending on district-level economic growth. The model
employed in the empirical analysis is borrowed from the demographic literature (See Bloom and Canning
(2008) for a recent example).
Use of the model typically focuses on the contribution of demographic change to economic growth. In this
context, the received theory suggests that both the level and the growth of the working-age population
are important for growth in developing countries. There is significant empirical support for both these
propositions. See the above reference for a recent review of some of the relevant literature.
Although the focus in this paper is on the effects of local capital spending on growth, the demographic
model constitutes a generally useful approach. There are a variety of different forms of the model in
question. Perhaps the most basic formulation starts with a simple identity:
N
WA
WA
Y
N
Y
, (1)
Where Y is income, N is population, and WA is the working age population.
Setting y=Y/N, z=Y/WA, and w=WA/N, then in growth terms:
wzy ggg . (2)
A standard Barro-type growth model can be represented by:
)( 0
* zzg z
(3)
where z* is the steady state level of income per worker and λ is the rate of convergence.
Suppose X represents a vector of variables that determine steady state labor productivity, then:
)( 0zXg z . (4)
Now, since:
000 wzy . (5)
It follows that:
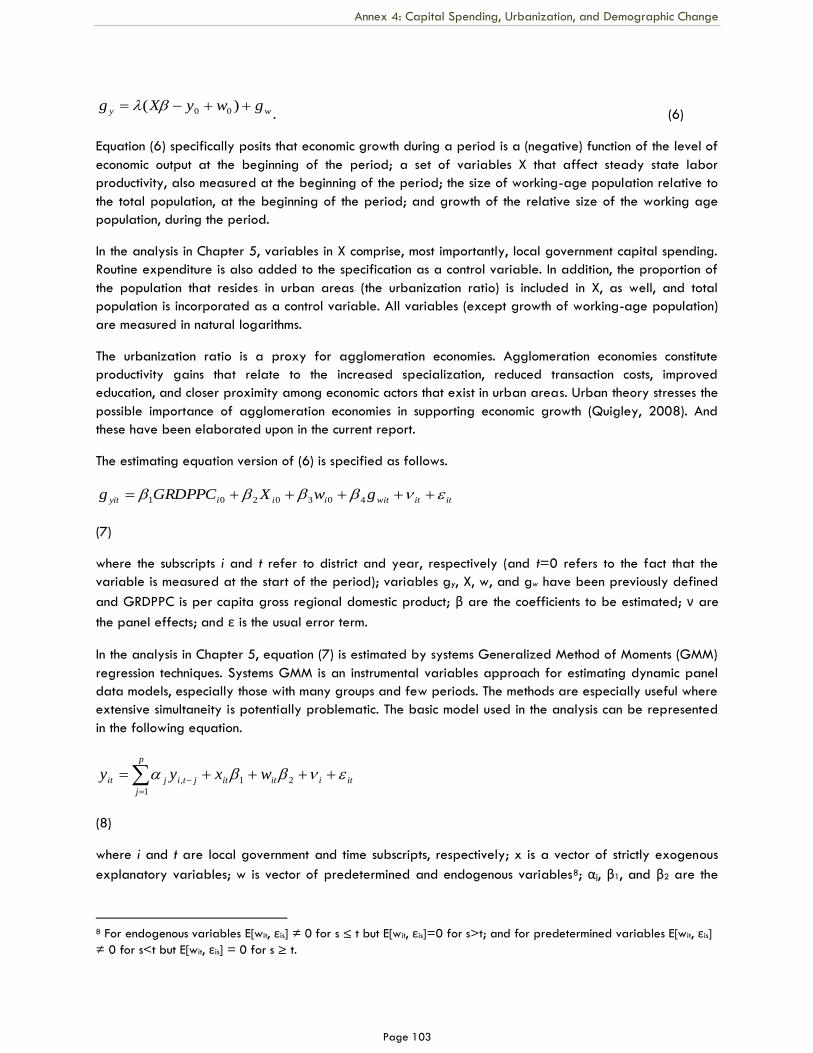
Annex 4: Capital Spending, Urbanization, and Demographic Change
Page 103
wy gwyXg )( 00. (6)
Equation (6) specifically posits that economic growth during a period is a (negative) function of the level of
economic output at the beginning of the period; a set of variables X that affect steady state labor
productivity, also measured at the beginning of the period; the size of working-age population relative to
the total population, at the beginning of the period; and growth of the relative size of the working age
population, during the period.
In the analysis in Chapter 5, variables in X comprise, most importantly, local government capital spending.
Routine expenditure is also added to the specification as a control variable. In addition, the proportion of
the population that resides in urban areas (the urbanization ratio) is included in X, as well, and total
population is incorporated as a control variable. All variables (except growth of working-age population)
are measured in natural logarithms.
The urbanization ratio is a proxy for agglomeration economies. Agglomeration economies constitute
productivity gains that relate to the increased specialization, reduced transaction costs, improved
education, and closer proximity among economic actors that exist in urban areas. Urban theory stresses the
possible importance of agglomeration economies in supporting economic growth (Quigley, 2008). And
these have been elaborated upon in the current report.
The estimating equation version of (6) is specified as follows.
ititwitiiiyit gwXGRDPPCg 4030201
(7)
where the subscripts i and t refer to district and year, respectively (and t=0 refers to the fact that the
variable is measured at the start of the period); variables gy, X, w, and gw have been previously defined
and GRDPPC is per capita gross regional domestic product; β are the coefficients to be estimated; ν are
the panel effects; and ε is the usual error term.
In the analysis in Chapter 5, equation (7) is estimated by systems Generalized Method of Moments (GMM)
regression techniques. Systems GMM is an instrumental variables approach for estimating dynamic panel
data models, especially those with many groups and few periods. The methods are especially useful where
extensive simultaneity is potentially problematic. The basic model used in the analysis can be represented
in the following equation.
itiitit
p
j
jtijit wxyy
21
1
,
(8)
where i and t are local government and time subscripts, respectively; x is a vector of strictly exogenous
explanatory variables; w is vector of predetermined and endogenous variables8; αj, β1, and β2 are the
8 For endogenous variables E[wit, εis] ≠ 0 for s ≤ t but E[wit, εis]=0 for s>t; and for predetermined variables E[wit, εis]
≠ 0 for s<t but E[wit, εis] = 0 for s ≥ t.
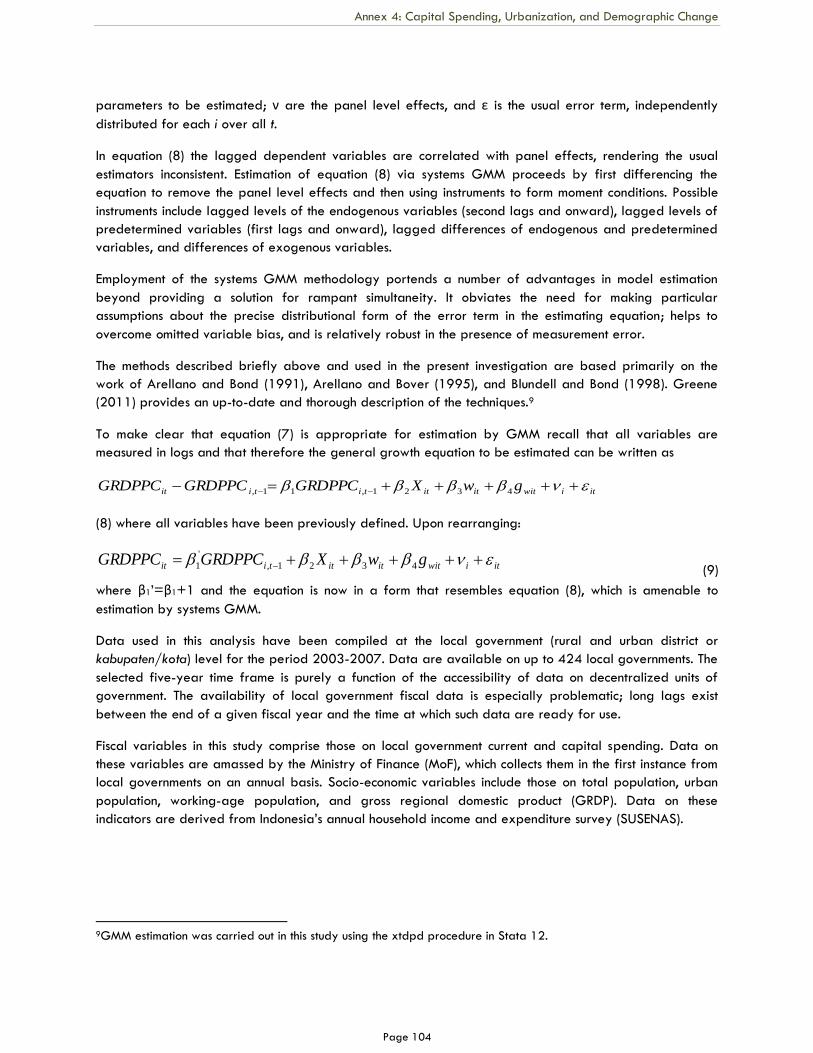
Annex 4: Capital Spending, Urbanization, and Demographic Change
Page 104
parameters to be estimated; ν are the panel level effects, and ε is the usual error term, independently
distributed for each i over all t.
In equation (8) the lagged dependent variables are correlated with panel effects, rendering the usual
estimators inconsistent. Estimation of equation (8) via systems GMM proceeds by first differencing the
equation to remove the panel level effects and then using instruments to form moment conditions. Possible
instruments include lagged levels of the endogenous variables (second lags and onward), lagged levels of
predetermined variables (first lags and onward), lagged differences of endogenous and predetermined
variables, and differences of exogenous variables.
Employment of the systems GMM methodology portends a number of advantages in model estimation
beyond providing a solution for rampant simultaneity. It obviates the need for making particular
assumptions about the precise distributional form of the error term in the estimating equation; helps to
overcome omitted variable bias, and is relatively robust in the presence of measurement error.
The methods described briefly above and used in the present investigation are based primarily on the
work of Arellano and Bond (1991), Arellano and Bover (1995), and Blundell and Bond (1998). Greene
(2011) provides an up-to-date and thorough description of the techniques.9
To make clear that equation (7) is appropriate for estimation by GMM recall that all variables are
measured in logs and that therefore the general growth equation to be estimated can be written as
itiwititittitiit gwXGRDPPCGRDPPCGRDPPC 4321,11,
(8) where all variables have been previously defined. Upon rearranging:
itiwititittiit gwXGRDPPCGRDPPC 4321,
'
1 (9)
where β1‘=β1+1 and the equation is now in a form that resembles equation (8), which is amenable to
estimation by systems GMM.
Data used in this analysis have been compiled at the local government (rural and urban district or
kabupaten/kota) level for the period 2003-2007. Data are available on up to 424 local governments. The
selected five-year time frame is purely a function of the accessibility of data on decentralized units of
government. The availability of local government fiscal data is especially problematic; long lags exist
between the end of a given fiscal year and the time at which such data are ready for use.
Fiscal variables in this study comprise those on local government current and capital spending. Data on
these variables are amassed by the Ministry of Finance (MoF), which collects them in the first instance from
local governments on an annual basis. Socio-economic variables include those on total population, urban
population, working-age population, and gross regional domestic product (GRDP). Data on these
indicators are derived from Indonesia‘s annual household income and expenditure survey (SUSENAS).
9GMM estimation was carried out in this study using the xtdpd procedure in Stata 12.
Page 105
ANNEX 5
DEVELOPMENT TRENDS IN JAKARTA, MAKASSAR, MEDAN
AND SURABAYA In this Annex, we present a series of case studies prepared on the basis of field visits conducted in the period from 2009 to 2011 to assess economic performance and to explore the institutional and policy constraints affecting urban economic development in four of Indonesia‘s major metropolitan regions: Jakarta, Makassar, Medan and Surabaya. Each of these case studies is intended to provide an overview of economic development and urbanization in those areas, together with an assessment of how laws and regulations affect growth and spatial structure. The case studies utilize available data and draw on interviews with key policy makers in each metropolitan area. Taken as a whole, this Annex provides a snapshot of the four Metropolitan areas in terms of population, land use and spatial structure, economic performance and urban development trends. It is intended to complement the aggregated assessments presented in Chapters 2(―Urbanization and Metropolitan Growth‖), Chapter 3 (―Leveraging Urbanization and Agglomeration‖) and Chapter 4 (―Economic Performance of Metropolitan Regions‖). The Annex is organized into five sections—one on each metropolitan region, and a final section which synthesizes the results.
JAKARTA METROPOLITAN REGION (JABODETABEK)
Jabodetabek, or the Jakarta Metropolitan Region (JMR), is the largest urban agglomeration in Indonesia. Its center is DKI Jakarta, the capital city. The population of Jakarta in the 1960s was already close to three million. With an annual growth rate averaging at 4.5 percent in the period from 1961 to 1971, this had doubled by the late 1970s. During the 1970s, DKI‘s rate of population growth began to gradually decline, falling to 3.9 percent per year in the period from 1971 to 1981. Starting in 1980, Jakarta‘s growth began to spill over into surrounding districts, especially Bogor, Tangerang and Bekasi. These surrounding districts contained approximately 5 million persons. Together with the population of the city proper, this added up to a total metropolitan population of 11.5 million. In the period from 1980 to 1990, the annual rate of growth of Jakarta‘s population slowed to 2.4 percent, while the comparable annual growth rates of the districts of Bogor, Tangerang and Bekasi were 4.1, 6.1 and 6.3 percent respectively. By 1990, the population of the Jabotabek area had reached 17 million, with the DKI area accounting for 8.2 million, or 49 percent, of the metropolitan area‘s total population. In 1990, Jabotabek‘s population accounted for 9.5 percent of Indonesia‘s total population.
Between 1990 and 2000, the population growth of Jakarta continued to slow, while the population growth of surrounding districts continued to accelerate. This resulted in the establishment of new municipalities adjacent to Jakarta, including the City of Tangerang in the West, the City of Bekasi in the East and the City of Depok in the South (see Figure A5.1). By 2000, the population of Jakarta proper was 8.35 million, accounting for 39 percent of total population of JMR, which had expanded significantly to include additional districts and municipalities. The recent Population Census (2010) states that the population of Jabodetabek is around 27.9 million, constituting approximately 11.75 percent of Indonesia‘s population (BPS, 2011). These figures suggest that the population of the JMR is still growing, as indicated in the previous chapter (see Table A5.1 below).
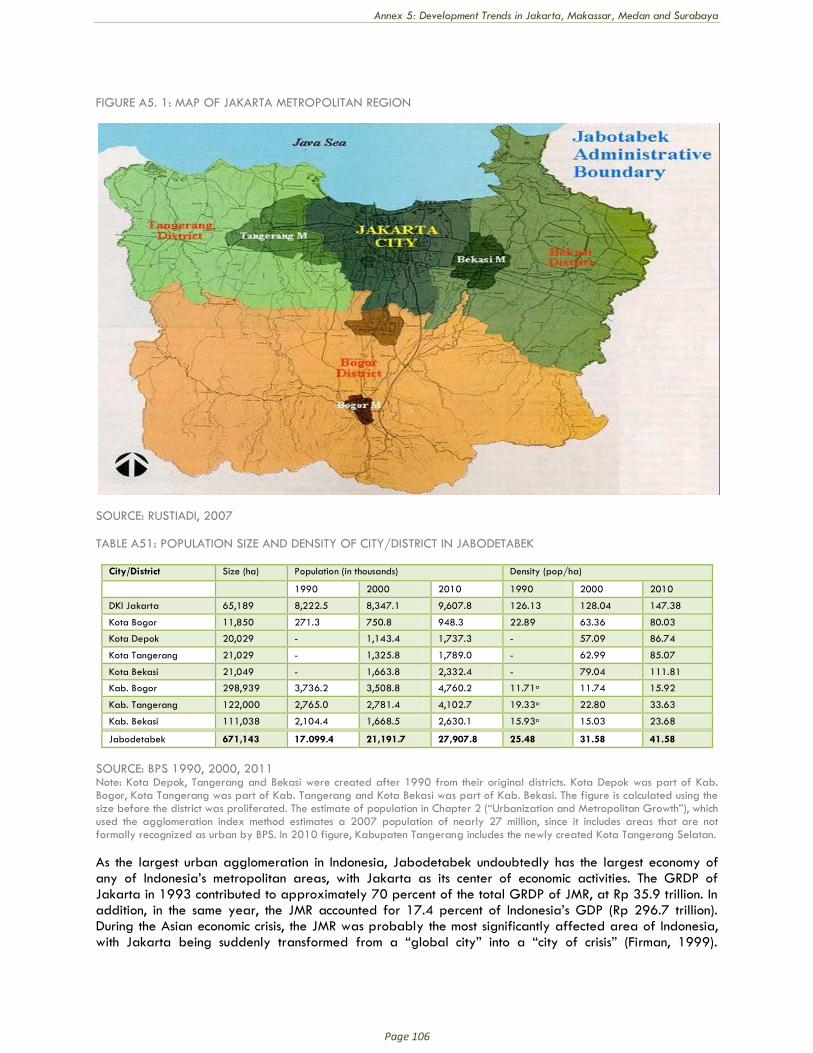
Annex 5: Development Trends in Jakarta, Makassar, Medan and Surabaya
Page 106
FIGURE A5. 1: MAP OF JAKARTA METROPOLITAN REGION
SOURCE: RUSTIADI, 2007
TABLE A51: POPULATION SIZE AND DENSITY OF CITY/DISTRICT IN JABODETABEK
City/District Size (ha) Population (in thousands) Density (pop/ha)
1990 2000 2010 1990 2000 2010
DKI Jakarta 65,189 8,222.5 8,347.1 9,607.8 126.13 128.04 147.38
Kota Bogor 11,850 271.3 750.8 948.3 22.89 63.36 80.03
Kota Depok 20,029 - 1,143.4 1,737.3 - 57.09 86.74
Kota Tangerang 21,029 - 1,325.8 1,789.0 - 62.99 85.07
Kota Bekasi 21,049 - 1,663.8 2,332.4 - 79.04 111.81
Kab. Bogor 298,939 3,736.2 3,508.8 4,760.2 11.71a 11.74 15.92
Kab. Tangerang 122,000 2,765.0 2,781.4 4,102.7 19.33a 22.80 33.63
Kab. Bekasi 111,038 2,104.4 1,668.5 2,630.1 15.93a 15.03 23.68
Jabodetabek 671,143 17.099.4 21,191.7 27,907.8 25.48 31.58 41.58
SOURCE: BPS 1990, 2000, 2011 Note: Kota Depok, Tangerang and Bekasi were created after 1990 from their original districts. Kota Depok was part of Kab. Bogor, Kota Tangerang was part of Kab. Tangerang and Kota Bekasi was part of Kab. Bekasi. The figure is calculated using the size before the district was proliferated. The estimate of population in Chapter 2 (―Urbanization and Metropolitan Growth‖), which used the agglomeration index method estimates a 2007 population of nearly 27 million, since it includes areas that are not formally recognized as urban by BPS. In 2010 figure, Kabupaten Tangerang includes the newly created Kota Tangerang Selatan.
As the largest urban agglomeration in Indonesia, Jabodetabek undoubtedly has the largest economy of any of Indonesia‘s metropolitan areas, with Jakarta as its center of economic activities. The GRDP of Jakarta in 1993 contributed to approximately 70 percent of the total GRDP of JMR, at Rp 35.9 trillion. In addition, in the same year, the JMR accounted for 17.4 percent of Indonesia‘s GDP (Rp 296.7 trillion). During the Asian economic crisis, the JMR was probably the most significantly affected area of Indonesia, with Jakarta being suddenly transformed from a ―global city‖ into a ―city of crisis‖ (Firman, 1999).
Annex 5: Development Trends in Jakarta, Makassar, Medan and Surabaya
Page 107
However, in recent years, the economy has been growing rapidly. With this growth, the region has re-established and built upon its primacy over other cities in Indonesia. The real GRDP of Jakarta in 2008 amounted to around Rp 350.6 trillion, or 70.8 percent of the GRDP of the JMR. In 2008, the GRDP of the JMR amounted to a sum equal to 25.76 percent of Indonesia‘s total GDP (around Rp. 1,936 trillion).
If we look carefully at the contribution of each industry in each of the districts and/or municipalities in the JMR (see Table A5.2 below), we notice that there has been a shift in the economic characteristics of Jakarta and the JMR. In 1993, the economy of the DKI was dominated by the manufacturing sector (25.9 percent), followed by trade, hotel and restaurant industries (18.9 percent) and the finance, real estate and business services sectors (17.6 percent). However, by 2008, finance, real estate and business services had grown to become the leading contributors (29.4 percent), followed by the trade, hotel and restaurant sectors (20.9 percent) and the manufacturing sector (16.4 percent).
For the JMR as a whole, in 1993 the economy was dominated by the manufacturing sector (30.5 percent), followed by the trade, hotel and restaurant sectors (18.5 percent) and the finance, real estate and business services sectors (13.5 percent). By 2008, the manufacturing sector was still most significant contributor (28.7 percent). However, the finance, real estate, and business services sector had grown to become the second largest contributor (21.5 percent), while the share of the trade, hotel and restaurant sectors had fallen to 19.9 percent. Thirdly, the increased share of the aforementioned three leading industries in JMR in 2008 corresponded to a decline in the share of all other industries.
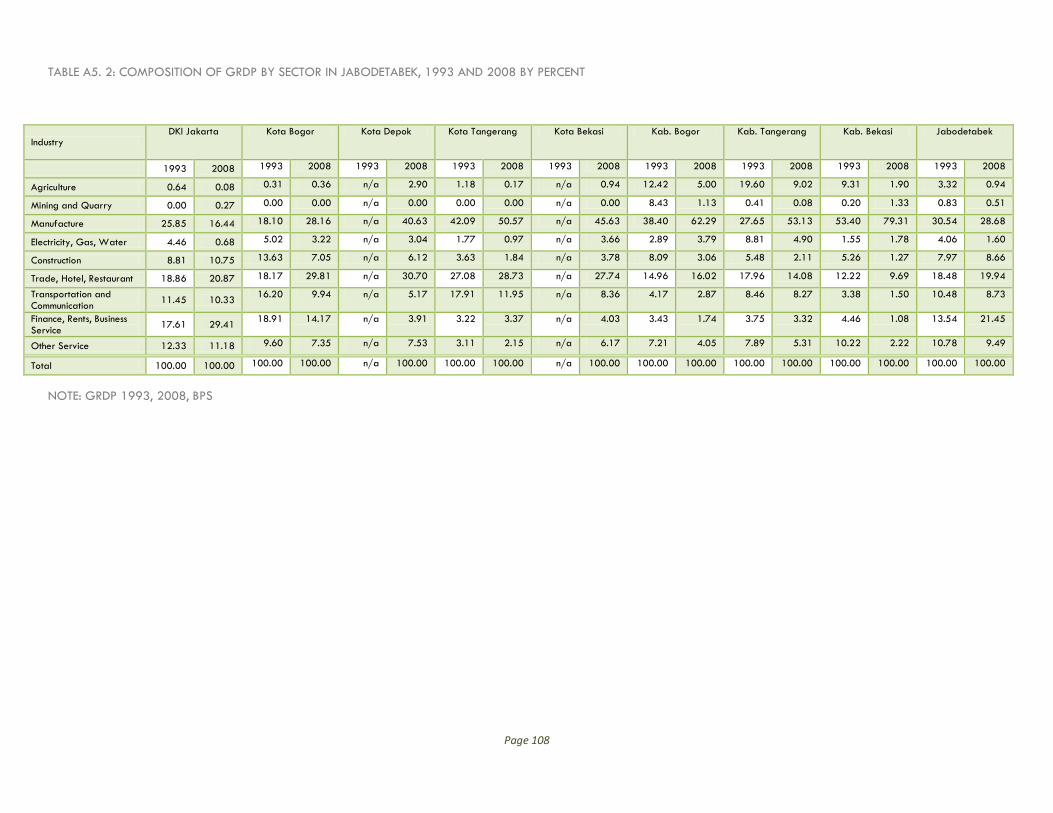
Page 108
TABLE A5. 2: COMPOSITION OF GRDP BY SECTOR IN JABODETABEK, 1993 AND 2008 BY PERCENT
Industry DKI Jakarta Kota Bogor Kota Depok Kota Tangerang Kota Bekasi Kab. Bogor Kab. Tangerang Kab. Bekasi Jabodetabek
1993 2008 1993 2008 1993 2008 1993 2008 1993 2008 1993 2008 1993 2008 1993 2008 1993 2008
Agriculture 0.64 0.08 0.31 0.36 n/a 2.90 1.18 0.17 n/a 0.94 12.42 5.00 19.60 9.02 9.31 1.90 3.32 0.94
Mining and Quarry 0.00 0.27 0.00 0.00 n/a 0.00 0.00 0.00 n/a 0.00 8.43 1.13 0.41 0.08 0.20 1.33 0.83 0.51
Manufacture 25.85 16.44 18.10 28.16 n/a 40.63 42.09 50.57 n/a 45.63 38.40 62.29 27.65 53.13 53.40 79.31 30.54 28.68
Electricity, Gas, Water 4.46 0.68 5.02 3.22 n/a 3.04 1.77 0.97 n/a 3.66 2.89 3.79 8.81 4.90 1.55 1.78 4.06 1.60
Construction 8.81 10.75 13.63 7.05 n/a 6.12 3.63 1.84 n/a 3.78 8.09 3.06 5.48 2.11 5.26 1.27 7.97 8.66
Trade, Hotel, Restaurant 18.86 20.87 18.17 29.81 n/a 30.70 27.08 28.73 n/a 27.74 14.96 16.02 17.96 14.08 12.22 9.69 18.48 19.94
Transportation and Communication
11.45 10.33 16.20 9.94 n/a 5.17 17.91 11.95 n/a 8.36 4.17 2.87 8.46 8.27 3.38 1.50 10.48 8.73
Finance, Rents, Business Service
17.61 29.41 18.91 14.17 n/a 3.91 3.22 3.37 n/a 4.03 3.43 1.74 3.75 3.32 4.46 1.08 13.54 21.45
Other Service 12.33 11.18 9.60 7.35 n/a 7.53 3.11 2.15 n/a 6.17 7.21 4.05 7.89 5.31 10.22 2.22 10.78 9.49
Total 100.00 100.00 100.00 100.00 n/a 100.00 100.00 100.00 n/a 100.00 100.00 100.00 100.00 100.00 100.00 100.00 100.00 100.00
NOTE: GRDP 1993, 2008, BPS
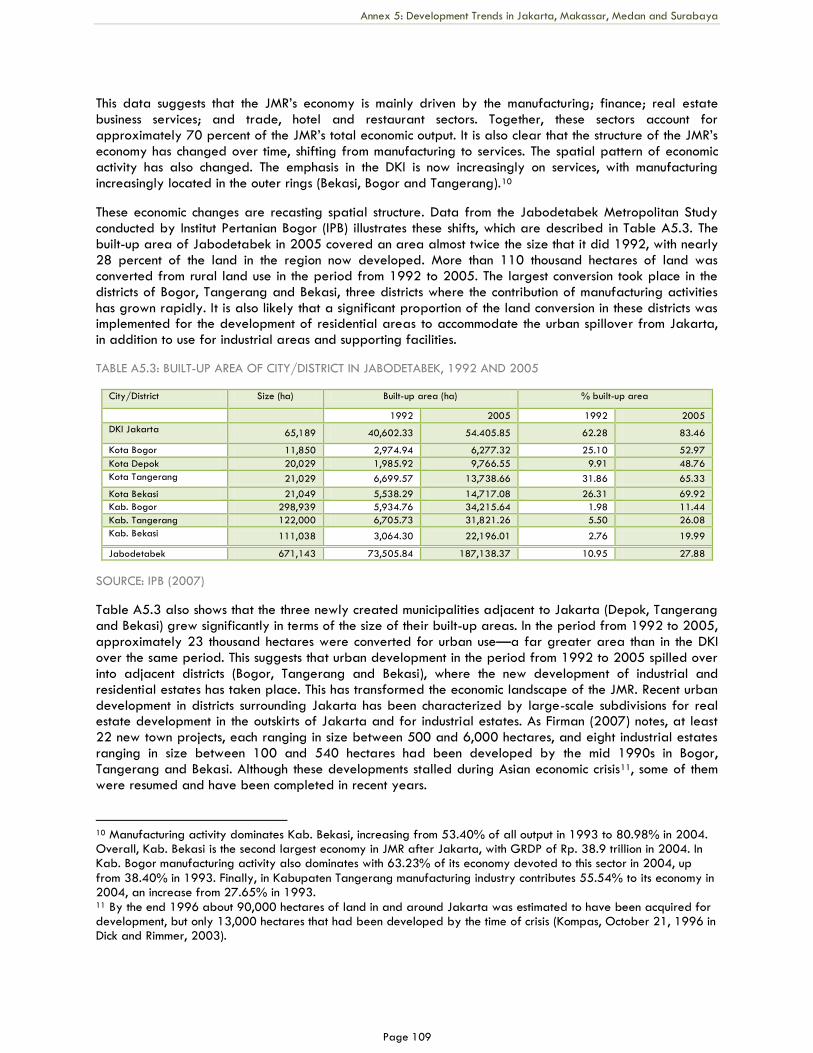
Annex 5: Development Trends in Jakarta, Makassar, Medan and Surabaya
Page 109
This data suggests that the JMR‘s economy is mainly driven by the manufacturing; finance; real estate business services; and trade, hotel and restaurant sectors. Together, these sectors account for approximately 70 percent of the JMR‘s total economic output. It is also clear that the structure of the JMR‘s economy has changed over time, shifting from manufacturing to services. The spatial pattern of economic activity has also changed. The emphasis in the DKI is now increasingly on services, with manufacturing increasingly located in the outer rings (Bekasi, Bogor and Tangerang).10
These economic changes are recasting spatial structure. Data from the Jabodetabek Metropolitan Study conducted by Institut Pertanian Bogor (IPB) illustrates these shifts, which are described in Table A5.3. The built-up area of Jabodetabek in 2005 covered an area almost twice the size that it did 1992, with nearly 28 percent of the land in the region now developed. More than 110 thousand hectares of land was converted from rural land use in the period from 1992 to 2005. The largest conversion took place in the districts of Bogor, Tangerang and Bekasi, three districts where the contribution of manufacturing activities has grown rapidly. It is also likely that a significant proportion of the land conversion in these districts was implemented for the development of residential areas to accommodate the urban spillover from Jakarta, in addition to use for industrial areas and supporting facilities.
TABLE A5.3: BUILT-UP AREA OF CITY/DISTRICT IN JABODETABEK, 1992 AND 2005
City/District Size (ha) Built-up area (ha) % built-up area
1992 2005 1992 2005
DKI Jakarta 65,189 40,602.33 54.405.85 62.28 83.46
Kota Bogor 11,850 2,974.94 6,277.32 25.10 52.97
Kota Depok 20,029 1,985.92 9,766.55 9.91 48.76
Kota Tangerang 21,029 6,699.57 13,738.66 31.86 65.33
Kota Bekasi 21,049 5,538.29 14,717.08 26.31 69.92
Kab. Bogor 298,939 5,934.76 34,215.64 1.98 11.44
Kab. Tangerang 122,000 6,705.73 31,821.26 5.50 26.08
Kab. Bekasi 111,038 3,064.30 22,196.01 2.76 19.99
Jabodetabek 671,143 73,505.84 187,138.37 10.95 27.88
SOURCE: IPB (2007)
Table A5.3 also shows that the three newly created municipalities adjacent to Jakarta (Depok, Tangerang and Bekasi) grew significantly in terms of the size of their built-up areas. In the period from 1992 to 2005, approximately 23 thousand hectares were converted for urban use—a far greater area than in the DKI over the same period. This suggests that urban development in the period from 1992 to 2005 spilled over into adjacent districts (Bogor, Tangerang and Bekasi), where the new development of industrial and residential estates has taken place. This has transformed the economic landscape of the JMR. Recent urban development in districts surrounding Jakarta has been characterized by large-scale subdivisions for real estate development in the outskirts of Jakarta and for industrial estates. As Firman (2007) notes, at least 22 new town projects, each ranging in size between 500 and 6,000 hectares, and eight industrial estates ranging in size between 100 and 540 hectares had been developed by the mid 1990s in Bogor, Tangerang and Bekasi. Although these developments stalled during Asian economic crisis11, some of them were resumed and have been completed in recent years.
10 Manufacturing activity dominates Kab. Bekasi, increasing from 53.40% of all output in 1993 to 80.98% in 2004. Overall, Kab. Bekasi is the second largest economy in JMR after Jakarta, with GRDP of Rp. 38.9 trillion in 2004. In Kab. Bogor manufacturing activity also dominates with 63.23% of its economy devoted to this sector in 2004, up from 38.40% in 1993. Finally, in Kabupaten Tangerang manufacturing industry contributes 55.54% to its economy in 2004, an increase from 27.65% in 1993. 11 By the end 1996 about 90,000 hectares of land in and around Jakarta was estimated to have been acquired for development, but only 13,000 hectares that had been developed by the time of crisis (Kompas, October 21, 1996 in Dick and Rimmer, 2003).
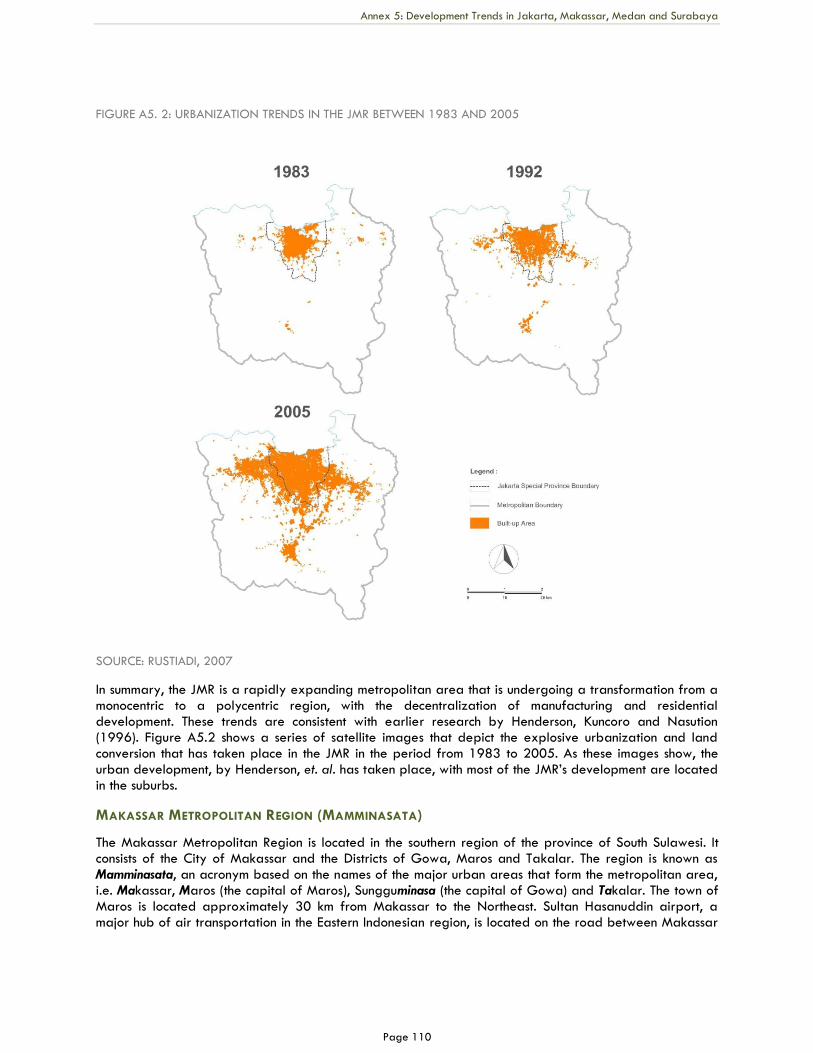
Annex 5: Development Trends in Jakarta, Makassar, Medan and Surabaya
Page 110
FIGURE A5. 2: URBANIZATION TRENDS IN THE JMR BETWEEN 1983 AND 2005
SOURCE: RUSTIADI, 2007
In summary, the JMR is a rapidly expanding metropolitan area that is undergoing a transformation from a monocentric to a polycentric region, with the decentralization of manufacturing and residential development. These trends are consistent with earlier research by Henderson, Kuncoro and Nasution (1996). Figure A5.2 shows a series of satellite images that depict the explosive urbanization and land conversion that has taken place in the JMR in the period from 1983 to 2005. As these images show, the urban development, by Henderson, et. al. has taken place, with most of the JMR‘s development are located in the suburbs.
MAKASSAR METROPOLITAN REGION (MAMMINASATA)
The Makassar Metropolitan Region is located in the southern region of the province of South Sulawesi. It consists of the City of Makassar and the Districts of Gowa, Maros and Takalar. The region is known as Mamminasata, an acronym based on the names of the major urban areas that form the metropolitan area, i.e. Makassar, Maros (the capital of Maros), Sungguminasa (the capital of Gowa) and Takalar. The town of Maros is located approximately 30 km from Makassar to the Northeast. Sultan Hasanuddin airport, a major hub of air transportation in the Eastern Indonesian region, is located on the road between Makassar
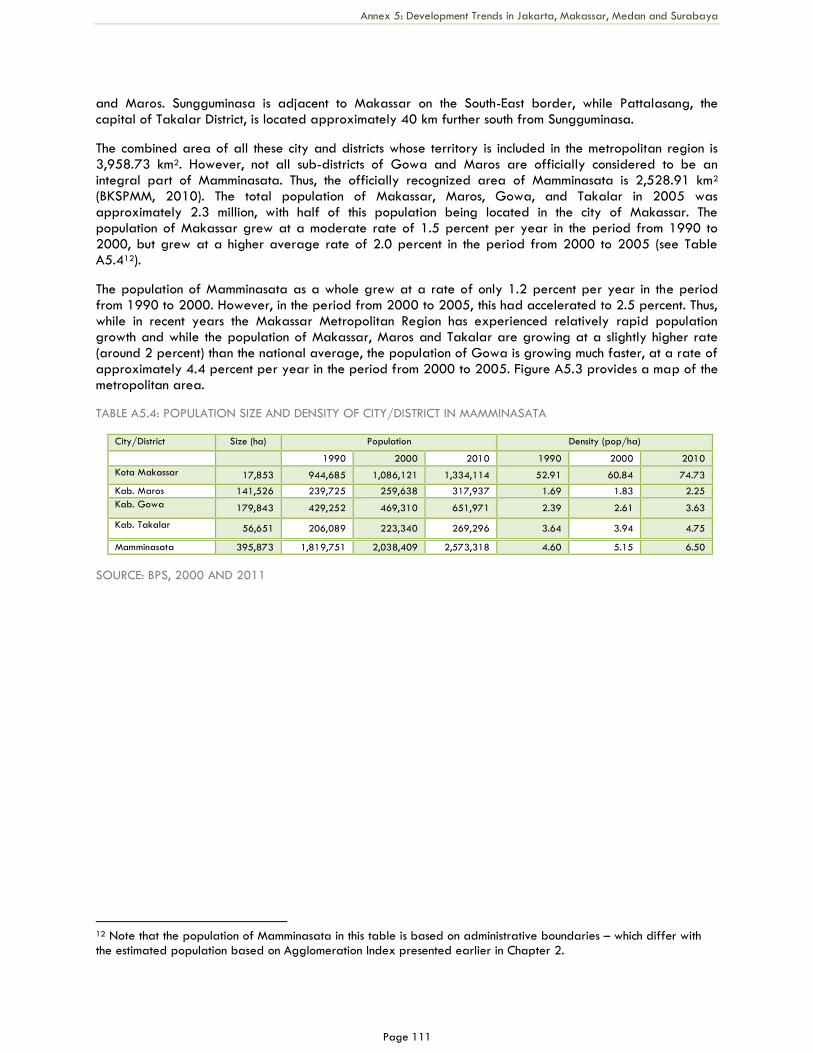
Annex 5: Development Trends in Jakarta, Makassar, Medan and Surabaya
Page 111
and Maros. Sungguminasa is adjacent to Makassar on the South-East border, while Pattalasang, the capital of Takalar District, is located approximately 40 km further south from Sungguminasa.
The combined area of all these city and districts whose territory is included in the metropolitan region is 3,958.73 km2. However, not all sub-districts of Gowa and Maros are officially considered to be an integral part of Mamminasata. Thus, the officially recognized area of Mamminasata is 2,528.91 km2 (BKSPMM, 2010). The total population of Makassar, Maros, Gowa, and Takalar in 2005 was approximately 2.3 million, with half of this population being located in the city of Makassar. The population of Makassar grew at a moderate rate of 1.5 percent per year in the period from 1990 to 2000, but grew at a higher average rate of 2.0 percent in the period from 2000 to 2005 (see Table A5.412).
The population of Mamminasata as a whole grew at a rate of only 1.2 percent per year in the period from 1990 to 2000. However, in the period from 2000 to 2005, this had accelerated to 2.5 percent. Thus, while in recent years the Makassar Metropolitan Region has experienced relatively rapid population growth and while the population of Makassar, Maros and Takalar are growing at a slightly higher rate (around 2 percent) than the national average, the population of Gowa is growing much faster, at a rate of approximately 4.4 percent per year in the period from 2000 to 2005. Figure A5.3 provides a map of the metropolitan area.
TABLE A5.4: POPULATION SIZE AND DENSITY OF CITY/DISTRICT IN MAMMINASATA
City/District Size (ha) Population Density (pop/ha)
1990 2000 2010 1990 2000 2010
Kota Makassar 17,853 944,685 1,086,121 1,334,114 52.91 60.84 74.73
Kab. Maros 141,526 239,725 259,638 317,937 1.69 1.83 2.25
Kab. Gowa 179,843 429,252 469,310 651,971 2.39 2.61 3.63
Kab. Takalar 56,651 206,089 223,340 269,296 3.64 3.94 4.75
Mamminasata 395,873 1,819,751 2,038,409 2,573,318 4.60 5.15 6.50
SOURCE: BPS, 2000 AND 2011
12 Note that the population of Mamminasata in this table is based on administrative boundaries – which differ with the estimated population based on Agglomeration Index presented earlier in Chapter 2.
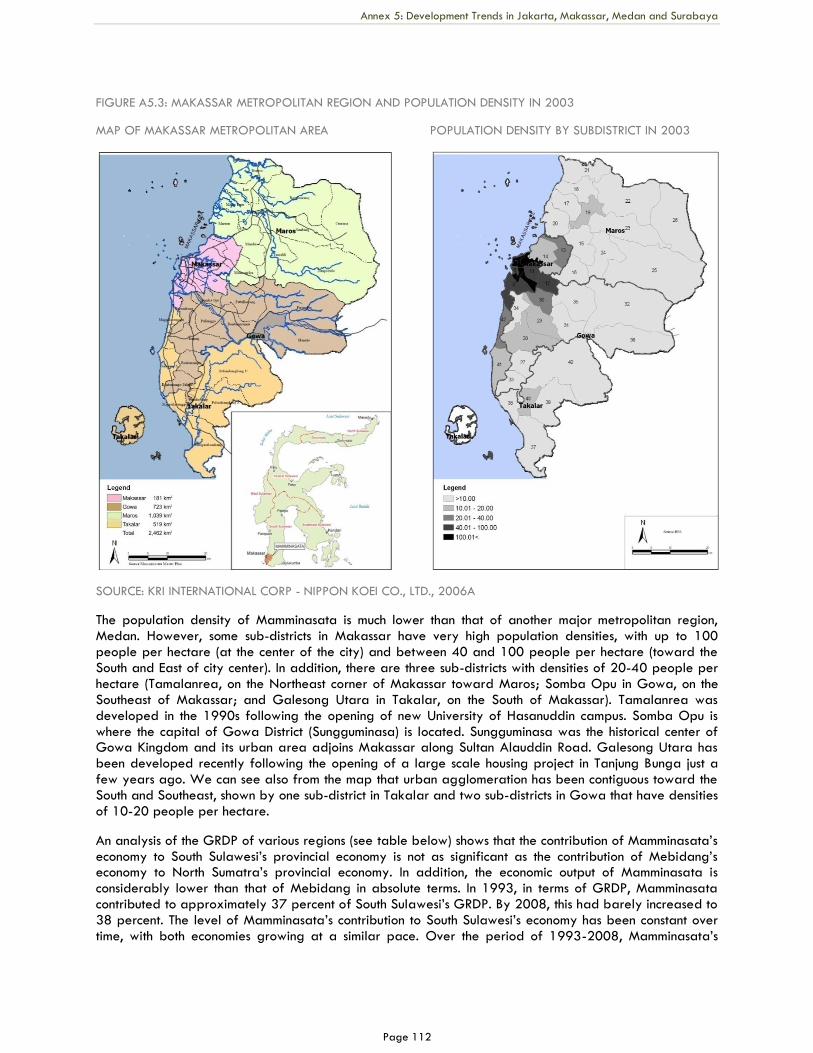
Annex 5: Development Trends in Jakarta, Makassar, Medan and Surabaya
Page 112
FIGURE A5.3: MAKASSAR METROPOLITAN REGION AND POPULATION DENSITY IN 2003
MAP OF MAKASSAR METROPOLITAN AREA POPULATION DENSITY BY SUBDISTRICT IN 2003
SOURCE: KRI INTERNATIONAL CORP - NIPPON KOEI CO., LTD., 2006A
The population density of Mamminasata is much lower than that of another major metropolitan region, Medan. However, some sub-districts in Makassar have very high population densities, with up to 100 people per hectare (at the center of the city) and between 40 and 100 people per hectare (toward the South and East of city center). In addition, there are three sub-districts with densities of 20-40 people per hectare (Tamalanrea, on the Northeast corner of Makassar toward Maros; Somba Opu in Gowa, on the Southeast of Makassar; and Galesong Utara in Takalar, on the South of Makassar). Tamalanrea was developed in the 1990s following the opening of new University of Hasanuddin campus. Somba Opu is where the capital of Gowa District (Sungguminasa) is located. Sungguminasa was the historical center of Gowa Kingdom and its urban area adjoins Makassar along Sultan Alauddin Road. Galesong Utara has been developed recently following the opening of a large scale housing project in Tanjung Bunga just a few years ago. We can see also from the map that urban agglomeration has been contiguous toward the South and Southeast, shown by one sub-district in Takalar and two sub-districts in Gowa that have densities of 10-20 people per hectare.
An analysis of the GRDP of various regions (see table below) shows that the contribution of Mamminasata‘s economy to South Sulawesi‘s provincial economy is not as significant as the contribution of Mebidang‘s economy to North Sumatra‘s provincial economy. In addition, the economic output of Mamminasata is considerably lower than that of Mebidang in absolute terms. In 1993, in terms of GRDP, Mamminasata contributed to approximately 37 percent of South Sulawesi‘s GRDP. By 2008, this had barely increased to 38 percent. The level of Mamminasata‘s contribution to South Sulawesi‘s economy has been constant over time, with both economies growing at a similar pace. Over the period of 1993-2008, Mamminasata‘s
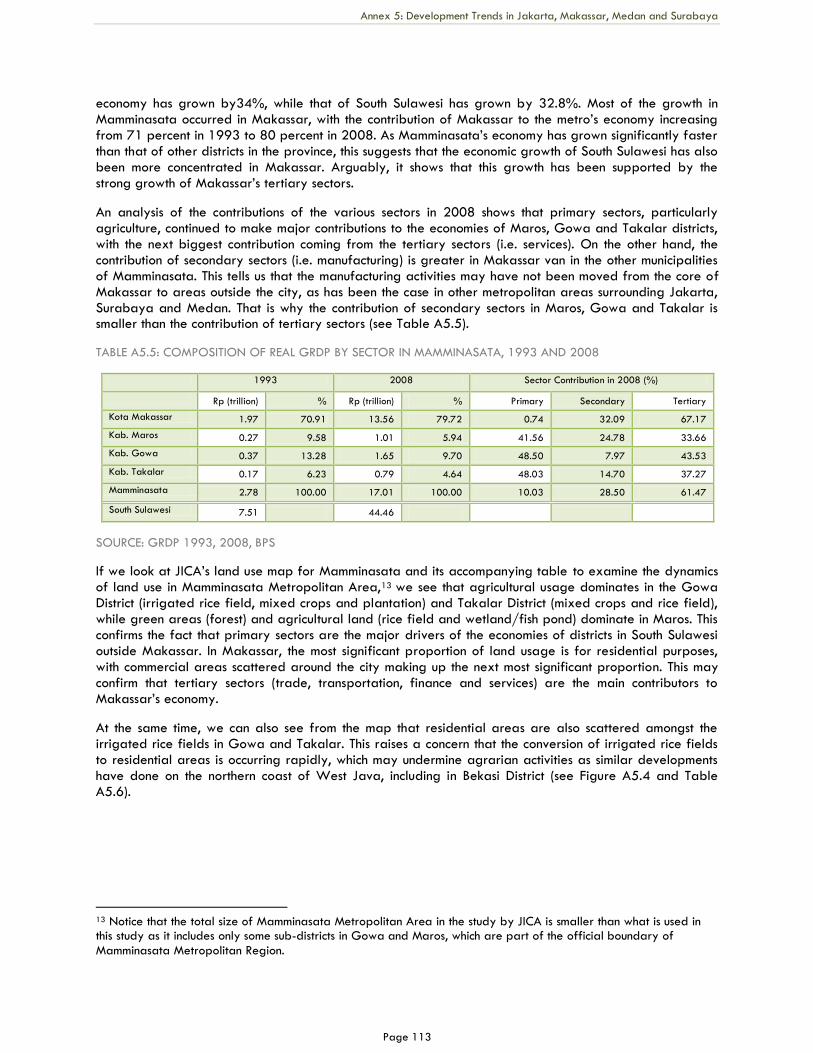
Annex 5: Development Trends in Jakarta, Makassar, Medan and Surabaya
Page 113
economy has grown by34%, while that of South Sulawesi has grown by 32.8%. Most of the growth in Mamminasata occurred in Makassar, with the contribution of Makassar to the metro‘s economy increasing from 71 percent in 1993 to 80 percent in 2008. As Mamminasata‘s economy has grown significantly faster than that of other districts in the province, this suggests that the economic growth of South Sulawesi has also been more concentrated in Makassar. Arguably, it shows that this growth has been supported by the strong growth of Makassar‘s tertiary sectors.
An analysis of the contributions of the various sectors in 2008 shows that primary sectors, particularly agriculture, continued to make major contributions to the economies of Maros, Gowa and Takalar districts, with the next biggest contribution coming from the tertiary sectors (i.e. services). On the other hand, the contribution of secondary sectors (i.e. manufacturing) is greater in Makassar van in the other municipalities of Mamminasata. This tells us that the manufacturing activities may have not been moved from the core of Makassar to areas outside the city, as has been the case in other metropolitan areas surrounding Jakarta, Surabaya and Medan. That is why the contribution of secondary sectors in Maros, Gowa and Takalar is smaller than the contribution of tertiary sectors (see Table A5.5).
TABLE A5.5: COMPOSITION OF REAL GRDP BY SECTOR IN MAMMINASATA, 1993 AND 2008
1993 2008 Sector Contribution in 2008 (%)
Rp (trillion) % Rp (trillion) % Primary Secondary Tertiary
Kota Makassar 1.97 70.91 13.56 79.72 0.74 32.09 67.17
Kab. Maros 0.27 9.58 1.01 5.94 41.56 24.78 33.66
Kab. Gowa 0.37 13.28 1.65 9.70 48.50 7.97 43.53
Kab. Takalar 0.17 6.23 0.79 4.64 48.03 14.70 37.27
Mamminasata 2.78 100.00 17.01 100.00 10.03 28.50 61.47
South Sulawesi 7.51 44.46
SOURCE: GRDP 1993, 2008, BPS
If we look at JICA‘s land use map for Mamminasata and its accompanying table to examine the dynamics of land use in Mamminasata Metropolitan Area,13 we see that agricultural usage dominates in the Gowa District (irrigated rice field, mixed crops and plantation) and Takalar District (mixed crops and rice field), while green areas (forest) and agricultural land (rice field and wetland/fish pond) dominate in Maros. This confirms the fact that primary sectors are the major drivers of the economies of districts in South Sulawesi outside Makassar. In Makassar, the most significant proportion of land usage is for residential purposes, with commercial areas scattered around the city making up the next most significant proportion. This may confirm that tertiary sectors (trade, transportation, finance and services) are the main contributors to Makassar‘s economy.
At the same time, we can also see from the map that residential areas are also scattered amongst the irrigated rice fields in Gowa and Takalar. This raises a concern that the conversion of irrigated rice fields to residential areas is occurring rapidly, which may undermine agrarian activities as similar developments have done on the northern coast of West Java, including in Bekasi District (see Figure A5.4 and Table A5.6).
13 Notice that the total size of Mamminasata Metropolitan Area in the study by JICA is smaller than what is used in this study as it includes only some sub-districts in Gowa and Maros, which are part of the official boundary of Mamminasata Metropolitan Region.
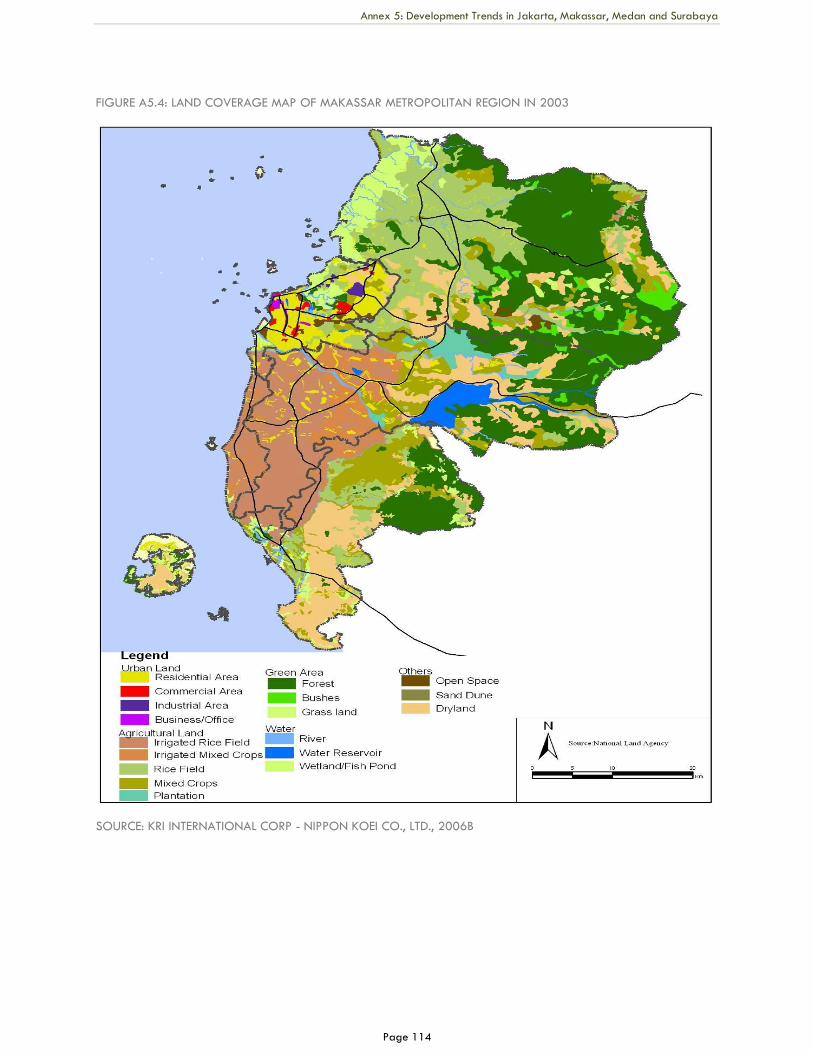
Annex 5: Development Trends in Jakarta, Makassar, Medan and Surabaya
Page 114
FIGURE A5.4: LAND COVERAGE MAP OF MAKASSAR METROPOLITAN REGION IN 2003
SOURCE: KRI INTERNATIONAL CORP - NIPPON KOEI CO., LTD., 2006B
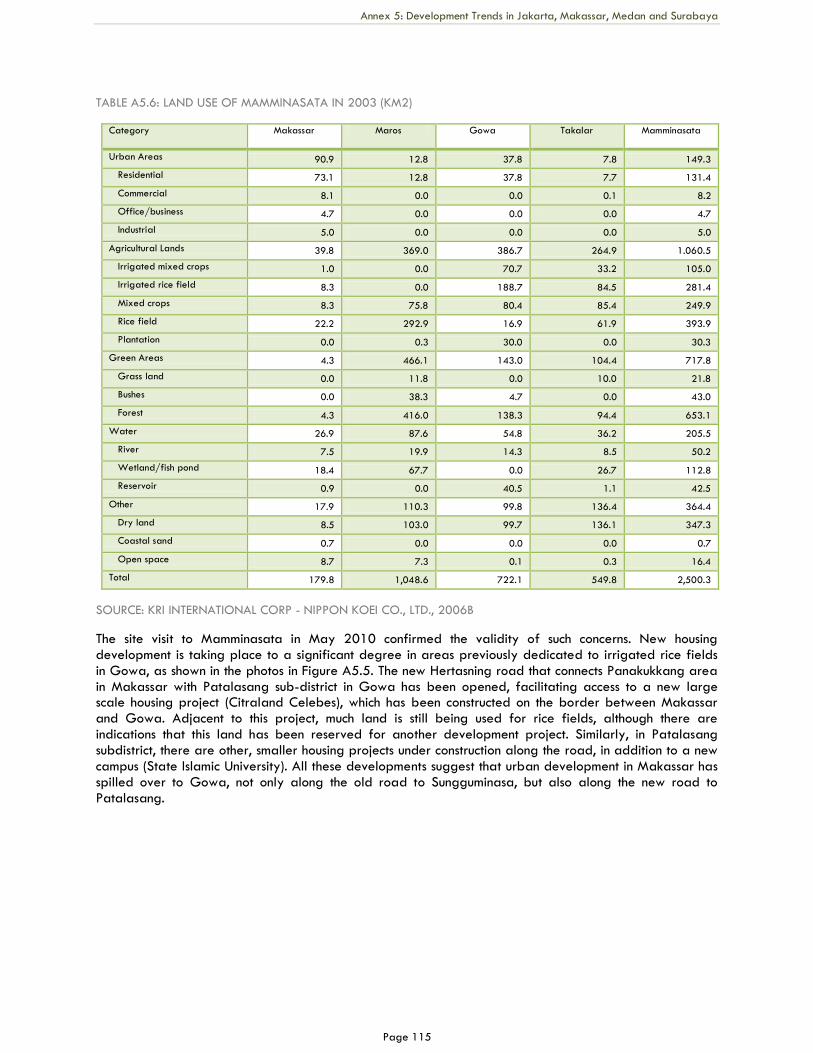
Annex 5: Development Trends in Jakarta, Makassar, Medan and Surabaya
Page 115
TABLE A5.6: LAND USE OF MAMMINASATA IN 2003 (KM2)
Category Makassar Maros Gowa Takalar Mamminasata
Urban Areas 90.9 12.8 37.8 7.8 149.3
Residential 73.1 12.8 37.8 7.7 131.4
Commercial 8.1 0.0 0.0 0.1 8.2
Office/business 4.7 0.0 0.0 0.0 4.7
Industrial 5.0 0.0 0.0 0.0 5.0
Agricultural Lands 39.8 369.0 386.7 264.9 1.060.5
Irrigated mixed crops 1.0 0.0 70.7 33.2 105.0
Irrigated rice field 8.3 0.0 188.7 84.5 281.4
Mixed crops 8.3 75.8 80.4 85.4 249.9
Rice field 22.2 292.9 16.9 61.9 393.9
Plantation 0.0 0.3 30.0 0.0 30.3
Green Areas 4.3 466.1 143.0 104.4 717.8
Grass land 0.0 11.8 0.0 10.0 21.8
Bushes 0.0 38.3 4.7 0.0 43.0
Forest 4.3 416.0 138.3 94.4 653.1
Water 26.9 87.6 54.8 36.2 205.5
River 7.5 19.9 14.3 8.5 50.2
Wetland/fish pond 18.4 67.7 0.0 26.7 112.8
Reservoir 0.9 0.0 40.5 1.1 42.5
Other 17.9 110.3 99.8 136.4 364.4
Dry land 8.5 103.0 99.7 136.1 347.3
Coastal sand 0.7 0.0 0.0 0.0 0.7
Open space 8.7 7.3 0.1 0.3 16.4
Total 179.8 1,048.6 722.1 549.8 2,500.3
SOURCE: KRI INTERNATIONAL CORP - NIPPON KOEI CO., LTD., 2006B
The site visit to Mamminasata in May 2010 confirmed the validity of such concerns. New housing development is taking place to a significant degree in areas previously dedicated to irrigated rice fields in Gowa, as shown in the photos in Figure A5.5. The new Hertasning road that connects Panakukkang area in Makassar with Patalasang sub-district in Gowa has been opened, facilitating access to a new large scale housing project (Citraland Celebes), which has been constructed on the border between Makassar and Gowa. Adjacent to this project, much land is still being used for rice fields, although there are indications that this land has been reserved for another development project. Similarly, in Patalasang subdistrict, there are other, smaller housing projects under construction along the road, in addition to a new campus (State Islamic University). All these developments suggest that urban development in Makassar has spilled over to Gowa, not only along the old road to Sungguminasa, but also along the new road to Patalasang.
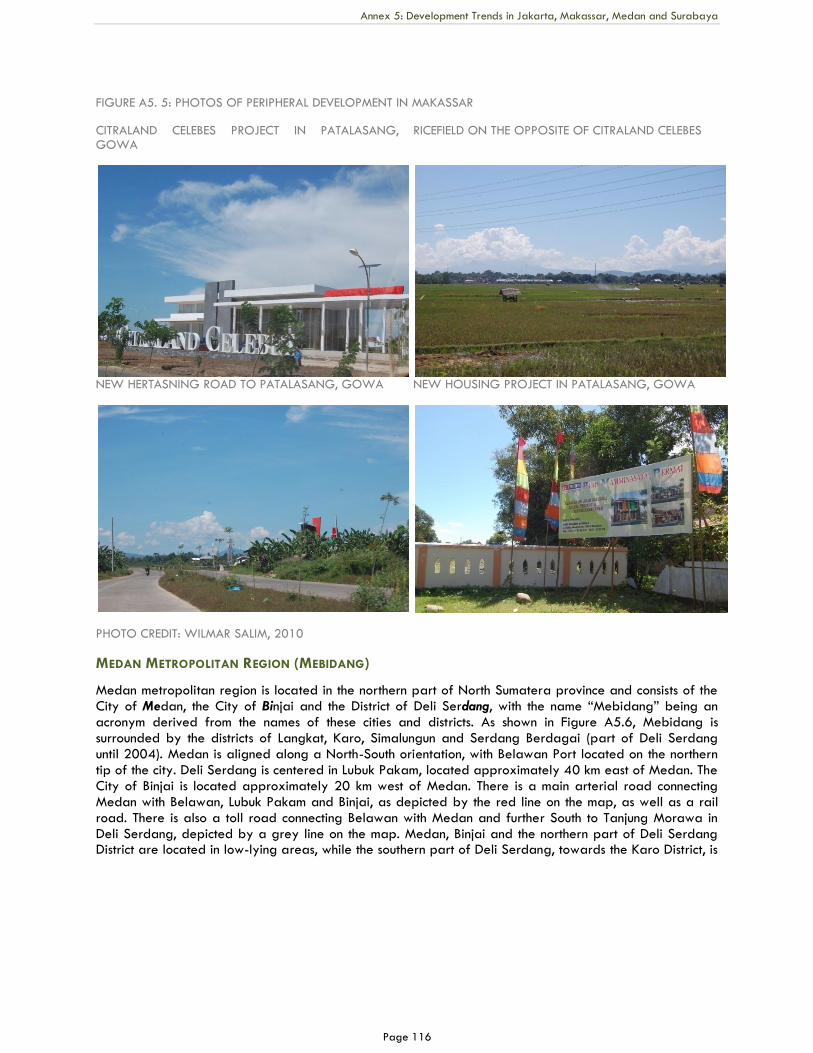
Annex 5: Development Trends in Jakarta, Makassar, Medan and Surabaya
Page 116
FIGURE A5. 5: PHOTOS OF PERIPHERAL DEVELOPMENT IN MAKASSAR
CITRALAND CELEBES PROJECT IN PATALASANG, GOWA
RICEFIELD ON THE OPPOSITE OF CITRALAND CELEBES
NEW HERTASNING ROAD TO PATALASANG, GOWA NEW HOUSING PROJECT IN PATALASANG, GOWA
PHOTO CREDIT: WILMAR SALIM, 2010
MEDAN METROPOLITAN REGION (MEBIDANG)
Medan metropolitan region is located in the northern part of North Sumatera province and consists of the City of Medan, the City of Binjai and the District of Deli Serdang, with the name ―Mebidang‖ being an acronym derived from the names of these cities and districts. As shown in Figure A5.6, Mebidang is surrounded by the districts of Langkat, Karo, Simalungun and Serdang Berdagai (part of Deli Serdang until 2004). Medan is aligned along a North-South orientation, with Belawan Port located on the northern tip of the city. Deli Serdang is centered in Lubuk Pakam, located approximately 40 km east of Medan. The City of Binjai is located approximately 20 km west of Medan. There is a main arterial road connecting Medan with Belawan, Lubuk Pakam and Binjai, as depicted by the red line on the map, as well as a rail road. There is also a toll road connecting Belawan with Medan and further South to Tanjung Morawa in Deli Serdang, depicted by a grey line on the map. Medan, Binjai and the northern part of Deli Serdang District are located in low-lying areas, while the southern part of Deli Serdang, towards the Karo District, is
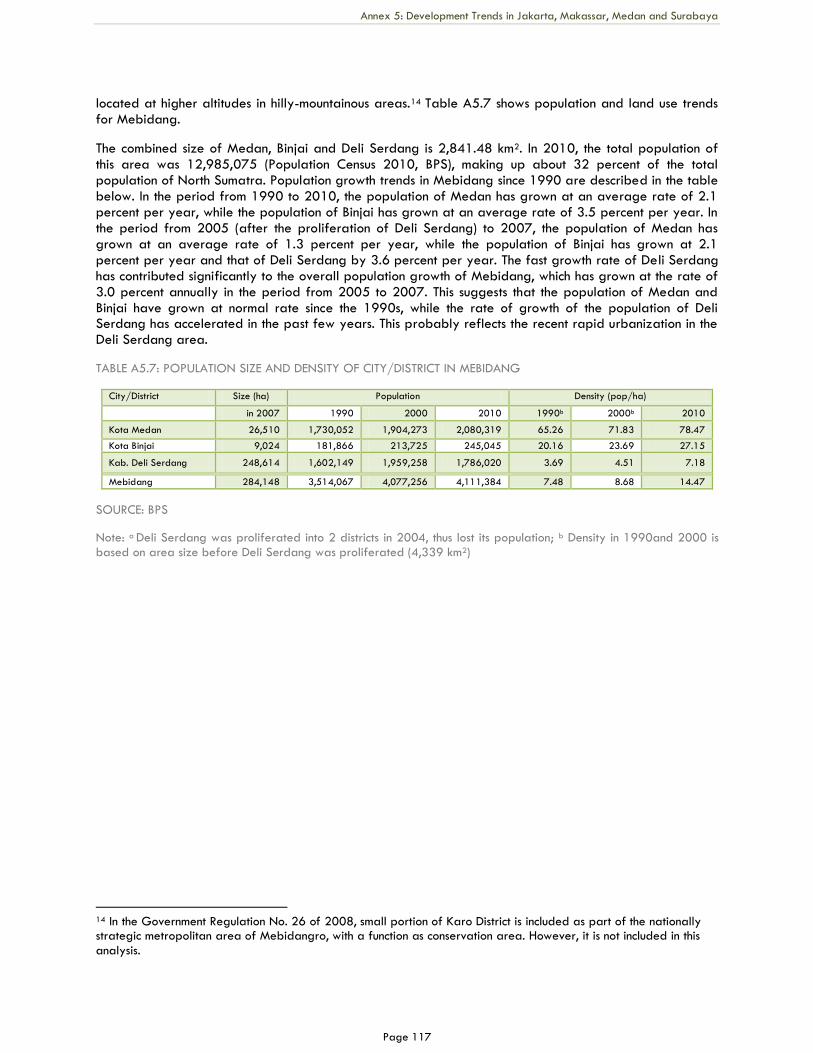
Annex 5: Development Trends in Jakarta, Makassar, Medan and Surabaya
Page 117
located at higher altitudes in hilly-mountainous areas.14 Table A5.7 shows population and land use trends for Mebidang.
The combined size of Medan, Binjai and Deli Serdang is 2,841.48 km2. In 2010, the total population of this area was 12,985,075 (Population Census 2010, BPS), making up about 32 percent of the total population of North Sumatra. Population growth trends in Mebidang since 1990 are described in the table below. In the period from 1990 to 2010, the population of Medan has grown at an average rate of 2.1 percent per year, while the population of Binjai has grown at an average rate of 3.5 percent per year. In the period from 2005 (after the proliferation of Deli Serdang) to 2007, the population of Medan has grown at an average rate of 1.3 percent per year, while the population of Binjai has grown at 2.1 percent per year and that of Deli Serdang by 3.6 percent per year. The fast growth rate of Deli Serdang has contributed significantly to the overall population growth of Mebidang, which has grown at the rate of 3.0 percent annually in the period from 2005 to 2007. This suggests that the population of Medan and Binjai have grown at normal rate since the 1990s, while the rate of growth of the population of Deli Serdang has accelerated in the past few years. This probably reflects the recent rapid urbanization in the Deli Serdang area.
TABLE A5.7: POPULATION SIZE AND DENSITY OF CITY/DISTRICT IN MEBIDANG
City/District Size (ha) Population Density (pop/ha)
in 2007 1990 2000 2010 1990b 2000b 2010
Kota Medan 26,510 1,730,052 1,904,273 2,080,319 65.26 71.83 78.47
Kota Binjai 9,024 181,866 213,725 245,045 20.16 23.69 27.15
Kab. Deli Serdang 248,614 1,602,149 1,959,258 1,786,020 3.69 4.51 7.18
Mebidang 284,148 3,514,067 4,077,256 4,111,384 7.48 8.68 14.47
SOURCE: BPS
Note: a Deli Serdang was proliferated into 2 districts in 2004, thus lost its population; b Density in 1990and 2000 is based on area size before Deli Serdang was proliferated (4,339 km2)
14 In the Government Regulation No. 26 of 2008, small portion of Karo District is included as part of the nationally strategic metropolitan area of Mebidangro, with a function as conservation area. However, it is not included in this analysis.
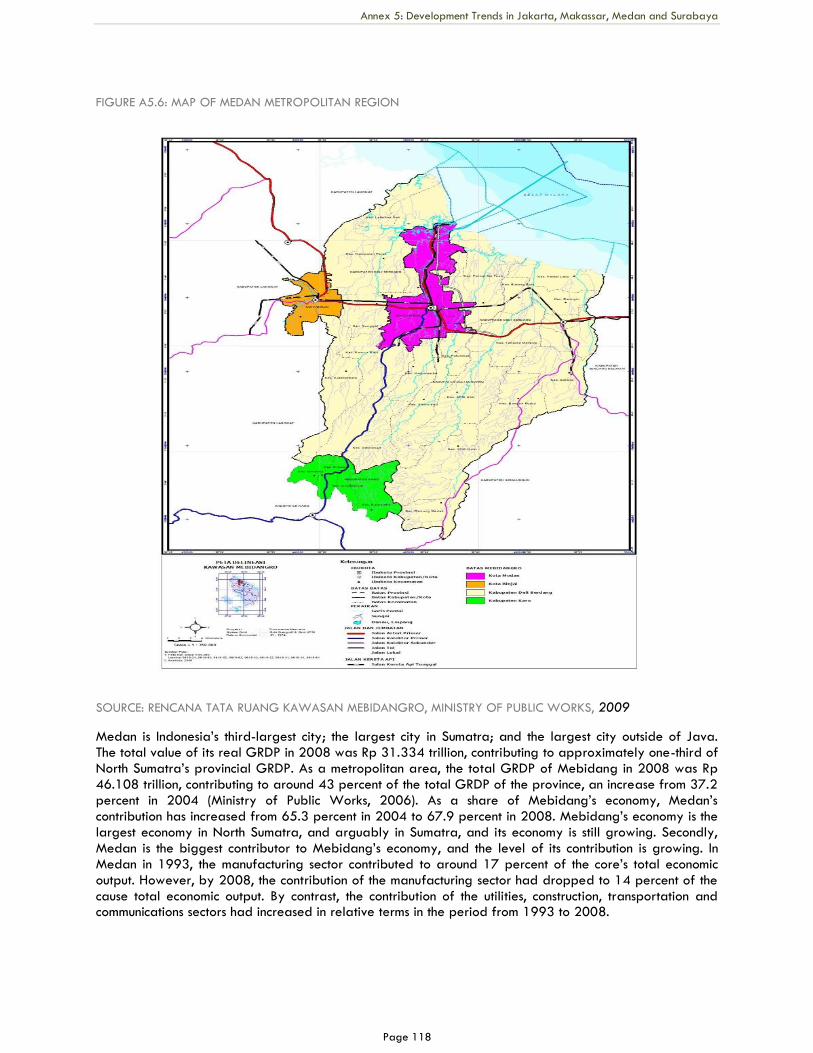
Annex 5: Development Trends in Jakarta, Makassar, Medan and Surabaya
Page 118
FIGURE A5.6: MAP OF MEDAN METROPOLITAN REGION
SOURCE: RENCANA TATA RUANG KAWASAN MEBIDANGRO, MINISTRY OF PUBLIC WORKS, 2009
Medan is Indonesia‘s third-largest city; the largest city in Sumatra; and the largest city outside of Java. The total value of its real GRDP in 2008 was Rp 31.334 trillion, contributing to approximately one-third of North Sumatra‘s provincial GRDP. As a metropolitan area, the total GRDP of Mebidang in 2008 was Rp 46.108 trillion, contributing to around 43 percent of the total GRDP of the province, an increase from 37.2 percent in 2004 (Ministry of Public Works, 2006). As a share of Mebidang‘s economy, Medan‘s contribution has increased from 65.3 percent in 2004 to 67.9 percent in 2008. Mebidang‘s economy is the largest economy in North Sumatra, and arguably in Sumatra, and its economy is still growing. Secondly, Medan is the biggest contributor to Mebidang‘s economy, and the level of its contribution is growing. In Medan in 1993, the manufacturing sector contributed to around 17 percent of the core‘s total economic output. However, by 2008, the contribution of the manufacturing sector had dropped to 14 percent of the cause total economic output. By contrast, the contribution of the utilities, construction, transportation and communications sectors had increased in relative terms in the period from 1993 to 2008.
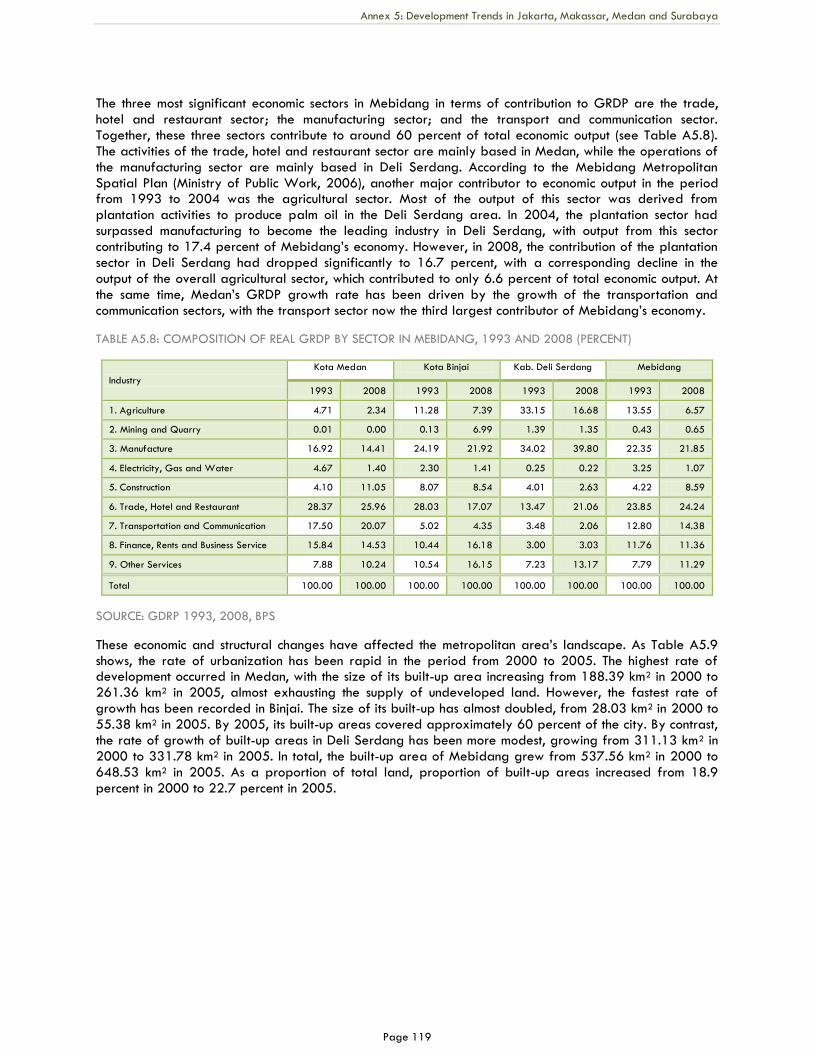
Annex 5: Development Trends in Jakarta, Makassar, Medan and Surabaya
Page 119
The three most significant economic sectors in Mebidang in terms of contribution to GRDP are the trade, hotel and restaurant sector; the manufacturing sector; and the transport and communication sector. Together, these three sectors contribute to around 60 percent of total economic output (see Table A5.8). The activities of the trade, hotel and restaurant sector are mainly based in Medan, while the operations of the manufacturing sector are mainly based in Deli Serdang. According to the Mebidang Metropolitan Spatial Plan (Ministry of Public Work, 2006), another major contributor to economic output in the period from 1993 to 2004 was the agricultural sector. Most of the output of this sector was derived from plantation activities to produce palm oil in the Deli Serdang area. In 2004, the plantation sector had surpassed manufacturing to become the leading industry in Deli Serdang, with output from this sector contributing to 17.4 percent of Mebidang‘s economy. However, in 2008, the contribution of the plantation sector in Deli Serdang had dropped significantly to 16.7 percent, with a corresponding decline in the output of the overall agricultural sector, which contributed to only 6.6 percent of total economic output. At the same time, Medan‘s GRDP growth rate has been driven by the growth of the transportation and communication sectors, with the transport sector now the third largest contributor of Mebidang‘s economy.
TABLE A5.8: COMPOSITION OF REAL GRDP BY SECTOR IN MEBIDANG, 1993 AND 2008 (PERCENT)
Industry
Kota Medan Kota Binjai Kab. Deli Serdang Mebidang
1993 2008 1993 2008 1993 2008 1993 2008
1. Agriculture 4.71 2.34 11.28 7.39 33.15 16.68 13.55 6.57
2. Mining and Quarry 0.01 0.00 0.13 6.99 1.39 1.35 0.43 0.65
3. Manufacture 16.92 14.41 24.19 21.92 34.02 39.80 22.35 21.85
4. Electricity, Gas and Water 4.67 1.40 2.30 1.41 0.25 0.22 3.25 1.07
5. Construction 4.10 11.05 8.07 8.54 4.01 2.63 4.22 8.59
6. Trade, Hotel and Restaurant 28.37 25.96 28.03 17.07 13.47 21.06 23.85 24.24
7. Transportation and Communication 17.50 20.07 5.02 4.35 3.48 2.06 12.80 14.38
8. Finance, Rents and Business Service 15.84 14.53 10.44 16.18 3.00 3.03 11.76 11.36
9. Other Services 7.88 10.24 10.54 16.15 7.23 13.17 7.79 11.29
Total 100.00 100.00 100.00 100.00 100.00 100.00 100.00 100.00
SOURCE: GDRP 1993, 2008, BPS
These economic and structural changes have affected the metropolitan area‘s landscape. As Table A5.9 shows, the rate of urbanization has been rapid in the period from 2000 to 2005. The highest rate of development occurred in Medan, with the size of its built-up area increasing from 188.39 km2 in 2000 to 261.36 km2 in 2005, almost exhausting the supply of undeveloped land. However, the fastest rate of growth has been recorded in Binjai. The size of its built-up has almost doubled, from 28.03 km2 in 2000 to 55.38 km2 in 2005. By 2005, its built-up areas covered approximately 60 percent of the city. By contrast, the rate of growth of built-up areas in Deli Serdang has been more modest, growing from 311.13 km2 in 2000 to 331.78 km2 in 2005. In total, the built-up area of Mebidang grew from 537.56 km2 in 2000 to 648.53 km2 in 2005. As a proportion of total land, proportion of built-up areas increased from 18.9 percent in 2000 to 22.7 percent in 2005.
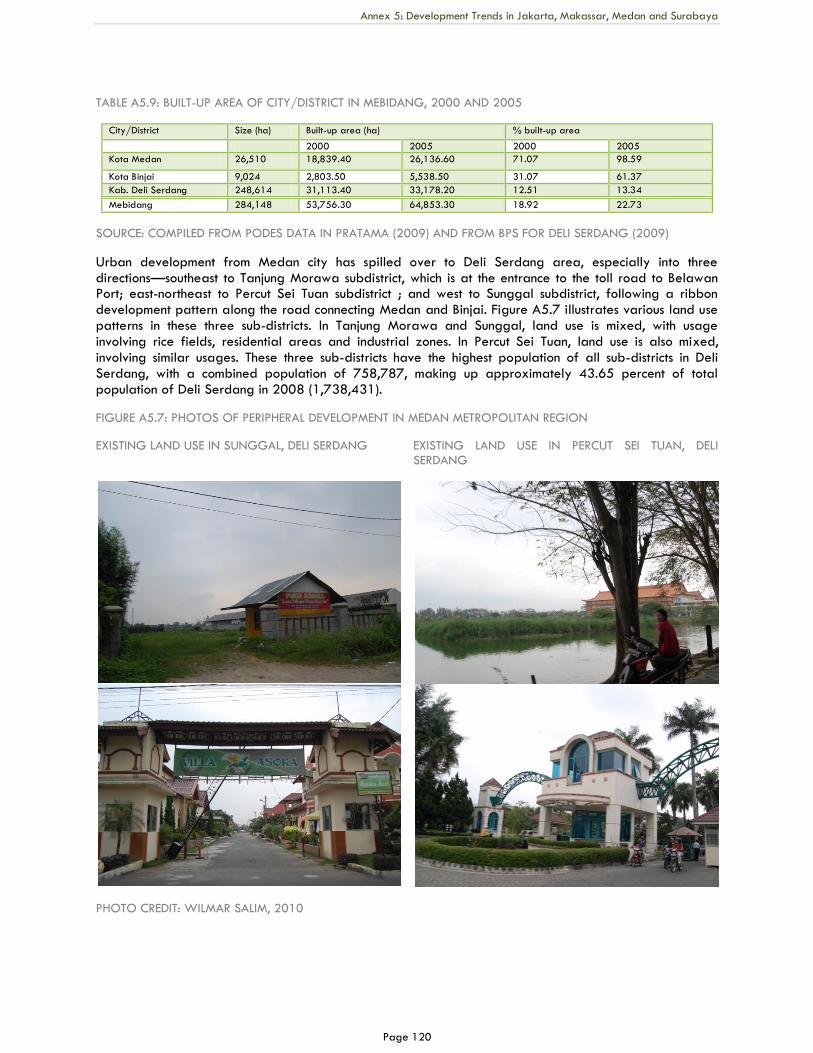
Annex 5: Development Trends in Jakarta, Makassar, Medan and Surabaya
Page 120
TABLE A5.9: BUILT-UP AREA OF CITY/DISTRICT IN MEBIDANG, 2000 AND 2005
City/District Size (ha) Built-up area (ha) % built-up area
2000 2005 2000 2005
Kota Medan 26,510 18,839.40 26,136.60 71.07 98.59
Kota Binjai 9,024 2,803.50 5,538.50 31.07 61.37
Kab. Deli Serdang 248,614 31,113.40 33,178.20 12.51 13.34
Mebidang 284,148 53,756.30 64,853.30 18.92 22.73
SOURCE: COMPILED FROM PODES DATA IN PRATAMA (2009) AND FROM BPS FOR DELI SERDANG (2009)
Urban development from Medan city has spilled over to Deli Serdang area, especially into three directions—southeast to Tanjung Morawa subdistrict, which is at the entrance to the toll road to Belawan Port; east-northeast to Percut Sei Tuan subdistrict ; and west to Sunggal subdistrict, following a ribbon development pattern along the road connecting Medan and Binjai. Figure A5.7 illustrates various land use patterns in these three sub-districts. In Tanjung Morawa and Sunggal, land use is mixed, with usage involving rice fields, residential areas and industrial zones. In Percut Sei Tuan, land use is also mixed, involving similar usages. These three sub-districts have the highest population of all sub-districts in Deli Serdang, with a combined population of 758,787, making up approximately 43.65 percent of total population of Deli Serdang in 2008 (1,738,431).
FIGURE A5.7: PHOTOS OF PERIPHERAL DEVELOPMENT IN MEDAN METROPOLITAN REGION
EXISTING LAND USE IN SUNGGAL, DELI SERDANG EXISTING LAND USE IN PERCUT SEI TUAN, DELI SERDANG
PHOTO CREDIT: WILMAR SALIM, 2010
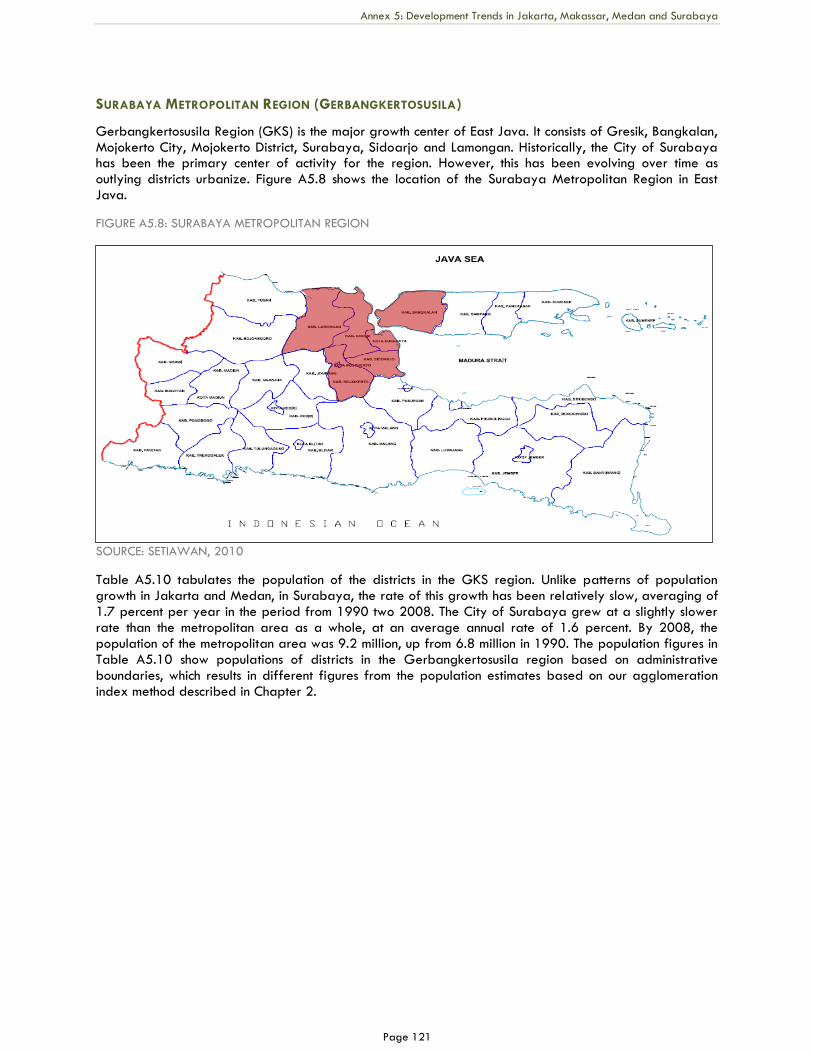
Annex 5: Development Trends in Jakarta, Makassar, Medan and Surabaya
Page 121
SURABAYA METROPOLITAN REGION (GERBANGKERTOSUSILA)
Gerbangkertosusila Region (GKS) is the major growth center of East Java. It consists of Gresik, Bangkalan, Mojokerto City, Mojokerto District, Surabaya, Sidoarjo and Lamongan. Historically, the City of Surabaya has been the primary center of activity for the region. However, this has been evolving over time as outlying districts urbanize. Figure A5.8 shows the location of the Surabaya Metropolitan Region in East Java.
FIGURE A5.8: SURABAYA METROPOLITAN REGION
SOURCE: SETIAWAN, 2010
Table A5.10 tabulates the population of the districts in the GKS region. Unlike patterns of population growth in Jakarta and Medan, in Surabaya, the rate of this growth has been relatively slow, averaging of 1.7 percent per year in the period from 1990 two 2008. The City of Surabaya grew at a slightly slower rate than the metropolitan area as a whole, at an average annual rate of 1.6 percent. By 2008, the population of the metropolitan area was 9.2 million, up from 6.8 million in 1990. The population figures in Table A5.10 show populations of districts in the Gerbangkertosusila region based on administrative boundaries, which results in different figures from the population estimates based on our agglomeration index method described in Chapter 2.
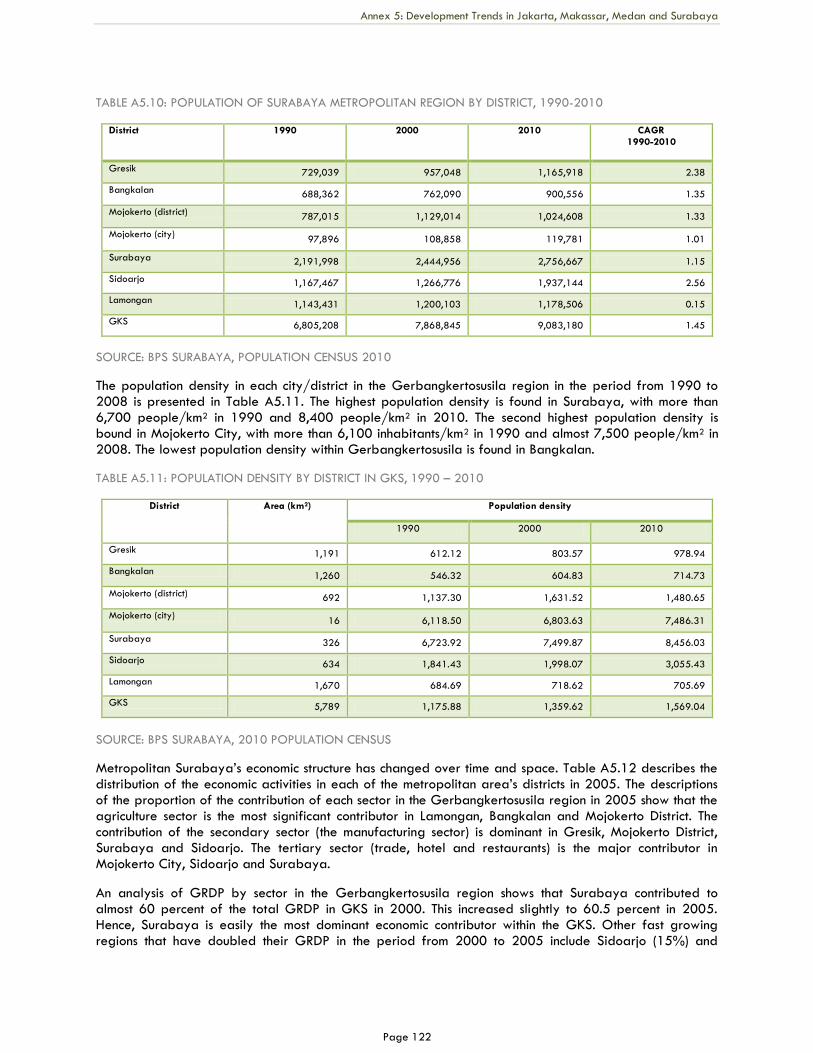
Annex 5: Development Trends in Jakarta, Makassar, Medan and Surabaya
Page 122
TABLE A5.10: POPULATION OF SURABAYA METROPOLITAN REGION BY DISTRICT, 1990-2010
District 1990 2000 2010 CAGR 1990-2010
Gresik 729,039 957,048 1,165,918 2.38
Bangkalan 688,362 762,090 900,556 1.35
Mojokerto (district) 787,015 1,129,014 1,024,608 1.33
Mojokerto (city) 97,896 108,858 119,781 1.01
Surabaya 2,191,998 2,444,956 2,756,667 1.15
Sidoarjo 1,167,467 1,266,776 1,937,144 2.56
Lamongan 1,143,431 1,200,103 1,178,506 0.15
GKS 6,805,208 7,868,845 9,083,180 1.45
SOURCE: BPS SURABAYA, POPULATION CENSUS 2010
The population density in each city/district in the Gerbangkertosusila region in the period from 1990 to 2008 is presented in Table A5.11. The highest population density is found in Surabaya, with more than 6,700 people/km2 in 1990 and 8,400 people/km2 in 2010. The second highest population density is bound in Mojokerto City, with more than 6,100 inhabitants/km2 in 1990 and almost 7,500 people/km2 in 2008. The lowest population density within Gerbangkertosusila is found in Bangkalan.
TABLE A5.11: POPULATION DENSITY BY DISTRICT IN GKS, 1990 – 2010
District Area (km2) Population density
1990 2000 2010
Gresik 1,191 612.12 803.57 978.94
Bangkalan 1,260 546.32 604.83 714.73
Mojokerto (district) 692 1,137.30 1,631.52 1,480.65
Mojokerto (city) 16 6,118.50 6,803.63 7,486.31
Surabaya 326 6,723.92 7,499.87 8,456.03
Sidoarjo 634 1,841.43 1,998.07 3,055.43
Lamongan 1,670 684.69 718.62 705.69
GKS 5,789 1,175.88 1,359.62 1,569.04
SOURCE: BPS SURABAYA, 2010 POPULATION CENSUS
Metropolitan Surabaya‘s economic structure has changed over time and space. Table A5.12 describes the distribution of the economic activities in each of the metropolitan area‘s districts in 2005. The descriptions of the proportion of the contribution of each sector in the Gerbangkertosusila region in 2005 show that the agriculture sector is the most significant contributor in Lamongan, Bangkalan and Mojokerto District. The contribution of the secondary sector (the manufacturing sector) is dominant in Gresik, Mojokerto District, Surabaya and Sidoarjo. The tertiary sector (trade, hotel and restaurants) is the major contributor in Mojokerto City, Sidoarjo and Surabaya.
An analysis of GRDP by sector in the Gerbangkertosusila region shows that Surabaya contributed to almost 60 percent of the total GRDP in GKS in 2000. This increased slightly to 60.5 percent in 2005. Hence, Surabaya is easily the most dominant economic contributor within the GKS. Other fast growing regions that have doubled their GRDP in the period from 2000 to 2005 include Sidoarjo (15%) and
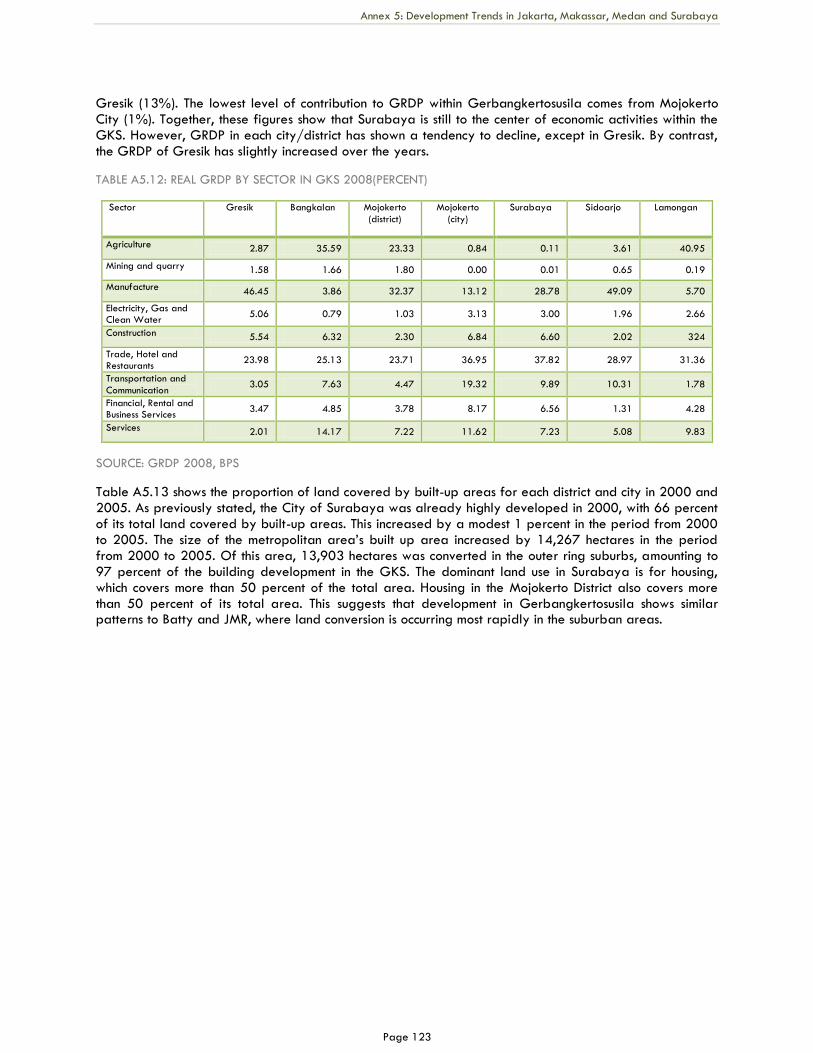
Annex 5: Development Trends in Jakarta, Makassar, Medan and Surabaya
Page 123
Gresik (13%). The lowest level of contribution to GRDP within Gerbangkertosusila comes from Mojokerto City (1%). Together, these figures show that Surabaya is still to the center of economic activities within the GKS. However, GRDP in each city/district has shown a tendency to decline, except in Gresik. By contrast, the GRDP of Gresik has slightly increased over the years.
TABLE A5.12: REAL GRDP BY SECTOR IN GKS 2008(PERCENT)
Sector Gresik Bangkalan Mojokerto
(district)
Mojokerto
(city)
Surabaya Sidoarjo Lamongan
Agriculture 2.87 35.59 23.33 0.84 0.11 3.61 40.95
Mining and quarry 1.58 1.66 1.80 0.00 0.01 0.65 0.19
Manufacture 46.45 3.86 32.37 13.12 28.78 49.09 5.70
Electricity, Gas and Clean Water
5.06 0.79 1.03 3.13 3.00 1.96 2.66
Construction 5.54 6.32 2.30 6.84 6.60 2.02 324
Trade, Hotel and Restaurants
23.98 25.13 23.71 36.95 37.82 28.97 31.36
Transportation and
Communication 3.05 7.63 4.47 19.32 9.89 10.31 1.78
Financial, Rental and Business Services
3.47 4.85 3.78 8.17 6.56 1.31 4.28
Services 2.01 14.17 7.22 11.62 7.23 5.08 9.83
SOURCE: GRDP 2008, BPS
Table A5.13 shows the proportion of land covered by built-up areas for each district and city in 2000 and 2005. As previously stated, the City of Surabaya was already highly developed in 2000, with 66 percent of its total land covered by built-up areas. This increased by a modest 1 percent in the period from 2000 to 2005. The size of the metropolitan area‘s built up area increased by 14,267 hectares in the period from 2000 to 2005. Of this area, 13,903 hectares was converted in the outer ring suburbs, amounting to 97 percent of the building development in the GKS. The dominant land use in Surabaya is for housing, which covers more than 50 percent of the total area. Housing in the Mojokerto District also covers more than 50 percent of its total area. This suggests that development in Gerbangkertosusila shows similar patterns to Batty and JMR, where land conversion is occurring most rapidly in the suburban areas.
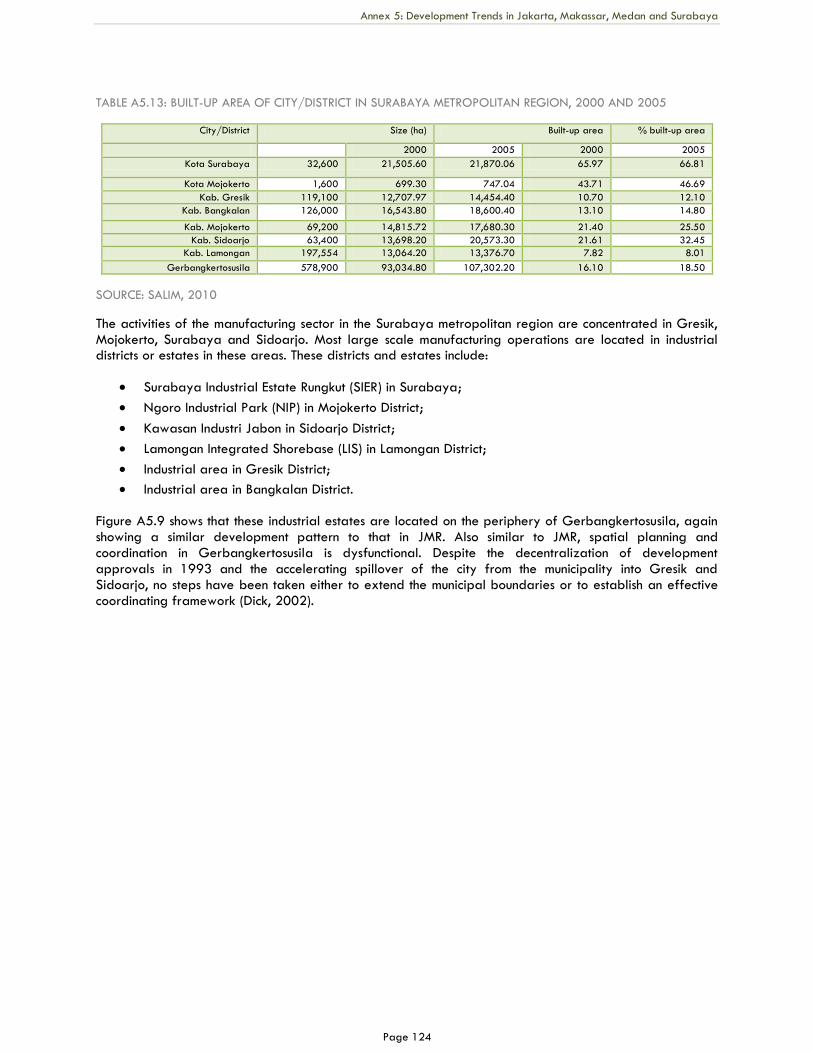
Annex 5: Development Trends in Jakarta, Makassar, Medan and Surabaya
Page 124
TABLE A5.13: BUILT-UP AREA OF CITY/DISTRICT IN SURABAYA METROPOLITAN REGION, 2000 AND 2005
City/District Size (ha) Built-up area % built-up area
2000 2005 2000 2005
Kota Surabaya 32,600 21,505.60 21,870.06 65.97 66.81
Kota Mojokerto 1,600 699.30 747.04 43.71 46.69
Kab. Gresik 119,100 12,707.97 14,454.40 10.70 12.10
Kab. Bangkalan 126,000 16,543.80 18,600.40 13.10 14.80
Kab. Mojokerto 69,200 14,815.72 17,680.30 21.40 25.50
Kab. Sidoarjo 63,400 13,698.20 20,573.30 21.61 32.45
Kab. Lamongan 197,554 13,064.20 13,376.70 7.82 8.01
Gerbangkertosusila 578,900 93,034.80 107,302.20 16.10 18.50
SOURCE: SALIM, 2010
The activities of the manufacturing sector in the Surabaya metropolitan region are concentrated in Gresik, Mojokerto, Surabaya and Sidoarjo. Most large scale manufacturing operations are located in industrial districts or estates in these areas. These districts and estates include:
Surabaya Industrial Estate Rungkut (SIER) in Surabaya;
Ngoro Industrial Park (NIP) in Mojokerto District;
Kawasan Industri Jabon in Sidoarjo District;
Lamongan Integrated Shorebase (LIS) in Lamongan District;
Industrial area in Gresik District;
Industrial area in Bangkalan District.
Figure A5.9 shows that these industrial estates are located on the periphery of Gerbangkertosusila, again showing a similar development pattern to that in JMR. Also similar to JMR, spatial planning and coordination in Gerbangkertosusila is dysfunctional. Despite the decentralization of development approvals in 1993 and the accelerating spillover of the city from the municipality into Gresik and Sidoarjo, no steps have been taken either to extend the municipal boundaries or to establish an effective coordinating framework (Dick, 2002).
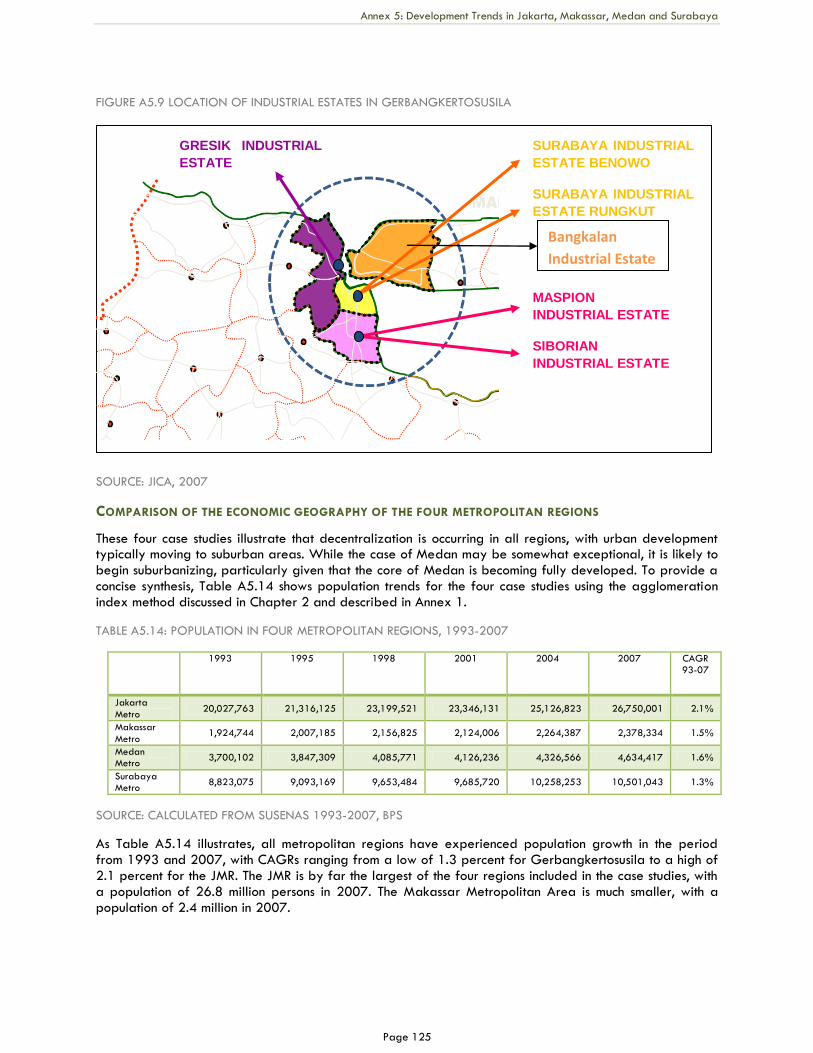
Annex 5: Development Trends in Jakarta, Makassar, Medan and Surabaya
Page 125
FIGURE A5.9 LOCATION OF INDUSTRIAL ESTATES IN GERBANGKERTOSUSILA
SOURCE: JICA, 2007
COMPARISON OF THE ECONOMIC GEOGRAPHY OF THE FOUR METROPOLITAN REGIONS
These four case studies illustrate that decentralization is occurring in all regions, with urban development typically moving to suburban areas. While the case of Medan may be somewhat exceptional, it is likely to begin suburbanizing, particularly given that the core of Medan is becoming fully developed. To provide a concise synthesis, Table A5.14 shows population trends for the four case studies using the agglomeration index method discussed in Chapter 2 and described in Annex 1.
TABLE A5.14: POPULATION IN FOUR METROPOLITAN REGIONS, 1993-2007
1993 1995 1998 2001 2004 2007 CAGR 93-07
Jakarta
Metro 20,027,763 21,316,125 23,199,521 23,346,131 25,126,823 26,750,001 2.1%
Makassar
Metro 1,924,744 2,007,185 2,156,825 2,124,006 2,264,387 2,378,334 1.5%
Medan Metro
3,700,102 3,847,309 4,085,771 4,126,236 4,326,566 4,634,417 1.6%
Surabaya Metro
8,823,075 9,093,169 9,653,484 9,685,720 10,258,253 10,501,043 1.3%
SOURCE: CALCULATED FROM SUSENAS 1993-2007, BPS
As Table A5.14 illustrates, all metropolitan regions have experienced population growth in the period from 1993 and 2007, with CAGRs ranging from a low of 1.3 percent for Gerbangkertosusila to a high of 2.1 percent for the JMR. The JMR is by far the largest of the four regions included in the case studies, with a population of 26.8 million persons in 2007. The Makassar Metropolitan Area is much smaller, with a population of 2.4 million in 2007.
GRESIK INDUSTRIAL
ESTATE
MASPION
INDUSTRIAL ESTATE
SIBORIAN
INDUSTRIAL ESTATE
SURABAYA INDUSTRIAL
ESTATE BENOWO
SURABAYA INDUSTRIAL
ESTATE RUNGKUT
Bangkalan
Industrial Estate
Annex 5: Development Trends in Jakarta, Makassar, Medan and Surabaya
Page 126
In the four largest metropolitan regions, population growth has been faster in the outer rings than in the core for all cities. In particular, core population growth has been stagnant in Jakarta and Surabaya. This has resulted in a de-concentration of population, with the share of population in Jakarta and Surabaya‘s core declining over time. By 2007, their respective core populations were between 28 and 25 percent respectively.
In the cases of Medan and Makassar, the trend towards decentralization has been less apparent. Even so, the rate of population growth in their respective outer rings has grown player than in their cores. In the case of Medan, population growth in the outer ring is double that for the core. In the case of Makassar, the rate is only slightly higher.
There are several reasons for this pattern of decentralization, which views common worldwide. First, land is cheaper in the outlying areas, making it less expensive to purchase land for housing and other purposes. Second, the core areas of the cities are highly developed and land ownership patterns are highly fragmented, limiting opportunities for development, especially given Indonesia‘s complex system of land and property rights. Fourth, as these metropolitan areas expand, the development and improvement of infrastructure, particularly roads, makes it easier for workers to commute.
Related Documents