Quality of Diabetes Care Qualidiab: A DOTA Initiative for Latin America and the Caribbean Juan José Gagliardino CENEXA Center of Experimental and Applied Endocrinology (UNLP – CONICET) PAHO/WHO Collaborating Center La Plata, Argentina

Workshop rpt-5-qualidiab
Jul 15, 2015
Welcome message from author
This document is posted to help you gain knowledge. Please leave a comment to let me know what you think about it! Share it to your friends and learn new things together.
Transcript

Quality of Diabetes Care
Qualidiab: A DOTA Initiative for Latin America and the Caribbean
Juan José Gagliardino
CENEXACenter of Experimental and Applied Endocrinology (UNLP – CONICET)
PAHO/WHO Collaborating Center
La Plata, Argentina

199520002025
60
50
40
30
20
10
0EME FSE MEC India China OAI LAC SSA
No of people withdiabetes (millions)
EME = Established market economiesFSE = Formerly socialist economies of EuropeMEC = Middle Eastern CrescentOAI = Other Asia and islandsLAC = Latin America and the CaribbeanSSA = Sub-Saharan Africa
Estimates (1995, 2000) and Predictions (2025)of the Absolute Numbers of People with Diabetes
Regional groupings according to World Bank (1993).
Source: King H, et al (1998).

The Number of People with Diabetesper Age Group (1995, 2025)
1995 2025
50
40
30
20
10
0
120
100
80
60
40
20
0
Developing countries
20-44 45-64 64+
Developed countries
20-44 45-64 64+
Source: King H, et al (1998).

The Facts
Rising burden Declining quality of life
The Cause
Rise in incidence and prevalence of diabetes and its complications
The Reasons
Demographic changes
Socio-economic changes
Industrialization & urbanization
Unrecognized diabetes
Unhealthy lifestyles
The Challenge
Implementation of prevention at all levels
The Tools
Appropriate control of diabetes and its risk factors
Education of people with diabetes, the public and healthcare team members
Continuous monitoring of impact
Modification of interventions to increase their effectiveness
Dr. Juan José Gagliardino member of the IDF Taskforce on Diabetes Health Economics

Knowledge and skills (health care team)
Patients empowerment
(education)
Accesibility (care, drugs and control devices)
Prevention
↓ Complications
Better quality of life
J.J. Gagliardino

Qualidiab Focus
“Establish monitoring and control systems using state-of-the-art information
technology for quality assurance in diabetes care.”

Qualidiab Instruments
Quality indicators
Basic information sheet
Computer programs
Local quality circles
LA and C Quality Network
Continous Quality development

Examples of the Qualidiab Indicators
Example
New cases of blindness
Proliferative retinopathy
HbA1c, microalbuminuria
Anxiety, well being
Tests request frequency
Feet and eye examination
Blood pressure lowering therapy at increased albumin excretion
Type of indicator
Outcomes•True outcomes
•Intermediate outcomes
•Quality of life
•Treatment satisfaction
•Documentation
•Self-monitoring
•Interventions
Procedures
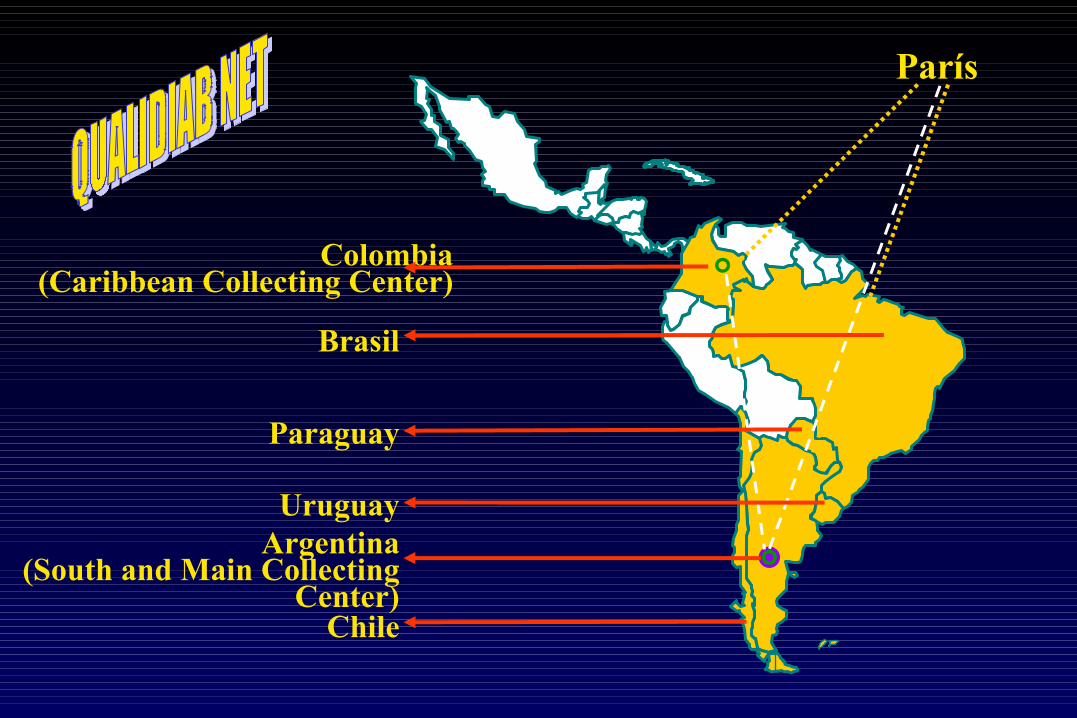
Brasil
Argentina(South and Main Collecting
Center)
Paraguay
Colombia(Caribbean Collecting Center)
Chile
Uruguay
París

Characteristics of the Qualidiab Population
Age 16-35 years56-75 years
Women
DM duration (0-5 years)
Known relatives with DM
Type 1 (%)
37 (16-41)----
49 (36-64)
46 (26-71)
52 (21-80)
----56 (53-59)
61 (51-71)
49 (36-70)
43 (36-53)
Type 2 (%)
Number of cases: Type 1= 1229; type 2 = 12.284; total = 13.513

0 10 20 30 40 50 60 70 80 90 100
Peso corporal
Examen pies
Control PA
Control retina
Control HbA1c
Control creatinina
Control col. total
Control col. HDL
Control triglic.
Control µalbum. y protein.
NO YES
Detection of Complications and Cardiovascular Risk FactorsIn Type 1 DM
µalbuminuria and prot.
Triglycerides
HDL-cholesterol
Total cholesterol
Creatinine
HbA1c
Retina
Blood Pressure
Foot care
Body weight
NO YES
(18-66)
(33-100)
(17-71)
(38-83)
(49-72)
(17-81)
(7-76)
(79-94)
(49-90)
(95-100)
(0-5)
(24-93)
(0-83)
(28-51)
(17-62)
(29-83)
(0-67)
(34-92)
(10-51)
(6-21)
0 10 20 30 40 50 60 70 80 90 100
Peso corporal
Examen pies
Control PA
Control retina
Control HbA1c
Control creatinina
Control col. total
Control col. HDL
Control triglic.
Control µalbum. y protein.
No detección Detección
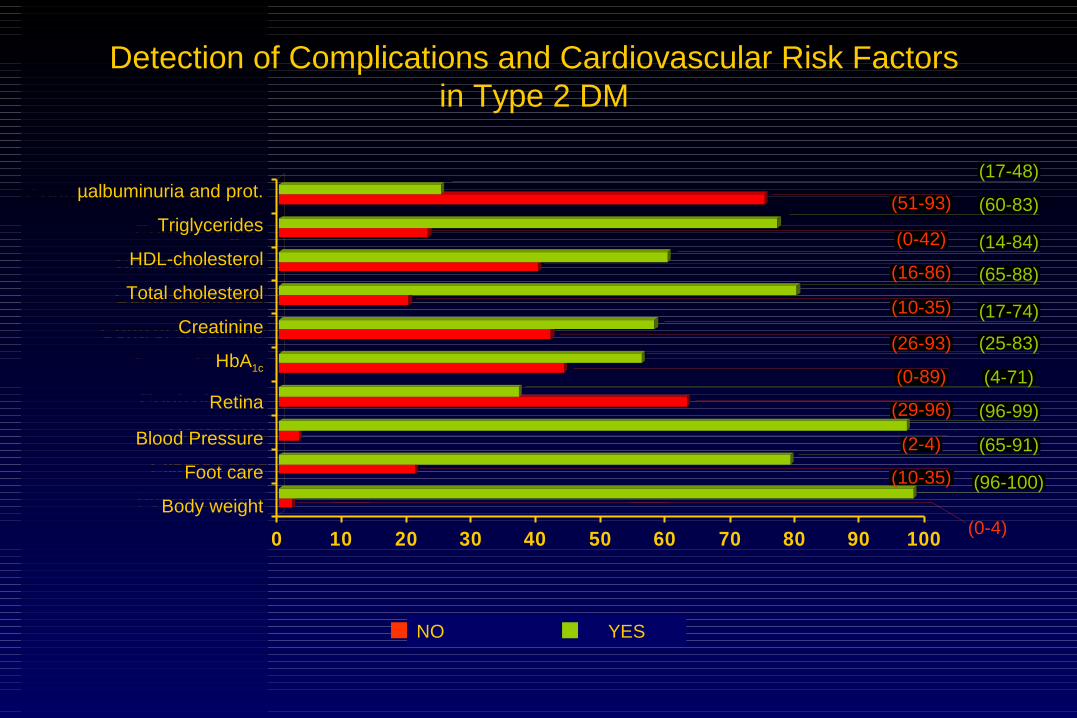
Detection of Complications and Cardiovascular Risk Factorsin Type 2 DM
µalbuminuria and prot.
Triglycerides
HDL-cholesterol
Total cholesterol
Creatinine
HbA1c
Retina
Blood Pressure
Foot care
Body weight
NO YES
(17-48)
(60-83)
(14-84)
(65-88)
(17-74)
(25-83)
(4-71)
(96-99)
(65-91)
(96-100)
(0-4)
(10-35)
(2-4)
(29-96)
(0-89)
(26-93)
(10-35)
(16-86)
(0-42)
(51-93)

0 10 20 30 40 50 60 70
>7.7 mmol/L
<4.4 mmol/L
>9.5 %
<6.5 %
>5.2 mmol/L
<5.2 mmol/L
<1.1 mmol/L
>1.1 mmol/L
>1.7 mmol/L
<1.7 mmol/L
Glycemic and Cardiovascular Risk-factor ControlIn Type 1 DM
<1.7 mmol/L
>1.7 mmol/L
>1.1 mmol/L
<1.1 mmol/L
<1.0 mmol/L
>5.5 mmol/L
<6.5 %
>9.5 %
<4.4 mmol/L
>7.7 mmol/L
Fasting glycemia
HbA1c
Total cholesterol
HDL cholesterol
Triglycerides
0 10 20 30 40 50 60 70
(50-84)
(11-50)
(3-31)
(9-74)
(22-66)
(7-57)
(5-26)
(13-43)
(0-61)
(1-64)

0 10 20 30 40 50 60
>7.7 mmol/L
<4.4 mmol/L
>9.5 %
<6.5 %
>5.5 mmol/L
<1,0 mmol/L
<1.1 mmol/L
>1.1 mmol/L
>1.7 mmol/L
<1.7 mmol/L (25-66)
(34-68)
(2-45)
(8-63)
(25-40)
(37-77)
(2-46)
(6-29)
(6-42)
(28-83)
Glycemic and Cardiovascular Risk-factor Controlin Type 2 DM
Fasting glycemia
HbA1c
Total cholesterol
HDL- cholesterol
Triglycerides

0 10 20 30 40 50 60 70 80
Miembro asociación
Control hipogluc.
Cuida sus pies
Interpreta automon.
Realiza automon.
SI NO
(28-79)(21-72)
(22-81)(19-78)
(14-53)(51-84)
(24-47)(53-76)
(6-95)(5-94)
No Yes
Therapeutic Education in Type 1 DM
Selfmonitoring
Interpretation of s.m.
Foot care
Hypoglycemic control
Member of an association
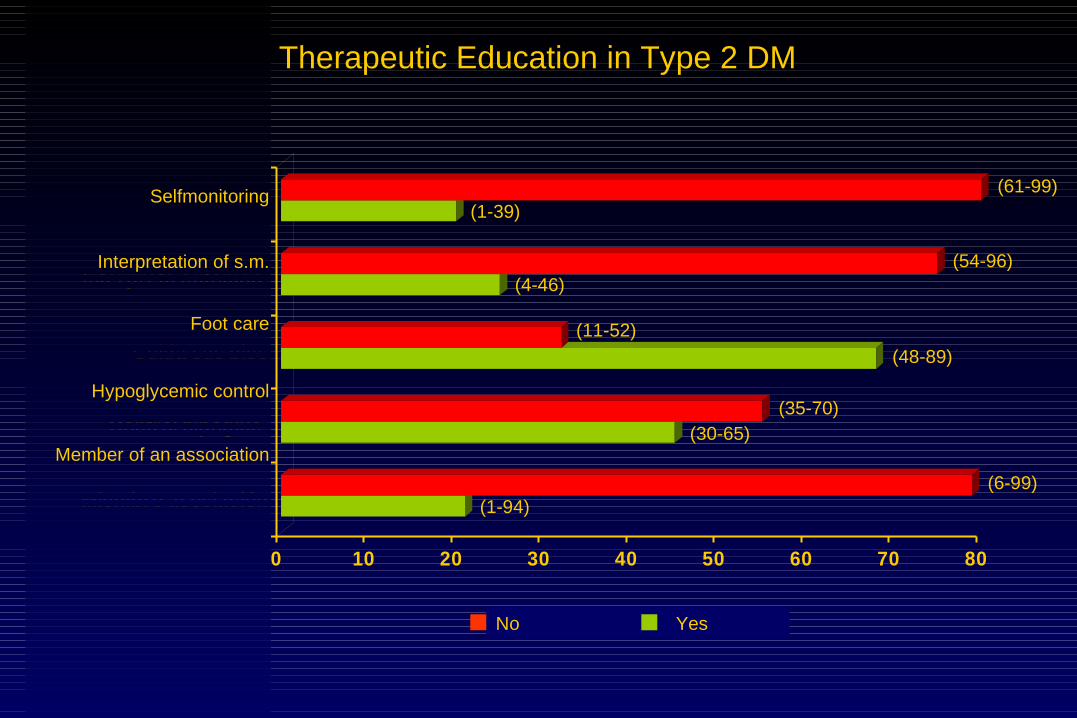
0 10 20 30 40 50 60 70 80
Miembro asociación
Control hipogluc.
Cuida sus pies
Interpreta automon.
Realiza automon.
SI NO
(61-99)(1-39)
(54-96)(4-46)
(11-52)
(48-89)
(35-70)(30-65)
(6-99)(1-94)
No Yes
Therapeutic Education in Type 2 DM
Selfmonitoring
Interpretation of s.m.
Foot care
Hypoglycemic control
Member of an association

Associated Cardiovascular Risk Factors in Type 1 DM
0 10 20 30 40 50 60 70
<19 y >30
19-24
>140/90
<140/90
>5.2 mmol/L
<5.2 mmol/L
<1.1 mmol/L
<1.1 mmol/L
>1.7 mmol/L
<1.7 mmol/L<1.7 mmol/L
>1.7 mmol/L
>1.1 mmol/L
<1.1 mmol/L
<1.0 mmol/L
>5.5mmol/L
<140/90
>140/90
19-24
<19
Total cholesterol
HDL cholesterol
Triglycerides
BMI
Hypertension
(50-84)
(11-50)
(3-31)
(9-74)
(22-66)
(7-57)
(7-47)
(19-45)
(4-43)
(46-83)

Associated Cardiovascular Risk Factors in Type 2 DM
BMI
0 10 20 30 40 50 60
<19 y >30
19-24
>140/90
<140/90
>5.2 mmol/L
<5.2 mmol/L
<1.1 mmol/L
<1.1 mmol/L
>1.7 mmol/L
<1.7 mmol/L<1.7 mmol/L
>1.7 mmol/L
>1.1 mmol/L
<1.1 mmol/L
<1.0 mmol/L
>5.5 mmol/L
<140/90
>140/90
19-24
>30
(25-66)
(34-68)
(2-45)
(8-63)
(25-40)
(34-77)
(35-44)
(52-64)
(9-27)
(19-54)
Triglycerides
Total cholesterol
HDL- cholesterol
Hypertension
BMI
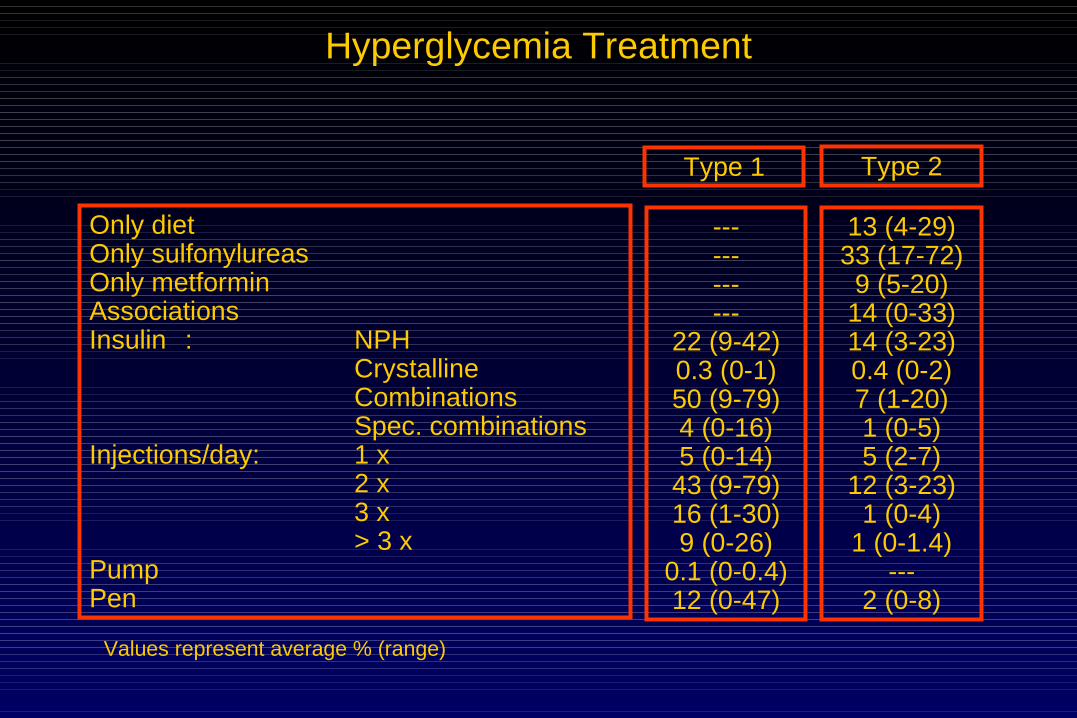
Hyperglycemia Treatment
Only dietOnly sulfonylureasOnly metforminAssociationsInsulin : NPH
Crystalline Combinations Spec. combinations
Injections/day: 1 x 2 x 3 x > 3 x
PumpPen
Type 1 Type 2
------------
22 (9-42)0.3 (0-1)50 (9-79)4 (0-16)5 (0-14)43 (9-79)16 (1-30)9 (0-26)
0.1 (0-0.4)12 (0-47)
13 (4-29)33 (17-72)
9 (5-20)14 (0-33)14 (3-23)0.4 (0-2)7 (1-20)1 (0-5)5 (2-7)
12 (3-23)1 (0-4)
1 (0-1.4)---
2 (0-8)
Values represent average % (range)
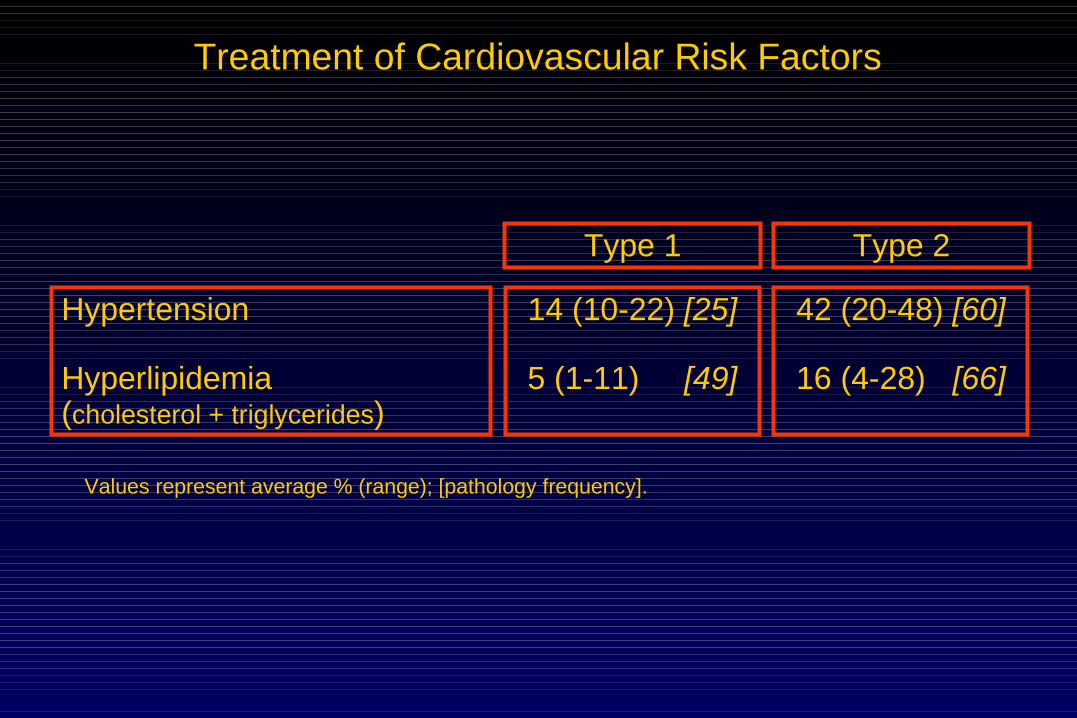
Treatment of Cardiovascular Risk Factors
Hypertension
Hyperlipidemia(cholesterol + triglycerides)
Type 1
14 (10-22) [25]
5 (1-11) [49]
42 (20-48) [60]
16 (4-28) [66]
Type 2
Values represent average % (range); [pathology frequency].
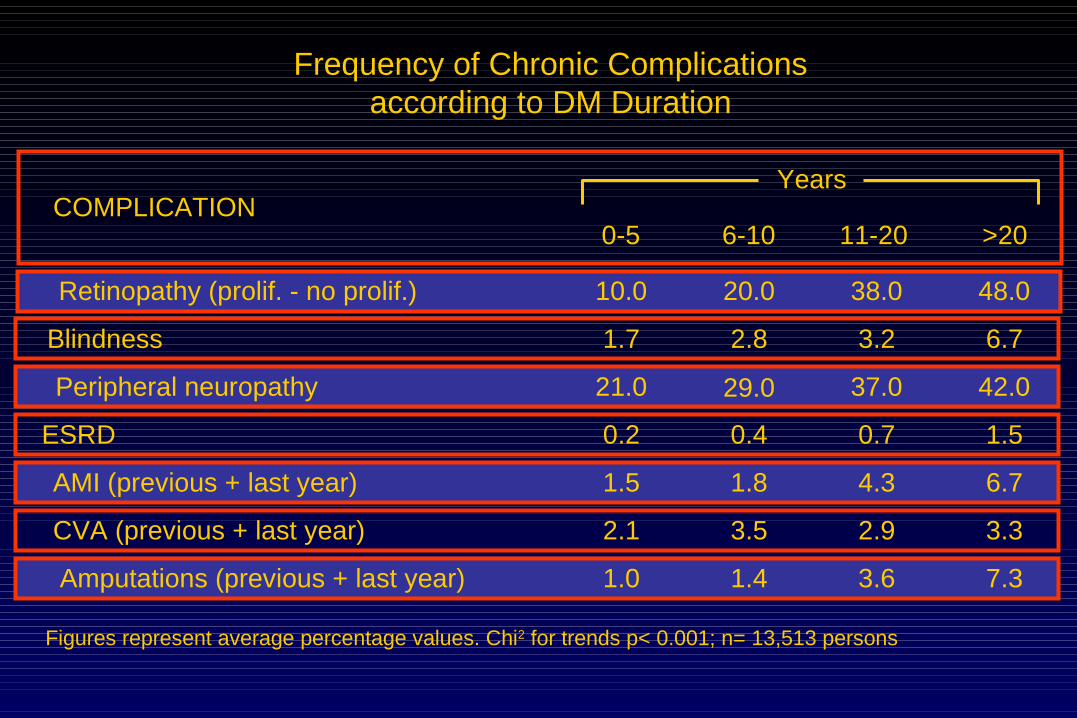
Frequency of Chronic Complicationsaccording to DM Duration
COMPLICATION0-5 6-10 11-20 >20
Years
Figures represent average percentage values. Chi2 for trends p< 0.001; n= 13,513 persons
Retinopathy (prolif. - no prolif.) 10.0 20.0 38.0 48.0
Blindness 1.7 2.8 3.2 6.7
Peripheral neuropathy 21.0 29.0 37.0 42.0
ESRD 0.2 0.4 0.7 1.5
AMI (previous + last year) 1.5 1.8 4.3 6.7
CVA (previous + last year) 2.1 3.5 2.9 3.3
Amputations (previous + last year) 1.0 1.4 3.6 7.3
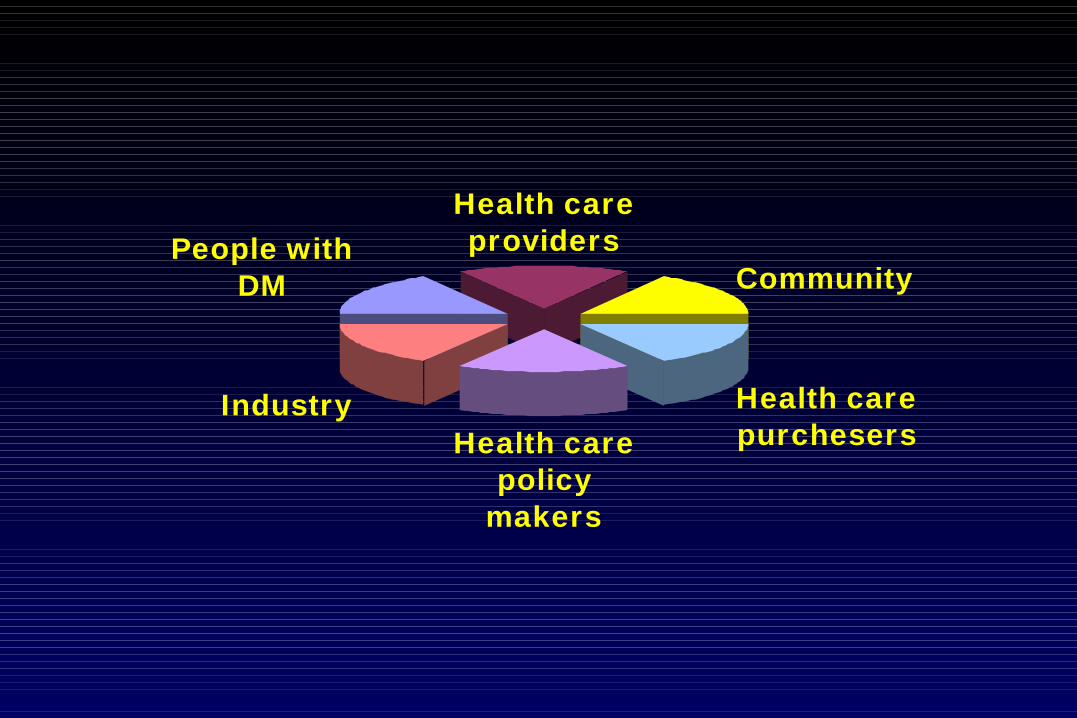
People with DM
Health care providers
Community
Health care purchesersHealth care
policy makers
Industry

Knowledge and skills (health care team)
Patients empowerment
(education)
Accesibility (care, drugs and control devices)
Prevention
↓ Complications
Better quality of life
J.J. Gagliardino
EDUCATION
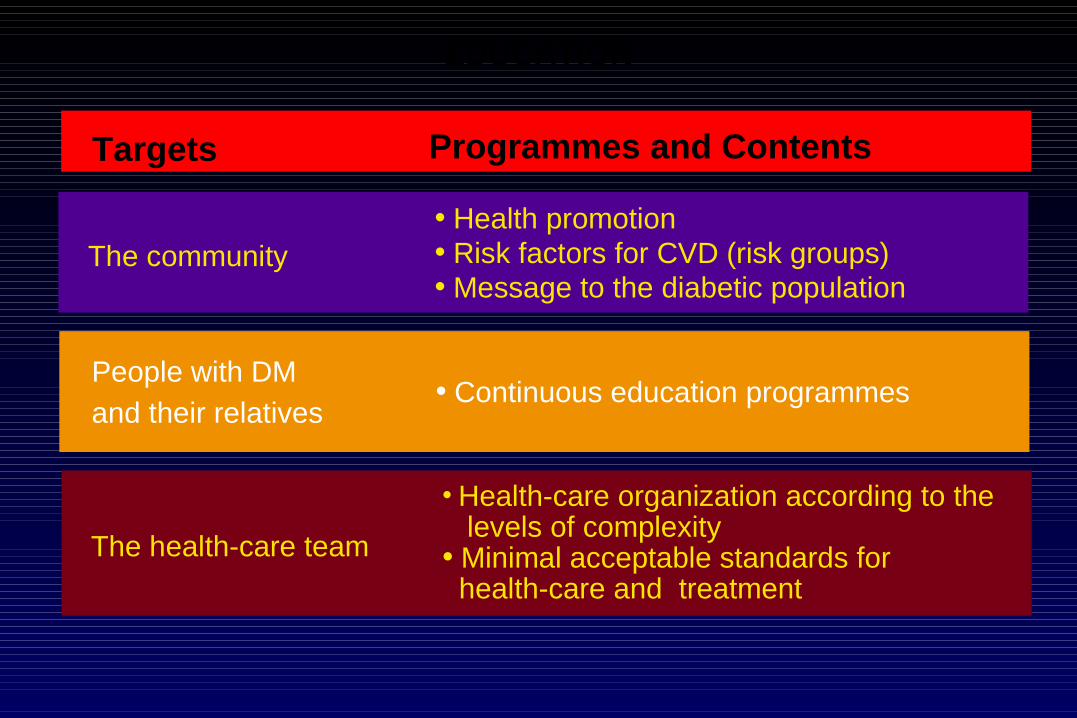
Targets Programmes and Contents
The community• Health promotion• Risk factors for CVD (risk groups)• Message to the diabetic population
The health-care team
• Health-care organization according to the levels of complexity• Minimal acceptable standards for health-care and treatment
• Continuous education programmesPeople with DM
and their relatives
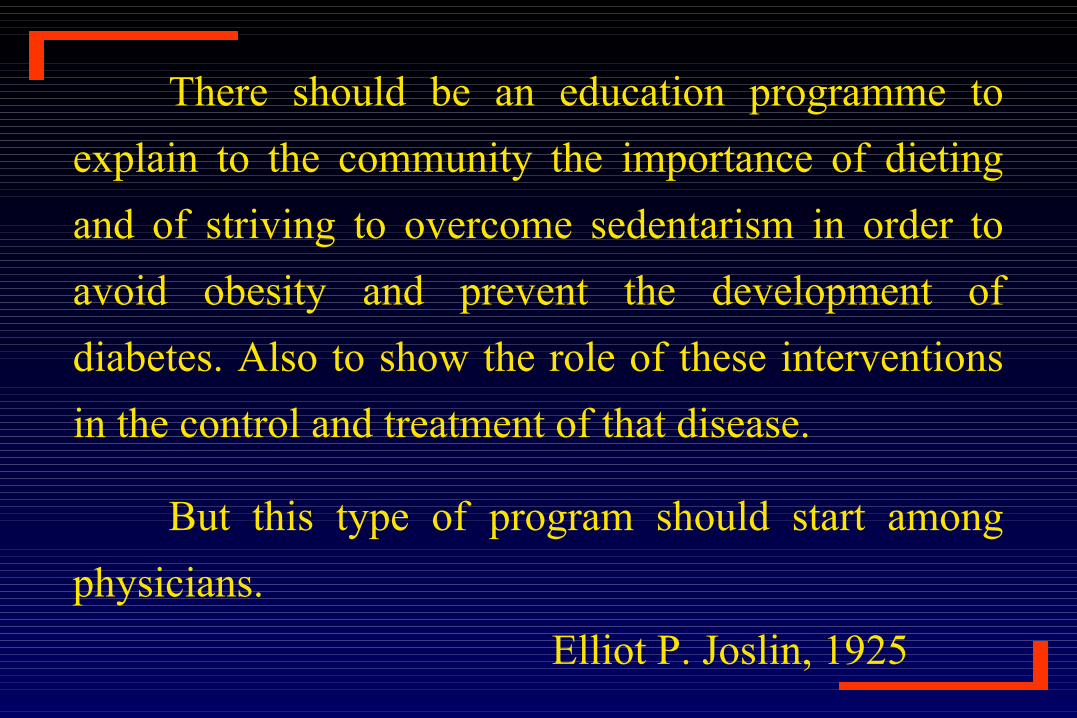
There should be an education programme to
explain to the community the importance of dieting
and of striving to overcome sedentarism in order to
avoid obesity and prevent the development of
diabetes. Also to show the role of these interventions
in the control and treatment of that disease.
But this type of program should start among
physicians.
Elliot P. Joslin, 1925

The Worldwide Diabetes Epidemic:
What can we do about it?
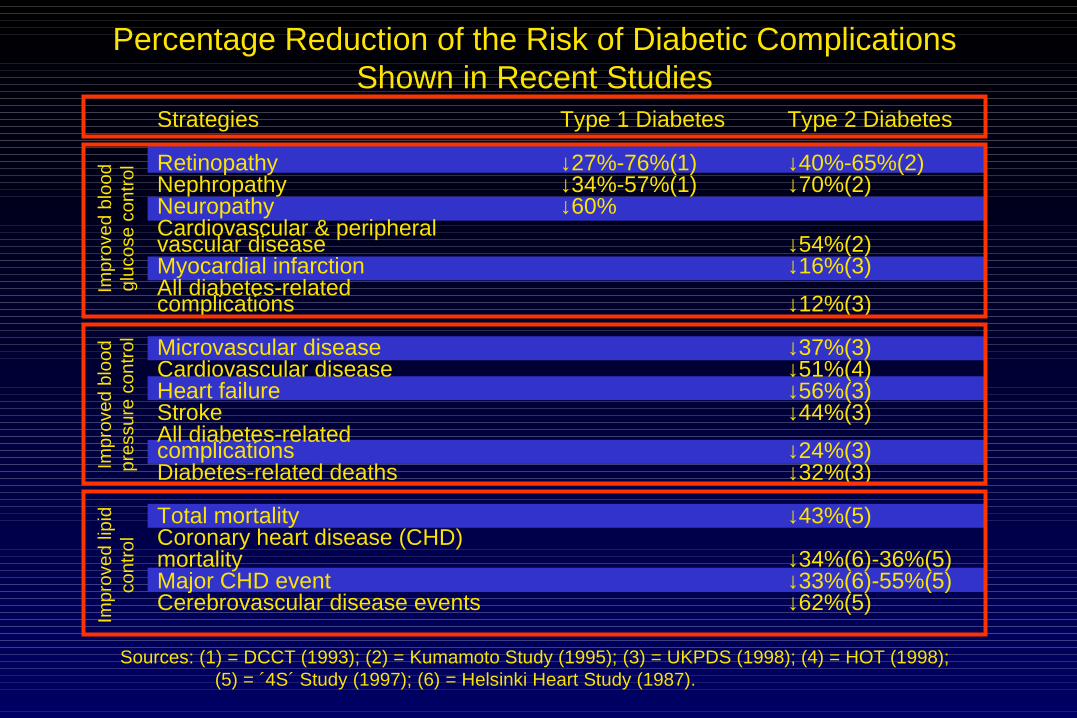
Percentage Reduction of the Risk of Diabetic ComplicationsShown in Recent Studies
Sources: (1) = DCCT (1993); (2) = Kumamoto Study (1995); (3) = UKPDS (1998); (4) = HOT (1998); (5) = ´4S´ Study (1997); (6) = Helsinki Heart Study (1987).
Strategies
RetinopathyNephropathyNeuropathyCardiovascular & peripheralvascular diseaseMyocardial infarctionAll diabetes-relatedcomplications
Microvascular diseaseCardiovascular diseaseHeart failureStrokeAll diabetes-relatedcomplicationsDiabetes-related deaths
Total mortalityCoronary heart disease (CHD)mortalityMajor CHD eventCerebrovascular disease events
Type 1 Diabetes
↓27%-76%(1)↓34%-57%(1)↓60%
Type 2 Diabetes
↓40%-65%(2)↓70%(2)
↓54%(2)↓16%(3)
↓12%(3)
↓37%(3)↓51%(4)↓56%(3)↓44%(3)
↓24%(3)↓32%(3)
↓43%(5)
↓34%(6)-36%(5)↓33%(6)-55%(5)↓62%(5)
Imp
rove
d bl
ood
gluc
ose
cont
rol
Impr
oved
blo
odpr
essu
re c
ontr
olIm
pro
ved
lipid
cont
rol

PROCAMEG
Opinion leaders Guidelines
Diabetologists from the chapters Teaching training
GPs Regular courses
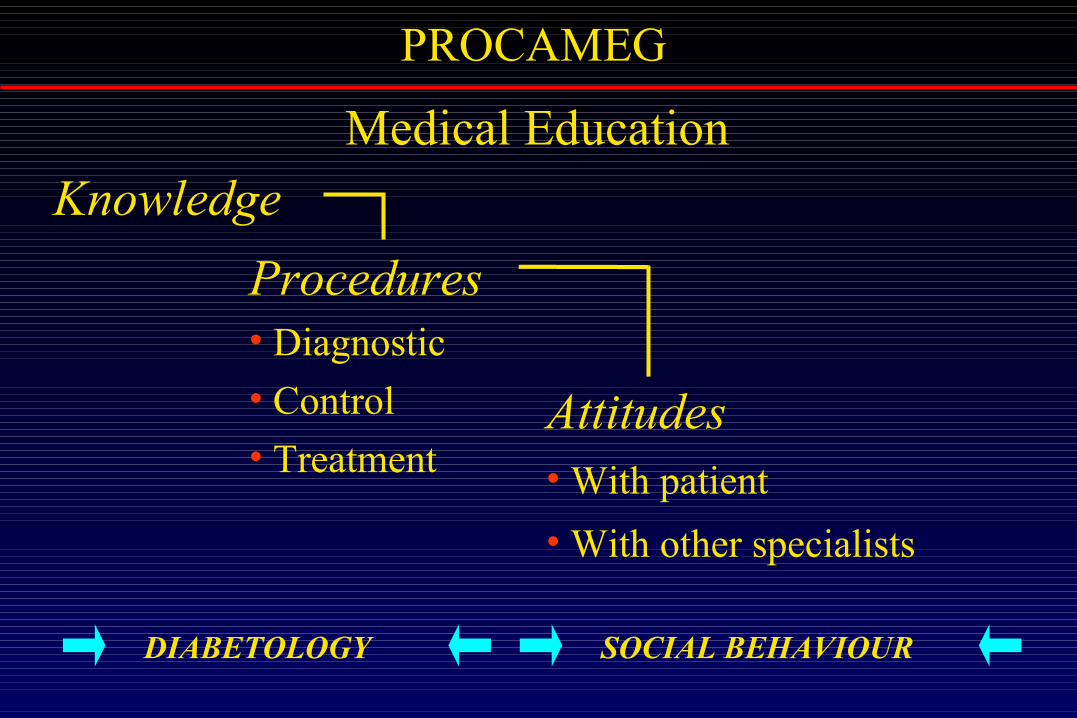
PROCAMEG
Medical Education
Knowledge
Procedures• Diagnostic
• Control
• TreatmentAttitudes• With patient
• With other specialists
DIABETOLOGY SOCIAL BEHAVIOUR

PROCAMEG
Evaluation
Characteristics, previous training in DM and teaching
experience of the participants
Degree of satisfaction (referred to the training course)
Program impact upon: knowledge (multiple choice) attitudes *
results *
*Follow up of a randomized patients sample
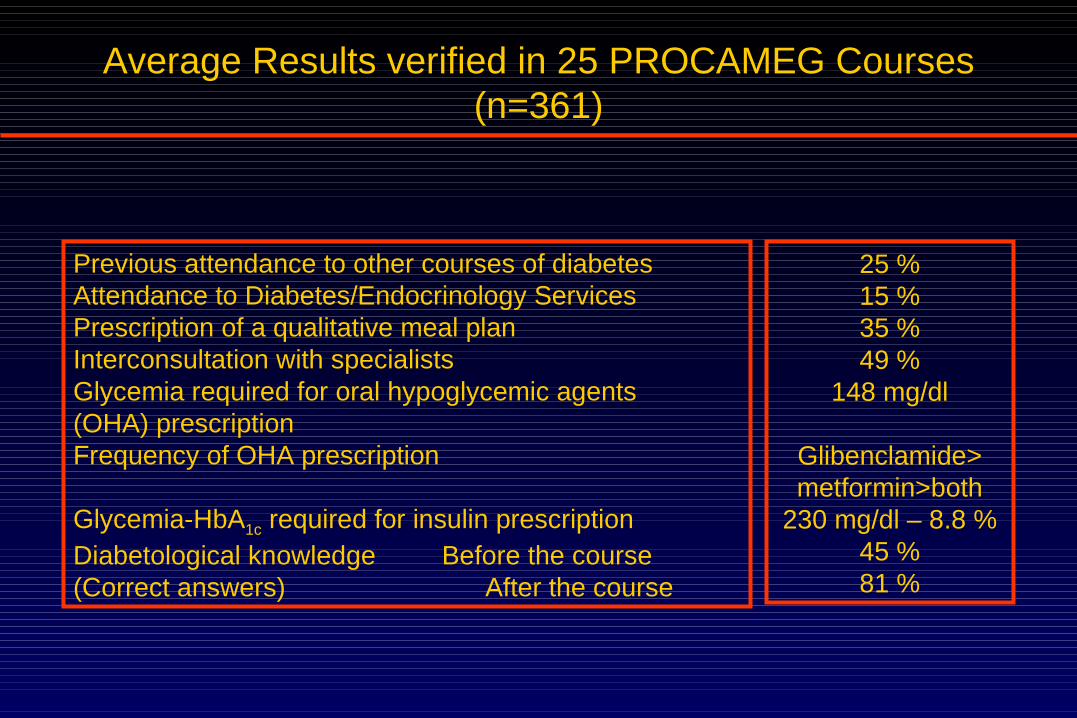
Average Results verified in 25 PROCAMEG Courses(n=361)
Previous attendance to other courses of diabetesAttendance to Diabetes/Endocrinology ServicesPrescription of a qualitative meal planInterconsultation with specialistsGlycemia required for oral hypoglycemic agents(OHA) prescriptionFrequency of OHA prescription
Glycemia-HbA1c required for insulin prescriptionDiabetological knowledge Before the course(Correct answers) After the course
25 %15 %35 %49 %
148 mg/dl
Glibenclamide>metformin>both
230 mg/dl – 8.8 %45 %81 %

Programa de Educación del Diabético No Insulinodependiente
de Latinoamérica*
Mexico
Costa Rica
Brazil
Argentina
Paraguay
Colombia
Bolivia
Uruguay
Cuba
Chile
*Non-Insulin-Dependent Diabetic Education Programme of Latin America
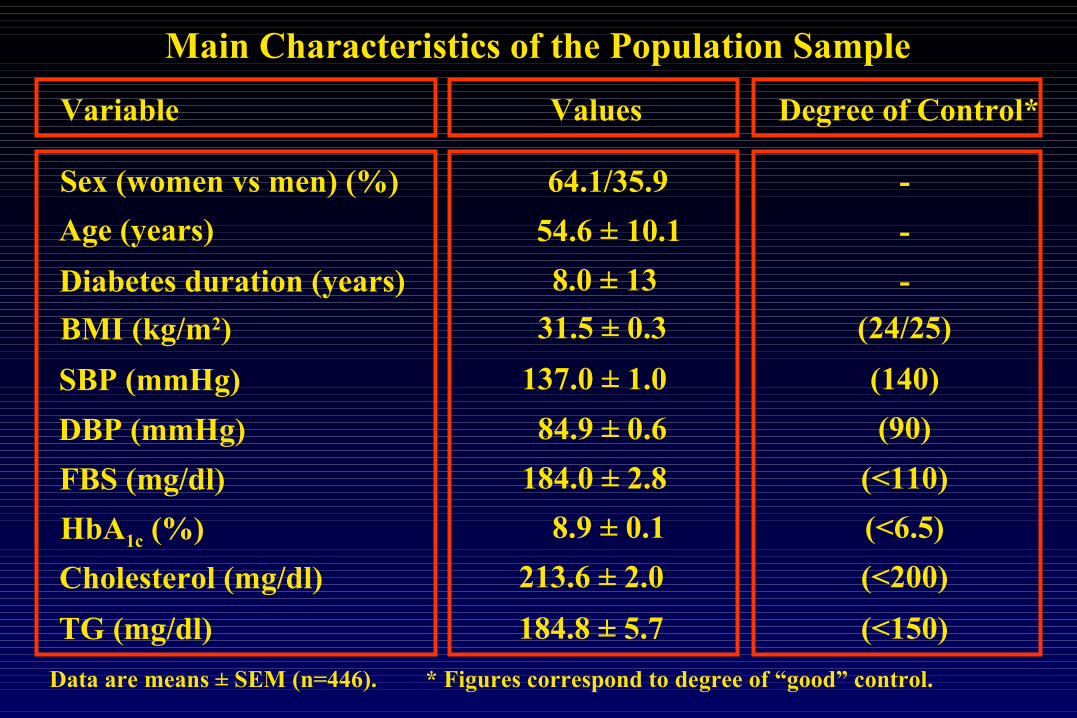
Variable Degree of Control*
Main Characteristics of the Population Sample
Data are means ± SEM (n=446). * Figures correspond to degree of “good” control.
Sex (women vs men) (%)
Age (years)
Diabetes duration (years)
BMI (kg/m2)
SBP (mmHg)
DBP (mmHg)
FBS (mg/dl)
HbA1c (%)
Cholesterol (mg/dl)
TG (mg/dl)
Values
54.6 ± 10.1
64.1/35.9
8.0 ± 13
31.5 ± 0.3
137.0 ± 1.0
84.9 ± 0.6
184.0 ± 2.8
8.9 ± 0.1
213.6 ± 2.0
184.8 ± 5.7
-
-
-
(24/25)
(140)
(90)
(<110)
(<6.5)
(<200)
(<150)

HbA1c
Body weight SBP - DBP
-6mos 0 1 month 4 mos 8 mos 12 mos -6mos 0 1 month 4 mos 8 mos 12 mos
-6mos 0 1 month 4 mos 8 mos 12 mos -6mos 0 1 month 4 mos 8 mos 12 mos
n = 446
n = 323* p<0.001
80
81
82
83
84
85
86
Time-period
kg
** p<0.05
150
160
170
180
190
200
Time-period
mg/d
l
FBG n = 446* p<0.001
7,5
8,0
8,5
9,0
9,5
Time-period
%
85
95
105
115
125
135
145
155
Time-period
mm
Hg
SBP DBP
**
*
*
* p<0.001
*
*
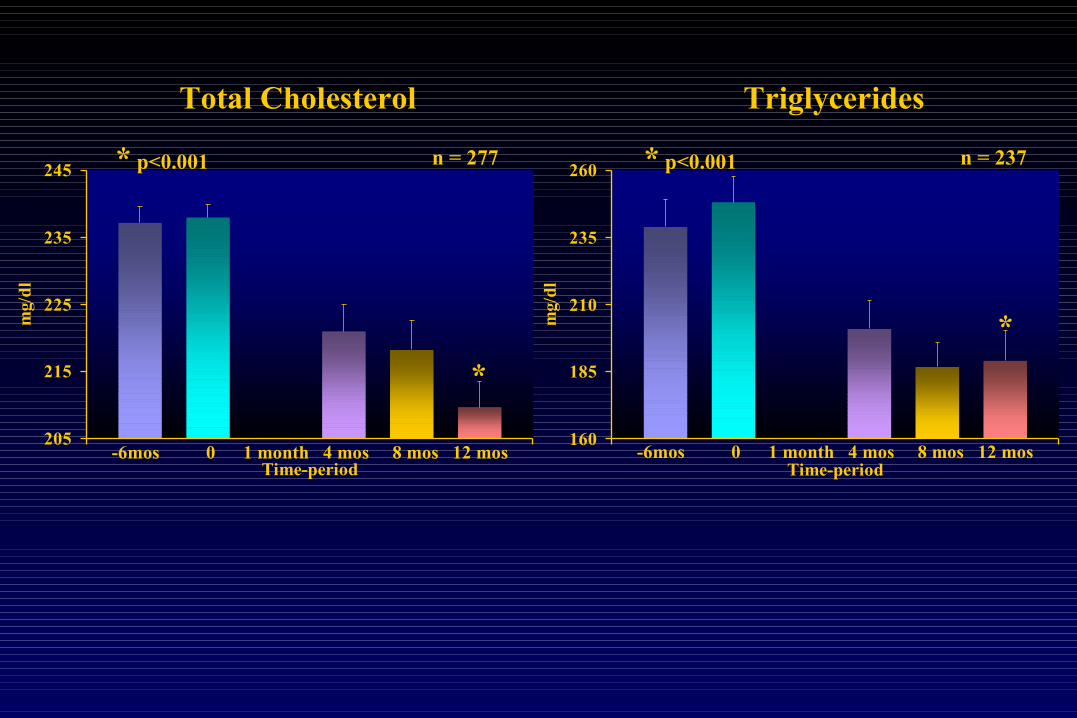
Total Cholesterol Triglycerides
-6mos 0 1 month 4 mos 8 mos 12 mos -6mos 0 1 month 4 mos 8 mos 12 mos
n = 277
205
215
225
235
245
Time-period
mg/
dl
*
* p<0.001
160
185
210
235
260
Time-period
mg/
dl
n = 237
*
* p<0.001
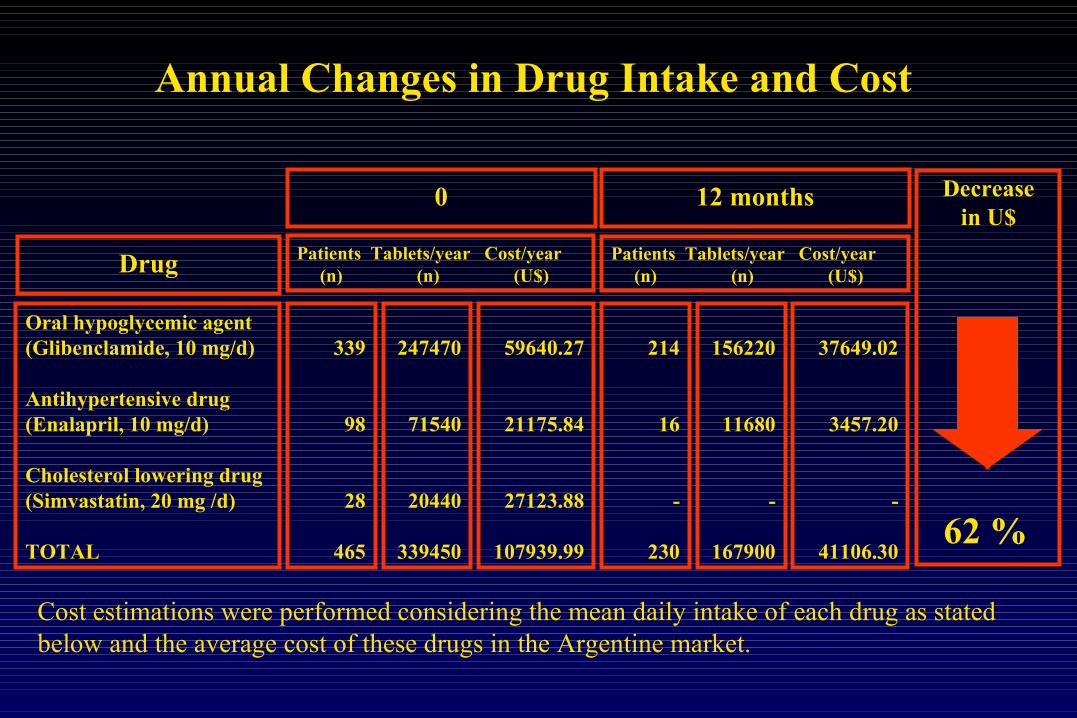
Oral hypoglycemic agent(Glibenclamide, 10 mg/d)
Antihypertensive drug(Enalapril, 10 mg/d)
Cholesterol lowering drug(Simvastatin, 20 mg /d)
TOTAL
339
98
28
465
247470
71540
20440
339450
214
16
-
230
156220
11680
-
167900
37649.02
3457.20
-
41106.30
59640.27
21175.84
27123.88
107939.99
Patients Tablets/year Cost/year (n) (n) (U$)Drug
0 12 months
Patients Tablets/year Cost/year (n) (n) (U$)
Decreasein U$
62 %
Cost estimations were performed considering the mean daily intake of each drug as stated below and the average cost of these drugs in the Argentine market.
Annual Changes in Drug Intake and Cost
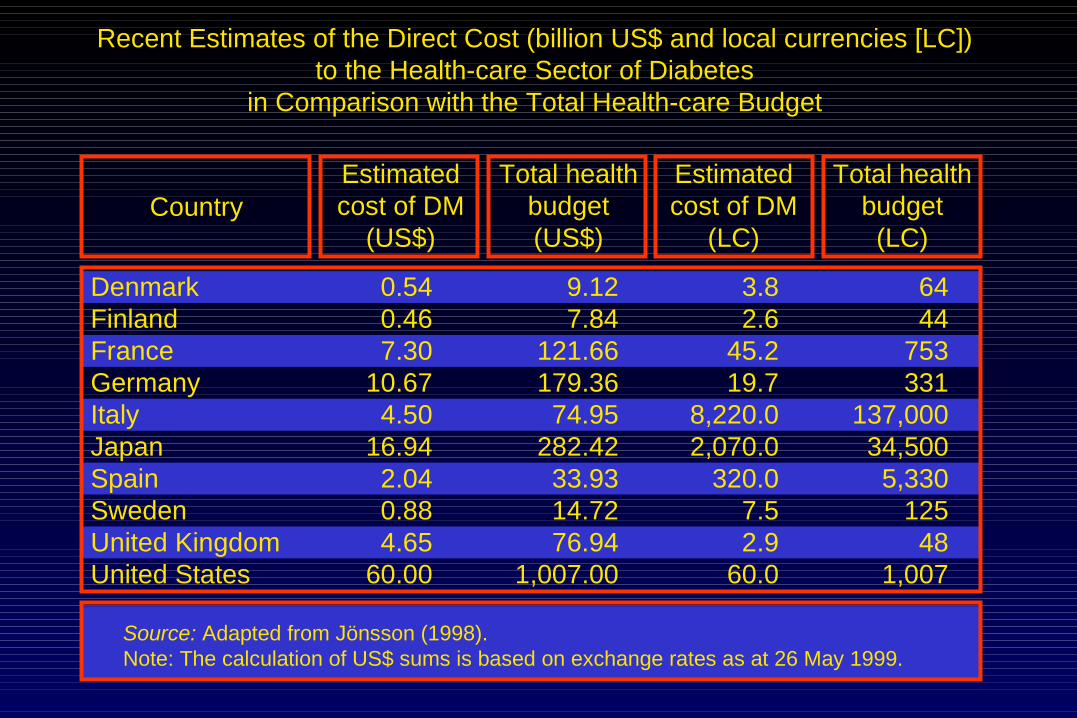
Recent Estimates of the Direct Cost (billion US$ and local currencies [LC])to the Health-care Sector of Diabetes
in Comparison with the Total Health-care Budget
DenmarkFinlandFranceGermanyItalyJapanSpainSwedenUnited KingdomUnited States
0.540.467.30
10.674.50
16.942.040.884.65
60.00
9.127.84
121.66179.36
74.95282.42
33.9314.7276.94
1,007.00
3.82.6
45.219.7
8,220.02,070.0
320.07.52.9
60.0
6444
753331
137,00034,500
5,330125
481,007
CountryEstimatedcost of DM
(US$)
Total healthbudget(US$)
Estimatedcost of DM
(LC)
Total healthbudget
(LC)
Source: Adapted from Jönsson (1998).Note: The calculation of US$ sums is based on exchange rates as at 26 May 1999.
Related Documents


![Atomic Physics at the Advanced Light Source [workshop rpt]](https://static.cupdf.com/doc/110x72/613c69d2f237e1331c51628f/atomic-physics-at-the-advanced-light-source-workshop-rpt.jpg)