Name of Municipality: Financial Year Covered by this Plan: 2012/2013 Financial Year Covered by this Report: 2011/2012 Last Day of the previous Financial Year: 30 June 2012 First Day of the Financial Year Covered by this Plan: 01 July 2012 Last Day of the Financial Year Covered by this Report: 30 June 2012 WORKPLACE SKILLS PLAN AND TRAINING REPORT submitted to the LGSETA in compliance with the Skills Development Act To qualify for a mandatory grant, employers must: Submit the WSP/ATR on the approved template Be registered with SARS and be contributing Skills Development Levy Submit their WSP/ATR on, or by 30 June each year, in terms of Skills Development Regulations Ensure tha the WSP contributes to the relevant SETA SSP Verify that the ATR reflects the implementation of the previous year’s WSP 4/6 Skeen Boulevard, Bedffordview 2007 ♦ P O Box 1964, Bedfordview 2008 ♦ Telephone (011) 456 8579, Facsimile (011) 450 4948 ♦ Email [email protected] ♦ Website www.lgseta.co.za

Welcome message from author
This document is posted to help you gain knowledge. Please leave a comment to let me know what you think about it! Share it to your friends and learn new things together.
Transcript

Name of Municipality:
Financial Year Covered by this Plan: 2012/2013
Financial Year Covered by this Report: 2011/2012
Last Day of the previous Financial Year: 30 June 2012
First Day of the Financial Year Covered by this Plan: 01 July 2012
Last Day of the Financial Year Covered by this Report: 30 June 2012
WORKPLACE SKILLS PLAN AND TRAINING REPORTsubmitted to the LGSETA in compliance with the Skills Development Act
To qualify for a mandatory grant, employers must:
Submit the WSP/ATR on the approved template
Be registered with SARS and be contributing Skills Development Levy
Submit their WSP/ATR on, or by 30 June each year, in terms of Skills Development Regulations
Ensure tha the WSP contributes to the relevant SETA SSP
Verify that the ATR reflects the implementation of the previous year’s WSP
4/6 Skeen Boulevard, Bedffordview 2007 ♦ P O Box 1964, Bedfordview 2008 ♦ Telephone (011) 456 8579, Facsimile (011) 450 4948 ♦ Email [email protected] ♦ Website www.lgseta.co.za

PLAN REPORTSignatories Signatories
Executive Summary - Workplace Skills Plan Executive Summary - Annual Training Report
Section 1: Details of Municipality for: Section 1: Details of Municipality for:
Section 1.1: Name and Type
Section 1.2: Standard Industrial Classification Codes
Section 1.4: Global figures Section 1.4: Global figures AR
Section 1.5: Proposed expenditure on training - Municipal Employees
Section 2: Primary Skills Development Facilitator Section 2: Primary Skills Development Facilitator
Section 3: Description of Municipality consultative process for: Section 3: Record of Consultation Process AR QR
Section 4: Employment profile
Section 4.1: Total number of employees in the enterprise as at: AR
Section 4.2: Number of new recruits employed during the year ending AR
Section 4.3: New labour market entrants employed during the year ending AR
Section 4.4: Number of interns given structured work experience during the year ending AR
Section 4.5: Number of 18.2 learners given structured work experience during the year ending AR
Section 4.6: Number of employees who left the enterprise in the year ending AR
Section 5: Employee qualification profile AR
Section 5.1: Employee qualification profile as at AR
Section 5.2: Process used to complete the qualification profile AR
Section 6: Strategic objectives and measures of success for Municipalities for the Financial Year:
Section 7: Sector Priority Skills Areas for the Financial Year:
Section 8: Proposed Programmes - Training for Municipal Employees during: Section 8: Programme Details - Training for Municipal Employees during AR QR
Section 9: Proposed Programmes - Training for the Unemployed during Section 9: Programme Details - Training for the Unemployed during AR
Section 10: Critical and Scarce Skills Section 10: Critical and Scarce Skills
Section 10.1 Department of Labour Critical and Scarce Skills in
Section 10.2 LGSETA Scarce Skills (Discretionary Grant Priority Areas) for Section 10.2 LGSETA Scarce Skills (Discretionary Grant Priority Areas) for AR
Section 11: Number of beneficiaries to receive ABET training during the Financial Year Section 11: Number of beneficiaries who received ABET during the Financial Year AR QR
Section 12: Number of beneficiaries to be trained during the Financial Year Section 12: Number of beneficiaries trained during the Financial Year AR
Section 13: Learnerships, skills programmes and apprenticeships planned for the Financial Year Section 13: Learnerships, skills programmes and apprenticeships implemented in the Financial Year AR
Section 14: Quality assurance - Providers to be used for planned training and development
activitiesSection 14: Quality assurance - Providers used for training and development activities AR
INDEX
Only if changes
Page 2

0
Signatories to this Workplace Skills Plan for the period:
L
1. Levy number L
2. Levy number L
3. Levy number L
4. Levy number L
5. Levy number L
Additional Levy Numbers
Name:
Signature:
For Organised Labour
Signatories
Name: Mr.GG Morapedi
Current
Job Title:
For the Training Committee, the Skills Development Facilitator
We, the undersigned, submit this information in fulfilment of this entity's legal obligations in terms
of the skills development legislation and regulations. We declare that, to the best of our
knowledge, the information contained in this Workplace Skills Plan is accurate and up to date.
For Organised Employers
Active Levy Number
Skills Development Facilitator
Acting Director:Corporate Services
Current
Job Title:
Signature:
Date:
Babsie Laastele
Date:
Date:
Name: Omphile Seshupo
Union
office held:
Date:
Union
office held:Bloemhof
Date:
Union: Samwu
Bloemhof
Signature:
Signature:
Union: Imatu
Name: Eric Mulder
Municipal Manager
Name: Mr Motlhaletsimang Andrew Makuapane
Signature:
2012/2013
Date WSP
presented
to Council
Page 3

Signatories to this Annual Training Report for the period:
L
1. Levy number L
2. Levy number L
3. Levy number L
4. Levy number L
5. Levy number L
Name: Omphile Seshupo
Current
Job Title:Acting Director:Corporate Services
Signature:
Date:
Union:
Union
office held:Bloemhof
Signature:
We, the undersigned, submit this information in fulfilment of this entity's legal obligations in terms
of the skills development legislation and regulations. We declare that, to the best of our
knowledge, the information contained in this Annual Training Report is accurate and up to date.
For the Training Committee, the Skills Development Facilitator
For Organised Employers
0
Active Levy Number
0
0
0
0
Additional Levy Numbers
#NAME?
Name: Mrs.Babsie Laastele
Date:
Name: Mr.GG Morapedi
Current
Job Title:Skills Development facilitator
Signature:
Date:
Union: Imatu
Samwu
Municipal Manager
Signature:
Date:
Name: Eric Mulder
Union
office held:Bloemhof
Date:
2011/2012
Name: Mr.Motlhaletsimang Andrew Makuapane
Signature:
Page 4

0
Executive Summary - Workplace Skills Plan 2012/2013
1. Total anticipated payroll for the year R 49 215 957.42
2. Total anticipated training spend for the year R 750 000.00
3. Total anticipated levy payment for the year R 492 159.57
4. Total Number of Employees in the Municipality
M F M F M F M F M F
6 3 1 1 0 0 2 1 9 5 14 0 0 0
4 0 0 0 0 0 3 0 7 0 7 0 0 0
5 2 0 1 0 0 0 0 5 3 8 0 0 0
12 0 4 0 0 0 0 0 16 0 16 0 0 0
4 2 0 0 0 0 3 2 7 4 11 0 0 0
20 8 5 2 0 0 1 2 26 12 38 1 1 2
29 8 13 0 0 0 2 0 44 8 52 0 0 0
87 13 16 3 0 0 0 0 103 16 119 0 0 0
0 0 0 0 0 0 0 0 0 0 0 0 0 0
167 36 39 7 0 0 11 5 217 48 265 1 1 2
5. Total Number of Employees to Receive Training
M F M F M F M F M F
7 2 1 1 0 0 2 1 10 4 14 0 0 0
4 0 0 0 0 0 0 0 4 0 4 0 0 0
5 2 0 1 0 0 0 0 5 3 8 0 0 0
11 0 0 0 0 0 0 0 11 0 11 0 0 0
3 2 0 0 0 0 2 2 5 4 9 0 0 0
18 8 4 2 0 0 1 2 23 12 35 1 1 2
0 0 0 0 0 0 0 0 0 0 0 0 0 0
26 13 2 3 0 0 0 0 28 16 44 0 0 0
0 0 0 0 0 0 0 0 0 0 0 0 0 0
74 27 7 7 0 0 5 5 86 39 125 1 1 2
6. Percentage of Total Employees to Receive Training
100%
57%
100%
69%
82%
92%
0%
37%
#DIV/0!
47%
Race PWD
African Coloured Indian White TotalM F Total
SOC 100 Legislators
Total
SOC 500 Clerical and Administrative Workers
SOC 400 Community and Personal Service Workers
SOC 300 Technicians and Trade Workers
SOC 100 Directors and Corporate Managers
SOC 200 Professionals
Employment category
SOC 800 Labourers
Apprentices
Total Employees
SOC 700 Machine Operators and Drivers
SOC 700 Machine Operators and Drivers
SOC 700 Machine Operators and Drivers
SOC 800 Labourers
Apprentices
TOTALS
SOC 300 Technicians and Trade Workers
SOC 500 Clerical and Administrative Workers
Total
SOC 100 Legislators
SOC 100 Directors and Corporate Managers
SOC 200 Professionals
SOC 500 Clerical and Administrative Workers
Total M
SOC 200 Professionals
SOC 300 Technicians and Trade Workers
SOC 800 Labourers
SOC 400 Community and Personal Service Workers
PWD
Employment category Total
SOC 400 Community and Personal Service Workers
Indian White Total
SOC 100 Legislators
F
SOC 100 Directors and Corporate Managers
Apprentices
TOTALS
African ColouredEmployment category
Race
Page 5

7. IDP/Municipal Training Objectives
1
2
3
4
5
6
7
8
9
10
11
0To ensure that the municipality has a To ensure appointment of LED manager
0
0
0 0 0 0
0 0 0
0
0
0 0 0 00 0 0 0
0 0
0 0
0 0 0
0 0 0
0
0
0
0
0
0 0 0 0
0
0
0 0 0
0
0
0 0 0 0
0
0
0 0 0 0 0
0 0 0
0
0 0 0
0 0 0
0 0
0
0
0 0
0
Municipal transformation,institutional development and labour
matter
Build and strengthen the financial management of the municipality
to enhance service delivery
To deliver sustainable essential services such as
water,sanitation,electricity and roads for lekwa-teemane
communities
0
0
0 0 0
0
0
0 0 0 0
0
0
0 0 0
0 0 0
0 0
0
0
0 0 0 0
0 0 0
0
0 0 0 0
0 0 0
0 0
0 0 0
00 0 0
0 0 0
0 0 0
0
0
0 0 0 0
0 0 0
0
0
0 0 0 0
To ensure that the municipality is properly marketed To ensure that the municipality is 0
0
0 0
0
0
0 0 0 0
To ensure appointment of a qualified electrician To ensure that the municipality has a 0
0
maintained internal roads on a regular basis To ensure that the municipality has qualified 0 0
managed and monitored water quality To ensure he municipality has qualified 0
0
0 0 0 0
To ensure functional budget and treasury To capacitate the budget and treasury 0
0
To ensure functional debt collection and credit To capacitate the debt collectionand credit 0 0
To enhance efficient and effective financial To develop cash flow management model 0
0
To capacitate supply chain management unit To review and update the SCM policy 0 0
0 0 0
0
0 0 0 0
To ensure profetional drafting of municipal To capacitate municipal employees on 0
0
To promote transformation through stakeholder To strengthen institutional working relations 0 0
To promote community participation on municipal To strengthen the involvement of community 0
To promote the programs of HIV AIDS in the 0
To conduct campaigs on illegal dumping
IDP objectivesOperational context
Municipal Objectives
Enabling context
Training & Skills Dev Objectives
Transformation context
Employment Equity Objectives
Educate and sensitise communities on potential threads and
hazards
0 0
Primary skills needs addressed in
terms of the Sector Skills Plan
0 0 0 0
0
To ensure that municipal employees are 0 0
To ensure that municipal employees are aware of
0 0
0 0 0 0
Page 6

12
13
14
15
16
17
18
0 0 0 0
0 0 0
0
0
0
0
0
0 0
0
0
0 0 0 0
0 0 0
0
0
00
0
0
0 0 0 0
0
0
0
0 0 0 0
0
0 0 0
0 0 0 0
0
0 0 0
0
0
0 0 0 0
0 0 0
0 0
0 0 0 0
0 0 0 0
0 0 0 0
0
0 0 0 0 0
0 0 0 0
0
0 0 0 0
0
0
0 0 0 00 0 0 0
0 0
0 0 0
0 0 0 0
0 0 0 0
0 0 0 0
0
0 0 0 0 0
0 0 0 0
0
0 0 0 0
0
0 0 0 00 0 0 0
0 0 0
0 0 0
Page 7

0
Executive Summary - Annual Training Report 2011/2012
1. Total actual payroll for the year R 0.00
1(a) Difference between anticipated and actual payroll R 49 215 957.42
2. Total actual training spend for the year R 0.00
2(a) Difference between anticipated and actual training spend R 750 000.00
3. Total actual levy payment for the year R 492 159.57
3(a) Difference between anticipated and actual levy payment -R 492 159.57
4. Total Number of Employees in the Municipality
M F M F M F M F M F
6 3 1 1 0 0 2 1 9 5 14 0 0 0
4 0 0 0 0 0 3 0 7 0 7 0 0 0
5 2 0 1 0 0 0 0 5 3 8 0 0 0
12 0 4 0 0 0 0 0 16 0 16 0 0 0
4 2 0 0 0 0 3 2 7 4 11 0 0 0
20 8 5 2 0 0 1 2 26 12 38 1 1 2
29 8 13 0 0 0 2 0 44 8 52 0 0 0
87 13 16 3 0 0 0 0 103 16 119 0 0 0
0 0 0 0 0 0 0 0 0 0 0 0 0 0
167 36 39 7 0 0 11 5 217 48 265 1 1 2
5. Total Number of Employees who Received Training
M F M F M F M F M F
6 3 1 1 0 0 2 1 9 5 14 0 0 0
3 0 1 0 0 0 0 0 4 0 4 0 0 0
5 2 0 1 0 0 0 0 5 3 8 0 0 0
0 0 0 0 0 0 0 0 0 0 0 0 0 0
0 1 0 0 0 0 0 1 0 2 2 0 0 0
3 6 0 0 0 0 0 1 3 7 10 1 1 2
7 8 3 0 0 0 0 0 10 8 18 0 0 0
3 0 0 0 0 0 0 0 3 0 3 0 0 0
0 0 0 0 0 0 0 0 0 0 0 0 0 0
27 20 5 2 0 0 2 3 34 25 59 1 1 2
6. Percentage of Total Employees who Received Training
100%
57%
100%
0%
18%
26%
35%
3%
#DIV/0!
#DIV/0!
TOTALS
Apprentices
SOC 700 Machine Operators and Drivers
SOC 100 Directors and Corporate Managers
African ColouredEmployment category
SOC 100 Legislators
Apprentices
Race
SOC 800 Labourers
SOC 400 Community and Personal Service Workers
PWD
Employment category Total
SOC 400 Community and Personal Service Workers
Indian White TotalTotal
SOC 100 Legislators
SOC 100 Directors and Corporate Managers
SOC 200 Professionals
SOC 500 Clerical and Administrative Workers
Total M
SOC 200 Professionals
SOC 300 Technicians and Trade Workers
F
TOTALS
SOC 700 Machine Operators and Drivers
SOC 500 Clerical and Administrative Workers
SOC 800 Labourers
Apprentices
TOTALS
SOC 800 Labourers
SOC 300 Technicians and Trade Workers
F
SOC 100 Legislators
Total
SOC 500 Clerical and Administrative Workers
SOC 400 Community and Personal Service Workers
SOC 300 Technicians and Trade Workers
SOC 100 Directors and Corporate Managers
SOC 200 Professionals
Employment category Total
SOC 700 Machine Operators and Drivers
Race PWD
African Coloured Indian White TotalM
Page 8

7. LGSETA Scarce Skills
0
0
0
0
0
0
0
0
0
0
0
0
0
0
0
0
0
0
0
0
0
0
15
0
0
0
0
0
0
0
0
0
0
0
0
0
0
0
0
0
0
0
0
0
0
0
0
0
0
0
0
0
0
0
0
0
0
0
0
0
0
0
0
0
0
0
75
0
0
0
0
0
0
0
0
0
0
0
0
0
0
0
40
0
0
0
20
0
Actual No. of
BeneficiariesDifference
0
0
0
0
Municipal Leadership Development 0 0
ABET 0 0
Municipal Leadership Development 0 0
Municipal Leadership Development 0 0
Councillors 0 0
Councillors 0 0
Training Committees 0 0
Councillors 0 0
LED 0 0
Management and Leadership Training Committees 0 0
Training Committees 0 0
LED 0 0
LED 0 0
IDPs 0 0
IDPs 0 0
Planning 0 0
IDPs 0 0
Planning 0 0
Planning 0 0
Community Based Participation and Planning Ward Committees Skills Programme 60
Ward Committees 0 0
Ward Committees 0 0
Municipal Finance 0 0
Municipal Finance 0 0
Audit and Procurement 0 0
Municipal Finance 0 0
Audit and Procurement 0 0
Audit and Procurement 0 0
Financial Viability Property Valuation 0 0
Property Valuation 0 0
Property Valuation 0 0
Roads 0 0
Roads 0 0
Water services 0 0
Roads 0 0
Water services 0 0
Water services 0 0
Electricity reticulation 0 0
Electricity reticulation learnership 40
Labour intensive construction (EPWP) 0 0
Electricity reticulation 0 0
Labour intensive construction (EPWP) 0 0
Labour intensive construction (EPWP) learnership 20
Infrastructure and service delivery Infrastructure asset maintenance 0 0
Infrastructure asset maintenance 0 0
Infrastructure asset maintenance 0 0
Strategic Priority Area: Project Name: Mode of delivery:Planned No. of
Beneficiaries
Page 9

0
PLANNING
Section 1: Details of Municipality for: 2012/2013
91201
91202
91203
91204
50493
Section 1.2: Standard Industrial Classification Codes
Select the SIC code/s relevant to your Municipality (select at least one) - refer to guidelines for
SIC code definitions. If the category is relevant to your Municipality choose YES from the drop
down menu.
Section 1.1: Name and Type
1.1.1 Name of Municipality
Enter the name of your Municipality
Lekwa-Teemane Municipality
1.1.2 Provincial location
Select the provincial location of your Municipality North West
1.1.4 Municipality type
Select a type of Municipality
1.1.3 Demarcation code
Enter the demarcation code of your Municipality NW 396
B
Yes
Please list any additional SIC codes which are covered by your Municipality, but which may
not be listed above
Section 1.3: Contact details of the CFO
Fax:
e-Mail:
Postal Address:
P O Box 13,Christiana 2680
534 413 735
First name:
Surname:
Tel: 534 413 952
Jerry
Riekert
Page 10

1.4.1 Total
anticipated no of
employees on:
Amount to be
spent
R 750 000.00
TOTAL to be spent
Other (specify)
Loan funding to the Municipality (for
capacity building)
R 750 000.00
1.4.7 Full-time
(salaried)
Councillors
14
Note the SALGA HRD conference resolution (10-14 March 2006) which encourages
municipalities to budget and spend on training more than the 1% stipulated in legislation.
Comment/Notes
1.4.5 Contract
workers
SALGA or Trade Unions
2
2012/2013
Bursaries and/or Educational Assistance
Programmes
Mandatory grant funds
Discretionary grant funds
Municipal Training over and above levy
payments
Donor funds
Government department funds (MIG, EPWP
etc)
265 R 49 215 957.42
21.4.4 Casual
workers40
Section 1.4: Global figures
Amount to be
spentComment/Notes
1.4.8 Total
Councillors14
Section 1.6: Proposed expenditure on training - unemployed people
Source
TOTAL anticipated Levy Payment R 492 159.57
Section 1.5: Proposed expenditure on training - Municipal Employees
1.4.9 Number of skills development facilitators, including primary SDF
01 July 2012
1.4.2 Total anticipated payroll
amount (on which levy
payment is based) for:
2012/2013
Source
Proposed expenditure on training (excluding subsistence & travel) for the period:
1.4.6 Part-time
Councillors
Of the total anticipated number of employees, how many will be:
1.4.3 Persons with
disabilities
Donor funds
Municipal funds
TOTAL to be spent R 0.00
Other (specify)
Page 11

REPORTING - Annual Report Only 2011/2012
TOTAL spent
Donor funds
Other (specify)
30 June 2012
1.4.2 Total actual payroll
amount (on which levy
payment is based) for:
2011/2012
R 0.00
Section 1.6: Actual expenditure on training - unemployed people
SourceAmount
spentComment/Notes
TOTAL spent R 1 003 933.91
TOTAL actual Levy Payment R 446 110.05
SALGA or Trade Unions
Other (specify)
Loan funding to the Municipality (for
capacity building)
Municipal Training over and above levy
paymentsR 749 723.09
Donor funds
Amount Spent Comment/Notes
Mandatory grant funds R 239 210.82
Discretionary grant funds R 15 000.00
40
1.4.6 Part-time
Councillors
1.4.7 Full-time
(salaried) 14
1.4.8 Total
Councillors
1.4.5 Contract
workers
Source
Section 1.4: Global figures
265
Bursaries and/or Educational Assistance
Programmes
Government department funds (MIG, EPWP
etc)
Municipal funds
R 44 611 005.00
Of the total number of employees, how many are:
1.4.3 Persons with
disabilities2
1.4.4 Casual
workers
14
1.4.9 Number of skills development facilitators, including primary SDF
Note the SALGA HRD conference resolution (10-14 March 2006) which encourages
municipalities to budget and spend on training more than the 1% stipulated in legislation.
2011/2012
2
Section 1.5: Actual expenditure on training - Municipal Employees
Proposed expenditure on training (excluding subsistence & travel) for the period:
Page 12

0
PLANNING 2012/2013
Section 2: Primary Skills Development Facilitator
2.16 Highest Qualification NQF Level 4
SDF short course Yes
Specify if Other2.15 SDF works with: Training Committee
2.17 Training Programmes
completed that assist in
performance of SDF role
Final year:Bachelors Degree:Human Resource Development
2.14 Current job title Skills Development Facilitator
P O Box 13
Christiana
2.10 Race Coloured
2.13 Appointment procedureAppointed by
employer
Postal code Postal code2680
2.11 Gender Female
2.12 Primary SDF is disabled No
2680
Cnr Robyn & Dirkie Uys Str
053 Number
053 Number 433 1442
2.8 Postal address 2.9 Physical address
433 1018
2.6 Fax number Code
2.5 Telephone number Code
Some of the fields below have drop down menus. Please check and choose the relevant response
77110606930872.1 Date appointed as SDF
05 January 2006
2.3 First names Patricia Babsy 2.4 Surname
2.2 ID Number
Christiana Municipal Building
Christiana
Laastele
Yes
Education, Training and Development Practitioner (ETDP) Yes
Other (please list):
Certificate in Project Management
Moderator & Verifier Training
Certificate in HR Management
Assessor,Mentor & Coaching Training
SDF qualification Yes
Conducting skills audits
2.7 E-mail address
Note that every Municipality is required to nominate a Skills Development Facilitator from amongst its
full-time employees. Even if a consultant performs many of the SDF functions, there must be someone
in the Municipality who is accountable for skills development activities and with whom the LGSETA can
liaise.
2.20 Does your Municipality
have an HRD and Training
Policy, and if so, when was it
approved by the Council?
Yes
2.18 Number of SDF Forums
that the SDF has attended in
the previous year?
3
2.19 What support do you
require from the LGSETA?
Financial Support
Page 13

REPORTING 2011/2012
Update only if the primary SDF details change during the year
Section 2: Primary Skills Development Facilitator
Lastele
2.1 Date appointed as SDF 05 January 2006 2.2 ID Number 7711060693087
2.8 Postal address 2.9 Physical address
433 1018
2.6 Fax number Code 053 Number 433 1442
2.5 Telephone number Code
P O Box 13 Cnr Robyn & Dirkie Uys
Christiana Christiana Municipal Building
Christiana
Postal code 2680 Postal code 2680
Some of the fields below have drop down menus. Please check and choose the relevant response.
2.10 Race Coloured 2.11 Gender Female
2.14 Current job title Skills Development facilitator
2.12 Primary SDF is disabled No 2.13 Appointment procedureAppointed by
employer
Yes
2.15 SDF works with: Training Committee Specify if Other
2.16 Highest Qualification NQF Level 4
SDF short course
2.17 Training Programmes
completed that assist in
performance of SDF role
SDF qualification
Other (please list):
Certificate in HR Management
Yes
Conducting skills audits Yes
Education, Training and Development Practitioner (ETDP) Yes
Assessor,Mentor,coaching training
Moderator & Verifier training
Certificate in Project Management
Final year :Bachelors degree:Human Resource Development
2.7 E-mail address
Note that every Municipality is required to nominate a Skills Development Facilitator from amongst its
full-time employees. Even if a consultant performs many of the SDF functions, there must be someone
in the Municipality who is accountable for skills development activities and with whom the LGSETA can
liaise.
053 Number
2.3 First names Patricia Babsy 2.4 Surname
Page 14

0
PLANNING REPORTING - Quarterly and Annual Report 2011/2012
Section 3: Description of Municipality consultative process for: 2012/2013
Yes Number of Meetings 1 Number of Meetings 1 Number of Meetings Number of Meetings 1 Total Meetings 3
Yes
Summary of problems
10
Yes
Yes Yes
Yes Yes
Yes
Employer
Management
Management
Management
Shop-Steward
Shop-Steward
Imatu
Samwu
Human Resource Manager
Director Community Services
Acting CFO
Shop-Steward
Management
Imatu
Pearl Masendi
Imatu 10 Eric Mulder
L Hottie
M Bogosi
Trade union name% members of total
workforceRepresentative's name
Samwu 90 O Seshupo
Email Other (specify)
3.7 Registered trade unions
3.6 Form of communication with staff about training and development and the Plan and Report If the
category is relevant to your enterprise choose YES from the drop down menu
Word of mouth Notice boards
Newsletter No communication
Through supervisors Mass meetings
Pay slips Smaller meetings
3.5 How often did consultative
meetings take place?Every two months
Other (specify) Once a Quarter
Workshops
3.4 Process of developing the Plan and Report
Indicate the type of process (required information)Informal meetings Formal meetings
3.3 Members who sit on other consultative structures
Indicate the number of people who sit on the skills development consultative structure AS WELL AS on the local
labour forum and the EE committeeThe local labour forum The Employment Equity committee
Samwu
Management
Mr Leon Hottie
Mrs.Babsie Laastele
Shop-Steward
SDF
Pearl Masendi
Ms Omphile Seshupo
Name Position
Mr Phelindaba Yanta
Mr Serame Lesie
Mr Jerry Riekert
Mr Eric Mulder
Councillor
Acting Director Corporate Services
Representing ….
Mr G Modise
Mr G Morapedi
Trade Union
Training Committee
Local Labour Forum
Staff Committee
No consultation
Other (specify)
3.2 Members of consultative structure
Indicate the members of the consultative structure
3.1 Type of consultative structure
Indicate the type of consultative structures involved in compiling this Plan
Skills Development Committee
Section 3: Record of Consultation Process
First Quarter Second Quarter Third Quarter Fourth Quarter Annual Report
Mr.Jerry Riekert
Ms. Omphile Seshupo
Mr.Leon Hottie
Mr.Eric Mulder
3.3 Comments on the Functioning of the Consultative Forum (eg how is it functioning. If problems, what?)
3.1 Total Number of Meetings of Consultative Forum Meetings Held
3.2 New Members Appointed to the Consultative Forum inc. org they represent ALL new members appointed
Ms.Pearl Masendi
Page 15

0
Section 4: Employment profile
Section 4.1: Total number of employees in the enterprise as at:Do not enter 0 into the fields below - only use a field if the number is 1 or greater.
M F M F M F M F M F M F M F M F M F M F M F
Executive Mayor 0 0 0 0 0 0 0
Mayor 1 0 1 1 1 0 1 1 0
Local Government Legislators (Councillors) 6 2 1 1 2 1 9 4 13 2 1 5 2 3 9 4 13 0
Traditional Leaders & Heads of Villages 0 0 0 0 0 0 0
Other (specify below)
Ward Committee Members 0 0 0
0 0 0 0 0 0 0
6 3 1 1 0 0 2 1 9 5 14 0 0 0 0 2 1 5 1 2 3 9 5 14 0 0 0
11131 City/Municipal Manager 1 1 0 1 1 1 0 1 0
11133 General Managers 0 0 0 0 0 0 0
1211 Corporate Services Managers 0 0 0 0 0 0 0
1212 Finance Managers 3 3 0 3 3 3 0 3 0
1213 Human Resource Managers 1 1 0 1 1 1 2 0 2 0
1214 Policy and Planning Managers 2 2 0 2 1 1 0 1 0
1221 Engineering Managers 0 0 0 0 0 0 0
1222 Construction Managers 0 0 0 0 0 0 0
1231 ICT Managers 0 0 0 0 0 0 0
1251 Health, Welfare and Education Service Managers 0 0 0 0 0 0 0
12922 Commissioned Fire Officer 0 0 0 0 0 0 0
12923 Commissioned Police Officer (Metro/Traffic Police) 0 0 0 0 0 0 0
12991 Laboratory Managers 0 0 0 0 0 0 0
12992 Environment, Parks and Land Care Managers 0 0 0 0 0 0 0
12993 Sports Administrator or Manager 0 0 0 0 0 0 0
12994 Arts Administrator or Managers 0 0 0 0 0 0 0
1491 Sport and Recreation Managers 0 0 0 0 0 0 0
1492 Customer Services Managers 0 0 0 0 0 0 0
Other (specify below)
0 0 0 0 0 0 0
4 0 0 0 0 0 3 0 7 0 7 0 0 1 0 1 0 2 0 3 0 7 0 7 0 0 0
Core Admin 0 0 0 0 0 0 0
Core Finance 0 0 0 0 0 0 0
Legal 0 0 0 0 0 0 0
IT 0 0 0 0 0 0 0Procurement 0 0 0 0 0 0 0
1 0 1 1 1 0 1 1 0
Property Valuation 1 0 1 1 1 0 1 1 0
Rates 0 0 0 0 0 0 0
Billing 1 1 0 1 1 0 1 1 0Client Services 4 1 4 1 5 3 1 1 4 1 5 0
Parks 0 0 0 0 0 0 0
Community Facilities 0 0 0 0 0 0 0
Libraries 0 0 0 0 0 0 0
Recreation Centres 0 0 0 0 0 0 0
Primary Health Care Facilities 0 0 0 0 0 0 0
Cemeteries 0 0 0 0 0 0 0
Environmental Health 0 0 0 0 0 0 0
Pollution Control 0 0 0 0 0 0 0
By-laws 0 0 0 0 0 0 0
Licensing 0 0 0 0 0 0 0
Fire & rescue 0 0 0 0 0 0 0
Disaster Planning and Management 0 0 0 0 0 0 0
Public Safety 0 0 0 0 0 0 0
Traffic Management 0 0 0 0 0 0 0
0 0 0 0 0 0 0
LED/IDP/Urban Planning 0 0 0 0 0 0 0
Land use management 0 0 0 0 0 0 0
0 0 0 0 0 0 0
Roads and Stormwater 0 0 0 0 0 0 0
Solid Waste and Landfill 0 0 0 0 0 0 0
Water supply and waste water 0 0 0 0 0 0 0
Electricity 0 0 0 0 0 0 0
5 2 0 1 0 0 0 0 5 3 8 0 0 0 0 3 2 1 2 0 0 4 4 8 0 0 0
30 June 2012
- 20Total
Indian White
Race Age categories
41-50
Corporate
Services
HR and Training
Technical
Services
Community
Safety
TotalTotal
SOC 200 Professionals
Community
Services
Legal
Emergency
Services
SOC 100 Directors and Corporate Managers
SOC 100 Legislators
Coloured 21-30African 31-40
REPORTING - Annual Report Only
SUB-TOTALS
Employment category Code TotalTotal
+ 51
PWD
M F
SUB-TOTALS
SUB-TOTALS
Public Transport
Municipal
Planning
Housing
Environmental
Management
Financial
Services
Page 16

Section 4: Employment profile
Section 4.1: Total number of employees in the enterprise as at:Do not enter 0 into the fields below - only use a field if the number is 1 or greater.
M F M F M F M F M F M F M F M F M F M F M F
30 June 2012
- 20Total
Indian White
Race Age categories
41-50Total
Total
SOC 100 Legislators
Coloured 21-30African 31-40
REPORTING - Annual Report Only
Employment category Code TotalTotal
+ 51
PWD
M F
Core Admin 0 0 0 0 0 0 0
Core Finance 0 0 0 0 0 0 0
Legal 0 0 0 0 0 0 0
IT 0 0 0 0 0 0 0Procurement 0 0 0 0 0 0 0
0 0 0 0 0 0 0
Property Valuation 0 0 0 0 0 0 0
Rates 0 0 0 0 0 0 0
Billing 0 0 0 0 0 0 0Client Services 0 0 0 0 0 0 0
Parks 0 0 0 0 0 0 0
Community Facilities 0 0 0 0 0 0 0
Libraries 0 0 0 0 0 0 0
Recreation Centres 0 0 0 0 0 0 0
Primary Health Care Facilities 0 0 0 0 0 0 0
Cemeteries 0 0 0 0 0 0 0
Environmental Health 0 0 0 0 0 0 0
Pollution Control 0 0 0 0 0 0 0
By-laws 0 0 0 0 0 0 0
Licensing 0 0 0 0 0 0 0
Fire & rescue 0 0 0 0 0 0 0
Disaster Planning and Management 0 0 0 0 0 0 0
Public Safety 0 0 0 0 0 0 0
Traffic Management 0 0 0 0 0 0 0
0 0 0 0 0 0 0
LED/IDP/Urban Planning 0 0 0 0 0 0 0
Land use management 0 0 0 0 0 0 0
0 0 0 0 0 0 0
Roads and Stormwater 12 4 16 0 16 3 6 7 16 0 16 0
Solid Waste and Landfill 0 0 0 0 0 0 0
Water supply and waste water 0 0 0 0 0 0 0
Electricity 0 0 0 0 0 0 0
12 0 4 0 0 0 0 0 16 0 16 0 0 0 0 3 0 6 0 7 0 16 0 16 0 0 0
Core Admin 0 0 0 0 0 0 0
Core Finance 0 0 0 0 0 0 0
Legal 0 0 0 0 0 0 0
IT 0 0 0 0 0 0 0Procurement 0 0 0 0 0 0 0
0 0 0 0 0 0 0
Property Valuation 0 0 0 0 0 0 0
Rates 0 0 0 0 0 0 0
Billing 0 0 0 0 0 0 0Client Services 0 0 0 0 0 0 0
Parks 0 0 0 0 0 0 0
Community Facilities 0 0 0 0 0 0 0
Libraries 1 2 0 3 3 1 2 0 3 3 0
Recreation Centres 0 0 0 0 0 0 0
Primary Health Care Facilities 0 0 0 0 0 0 0
Cemeteries 0 0 0 0 0 0 0
Environmental Health 0 0 0 1 1 0 1 0
Pollution Control 0 0 0 0 0 0 0
By-laws 0 0 0 0 0 0 0
Licensing 1 1 2 0 2 0 0 0 0
Fire & rescue 0 0 0 0 0 0 0
Disaster Planning and Management 0 0 0 0 0 0 0
Public Safety 0 0 0 0 0 0 0
Traffic Management 3 1 2 5 1 6 1 2 2 5 0 5 0
0 0 0 0 0 0 0
LED/IDP/Urban Planning 0 0 0 0 0 0 0
Land use management 0 0 0 0 0 0 0
0 0 0 0 0 0 0
Roads and Stormwater 0 0 0 0 0 0 0
Solid Waste and Landfill 0 0 0 0 0 0 0
Water supply and waste water 0 0 0 0 0 0 0
Electricity 0 0 0 0 0 0 0
4 2 0 0 0 0 3 2 7 4 11 0 0 1 0 3 1 0 0 2 2 6 3 9 0 0 0
HR and Training
Housing
Technical
Services
Community
Safety
Legal
Emergency
Services
Municipal
Planning
Housing
Corporate
Services
Technical
Services
SUB-TOTALS
Municipal
Planning
Environmental
Management
Legal
SOC 400 Community and Personal Service Workers
SOC 300 Technicians and Trade Workers
Financial
Services
Community
Services
Emergency
ServicesCommunity
Safety
Public Transport
Public Transport
Corporate
Services
HR and Training
Financial
Services
Community
Services
Environmental
Management
SUB-TOTALS
Page 17

Section 4: Employment profile
Section 4.1: Total number of employees in the enterprise as at:Do not enter 0 into the fields below - only use a field if the number is 1 or greater.
M F M F M F M F M F M F M F M F M F M F M F
30 June 2012
- 20Total
Indian White
Race Age categories
41-50Total
Total
SOC 100 Legislators
Coloured 21-30African 31-40
REPORTING - Annual Report Only
Employment category Code TotalTotal
+ 51
PWD
M F
Core Admin 3 3 1 3 4 7 1 2 1 1 1 1 2 5 7 1 1 2
Core Finance 0 0 0 0 0 0 0
Legal 0 0 0 0 0 0 0
IT 0 0 0 0 0 0 0Procurement 0 0 0 0 0 0 0
0 0 0 0 0 0 0
Property Valuation 0 0 0 0 0 0 0
Rates 1 1 1 1 2 2 0 2 2 0
Billing 4 3 3 1 1 1 8 5 13 4 2 3 1 3 7 6 13 0Client Services 10 1 1 1 11 2 13 1 1 4 2 4 1 9 4 13 0
Parks 0 0 0 0 0 0 0
Community Facilities 0 0 0 0 0 0 0
Libraries 0 0 0 0 0 0 0
Recreation Centres 0 0 0 0 0 0 0
Primary Health Care Facilities 0 0 0 0 0 0 0
Cemeteries 0 0 0 0 0 0 0
Environmental Health 0 0 0 0 0 0 0
Pollution Control 0 0 0 0 0 0 0
By-laws 0 0 0 0 0 0 0
Licensing 2 1 3 0 3 2 1 3 0 3 0
Fire & rescue 0 0 0 0 0 0 0
Disaster Planning and Management 0 0 0 0 0 0 0
Public Safety 0 0 0 0 0 0 0
Traffic Management 0 0 0 0 0 0 0
0 0 0 0 0 0 0
LED/IDP/Urban Planning 0 0 0 0 0 0 0
Land use management 0 0 0 0 0 0 0
0 0 0 0 0 0 0
Roads and Stormwater 0 0 0 0 0 0 0
Solid Waste and Landfill 0 0 0 0 0 0 0
Water supply and waste water 0 0 0 0 0 0 0
Electricity 0 0 0 0 0 0 0
20 8 5 2 0 0 1 2 26 12 38 0 0 2 3 10 5 9 3 0 6 21 17 38 1 1 2
Core Admin 1 1 0 1 1 1 0 1 0
Core Finance 0 0 0 0 0 0 0
Legal 0 0 0 0 0 0 0
IT 0 0 0 0 0 0 0Procurement 0 0 0 0 0 0 0
0 0 0 0 0 0 0
Property Valuation 0 0 0 0 0 0 0
Rates 0 0 0 0 0 0 0
Billing 0 0 0 0 0 0 0Client Services 0 0 0 0 0 0 0
Parks 7 6 13 0 13 8 5 13 0 13 0
Community Facilities 7 1 8 0 8 3 5 8 0 8 0
Libraries 0 0 0 0 0 0 0
Recreation Centres 0 0 0 0 0 0 0
Primary Health Care Facilities 0 0 0 0 0 0 0
Cemeteries 8 3 11 0 11 3 7 1 11 0 11 0
Environmental Health 0 0 0 0 0 0 0
Pollution Control 0 0 0 0 0 0 0
By-laws 0 0 0 0 0 0 0
Licensing 0 0 0 0 0 0 0
Fire & rescue 0 0 0 0 0 0 0
Disaster Planning and Management 0 0 0 0 0 0 0
Public Safety 0 0 0 0 0 0 0
Traffic Management 0 0 0 0 0 0 0
0 0 0 0 0 0 0
LED/IDP/Urban Planning 0 0 0 0 0 0 0
Land use management 0 0 0 0 0 0 0
0 0 0 0 0 0 0
Roads and Stormwater 0 0 0 0 0 0 0
Solid Waste and Landfill 0 0 0 0 0 0 0
Water supply and waste water 7 8 3 1 11 8 19 1 5 5 2 2 1 3 11 8 19 0
Electricity 0 0 0 0 0 0 0
29 8 13 0 0 0 2 0 44 8 52 0 0 1 5 9 2 20 1 14 0 44 8 52 0 0 0
Environmental
Management
Housing
Corporate
Services
Community
Services
Financial
Services
SUB-TOTALS
Emergency
Services
Environmental
Management
SOC 500 Clerical and Administrative Workers
SOC 700 Machine Operators and Drivers
Corporate
Services
HR and Training
Legal
Technical
Services
Financial
Services
Community
Services
Housing
Technical
Services
SUB-TOTALS
Municipal
Planning
Community
Safety
Public Transport
Municipal
Planning
HR and Training
Legal
Emergency
ServicesCommunity
Safety
Public Transport
Page 18

Section 4: Employment profile
Section 4.1: Total number of employees in the enterprise as at:Do not enter 0 into the fields below - only use a field if the number is 1 or greater.
M F M F M F M F M F M F M F M F M F M F M F
30 June 2012
- 20Total
Indian White
Race Age categories
41-50Total
Total
SOC 100 Legislators
Coloured 21-30African 31-40
REPORTING - Annual Report Only
Employment category Code TotalTotal
+ 51
PWD
M F
Core Admin 3 12 3 3 15 18 2 3 7 6 3 15 18 0
Core Finance 0 0 0 0 0 0 0
Legal 0 0 0 0 0 0 0
IT 0 0 0 0 0 0 0Procurement 0 0 0 0 0 0 0
0 0 0 0 0 0 0
Property Valuation 0 0 0 0 0 0 0
Rates 0 0 0 0 0 0 0
Billing 0 0 0 0 0 0 0Client Services 0 0 0 0 0 0 0
Parks 18 5 23 0 23 6 7 10 23 0 23 0
Community Facilities 19 2 21 0 21 3 7 2 9 21 0 21 0
Libraries 0 0 0 0 0 0 0
Recreation Centres 0 0 0 0 0 0 0
Primary Health Care Facilities 0 0 0 0 0 0 0
Cemeteries 14 3 17 0 17 5 12 17 0 17 0
Environmental Health 0 0 0 0 0 0 0
Pollution Control 0 0 0 0 0 0 0
By-laws 0 0 0 0 0 0 0
Licensing 0 0 0 0 0 0 0
Fire & rescue 1 1 0 1 1 1 0 1 0
Disaster Planning and Management 0 0 0 0 0 0 0
Public Safety 0 0 0 0 0 0 0
Traffic Management 0 0 0 0 0 0 0
0 0 0 0 0 0 0
LED/IDP/Urban Planning 0 0 0 0 0 0 0
Land use management 0 0 0 0 0 0 0
0 0 0 0 0 0 0
Roads and Stormwater 31 1 4 35 1 36 1 11 24 35 1 36 0
Solid Waste and Landfill 0 0 0 0 0 0 0
Water supply and waste water 0 0 0 0 0 0 0
Electricity 1 2 3 0 3 1 2 3 0 3 0
87 13 16 3 0 0 0 0 103 16 119 0 0 3 0 19 3 38 7 43 6 103 16 119 0 0 0
Roads and Stormwater 0 0 0 0 0 0 0
Solid Waste and Landfill 0 0 0 0 0 0 0
Water supply and waste water 0 0 0 0 0 0 0
Electricity 0 0 0 0 0 0 0
0 0 0 0 0 0 0 0 0 0 0 0 0 0 0 0 0 0 0 0 0 0 0 0 0 0 0
167 36 39 7 0 0 11 5 217 48 265 0 0 8 8 50 14 81 14 71 17 210 53 263 1 1 2
18.11%
Total number of women employees
60.46%
Employees with disabilities as a % of total employees
Over 51 employees as a % of total employees 33.46%
Total employees between 31& 50 159
Total employees over 51 88
48
249Black employees as a % of total employees 93.96%
Technical
Services
Municipal
Planning
Employees under 30 as a % of total employees 6.08%
2
0.75%
Women employees as a % of total employees
Total employees with Disabilities
Employees between 31 & 50 as a % of total employees
Total employees under 30 16
Apprentices
TOTALS
Total number of black (African, Coloured, Indian) employees
Summary Employment Data
SUB-TOTALS
Community
Safety
Corporate
Services
Legal
Emergency
Services
Environmental
Management
HR and Training
SOC 800 Labourers
SUB-TOTALS
Housing
Technical
Services
Public Transport
Financial
Services
Community
Services
Page 19

Page 20

Page 21

Page 22

Page 23

0
Section 4: Employment profile
Section 4.2: Number of new recruits employed during the year ending Do not enter 0 into the fields below - only use a field if the number is 1 or greater.
M F M F M F M F M F M F M F M F M F M F M F
SOC 100 Legislators 1 1 0 1 1 1 0 1 0
SOC 100 Directors and Corporate Managers 1 1 0 1 1 1 0 1 0
SOC 200 Professionals 0 0 0 0 0 0 0
SOC 300 Technicians and Trade Workers 0 0 0 0 0 0 0
SOC 400 Community and Personal Service Workers 0 0 0 0 0 0 0
SOC 500 Clerical and Administrative Workers 1 0 1 1 1 0 1 1 0
SOC 700 Machine Operators and Drivers 0 0 0 0 0 0 0
SOC 800 Labourers 15 10 4 1 19 11 30 5 3 10 6 4 2 19 11 30 0
Apprentices 0 0 0 0 0 0 0
TOTALS 16 10 4 1 0 0 1 1 21 12 33 0 0 6 3 10 6 4 0 1 3 21 12 33 0 0 0
30 JUNE 2013
Employment category 41-50
Race Age categories
African
REPORTING - Annual Report Only
FTotal+ 51 Total TotalColoured Indian
PWD
WhiteM
- 20 21-30 31-40Total Total
Page 24

0
Section 4: Employment profile
Section 4.3: New labour market entrants employed during the year ending (ie. of the new recruits reflected in Section 4.2) Do not enter 0 into the fields below - only use a field if the number is 1 or greater.
M F M F M F M F M F M F M F M F M F M F M F
SOC 100 Legislators 0 0 0 0 0 0 0
SOC 100 Directors and Corporate Managers 0 0 0 0 0 0 0
SOC 200 Professionals 0 0 0 0 0 0 0
SOC 300 Technicians and Trade Workers 0 0 0 0 0 0 0
SOC 400 Community and Personal Service Workers 0 0 0 0 0 0 0
SOC 500 Clerical and Administrative Workers 0 0 0 0 0 0 0
SOC 700 Machine Operators and Drivers 0 0 0 0 0 0 0
SOC 800 Labourers 0 0 0 0 0 0 0
Apprentices 0 0 0 0 0 0 0
TOTALS 0 0 0 0 0 0 0 0 0 0 0 0 0 0 0 0 0 0 0 0 0 0 0 0 0 0 0
Summary New LME Data
% of new recruits who are also new labour market entrants
REPORTING - Annual Report Only
Race Age categories
31-40 41-50
30 June 2012
21-30Employment category African Indian
PWD
WhiteM
+ 51 TotalTotal TotalColoured
0.00%
FTotalTotal - 20
Page 25

0
Section 4: Employment profile
Section 4.4: Number of interns given structured work experience during the year ending Note: Interns are NOT part of the New Recruits category, nor are they included in the total number of employees in the enterprise.Do not enter 0 into the fields below - only use a field if the number is 1 or greater. LGSETA Scarce Skills Areas highlighted in RED
M F M F M F M F M F M F
Core Admin 0 0 0 0
Core Finance 0 0 0 0
Legal 0 0 0 0
IT 0 0 0 0
Procurement 0 0 0 0
0 0 0 0
Property Valuation 0 0 0 0
Rates 0 0 0 0
Billing 1 5 1 5 6 0
Client Services 1 1 0 1 0
Parks 0 0 0 0
Community Facilities 0 0 0 0
Libraries 0 0 0 0
Recreation Centres 0 0 0 0
Primary Health Care Facilities 0 0 0 0
Cemeteries 0 0 0 0
Environmental Health 0 0 0 0
Pollution Control 0 0 0 0
By-laws 0 0 0 0
Licensing 0 0 0 0
Fire & rescue 0 0 0 0
Disaster Planning and Management 0 0 0 0
Public Safety 0 0 0 0
Traffic Management 0 0 0 0
0 0 0 0
LED/IDP/Urban Planning 0 0 0 0
Land use management 0 0 0 0
1 1 0 1 0
Roads and Stormwater 0 0 0 0
Solid Waste and Landfill 0 0 0 0
Water supply and waste water 0 0 0 0
Electricity 0 0 0 0
0 0 0 0
3 5 0 0 0 0 0 0 3 5 8 0 0 0
Interns in LGSETA Scarce Skill priority areas as a % of total interns 0.00%
Summary Intern Data
Interns as a % of total employees 3.02%
Total interns in LGSETA Scarce Skill priority areas 0
Community
Safety
Other (specify below)
TOTALS
Public Transport
Municipal
Planning
Housing
Technical
Services
Community
Services
Environmental
Management
Legal
Emergency
Services
Corporate
Services
Work area
HR and Training
Financial
Services
REPORTING - Annual Report Only
TotalWhite Total PWDTotalAfrican Coloured Indian
30 June 2012
Page 26

0
Section 4: Employment profile
Section 4.5: Number of 18.2 learners given structured work experience during the year ending Note: 18.2 Learners are UNEMPLOYED people who are working at the Municipality as part of a LEARNERSHIPDo not enter 0 into the fields below - only use a field if the number is 1 or greater.
M F M F M F M F M F M F
Core Admin 0 0 0 0
Core Finance 0 0 0 0
Legal 0 0 0 0
IT 0 0 0 0
Procurement 0 0 0 0
0 0 0 0
Property Valuation 0 0 0 0
Rates 0 0 0 0
Billing 0 0 0 0
Client Services 0 0 0 0
Parks 9 9 1 1 10 10 20 0
Community Facilities 0 0 0 0
Libraries 0 0 0 0
Recreation Centres 0 0 0 0
Primary Health Care Facilities 0 0 0 0
Cemeteries 0 0 0 0
Environmental Health 0 0 0 0
Pollution Control 0 0 0 0
By-laws 0 0 0 0
Licensing 0 0 0 0
Fire & rescue 0 0 0 0
Disaster Planning and Management 0 0 0 0
Public Safety 0 0 0 0
Traffic Management 0 0 0 0
0 0 0 0
LED/IDP/Urban Planning 0 0 0 0
Land use management 0 0 0 0
0 0 0 0
Roads and Stormwater 24 16 24 16 40 0
Solid Waste and Landfill 0 0 0 0
Water supply and waste water 0 0 0 0
Electricity 8 7 3 2 11 9 20 0
0 0 0 0
41 32 4 3 0 0 0 0 45 35 80 0 0 0
30 June 2012
Work area
Corporate
Services
HR and Training
TotalAfrican Coloured
Public Transport
Municipal
Planning
Housing
Interns in LGSETA Scarce Skill priority areas as a % of total interns
Technical
Services
Emergency
Services
Community
Safety
Other (specify below)
75.00%
Summary 18.2 Learner Data
18.2 learners as a % of total employees 30.19%
Total 18.2 learners in LGSETA Scarce Skill priority areas 60
TOTALS
REPORTING - Annual Report Only
TotalWhite Total PWD
Legal
Environmental
Management
Financial
Services
Community
Services
Indian
Page 27

0
Section 4: Employment profile
Section 4.6: Number of employees who left the enterprise in the year ending Do not enter 0 into the fields below - only use a field if the number is 1 or greater.
M F M F M F M F M F M F M F M F M F M F M F M F M F M F M F M F M F M F
SOC 100 Legislators 0 0 0 0 0 0 0 0 0 0
SOC 100 Directors and Corporate Managers 3 3 0 3 1 1 1 3 0 3 0 3 3 0 3
SOC 200 Professionals 0 0 0 0 0 0 0 0 0 0
SOC 300 Technicians and Trade Workers 1 1 1 1 2 1 1 1 1 2 0 1 1 1 1 2
SOC 400 Community and Personal Service Workers 0 0 0 0 0 0 0 0 0 0
SOC 500 Clerical and Administrative Workers 1 0 1 1 1 0 1 1 0 1 0 1 1
SOC 700 Machine Operators and Drivers 0 0 0 0 0 0 0 0 0 0
SOC 800 Labourers 5 3 1 1 6 4 10 2 1 4 3 6 4 10 0 1 3 5 1 6 4 10
Apprentices 0 0 0 0 0 0 0 0 0 0
TOTALS 8 4 2 1 0 0 0 1 10 6 16 0 0 1 1 1 0 4 2 4 3 10 6 16 0 0 0 3 2 1 3 0 0 0 0 1 0 5 1 10 6 16
Summary Data
Employees who left as a % of total employees
30 June 2012
6.04%
ReasonRace Age categories PWD
31-40 41-50 Retrenched21-30Total Total Resigned RetiredTotalTotal Total Total- 20F
+ 51M
Employment category
REPORTING - Annual Report Only
Medical
groundsDismissed DeathTotalAfrican Coloured Indian White
Page 28

0
Section 5: Employee qualification profile
Section 5.1: Employee qualification profile as at Do not enter 0 into the fields below - only use a field if the number is 1 or greater.
M F M F M F M F M F M F M F M F M F M F M F
Executive Mayor 0 0 0
Mayor 1 0 1 1
Local Government Legislators (Councillors) 5 2 3 1 2 9 4 13
Traditional Leaders & Heads of Villages 0 0 0
Other (specify below)
Ward Committee Members 0 0 0
0 0 0 0 0 0 5 0 2 3 0 2 0 0 2 0 0 0 0 0 9 5 14
11131 City/Municipal Manager 1 1 0 1
11133 General Managers 0 0 0
1211 Corporate Services Managers 0 0 0
1212 Finance Managers 0 0 0
1213 Human Resource Managers 3 1 2 6 0 6
1214 Policy and Planning Managers 0 0 0
1221 Engineering Managers 0 0 0
1222 Construction Managers 0 0 0
1231 ICT Managers 0 0 0
1251 Health, Welfare and Education Service Managers 0 0 0
12922 Commissioned Fire Officer 0 0 0
12923 Commissioned Police Officer (Metro/Traffic Police) 0 0 0
12991 Laboratory Managers 0 0 0
12992 Environment, Parks and Land Care Managers 0 0 0
12993 Sports Administrator or Manager 0 0 0
12994 Arts Administrator or Managers 0 0 0
1491 Sport and Recreation Managers 0 0 0
1492 Customer Services Managers 0 0 0
Other (specify below)
0 0 0
0 0 0 0 0 0 0 0 3 0 1 0 2 0 0 0 1 0 0 0 7 0 7
Core Admin 0 0 0
Core Finance 0 0 0
Legal 0 0 0
IT 0 0 0
Procurement 0 0 0
1 0 1 1
Property Valuation 1 0 1 1
Rates 0 0 0
Billing 1 1 0 1
Client Services 4 1 4 1 5
Parks 0 0 0
Community Facilities 0 0 0
Libraries 0 0 0
Recreation Centres 0 0 0
Primary Health Care Facilities 0 0 0
Cemeteries 0 0 0
Environmental Health 0 0 0
Pollution Control 0 0 0
By-laws 0 0 0
Licensing 0 0 0
Fire & rescue 0 0 0
Disaster Planning and Management 0 0 0
Public Safety 0 0 0
Traffic Management 0 0 0
0 0 0
LED/IDP/Urban Planning 0 0 0
Land use management 0 0 0
0 0 0
Roads and Stormwater 0 0 0
Solid Waste and Landfill 0 0 0
Water supply and waste water 0 0 0
Electricity 0 0 0
0 0 0 0 0 0 0 0 5 2 0 0 0 0 0 1 0 0 0 0 5 3 8
HR and Training
Financial
Services
Community
Services
Emergency
Services
Environmental
Management
Legal
Housing
Technical
Services
Community
Safety
Public Transport
Municipal
Planning
NQF 7 NQF 8
SOC 200 Professionals
Corporate
Services
REPORTING - Annual Report Only
Employment category
Highest level qualifications held by employees
Below
NQF 1
NQF 1 NQF 2 NQF 3
30 June 2012
TotalTotal
UnknownNQF 4 NQF 5
SUB-TOTALS
SOC 100 Legislators
NQF 6
SUB-TOTALS
SOC 100 Directors and Corporate Managers
SUB-TOTALS
Page 29

Section 5: Employee qualification profile
Section 5.1: Employee qualification profile as at Do not enter 0 into the fields below - only use a field if the number is 1 or greater.
M F M F M F M F M F M F M F M F M F M F M F
NQF 7 NQF 8
REPORTING - Annual Report Only
Employment category
Highest level qualifications held by employees
Below
NQF 1
NQF 1 NQF 2 NQF 3
30 June 2012
TotalTotal
UnknownNQF 4 NQF 5
SOC 100 Legislators
NQF 6
Core Admin 0 0 0
Core Finance 0 0 0
Legal 0 0 0
IT 0 0 0
Procurement 0 0 0
0 0 0
Property Valuation 0 0 0
Rates 0 0 0
Billing 0 0 0
Client Services 0 0 0
Parks 0 0 0
Community Facilities 0 0 0
Libraries 0 0 0
Recreation Centres 0 0 0
Primary Health Care Facilities 0 0 0
Cemeteries 0 0 0
Environmental Health 0 0 0
Pollution Control 0 0 0
By-laws 0 0 0
Licensing 0 0 0
Fire & rescue 0 0 0
Disaster Planning and Management 0 0 0
Public Safety 0 0 0
Traffic Management 0 0 0
0 0 0
LED/IDP/Urban Planning 0 0 0
Land use management 0 0 0
0 0 0
Roads and Stormwater 9 2 2 3 16 0 16
Solid Waste and Landfill 0 0 0
Water supply and waste water 0 0 0
Electricity 0 0 0
9 0 0 0 2 0 2 0 3 0 0 0 0 0 0 0 0 0 0 0 16 0 16
Core Admin 0 0 0
Core Finance 0 0 0
Legal 0 0 0
IT 0 0 0
Procurement 0 0 0
0 0 0
Property Valuation 0 0 0
Rates 0 0 0
Billing 0 0 0
Client Services 0 0 0
Parks 0 0 0
Community Facilities 0 0 0
Libraries 1 2 0 3 3
Recreation Centres 0 0 0
Primary Health Care Facilities 0 0 0
Cemeteries 0 0 0
Environmental Health 0 0 0
Pollution Control 0 0 0
By-laws 0 0 0
Licensing 2 2 0 2
Fire & rescue 0 0 0
Disaster Planning and Management 0 0 0
Public Safety 0 0 0
Traffic Management 0 0 0
5 1 5 1 6
LED/IDP/Urban Planning 0 0 0
Land use management 0 0 0
0 0 0
Roads and Stormwater 0 0 0
Solid Waste and Landfill 0 0 0
Water supply and waste water 0 0 0
Electricity 0 0 0
0 0 0 0 0 0 0 0 2 0 5 2 0 0 0 2 0 0 0 0 7 4 11
SOC 300 Technicians and Trade Workers
Corporate
Services
HR and Training
Financial
Services
Community
Services
Environmental
Management
Legal
Emergency
Services
Community
Safety
Public Transport
Municipal
Planning
Housing
Technical
Services
SUB-TOTALS
SOC 400 Community and Personal Service Workers
Corporate
Services
HR and Training
Financial
Services
Community
Services
Environmental
Management
Legal
Emergency
Services
Community
Safety
Public Transport
Municipal
Planning
Housing
Technical
Services
SUB-TOTALS
Page 30

Section 5: Employee qualification profile
Section 5.1: Employee qualification profile as at Do not enter 0 into the fields below - only use a field if the number is 1 or greater.
M F M F M F M F M F M F M F M F M F M F M F
NQF 7 NQF 8
REPORTING - Annual Report Only
Employment category
Highest level qualifications held by employees
Below
NQF 1
NQF 1 NQF 2 NQF 3
30 June 2012
TotalTotal
UnknownNQF 4 NQF 5
SOC 100 Legislators
NQF 6
Core Admin 1 2 3 1 3 4 7
Core Finance 0 0 0
Legal 0 0 0
IT 0 0 0
Procurement 0 0 0
0 0 0
Property Valuation 0 0 0
Rates 1 1 1 1 2
Billing 2 1 2 1 4 3 8 5 13
Client Services 3 8 2 11 2 13
Parks 0 0 0
Community Facilities 0 0 0
Libraries 0 0 0
Recreation Centres 0 0 0
Primary Health Care Facilities 0 0 0
Cemeteries 0 0 0
Environmental Health 0 0 0
Pollution Control 0 0 0
By-laws 0 0 0
Licensing 0 0 0
Fire & rescue 2 1 2 1 3
Disaster Planning and Management 0 0 0
Public Safety 0 0 0
Traffic Management 0 0 0
0 0 0
LED/IDP/Urban Planning 0 0 0
Land use management 0 0 0
0 0 0
Roads and Stormwater 0 0 0
Solid Waste and Landfill 0 0 0
Water supply and waste water 0 0 0
Electricity 0 0 0
0 0 0 0 2 1 6 1 17 9 0 2 0 0 0 0 0 0 0 0 25 13 38
Core Admin 1 1 0 1
Core Finance 0 0 0
Legal 0 0 0
IT 0 0 0
Procurement 0 0 0
0 0 0
Property Valuation 0 0 0
Rates 0 0 0
Billing 0 0 0
Client Services 0 0 0
Parks 5 8 13 0 13
Community Facilities 5 1 2 8 0 8
Libraries 0 0 0
Recreation Centres 0 0 0
Primary Health Care Facilities 0 0 0
Cemeteries 5 3 3 11 0 11
Environmental Health 0 0 0
Pollution Control 0 0 0
By-laws 0 0 0
Licensing 0 0 0
Fire & rescue 0 0 0
Disaster Planning and Management 0 0 0
Public Safety 0 0 0
Traffic Management 0 0 0
0 0 0
LED/IDP/Urban Planning 0 0 0
Land use management 0 0 0
0 0 0
Roads and Stormwater 0 0 0
Solid Waste and Landfill 0 0 0
Water supply and waste water 8 2 3 5 1 11 8 19
Electricity 0 0 0
10 0 5 0 11 0 4 3 13 5 0 0 1 0 0 0 0 0 0 0 44 8 52
SOC 500 Clerical and Administrative Workers
Corporate
Services
HR and Training
Financial
Services
Community
Services
Environmental
Management
Legal
Emergency
Services
Community
Safety
Public Transport
Municipal
Planning
Housing
Technical
Services
SUB-TOTALS
SOC 700 Machine Operators and Drivers
Corporate
Services
HR and Training
Financial
Services
Community
Services
Environmental
Management
Legal
Emergency
Services
Community
Safety
Public Transport
Municipal
Planning
Housing
Technical
Services
SUB-TOTALS
Page 31

Section 5: Employee qualification profile
Section 5.1: Employee qualification profile as at Do not enter 0 into the fields below - only use a field if the number is 1 or greater.
M F M F M F M F M F M F M F M F M F M F M F
NQF 7 NQF 8
REPORTING - Annual Report Only
Employment category
Highest level qualifications held by employees
Below
NQF 1
NQF 1 NQF 2 NQF 3
30 June 2012
TotalTotal
UnknownNQF 4 NQF 5
SOC 100 Legislators
NQF 6
Core Admin 2 2 4 1 5 4 3 15 18
Core Finance 0 0 0
Legal 0 0 0
IT 0 0 0
Procurement 0 0 0
0 0 0
Property Valuation 0 0 0
Rates 0 0 0
Billing 0 0 0
Client Services 0 0 0
Parks 15 3 5 23 0 23
Community Facilities 16 2 1 2 21 0 21
Libraries 0 0 0
Recreation Centres 0 0 0
Primary Health Care Facilities 0 0 0
Cemeteries 11 4 1 1 17 0 17
Environmental Health 0 0 0
Pollution Control 0 0 0
By-laws 0 0 0
Licensing 1 1 0 1
Fire & rescue 0 0 0
Disaster Planning and Management 0 0 0
Public Safety 0 0 0
Traffic Management 0 0 0
0 0 0
LED/IDP/Urban Planning 0 0 0
Land use management 0 0 0
0 0 0
Roads and Stormwater 27 4 4 1 35 1 36
Solid Waste and Landfill 0 0 0
Water supply and waste water 0 0 0
Electricity 1 2 3 0 3
69 2 4 0 13 4 14 5 3 5 0 0 0 0 0 0 0 0 0 0 103 16 119
Roads and Stormwater 0 0 0
Solid Waste and Landfill 0 0 0
Water supply and waste water 0 0 0
Electricity 0 0 0
0 0 0 0 0 0 0 0 0 0 0 0 0 0 0 0 0 0 0 0 0 0 0
88 2 9 0 28 5 31 9 48 24 6 6 3 0 2 3 1 0 0 0 216 49 265
Total number of employees with an NQF Level 5 and above 21Employees with an NQF Level 5 and above as a % of total employees 7.92%
Employees in SOC 300 with an NQF Level 5 and above as a % of total
employees in those categories0.00%
Total employees in SOC 100 and 200 with an NQF Level 6 and above 4Employees in SOC 100 and 200 with an NQF Level 6 and above as a % of
total employees in those categories13.79%
Total employees in SOC 300 with an NQF Level 5 and above 0
Employees with an NQF Level 2,3 and 4 as a % of total employees 54.72%
Summary Employee Qualification Profile Data
Total number of employees with an NQF Level 1 and below 99Employees with an NQF Level 1 and below as a % of total employees 37.36%
Total number of employees with an NQF Level 2,3 and 4 145
SOC 800 Labourers
Corporate
Services
HR and Training
Financial
Services
Community
Services
Environmental
Management
Legal
Emergency
Services
Community
Safety
Public Transport
Municipal
Planning
Technical
Services
SUB-TOTALS
TOTALS
Housing
Technical
Services
SUB-TOTALS
Apprentices
Page 32

0
Section 5: Employee qualification profile
Section 5.2: Process used to complete the qualification profileDescription Yes/No Comment
Looked at formal qualifications Yes
Considered all training, both formal and informal
Interviewed each employee Yes
Conducted Recognition of Prior Learning (RPL) Process
Skills audit Yes
Other (specify below):
REPORTING - Annual Report Only
Page 33

0
Section 6: Strategic objectives and measures of success for Municipalities for the Financial Year: 2012/2013
Objectives Targets and measures of success Objectives Targets and measures of success
1
To ensure that municipal employees are aware of
HIV and AIDS
Inform municipal employees about HIV AIDS on
an ongoing basis
To promote the programs of HIV AIDS in the
municipality amongs employees
Inform municipal employees about HIV AIDS on
an ongoing basis
To conduct campaigs on illegal dumpingTo ensure that campains are conducted on illegal
dumping
To ensure that municipal employees are
capacitated on municipal by-laws
Train employees on the municipal by-laws on
continious basis
2
To promote community participation on municipal
affairs70 ward committee members trained
To strengthen the involvement of community
through public participation
70 ward committee members trained on
community based planning
To promote transformation through stakeholder
participationRestructured Local Labour Forum To strengthen institutional working relations
10 LLF members trained on their powers and
functions
To ensure profetional drafting of municipal
documentsProfessionalise drafted municipal documents
To capacitate municipal employees on drafting of
professional documents
5 employees trained on professional documents
design course
3To capacitate supply chain management unit SCM officer appointed To review and update the SCM policy SCM officer trained on supply chain management
To enhance efficient and effective financial
management of the municipality
5 finance interns appointed in the finance
departmentTo develop cash flow management model
trained employees on cash flow management
model before the implementation thereof
To ensure functional debt collection and credit
control unit
capacitated debt collection with debt reduced to
45 days on an ongoing basis
To capacitate the debt collectionand credit control
unitTrained debt collectors and credit control units
To ensure functional budget and treasury
managemnt unit
capacitate budget and treasury management
units
To capacitate the budget and treasury
management unitBudget and treasury manager trained
4managed and monitored water quality Trained process controllers
To ensure he municipality has qualified process
controllers
RPL officials on waste and water process
controllers
maintained internal roads on a regular basisTrained grader operators for maintanance of
roads
To ensure that the municipality has qualified
grader operatorOfficial trained to operate a grader
To ensure appointment of a qualified electrician appointed qualified electricianTo ensure that the municipality has a qualified
electricianAppointment of Electrician
5To ensure appointment of LED manager Appointed LED manager by june 2013
To ensure that the municipality has a qualified
LED manageron-going training of smme to alliviate poverty
To ensure that the municipality is properly
marketed and that tourism awareness is widened
branded and marketed municipality on an on-
going basis
To ensure that the municipality is economically
viableAppointment of tourism officers at the municipality
6
7
8
9
10
Educate and sensitise communities on potential
threads and hazards
Municipal transformation,institutional development
and labour matter
Build and strengthen the financial management of
the municipality to enhance service delivery
To deliver sustainable essential services such as
water,sanitation,electricity and roads for lekwa-
teemane communities
Strengthening the enabling enviroment through
more flexible regulations,better access to finance
and markets ,improved infastructure facilities and
business support
PLANNING
IDP objectives
Operational context
Municipal objectives
Enabling context
Training and skills development objectives
Page 34

0
1
2
3
4
5
6
7
8
9
10
Objectives Targets and measures of success
PLANNING
Transformation context
Employment equity objectives (employees only) Priority Skills Area addressed Notes
Page 35

Section 6: Strategic objectives and measures of success for Municipalities for the Financial Year: 2012/2013
Objectives Targets and measures of success Objectives Targets and measures of success
Educate and sensitise communities on potential
threads and hazards
PLANNING
IDP objectives
Operational context
Municipal objectives
Enabling context
Training and skills development objectives
11
12
13
14
15
16
17
18
Page 36

111
12
13
14
15
16
17
18
Objectives Targets and measures of success
PLANNING
Transformation context
Employment equity objectives (employees only) Priority Skills Area addressed Notes
Page 37

0
Section 7: Sector Priority Skills Areas for the Financial Year: 2012/2013
TO
TA
L
ABET 0
Administration 0
Client service 12 1 1
Computer Literacy 11 2 2
Corporate, legal and support 5 1 1
Financial 4 2 2
Life skills 10 1 1
Management / leadership 1 1 1
Occupational Health and Safety 9 1 1
Policy development 7 2 2
Project management /planning 8 3 3
Social/community/economic development and planning 3 4 4
Specialist technical 6 3 3
Training skills 4 0
Specialist Skills required by legislation 2 3 3
0 0 1 10 2 4 3 1 0
General
(GET) band
Up to NQF
Level 1
PLANNING
Number of interventions planned for the period
Un
kn
ow
n
Skil
ls P
rio
rity
no
NQF
Level 6
NQF
Level 4
TOTAL
Do not enter 0 into the fields below - only use a field if the number is 1 or greater.
Training and skills
development interventions
in the area of…NQF
Level 7
NQF
Level 8
Further Education and
Training
Higher Education and Training
(HE) band
NQF
Level 2
NQF
Level 3
NQF
Level 5
Page 38

0
Section 8: Proposed Programmes - Training for Municipal Employees during: 2012/2013
No. Course Name or Qualification Title Proposed Provider Skills Priority Area
Skills
Priority
No
Informal/
Formal
In-house/
ExternalType of Intervention
Target Employment
Category
Total No.
to be
Trained
Estimated
Cost
1
Environmental Management (Councillors &
OfficialsNOT YET APPOINTED
Social/community/economic development and
planning 3 Formal In-house Skills Programme Labourers 20
2 MFMA (Councillors) NOT YET APPOINTED Specialist Skills required by legislation 2 Formal In-house Skills Programme Legislators 20
3 CPMD (Councillors & Officials) WITS UNIVERSITY Management / leadership 1 Formal External Short Course Directors and Corporate Managers 8 R 315 000.00
4 House Keeping NOT YET APPOINTED Life skills 16 Formal In-house Skills Programme Labourers 20 R3000.000.00
5Property Valuation NOT YET APPOINTED
Social/community/economic development and
planning 15 Formal External Diploma Clerical & Administrative Workers 2 R 30 000.00
6
Mechanical EngineeringNOT YET APPOINTED Specialist technical
Formal External Short Course Technicians & Trade Workers 2 R 30 000.00
7Building Inspection NOT YET APPOINTED
Social/community/economic development and
planning 14 Formal External Diploma Clerical & Administrative Workers 2 R 30 000.00
8 Computers (Councillors ) NOT YET APPOINTED Computer Literacy 13 Formal In-house Skills Programme Legislators 14 R
9 Plumbing NOT YET APPOINTED Specialist technical 12 Formal In-house Apprenticeship Labourers
10LED NOT YET APPOINTED
Social/community/economic development and
planning 11 Formal In-house Clerical & Administrative Workers
11 Waste water NOT YET APPOINTED Specialist Skills required by legislation 10 Formal In-house Skills Programme Machine Operators & Drivers 10
12 Traffic management NOT YET APPOINTED Specialist technical 9 Formal External Short Course Professionals 5 R 75 000.00
13 HRD NORTH WEST UNIVERSITY Training skills 8 Formal External Degree Professionals 1 R 15 000.00
14Internal Auditing NOT YET APPOINTED Specialist technical
Formal External Degree Professionals 2 R 30 000.00
15Supply Chain( Councillors) NOT YET APPOINTED Specialist Skills required by legislation
4 Formal External Skills Programme Professionals 20
16 Finance for non finance managers (Councillors) NOT YET APPOINTED Training skills 7 Formal In-house Skills Programme Legislators 14
17 Project management( councillors & Officials ) NOT YET APPOINTED Specialist technical 5 Formal In-house Learnership Professionals 5
18 Credit Control and debt collection( Councillors) NOT YET APPOINTED Policy development 6 Formal In-house Short Course Clerical & Administrative Workers 20
19 Generic management NOT YET APPOINTED Training skills Formal External Skills Programme Technicians & Trade Workers 10
20 ELMDP( Councillors) NOT YET APPOINTED Management / leadership Formal In-house Skills Programme Legislators 14
21 Report writing NOT YET APPOINTED Life skills Formal In-house Skills Programme Legislators 14
22 Policy Development ( Councillors) NOT YET APPOINTED Policy development Formal In-house Skills Programme Legislators 14
23
24
25
26
27
28
29
30
31
32
33
34
35
36
37
38
39
40
41
42
43
44
45
46
47
48
49
50
51
52
53
54
55
56
PLANNING
Note that if you have not yet appointed a provider, you can write 'not yet appointed' in the 'Proposed Provider' column
Page 39

57
58
59
60
61
62
63
64
65
66
67
68
69
70
71
72
73
74
75
76
77
78
79 R 300.00
80
81
82
83
84
85
86
87
88
89
90
91
92
93
94
95
96
97
98
99
100
Page 40

Summary Data of Proposed Programmes for Employees217
#DIV/0!
Skills
Priority
No
Name of Intervention Number of Interventions Planned
0 ABET 00 Administration 012 Client service 011 Computer Literacy 15 Corporate, legal and support 04 Financial 010 Life skills 01 Management / leadership 29 Occupational Health and Safety 0
7 Policy development 2
8 Project management /planning 0
3Social/community/economic development and
planning
4
6 Specialist technical 5
4 Training skills 32 Specialist Skills required by legislation 3
Total Interventions not linked to Sector Skills
Priorities
0
Total Estimated Levy
Total Estimated Cost as a % of Levy
Total Interventions
Total Number to be Trained
Total Estimated Cost of Training
Page 41

Section 8: Programme Details - Training for Municipal Employees during 2011/2012
No. Course Name or Qualification Title Name of Provider Skills Area
Skills
Priority
No
NQF
Level
Informal/
Formal
In-house/
External
Includes
SAQA reg.
unit
standards
Type of Intervention Start Date End Date DurationTarget Employment
Category
Total No.
TrainedActual Cost
1
Records Management
Auditor Generals Office Administration 7 Formal External Yes Degree 1 day Clerical & Administrative Workers 5
2 LED Human Settlements Social/community/economic development and planning 6 Formal External Yes Certificate 2 days Clerical & Administrative Workers 1
3 OHS Salga Occupational Health and Safety 6 Formal External Yes Certificate 2 days Directors and Corporate Managers 1
4 PMS Salga Policy development 5 Formal External Yes Short Course 2 days Directors and Corporate Managers 1
5Customer care
Lejweng Communications Client service 4 Formal In-house Yes Skills Programme 2 days Clerical & Administrative Workers 20 R 96 667.86
6
Water and Waste Water treatment process
operation Aurecon training Specialist technical 3 Formal In-house Yes Workplace Experience 8 months Machine Operators & Drivers 7
7Accounting Project
Saica Management / leadership 8 Formal External Yes Certificate 10 months Clerical & Administrative Workers 5
8 CPMD Wits University Specialist Skills required by legislation 8 Formal External Yes Diploma 12mnths Directors and Corporate Managers 2
9 MIDP DBSA Social/community/economic development and planning 7 Formal External Yes Certificate 2 days Legislators 2
10Environmental Management
Salga Specialist Skills required by legislation 4 Formal External Yes Skills Programme 2 days Professionals 1
11 HIV/AIDS Salga Occupational Health and Safety 4 Formal External Yes Skills Programme 2 days Clerical & Administrative Workers
12 Human Resource Development NWU Training skills 8 Formal External Yes Degree 14-Jan 30-Nov 12mnths Professionals 1
13 Local Government Resource Centre DBSA Computer Literacy 5 Formal In-house Yes Skills Programme 3 days Clerical & Administrative Workers 20
14
Water and Waste Water treatment process
operation Sedibeng Water Specialist technical 3 Formal External Yes Skills Programme 1 day Machine Operators & Drivers 5
15
Job analyses ,recruitment,selection and
promotion Kgotla training Policy development 5 Formal External Yes Skills Programme 20-Jun 22-Jun-12 3 days Directors and Corporate Managers 3
16 Local Government Resource Centre DBSA Computer Literacy 5 Formal In-house Yes Skills Programme Legislators 18
17 Grader Operator Valley Junction Training Academy Specialist technical 3 Formal In-house Yes Skills Programme 16Apr.2012 20Apr.2012 5 days Machine Operators & Drivers 8 R 31 350.00
18
19
20
21
22
23
24
25
26
27
28
29
30
31
32
33
34
35
36
37
38
39
40
41
42
43
44
45
46
47
48
49
50
51
52
53
54
55
56
REPORTING - Quarterly and Annual Report
Page 42

57
58
59
60
61
62
63
64
65
66
67
68
69
70
71
72
73
74
75
76
77
78
79
80
81
82
83
84
85
86
87
88
89
90
91
92
93
94
95
96
97
98
99
100
Page 43

Summary of Actual Programmes100
R 128 017.86
R 0.00
#DIV/0!
Skills Priority No Name of Intervention Number of Interventions Planned
0 ABET 00 Administration 112 Client service 111 Computer Literacy 25 Corporate, legal and support 04 Financial 010 Life skills 01 Management / leadership 19 Occupational Health and Safety 2
7 Policy development 2
8 Project management /planning 0
3Social/community/economic development and
planning
2
6 Specialist technical 3
4 Training skills 12 Specialist Skills required by legislation 2
Total Interventions not linked to Sector Skills
Priorities
0
Total Number Trained
Total Actual Cost of Training
Total Estimated Levy
Total Estimated Cost as a % of Levy
Total Interventions
Page 44

0
Section 9: Proposed Programmes - Training for the Unemployed during 2012/2013
1 Environmental management Not yet appointed Formal In-house Learnership Youth 10 Self Employment
2 Roads construction Not yet appointed Formal In-house Learnership Youth 15 Self Employment
3 Electrical Engineering Not yet appointed Formal In-house Learnership Youth 10 Self Employment
4 Road Works Not yet appointed Formal In-house Learnership Youth 20 Self Employment
5 Horticulture Not yet appointed Formal In-house Skills Programme General Unemployed 20 Self Employment
6 Bricklaying Not yet appointed Formal In-house Skills Programme General Unemployed 50 Self Employment
7 Plumbing Not yet appointed Formal In-house Skills Programme General Unemployed 50 Self Employment
8 Carpentry Not yet appointed Formal In-house Skills Programme General Unemployed 50 Self Employment
9 Tilling Not yet appointed Formal In-house Skills Programme General Unemployed 50 Self Employment
10 Welding Not yet appointed Formal In-house Skills Programme General Unemployed 50 Self Employment
11 Plastering Not yet appointed Formal In-house Skills Programme General Unemployed 50 Self Employment
12 Emergency Operations Not yet appointed Formal External Learnership Youth 10 Self Employment
13
14
15
16
17
18
19
20
21
22
23
24
25
26
27
28
29
30
31
32
33
34
35
36
37
38
39
40
41
42
43
44
45
46
47
48
49
50
Summary Data of Proposed Programmes for Unemployed
385
R 0.00
#DIV/0!
PLANNING
Note that if you have not yet appointed a provider, you can write 'not yet appointed' in the 'Proposed Provider' column
Total Number to be Trained
Total Estimated Cost of Training
Total Estimated Cost as a % of Total Estimated Cost of
Training Employees
No. Course Name Proposed ProviderInformal/
Formal
In-house/
ExternalType of Intervention Target Category
Total No.
to be
Trained
Estimated
Cost
Exit Opportunities Available
as a Result of the Training
Page 45
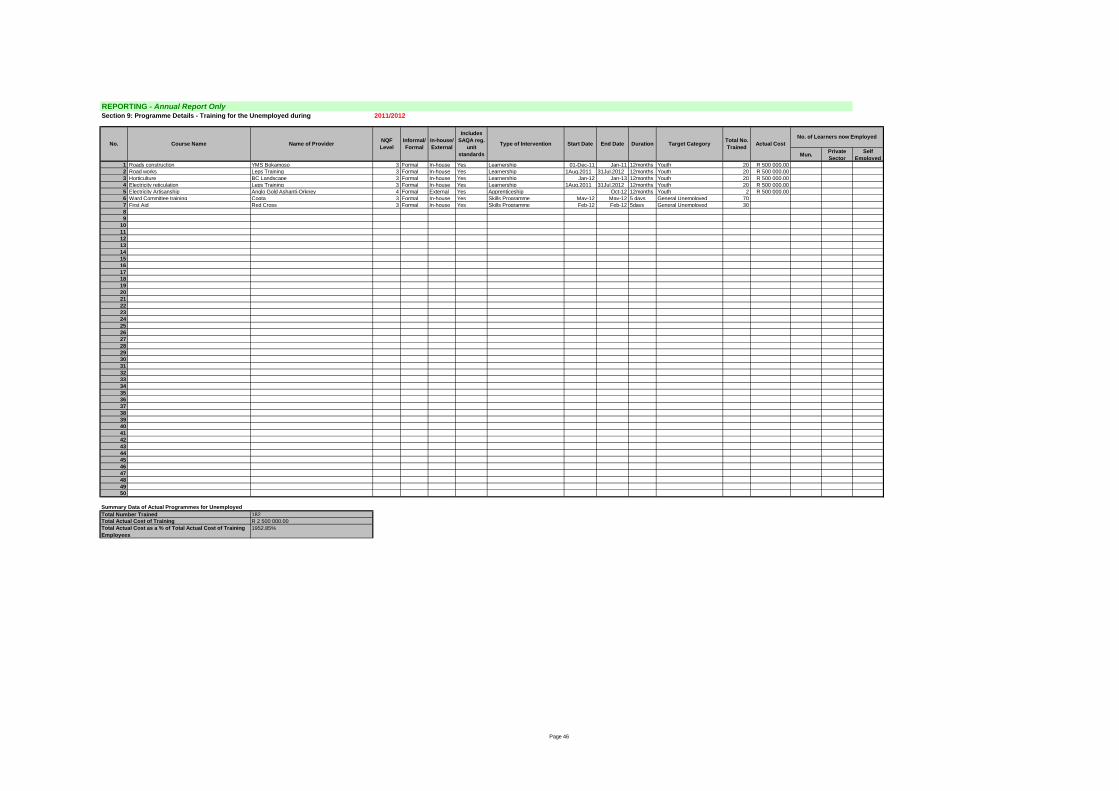
Section 9: Programme Details - Training for the Unemployed during 2011/2012
Mun.Private
Sector
Self
Employed
1 Roads construction YMS Bokamoso 3 Formal In-house Yes Learnership 01-Dec-11 Jan-11 12months Youth 20 R 500 000.00
2 Road works Leps Training 3 Formal In-house Yes Learnership 1Aug.2011 31Jul.2012 12months Youth 20 R 500 000.00
3 Horticulture BC Landscape 3 Formal In-house Yes Learnership Jan-12 Jan-13 12months Youth 20 R 500 000.00
4 Electricity reticulation Leps Training 3 Formal In-house Yes Learnership 1Aug.2011 31Jul.2012 12months Youth 20 R 500 000.00
5 Electricity Artisanship Anglo Gold Ashanti-Orkney 4 Formal External Yes Apprenticeship Oct-12 12months Youth 2 R 500 000.00
6 Ward Committee training Cogta 3 Formal In-house Yes Skills Programme May-12 May-12 5 days General Unemployed 70
7 First Aid Red Cross 3 Formal In-house Yes Skills Programme Feb-12 Feb-12 5days General Unemployed 30
8
9
10
11
12
13
14
15
16
17
18
19
20
21
22
23
24
25
26
27
28
29
30
31
32
33
34
35
36
37
38
39
40
41
42
43
44
45
46
47
48
49
50
Summary Data of Actual Programmes for Unemployed
182
R 2 500 000.00
1952.85%
REPORTING - Annual Report Only
Total Actual Cost as a % of Total Actual Cost of Training
Employees
Total Number Trained
Total Actual Cost of Training
No. Course Name Name of ProviderNQF
Level
Informal/
Formal
In-house/
External
Includes
SAQA reg.
unit
standards
Type of Intervention Start Date End Date
No. of Learners now Employed
Duration Target CategoryTotal No.
TrainedActual Cost
Page 46

0
Section 10: Critical and Scarce Skills
Section 10.1 Department of Labour Critical and Scarce Skills in 2012/2013
SOC100 SOC 100 Legislators
111301 Local or Provincial Government Legislator Councillor 14 14 0 0%
111301 Local or Provincial Government Legislator Mayor 0 #DIV/0!
111301 Local or Provincial Government Legislator Member of Mayoral Committee 0 #DIV/0!
111303 Traditional Leader Head of Village/Chief/Senior Royal 0 #DIV/0!
None Local or Provincial Government Legislator Ward Committee Member 0 #DIV/0!
SUB-TOTALS 14 14 0 0%
SOC100 SOC 100 Directors and Corporate Managers
111403 Local Authority Manager City Administrator 0 #DIV/0!
111403 Local Authority Manager City Treasurer 0 #DIV/0!
111403 Local Authority Manager General Manager Local Authority 0 #DIV/0!
111403 Local Authority Manager Municipal Manager 0 #DIV/0!
111405 Senior Police Officer Senior Metro Police Officer 0 #DIV/0!
132101 Corporate Services Manager Administration Manager 1 1 100%
132201 Finance Manager Chief Financial Officer (CFO) 1 1 100%
132301 Personnel / Human Resource Manager Human Resources Development Manager 1 1 0 0%
132401 Policy and Planning Manager Public Policy Manager / IDP/LED 2 1 1 50%
133101 Construction Project Manager Building and Construction Manager 0 #DIV/0!
134101 Child Care Centre Manager Early Childhood Development Centre Manager 0 #DIV/0!
134201 Medical Superintendent Public Health Manager 0 #DIV/0!
134202 Nursing Clinical Director Director of Nursing / Community Health 0 #DIV/0!
134204 Welfare Centre Manager Community Services Manager 0 #DIV/0!
139102 Commissioned Fire & Rescue Officer Chief Fire & Rescue Officer 0 #DIV/0!
139102 Commissioned Fire & Rescue Officer Fire Investigator 0 #DIV/0!
139102 Commissioned Fire & Rescue Officer Inspector (Fire Services) 0 #DIV/0!
139901 Arts/Culture Manager Art Gallery Director 0 #DIV/0!
139901 Arts/Culture Manager Arts / gallery Administrator 0 #DIV/0!
139902 Environmental Manager Parks Manager 0 #DIV/0!
139902 Environmental Manager Pollution & Waste Group Manager 0 #DIV/0!
139905 Sports Administrator Recreation Administrator 0 #DIV/0!
SUB-TOTALS 5 2 3 60%
SOC200 SOC 200 Professionals
221101 Accountant (General) Treasury Accountant 0 #DIV/0!
221204 Internal Auditor Compliance Auditor 0 #DIV/0!
223101 Human Resource Advisor HR Officer 1 1 0 0%
223104 Skills Development Facilitator Human Resource Planner 1 1 0 0%
224202 Gallery or Museum Curator Curatorial Services Manager 0 #DIV/0!
224301 Economist LED Officer / IDP 0 #DIV/0!
224502 Valuer Property Valuer 0 #DIV/0!
224601 Librarian Children's Librarian 0 #DIV/0!
224601 Librarian Library Manager / Advisor 0 #DIV/0!
224902 Liaison Officer Community Liaison Officer 0 #DIV/0!
224902 Liaison Officer Disability Liaison Officer 0 #DIV/0!
232101 Architect Building Designer 0 #DIV/0!
232102 Landscape Architect Landscape Designer 0 #DIV/0!
232202 Surveyor Topographer and Hydrographer 0 #DIV/0!
232601 Urban and Regional Planner Community / Country / District Planner 0 #DIV/0!
232601 Urban and Regional Planner Environmental Consents Planner 0 #DIV/0!
232601 Urban and Regional Planner Land Planner 0 #DIV/0!
232601 Urban and Regional Planner Town Planner 0 #DIV/0!
232601 Urban and Regional Planner Traffic and Transport Planner 0 #DIV/0!
233201 Civil Engineer Transportation and Urban Planning Engineer 0 #DIV/0!
233201 Civil Engineer Water Operations / Resources / Supply Engineer 0 #DIV/0!
233202 Civil Engineering Technologist Transportation and Urban Planning Technologist 0 #DIV/0!
233202 Civil Engineering Technologist Water Operations Technologist 0 #DIV/0!
233301 Electrical Engineer Power Distribution Engineer 0 #DIV/0!
233301 Electrical Engineer Power Systems Engineer 0 #DIV/0!
233302 Electrical Engineering Technologist Power Engineering Technologist 0 #DIV/0!
233502 Mechanical Engineer Maintenance Management Engineer 0 #DIV/0!
233505 Mechanical Engineering Technologist Maintenance Technologist 0 #DIV/0!
234301 Conservation Officer Environmental Waste Officer 0 #DIV/0!
234303 Environmental Research Scientist Water Quality Analyst 0 #DIV/0!
241101 Early childhood (Pre-primary School) Teacher Early Childcare Teacher 0 #DIV/0!
251301 Environmental Health Officer Health Inspector 0 #DIV/0!
251301 Environmental Health Officer Licensed Premises Inspector 0 #DIV/0!
251301 Environmental Health Officer Sanitary Inspector / by-law enforcement 0 #DIV/0!
251302 Occupational Health & Safety Advisor OSH Advisor / Co-ordinator / Officer /Professional 0 #DIV/0!
251302 Occupational Health & Safety Advisor Road Safety Co-ordinator 0 #DIV/0!
251901 Health Promotion Officer AIDS Educator 0 #DIV/0!
251901 Health Promotion Officer Community Health Worker 0 #DIV/0!
254404 Registered Nurse (Community Health) Public Health Nurse 0 #DIV/0!
262103 Systems Administrator Systems Admin / Manager (Computing / Data GIS 0 #DIV/0!
271204 Administrative Lawyer Legal Advisor 0 #DIV/0!
272501 Social Worker Outreach Worker / Community Development Worker 0 #DIV/0!
272601 Community Arts Worker Community Arts Officer 0 #DIV/0!
272602 Recreation Officer Recreation Co-ordinator 0 #DIV/0!
SUB-TOTALS 2 2 0 0%
Alternative Title / Specialisation
PLANNING
Anticipated
staffing
shortfalls/
redundancies
Anticipated changes
No. of Posts
Filled
Occupation Name Code
Current Status
No. of Posts per
Organogram
No. of Posts
VacantVacancy Rate
Change over 5
Years?
Scarce and Critical Skills
Reason for Vacancy18(2) Learners &
Interns
Change over 3
Years?
If YES, numbers
to be trained
If YES, NQF
Level
Is this Occupation a Scarce Skill?
Give reasons
Are there any critical skills
attached to this occuaption?
Please list
Number of
qualified people
to be imported
from outside
South Africa
If YES, type of
Intervention
Planned Scarce Skills or Critical Skills Training Interventions
Intend to train
SS or CS
Page 47

Section 10: Critical and Scarce Skills
Section 10.1 Department of Labour Critical and Scarce Skills in 2012/2013
Alternative Title / Specialisation
PLANNING
Anticipated
staffing
shortfalls/
redundancies
Anticipated changes
No. of Posts
Filled
Occupation Name Code
Current Status
No. of Posts per
Organogram
No. of Posts
VacantVacancy Rate
Change over 5
Years?
Scarce and Critical Skills
Reason for Vacancy18(2) Learners &
Interns
Change over 3
Years?
If YES, numbers
to be trained
If YES, NQF
Level
Is this Occupation a Scarce Skill?
Give reasons
Are there any critical skills
attached to this occuaption?
Please list
Number of
qualified people
to be imported
from outside
South Africa
If YES, type of
Intervention
Planned Scarce Skills or Critical Skills Training Interventions
Intend to train
SS or CS
SOC300 SOC 300 Technicians and Trade Workers
311205 Pharmacy Technician Dispensary Technician 0 #DIV/0!
311901 Earth & Atmospheric Science Technician Air Quality Technician 0 #DIV/0!
311901 Earth & Atmospheric Science Technician Water Resources Technical Officer 0 #DIV/0!
311903 Environmental Science Technician Environmental Technical Officer 0 #DIV/0!
312102 Building Associate Clerk of Works 0 #DIV/0!
312103 Building Inspector Electrical Installation Inspector 0 #DIV/0!
312105 Plumbing inspector Sanitary Plumbing & Water Supply Inspector 0 #DIV/0!
312202 Civil Engineering Technician Civil Engineering Assistant 0 #DIV/0!
312202 Civil Engineering Technician Waste Water Treatment Officer 0 #DIV/0!
312302 Electrical Engineering Technician Electrical Engineering Technical Officer 0 #DIV/0!
312906 Town Planning Technician Town Planning Research Technician 0 #DIV/0!
321201 Motor Mechanic (General) Mechanic 0 #DIV/0!
323201 Fitter (General) Waterworks Fitter / Mechanic 0 #DIV/0!
331101 Bricklayer Blocklayer 0 #DIV/0!
331201 Carpenter & Joiner Building Maintenance Repairman 0 #DIV/0!
334101 Plumber (General) Maintenance Plumber 0 #DIV/0!
334101 Plumber (General) Water Plumber 0 #DIV/0!
334103 Drainer / Drainlayer Sewer Pipe Layer 0 #DIV/0!
334103 Drainer / Drainlayer Underground Drainlayer 0 #DIV/0!
334104 Gasfitter Gas Main & line fitter 0 #DIV/0!
341101 Electrician (General) Electrical Mechanic 0 #DIV/0!
342201 Electrical Linesworker / Electrical Line Mechanic Electrical Cable Layer / Puller 0 #DIV/0!
342201 Electrical Linesworker / Electrical Line Mechanic Electric Power Lines Faultsman / Serviceman 0 #DIV/0!
342201 Electrical Linesworker / Electrical Line Mechanic Electrical Inspector Lines 0 #DIV/0!
342201 Electrical Linesworker / Electrical Line Mechanic Electrical Line Mechanic / Line Worker (Distribution) 0 #DIV/0!
342202 Technical Cable Jointer Mains Layer and Jointer 0 #DIV/0!
342302 Communications Operator Radio Communications Operator 0 #DIV/0!
361101 Animal Attendants Pound Keeper 0 #DIV/0!
362103 Gardener (General) Street trees team leader 0 #DIV/0!
362106 Nursery person Horticulturist 0 #DIV/0!
362107 Green Keeper Parks Caretaker 0 #DIV/0!
364103 Livestock Product Evaluator * Broker Meat Examiner / Classifier 0 #DIV/0!
364202 Livestock Produce Processing & Handling SupervisorsRed Meat Processing Supervisor (Abattoir) 0 #DIV/0!
SUB-TOTALS 0 0 0 #DIV/0!
SOC400SOC 400 Community and Personal Service
Workers
411101 Ambulance Officer Ambulance Man / Woman 0 #DIV/0!
411102 Ambulance Paramedic Paramedic 0 #DIV/0!
441202 Fire Fighter Fire Prevention Officer / Fire Brigade Officer 0 #DIV/0!
441202 Fire Fighter Rescue Firefighter 0 #DIV/0!
441302 Police Officer (Non-Commissioned Metro) Metro Police Officer 0 #DIV/0!
441303 Traffic Officer Constable (City Traffic) 0 #DIV/0!
441303 Traffic Officer Driver testing / road safety / traffic safety 0 #DIV/0!
442204 Security Officer Security Safety & Emergency Services Manager 0 #DIV/0!
451401 Gallery or Museum Guide Gallery Assistant 0 #DIV/0!
451402 Tour Guide Tour Leader 0 #DIV/0!
451601 Tourists Information Officer Tourist Advisor 0 #DIV/0!
452311 Other Sports Official Recreation Co-ordinator 0 #DIV/0!
452404 Lifeguard Surf Patrolman 0 #DIV/0!
SUB-TOTALS 0 0 0 #DIV/0!
SOC500 SOC 500 Clerical and Administrative Workers
511101 Contract Administrator Contract Co-ordinator 0 #DIV/0!
511102 Contract Program & project Administrators Administrator 0 #DIV/0!
511102 Contract Program & project Administrators Senior Officer 0 #DIV/0!
511201 Office Administrator Office Co-ordinator 1 1 0 0%
531101 General Clerk Administration Clerk / Officer 0 #DIV/0!
532101 Data Entry Operator Data Control /Input Clerk 0 #DIV/0!
532103 Word Processing Operator Typist 0 #DIV/0!
541101 Call or Contract Centre Operator Communication Centre Operator 0 #DIV/0!
541201 Inquiry clerk Customer Services Clerk / Officer / Reception Officer 2 2 0 0%
542101 Receptionist (General) Client Services 0 #DIV/0!
551101 Accounts Clerk Debtors Clerk 1 1 0 0%
551201 Bookkeeper Bookkeeping Clerk 0 #DIV/0!
551301 Payroll Clerk Wage Clerk 1 1 0 0%
561301 Filing or Registry clerk Documentation Clerk / Officer 1 1 0 0%
561401 Mail Clerk Mail Assistant 0 #DIV/0!
561601 Switchboard Operator Telephone Operator / Attendant 2 2 0 0%
561902 Meter Reader Water / Electricity Meter Reader 0 #DIV/0!
591103 Purchasing Officer Procurement Administrator / Co-ordinator / Officer 0 #DIV/0!
591105 Stock Clerk Stores Maintenance Clerk 0 #DIV/0!
599401 Human Resource Clerk Human Resources Records Clerk 1 1 100%
599503 Motor Vehicle License Examiner Driver Licensing Clerk / Officer 0 #DIV/0!
599701 Library Assistant Library Attendant 0 #DIV/0!
599904 Radio Services Dispatcher Radio Telephone Dispatcher 0 #DIV/0!
612102 Property Manager Building Services Manager 0 #DIV/0!
621901 Materials Recycler Waste Recycler 0 #DIV/0!
621903 Amusement, Fitness or Sports Centre Attendant Swimming Pool Attendant 0 #DIV/0!
631102 Office Cashier Cashier 0 #DIV/0!
639402 Transport Conductor Bus / Train Ticket Inspector 0 #DIV/0!
SUB-TOTALS 9 8 1 11%
SOC700 Machinery Operators and Drivers
712101 Crane, Hoist or Lift Operator Cherry Picker Operator 0 #DIV/0!
712909 Water Plant Operator Sewerage Plant Operator 0 #DIV/0!
721201 Earthmoving Plant Operator (General) construction Plant Operator (General) 0 #DIV/0!
721205 Grader Operator Grader Driver 0 #DIV/0!
721903 Paving Plant Operator Asphalt Spreader Machine Operator 0 #DIV/0!
721905 Road roller Operator Road Repairer 0 #DIV/0!
721906 Streetsweeper Road Sweeper 0 #DIV/0!
731103 Emergency Vehicle Drivers Ambulance / Fire Driver 0 #DIV/0!
731201 Bus Driver School Bus Driver 0 #DIV/0!
733101 Truck Driver (General) Compactor Driver (Rubbish Collection) 0 #DIV/0!
733101 Truck Driver (General) Lorry Driver 0 #DIV/0!
741101 Store Person Stores Assistant 0 #DIV/0!
SUB-TOTALS 0 0 0 #DIV/0!
SOC800 SOC 800 Labourers
811201 Commercial Cleaner Building Exterior Cleaner 0 #DIV/0!
811904 Healthcare Cleaner Low Risk Area Cleaner 0 #DIV/0!
821101 Builder's Worker Pipe Layer 0 #DIV/0!
821101 Builder's Worker Road Construction / Maintenance Labourer 0 #DIV/0!
821101 Builder's Worker Road Surfaceman 0 #DIV/0!
821102 Drainage, Sewerage & Storm Water Worker Hydro Contract Worker 0 #DIV/0!
821103 Earthmoving Worker Ditch Digging Worker 0 #DIV/0!
821103 Earthmoving Worker Grave Digger 0 #DIV/0!
821201 Concreter Concrete Worker 0 #DIV/0!
821501 Paving & Surfacing Worker Roading Construction Worker 0 #DIV/0!
831202 Slaughterer Slaughtering Assistant 0 #DIV/0!
841402 Ornamental Horticultural or Nursery Assistant Horticultural / Nursery Worker 0 #DIV/0!
899101 Caretaker Janitor 0 #DIV/0!
899301 Handyperson Handyman 0 #DIV/0!
899601 Recycling or Rubbish Collector Garbage Collector 0 #DIV/0!
SUB-TOTALS 0 0 0 #DIV/0!
TOTALS 30 26 4 13%
Page 48

0
Section 10: Critical and Scarce Skills
Section 10.2 LGSETA Scarce Skills (Discretionary Grant Priority Areas) for 2012/2013
Strategic Priority Area: Mode of delivery:Total No. of
Beneficiaries
Infrastructure asset maintenance
Infrastructure asset maintenance
Labour intensive construction (EPWP)
Labour intensive construction (EPWP)
Electricity reticulation
Electricity reticulation
Water services
Water services
Roads
Roads
Roads
Other:
Other:
Other:
Other:
Property valuation Bursary 2
Property valuation
Audit and procurement Bursary 2
Audit and procurement
Municipal finance Skills Programme 14
Municipal finance
Municipal finance
Other:
Other:
Other:
Other:
Ward committees
Ward committees
Planning
Planning
IDPs
IDPs
LED Skills Programme 2
LED
LED
Other:
Other:
Other:
Other:
Training committees Skills Programme 10
Training committees
Councillors Skills Programme 14
Councillors
Municipal Leadership Development Skills Programme 7
Municipal Leadership Development
Other:
Other:
Other:
Other:
ABET
51
23.50%
Total Scarce Skills Training Beneficiaries
Total Beneficiaries of Scarce Skills Training as a % of Total Training Beneficiaries
Summary LGSETA Scarce Skills Data
Project Name:
Management and leadership
PLANNING
Infrastructure and service
delivery
Financial viability
Community based
participation and planning
Page 49

Section 10: Critical and Scarce Skills
Section 10.2 LGSETA Scarce Skills (Discretionary Grant Priority Areas) for 2011/2012
Strategic Priority Area: Mode of delivery:Planned No. of
Beneficiaries
Actual No. of
BeneficiariesDifference Reason for Difference
Infrastructure asset maintenance 0
Infrastructure asset maintenance 0
Labour intensive construction (EPWP) 0
Labour intensive construction (EPWP) 0
Electricity reticulation learnership 20 20 0
Electricity reticulation 0
Water services 0
Water services 0
Roads learnership 40 40 0
Roads 0
Roads 0
Other: 0
Other: 0
Other: 0
Other: 0
Property valuation 0
Property valuation 0
Audit and procurement 0
Audit and procurement 0
Municipal finance 0
Municipal finance 0
Municipal finance 0
Other: 0
Other: 0
Other: 0
Other: 0
Ward committees Skills Programme 60 75 15 Difference due to new nominations of ward committee
Ward committees 0
Planning 0
Planning 0
IDPs 0
IDPs 0
LED 0
LED 0
LED 0
Other: 0
Other: 0
Other: 0
Other: 0
Training committees 0
Training committees 0
Councillors 0
Councillors 0
Municipal Leadership Development 0
Municipal Leadership Development 0
Other: 0
Other: 0
Other: 0
Other: 0
ABET 0
135
135.00%
Management and leadership
Infrastructure and service
delivery
Financial viability
Community based
participation and planning
Total Beneficiaries of Scarce Skills Training as a % of Total Training Beneficiaries
Summary LGSETA Scarce Skills Data
Total Scarce Skills Training Beneficiaries
Project Name:
REPORTING - Annual Report Only
Page 50

0
PLANNINGSection 11: Number of beneficiaries to receive ABET training during the Financial Year 2012/2013Do not enter 0 into the fields below - only use a field if the number is 1 or greater.
M F M F M F M F M F
0 0 0 0
0 0 0 0
0 0 0 0
0 0 0 0
0 0 0 0
0 0 0 0
0 0 0 0
0 0 0 0
0 0 0 0
0 0 0 0 0 0 0 0 0 0 0 0 0 0
99
0
0.00%
SOC 800 Labourers
SOC 700 Machine Operators and Drivers
Summary ABET Data
% of employees w. NQF L1 and below who will receive ABET
Total no of employees w. NQF L1 and below
Total no of employees who will receive ABET (all levels)
African
SOC 400 Community and Personal Service Workers
Apprentices
TOTALS
SOC 500 Clerical and Administrative Workers
SOC 100 Legislators
SOC 100 Directors and Corporate Managers
SOC 200 Professionals
SOC 300 Technicians and Trade Workers
Coloured Indian White Total Total
F
Total
M
Total ABET Beneficiaries PWDEmployment category
Page 51

REPORTING - Quarterly and Annual Report
Section 11: Number of beneficiaries who received ABET during the Financial Year 2011/2012Do not enter 0 into the fields below - only use a field if the number is 1 or greater.
M F M F M F M F M F M F M F M F M F M F M F M F M F M F M F
0 0 0 0 0 0 0 0 0
0 0 0 0 0 0 0 0 0
0 0 0 0 0 0 0 0 0
0 0 0 0 0 0 0 0 0
0 0 0 0 0 0 0 0 0
0 0 0 0 0 0 0 0 0
0 0 0 0 0 0 0 0 0
0 0 0 0 0 0 0 0 0
0 0 0 0 0 0 0 0 0
0 0 0 0 0 0 0 0 0 0 0 0 0 0 0 0 0 0 0 0 0 0 0 0 0 0 0 0 0 0 0 0 0
M F M F M F M F M F M F M F M F M F M F M F M F M F M F M F
0 0 0 0 0 0 0 0 0
0 0 0 0 0 0 0 0 0
0 0 0 0 0 0 0 0 0
0 0 0 0 0 0 0 0 0
0 0 0 0 0 0 0 0 0
0 0 0 0 0 0 0 0 0
0 0 0 0 0 0 0 0 0
0 0 0 0 0 0 0 0 0
0 0 0 0 0 0 0 0 0
0 0 0 0 0 0 0 0 0 0 0 0 0 0 0 0 0 0 0 0 0 0 0 0 0 0 0 0 0 0 0 0 0
M F M F M F M F M F M F M F M F M F M F M F M F M F M F M F
0 0 0 0 0 0 0 0 0
0 0 0 0 0 0 0 0 0
0 0 0 0 0 0 0 0 0
0 0 0 0 0 0 0 0 0
0 0 0 0 0 0 0 0 0
0 0 0 0 0 0 0 0 0
0 0 0 0 0 0 0 0 0
0 0 0 0 0 0 0 0 0
0 0 0 0 0 0 0 0 0
0 0 0 0 0 0 0 0 0 0 0 0 0 0 0 0 0 0 0 0 0 0 0 0 0 0 0 0 0 0 0 0 0
M F M F M F M F M F M F M F M F M F M F M F M F M F M F M F
0 0 0 0 0 0 0 0 0
0 0 0 0 0 0 0 0 0
0 0 0 0 0 0 0 0 0
0 0 0 0 0 0 0 0 0
0 0 0 0 0 0 0 0 0
0 0 0 0 0 0 0 0 0
0 0 0 0 0 0 0 0 0
0 0 0 0 0 0 0 0 0
0 0 0 0 0 0 0 0 0
0 0 0 0 0 0 0 0 0 0 0 0 0 0 0 0 0 0 0 0 0 0 0 0 0 0 0 0 0 0 0 0 0
M F M F M F M F M F M F M F M F M F M F M F M F M F M F M F
0 0 0 0 0 0 0 0 0 0 0 0 0 0 0 0 0 0 0 0 0 0 0 0 0 0 0 0 0 0 0 0 0
0 0 0 0 0 0 0 0 0 0 0 0 0 0 0 0 0 0 0 0 0 0 0 0 0 0 0 0 0 0 0 0 0
0 0 0 0 0 0 0 0 0 0 0 0 0 0 0 0 0 0 0 0 0 0 0 0 0 0 0 0 0 0 0 0 0
0 0 0 0 0 0 0 0 0 0 0 0 0 0 0 0 0 0 0 0 0 0 0 0 0 0 0 0 0 0 0 0 0
0 0 0 0 0 0 0 0 0
Apprentices
SOC 100 Directors and Corporate Managers
SOC 400 Community and Personal Service Workers
SOC 700 Machine Operators and Drivers
SOC 800 Labourers
TOTALS
SOC 200 Professionals
Employment category Third Quarter
SOC 100 Legislators
Apprentices
SOC 300 Technicians and Trade Workers
SOC 700 Machine Operators and Drivers
SOC 800 Labourers
TOTALS
SOC 800 Labourers
SOC 700 Machine Operators and Drivers
SOC 300 Technicians and Trade Workers
TOTALS
SOC 100 Legislators
SOC 100 Directors and Corporate Managers
SOC 200 Professionals
SOC 400 Community and Personal Service Workers
SOC 500 Clerical and Administrative Workers
SOC 400 Community and Personal Service Workers
Employment category Second Quarter
SOC 500 Clerical and Administrative Workers
Apprentices
SOC 300 Technicians and Trade Workers
SOC 200 Professionals
SOC 100 Legislators
SOC 100 Directors and Corporate Managers
White Total TotalAfrican IndianColoured
ABET LEVEL 1 ABET LEVEL 2
TotalWhite Total Total African Coloured Indian White Total
ABET LEVEL 3
ABET LEVEL 3
African Coloured Indian
Total
ABET LEVEL 1
African Coloured Indian White AfricanTotal African Coloured Indian
ABET LEVEL 2
White Total Total Coloured Indian White Total
ABET LEVEL 2 ABET LEVEL 3
Total
African Coloured Indian White Total Total African
ABET LEVEL 1
Coloured Indian White Total Total African Coloured Indian White Total Total
SOC 500 Clerical and Administrative Workers
ABET LEVEL 1 ABET LEVEL 2 ABET LEVEL 3
African Coloured Indian White Total Total African Coloured Indian White Total Total African Coloured Indian White Total Total
SOC 100 Legislators
SOC 100 Directors and Corporate Managers
SOC 200 Professionals
SOC 800 Labourers
Apprentices
TOTALS
ABET LEVEL 1 ABET LEVEL 2 ABET LEVEL 3
African Coloured Indian White Total Total TotalTotal
Total No. Received Training in Quarter 1
Total No. Received Training in Quarter 2
Total African
Total Graduates
WhiteAfrican Coloured IndianColoured Indian White Total
Total No. Received Training in Quarter 3
Total No. Received Training in Quarter 4
Employment category First Quarter
Annual Report
Employment category Fourth Quarter
SOC 300 Technicians and Trade Workers
SOC 400 Community and Personal Service Workers
SOC 500 Clerical and Administrative Workers
SOC 700 Machine Operators and Drivers
Page 52

M F M F M F M F M F M F M F M F M F M F
0 0 0 0 0 0 0
0 0 0 0 0 0 0
0 0 0 0 0 0 0
0 0 0 0 0 0 0
0 0 0 0 0 0 0
0 0 0 0 0 0 0
0 0 0 0 0 0 0
0 0 0 0 0 0 0
0 0 0 0 0 0 0
0 0 0 0 0 0 0 0 0 0 0 0 0 0 0 0 0 0 0 0 0 0 0 0 0
M F M F M F M F M F M F M F M F M F M F
0 0 0 0 0 0 0
0 0 0 0 0 0 0
0 0 0 0 0 0 0
0 0 0 0 0 0 0
0 0 0 0 0 0 0
0 0 0 0 0 0 0
0 0 0 0 0 0 0
0 0 0 0 0 0 0
0 0 0 0 0 0 0
0 0 0 0 0 0 0 0 0 0 0 0 0 0 0 0 0 0 0 0 0 0 0 0 0
M F M F M F M F M F M F M F M F M F M F
0 0 0 0 0 0 0
0 0 0 0 0 0 0
0 0 0 0 0 0 0
0 0 0 0 0 0 0
0 0 0 0 0 0 0
0 0 0 0 0 0 0
0 0 0 0 0 0 0
0 0 0 0 0 0 0
0 0 0 0 0 0 0
0 0 0 0 0 0 0 0 0 0 0 0 0 0 0 0 0 0 0 0 0 0 0 0 0
M F M F M F M F M F M F M F M F M F M F
0 0 0 0 0 0 0
0 0 0 0 0 0 0
0 0 0 0 0 0 0
0 0 0 0 0 0 0
0 0 0 0 0 0 0
0 0 0 0 0 0 0
0 0 0 0 0 0 0
0 0 0 0 0 0 0
0 0 0 0 0 0 0
0 0 0 0 0 0 0 0 0 0 0 0 0 0 0 0 0 0 0 0 0 0 0 0 0
M F M F M F M F M F M F M F M F M F M F
0 0 0 0 0 0 0 0 0 0 0 0 0 0 0 0 0 0 0 0 0 0 0 0 0
0 0 0 0 0 0 0 0 0 0 0 0 0 0 0 0 0 0 0 0 0 0 0 0 0
0 0 0 0 0 0 0 0 0 0 0 0 0 0 0 0 0 0 0 0 0 0 0 0 0
0 0 0 0 0 0 0 0 0 0 0 0 0 0 0 0 0 0 0 0 0 0 0 0 0
0 0 0 0 0 0 0
PWD
African Coloured
ABET LEVEL 4 NQF LEVEL 1
African Coloured IndianTotalIndian White Total TotalWhite Total Total
M
ABET LEVEL 4 NQF LEVEL 1 PWD
F
Coloured Indian
M F
TotalColoured Indian White Total
ABET LEVEL 4
TotalWhite Total Total AfricanAfrican
NQF LEVEL 1 PWD
ColouredAfrican Indian
F
Coloured Indian White Total Total TotalTotal African Total
ABET LEVEL 4 NQF LEVEL 1 PWD
White
M
African Coloured Indian WhiteIndian White Total Total TotalTotal Total
M F
African Coloured
IndianColoured
ABET LEVEL 4 NQF LEVEL 1 PWD
African TotalWhite Total Total
M F
African ColouredIndian White Total Total
Page 53

0
PLANNINGSection 12: Number of beneficiaries to be trained during the Financial Year 2012/2013Do not enter 0 into the fields below - only use a field if the number is 1 or greater.
M F M F M F M F M F M F M F M F M F M F M F
Executive Mayor 0 0 0 0 0 0 0
Mayor 1 1 0 1 1 0 1 1 0
Local Government Legislators (Councillors) 6 2 1 1 2 1 9 4 13 2 1 5 2 3 9 4 13 0
Traditional Leaders & Heads of Villages 0 0 0 0 0 0 0
Other (specify below)
Ward Committee Members 0 0 0 0 0 0 0
7 2 1 1 0 0 2 1 10 4 14 0 0 0 0 2 1 5 1 2 3 9 5 14 0 0 0
11131 City/Municipal Manager 1 1 0 1 1 1 0 1 0
11133 General Managers 0 0 0 0 0 0 0
1211 Corporate Services Managers 1 1 0 1 1 1 0 1 0
1212 Finance Managers 2 2 0 2 1 1 2 0 2 0
1213 Human Resource Managers 0 0 0 0 0 0 0
1214 Policy and Planning Managers 0 0 0 0 0 0 0
1221 Engineering Managers 0 0 0 0 0 0 0
1222 Construction Managers 0 0 0 0 0 0 0
1231 ICT Managers 0 0 0 0 0 0 0
1251 Health, Welfare and Education Service Managers 0 0 0 0 0 0 0
12922 Commissioned Fire Officer 0 0 0 0 0 0 0
12923 Commissioned Police Officer (Metro/Traffic Police) 0 0 0 0 0 0 0
12991 Laboratory Managers 0 0 0 0 0 0 0
12992 Environment, Parks and Land Care Managers 0 0 0 0 0 0 0
12993 Sports Administrator or Manager 0 0 0 0 0 0 0
12994 Arts Administrator or Managers 0 0 0 0 0 0 0
1491 Sport and Recreation Managers 0 0 0 0 0 0 0
1492 Customer Services Managers 0 0 0 0 0 0 0
Other (specify below)
0 0 0 0 0 0 0
4 0 0 0 0 0 0 0 4 0 4 0 0 1 0 1 0 2 0 0 0 4 0 4 0 0 0
Core Admin 0 0 0 0 0 0 0
Core Finance 0 0 0 0 0 0 0
Legal 0 0 0 0 0 0 0
IT 0 0 0 0 0 0 0
Procurement 0 0 0 0 0 0 0
1 0 1 1 1 0 1 1 0
Property Valuation 1 0 1 1 1 0 1 1 0
Rates 0 0 0 0 0 0 0
Billing 1 1 0 1 1 0 1 1 0
Client Services 4 1 4 1 5 3 1 1 4 1 5 0
Parks 0 0 0 0 0 0 0
Community Facilities 0 0 0 0 0 0 0
Libraries 0 0 0 0 0 0 0
Recreation Centres 0 0 0 0 0 0 0
Primary Health Care Facilities 0 0 0 0 0 0 0
Cemeteries 0 0 0 0 0 0 0
Environmental Health 0 0 0 0 0 0 0
Pollution Control 0 0 0 0 0 0 0
By-laws 0 0 0 0 0 0 0
Licensing 0 0 0 0 0 0 0
Fire & rescue 0 0 0 0 0 0 0
Disaster Planning and Management 0 0 0 0 0 0 0
Public Safety 0 0 0 0 0 0 0
Traffic Management 0 0 0 0 0 0 0
0 0 0 0 0 0 0
LED/IDP/Urban Planning 0 0 0 0 0 0 0
Land use management 0 0 0 0 0 0 0
0 0 0 0 0 0 0
Roads and Stormwater 0 0 0 0 0 0 0
Solid Waste and Landfill 0 0 0 0 0 0 0
Water supply and waste water 0 0 0 0 0 0 0
Electricity 0 0 0 0 0 0 0
5 2 0 1 0 0 0 0 5 3 8 0 0 0 0 3 2 1 2 0 0 4 4 8 0 0 0
Total- 20 21-30 31-40
Total+ 51 Total
TotalAfrican Coloured Indian White Total
Age categories PWD
Emergency
Services
Employment category
Environmental
Management
SUB-TOTALS
SOC 100 Legislators
41-50F
HR and Training
MCode
Race
SOC 100 Directors and Corporate Managers
Legal
Financial
Services
SUB-TOTALS
Community
Services
Public Transport
Municipal
Planning
Housing
Technical
Services
SUB-TOTALS
Community
Safety
SOC 200 Professionals
Corporate
Services
Page 54

M F M F M F M F M F M F M F M F M F M F M FTotal
- 20 21-30 31-40Total
+ 51 TotalTotal
African Coloured Indian White Total
Age categories PWD
Employment category
SOC 100 Legislators
41-50FM
Code
Race
Core Admin 0 0 0 0 0 0 0
Core Finance 0 0 0 0 0 0 0
Legal 0 0 0 0 0 0 0
IT 0 0 0 0 0 0 0
Procurement 0 0 0 0 0 0 0
0 0 0 0 0 0 0
Property Valuation 0 0 0 0 0 0 0
Rates 0 0 0 0 0 0 0
Billing 0 0 0 0 0 0 0Client Services 0 0 0 0 0 0 0
Parks 0 0 0 0 0 0 0
Community Facilities 0 0 0 0 0 0 0
Libraries 0 0 0 0 0 0 0
Recreation Centres 0 0 0 0 0 0 0
Primary Health Care Facilities 0 0 0 0 0 0 0
Cemeteries 0 0 0 0 0 0 0
Environmental Health 0 0 0 0 0 0 0
Pollution Control 0 0 0 0 0 0 0
By-laws 0 0 0 0 0 0 0
Licensing 0 0 0 0 0 0 0
Fire & rescue 0 0 0 0 0 0 0
Disaster Planning and Management 0 0 0 0 0 0 0
Public Safety 0 0 0 0 0 0 0
Traffic Management 0 0 0 0 0 0 0
0 0 0 0 0 0 0
LED/IDP/Urban Planning 0 0 0 0 0 0 0
Land use management 0 0 0 0 0 0 0
0 0 0 0 0 0 0
Roads and Stormwater 11 11 0 11 6 5 11 0 11 0
Solid Waste and Landfill 0 0 0 0 0 0 0
Water supply and waste water 0 0 0 0 0 0 0
Electricity 0 0 0 0 0 0 0
11 0 0 0 0 0 0 0 11 0 11 0 0 6 0 5 0 0 0 0 0 11 0 11 0 0 0
Core Admin 0 0 0 0 0 0 0
Core Finance 0 0 0 0 0 0 0
Legal 0 0 0 0 0 0 0
IT 0 0 0 0 0 0 0Procurement 0 0 0 0 0 0 0
0 0 0 0 0 0 0
Property Valuation 0 0 0 0 0 0 0
Rates 0 0 0 0 0 0 0
Billing 0 0 0 0 0 0 0
Client Services 0 0 0 0 0 0 0
Parks 0 0 0 0 0 0 0
Community Facilities 0 0 0 0 0 0 0
Libraries 1 2 0 3 3 1 2 0 3 3 0
Recreation Centres 0 0 0 0 0 0 0
Primary Health Care Facilities 0 0 0 0 0 0 0
Cemeteries 0 0 0 0 0 0 0
Environmental Health 0 0 0 0 0 0 0
Pollution Control 0 0 0 0 0 0 0
By-laws 0 0 0 0 0 0 0
Licensing 0 0 0 0 0 0 0
Fire & rescue 0 0 0 0 0 0 0
Disaster Planning and Management 0 0 0 0 0 0 0
Public Safety 0 0 0 0 0 0 0
Traffic Management 3 1 2 5 1 6 1 2 1 2 6 0 6 0
0 0 0 0 0 0 0
LED/IDP/Urban Planning 0 0 0 0 0 0 0
Land use management 0 0 0 0 0 0 0
0 0 0 0 0 0 0
Roads and Stormwater 0 0 0 0 0 0 0
Solid Waste and Landfill 0 0 0 0 0 0 0
Water supply and waste water 0 0 0 0 0 0 0
Electricity 0 0 0 0 0 0 0
3 2 0 0 0 0 2 2 5 4 9 0 0 1 0 2 1 1 0 2 2 6 3 9 0 0 0
Housing
Environmental
Management
Legal
Emergency
Services
Public Transport
Municipal
Planning
Technical
Services
Emergency
Services
Community
Safety
SUB-TOTALS
Environmental
Management
Legal
SOC 300 Technicians and Trade Workers
Corporate
Services
Housing
Technical
Services
SUB-TOTALS
SOC 400 Community and Personal Service Workers
HR and Training
Financial
Services
Community
Services
Community
Safety
Public Transport
Municipal
Planning
Corporate
Services
HR and Training
Financial
Services
Community
Services
Page 55

M F M F M F M F M F M F M F M F M F M F M FTotal
- 20 21-30 31-40Total
+ 51 TotalTotal
African Coloured Indian White Total
Age categories PWD
Employment category
SOC 100 Legislators
41-50FM
Code
Race
Core Admin 3 3 1 3 4 7 1 2 1 1 1 1 2 5 7 1 1 2
Core Finance 0 0 0 0 0 0 0
Legal 0 0 0 0 0 0 0
IT 0 0 0 0 0 0 0
Procurement 0 0 0 0 0 0 0
0 0 0 0 0 0 0
Property Valuation 0 0 0 0 0 0 0
Rates 1 1 1 1 2 2 0 2 2 0
Billing 4 3 3 1 1 1 8 5 13 4 2 3 1 3 7 6 13 0
Client Services 10 1 1 1 11 2 13 1 1 4 2 4 1 9 4 13 0
Parks 0 0 0 0 0 0 0
Community Facilities 0 0 0 0 0 0 0
Libraries 0 0 0 0 0 0 0
Recreation Centres 0 0 0 0 0 0 0
Primary Health Care Facilities 0 0 0 0 0 0 0
Cemeteries 0 0 0 0 0 0 0
Environmental Health 0 0 0 0 0 0 0
Pollution Control 0 0 0 0 0 0 0
By-laws 0 0 0 0 0 0 0
Licensing 0 0 0 0 0 0 0
Fire & rescue 0 0 0 0 0 0 0
Disaster Planning and Management 0 0 0 0 0 0 0
Public Safety 0 0 0 0 0 0 0
Traffic Management 0 0 0 0 0 0 0
0 0 0 0 0 0 0
LED/IDP/Urban Planning 0 0 0 0 0 0 0
Land use management 0 0 0 0 0 0 0
0 0 0 0 0 0 0
Roads and Stormwater 0 0 0 0 0 0 0
Solid Waste and Landfill 0 0 0 0 0 0 0
Water supply and waste water 0 0 0 0 0 0 0
Electricity 0 0 0 0 0 0 0
18 8 4 2 0 0 1 2 23 12 35 0 0 2 3 8 5 8 3 0 6 18 17 35 1 1 2
Core Admin 0 0 0 0 0 0 0
Core Finance 0 0 0 0 0 0 0
Legal 0 0 0 0 0 0 0
IT 0 0 0 0 0 0 0
Procurement 0 0 0 0 0 0 0
0 0 0 0 0 0 0
Property Valuation 0 0 0 0 0 0 0
Rates 0 0 0 0 0 0 0
Billing 0 0 0 0 0 0 0
Client Services 0 0 0 0 0 0 0
Parks 0 0 0 0 0 0 0
Community Facilities 0 0 0 0 0 0 0
Libraries 0 0 0 0 0 0 0
Recreation Centres 0 0 0 0 0 0 0
Primary Health Care Facilities 0 0 0 0 0 0 0
Cemeteries 0 0 0 0 0 0 0
Environmental Health 0 0 0 0 0 0 0
Pollution Control 0 0 0 0 0 0 0
By-laws 0 0 0 0 0 0 0
Licensing 0 0 0 0 0 0 0
Fire & rescue 0 0 0 0 0 0 0
Disaster Planning and Management 0 0 0 0 0 0 0
Public Safety 0 0 0 0 0 0 0
Traffic Management 0 0 0 0 0 0 0
0 0 0 0 0 0 0
LED/IDP/Urban Planning 0 0 0 0 0 0 0
Land use management 0 0 0 0 0 0 0
0 0 0 0 0 0 0
Roads and Stormwater 0 0 0 0 0 0 0
Solid Waste and Landfill 0 0 0 0 0 0 0
Water supply and waste water 0 0 0 0 0 0 0
Electricity 0 0 0 0 0 0 0
0 0 0 0 0 0 0 0 0 0 0 0 0 0 0 0 0 0 0 0 0 0 0 0 0 0 0SUB-TOTALS
Emergency
Services
Housing
Environmental
Management
Legal
Community
Services
Corporate
Services
HR and Training
Financial
Services
Housing
Community
Safety
Public Transport
Municipal
Planning
SOC 500 Clerical and Administrative Workers
Corporate
Services
HR and Training
Financial
Services
Emergency
Services
SUB-TOTALS
SOC 700 Machine Operators and Drivers
Community
Safety
Public Transport
Municipal
Planning
Technical
Services
Legal
Community
Services
Environmental
Management
Technical
Services
Page 56

M F M F M F M F M F M F M F M F M F M F M FTotal
- 20 21-30 31-40Total
+ 51 TotalTotal
African Coloured Indian White Total
Age categories PWD
Employment category
SOC 100 Legislators
41-50FM
Code
Race
Core Admin 3 12 3 3 15 18 2 3 7 6 3 15 18 0
Core Finance 0 0 0 0 0 0 0
Legal 0 0 0 0 0 0 0
IT 0 0 0 0 0 0 0
Procurement 0 0 0 0 0 0 0
0 0 0 0 0 0 0
Property Valuation 0 0 0 0 0 0 0
Rates 0 0 0 0 0 0 0
Billing 0 0 0 0 0 0 0
Client Services 0 0 0 0 0 0 0
Parks 0 0 0 0 0 0 0
Community Facilities 0 0 0 0 0 0 0
Libraries 0 0 0 0 0 0 0
Recreation Centres 0 0 0 0 0 0 0
Primary Health Care Facilities 0 0 0 0 0 0 0
Cemeteries 0 0 0 0 0 0 0
Environmental Health 0 0 0 0 0 0 0
Pollution Control 0 0 0 0 0 0 0
By-laws 0 0 0 0 0 0 0
Licensing 0 0 0 0 0 0 0
Fire & rescue 0 0 0 0 0 0 0
Disaster Planning and Management 0 0 0 0 0 0 0
Public Safety 0 0 0 0 0 0 0
Traffic Management 0 0 0 0 0 0 0
0 0 0 0 0 0 0
LED/IDP/Urban Planning 0 0 0 0 0 0 0
Land use management 0 0 0 0 0 0 0
0 0 0 0 0 0 0
Roads and Stormwater 22 1 22 1 23 1 15 7 22 1 23 0
Solid Waste and Landfill 0 0 0 0 0 0 0
Water supply and waste water 0 0 0 0 0 0 0
Electricity 1 2 3 0 3 1 2 3 0 3 0
26 13 2 3 0 0 0 0 28 16 44 0 0 0 0 1 3 20 7 7 6 28 16 44 0 0 0
Roads and Stormwater 0 0 0 0 0 0 0
Solid Waste and Landfill 0 0 0 0 0 0 0
Water supply and waste water 0 0 0 0 0 0 0
Electricity 0 0 0 0 0 0 0
0 0 0 0 0 0 0 0 0 0 0 0 0 0 0 0 0 0 0 0 0 0 0 0 0 0 0
74 27 7 7 0 0 5 5 86 39 125 0 0 10 3 22 12 37 13 11 17 80 45 125 1 1 2
Total beneficiaries 50 and below 97
50 and below beneficiaries as a % of total beneficiaries 77.60%
Total beneficiaries with Disabilities 2Beneficiaries with disabilities as a % of total beneficiaries 1.60%
Total number of women beneficiaries 39Women beneficiaries as a % of total beneficiaries 31.20%
Summary Beneficiary Data
Total number of black (African, Coloured, Indian) beneficiaries 115Black beneficiaries as a % of total beneficiaries 92.00%
Total number of beneficiaries 125Beneficiaries as a % of total employees 47.17%
Environmental
Management
SOC 800 Labourers
Corporate
Services
Emergency
Services
HR and Training
Financial
Services
Community
Services
Legal
SUB-TOTALS
TOTALS
Community
Safety
Public Transport
Municipal
Planning
Technical
Services
Apprentices
Housing
SUB-TOTALS
Technical
Services
Page 57

REPORTING - Annual Report OnlySection 12: Number of beneficiaries trained during the Financial Year 2011/2012Do not enter 0 into the fields below - only use a field if the number is 1 or greater.
M F M F M F M F M F M F M F M F M F M F M F
Executive Mayor 0 0 0 0 0 0 0
Mayor 1 0 1 1 1 0 1 1 0
1112 Local Government SOC 100 Legislators (Councillors) 6 2 1 1 2 1 9 4 13 2 1 5 2 3 9 4 13 0
1113 Traditional Leaders & Heads of Villages 0 0 0 0 0 0 0
Other (specify below)
0 0 0 0 0 0 0
6 3 1 1 0 0 2 1 9 5 14 0 0 0 0 2 1 5 1 2 3 9 5 14 0 0 0
11131 City/Municipal Manager 1 1 0 1 1 1 0 1 0
11133 General Managers 0 0 0 0 0 0 0
1211 Corporate Services Managers 0 0 0 0 0 0 0
1212 Finance Managers 0 0 0 0 0 0 0
1213 Human Resource Managers 1 1 0 1 1 1 0 1 0
1214 Policy and Planning Managers 1 1 2 0 2 1 1 2 0 2 0
1221 Engineering Managers 0 0 0 0 0 0 0
1222 Construction Managers 0 0 0 0 0 0 0
1231 ICT Managers 0 0 0 0 0 0 0
1251 Health, Welfare and Education Service Managers 0 0 0 0 0 0 0
12922 Commissioned Fire Officer 0 0 0 0 0 0 0
12923 Commissioned Police Officer (Metro/Traffic Police) 0 0 0 0 0 0 0
12991 Laboratory Managers 0 0 0 0 0 0 0
12992 Environment, Parks and Land Care Managers 0 0 0 0 0 0 0
12993 Sports Administrator or Manager 0 0 0 0 0 0 0
12994 Arts Administrator or Managers 0 0 0 0 0 0 0
1491 Sport and Recreation Managers 0 0 0 0 0 0 0
1492 Customer Services Managers 0 0 0 0 0 0 0
Other (specify below)
0 0 0 0 0 0 0
3 0 1 0 0 0 0 0 4 0 4 0 0 1 0 1 0 2 0 0 0 4 0 4 0 0 0
Core Admin 0 0 0 0 0 0 0
Core Finance 0 0 0 0 0 0 0
Legal 0 0 0 0 0 0 0
IT 0 0 0 0 0 0 0
Procurement 0 0 0 0 0 0 0
1 0 1 1 1 0 1 1 0
Property Valuation 1 0 1 1 1 0 1 1 0
Rates 0 0 0 0 0 0 0
Billing 1 1 0 1 0 0 0 0
Client Services 4 1 4 1 5 3 1 1 4 1 5 0
Parks 0 0 0 0 0 0 0
Community Facilities 0 0 0 0 0 0 0
Libraries 0 0 0 0 0 0 0
Recreation Centres 0 0 0 0 0 0 0
Primary Health Care Facilities 0 0 0 0 0 0 0
Cemeteries 0 0 0 0 0 0 0
Environmental Health 0 0 0 0 0 0 0
Pollution Control 0 0 0 0 0 0 0
By-laws 0 0 0 0 0 0 0
Licensing 0 0 0 0 0 0 0
Fire & rescue 0 0 0 0 0 0 0
Disaster Planning and Management 0 0 0 0 0 0 0
Public Safety 0 0 0 0 0 0 0
Traffic Management 0 0 0 0 0 0 0
0 0 0 0 0 0 0
LED/IDP/Urban Planning 0 0 0 0 0 0 0
Land use management 0 0 0 0 0 0 0
0 0 0 0 0 0 0
Roads and Stormwater 0 0 0 0 0 0 0
Solid Waste and Landfill 0 0 0 0 0 0 0
Water supply and waste water 0 0 0 0 0 0 0
Electricity 0 0 0 0 0 0 0
5 2 0 1 0 0 0 0 5 3 8 0 0 3 1 1 1 0 1 0 0 4 3 7 0 0 0
+ 51Total
TotalTotal M F
- 20 21-30 31-40 41-50
Age categories PWD
African Coloured Indian White
Race
TotalTotal
SOC 100 Legislators
SUB-TOTALS
SOC 100 Directors and Corporate Managers
Corporate
Services
HR and Training
Financial
Services
Emergency
ServicesCommunity
Safety
Public Transport
Code
Community
Services
Environmental
Management
Legal
SUB-TOTALS
SOC 200 Professionals
Employment category
Municipal
Planning
Housing
Technical
Services
SUB-TOTALS
Page 58

M F M F M F M F M F M F M F M F M F M F M F
+ 51Total
TotalTotal M F
- 20 21-30 31-40 41-50
Age categories PWD
African Coloured Indian White
Race
TotalTotal
SOC 100 Legislators
Code Employment category
Core Admin 0 0 0 0 0 0 0
Core Finance 0 0 0 0 0 0 0
Legal 0 0 0 0 0 0 0
IT 0 0 0 0 0 0 0
Procurement 0 0 0 0 0 0 0
0 0 0 0 0 0 0
Property Valuation 0 0 0 0 0 0 0
Rates 0 0 0 0 0 0 0
Billing 0 0 0 0 0 0 0Client Services 0 0 0 0 0 0 0
Parks 0 0 0 0 0 0 0
Community Facilities 0 0 0 0 0 0 0
Libraries 0 0 0 0 0 0 0
Recreation Centres 0 0 0 0 0 0 0
Primary Health Care Facilities 0 0 0 0 0 0 0
Cemeteries 0 0 0 0 0 0 0
Environmental Health 0 0 0 0 0 0 0
Pollution Control 0 0 0 0 0 0 0
By-laws 0 0 0 0 0 0 0
Licensing 0 0 0 0 0 0 0
Fire & rescue 0 0 0 0 0 0 0
Disaster Planning and Management 0 0 0 0 0 0 0
Public Safety 0 0 0 0 0 0 0
Traffic Management 0 0 0 0 0 0 0
0 0 0 0 0 0 0
LED/IDP/Urban Planning 0 0 0 0 0 0 0
Land use management 0 0 0 0 0 0 0
0 0 0 0 0 0 0
Roads and Stormwater 0 0 0 0 0 0 0
Solid Waste and Landfill 0 0 0 0 0 0 0
Water supply and waste water 0 0 0 0 0 0 0
Electricity 0 0 0 0 0 0 0
0 0 0 0 0 0 0 0 0 0 0 0 0 0 0 0 0 0 0 0 0 0 0 0 0 0 0
Core Admin 0 0 0 0 0 0 0
Core Finance 0 0 0 0 0 0 0
Legal 0 0 0 0 0 0 0
IT 0 0 0 0 0 0 0Procurement 0 0 0 0 0 0 0
0 0 0 0 0 0 0
Property Valuation 0 0 0 0 0 0 0
Rates 0 0 0 0 0 0 0
Billing 0 0 0 0 0 0 0
Client Services 0 0 0 0 0 0 0
Parks 0 0 0 0 0 0 0
Community Facilities 0 0 0 0 0 0 0
Libraries 1 1 0 2 2 1 1 0 2 2 0
Recreation Centres 0 0 0 0 0 0 0
Primary Health Care Facilities 0 0 0 0 0 0 0
Cemeteries 0 0 0 0 0 0 0
Environmental Health 0 0 0 0 0 0 0
Pollution Control 0 0 0 0 0 0 0
By-laws 0 0 0 0 0 0 0
Licensing 0 0 0 0 0 0 0
Fire & rescue 0 0 0 0 0 0
Disaster Planning and Management 0 0 0 0 0 0 0
Public Safety 0 0 0 0 0 0 0
Traffic Management 0 0 0 0 0 0 0
0 0 0 0 0 0 0
LED/IDP/Urban Planning 0 0 0 0 0 0 0
Land use management 0 0 0 0 0 0 0
0 0 0 0 0 0 0
Roads and Stormwater 0 0 0 0 0 0 0
Solid Waste and Landfill 0 0 0 0 0 0 0
Water supply and waste water 0 0 0 0 0 0 0
Electricity 0 0 0 0 0 0 0
0 1 0 0 0 0 0 1 0 2 2 0 0 0 0 0 1 0 0 0 1 0 2 2 0 0 0
Environmental
Management
Legal
SUB-TOTALS
Financial
Services
Community
Services
Technical
Services
Corporate
Services
HR and Training
Emergency
Services
Community
Safety
Public Transport
Municipal
Planning
Housing
Environmental
Management
Legal
Emergency
Services
Public Transport
Corporate
Services
HR and Training
Financial
Services
Community
Services
SOC 400 Community and Personal Service Workers
Municipal
Planning
Housing
Technical
Services
Community
Safety
SUB-TOTALS
SOC 300 Technicians and Trade Workers
Page 59

M F M F M F M F M F M F M F M F M F M F M F
+ 51Total
TotalTotal M F
- 20 21-30 31-40 41-50
Age categories PWD
African Coloured Indian White
Race
TotalTotal
SOC 100 Legislators
Code Employment category
Core Admin 2 2 1 2 3 5 2 2 1 2 2 5 7 1 1 2
Core Finance 0 0 0 0 0 0 0
Legal 0 0 0 0 0 0 0
IT 0 0 0 0 0 0 0
Procurement 0 0 0 0 0 0 0
0 0 0 0 0 0 0
Property Valuation 0 0 0 0 0 0 0
Rates 1 1 1 1 2 1 1 1 1 2 0
Billing 3 0 3 3 3 3 0 3 0
Client Services 0 0 0 0 0 0 0
Parks 0 0 0 0 0 0 0
Community Facilities 0 0 0 0 0 0 0
Libraries 0 0 0 0 0 0 0
Recreation Centres 0 0 0 0 0 0 0
Primary Health Care Facilities 0 0 0 0 0 0 0
Cemeteries 0 0 0 0 0 0 0
Environmental Health 0 0 0 0 0 0 0
Pollution Control 0 0 0 0 0 0 0
By-laws 0 0 0 0 0 0 0
Licensing 0 0 0 0 0 0 0
Fire & rescue 0 0 0 0 0 0 0
Disaster Planning and Management 0 0 0 0 0 0 0
Public Safety 0 0 0 0 0 0 0
Traffic Management 0 0 0 0 0 0 0
0 0 0 0 0 0 0
LED/IDP/Urban Planning 0 0 0 0 0 0 0
Land use management 0 0 0 0 0 0 0
0 0 0 0 0 0 0
Roads and Stormwater 0 0 0 0 0 0 0
Solid Waste and Landfill 0 0 0 0 0 0 0
Water supply and waste water 0 0 0 0 0 0 0
Electricity 0 0 0 0 0 0 0
3 6 0 0 0 0 0 1 3 7 10 0 0 2 2 3 1 1 2 0 1 6 6 12 1 1 2
Core Admin 0 0 0 0 0 0 0
Core Finance 0 0 0 0 0 0 0
Legal 0 0 0 0 0 0 0
IT 0 0 0 0 0 0 0
Procurement 0 0 0 0 0 0 0
0 0 0 0 0 0 0
Property Valuation 0 0 0 0 0 0 0
Rates 0 0 0 0 0 0 0
Billing 0 0 0 0 0 0 0
Client Services 0 0 0 0 0 0 0
Parks 0 0 0 0 0 0 0
Community Facilities 0 0 0 0 0 0 0
Libraries 0 0 0 0 0 0 0
Recreation Centres 0 0 0 0 0 0 0
Primary Health Care Facilities 0 0 0 0 0 0 0
Cemeteries 0 0 0 0 0 0 0
Environmental Health 0 0 0 0 0 0 0
Pollution Control 0 0 0 0 0 0 0
By-laws 0 0 0 0 0 0 0
Licensing 0 0 0 0 0 0 0
Fire & rescue 0 0 0 0 0 0 0
Disaster Planning and Management 0 0 0 0 0 0 0
Public Safety 0 0 0 0 0 0 0
Traffic Management 0 0 0 0 0 0 0
0 0 0 0 0 0 0
LED/IDP/Urban Planning 0 0 0 0 0 0 0
Land use management 0 0 0 0 0 0 0
0 0 0 0 0 0 0
Roads and Stormwater 0 0 0 0 0 0 0
Solid Waste and Landfill 0 0 0 0 0 0 0
Water supply and waste water 7 8 3 10 8 18 1 5 5 2 2 1 2 10 8 18 0
Electricity 0 0 0 0 0 0 0
7 8 3 0 0 0 0 0 10 8 18 0 0 1 5 5 2 2 1 2 0 10 8 18 0 0 0
HR and Training
Financial
Services
Emergency
Services
Community
Safety
Public Transport
SOC 500 Clerical and Administrative Workers
Environmental
Management
Legal
Community
Services
Corporate
Services
Community
Safety
Financial
Services
Municipal
Planning
Housing
Technical
Services
Community
Services
Corporate
Services
SUB-TOTALS
SOC 700 Machine Operators and Drivers
HR and Training
Municipal
Planning
Technical
Services
SUB-TOTALS
Emergency
Services
Housing
Environmental
Management
Public Transport
Legal
Page 60

M F M F M F M F M F M F M F M F M F M F M F
+ 51Total
TotalTotal M F
- 20 21-30 31-40 41-50
Age categories PWD
African Coloured Indian White
Race
TotalTotal
SOC 100 Legislators
Code Employment category
Core Admin 0 0 0 0 0 0 0
Core Finance 0 0 0 0 0 0 0
Legal 0 0 0 0 0 0 0
IT 0 0 0 0 0 0 0
Procurement 0 0 0 0 0 0 0
0 0 0 0 0 0 0
Property Valuation 0 0 0 0 0 0 0
Rates 0 0 0 0 0 0 0
Billing 0 0 0 0 0 0 0
Client Services 0 0 0 0 0 0 0
Parks 0 0 0 0 0 0 0
Community Facilities 0 0 0 0 0 0 0
Libraries 0 0 0 0 0 0 0
Recreation Centres 0 0 0 0 0 0 0
Primary Health Care Facilities 0 0 0 0 0 0 0
Cemeteries 0 0 0 0 0 0 0
Environmental Health 0 0 0 0 0 0 0
Pollution Control 0 0 0 0 0 0 0
By-laws 0 0 0 0 0 0 0
Licensing 0 0 0 0 0 0 0
Fire & rescue 0 0 0 0 0 0 0
Disaster Planning and Management 0 0 0 0 0 0 0
Public Safety 0 0 0 0 0 0 0
Traffic Management 0 0 0 0 0 0 0
0 0 0 0 0 0 0
LED/IDP/Urban Planning 0 0 0 0 0 0 0
Land use management 0 0 0 0 0 0 0
0 0 0 0 0 0 0
Roads and Stormwater 2 2 0 2 2 2 0 2 0
Solid Waste and Landfill 0 0 0 0 0 0 0
Water supply and waste water 0 0 0 0 0 0 0
Electricity 1 1 0 1 1 1 0 1 0
3 0 0 0 0 0 0 0 3 0 3 0 0 0 0 0 0 3 0 0 0 3 0 3 0 0 0
Roads and Stormwater 0 0 0 0 0 0 0
Solid Waste and Landfill 0 0 0 0 0 0 0
Water supply and waste water 0 0 0 0 0 0 0
Electricity 0 0 0 0 0 0 0
0 0 0 0 0 0 0 0 0 0 0 0 0 0 0 0 0 0 0 0 0 0 0 0 0 0 0
27 20 5 2 0 0 2 3 34 25 59 0 0 7 8 12 6 13 5 4 5 36 24 60 1 1 2
Total beneficiaries 50 and below 51
50 and below beneficiaries as a % of total beneficiaries 85.00%
Total beneficiaries with Disabilities 2Beneficiaries with disabilities as a % of total beneficiaries 3.39%
Total number of women beneficiaries 25Women beneficiaries as a % of total beneficiaries 42.37%
Summary Beneficiary Data
Total number of beneficiaries 59Beneficiaries as a % of total employees 22.26%
Total number of black (African, Coloured, Indian) beneficiaries 54Black beneficiaries as a % of total beneficiaries 91.53%
Community
Services
Corporate
Services
HR and Training
Financial
Services
Legal
SOC 800 Labourers
Environmental
Management
Emergency
Services
Community
Safety
Public Transport
Municipal
Planning
Technical
Services
SUB-TOTALS
TOTALS
Apprentices
Housing
SUB-TOTALS
Technical
Services
Page 61

0
Section 13: Learnerships, skills programmes and apprenticeships planned for the Financial Year 2012/2013Number
of 18.2
learners
Number
of Emp.
Learners15
20
20
10
10
10
50
50
50
50
50
50
Summary Learnership, Skills Programme and Apprenticeship Data
Total Number of 18.2 Learners 385
Total Number of Employed Learners 0
18.2 Learners as a % of Employed Learners #DIV/0!
PLANNING
Title Type ETQA this is registered with
National Certificate:Road construction Learnership CETA
National Certificate:Roads Works Learnership CETA
National Certificate:Horticulture Learnership AGRI SETA
National Certificate:Electricity reticulation Learnership ENERGY SETA
National certificate: Environmental management Learnership LGSETA
National Certificate:Emergency Operations Learnership LGSETA
Bricklaying Skills Programme LGSETA
Plumbing Skills Programme LGSETA
Carpentry Skills Programme LGSETA
Tilling Skills Programme LGSETA
Welding Skills Programme LGSETA
Plastering Skills Programme LGSETA
Page 62

Page 63

Section 13: Learnerships, skills programmes and apprenticeships implemented in the Financial Year 2011/2012Number
of 18.2
learners
Number
of Emp.
Learners20
20
20
20
2
Summary Learnership, Skills Programme and Apprenticeship Data
Total Number of 18.2 Learners 82
Total Number of Employed Learners 0
18.2 Learners as a % of Employed Learners #DIV/0!
Electricity Apprenticeship ESETA
Electricity Learnership ESETA
Horticulture Learnership AGRI SETA
Roads Construction Learnership CETA
Roads Works Learnership CETA
REPORTING - Annual Report Only
Title Type ETQA this is registered with
Page 64

Page 65

0
Section 14: Quality assurance - Providers to be used for planned training and development activities
1
2
3
4
5
6
7
8
9
10
11
12
13
14
15
16
17
18
19
20
21
22
23
24
25
26
27
28
29
30
31
32
33
PLANNING
Skills areaAccreditation
numberETQAName of provider
NOT YET APPOINTED Management / leadership
NOT YET APPOINTED Training skills
NOT YET APPOINTED Policy development
Training skills
NOT YET APPOINTED Specialist technical
NOT YET APPOINTED
NOT YET APPOINTED Specialist Skills required by legislation
NOT YET APPOINTED Specialist technical
NORTH WEST UNIVERSITY ETDP SETA Training skills
NOT YET APPOINTED Specialist technical
NOT YET APPOINTED Specialist Skills required by legislation
NOT YET APPOINTED Social/community/economic development and planning
NOT YET APPOINTED Specialist technical
NOT YET APPOINTED Computer Literacy
NOT YET APPOINTED Social/community/economic development and planning
NOT YET APPOINTED Specialist technical
Life skills
NOT YET APPOINTED Social/community/economic development and planning
NOT YET APPOINTED
Specialist Skills required by legislation
WITS UNIVERSITY ETDP SETA Management / leadership
NOT YET APPOINTED
Social/community/economic development and planningNOT YET APPOINTED
NOT YET APPOINTED Life skills
NOT YET APPOINTED Policy development
0 0
0 0
0 0
0 0
0 0
0 0
0 0
0 0
0 0
0 0
0 0
Page 66

Section 14: Quality assurance - Providers to be used for planned training and development activities
PLANNING
Skills areaAccreditation
numberETQAName of provider
Social/community/economic development and planningNOT YET APPOINTED34
35
36
37
38
39
40
41
42
43
44
45
46
47
48
49
50
51
52
53
54
55
56
57
58
59
60
61
62
63
64
65
66
67
0 0
0 0
0 0
0 0
0 0
0 0
0 0
0 0
0 0
0 0
0 0
0 0
0 0
0 0
0 0
0 0
0 0
0 0
0 0
0 0
0 0
0 0
0 0
0 0
0 0
0 0
0 0
0 0
0 0
0 0
0 0
0 0
0 0
0 0
Page 67

Section 14: Quality assurance - Providers to be used for planned training and development activities
PLANNING
Skills areaAccreditation
numberETQAName of provider
Social/community/economic development and planningNOT YET APPOINTED68
69
70
71
72
73
74
75
76
77
78
79
80
81
82
83
84
85
86
87
88
89
90
91
92
93
94
95
96
97
98
99
100
0 0
0 0
0 0
0 0
0 0
0 0
0 0
0 0
0 0
0 0
0 0
0 0
0 0
0 0
0 0
0 0
0 0
0 0
0 0
0 0
0 0
0 0
0 0
0 0
0 0
0 0
0 0
0 0
0 0
0 0
0 0
0 0
0 0
Page 68

Section 14: Quality assurance - Providers used for training and development activities
1
2
3
4
5
6
7
8
9
10
11
12
13
14
15
16
17
18
19
20
21
22
23
24
25
26
27
28
29
30
31
32
33
0
0 0
0
Specialist technical
0 0
Valley Junction Training Academy
Policy development
DBSA ISETT SETA Computer Literacy
Kgotla training ETDP SETA
Computer Literacy
Sedibeng Water ESETA Specialist technical
DBSA ISETT SETA
Occupational Health and Safety
NWU ETDP SETA Training skills
Salga LGSETA
Social/community/economic development and planning
Salga LGSETA Specialist Skills required by legislation
DBSA
Management / leadership
Wits University EDTP SETA Specialist Skills required by legislation
Saica
Client service
Aurecon training ESETA Specialist technical
Lejweng Communications LGSETA
Occupational Health and Safety
Salga LGSETA Policy development
Salga ESETA
Administration
Human Settlements Social/community/economic development and planning
Auditor Generals Office
REPORTING - Annual Report Only
Name of provider ETQAAccreditation
number
Skills area
0 0
0 0
0 0
0 0
0 0
0 0
0 0
0 0
0 0
0 0
0 0
0 0
0 0
Page 69

Section 14: Quality assurance - Providers used for training and development activities
AdministrationAuditor Generals Office
REPORTING - Annual Report Only
Name of provider ETQAAccreditation
number
Skills area
34
35
36
37
38
39
40
41
42
43
44
45
46
47
48
49
50
51
52
53
54
55
56
57
58
59
60
61
62
63
64
65
66
67
0 0
0 0
0 0
0 0
0 0
0 0
0 0
0 0
0 0
0 0
0 0
0 0
0 0
0 0
0 0
0 0
00
0 0
0 0
0 0
0 0
0 0
0 0
0 0
0 0
0 0
0 0
0 0
0 0
0 0
0 0
0 0
0 0
0 0
Page 70

Section 14: Quality assurance - Providers used for training and development activities
AdministrationAuditor Generals Office
REPORTING - Annual Report Only
Name of provider ETQAAccreditation
number
Skills area
68
69
70
71
72
73
74
75
76
77
78
79
80
81
82
83
84
85
86
87
88
89
90
91
92
93
94
95
96
97
98
99
100
0 0
0 0
0 0
0 0
0 0
0 0
0 0
0 0
0 0
0 0
0 0
0 0
0 0
0 0
0 0
0 0
0 0
0 0
0 0
0 0
0 0
0 0
0 0
0 0
0 0
0 0
0 0
0 0
0 0
0 0
0 0
0 0
0 0
Page 71
Related Documents