AMERICAN JOURNAL OF INDUSTRIAL MEDICINE 43:483–494 (2003) Workplace Health and Safety Regulations: Impact of Enforcement and Consultation on Workers’ Compensation Claims Rates in Washington State James Baggs, PhD, Barbara Silverstein, PhD, MPH, and Michael Foley, MA Background There has been considerable debate in the public policy arena about the appropriate mix of regulatory enforcement and consultation in achieving desired health and safety behavior across industries. Recently there has been a shift in federal policy toward voluntary approaches and constraining the scope of enforcement programs, although there is little evidence that this might improve health and safety outcomes. To address this, we examined changes in lost time workers compensation claims rates for Washington State employers who had (1) no OSHA State Plan (WISHA) activity, (2) enforcement, (3) consultation, and (4) both types of visits. Methods Compensable claims rates, hours, and WISHA activity were determined for each employer account with a single business location that had payroll hours reported for every quarter from 1997–2000 and more than 10 employees. We used a generalized estimating equations (GEE) approach to Poisson regression to model the association between WISHA activity and claims rate controlling for other external factors. Results Controlling for previous claims rate and average size, claims rates for employers with WISHA enforcement activity declined 22.5% in fixed site industry SIC codes compared to 7% among employers with no WISHA activity (P < 0.05), and in non-fixed site SICs (e.g., construction) claims rates declined 12.8% for employers with enforcement activity compared to a 7.4% decline for those with no WISHA activity (P > 0.10). WISHA consultation activity was not associated with a greater decline in compensable claims rates (2.3% for fixed sites and þ3.5% for non-fixed sites). WISHA activity did not adversely affect worksite survivability through the study period. Conclusions Enforcement inspections are significantly associated with decreasing compensable workers compensation claims rates especially for fixed site employers. We were unable to identify an association between consultation activities and decreasing claims rates. Am. J. Ind. Med. 43:483 – 494, 2003. ß 2003 Wiley-Liss, Inc. KEY WORDS: OSHA regulations; enforcement; consultation; injury claims rates; workers compensation ȣ 2003 Wiley-Liss, Inc. *Correspondence to: Barbara Silverstein, Safety and Health Assessment and Research for Prevention (SHARP) Program, Washington State Department of Labor and Industries, PO Box 44330, Olympia,WA 98504-4330. E-mail: silb235@lni.wa.gov Accepted16 December 2002 DOI10.1002/ajim.10209. Published online in Wiley InterScience (www.interscience.wiley.com) Safety and Health Assessment and Research for Prevention (SHARP) Program, Washington State Department of Labor and Industries, Olympia,Washington This research was supported by the Washington State Department of Labor and Industries where the work was conducted. None of the authors are affiliated with any organizations which have a financial interest in the subject matter of this study.

Welcome message from author
This document is posted to help you gain knowledge. Please leave a comment to let me know what you think about it! Share it to your friends and learn new things together.
Transcript

AMERICAN JOURNAL OF INDUSTRIAL MEDICINE 43:483–494 (2003)
Workplace Health and Safety Regulations:Impact of Enforcement and Consultationon Workers’ Compensation Claims Rates
in Washington State
James Baggs, PhD, Barbara Silverstein, PhD, MPH,� and Michael Foley, MA
Background There has been considerable debate in the public policy arena about theappropriate mix of regulatory enforcement and consultation in achieving desired healthand safety behavior across industries. Recently there has been a shift in federal policytoward voluntary approaches and constraining the scope of enforcement programs,although there is little evidence that this might improve health and safety outcomes. Toaddress this, we examined changes in lost time workers compensation claims rates forWashington State employers who had (1) no OSHA State Plan (WISHA) activity, (2)enforcement, (3) consultation, and (4) both types of visits.Methods Compensable claims rates, hours, and WISHA activity were determined foreachemployer account with a single business location that had payroll hours reported for everyquarter from 1997–2000 and more than 10 employees. We used a generalized estimatingequations (GEE) approach to Poisson regression to model the association between WISHAactivity and claims rate controlling for other external factors.Results Controlling for previous claims rate and average size, claims rates for employerswith WISHA enforcement activity declined 22.5% in fixed site industry SIC codescompared to 7% among employers with no WISHA activity (P< 0.05), and in non-fixed siteSICs (e.g., construction) claims rates declined 12.8% for employers with enforcementactivity compared to a 7.4% decline for those with no WISHA activity (P> 0.10). WISHAconsultation activity was not associated with a greaterdecline in compensable claims rates(�2.3% for fixed sites and þ3.5% for non-fixed sites). WISHA activity did not adverselyaffect worksite survivability through the study period.Conclusions Enforcement inspections are significantly associated with decreasingcompensable workers compensation claims rates especially for fixed site employers. Wewere unable to identify an association between consultation activities and decreasingclaims rates. Am. J. Ind. Med. 43:483–494, 2003. � 2003 Wiley-Liss, Inc.
KEY WORDS: OSHA regulations; enforcement; consultation; injury claims rates;workers compensation
� 2003Wiley-Liss, Inc.
*Correspondence to: Barbara Silverstein, Safety and Health Assessment and Researchfor Prevention (SHARP) Program, Washington State Department of Labor and Industries,PO Box 44330, Olympia,WA 98504-4330. E-mail: [email protected]
Accepted16 December 2002DOI10.1002/ajim.10209. Published online inWiley InterScience
(www.interscience.wiley.com)
Safety and Health Assessment and Research for Prevention (SHARP) Program,Washington State Department of Labor and Industries, Olympia,Washington
This research was supported by the Washington State Department of Labor andIndustries where the work was conducted. None of the authors are affiliated with anyorganizations which have a financial interest in the subject matter of this study.

INTRODUCTION
There has been considerable discussion in the public
policy arena about the roles of regulatory enforcement and
consultation in achieving compliance with desired health
and safety behavior in different industries. Recent legislative
proposals at the federal level have sought to limit the
Occupational Safety and Health Administration’s (OSHA)
flexibility to choose the mix of enforcement and consultative
activities it deems most likely to achieve its mandate of
preventing injuries and illnesses. Among these proposals
are provisions that would reallocate OSHA funding toward a
greater emphasis on providing consultations to employers;
exemptions for small employers from routine enforcement
visits; exemptions for employers with better than average
safety records; the elimination of citations for the first
instance of a violation; and a limit on the size of OSHA fines
and the foreclosure of possible criminal sanctions. It has been
argued that these approaches would hinder OSHA in its
search for the optimal mixture of consultation and enforce-
ment strategies. Such restrictions would reduce OSHA’s
effectiveness by reducing the probability of an inspection or a
fine and thus, the economic incentive to comply [Shapiro and
Rabinowitz, 1997]. Such approaches are based upon a
premise lacking evidence: that the effectiveness of consulta-
tion visits in reducing occupational hazards is at least as great
as that of inspections, and that this opportunity has been
unduly neglected by OSHA in the past. A recently published
report by the United States General Accounting Office
(GAO) on OSHA’s consultation program found that the
agency was unable to measure the effect its consultation
programs actually had on injuries and illnesses at participat-
ing work sites because it did not collect the data necessary to
separate the effect of its consultation interventions from
those of its inspections [GAO, 2001]. At the same time,
congressional appropriations for state consultation programs
grew by 50% from 1996 to 2001 and now account for more
than 11% of OSHA’s budget. In fact, this underestimates total
OSHA expenditures to assist employers to comply with
safety and health standards. If the federal compliance assis-
tance program and the state consultation grants programs are
combined, the actual shift in resources toward voluntary
approaches is even more marked. From a total of $43 million,
or 14% of the total OSHA budget in 1994, this grew to
$107 million, or 24% of the total OSHA budget in 2001
[OMB, 1994–2002]. Over the same period of time, expen-
ditures for both federal and state enforcement programs fell
from 70% to 56% of the total budget. From 1994 to 2001, the
total number of enforcement visits conducted by federal and
state inspectors fell from 102,977 to 90,894. A continuing
shift in federal-level priorities toward more consultative
approaches is also shown in the rescinding of the federal
ergonomics standard by Congress in March 2001 and the
announcement by Labor Secretary Elaine Chao that future
efforts in ergonomics will emphasize voluntary approaches,
such as guidelines and consultations.
Enforcement inspections seek to encourage safe work-
places and prevent injuries and illness through deterrence
[McQuiston et al., 1998]. This deterrence takes two forms:
one, businesses will be less likely to commit violations if
they know these activities may be detected and penalized,
‘‘general deterrence,’’ and two, a business violating the rules
and laws will be less likely to repeat the violation if the
business is caught and penalized, ‘‘specific deterrence.’’
Some have argued that workers compensation incentives
provide effective ways of reducing work-related injuries and
illnesses, thereby making enforcement of OSHA regulations
unnecessary [Mixon, 1900] while others have argued the
reverse [Spieler, 1994] or that both are necessary [Smitha
et al., 2001]. Few studies nationally have considered the
relationship between OSHA activities and the rate of oc-
cupational injuries [Cooke and Gautschi, 1981; Bartel and
Thomas, 1982; Gray and Scholz, 1993; McQuiston et al.,
1998]. These have been primarily in the manufacturing sector
and covering large employers. None of these studies have
examined the question raised above: what is the effect of
consultation without the threat of enforcement? What is
the relative impact of enforcement as compared to consulta-
tion? Is there any evidence for a combination of consul-
tation and enforcement having a greater impact than either
strategy alone?
Washington State recognized the importance of worker
health and safety protections in its 1889 constitution, and is
the only state which administers both the state’s workers
compensation program and OSHA State Plan (WISHA)
through the Department of Labor and Industries (L&I). L&I
has had general safety standards as early as 1946 that required
safety programs and joint labor-management safety commit-
tees [State of Washington, 1946]. L&I dedicates a significant
portion of its resources to enforcement inspections and offers
consultation services to employers requesting help to correct
potential hazards and rule violations without the threat of
penalty. Only limited analysis has been conducted to examine
the relationship between workers compensation claims rates
and WISHA activity [Nelson et al., 1997].
METHODS
Time Periods
Workers’ compensation data from Washington State
computerized systems requires time to mature. Given this
limitation of the data, the following time periods were
identified:
* Pre-Study Period State Fiscal Year (SFY) 1997–1998:
compensable claims rates, reported hours, and WISHA
activity were determined for each state fund employer
484 Baggs et al.

workers’ compensation account. Accounts were selected
for inclusion based on measurements from the pre-study
period.
* Baseline Period SFY 1999: baseline compensable claims
rates were measured and WISHA activity was character-
ized for each account ID.
* Measurement Period SFY 2000: the compensable claims
rates and the resulting change in compensable claims
rates from the baseline period were determined for each
account ID and compared to those from the baseline
period for various categories of WISHA activity.
These periods allowed for an 11-month period for claims
data to mature before data extraction.
In order to minimize external influences and bias, the
following inclusion criteria were applied to the population of
accounts:
Only accounts reporting hours each quarter from SFY
1997–2000; State Fund accounts; accounts with a single
business location; accounts with an average size of at least 10
FTEs-YR (fulltime equivalent employees per year) during
the pre-study period; accounts with no WISHA activity
during the pre-study period.
Rationale for Inclusion Criteria
To allow equivalent time for the rates to decrease during
similar periods, only accounts that reported hours in
equivalent time periods throughout the study period were
selected. Because claims rates cannot be calculated for each
business location at this time, only accounts with a single
business location were included. Therefore, claims rates
correspond directly to the business location in which the
WISHA activity occurred. Only State Fund (SF) accounts
were included as only 4% of self-insured (SI) accounts have a
single business location. Accounts were limited to those with
an average pre-period size of at least 10 FTEs-YR. Accounts
with less than 10 FTEs-YR have widely varying claims rates,
generally speaking, since the influence of a single claim can
be substantial. In order to reduce the influence from previous
WISHA activity, only accounts with no WISHA activity
during the pre-study period were included. Finally, analysis
was conducted separately for accounts with ‘‘fixed site’’ SIC
codes compared to accounts with other SIC (‘‘non-fixed
site’’). Fixed site SIC codes included agriculture; manufac-
turing; wholesale trade; retail trade; finance, insurance, and
real estate; services; and the executive, legislative, and
general government (two-digit SICs 01, 02, 20–39, 50–87,
91). Such a categorization was developed since it was
assumed that WISHA effectiveness might vary between
these two categories of industry. Given the inclusion criteria,
we were unable to assess each two-digit SIC separately since
the number of available accounts would be small.
Data Analysis
Included accounts were followed for 4 years on a quar-
terly basis beginning with the pre-study period. The com-
pensable claims and number of hours reported were recorded
for each quarter of the study period as was WISHA activity.
Closing dates were used to determine quarter of WISHA
activity. Yearly compensable claims rates for each account
were determined [(no. of compensable claims/work-hours)�2,000 hr� 100)].
Changes in claims rates for accounts with and without
WISHA activity were compared through univariate and
multivariate analysis. For univariate analysis, the difference
in the compensable claims rates for each account ID between
the measurement period and the baseline period was calcu-
lated. The average difference in annual claims rates was then
determined for the different groups of accounts based on
WISHA activity. Statistical comparisons of the average
differences were conducted using the Wilcoxon Rank Sum
test for two category comparisons, and the Kruskal-Wallis
test for >2 category comparisons.
For univariate analysis, WISHA status was categorized
into four groups for the baseline period:
* None—No WISHA activity closing during SFY 1999.
* Consultation Only—one or more consultation activities
closing during SFY 1999.
* Enforcement Only—one or more enforcement activities
closing during SFY 1999.
* Both—At least one consultation and one enforcement
activity closing during SFY 1999.
Other variables considered during univariate analysis
included claims rate during SFY 1997 (using actual claims
rate or categorized into quartiles for non-zero claims rate and
a separate category for those with zero claims rate), average
size based on SFY 1997–1998 categorized into quartiles,
SIC code categories (fixed vs. non-fixed), and industry sector
categories.
For multivariate analysis, a Poisson model was con-
structed. For count data, such as the number of compensable
claims, the Poisson distribution is well suited [Kleinbaum
et al., 1988; Allison and Institute, 1999]. Multivariate
Poisson models are especially well suited for estimation
of rates based on count data. However, Poisson models
often suffer from over-dispersion; therefore standard errors
were adjusted for over-dispersion as previously suggested
[Allison, 1999]. In addition, we included multiple quarterly
measures of claims rates for each account ID. Because these
observations are not independent but are longitudinal, we
used a generalized estimating equations (GEE) approach to
estimate the Poisson models. In our models, an autoregres-
sive correlation matrix was specified although other models
were attempted. Because the results and conclusions were
Impact of Enforcement and Consultation 485
similar regardless of the matrix, and the autoregressive
matrix seemed most appropriate for this study’s data, we
present the results using this matrix only. Using this model,
the compensable claims rates for each quarter from SFY
1999 through SFY 2000 were modeled adjusting for WISHA
activity, average SFY 1997–1998 size, SFY 1997 claims
rate, and SIC code categories as possible.
RESULTS
Selection of Account Population
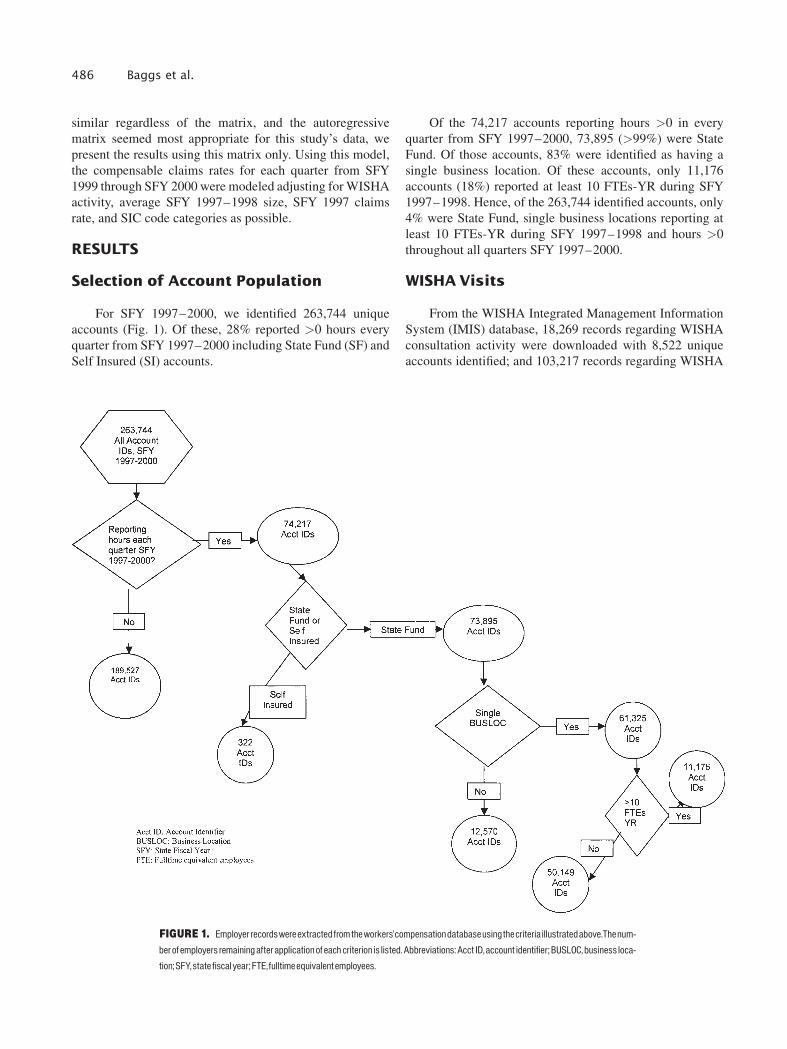
For SFY 1997–2000, we identified 263,744 unique
accounts (Fig. 1). Of these, 28% reported >0 hours every
quarter from SFY 1997–2000 including State Fund (SF) and
Self Insured (SI) accounts.
Of the 74,217 accounts reporting hours >0 in every
quarter from SFY 1997–2000, 73,895 (>99%) were State
Fund. Of those accounts, 83% were identified as having a
single business location. Of these accounts, only 11,176
accounts (18%) reported at least 10 FTEs-YR during SFY
1997–1998. Hence, of the 263,744 identified accounts, only
4% were State Fund, single business locations reporting at
least 10 FTEs-YR during SFY 1997–1998 and hours >0
throughout all quarters SFY 1997–2000.
WISHA Visits
From the WISHA Integrated Management Information
System (IMIS) database, 18,269 records regarding WISHA
consultation activity were downloaded with 8,522 unique
accounts identified; and 103,217 records regarding WISHA
FIGURE 1. Employer recordswereextractedfromtheworkers’compensationdatabaseusingthecriteria illustratedabove.Thenum-
berofemployers remaining after application of each criterion is listed. Abbreviations:Acct ID, account identifier; BUSLOC,business loca-
tion; SFY,state fiscal year; FTE,fulltimeequivalentemployees.
486 Baggs et al.

enforcement activity were downloaded with 37,335 dis-
tinct accounts identified. Figure 2 describes the selection and
matching process of WISHA activities to hours and claims.
Of the 11,176 accounts identified as of primary interest,
accounts with WISHA activity during the pre-study period
were excluded leaving 8,929 (80%) accounts. Through the
baseline period (SFY 1999), only 9.6% of enforcement visits,
10.2% of consultation visits, and 9.7% of programmed en-
forcement visits occurred in the selected 8,929 accounts.
Compensable Claims Rates
From SFY 1999 to SFY 2000, the average compensable
claims rates decreased 5.5% among the 8,929 remaining
accounts. For comparison purposes, the average compensa-
ble claims rate for non-sampled, but surviving accounts for
the same period decreased 2.1%. For fixed site SIC accounts,
the average compensable claims rates decreased 5.3% while
compensable claims rates decreased 5.9% for non-fixed SIC
accounts.
Changes in the claims rates were first examined through
univariate comparisons of average claims rates for groups of
accounts categorized by WISHA activity. (See Table IA and
Fig. 3.)
For fixed site SIC accounts, from the baseline period
(SFY 1999) to the measurement period (SFY 2000), the
compensable claims rates decreased 21.0% for accounts
with any WISHA activity compared to 3.0% for accounts
with no WISHA activity (P< 0.002). Among non-fixed site
SIC accounts, compensable claims rates decreased 11.0%
for accounts with any WISHA activity compared to 4.6% for
accounts with no WISHA activity but this change was not
statistically significant.
WISHA activity was then broken out into four exclusive
groups: accounts with no activity, those with consultation
visit(s) only, those with enforcement visit(s) only, and those
with both consultation and enforcement visits.
For fixed site SIC accounts, compensable claims rates
increased 4.1% among accounts with WISHA consultation
activity. Compensable claims rates decreased 27.5% among
accounts with WISHA enforcement activity during the mea-
surement period (P< 0.002), and compensable claims rates
decreased 24.6% among accounts with both consultation and
enforcement activity. Compensable claims rates decreased
3.0% among accounts with no WISHA activity during the
measurement period.
Similarly, among accounts in non-fixed SIC codes,
compensable claims rates increased 8.3% for consultation
FIGURE 2. Employer records extracted fromtheworkers’compensationdatabasewerematched to records ofWISHAenforcement
and consultation activity.The number of enforcement and consultation recordsmatching to employer records previously extracted and
thosemeetingthespecifiedcriteriaarelisted.Abbreviations:Acct ID,account identifier;SFY,statefiscalyear;Cons,consultation;Enforce,
enforcement.
Impact of Enforcement and Consultation 487

FIGURE 3. ThepercentchangeinaveragecompensableclaimsratesforStateFundAccountsSFY1999^SFY2000.Abbreviations:
SFY,state fiscal year.
TABLE IA. Univariate Associations Between Compensable Claim Rates andWISHA Activity for Fixed andNon-Fixed SIC
Compensable rates per100 FTEs Rate difference
N
SFY1997 SFY1998 SFY1999 SFY 2000 SFY2000^SFY1999 SFY 2000^SFY1998
Mean Mean Mean Mean Mean % Mean %
Excluded accountsa
All 65288 2.46 2.51 2.37 2.32 �0.05 �2.1 �0.19 �7.7WISHA categories SIC categoriesAll All 8929 2.06 1.96 1.95 1.85 �0.11 �5.5 �0.11 �5.6All Fixed SIC 7424 1.62 1.58 1.53 1.45 �0.08 �5.3 �0.13 �8.1All Non-fixed SIC 1505 4.23 3.84 4.04 3.81 �0.24 �5.9 �0.03 �0.8
NoWISHA Fixed SIC 7042 1.49 1.46 1.41 1.36 �0.04 �3.0 �0.10 �6.8WISHA Fixed SIC 382 4.02 3.66 3.81 3.01 �0.80 �21.0 �0.65 �17.7NoWISHA Non-fixed SIC 1270 3.96 3.64 3.86 3.68 �0.18 �4.6 0.04 1.1WISHA Non-fixed SIC 235 5.69 4.87 5.02 4.47 �0.55 �11.0 �0.40 �8.2
NoWISHA Fixed SIC 7042 1.49 1.46 1.41 1.36 �0.04 �3.0 �0.10 �6.8Consultation Fixed SIC 99 3.68 3.22 2.93 3.05 0.12 4.1 �0.17 �5.3Enforcement Fixed SIC 254 4.09 3.77 4.18 3.03 �1.15 �27.5 �0.74 �19.6Both Fixed SIC 29 4.53 4.22 3.66 2.76 �0.90 �24.6 �1.46 �34.6NoWISHA Non-fixed SIC 1270 3.96 3.64 3.86 3.68 �0.18 �4.6 0.04 1.1Consultation Non-fixed SIC 39 7.02 4.15 5.23 5.66 0.43 8.3 1.51 36.4Enforcement Non-fixed SIC 186 5.60 5.06 5.07 4.28 �0.80 �15.7 �0.78 �15.4Both Non-fixed SIC 10 2.30 4.19 3.25 3.38 0.14 4.2 �0.81 �19.3
aOnlysurvivingaccountsused.
488 Baggs et al.

activity, decreased 15.7% for enforcement activity, and in-
creased 4.2% for enforcement and consultation activity, but
for accounts with no WISHA activity during the measure-
ment period, compensable claims rates decreased 4.6%
(P< 0.41). The increase of compensable claims rates among
accounts with both consultation and enforcement activity is
based on a small number of accounts (10).
To eliminate possible bias from pre-period claims rate,
associations between WISHA activity and compensable
claims rates were examined, with the analysis focused on
specific quartiles based on the SFY 1997 compensable claims
rate, i.e., accounts with higher SFY 1997 compensable
claims rates were compared to each other while accounts
with low SFY 1997 claim rate were compared separately
(data not shown). In general, accounts with enforcement acti-
vity were associated with a greater decrease in the com-
pensable claims rate in the fixed site SIC accounts. This
association was observed among all categories except those
with the lowest non-zero claims rate. Among the non-fixed
SIC accounts, this same association was observed among
accounts with the highest SFY 1997 rate or a SFY 1997 rate
of zero. Because several categories have a small number of
accounts (<10), the results for consultation activities tend to
vary more widely than previous comparisons.
Associations between WISHA activity and compensa-
ble claims rates were also examined for each category of
account size, <50 and �50 FTEs-YR (Table IB). Previously
observed associations between WISHA activity and claims
rates were apparent among smaller accounts. Indeed, the
impact of enforcement visits on claims rates was somewhat
greater among smaller accounts than they were among larger
accounts. Among larger accounts in fixed SIC, consultation
activities were associated with a larger decrease in claims
rates unlike previous observations, although this was not
statistically significant (P< 0.40). The number of non-fixed
SIC large accounts was small, and claim rates tend to vary
more widely.
WISHA enforcement activity was then divided into
programmed and unprogrammed (‘‘complaint-driven’’) in-
spections for those accounts with enforcement activity only.
Among accounts with fixed site SIC, compensable claims
rates decreased 24.6% and 36.0% between 1999 and 2000 for
programmed and unprogrammed inspections, respectively
(P< 0.003). For accounts with non-fixed site SIC, the dec-
reases were not statistically significant.
To adjust for size and pre-period compensable claims
rate, two multivariate Poisson models were estimated
(Table II). The first model compares rates from SFY 2000
to rates from SFY 1999. The second model calculates the
average decrease between each quarter over the period
SFY 1999–SFY 2000. Both models control for SFY 1997
rates, average SFY 1997–1998 size, and SIC category when
possible. Similar results were found in both multivariate
models. In the first model, for fixed site SIC, compensable
claims rates for accounts with no WISHA activity decreased
7% from SFY 1999 to SFY 2000. Accounts with WISHA
TABLE IB. Univariate Associations Between Compensable Claim Rates and WISHA Activity for Fixed and Non-Fixed SIC Stratified by SFY 1997 AccountAverage Size (<50 or�50 FTEs-YR)
WISHA categories SIC categories N
SFY1997 SFY1998 SFY1999 SFY 2000 SFY2000^SFY1999 SFY 2000^SFY1998
Mean Mean Mean Mean Mean % Mean %
<50FTEs-YRNoWISHA Fixed SIC 6192 1.48 1.46 1.39 1.36 � 0.03 �1.9 �0.10 �6.8Consultation Fixed SIC 69 3.66 3.14 2.68 3.21 0.53 19.9 0.07 2.2Enforcement Fixed SIC 205 4.19 3.93 4.40 3.09 �1.31 �29.8 �0.85 �21.6Both Fixed SIC 19 4.23 4.32 2.86 2.07 �0.79 �27.6 �2.24 �52.0NoWISHA Non-fixed SIC 1146 4.06 3.69 3.95 3.79 �0.17 �4.2 0.10 2.7Consultation Non-fixed SIC 32 7.29 4.45 5.49 6.06 0.56 10.3 1.61 36.1Enforcement Non-fixed SIC 163 5.87 4.96 5.28 4.35 �0.93 �17.7 �0.61 �12.2Both Non-fixed SIC 8 1.89 4.09 3.25 3.73 0.48 14.8 �0.36 �8.8
�50FTEs-YRNoWISHA Fixed SIC 850 1.57 1.47 1.53 1.38 �0.16 �10.2 �0.10 �6.6Consultation Fixed SIC 30 3.72 3.41 3.52 2.69 �0.83 �23.6 �0.72 �21.2Enforcement Fixed SIC 49 3.68 3.07 3.26 2.79 �0.47 �14.5 �0.28 �9.1Both Fixed SIC 10 5.10 4.04 5.18 4.07 �1.11 �21.4 0.03 0.8NoWISHA Non-fixed SIC 124 3.04 3.22 3.03 2.72 �0.31 �10.2 �0.49 �15.4Consultation Non-fixed SIC 7 5.79 2.80 4.04 3.87 �0.17 �4.1 1.08 38.6Enforcement Non-fixed SIC 23 3.71 5.78 3.59 3.75 0.17 4.7 �2.02 �35.0Both Non-fixed SIC 2 3.93 4.60 3.24 2.00 �1.23 �38.1 �2.60 �56.5
Impact of Enforcement and Consultation 489

enforcement activity decreased 16% more than accounts with
no WISHA activity (P< 0.03), but accounts with consulta-
tion activity decreased 5% less than accounts with no
WISHA activity (P< 0.70). In a second model for fixed SIC,
claims rates for accounts with WISHA enforcement activity
decreased 15% more than accounts with no WISHA activity
per four quarters (P< 0.02). Consultation activity was as-
sociated with a small increase, 4% per four quarters
(P< 0.68).
For non-fixed SIC codes, claims rates among those with
WISHA enforcement activity decreased 5% more than ac-
counts with no WISHA activity. Claims rates for accounts
with consultation activity increased 11% compared to ac-
counts with no WISHA activity. In the second model, claims
rates for accounts with WISHA enforcement activity dec-
reased 12% more than accounts with no WISHA activity
per four quarters (P< 0.09), and claims rates for accounts
with WISHA consultation activity also decreased 11% more
than accounts with no WISHA activity per four quarters
(P< 0.46).
Only the larger decline in compensable claims rates for
fixed site SIC accounts with enforcement activity was stati-
stically different from accounts with no WISHA activity. The
relationship between claims rates and consultation activity
for fixed SIC accounts as well as the relationship between
claims rates and any WISHA activity for non-fixed SIC
accounts was not statistically significant. These results were
very similar to the results from the univariate analysis except
TABLE II. MultivariateAssociations Between Compensable ClaimRates andWISHA Activity for Fixed andNon-Fixed SIC
Estimator
Fixed SIC Non-fixed SIC
Estimate Standard error P-value Estimate Standard error P-value
Model1a
Study periodb �0.0730 0.0260 0.0049 �0.0774 0.0423 0.0678Enforcement 0.5745 0.0762 <0.0001 0.1553 0.0854 0.1242Enforcement* study period �0.1816 0.0794 0.0268 �0.0600 0.0914 0.5103Consultation 0.2333 0.1190 0.0190 �0.0482 0.1576 0.9580Consultation* study period 0.0497 0.1158 0.6668 0.1114 0.1518 0.4615Average size SFY1997^1998 <0.0001 0.0183SFY1997 compensable rate (quartiles) <0.0001 <0.0001
Estimated %difference SFY2000 vs. SFY1999 based onmodel estimates
NoWISHA �7.0% �7.4%Enforcement �22.5% �12.8%Consultation �2.3% 3.5%
Model 2a
Periodc �0.0198 0.0057 0.0006 �0.0028 0.0090 0.7523Enforcement 1.0260 0.2253 <0.0001 0.5399 0.2472 0.0383Enforcement* period �0.0437 0.0170 0.0133 �0.0334 0.0193 0.0860Consultation 0.1150 0.3666 0.7568 0.3867 0.5170 0.4652
Consultation* period 0.0115 0.0276 0.6758 �0.0304 0.0399 0.4513Average size SFY1997^1998 <0.0001 0.0185SFY1997 compensable rate (quartiles) <0.0001 <0.0001
Estimated %differenceper1quarterNoWISHA �2.0% �0.3%Enforcement �6.2% �3.6%Consultation �0.8% �3.3%
Estimated %differenceper 4 quartersNoWISHA �7.6% �1.1%Enforcement �22.4% �13.5%Consultation �3.3% �12.4%
aMultivariateestimatesfromarepeatedmeasuresPoissonmodel.bStudyperiodcomparesSFY2000toSFY1999.cPeriodisacontinuousvariablefrom1to8representingeachquarter fromSFY1999throughSFY2000.
490 Baggs et al.

for the effect of consultation activities among non-fixed SIC
in Model 2, which showed a decrease in claims rates. But
this decline was not statistically significant and may be a
spurious association due to the large standard error and small
sample size.
Additional multivariate models classifying WISHA
activity into programmed and unprogrammed enforcement
showed similar results (Table III), with statistically signifi-
cant decreases in claims rates for fixed site accounts with
enforcement activity. For non-fixed site accounts with
enforcement activity claims rates also decreased but this
was not statistically significant. Consultation activity once
again was not associated with a decline in claims rate over
this period.
DISCUSSION
This study identified a strong association between
WISHA enforcement visits and decreasing compensable
workers compensation claims rates among employers with
single business locations and fixed site SICs while control-
ling for size and pre-study claims rate. At worksites that
experienced WISHA enforcement activity there was a 25%
greater decline in claims rates at fixed site SICs than there
was at worksites with no WISHA enforcement activity. This
reduction is similar in degree to that found for a 3-year
follow-up period by Gray and Scholz [1993]. In contrast, our
study is not restricted to large workplaces in regularly
inspected firms. While similar trends were identified for non-
fixed site SIC employers (an 11% greater decline), they were
not statistically significant. Non-statistically significant
increases in compensable claims rates were associated with
consultation visits. Additionally, WISHA enforcement acti-
vity was not associated with decreasing survivability of
firms over the study period compared to those without
WISHA activity.
If plant managers, when setting health and safety
policies, only followed a narrow expected utility approach
in which the costs of investments in compliance are weighed
against the probability of the detection of non-compliance
and the size of the penalties which would result, one would
expect only incremental, narrowly focused safety improve-
ments following an inspection. But the magnitude of the
decline in claims rates following inspections found in this
study lends support to the view that enforcement visits may
trigger a re-shuffling of managerial priorities and a greater
attention paid to safety and health improvement opportu-
nities throughout a worksite [Gray and Scholz, 1993].
The strengths of this study include a repeated measures
approach (GEE) which follows each worksite in a state that
has a long history of requiring joint health and safety com-
mittees and written safety programs. This allowed us to look
specifically at WISHA activity rather than a combination
of WISHA and workers compensation regulations [Smitha
et al., 2001]. Additionally, it includes primarily small to
medium sized worksites in many different industries whereas
other studies have focused on large manufacturing employers
[Bartel and Thomas, 1982; Gray and Scholz, 1993].
Ruser [1993] used a mixed model to look at count data
(number of claims) and severity of claims simultaneously. He
used a negative binomial model because a Poisson model had
over-dispersion. We chose to adjust for over-dispersion in a
Poisson model using PSCALE [Allison, 1999]. We examined
our data with a negative binomial model and found more
precision (smaller P values) but no difference in results and
conclusions. Other models with alternative study designs are
appropriate areas for future research.
Because this type of study design assumes all accounts
included in the analysis are similar to one another except for
their WISHA activity, numerous limitations in this study
design may be identified.
Factors such as account size and the account’s SFY 1997
compensable claims rate were controlled for in the analysis.
While these factors are related to WISHA activity, they were
not strongly related to compensable claim rate decreases in
the measurement years. Hence, these factors did not strongly
influence the results.
However, accounts with WISHA activity did have consis-
tently higher average SFY 1997 claims rates than those
accounts with no activity. This may be a result of WISHA
targeting activities (only partially based on previous claims
rates). Therefore, one can hypothesize that the differences in
the decline of claims rates were a result of regression to the
mean. However, the study design allows claims rates to be
controlled for in the analysis. When the effect of WISHA
activity was stratified by SFY 1997 claims rates, the
association between WISHA activity and decreasing claims
rates was noticeable in all strata except one. That was the
lowest non-zero claims rates stratum. To further examine the
issue of regression to the mean, the association between
WISHA activity and decreasing claims rates was examined
using only the accounts in the top 10% and top 5% of SFY
1997 claims rates. Again, similar associations were ob-
served. Hence, it is not likely that the magnitude of the SFY
1997 claims rates explains the observed associations between
WISHA activity and decreasing claims rates. We also
included 1997 claims rate as a continuous variable in the
multivariate analyses. The P-value for enforcement dropped
to 0.052 from 0.027 in model 1 and to 0.038 from 0.013 in
model 2 (Table II).
There is some evidence that WISHA activity may in-
crease claims rates before the subsequent decrease. From
SFY 1998–1999, accounts with WISHA activity generally
increased slightly more than those accounts with no WISHA
activity. The increase may possibly be due to increased re-
porting immediately after WISHA activity. This increase
could elevate the magnitude of the change in WISHA
accounts. This increase was higher for accounts with unpro-
Impact of Enforcement and Consultation 491

TABLE
III.
UnivariateA
ssociationsBetweenCompensableClaimRatesand
WISHA
TargetedandUntargetedActivityforFixedandNon-FixedSIC
WISHA
categories
SICcategories
Compensableratesper100FTEs
Ratedifference
N
SFY1997
SFY1998
SFY1999
SFY2000
SFY2000
^SFY1999
SFY2000
^SFY1998
Mean
Mean
Mean
Mean
Mean
%Mean
%
a.Univariate
All
All
8929
2.06
1.96
1.95
1.85
�0.11
�5.5
�0.11
�5.6
All
FixedSIC
7424
1.62
1.58
1.53
1.45
�0.08
�5.3
�0.13
�8.1
All
Non-fixedSIC
1505
4.23
3.84
4.04
3.81
�0.24
�5.9
�0.03
�0.8
NoWISHA
FixedSIC
7042
1.49
1.46
1.41
1.36
�0.04
�3.0
�0.10
�6.8
Consultation
FixedSIC
993.68
3.22
2.93
3.05
0.12
4.1�0.17
�5.3
Unprogrammedinspection
FixedSIC
762.49
2.78
3.52
2.26
�1.27
�36.0
�0.52
�18.7
Programmedinspection
FixedSIC
178
4.78
4.19
4.46
3.36
�1.10
�24.6
�0.83
�19.9
Both
FixedSIC
294.53
4.22
3.66
2.76
�0.90
�24.6
�1.46
�34.6
NoWISHA
Non-fixedSIC
1270
3.96
3.64
3.86
3.68
�0.18
�4.6
0.04
1.1Consultation
Non-fixedSIC
397.02
4.15
5.23
5.66
0.43
8.3
1.51
36.4
Unprogrammedinspection
Non-fixedSIC
384.06
4.46
5.54
4.95
�0.59
�10.6
0.49
11.1
Programmedinspection
Non-fixedSIC
148
5.99
5.21
4.95
4.10
�0.85
�17.2
�1.11
�21.3
Both
Non-fixedSIC
102.30
4.19
3.25
3.38
0.14
4.2
�0.81
�19.3
FixedSIC
Non-fixed
SIC
Estim
ate
Standarderror
P-value
Estim
ate
Standarderror
P-value
b.Multivariate
Model1aestim
ator
Studyperiodb
�0.0731
0.0260
0.0049
�0.0770
0.0422
0.0694
Programmedenforcem
ent
0.6455
0.0863
<0.0001
0.1361
0.0897
0.2462
Programmedenforcem
ent*studyperiod
�0.1732
0.0917
0.0683
�0.0819
0.1097
0.4521
Unprogrammedenforcem
ent
0.4334
0.1396
0.0095
0.2167
0.1850
0.2822
Unprogrammedenforcem
ent*studyperiod
�0.2027
0.1412
0.1660
0.0006
0.1270
0.9961
Consultation
0.2387
0.1170
0.0156
�0.0551
0.1604
0.9812
Consultation*studyperiod
0.0511
0.1156
0.6572
0.1033
0.1536
0.4994
Averagesize
SFY1997^1998
0.0001
0.0172
SFY1997
compensablerate
<0.0001
<0.0001
Estim
ated%differenceSFY2000
vs.SFY
1999
basedonmodelestim
ates
NoWISHA
�7.0%
�7.4%
Programmedenforcem
ent
�21.8%
�14.7%
Unprogrammedenforcem
ent
�24.1%
�7.4
%Consultation
�2.2%
2.7%
Numberaccountsincludedinmodel
7424
1505
a Multivariateestimatesfromarepeatedm
easuresPoissonmodel.
b Studyperiodcom
paresSFY
2000
toSFY1999.
492

grammed enforcement inspections. However with the excep-
tion of unprogrammed visits, the increases in claims rates in
SFY 1999 were small compared to the decreases by SFY
2000. Further, similar associations were observed using SFY
1998 as the baseline year rather than SFY 1999. Among
accounts with fixed site SIC, compensable claims rates dec-
reased 6.8, 5.3, 19.6, and 34.6% between SFY 1998 and SFY
2000 for accounts with no WISHA activity, consultation
activity, enforcement activity and consultation/enforcement
activity respectively (Table IA).
Temporal association between WISHA activity and the
changes in claims rates could be established using the current
study design. Included accounts did not have any WISHA
activity close during SFY 1997–SFY 1998. WISHA activity
was then categorized in SFY 1999, and the changes in the
claims rates were measured during the next year SFY 2000.
Therefore, WISHA activity occurred first, and then the
changes in claims rates occurred.
It could also be hypothesized that those accounts with
WISHA activity were less likely to survive all 16 quarters of
the study period. Among the cohort of accounts which
satisfied all selection criteria but the survival criteria, 76%
of 11,814 accounts were included in the study. Among ac-
counts that had WISHA activity a greater proportion survived
all 16 quarters: 80% for consultation, 83% for enforcement,
and 89% for consultation/enforcement, whereas only 75% of
the no WISHA accounts survived all 16 quarters, (w2¼23.3567, P< 0.0001). The same general pattern of account
survival was noticeable stratifying survival rates by average
SFY 1997–1998 account size and SFY 1997 claims rates
except for accounts with a zero claims rate in SFY 1997.
Among accounts with a zero claims rate, those with WISHA
activity were as likely to survive as those with no WISHA
activity (w2¼ 1.5342, P< 0.68). The finding that firms
scrutinized by WISHA were actually more likely to survive
through the 4-year period of study is significant when viewed
in the context of the political debate over the burden of
occupational safety and health regulation. As with a previous
study by the now-defunct U.S. Congress Office of Technol-
ogy Assessment, this analysis supports the claim that such
standards do not impose an intolerable compliance burden on
business [OTA, 1995].
A strength of this study design is that limiting the cohort
to meeting specific criteria minimizes external influences.
However, only 10% of WISHA visits in the same time frame
are represented in this cohort. Since the remaining accounts
differ by important factors such as self-insured status, size,
and the number of business locations, it does not necessarily
follow that the results can be extended to WISHA activity
overall. Those account populations in which most WISHA
activity occurs include large self-insured accounts; medium
and large State Fund accounts with multiple business loca-
tions, and medium State Fund accounts with single business
locations. This study focused on medium-sized, State Fund
accounts with a single business location in fixed and non-
fixed SIC categories due to constraints in the L&I databases.
Studies at the business location level, which would allow for
the inclusion of multiple business location accounts, would
extend the coverage of the analysis, but they cannot be
currently completed as worker hours and claims are reported
only at the account level.
Additionally, when we looked at overall accounts that
did not meet our study criteria of size or single location, the
compensable claims rates were higher over the study period.
This suggests that exclusion was necessary but may also have
underestimated potential effect of WISHA visits. Claims
rates for very small employers (<10 FTE) were highly vari-
able, making comparisons between before and after inter-
vention less efficient.
Only a short follow-up time is available for this study
design. It is unknown whether the decrease in claims rates for
accounts with enforcement activity will become similar to
other accounts as time passes. Analysis using the same time
frames should be conducted in another year when the mea-
surement year can be extended to SFY 2001. Because of the
relatively short follow-up time, accounts with visits in
quarter 1 of the baseline period had a relatively longer time
for claim rates to decrease when compared to accounts with
visits closing in quarter 4 of the baseline period. Additional
analysis, which separated accounts by their quarter of visit,
suggested there was similar association between WISHA
activity and the average difference of claims rates post 1 year
from their first visit.
Finer distinctions in SIC codes were also not possible
for this analysis. Often, there were inadequate numbers of
accounts for each two-digit SIC code. Accounts were divided
into fixed and non-fixed for this analysis. Estimates of
WISHA effectiveness did vary by this categorization. Only
through using less restrictive criteria might estimates be
obtained by each SIC code.
It should be noted that, as in the Gray and Scholz study,
we focused only on the ‘‘specific’’ form of deterrence, where
the behavior of firms actually inspected is tracked. If the
broader aim of this project is to measure the overall effect
which the existence of occupational safety and health
standards have on the level of workplace injuries, then this
study is likely to understate this impact. This study does not
take into account the ‘‘general deterrence’’ effect whereby all
companies improve and maintain safety because they know
that failure to do so may be detected and penalized. Neither
has this study accounted for the effect which OSHA standards
may have had on the nature of technological change and on
the level of safety education received by management and
workers [Gray and Scholz, 1993]. Taken together, this sug-
gests that the impact measured by this study is if anything an
understatement of the total impact which the existence of
occupational safety and health standards has on the level of
injuries and illnesses.
Impact of Enforcement and Consultation 493

Finally, the associations between WISHA activity and
decreasing claims rates identified in this study do not provide
sufficient evidence for a causal relationship. To establish
causality it would be necessary to demonstrate the mechan-
ism by which claims rates decrease. One may expect those
accounts without WISHA activity to have not made any
changes in workplace safety while those accounts with
WISHA activity to correct hazards. On the other hand,
WISHA activity may lead to suppression of claims, which
also leads to the observed association. The lack of association
between consultation activities and decreasing claims rates
does not by itself prove that consultation is an ineffective
activity whether alone or in combination with enforcement
visits. The observed association does show that the simple
presence of WISHA in the workplace is not necessarily
associated with decreasing claims rates because there was no
decrease with consultation alone. Our results suggest, but do
not prove, that the threat of penalty does influence future
claims rates. Follow-up data after WISHA activity occurs
would provide useful information regarding mechanisms by
which claims decrease. Information on the abatement of
hazards is now being collected for enforcement visits. This
should be useful in future studies.
CONCLUSIONS
In conclusion, this study finds that the magnitude of the
decline in claims rate following inspections suggests that
enforcement activity may trigger broad improvements in
safety practices at visited workplaces; the similar results for
small firms suggest that opportunities for improved safety
among smaller businesses should not be neglected; and the
ability of firms to survive is not affected by whether they are
subjected to a WISHA inspection.
Taken in the context of recent calls to shift OSHA
resources away from enforcement and toward consultation,
this study suggests such moves may be counterproductive to
reaching the goal of improved safety and health.
ACKNOWLEDGMENTS
We thank Preetha Rajaraman and Heather Grob for prior
work in exploration of WISHA consultation and enforcement
data. We appreciate support from WISHA Services staff in
fixed and non-fixed worksite categorization.
REFERENCES
Allison PD. 1999. Logistic regression using the SAS system: Theoryand application. Cary, NC: SAS Institute.
Bartel AP, Thomas LG, NBER working paper #953. 1982. Cambridge,MA, National Bureau of Economic Research.
Cooke WN, Gautschi FH III. 1981. OSHA, plant safety programs, andinjury reduction. Ind Relat 20:245–257.
Gray WB, Scholz JT. 1993. Does regulatory enforcement work?A panel analysis of OSHA enforcement. Law & Soc Rev 27:177–213.
Kleinbaum DG, Kupper LL, Muller KE. 1988. Applied regressionanalysis and other multivariable methods. Boston, Mass: PWS-KentPub. Co.
McQuiston TH, Zakocs RC, Loomis D. 1998. The case for strongerOSHA enforcement—Evidence from evaluation research. Am J PublicHealth 88:1022–1024.
Mixon FG, Jr. 1900. Workers’ compensation and OSHA: Are bothnecessary? Gov Union Rev 13:37–43.
Nelson NA, Kaufman J, Kalat J, Silverstein B. 1997. Falls inconstruction: Injury rates for OSHA-inspected employers before andafter citation for violating the Washington State Fall ProtectionStandard. Am J Ind Med 31:296–302.
Ruser JW. 1993. Workers’ compensation and the distribution ofoccupational injuries. J Hum Resour 28(3):593–617.
Shapiro SA, Rabinowitz RS. 1997. Punishment versus cooperation inregulatory enforcement: A case study of OSHA. Adm Law Rev 49:713–762.
Smitha MW, Kirk KA, Oestenstad KR, Brown KC, Lee SD. 2001. Effectof state workplace safety laws on occupational injury rates. J OccupEnviron Med 43:1001–1010.
Spieler E. 1994. Perpetuating risk: Workers compensation and thepersistence of occupational injuries. Houston L Rev 31:1–45.
State of Washington, Dept. of Labor and Industries Division of Safety.General Safety Standards. 1946. Olympia, WA, State of WashingtonDepartment of Labor and Industries.
United States. General Accounting Office. 2001. Workplace safety andhealth: OSHA should strengthen the management of its consultationprogram. GAO-02-60.
United States. Office of Management and Budget. 1994–2002. Budgetof the United States Government.
United States. U. S. Congress, Office of Technology Assessment.(September 1995). Gaugeing control technology and regulatory impactsin occupational safety and health—An appraisal of OSHA’s analyticapproach, OTA-ENV-635.
494 Baggs et al.
Related Documents