WORKPIECE I MAGE - BASED TOOL WEAR C LASSIFICATION IN B LANKING P ROCESSES U SING D EEP C ONVOLUTIONAL N EURAL N ETWORKS APREPRINT Dirk Alexander Molitor Institute for Production Engineering and Forming Machines Technical University of Darmstadt Germany, 64289 Darmstadt [email protected] Christian Kubik Institute for Production Engineering and Forming Machines Technical University of Darmstadt Germany, 64289 Darmstadt [email protected] Ruben Helmut Hetfleisch Technical University of Darmstadt Germany, 64289 Darmstadt [email protected] Peter Groche Institute for Production Engineering and Forming Machines Technical University of Darmstadt Germany, 64289 Darmstadt [email protected] July 27, 2021 ABSTRACT Blanking processes belong to the most widely used manufacturing techniques due to their economic efficiency. Their economic viability depends to a large extent on the resulting product quality and the associated customer satisfaction as well as on possible downtimes. In particular, the occurrence of increased tool wear reduces the product quality and leads to downtimes, which is why considerable research has been carried out in recent years with regard to wear detection. While processes have widely been monitored based on force and acceleration signals, a new approach is pursued in this paper. Blanked workpieces manufactured by punches with 16 different wear states are photographed and then used as inputs for Deep Convolutional Neural Networks to classify wear states. The results show that wear states can be predicted with surprisingly high accuracy, opening up new possibilities and research opportunities for tool wear monitoring of blanking processes. Keywords Tool Condition Monitoring · Deep Learning · Wear Detection · Smart Manufacturing · Industry 4.0 · Blanking 1 Introduction Increasing quality requirements, high production rates and progressively more complex product geometries pose manu- facturers with the challenges of a systematic automation and an efficient monitoring of blanking processes. Therefore, sensors are increasingly integrated into the processes and attempts are made to identify correlations between process anomalies and features of the recorded time series. Conventional approaches monitor the time series with the help of thresholds (Jemielniak et al., 2012; Faura et al., 1997; Sari et al., 2017)), linear discriminant functions (Lee et al., 1997) or envelope curves and can thus distinguish binary process states from each other. In particular, the occurrence of punch wear, which has a negative impact on the resulting product quality (Hambli et al., 2002, 2003; Mucha, 2010; Maiti et al., 2000; Kubik et al., 2021a), is a widely researched application scenario. Knowledge about the current wear can help manufacturers to reduce downtimes and flexibly adapt maintenance intervals to the punch wear state. Modern arXiv:2107.12034v1 [cs.LG] 26 Jul 2021

Welcome message from author
This document is posted to help you gain knowledge. Please leave a comment to let me know what you think about it! Share it to your friends and learn new things together.
Transcript
WORKPIECE IMAGE-BASED TOOL WEAR CLASSIFICATION INBLANKING PROCESSES USING DEEP CONVOLUTIONAL
NEURAL NETWORKS
A PREPRINT
Dirk Alexander MolitorInstitute for Production Engineering
and Forming MachinesTechnical University of Darmstadt
Germany, 64289 [email protected]
Christian KubikInstitute for Production Engineering
and Forming MachinesTechnical University of Darmstadt
Germany, 64289 [email protected]
Ruben Helmut HetfleischTechnical University of Darmstadt
Germany, 64289 [email protected]
Peter GrocheInstitute for Production Engineering
and Forming MachinesTechnical University of Darmstadt
Germany, 64289 [email protected]
July 27, 2021
ABSTRACT
Blanking processes belong to the most widely used manufacturing techniques due to their economicefficiency. Their economic viability depends to a large extent on the resulting product quality and theassociated customer satisfaction as well as on possible downtimes. In particular, the occurrence ofincreased tool wear reduces the product quality and leads to downtimes, which is why considerableresearch has been carried out in recent years with regard to wear detection. While processes havewidely been monitored based on force and acceleration signals, a new approach is pursued in thispaper. Blanked workpieces manufactured by punches with 16 different wear states are photographedand then used as inputs for Deep Convolutional Neural Networks to classify wear states. The resultsshow that wear states can be predicted with surprisingly high accuracy, opening up new possibilitiesand research opportunities for tool wear monitoring of blanking processes.
Keywords Tool Condition Monitoring · Deep Learning · Wear Detection · Smart Manufacturing · Industry 4.0 ·Blanking
1 Introduction
Increasing quality requirements, high production rates and progressively more complex product geometries pose manu-facturers with the challenges of a systematic automation and an efficient monitoring of blanking processes. Therefore,sensors are increasingly integrated into the processes and attempts are made to identify correlations between processanomalies and features of the recorded time series. Conventional approaches monitor the time series with the help ofthresholds (Jemielniak et al., 2012; Faura et al., 1997; Sari et al., 2017)), linear discriminant functions (Lee et al., 1997)or envelope curves and can thus distinguish binary process states from each other. In particular, the occurrence of punchwear, which has a negative impact on the resulting product quality (Hambli et al., 2002, 2003; Mucha, 2010; Maitiet al., 2000; Kubik et al., 2021a), is a widely researched application scenario. Knowledge about the current wear canhelp manufacturers to reduce downtimes and flexibly adapt maintenance intervals to the punch wear state. Modern
arX
iv:2
107.
1203
4v1
[cs
.LG
] 2
6 Ju
l 202
1
arXiv Template A PREPRINT
monitoring approaches predict, for example, the edge radius of the punch by means of multiple linear regressions,whereby features from force signals are used as input variables (Hoppe et al., 2019).Some authors predict that artificial intelligence and machine learning will have enormous effects on blanking processes(Zheng et al., 2019; Klingenberg and de Boer, 2008), while the first applications have already been presented. Forexample, neural networks can be used to approximate the effects of fluctuating process parameters on geometric productproperties, whereby training data can be obtained through FEM simulations (Stanke et al., 2017; Al-Momani et al.,2012; Stanke et al., 2018; Hambli, 2002; Hambli and Guerin, 2003). It was also shown that wear conditions can beaccurately classified by extracting features from force signals and inputting them into Support Vector Machines (Kubiket al., 2021b).Such time-series-based monitoring approaches have two different key disadvantages. On the one hand, the sensors areheavily loaded during the process due to high force and acceleration peaks, which can cause contact losses or slipping.On the other hand, they need to be integrated as close as possible to the tool in order to realistically display the dynamiceffects of the process (Groche et al., 2019). To circumvent these issues, other data that contain correlations to wearconditions must be recorded and processed in real time.An efficient approach to overcome this problem is the recording of image data. Image-based sensors enable con-tactless monitoring of production processes and depict optically perceptible process characteristics in great detail(Cao et al., 2019a). In combination with the advances made in the field of deep learning over the past decade, im-ages can be processed in real time and correlations with labels recorded in production processes can be explored.However, to the best of the authors’ knowledge, no image-based, data-driven monitoring approaches of blankingprocesses can be found in the literature. Therefore, this paper shows how images of blanked workpieces can beused to predict wear conditions of the punch. For this purpose, 7440 photos of 1860 workpieces, produced bypunches with 16 different edge radii, are taken and used as inputs of Convolutional Neural Networks (CNN). Subse-quently, it is demonstrated to what extent the CNN can classify the workpiece images according to the 16 wear states.
rollover zone
shear zone
rupture zone
burr height
he
hl
hf
hb
a) force-displacement curve of blanking processes
punch-phase (I)
push-phase (II)
withdraw-phase (III)
time
b) partition of the cutting edge surface
punc
hfo
rce
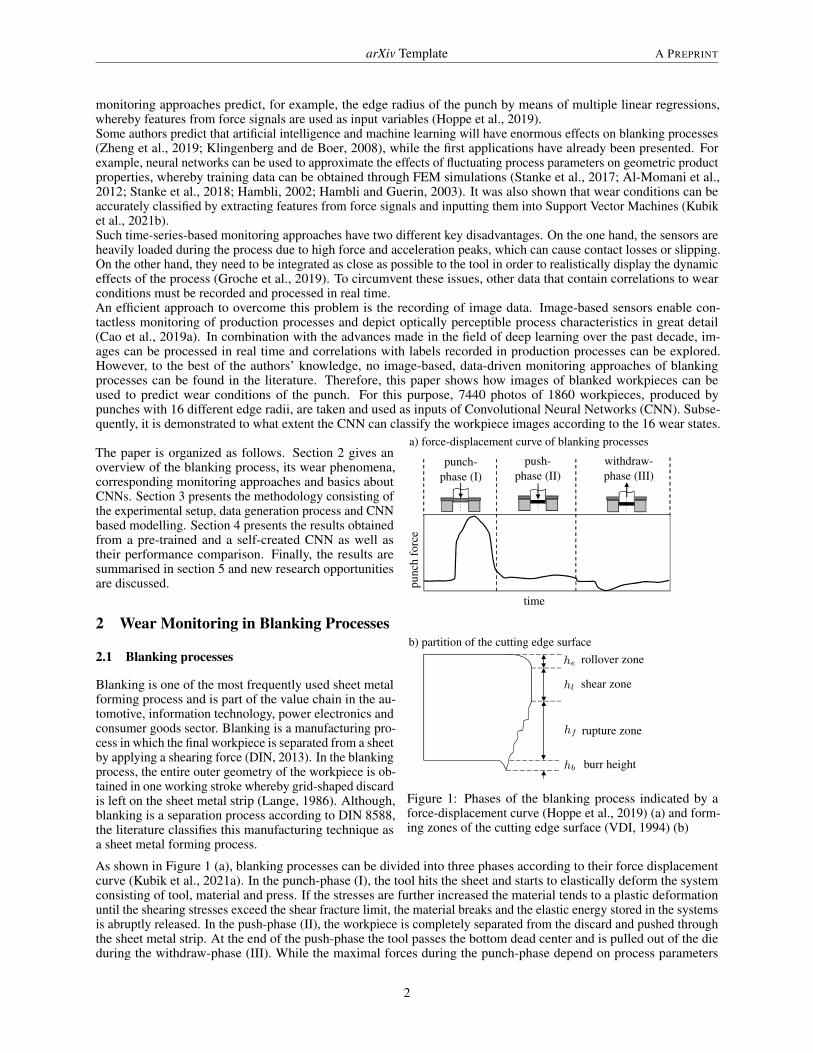
Figure 1: Phases of the blanking process indicated by aforce-displacement curve (Hoppe et al., 2019) (a) and form-ing zones of the cutting edge surface (VDI, 1994) (b)
The paper is organized as follows. Section 2 gives anoverview of the blanking process, its wear phenomena,corresponding monitoring approaches and basics aboutCNNs. Section 3 presents the methodology consisting ofthe experimental setup, data generation process and CNNbased modelling. Section 4 presents the results obtainedfrom a pre-trained and a self-created CNN as well astheir performance comparison. Finally, the results aresummarised in section 5 and new research opportunitiesare discussed.
2 Wear Monitoring in Blanking Processes
2.1 Blanking processes
Blanking is one of the most frequently used sheet metalforming process and is part of the value chain in the au-tomotive, information technology, power electronics andconsumer goods sector. Blanking is a manufacturing pro-cess in which the final workpiece is separated from a sheetby applying a shearing force (DIN, 2013). In the blankingprocess, the entire outer geometry of the workpiece is ob-tained in one working stroke whereby grid-shaped discardis left on the sheet metal strip (Lange, 1986). Although,blanking is a separation process according to DIN 8588,the literature classifies this manufacturing technique asa sheet metal forming process.
As shown in Figure 1 (a), blanking processes can be divided into three phases according to their force displacementcurve (Kubik et al., 2021a). In the punch-phase (I), the tool hits the sheet and starts to elastically deform the systemconsisting of tool, material and press. If the stresses are further increased the material tends to a plastic deformationuntil the shearing stresses exceed the shear fracture limit, the material breaks and the elastic energy stored in the systemsis abruptly released. In the push-phase (II), the workpiece is completely separated from the discard and pushed throughthe sheet metal strip. At the end of the push-phase the tool passes the bottom dead center and is pulled out of the dieduring the withdraw-phase (III). While the maximal forces during the punch-phase depend on process parameters
2

arXiv Template A PREPRINT
(clearance, cutting edge radii, cutting line), material properties (tensile strength, sheet thickness) or press settings (strokespeed, stiffness of the press), the pushing as well as the withdrawing forces are mainly due to contact normal forcesinfluenced by ongoing wear on the lateral punch surface (Kubik et al., 2021a; Hohmann et al., 2017). As an indicatorfor the quality of blanked workpieces, the cutting edge surface is quantified according to Lange (Lange, 1986). Asshown in Figure 1 (b), the form error found on the blanked surface is divided into rollover zone he, shear zone hl andrupture zone hf . In addition, the burr height hb is a key indicator of poor product quality and is directly influenced bythe wear state (Feistle et al., 2017).
2.2 Wear phenomena during blanking
Failures of blanking tools are often caused by major wear mechanisms referred to in the literature as adhesion, abrasion,surface fatigue and tribochemical wear (Lange, 1986). Especially, abrasive wear related to the rounding of the punchcutting edge due to the trend of processing high-strength materials is a major issue manufactures have to deal with(Xing et al., 2018). Hohmann et al. showed in their work that high-strength materials (Rm > 600 MPa) tend to abrasivewear on the tip while soft graded steels (Rm < 350 MPa) tend to adhesive wear on the lateral tool surface (Hohmannet al., 2017). Many authors have shown that abrasive wear directly influences product quality in terms of cutting edgesurface and burr height of the blanked workpieces (Hambli, 2001; Klingenberg and Singh, 2004). They have carried outexperimental and numerical studies on the correlation between cutting edge quality and abrasive wear state on the tool.One of the first studies in this area was conducted by Meade and Matsuno, who investigated the influence of wear onthe burr height (Maeda and Matsuno, 1967). Cheung et al. explored the influence of different process variables on thewear state of the blanking tool and correlated it with burr height and the required blanking force (Cheung et al., 2000).Kubik et al. systematically investigated the influence of semi-finished products and tool parameters on the quality ofthe cutting edge surface. They showed that the rounding of the cutting edge significantly increases the burr height andenhances the fraction of the sheared surface (Kubik et al., 2021a). In addition to experimental investigations, numericalmethods are increasingly used to predict tool wear in blanking processes. Hambli implemented a finite element (FE)wear model to predict tool wear in blanking steel and correlated tool wear with burr formation (Hambli, 2001). A moreadvanced approach was developed by Cheong and Kim, who took the effect of progressive tool wear into account of aFE model using a modified Archard wear model and a Lemaitre damage model. In addition, the geometry of the toolwas adjusted based on the predicted wear volume, the tool replacement time was predicted, and the product quality wasquantified based on the decrement of the hole area (Cheon and Kim, 2016). Due to the non-linearity of the blankingprocess and the variety of process variables, a detailed description of the wear state by analytical, empirical or numericalmodels is only possible to a limited extent. In this context, data-driven approaches based on acquired process data offerthe possibility to identify the cause of wear as well as to quantify the extent of the worn out region.
2.3 Data driven methods for process monitoring
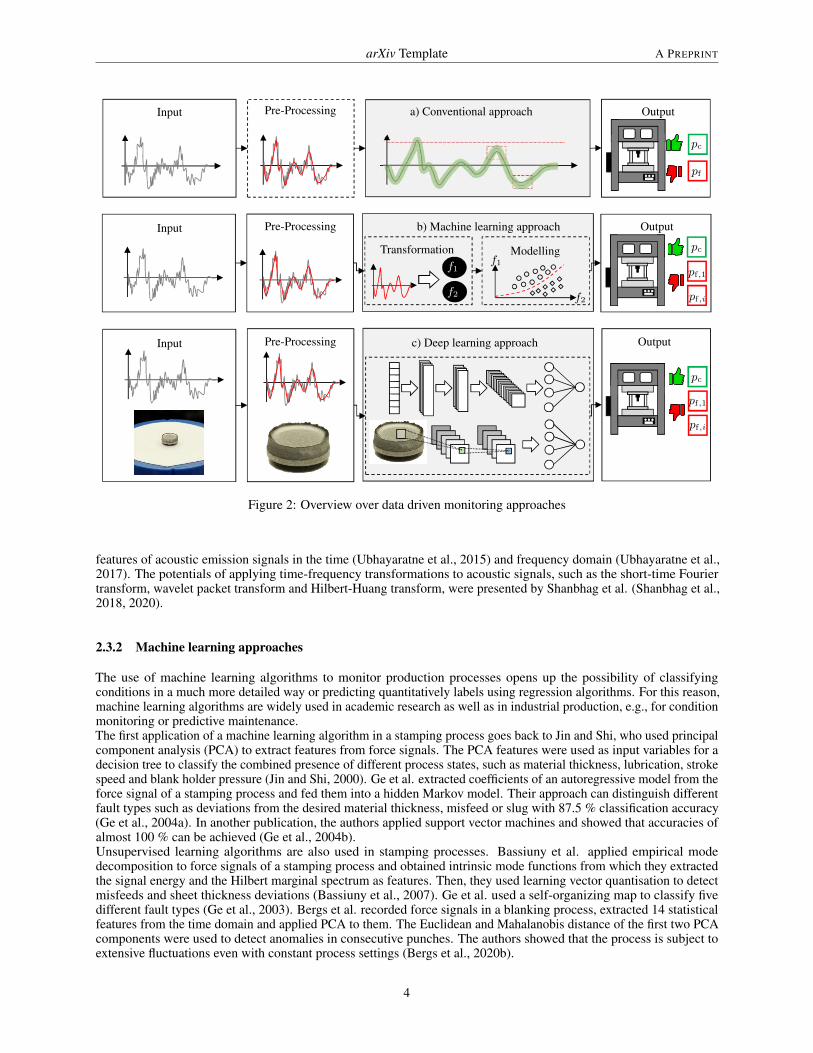
Since the 1990s, data-driven monitoring approaches have been researched and used in blanking processes. Theapproaches, which are mostly based on time series, differ considerably. Conventional monitoring approaches defineenvelope curves or thresholds that enable time series or extracted features to be monitored, whereby only binarystatements about faultless pc or faulty process states pf can be made. More advanced approaches use machine learningalgorithms that offer the potential to detect different error patterns pf,i. Recent publications in other production processesuse deep learning algorithms, which can deal with a variety of raw data. Additionally there is no need for hand-craftedfeature engineering, extraction and selection. An overview of the abstracted processes of the different approaches isprovided in Fig. 2.
2.3.1 Conventional monitoring approaches
One of the first qualitative investigations on time series-based monitoring of blanking processes go back to Breitling et al.(Breitling et al., 1997), who integrated different sensors both in the press frame and in the progressive die. They showedthat the optical appearance of the signals differs when using different materials, stroke speeds and punch-die clearances,from which the fundamental suitability of monitoring blanking processes through time series is justified. The firstreal-time monitoring of tool wear in a blanking process was published by Lee et al. (Lee et al., 1997) who used forcesignals to build an autoregressive model in order to estimate blanking force peaks. The coefficients of the autoregressivemodel were used as inputs for a linear discriminant function that classifies between new and worn tool. Koh et al.showed how wavelet transform-based Haar coefficients from a force signal can be used to detect faulty conditionsin a stamping process (Koh et al., 1999), similar wavelet-based approaches were investigated on force (Jin and Shi,1999, 2001; Zhou et al., 2006) and acceleration signals (Ge et al., 2002). Zhang et al. applied bispectral analysis toacceleration signals to identify defective products (Zhang et al., 2002). Recent publications monitor stamping processesby recording acoustic emissions. Ubhayaratne et al. revealed correlations between wear and lubricant conditions with
3
arXiv Template A PREPRINT
Input
Input
Pre-Processing
Pre-Processing
Transformation Modelling
b) Machine learning approach
a) Conventional approach Output
Output
Input Pre-Processing c) Deep learning approach Output
f1
f2
f1
f2
pc
pc
pc
pf
pf,1
pf,i
pf,1
pf,i
Figure 2: Overview over data driven monitoring approaches
features of acoustic emission signals in the time (Ubhayaratne et al., 2015) and frequency domain (Ubhayaratne et al.,2017). The potentials of applying time-frequency transformations to acoustic signals, such as the short-time Fouriertransform, wavelet packet transform and Hilbert-Huang transform, were presented by Shanbhag et al. (Shanbhag et al.,2018, 2020).
2.3.2 Machine learning approaches
The use of machine learning algorithms to monitor production processes opens up the possibility of classifyingconditions in a much more detailed way or predicting quantitatively labels using regression algorithms. For this reason,machine learning algorithms are widely used in academic research as well as in industrial production, e.g., for conditionmonitoring or predictive maintenance.The first application of a machine learning algorithm in a stamping process goes back to Jin and Shi, who used principalcomponent analysis (PCA) to extract features from force signals. The PCA features were used as input variables for adecision tree to classify the combined presence of different process states, such as material thickness, lubrication, strokespeed and blank holder pressure (Jin and Shi, 2000). Ge et al. extracted coefficients of an autoregressive model from theforce signal of a stamping process and fed them into a hidden Markov model. Their approach can distinguish differentfault types such as deviations from the desired material thickness, misfeed or slug with 87.5 % classification accuracy(Ge et al., 2004a). In another publication, the authors applied support vector machines and showed that accuracies ofalmost 100 % can be achieved (Ge et al., 2004b).Unsupervised learning algorithms are also used in stamping processes. Bassiuny et al. applied empirical modedecomposition to force signals of a stamping process and obtained intrinsic mode functions from which they extractedthe signal energy and the Hilbert marginal spectrum as features. Then, they used learning vector quantisation to detectmisfeeds and sheet thickness deviations (Bassiuny et al., 2007). Ge et al. used a self-organizing map to classify fivedifferent fault types (Ge et al., 2003). Bergs et al. recorded force signals in a blanking process, extracted 14 statisticalfeatures from the time domain and applied PCA to them. The Euclidean and Mahalanobis distance of the first two PCAcomponents were used to detect anomalies in consecutive punches. The authors showed that the process is subject toextensive fluctuations even with constant process settings (Bergs et al., 2020b).
4

arXiv Template A PREPRINT
2.3.3 Deep learning approaches
The application of machine learning algorithms to time signals is accompanied by the application of transformations,hand-crafted feature engineering, extraction and selection. Features must be extracted either model-based, e.g., byautoregressive models or PCA, in the time, frequency or time-frequency domain (Du, 2006). Deep learning approachestackle this problem by unifying the process steps of data transformation and model building, consequently expandingthe variety of usable data (LeCun and Bengio, 1995). For example, the application of filtering and pooling operations inCNNs can simplify the high-dimensional representation of image data so that it can be used efficiently for classificationand regression tasks. Publications from stamping, blanking and in general sheet metal forming processes rarely applydeep learning algorithms. Huang and Dzulfikri transformed acceleration signals into the frequency domain and used theentire power density spectrum as input for a one dimensional CNN. They demonstrated that they can distinguish sevendifferent wear states with more than 99 % accuracy (Huang and Dzulfikri, 2021). Unterberg et al. recorded magneticbarkhausen noise from different material coils, created recurrence plots of the time series and used them as inputs for atwo dimensional CNN. They classified whether certain material sections belong to the beginning, middle or end of acoil, as these sections have different semi-finished product properties (Unterberg et al., 2019).Approaches that use deep learning for the purpose of tool condition monitoring are relatively new. This is evidencedby the fact that a comprehensive review paper from 2013 did not present any deep learning applications (Dutta et al.,2013), whereas recent review papers discussed and emphasised the suitability of such algorithms (Serin et al., 2020).For example, Gouarir et al. recorded triaxial force signals in a milling process, applied a method called GramianAngular Summation Field to the time series to obtain a two-dimensional representation and classified the force signalsaccording to three wear states using CNN (Gouarir et al., 2018). Cao et al., Kothuru et al. and Martínez-Arellano etal. also classified tool wear conditions by transforming recorded time series into two-dimensional representations,which are then used as inputs for a CNN (Cao et al., 2019b; Kothuru et al., 2019; Martínez-Arellano et al., 2019).Recent publications used image data in combination with deep learning algorithms to detect wear states. A particularlyinteresting approach was taken by Bergs et al. who took 50 microscopic images of each of eight different tools. Then,they generated artificial images using data augmentation techniques and fed the images into a Fully ConvolutionalNetwork (FCN). The task of the FCN was to separate worn-out areas of the tool from non-worn-out areas, so that eachpixel was labeled according to whether it represents a worn area or not. The authors showed that the deep learningapproach is superior to classical computer vision algorithms and that local wear can be detected using FCN (Bergs et al.,2020a). Marei et al. took 327 microscope images of the cutting tool flank of a CNC machine and applied different CNNtransfer learning models to them to classify and regress 14 different wear states of the tool. The ResNet-18 model ledto both the highest classification accuracy of 84 % and the lowest normalized mean absolute error of 0.0773 (Mareiet al., 2021). Other image-based CNN approaches can be found in the literature, such as predicting the remaininguseful life of cutting wheels (Li et al., 2020) or classifying different types of wear in a face milling process (Wu et al.,2019b). These findings prove that image-based methods are highly suitable for the detection of wear states. Since wearconditions are reflected in the geometric properties of the products, especially in blanking processes (Hambli et al.,2002; Kubik et al., 2021a; Hambli et al., 2003; Mucha, 2010), the authors of the present paper choose the approach oftaking images of workpieces and correlating them with the existing tool wear using CNN.
2.4 Convolutional Neural Networks
CNNs are one of the most important deep learning algorithms and are used in different application areas, such as objectdetection, object recognition, pose estimation and text recognition (Liu et al., 2017). Ever since CNN showed unbeatableperformance in high-level image classification competitions compared to shallow learning algorithms (Krizhevsky et al.,2017), they have become a standard in image classification applications.
InputLayer
ConvolutionalLayer
PoolingLayer
FlattenLayer
Fully ConnectedLayer
OutputLayer
Xin ∈ Rm×m×3
Figure 3: Structure of a CNN
5
arXiv Template A PREPRINT
CNNs consist of an input layer and an output layer, between which convolutional, pooling, flatten and, if required,fully connected layers are arranged. The typical structure of a CNN is shown in Figure 3. The input variable ofimage-processing CNNs are the original images, which can be represented as a two-dimensional matrix Xin in the caseof black-and-white images, or as a three-dimensional tensor Xin in the case of RGB images. One of the most importantcomponents of CNNs are convolutional layers. In convolutional layers, feature maps are generated by applying filters,also called kernels. If Xlj is the j-th feature map in the l-th layer, it is calculated according to
Xlj = f
(N∑i=1
Xl−1i ∗Wl
ij + blj
), (1)
where Wlij is a weighting matrix, ∗ is the computational symbol of a two dimensional convolution with predefined
filters and blj are bias parameters of the l-th layer. Here, f(·) is a non-linear activation function, whereby especially inimage processing deep networks Rectified Linear Unit (ReLU)
f(x) = max[0, x] (2)
is used. The convolutional layer is usually followed by pooling layers, which reduce the dimensionality of the previousfeature map according to predefined rules. In common CNNs, average pooling or max pooling layers are used. After amostly alternating sequence of convolutional and pooling layers, a flatten layer follows, which transforms the multi-dimensional feature map into a one dimensional representation. At the end of the network topology, several fullyconnected layers usually form a multilayer perceptron (MLP), which transforms the one dimensional input to outputvalues. Within the MLP, the output of the l-th hidden layers is calculated by
xl = f(
Wl · xl−1 + bl). (3)
In the classification case, the output layer has as many neurons as there are classes, with the softmax function
fsoft,k(xi) =exk∑Ni=1 e
xi
(4)
now serving as the activation function of the k-th output neuron.
semi-finishedproduct
productgeometry
blanking process
tool
productimage
generationimage data setfor tool wearclassification
16 wear states(cutting edge
radii ri)
model building
determinebest
performingpre-trained
model
buildingself-
createdCNN
hyperparameteroptimization
toolwear
classifi-cation
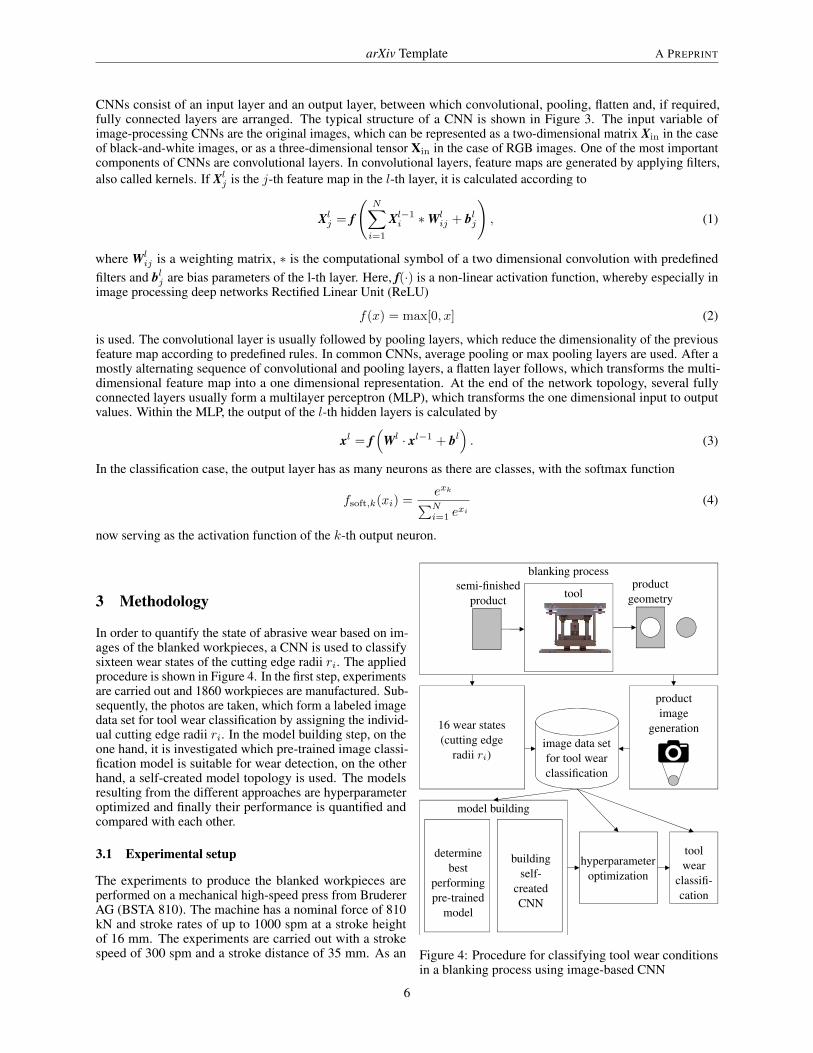
Figure 4: Procedure for classifying tool wear conditionsin a blanking process using image-based CNN
3 Methodology
In order to quantify the state of abrasive wear based on im-ages of the blanked workpieces, a CNN is used to classifysixteen wear states of the cutting edge radii ri. The appliedprocedure is shown in Figure 4. In the first step, experimentsare carried out and 1860 workpieces are manufactured. Sub-sequently, the photos are taken, which form a labeled imagedata set for tool wear classification by assigning the individ-ual cutting edge radii ri. In the model building step, on theone hand, it is investigated which pre-trained image classi-fication model is suitable for wear detection, on the otherhand, a self-created model topology is used. The modelsresulting from the different approaches are hyperparameteroptimized and finally their performance is quantified andcompared with each other.
3.1 Experimental setup
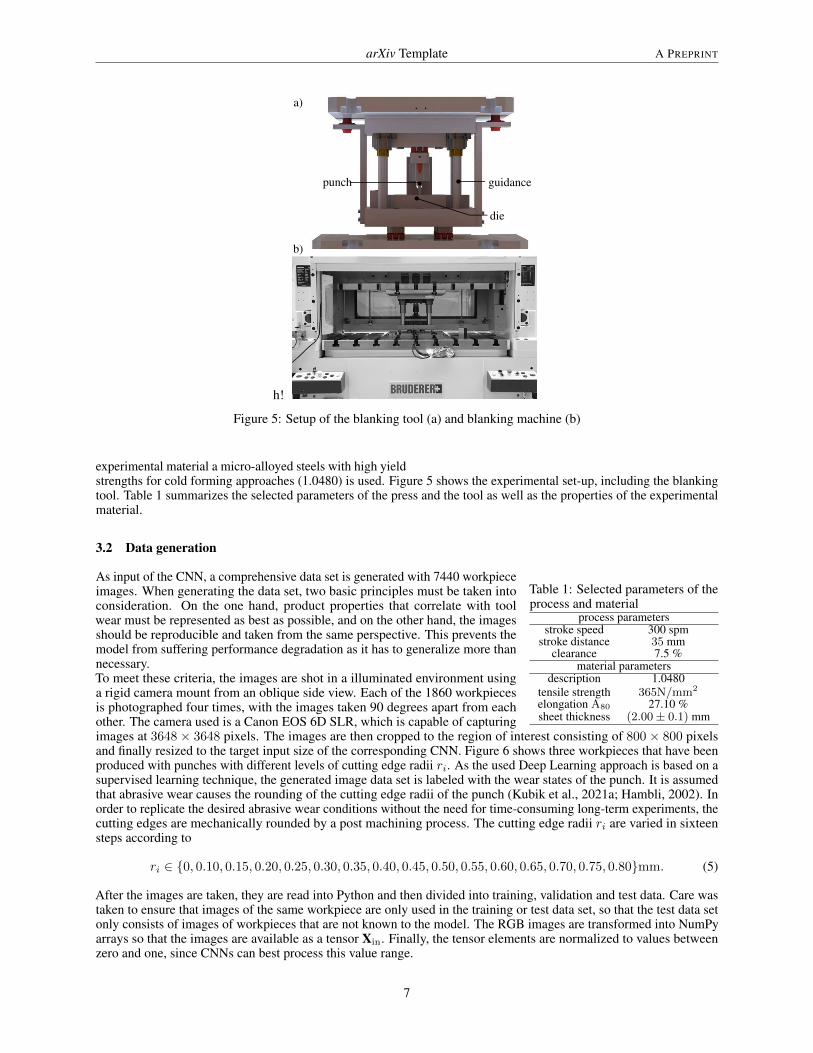
The experiments to produce the blanked workpieces areperformed on a mechanical high-speed press from BrudererAG (BSTA 810). The machine has a nominal force of 810kN and stroke rates of up to 1000 spm at a stroke heightof 16 mm. The experiments are carried out with a strokespeed of 300 spm and a stroke distance of 35 mm. As an
6
arXiv Template A PREPRINT
h!
punch guidance
die
a)
b)
Figure 5: Setup of the blanking tool (a) and blanking machine (b)
experimental material a micro-alloyed steels with high yieldstrengths for cold forming approaches (1.0480) is used. Figure 5 shows the experimental set-up, including the blankingtool. Table 1 summarizes the selected parameters of the press and the tool as well as the properties of the experimentalmaterial.
3.2 Data generation
Table 1: Selected parameters of theprocess and material
process parametersstroke speed 300 spm
stroke distance 35 mmclearance 7.5 %
material parametersdescription 1.0480
tensile strength 365N/mm2
elongation A80 27.10 %sheet thickness (2.00± 0.1) mm
As input of the CNN, a comprehensive data set is generated with 7440 workpieceimages. When generating the data set, two basic principles must be taken intoconsideration. On the one hand, product properties that correlate with toolwear must be represented as best as possible, and on the other hand, the imagesshould be reproducible and taken from the same perspective. This prevents themodel from suffering performance degradation as it has to generalize more thannecessary.To meet these criteria, the images are shot in a illuminated environment usinga rigid camera mount from an oblique side view. Each of the 1860 workpiecesis photographed four times, with the images taken 90 degrees apart from eachother. The camera used is a Canon EOS 6D SLR, which is capable of capturingimages at 3648× 3648 pixels. The images are then cropped to the region of interest consisting of 800× 800 pixelsand finally resized to the target input size of the corresponding CNN. Figure 6 shows three workpieces that have beenproduced with punches with different levels of cutting edge radii ri. As the used Deep Learning approach is based on asupervised learning technique, the generated image data set is labeled with the wear states of the punch. It is assumedthat abrasive wear causes the rounding of the cutting edge radii of the punch (Kubik et al., 2021a; Hambli, 2002). Inorder to replicate the desired abrasive wear conditions without the need for time-consuming long-term experiments, thecutting edges are mechanically rounded by a post machining process. The cutting edge radii ri are varied in sixteensteps according to
ri ∈ 0, 0.10, 0.15, 0.20, 0.25, 0.30, 0.35, 0.40, 0.45, 0.50, 0.55, 0.60, 0.65, 0.70, 0.75, 0.80mm. (5)
After the images are taken, they are read into Python and then divided into training, validation and test data. Care wastaken to ensure that images of the same workpiece are only used in the training or test data set, so that the test data setonly consists of images of workpieces that are not known to the model. The RGB images are transformed into NumPyarrays so that the images are available as a tensor Xin. Finally, the tensor elements are normalized to values betweenzero and one, since CNNs can best process this value range.
7

arXiv Template A PREPRINT
3.3 Deep Learning Modeling
r00 = 0 mm r40 = 0.4 mm r80 = 0.8 mm
a) b) c)
Figure 6: Workpieces produced with cutting edge radii riof a) 0 mm, b) 0.4 mm and c) 0.8 mm
In order to find the best possible network topology, twodifferent approaches are chosen. On the one hand, net-work topologies can be freely chosen and then hyper-parameter optimized. On the other hand, transfer learn-ing techniques (Zhuang et al., 2020) allow the use ofpre-trained models whose performance has already beenproven in other image classification tasks (Shao et al.,2014). The machine and deep learning community wasable to demonstrate several years ago that CNNs are ca-pable of learning generic mid-level image representations(Oquab et al., 2014). As a result, weights and topologiesof networks obtained in image classification tasks withmillions of labeled images and several thousand classescan also bring advantages to tasks that have comparativelyfew images and classes (Sermanet et al., 2013).
3.3.1 Choice of the transfer learning model
All models presented are developed in Python, popu-lar deep learning libraries such as Keras and Tensorflow(Abadi et al., 2016) are used. Keras provides a varietyof pre-trained models that have been used for the transfer learning approach. The dataset described in chapter 3.2 isdivided into 70 % test, 15 % validation and 15 % training data and fed into 27 pre-trained models. Sparse categorialcross entropy (SCCE) is used as the loss function and Adam (Kingma and Ba, 2014) as the optimization algorithm. Noadditional fully connected layers are added to the models, the inputs of the output layer are taken from the flatten layerand the training of the models is stopped after 5 epochs. The results of the comparison of all pretrained models can beseen in Figure 7.
Table 2: Overview over optimized hyperparameters
Hyperparameter MobileNet Self-created CNNAmount of FCLs Not used (0) 3Neurons in FCLs Not used 512; 512; 512
Batch Normalization Not used After every FCLDropout Not used Not used
L2-regularization Not used 0.01Amount of CL Not optimized 7Learning Rate 0.0001 0.001Trained layers Last 24 layers All layersFilters in CL Not optimized 25;26;26;27;28;28;28
Table 3: Overview over network topologies and informations onthe training process
Network parameter MobileNet Self-created CNNActivation function ReLU ReLUAmount of layers 88 31
Trainable parameters 3,223,376 2,273,680Output activation function Softmax Softmax
Pooling operation used Average MaxAmount of CL 27 7Amount of PL 1 6
Input dimension of Xin R224×224×3 R128×128×3
Amount of output neurons 16 16Amount of FCL 0 3
Optimization algorithm Adam AdamLoss function SCCE SCCE
It is evident that the accuracy of the different modelsvaries greatly. The VGG models (Tammina, 2019)deliver classification accuracies between 45 and 50%, whereas different versions of ResNet modelsachieve accuracies of up to 79 %. The MobileNet,which is originally used for object recognition incommercially available smartphones (Howard et al.,2017), performs best with classification accuraciesover 80 %. Last but not least due to the compara-tively low number of trainable parameters and theassociated low model complexity, it was decided touse the MobileNet as transfer learning model in thefollowing.
3.3.2 Hyperparameter optimization
In order to determine optimal hyperparameters forthe developed models, a comprehensive hyperpa-
8

arXiv Template A PREPRINT
107
number of model parameters
80
70
60
50
40
30
20
10
MobileNetV3SmallMobileNetV2MobileNetEfficientNetB0MobileNetV3LargeNASNetMobileEfficientNetB1DenseNet121EfficientNetB2EfficientNetB3DenseNet169VGG16EfficientNetB4DenseNet201VGG19XceptionInceptionV3ResNet50V2ResNet50EfficientNetB5
EfficientNetB6ResNet101V2ResNet101InceptionResNetV2ResNet152V2ResNet152EfficientNetB7
clas
sific
atio
nac
cura
cy
Figure 7: Comparison of pretrained models
rameter optimization is carried out for both the self-created CNN and the pre-trained MobileNet. Due to the probability-based search and computational efficiencyadvantages over conventional optimization methods such as grid search, Bayesian hyperparameter optimization (Wuet al., 2019a) is applied. In the optimization process, the individual runs are trained on 50 epochs and those hyperparam-eters are selected that lead to the highest accuracies. Table 2 gives an overview of the optimized hyperparameters. Table3 presents the final network topologies obtained and additional information on the training processes.
4 Results
Table 4: Descriptive statistics of the model performancesStatistical parameter MobileNet Self-created CNN
Mean accuracy µ 98.94 % 98.80 %Median accuracy 98.93 % 98.83 %
Standard deviation σ 0.24 % 0.37 %95% confidence intervals (98.94± 0.06)% (98.80± 0.10)%
Maximum accuracy 99.41 % 99.71 %Minimum accuracy 98.44 % 97.47 %
In the present section, the performances ofthe two models obtained from hyperparame-ter optimization are compared. To be able tocompare the model performances in a sta-tistically robust way, the two models areboth trained 100 times over 200 epochs,whereby the training process is stopped if nosignificant performance improvements arerecorded over 30 consecutive epochs. 64images of each wear class are used as vali-dation data, another 64 images of each class as test data. The remaining 5392 images are used to train the models.
100
99.5
99
98.5
98MobileNet Self-created CNN
clas
sific
atio
nac
cura
cy
Figure 8: Performance comparison of Mo-bileNet and self-created CNN
Figure 8 shows the results of 100 independent model runs as a boxplot,descriptive statistics of the results can be found in Table 4. It can beseen that both models deliver extremely high accuracy values and thewear condition of the tool can be determined by both models with almost99 % accuracy. The accuracies of the models differ only in the decimalrange, whereby the performance of the MobileNet is slightly better. Therobustness of the MobileNet also appears to be higher, which is indi-cated by lower standard deviations and closer confidence intervals of themodel performance. This is either due to the initialised weights of theMobileNet and the associated ability to provide generic mid-level imagerepresentations, or to the higher number of trainable model parameters.
In order to make statistically reliable statements about the superiority ofone machine learning algorithm over another, methods from statistics canbe applied. One approach to detect significant differences in performancesof classifiers is the Welch’s unequal variances t-test for differences in mean
9
arXiv Template A PREPRINT
accuracy (Demšar, 2006). Since it is assumed that the pre-trained MobileNet can generate generic mid-level imagerepresentations, a one-tailed hypothesis test is conducted and the significance level is chosen to be p = 0.01. If themean accuracies of MobileNet and self-created CNN are described by µMob and µCNN, respectively, then the nullhypothesis is:
Table 5: Results of the one-tailed t-test for differ-ences in mean accuracies between MobileNet andself-created CNN
Observations N per model 100Degrees of freedom 169
tstat 3.13tcrit one-tailed 2.35p(tstat ≤ tcrit) 0.001
H0: The accuracy of the MobileNet is equal to or less than that ofthe self-created CNN (µMob ≤ µCNN).
The t-statistic value can be calculated by
tstat =µMob − µCNN√σ2Mob
N +σ2CNN
N
, (6)
where σMob and σCNN are the standard deviations of the accuraciesof Mobilenet and self-generated CNN, respectively. The resultsof the t-test can be seen in Table 5. It is shown that the test issignificant due to
p(tstat ≤ tcrit) < p = 0.01, (7)which is why the null hypothesis must be rejected. This leads to the statistically robust statement that the MobileNet isbetter suited for the classification of tool wear conditions and leads to higher accuracies.
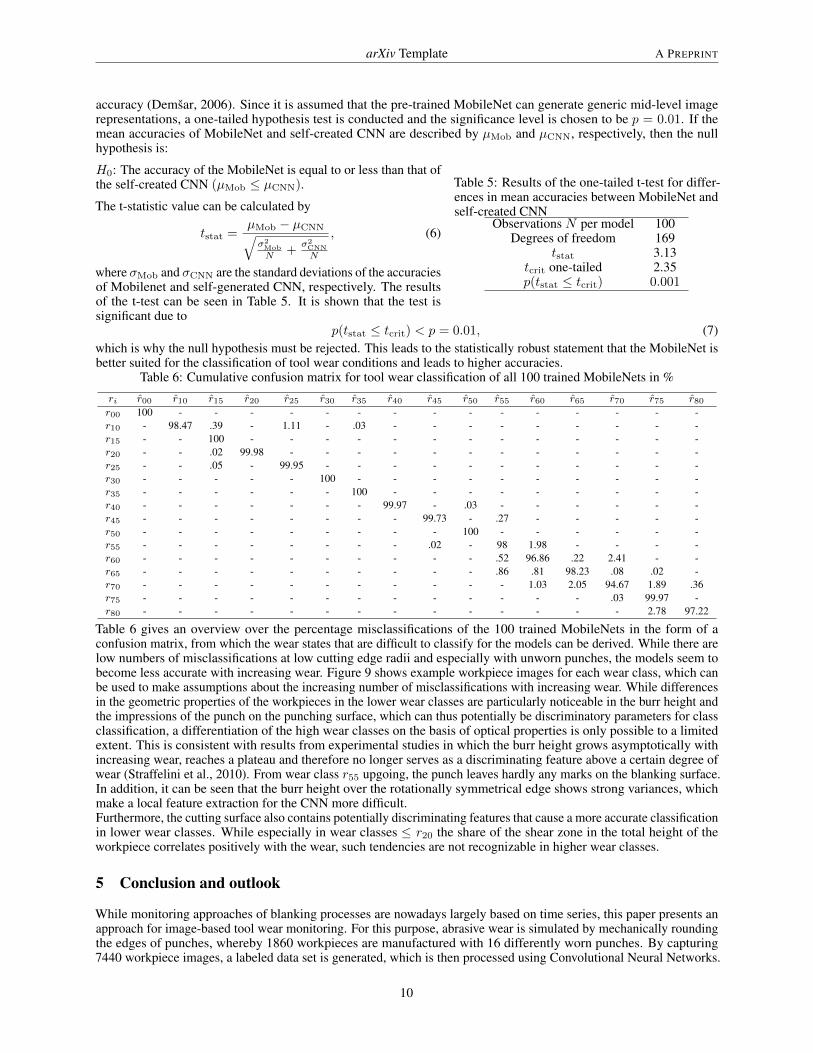
Table 6: Cumulative confusion matrix for tool wear classification of all 100 trained MobileNets in %
ri r00 r10 r15 r20 r25 r30 r35 r40 r45 r50 r55 r60 r65 r70 r75 r80r00 100 - - - - - - - - - - - - - - -r10 - 98.47 .39 - 1.11 - .03 - - - - - - - - -r15 - - 100 - - - - - - - - - - - - -r20 - - .02 99.98 - - - - - - - - - - - -r25 - - .05 - 99.95 - - - - - - - - - - -r30 - - - - - 100 - - - - - - - - - -r35 - - - - - - 100 - - - - - - - - -r40 - - - - - - - 99.97 - .03 - - - - - -r45 - - - - - - - - 99.73 - .27 - - - - -r50 - - - - - - - - - 100 - - - - - -r55 - - - - - - - - .02 - 98 1.98 - - - -r60 - - - - - - - - - - .52 96.86 .22 2.41 - -r65 - - - - - - - - - - .86 .81 98.23 .08 .02 -r70 - - - - - - - - - - - 1.03 2.05 94.67 1.89 .36r75 - - - - - - - - - - - - - .03 99.97 -r80 - - - - - - - - - - - - - - 2.78 97.22
Table 6 gives an overview over the percentage misclassifications of the 100 trained MobileNets in the form of aconfusion matrix, from which the wear states that are difficult to classify for the models can be derived. While there arelow numbers of misclassifications at low cutting edge radii and especially with unworn punches, the models seem tobecome less accurate with increasing wear. Figure 9 shows example workpiece images for each wear class, which canbe used to make assumptions about the increasing number of misclassifications with increasing wear. While differencesin the geometric properties of the workpieces in the lower wear classes are particularly noticeable in the burr height andthe impressions of the punch on the punching surface, which can thus potentially be discriminatory parameters for classclassification, a differentiation of the high wear classes on the basis of optical properties is only possible to a limitedextent. This is consistent with results from experimental studies in which the burr height grows asymptotically withincreasing wear, reaches a plateau and therefore no longer serves as a discriminating feature above a certain degree ofwear (Straffelini et al., 2010). From wear class r55 upgoing, the punch leaves hardly any marks on the blanking surface.In addition, it can be seen that the burr height over the rotationally symmetrical edge shows strong variances, whichmake a local feature extraction for the CNN more difficult.Furthermore, the cutting surface also contains potentially discriminating features that cause a more accurate classificationin lower wear classes. While especially in wear classes ≤ r20 the share of the shear zone in the total height of theworkpiece correlates positively with the wear, such tendencies are not recognizable in higher wear classes.
5 Conclusion and outlook
While monitoring approaches of blanking processes are nowadays largely based on time series, this paper presents anapproach for image-based tool wear monitoring. For this purpose, abrasive wear is simulated by mechanically roundingthe edges of punches, whereby 1860 workpieces are manufactured with 16 differently worn punches. By capturing7440 workpiece images, a labeled data set is generated, which is then processed using Convolutional Neural Networks.
10

arXiv Template A PREPRINT
r80 r75 r70 r65
r60 r55 r50 r45
r40 r35 r30 r25
r20 r15 r10 r00
Figure 9: Example images of workpieces produced with 16different punch edge radii ri
A pre-trained CNN called MobileNet as well as a self-generated CNN are hyperparameter optimized and usedfor the image classification task. The results show thatboth models have excellent classification accuracies ofup to 99 % and are thus highly suitable for tool wearclassification. Using statistical testing methods, it canbe shown that the pre-trained MobileNet is slightly supe-rior to the self-created CNN. In addition, images of theworkpieces show that optical properties correlate with thepunch wear, but their ambiguity prevents an even moreprecise classification, especially in the presence of highwear.These promising results open up new possibilities for fu-ture research. Future research efforts should investigatethe extent to which models react to workpiece images ofdifferent semi-finished products and punch geometries.A highly interesting approach is to train the models onunlabeled data by using domain adaptation techniques in order to generate models that are as generalisable as possibleand adaptable to different applications. Another interesting object of investigation is the performance behaviour of themodels with varying data set sizes and how data augmentation techniques can improve model performances. In addition,the workpiece images offer the possibility to apply computer vision algorithms for hand-crafted feature extraction inorder to capture product properties as time-efficiently as possible. A process-integrated acquisition of the workpieceimages and their fusion with sensor data enables the identification of correlations between time series signals andproduct properties, which in turn can be used for predictive quality applications.
ReferencesAbadi M, Barham P, Chen J, Chen Z, Davis A, Dean J, Devin M, Ghemawat S, Irving G, Isard M, et al. (2016)
Tensorflow: A system for large-scale machine learning. In: 12th USENIX symposium on operating systems designand implementation (OSDI ’16), pp 265–283
Al-Momani ES, Mayyas AT, Rawabdeh I, Alqudah R (2012) Modeling blanking process using multiple regres-sion analysis and artificial neural networks. Journal of materials engineering and performance 21(8):1611–1619,doi:10.1007/s11665-011-0079-x
Bassiuny AM, Li X, Du R (2007) Fault diagnosis of stamping process based on empirical mode decompositionand learning vector quantization. International Journal of Machine Tools and Manufacture 47(15):2298–2306,doi:10.1016/j.ijmachtools.2007.06.006
Bergs T, Holst C, Gupta P, Augspurger T (2020a) Digital image processing with deep learning for automated cuttingtool wear detection. Procedia Manufacturing 48:947–958, doi:10.1016/j.promfg.2020.05.134
Bergs T, Niemietz P, Kaufman T, Trauth D (2020b) Punch-to-punch variations in stamping processes. In: 2020 IEEE18th World Symposium on Applied Machine Intelligence and Informatics (SAMI), IEEE, pp 000213–000218,doi:10.1109/SAMI48414.2020.9108761
Breitling J, Pfeiffer B, Altan T, Siegert K (1997) Process control in blanking. Journal of Materials Processing Technology71(1):187–192, doi:10.1016/S0924-0136(97)00167-2
Cao J, Brinksmeier E, Fu M, Gao R, Liang B, Merklein M, Schmidt M, Yanagimoto J (2019a) Manufacturing ofadvanced smart tooling for metal forming. CIRP Annals 68(2):605–628, doi:10.1016/j.cirp.2019.05.001
Cao X, Chen B, Yao B, Zhuang S (2019b) An intelligent milling tool wear monitoring methodology based on convolu-tional neural network with derived wavelet frames coefficient. Applied Sciences 9(18):3912, doi:10.3390/app9183912
Cheon S, Kim N (2016) Prediction of tool wear in the blanking process using updated geometry. Wear 352:160–170,doi:10.1016/j.wear.2016.01.024
Cheung CF, Lee WB, Chiu W (2000) An investigation of tool wear in the dam-bar cutting of integrated circuit packages.Wear 237(2):274–282, doi:10.1016/S0043-1648(99)00350-6
Demšar J (2006) Statistical comparisons of classifiers over multiple data sets. The Journal of Machine LearningResearch 7:1–30
DIN (2013) Din 8588:2013-08 - manufacturing processes severing – classification, subdivision, terms and definitions.Tech. rep., Deutsches Institut für Normung
11

arXiv Template A PREPRINT
Du R (2006) Monitoring and diagnosis of sheet metal stamping processes. In: Wang L, Gao RX (eds) ConditionMonitoring and Control for Intelligent Manufacturing, Springer, chap 8, pp 193–218, doi:10.1007/1-84628-269-1_8
Dutta S, Pal S, Mukhopadhyay S, Sen R (2013) Application of digital image processing in tool condition monitoring: Areview. CIRP Journal of Manufacturing Science and Technology 6(3):212–232, doi:10.1016/j.cirpj.2013.02.005
Faura F, Lopez J, Sanes J (1997) Criterion for tool wear limitation on blanking 18-8 stainless steel strips. Revista demetalurgia 33(5):304–310, doi:10.3989/REVMETALM.1997.V33.I5.842
Feistle M, Koslow I, Krinninger M, Golle R, Volk W (2017) Reduction of burr formation for conventional shear cuttingof boron-alloyed sheets through focused heat treatment. Procedia CIRP 63:493–498, doi:10.1016/j.procir.2017.03.161
Ge M, Zhang GC, Du R, Xu Y (2002) Feature extraction from energy distribution of stamping processes using wavelettransform. Journal of Vibration and Control 8(7):1023–1032, doi:10.1177/107754602029577
Ge M, Du R, Xu Y (2003) Fault detection using hierarchical self-organizing map. In: IEEE International Conferenceon Robotics, Intelligent Systems and Signal Processing, 2003. Proceedings. 2003, IEEE, vol 1, pp 565–570,doi:10.1109/RISSP.2003.1285636
Ge M, Du R, Xu Y (2004a) Hidden markov model based fault diagnosis for stamping processes. Mechanical Systemsand Signal Processing 18(2):391–408, doi:10.1016/S0888-3270(03)00076-1
Ge M, Du R, Zhang G, Xu Y (2004b) Fault diagnosis using support vector machine with an application in sheet metalstamping operations. Mechanical Systems and Signal Processing 18(1):143–159, doi:10.1016/S0888-3270(03)00071-2
Gouarir A, Martínez-Arellano G, Terrazas G, Benardos P, Ratchev S (2018) In-process tool wear prediction system basedon machine learning techniques and force analysis. Procedia CIRP 77:501–504, doi:10.1016/j.procir.2018.08.253
Groche P, Hohmann J, Übelacker D (2019) Overview and comparison of different sensor positions andmeasuring methods for the process force measurement in stamping operations. Measurement 135:122–130,doi:10.1016/j.measurement.2018.11.058
Hambli R (2001) Blanking tool wear modeling using the finite element method. International Journal of Machine Toolsand Manufacture 41(12):1815–1829, doi:10.1016/S0890-6955(01)00024-4
Hambli R (2002) Prediction of burr height formation in blanking processes using neural network. International Journalof Mechanical Sciences 44(10):2089–2102, doi:10.1016/S0020-7403(02)00168-6
Hambli R, Guerin F (2003) Application of a neural network for optimum clearance prediction in sheet metal blankingprocesses. Finite Elements in Analysis and Design 39(11):1039–1052, doi:10.1016/S0168-874X(02)00155-5
Hambli R, Kobi S, Guerin F, Dumon B (2002) Relationships between blanking force and part geometry vs. clearance,tool wear, and sheet thickness. Quality Engineering 15(2):197–207, doi:10.1081/QEN-120015852
Hambli R, Guerin F, Dumon B (2003) Numerical evaluation of the tool wear influence on metal-punching processes.The International Journal of Advanced Manufacturing Technology 21(7):483–493, doi:10.1007/s001700300057
Hohmann J, Schatz T, Groche P (2017) Intelligent wear identification based on sensory inline information for astamping process. In: Majstorovic V, Jakovljevic Z (eds) Proceedings of 5th International Conference on AdvancedManufacturing Engineering and Technologies, Lecture Notes in Mechanical Engineering, Springer InternationalPublishing, Cham, pp 285–295, doi:10.1007/978-3-319-56430-2_21
Hoppe F, Hohmann J, Knoll M, Kubik C, Groche P (2019) Feature-based supervision of shear cutting processes onthe basis of force measurements: Evaluation of feature engineering and feature extraction. Procedia Manufacturing34:847–856, doi:10.1016/j.promfg.2019.06.164
Howard AG, Zhu M, Chen B, Kalenichenko D, Wang W, Weyand T, Andreetto M, Adam H (2017) Mobilenets: Efficientconvolutional neural networks for mobile vision applications. preprint arXiv:170404861
Huang CY, Dzulfikri Z (2021) Stamping monitoring by using an adaptive 1d convolutional neural network. Sensors21(1):262, doi:10.3390/s21010262
Jemielniak K, Urbanski T, Kossakowska J, Bombinski S (2012) Tool condition monitoring based on numerous signalfeatures. The International Journal of Advanced Manufacturing Technology 59:73–81, doi:10.1007/s00170-011-3504-2
Jin J, Shi J (1999) Feature-preserving data compression of stamping tonnage information using wavelets. Technometrics41(4):327–339, doi:10.1080/00401706.1999.10485932
Jin J, Shi J (2000) Diagnostic feature extraction from stamping tonnage signals based on design of experiments. Journalof Manufacturing Science and Engineering 122(2):360–369, doi:10.1115/1.538926
12

arXiv Template A PREPRINT
Jin J, Shi J (2001) Automatic feature extraction of waveform signals for in-process diagnostic performance improvement.Journal of Intelligent Manufacturing 12(3):257–268, doi:10.1023/A:1011248925750
Kingma DP, Ba J (2014) Adam: A method for stochastic optimization. preprint arXiv:14126980
Klingenberg W, de Boer TW (2008) Condition-based maintenance in punching/blanking of sheet metal. InternationalJournal of Machine Tools and Manufacture 48(5):589–598, doi:10.1016/j.ijmachtools.2007.08.013
Klingenberg W, Singh U (2004) Principles for on-line monitoring of tool wear during sheet metal punching. In:Proceedings of the 34th International MATADOR Conference, Springer, pp 169–174, doi:10.1007/978-1-4471-0647-0_25
Koh CKH, Shi J, Williams WJ, Ni J (1999) Multiple fault detection and isolation using the haar transform, part2: Application to the stamping process. Journal of Manufacturing Science and Engineering 121(2):295–299,doi:10.1115/1.2831219
Kothuru A, Nooka SP, Liu R (2019) Application of deep visualization in cnn-based tool condition monitoring for endmilling. Procedia Manufacturing 34:995–1004, doi:10.1016/j.promfg.2019.06.096
Krizhevsky A, Sutskever I, Hinton GE (2017) Imagenet classification with deep convolutional neural networks.Communications of the ACM 60(6):84–90, doi:10.1145/3065386
Kubik C, Hohmann J, Groche P (2021a) Exploitation of force displacement curves in blanking - feature engineer-ing beyond defect detection. The International Journal of Advanced Manufacturing Technology 113:261–278,doi:10.1007/s00170-020-06450-z
Kubik C, Knauer S, Groche P (2021b) Smart sheet metal forming: importance of data acquisition, preprocessing andtransformation on the performance of a multiclass support vector machine for predicting wear states during blanking.Journal of Intelligent Manufacturing 32, doi:10.1007/s10845-021-01789-w
Lange K (1986) Handbook of metal forming. McGraw-Hill
LeCun Y, Bengio Y (1995) Convolutional networks for images, speech, and time-series. In: Arbib MA (ed) TheHandbook of Brain Theory and Neural Networks, MIT Press
Lee WB, Cheung CF, Chiu WM, Chan LK (1997) Automatic supervision of blanking tool wear using pattern recog-nition analysis. International Journal of Machine Tools and Manufacture 37(8):1079–1095, doi:10.1016/S0890-6955(97)88104-7
Li X, Jia X, Wang Y, Yang S, Zhao H, Lee J (2020) Industrial remaining useful life prediction by partial observa-tion using deep learning with supervised attention. IEEE/ASME Transactions on Mechatronics 25(5):2241–2251,doi:10.1109/TMECH.2020.2992331
Liu W, Wang Z, Liu X, Zeng N, Liu Y, Alsaadi FE (2017) A survey of deep neural network architectures and theirapplications. Neurocomputing 234:11–26, doi:10.1016/j.neucom.2016.12.038
Maeda T, Matsuno K (1967) Wear on shearing tools: (wear on cutting edges of blanking tool for square parts). Bulletinof JSME 10(37):197–205, doi:10.1299/jsme1958.10.197
Maiti S, Ambekar A, Singh U, Date P, Narasimhan K (2000) Assessment of influence of some process parame-ters on sheet metal blanking. Journal of Materials Processing Technology 102(1-3):249–256, doi:10.1016/S0924-0136(99)00486-0
Marei M, El Zaatari S, Li W (2021) Transfer learning enabled convolutional neural networks for estimating health stateof cutting tools. Robotics and Computer-Integrated Manufacturing 71:102145, doi:10.1016/j.rcim.2021.102145
Martínez-Arellano G, Terrazas G, Ratchev S (2019) Tool wear classification using time series imaging and deep learning.The International Journal of Advanced Manufacturing Technology 104(9):3647–3662, doi:10.1007/s00170-019-04090-6
Mucha J (2010) An experimental analysis of effects of various material tool’s wear on burr during generator sheetsblanking. The International Journal of Advanced Manufacturing Technology 50(5-8):495–507, doi:10.1007/s00170-010-2554-1
Oquab M, Bottou L, Laptev I, Sivic J (2014) Learning and transferring mid-level image representations using convo-lutional neural networks. In: Proceedings of the IEEE conference on computer vision and pattern recognition, pp1717–1724, doi:10.1109/CVPR.2014.222
Sari DY, Wu TL, Lin BT (2017) Preliminary study for online monitoring during the punching process. The InternationalJournal of Advanced Manufacturing Technology 88(5-8):2275–2285, doi:10.1007/s00170-016-8956-y
13

arXiv Template A PREPRINT
Serin G, Sener B, Ozbayoglu A, Unver H (2020) Review of tool condition monitoring in machining and opportunitiesfor deep learning. The International Journal of Advanced Manufacturing Technology pp 1–22, doi:10.1007/s00170-020-05449-w
Sermanet P, Eigen D, Zhang X, Mathieu M, Fergus R, LeCun Y (2013) Overfeat: Integrated recognition, localizationand detection using convolutional networks. preprint arXiv:13126229
Shanbhag VV, Rolfe BF, Arunachalam N, Pereira MP (2018) Investigating galling wear behaviour in sheet metalstamping using acoustic emissions. Wear 414:31–42
Shanbhag VV, Rolfe BF, Arunachalam N, Pereira MP (2020) Investigation of galling wear using acoustic emissionfrequency characteristics. Lubricants 8(3):25, doi:10.3390/lubricants8030025
Shao L, Zhu F, Li X (2014) Transfer learning for visual categorization: A survey. IEEE transactions on neural networksand learning systems 26(5):1019–1034, doi:10.1109/TNNLS.2014.2330900
Stanke J, Trauth D, Feuerhack A, Klocke F (2017) Setup of a parameterized fe model for the die roll prediction infine blanking using artificial neural networks. In: Journal of Physics: Conference Series, IOP Publishing, vol 896, p012096
Stanke J, Feuerhack A, Trauth D, Mattfeld P, Klocke F (2018) A predictive model for die roll height in fine blankingusing machine learning methods. Procedia Manufacturing 15:570–577, doi:10.1088/1742-6596/896/1/012096
Straffelini G, Bizzotto G, Zanon V (2010) Improving the wear resistance of tools for stamping. Wear 269(9-10):693–697,doi:10.1016/j.wear.2010.07.004
Tammina S (2019) Transfer learning using vgg-16 with deep convolutional neural network for classifying images.International Journal of Scientific and Research Publications 9(10):143–150, doi:10.29322/IJSRP.9.10.2019.p9420
Ubhayaratne I, Xiang Y, Pereira M, Rolfe B (2015) An audio signal based model for condition monitoring of sheetmetal stamping process. In: 2015 IEEE 10th Conference on Industrial Electronics and Applications (ICIEA), IEEE,pp 1267–1272, doi:10.1109/ICIEA.2015.7334303
Ubhayaratne I, Pereira MP, Xiang Y, Rolfe BF (2017) Audio signal analysis for tool wear monitoring in sheet metalstamping. Mechanical Systems and Signal Processing 85:809–826, doi:10.1016/j.ymssp.2016.09.014
Unterberg M, Niemietz P, Trauth D, Wehrle K, Bergs T (2019) In-situ material classification in sheet-metal blankingusing deep convolutional neural networks. Production Engineering 13(6):743–749, doi:10.1007/s11740-019-00928-w
VDI (1994) Vdi 2906 blatt 2 - quality of cut faces of (sheet) metal parts after cutting, blanking, trimming or piercing;shearing, form of sheared edge und characteristic values. Tech. rep., Verein Deutscher Ingenieure e.V.
Wu J, Chen XY, Zhang H, Xiong LD, Lei H, Deng SH (2019a) Hyperparameter optimization for machinelearning models based on bayesian optimization. Journal of Electronic Science and Technology 17(1):26–40,doi:10.11989/JEST.1674-862X.80904120
Wu X, Liu Y, Zhou X, Mou A (2019b) Automatic identification of tool wear based on convolutional neural network inface milling process. Sensors 19(18):3817, doi:10.3390/s19183817
Xing Z, Chen L, Lei C, Cai T, Yub H (2018) Simulated analysis and experimental investigation on edge qualities ofhigh strength steels hot blanking parts. Procedia Manufacturing 15:619–626, doi:10.1016/j.promfg.2018.07.286
Zhang G, Ge M, Tong H, Xu Y, Du R (2002) Bispectral analysis for on-line monitoring of stamping operation.Engineering Applications of Artificial Intelligence 15(1):97–104, doi:10.1016/S0952-1976(02)00007-6
Zheng Q, Zhuang X, Zhao Z (2019) State-of-the-art and future challenge in fine-blanking technology. ProductionEngineering 13(1):61–70, doi:10.1007/s11740-018-0839-7
Zhou S, Sun B, Shi J (2006) An spc monitoring system for cycle-based waveform signals using haar transform. IEEETransactions on Automation Science and Engineering 3(1):60–72, doi:10.1109/TASE.2005.859655
Zhuang F, Qi Z, Duan K, Xi D, Zhu Y, Zhu H, Xiong H, He Q (2020) A comprehensive survey on transfer learning.Proceedings of the IEEE 109(1):43–76, doi:10.1109/JPROC.2020.3004555
14
Related Documents