Welcome message from author
This document is posted to help you gain knowledge. Please leave a comment to let me know what you think about it! Share it to your friends and learn new things together.
Transcript


At Cross Country Healthcare, we know that our
success is dependent on how well we serve our
clients. That’s why we make it a priority to work
and grow together. We motivate each other to go
beyond expectations and to achieve more than
we thought possible. It’s our belief that customers
are won over and held onto, one at a time. And
through reliable, honest communication, we will
do our best to ensure that our customers know
they are an integral part of our continued growth
and success.
Working Towards Our Goal
EXECUTIVE OFFICERSJoseph A. BoshartPresident and Chief Executive Officer
Emil HenselChief Financial Officer
Vickie AnenbergExecutive Vice President,Cross Country Staffing
Susan E. Ball, RNGeneral Counsel
Greg GreenePresident, Cross Country Education
Victor KalafaVice President, Corporate Development
Daniel J. LewisPrincipal Accounting Officer
Dr. Franklin A. Shaffer, EdD, RN, FAANChief Nursing Officer
Tony SimsPresident, ClinForce
Jonathan W. WardPresident, Cross Country Staffing
Carol WestfallPresident, Cejka Search
CORPORATE HEADQUARTERSCross Country Healthcare, Inc.6551 Park of Commerce Blvd.Boca Raton, Florida 33487Phone: 561.998.2232www.crosscountryhealthcare.com
STOCKHOLDER INQUIRIESNews releases, SEC filings, annual reports,corporate governance matters and additionalinformation about Cross Country Healthcareare available on our corporate website at nocost. Current and prospective investors canalso register to automatically receive by emailour press releases, SEC filings and othernotices. Information about the Company canalso be obtained by writing or contacting:
Howard A. GoldmanDirector of Investor & Corporate RelationsPhone: 561.998.2232Toll-Free: 877.686.9779Email: [email protected]
Certain exhibits in our Form 10-K for theyear ended December 31, 2007, as filedwith the SEC, are not included in the Form10-K enclosed as part of this AnnualReport. Our Form 10-K, including allexhibits, is available on our corporatewebsite or the SEC’s website atwww.sec.gov.
INDEPENDENT REGISTERED PUBLIC ACCOUNTING FIRMErnst & Young LLPOne Clearlake CentreSuite 900250 South Australian AvenueWest Palm Beach, Florida 33401
TRANSFER AGENTLaSalle Bank National Association135 South LaSalle StreetSuite 1960Chicago, IL 60603Toll-Free: 800.246.5761Fax: 312.904.2236
CORPORATE GOVERNANCEInformation concerning our corporate governance practices,including our Code of Conduct, Codeof Ethics, Committee Charters, andCertification of Financial Statements,is available on our corporate websiteat www.crosscountryhealthcare.com.
We also have established a toll-freephone number and an email addressfor stockholders to communicate withour Board of Directors. All such communications will be kept confidential and forwarded directly tothe appropriate party, as applicable.
Hotline: 800.354.7197 E-mail: [email protected]
STOCK LISTINGOur common stock trades under thesymbol “CCRN” on the NASDAQGlobal Select Market, a new markettier created by the NASDAQ StockMarket® that became effective on July 1,2006. NASDAQ became operational asa stock exchange on August 1, 2006.
FORWARD-LOOKING STATEMENTSInformation concerning forward-lookingstatements can be found on page 1 ofour Annual Report on Form 10-K forthe year ended December 31, 2007,as well as in Quarterly Reports onForm 10-Q to be filed by us in fiscalyear 2008.
BOARD OF DIRECTORSJoseph A. BoshartPresident and Chief Executive OfficerCross Country Healthcare, Inc.
W. Larry Cash (a)(b)
Executive Vice President and Chief Financial OfficerCommunity Health Systems
C. Taylor Cole, Jr.PartnerCharterhouse Group, Inc.
Thomas C. Dircks (b)(c)
Managing PartnerCharterhouse Group, Inc.
Gale Fitzgerald (a)
PrincipalTranspeed, Inc.
Emil HenselChief Financial OfficerCross Country Healthcare, Inc.
Joseph Trunfio (a)(c)
President and Chief Executive OfficerAtlantic Health Systems
(a) Member of the Audit Committee (b) Member of the Compensation Committee(c) Member of the Nominating Committee
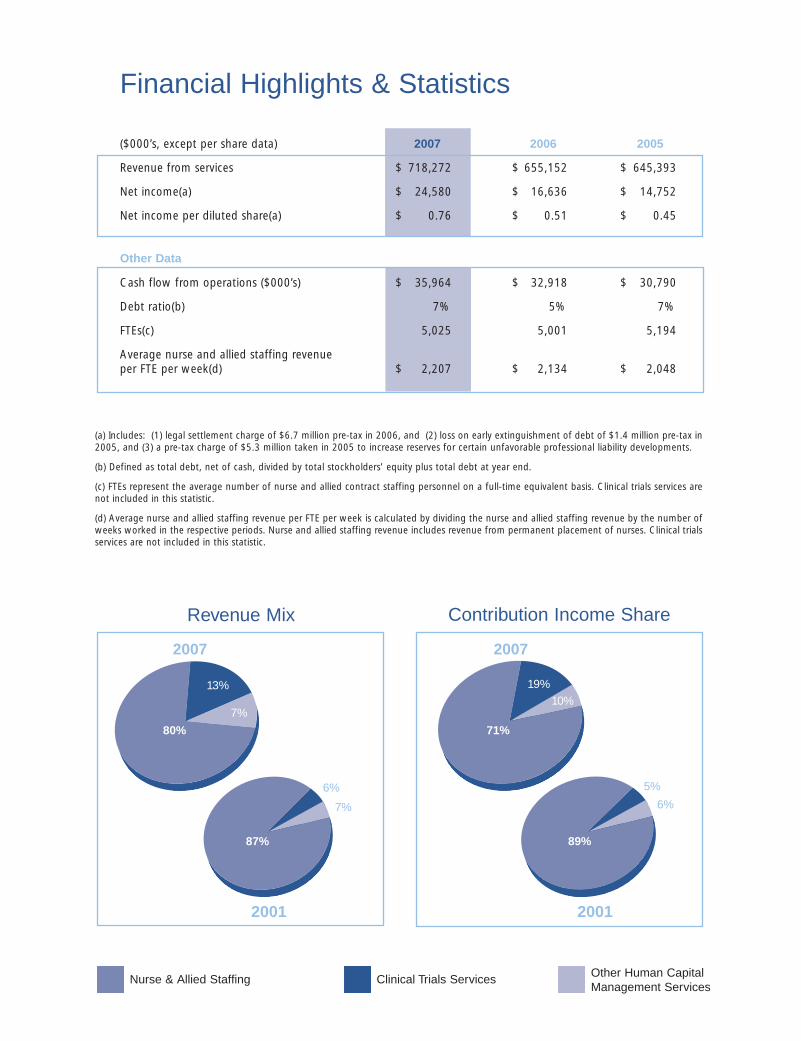
Financial Highlights & Statistics
(a) Includes: (1) legal settlement charge of $6.7 million pre-tax in 2006, and (2) loss on early extinguishment of debt of $1.4 million pre-tax in2005, and (3) a pre-tax charge of $5.3 million taken in 2005 to increase reserves for certain unfavorable professional liability developments.
(b) Defined as total debt, net of cash, divided by total stockholders’ equity plus total debt at year end.
(c) FTEs represent the average number of nurse and allied contract staffing personnel on a full-time equivalent basis. Clinical trials services arenot included in this statistic.
(d) Average nurse and allied staffing revenue per FTE per week is calculated by dividing the nurse and allied staffing revenue by the number ofweeks worked in the respective periods. Nurse and allied staffing revenue includes revenue from permanent placement of nurses. Clinical trialsservices are not included in this statistic.
Revenue Mix Contribution Income Share
Nurse & Allied Staffing Clinical Trials Services Other Human CapitalManagement Services
2007
2001
80%
87%
13%
7%
6%
7%
2007
2001
71%
89%
19%
10%
5%
6%
($000’s, except per share data) 2007 2006 2005
Revenue from services $ 718,272 $ 655,152 $ 645,393
Net income(a) $ 24,580 $ 16,636 $ 14,752
Net income per diluted share(a) $ 0.76 $ 0.51 $ 0.45
Other Data
Cash flow from operations ($000’s) $ 35,964 $ 32,918 $ 30,790
Debt ratio(b) 7% 5% 7%
FTEs(c) 5,025 5,001 5,194
Average nurse and allied staffing revenueper FTE per week(d) $ 2,207 $ 2,134 $ 2,048

Dear Fellow Stockholders:We encourage our employees at Cross Country Healthcare to abide by a simple philosophy, which is tofocus our efforts on the things we can control and improve, and not to waste energy on the things we can’tcontrol. Our ability to adhere to these words was truly put to the test during the past year. For example, ouroperating performance in 2007 was strong:
• Revenue increased 10% to a record $718 million;
• Net income was up 48% from the prior year on a reported basis and increased nearly 20% even when acharge related to the settlement of a class action lawsuit in California in 2006 is excluded;
• Gross margins improved throughout the year, with the fourth quarter ending up 220 basis points fromprior year, reflecting the impact of both attractive higher margin acquisitions made during the year andimproving operating performance, particularly in our key nurse and allied staffing business segment;
• Both operating and free cash flow continued to be strong, with the fourth quarter performance the highestin our Company’s history;
• Our clinical trials services business segment generated more than $25 million in fourth quarter revenue,which equates to an annual run rate in revenue of more than $100 million, creating a meaningful secondleg of growth for the Company.
Notwithstanding these results, our share price performance weakened significantly in the fourth quarter as investors appeared to be placing a higher probability on the economy going into recession, and consequently reducing their expectations for future results from companies like ours in the business servicessector. As there are undoubtedly other factors at play, we believe this is the most important reason behindour recent stock price decline. While we certainly can’t control whether or not the economy enters intorecession, we are highly disappointed that our strong operating performance during 2007 did not appearat all to translate into greater shareholder value. The reality was quite the contrary.
Even though we agree that a recession will likely reduce the performance potential for the vast majority ofpublicly traded companies, we believe Cross Country Healthcare is much better positioned today to weathersuch an unfavorable economic climate than it was entering the last recession earlier this decade. There areseveral reasons for our confidence.
First, we believe we have a stronger position in the nurse and allied staffing market than we did in 2002,because of our successful vendor management strategy along with our acquisition of MedStaff in June of 2003.
Second, during the past two years we have redeployed excess cash thrown off by our nurse and alliedstaffing business into the higher margin clinical trials staffing services market. This market has had morefavorable growth dynamics in recent years than has the nurse and allied staffing market, and is not affectedto the same degree by a soft labor market.
As a result, we have diversified our revenue sources since becoming a public company in 2001. More importantly, the contribution income generated by our clinical trials services business in the fourth quarterof 2007 of $3.8 million was 18% of total company contribution income — 3.5 times the level in the fourthquarter of 2001 when it was 5% of total contribution income. So, even if the labor market deterioratesfurther as a result of a weakening economy, we believe the actions we have taken will better insulate ourCompany from its consequences.
Lastly, admissions trends at hospitals have been essentially flat since 2003 and hospital administratorsappear to have incorporated a lower level of expectations into their nurse staffing plans. Consequently, webelieve there is a greater potential for an upside surprise in admissions reflecting the aging and growth of theU.S. population, which we believe would create a more favorable market environment for us to operate in.
While no one can predict the future, we believe nevertheless that we have many reasons to be optimisticabout our near-term and long-term prospects. Notwithstanding the relatively more challenging operatingenvironment, as we enter 2008, your management team will strive to achieve continued improvement inour operating performance and will remain focused on the operating strategies we have deployed sincebecoming a public company. Such strategies include: strengthening our market position in our nurse andallied business, which generates strong cash flow; making strategic acquisitions in high growth, higher marginbusinesses as we have done in clinical trials services; opportunistically buying back our common stock; allthe while maintaining a strong balance sheet to provide financial flexibility. We believe continued adherenceto these strategies will yield strong shareholder returns over time.
As always, I appreciate the dedication and hard work of our employees and the continued support of our shareholders.
Sincerely,
Joseph A. BoshartPresident and Chief Executive Officer
March 2008

Cross Country Healthcare, Inc.
We are a leading provider of nurse and allied staffing services in the United States, a global provider of clinical
trials services to global pharmaceutical and biotechnology customers, as well as a provider of other human
capital management services focused on healthcare. We have a national client base of approximately 4,000
contracts with hospitals, pharmaceutical and biotechnology companies, and other healthcare organizations.
Our mix of business shifted during 2007 due to several recent acquisitions, which led us to begin reporting
our financial results according to three business segments. Our nurse and allied staffing segment represented
80% of our 2007 revenue and is comprised of travel and per diem nurse staffing and travel allied health
staffing. Travel nurse staffing is our core business and it represented approximately 68% of total revenue.
Our clinical trials services segment represented 13% of revenue and consists of service offerings that include
traditional staffing, as well as clinical trials management, drug safety monitoring, and regulatory services to
pharmaceutical and biotechnology customers. Our other human capital management services segment
represented 7% of our revenue and consists of education and training, as well as retained search services
related to physicians and healthcare executives.
Nurse and Allied Staffing
We market our healthcare staffing services to hospitals and healthcare facilities through our Cross Country
Staffing and MedStaff brands. We provide credentialed registered nurses (RNs) for travel and per diem
staffing assignments at public and private healthcare facilities, and at for-profit and not-for-profit facilities
located throughout the U.S. The vast majority of our assignments are at acute care hospitals, including
teaching institutions, trauma centers and community hospitals located in major metropolitan areas. We also
provide other healthcare professionals in a wide range of specialties that include operating room technicians
and other allied health professionals, such as rehabilitation therapists, radiology technicians and respiratory
therapists.
Cross Country Staffing operates differentiated recruiting brands to recruit RNs and allied healthcare
professionals on a domestic and international basis. These brands include Cross Country TravCorps, NovaPro,
Cross Country Local and Assignment America. MedStaff recruits RNs for travel staffing assignments as well
as RNs and other healthcare professionals for assignments in local markets where it maintains branch offices.
Our fees are paid directly by our clients and, in certain cases, by third-party administrative payors. As a result, we
have no direct exposure to any third-party reimbursements including, Medicare or Medicaid reimbursements.
Clinical Trials Services
We provide a flexible range of traditional contract staffing, clinical research outsourcing, drug safety monitoring,
and regulatory consulting services to pharmaceutical, biotechnology and medical device companies, as well as
contract research organization (CRO) customers. We market these services through our ClinForce brand, as
well as additional brands that we acquired since August 2006, which together have allowed us to establish
a significant geographic footprint in the U.S. and an important presence in the European market.
Among the various clinical trials services we provide, traditional contract staffing, project management, and
outsourcing account for more than 70% of segment revenue. The business units that comprise our clinical
trials services segment include:
• ClinForce is our platform brand that primarily provides clinical research professionals for in-sourced and
out-sourced contract assignments and permanent placement services. Customers include pharmaceutical,
biotechnology and medical device companies, as well as CROs. We acquired ClinForce in March 2001. It
is headquartered in the Research Triangle Park, North Carolina.
• Metropolitan Research Associates (MRA) provides clinical trials management consisting of monitoring and
managing of clinical trials as well as providing functional drug safety solutions. MRA has extensive experience
across a wide range of therapeutic areas – including women’s health, CNS, pain management, infectious
disease and obesity. Customers include pharmaceutical, biotechnology and medical device companies.
We acquired Metropolitan Research in August 2006. It is based in New York City.
• AKOS Limited provides drug safety, regulatory and clinical trials services. Customers include pharmaceutical
and biotechnology companies in Europe, the U.S., Canada and Asia. We acquired AKOS in June 2007. It
is based in Harpenden, Hertfordshire, United Kingdom.
• Assent Consulting provides contract staffing services to pharmaceutical and biotechnology customers in
the U.S. We acquired Assent in July 2007. It is based in Cupertino and Solana Beach, California.
Other Human Capital Management Services
Our Cross Country Education (CCE) subsidiary provides continuing education programs to the healthcare
industry and our field employees. CCE offers one-day seminars and e-learning, as well as national and
regional conferences, on topics relevant to nurses and other healthcare professionals.
Our Cejka Search subsidiary is a nationally recognized retained search organization that provides physician
and executive search services throughout the U.S. exclusively to the healthcare industry, including
physician group practices, hospitals and health systems, academic medical centers, managed care, and
other healthcare organizations.
Financial Performance
I am pleased to report on our improved financial performance in 2007. Our revenue was
a record $718 million, up 10% from the prior year. Net income was $24.6 million, up 48%
from the prior year, and our earnings per diluted share were $0.76 in 2007, up 49% on
a reported basis.
Following the completion of several strategic acquisitions, starting in the second quarter
of 2007, we began reporting our results through three business segments: nurse and
allied staffing, clinical trials services, and other human capital management services.
Looking at our segment performance, for the full-year 2007, nurse and allied staffing
revenue increased 4% to $576.8 million and contribution income increased 4% to $54.9
million from the prior year. Clinical trials services revenue increased 70% to $90.6 million
and contribution income increased 108% to $14.4 million from a year ago. Other human
capital management services revenue increased 8% to $50.9 million while contribution
income decreased 16% to $7.6 million from the prior year period.
A number of factors contributed to our improved performance in 2007:
• We continued to invest in the clinical trials services market, which is currently a higher
growth and higher margin business than our other businesses. We acquired AKOS
Limited in June and Assent Consulting in July. These two businesses, combined with
the Metropolitan Research business we acquired in August 2006, and our ClinForce
business that we acquired in 2001, provide us with a range of capabilities in contract
research outsourcing, drug safety monitoring, clinical trials management and regulatory
services. We have also attained a much more attractive geographic footprint for this
business primarily in the U.S., as well as in Europe.
• Our gross profit margin for the full-year increased 100 basis-points to 24.3%, and
included a 220 basis point improvement in the fourth quarter. This year–over–year
improvement is due to a combination of a higher mix of revenue from our clinical trials
services businesses and a continued widening of the bill-pay spread in our travel nurse
staffing business.
• Bill rates in our travel nurse staffing business increased 4% year–over–year and the average
revenue per FTE per week for our nurse and allied staffing segment as a whole was up
more than 3% versus the prior year.
Our balance sheet remains strong. We generated $36.0 million of cash from operating
activities during 2007, which was a 9% increase over the prior year, and included the
highest ever quarterly cash flow for our Company in the fourth quarter of $19.9 million.
We used $17.1 million for debt repayment, another $10.9 million for share repurchases,
and $8.3 million for capital expenditures, which was higher than our historic 1% of total revenue and
primarily reflected ongoing IT and Internet related projects. We ended the year with $39 million of debt and
$9 million of cash on the balance sheet. Net of cash, our debt to total capital ratio was 7% and the current
ratio was 3-to-1 at year-end. DSOs at the end of the year were 59 days, down 1 day from the prior year.
We continue to evaluate the optimal use of our excess cash for building shareholder value. We believe that
strategic acquisitions at reasonable prices represent the best opportunity for enhancing our shareholders’
return on investment. Our strong balance sheet, coupled with low interest rates and our proven track record
in integrating acquisitions, has created a favorable environment for supplementing our organic growth
through acquisitions. We will continue to use a disciplined approach when evaluating acquisition opportunities
to ensure that they are not only accretive, but can be reasonably expected to generate returns that are
significantly in excess of our overall cost of capital over the long run.
We also intend to use some of our excess cash to repurchase our own shares when we believe that our
stock represents good value relative to market multiples, as they do at current prices. Since becoming a
public company in 2001, we repurchased more than 2.7 million shares of our common stock. On February
28, 2008, our Board of Directors authorized a new 1.5 million stock repurchase program, to commence
upon the completion of our prior stock repurchase authorization.
Thank you for your continued support of Cross Country Healthcare.
Emil HenselChief Financial Officer
March 2008


UNITED STATES SECURITIES AND EXCHANGE COMMISSION
Washington, D.C. 20549 —————— FORM 10-K
ANNUAL REPORT PURSUANT TO SECTION 13 OR 15(d) OF THE SECURITIES EXCHANGE ACT OF 1934 For the Fiscal Year Ended December 31, 2007
or TRANSITION REPORT PURSUANT TO SECTION 13 OR 15(d) OF THE SECURITIES EXCHANGE ACT OF 1934
For the transition period from __________ to __________ Commission file number 0-33169
Cross Country Healthcare, Inc.
(Exact name of registrant as specified in its charter)
Delaware (State or other jurisdiction of incorporation or organization)
13-4066229 (I.R.S. Employer Identification No.)
6551 Park of Commerce Boulevard, N.W. Boca Raton, Florida 33487
(Address of principal executive offices, zip code)
Registrant’s telephone number, including area code: (561) 998-2232
Securities registered pursuant to Section 12(b) of the Act:
Title of each class Common Stock, par value $0.0001 per share
Name of each exchange on which registered The NASDAQ Stock Market
Securities registered pursuant to Section 12(g) of the act: None
Indicate by check mark if the Registrant is a well-known seasoned issuer, as defined in Rule 405 of the Securities Act. Yes No Indicate by check mark if the Registrant is not required to file reports pursuant to Section 13 or Section 15(d) of the Act. Yes No Indicate by check mark whether the Registrant: (1) has filed all reports required to be filed by Section 13 or 15(d) of the Securities
Exchange Act of 1934 during the preceding 12 months (or for such shorter period that the Registrant was required to file such reports), and (2) has been subject to such filing requirements for the past 90 days. Yes No
Indicate by check mark if disclosure of delinquent filers pursuant to Item 405 of Regulation S-K (§ 229.405 of this chapter) is not contained herein, and will not be contained, to the best of Registrant’s knowledge, in definitive proxy or information statements incorporated by reference in Part III of this Form 10-K or any amendment to this Form 10-K.
Indicate by check mark whether the Registrant is a large accelerated filer, an accelerated filer, a non-accelerated filer, or a smaller reporting company. See the definitions of “large accelerated filer,” “accelerated filer” and “smaller reporting company” in Rule 12b-2 of the Exchange Act: Large accelerated filer Accelerated filer Non-accelerated filer Smaller reporting company
Indicate by check mark whether the Registrant is a shell company (as defined by Rule 12b-2 of the Act). Yes No The aggregate market value of the voting stock held by non-affiliates of the Registrant, based on the closing price of Common Stock on
June 30, 2007 of $16.68 as reported on the NASDAQ National Market, was $467,430,012. This calculation does not reflect a determination that persons are affiliated for any other purpose.
As of February 29, 2008, 31,012,571 shares of Common Stock, $0.0001 par value per share, were outstanding. DOCUMENTS INCORPORATED BY REFERENCE
Portions of the Registrant’s definitive proxy statement, for the 2008 Annual Meeting of Stockholders, which statement will be filed pursuant to Regulation 14A not later than 120 days after the end of the fiscal year covered by this Report, are incorporated by reference into Part III hereof.
TABLE OF CONTENTS
Page
PART I
Item 1. Business. .............................................................................................................................................................. 1 Item 1A. Risk Factors. ........................................................................................................................................................ 15 Item 1B. Unresolved Staff Comments. ............................................................................................................................... 20 Item 2. Properties. ............................................................................................................................................................ 20 Item 3. Legal Proceedings. .............................................................................................................................................. 20 Item 4. Submission of Matters to a Vote of Security Holders. ........................................................................................ 20
PART II
Item 5. Market for Registrant’s Common Equity, Related Stockholder Matters and Issuer Purchases of Equity Securities. ....................................................................................................... 21
Item 6. Selected Financial Data. ...................................................................................................................................... 24 Item 7. Management’s Discussion and Analysis of Financial Condition and
Results of Operations. ............................................................................................................................... 26 Item 7A. Quantitative and Qualitative Disclosures about Market Risk. ............................................................................. 42 Item 8. Financial Statements and Supplementary Data. ................................................................................................... 42 Item 9. Changes in and Disagreements with Accountants on Accounting and
Financial Disclosure. ................................................................................................................................. 42 Item 9A. Controls and Procedures. ..................................................................................................................................... 42 Item 9B. Other Information. ............................................................................................................................................... 42
PART III
Item 10. Directors, Executive Officers and Corporate Governance. .................................................................................. 44 Item 11. Executive Compensation. .................................................................................................................................... 44 Item 12. Security Ownership of Certain Beneficial Owners and Management and
Related Stockholders Matters. ................................................................................................................... 44 Item 13. Certain Relationships and Related Transactions, and Director Independence. .................................................... 44 Item 14. Principal Accountant Fees and Services. ............................................................................................................. 44
PART IV
Item 15. Exhibits, Financial Statement Schedules. ............................................................................................................ 45
SIGNATURES ..................................................................................................................................................................... 46
All references to “we,” “us,” “our,” or “Cross Country” in this Report on Form 10-K means Cross Country Healthcare, Inc., its subsidiaries and affiliates.

Forward-Looking Statements
In addition to historical information, this Annual Report on Form 10-K contains forward-looking statements. Words such as “anticipates,” “expects,” “intends,” “plans,” “believes,” “seeks,” “estimates,” “will” and variations of such words and similar expressions are intended to identify such forward-looking statements. Such forward-looking statements involve known and unknown risks, uncertainties and other important factors that could cause our actual results, performance or achievements of , or industry results, to differ materially from any future results, performance or achievement implied by such forward-looking statements. Factors that might cause such differences include, but are not limited to, those discussed in the section entitled “Item 1A – Risk Factors.” Readers are cautioned not to place undue reliance on these forward-looking statements, which reflect management’s opinions only as of the date hereof. There can be no assurance that (i) we have correctly measured or identified all of the factors affecting its business or the extent of their likely impact, (ii) the publicly available information with respect to these factors on which such analysis is based is complete or accurate, (iii) such analysis is correct or (iv) the such strategy, which is based in part on this analysis, will be successful. We undertake no obligation to revise or publicly release the results of any revision to these forward-looking statements. Readers should carefully review the “Risk Factors” section contained in other documents we file from time to time with the Securities and Exchange Commission, including the Quarterly Reports on Form 10-Q to be filed by us in fiscal year 2008.
PART I Item 1. Business.
Overview of Our Company
We are a leading provider of nurse and allied staffing services in the United States, a global provider of clinical trials services to pharmaceutical and biotechnology customers, as well as a provider of other human capital management services focused on healthcare. We have a national client base of approximately 4,000 contracts with hospitals, pharmaceutical and biotechnology companies, and other healthcare organizations.
Our nurse and allied staffing business segment represented 80% of our 2007 revenue and is comprised of travel and per diem nurse staffing and travel allied health staffing. Travel nurse staffing is our largest business and it represented approximately 68% of our total revenue. Our clinical trials services business segment represented 13% of our 2007 revenue and consists of service offerings that include traditional staffing, as well as clinical trials management, drug safety monitoring and regulatory services to pharmaceutical and biotechnology customers. Our other human capital management services business segment represented approximately 7% of our 2007 revenue and consists of education and training as well as retained search services related to physicians and healthcare executives.
In our nurse and allied staffing business, we believe we are well-positioned to take advantage of long-term industry and demographic dynamics. These dynamics include an aging U.S. population expected to result in greater demand for in-patient hospital services; a growing shortage and aging of registered nurses (RNs); state and federal legislation establishing minimum nurse staffing levels and maximum allowable overtime; and a long-term trend among acute care hospitals to utilize supplemental nurse staffing services to provide flexibility and a variable cost structure to meet their overall staffing requirements. In our clinical trials services business segment, we believe we are well-positioned to provide our customers with a high degree of flexibility and cost-effective solutions through a combination of service offerings and clinical capabilities to assist them in advancing their products through the clinical and regulatory processes.
On July 18, 2007, we acquired the shares of privately-held Assent Consulting (Assent) for $19.6 million in cash. This transaction also includes an earn-out provision up to a maximum of $4.9 million based on 2007 and 2008 performance criteria. Headquartered in Cupertino, California, Assent primarily provides highly qualified clinical research, biostatistics and drug safety professionals nationwide to companies in the pharmaceutical and biotechnology industries. On June 6, 2007, we acquired all of the shares of privately-held AKOS Limited (AKOS) for up to $14.0 million, consisting of an up-front payment and potential earn-out payments in 2007 and 2008, based on performance in these years. AKOS, conducting business since 1986, is a provider of drug safety, regulatory and clinical trial services to pharmaceutical and biotechnology companies in Europe, the United States, Canada and Asia. AKOS is based approximately 30 miles north of London, England and strategically located inside what is considered to be the UK’s research triangle that extends outward from London to Cambridge and Oxford Universities. We financed these transactions using our revolving credit facility.
In 2007, we reevaluated our reporting segments in conjunction with our recent acquisitions of clinical trials services businesses. As a result, we disaggregated clinical trials services from nurse and allied staffing, both formerly included in the healthcare staffing segment. The new reporting segment for clinical trials services includes our ClinForce business,
2
Metropolitan Research, AKOS, and Assent. All prior period data reported in this Report has been reclassified to conform to the current period presentation.
For the year ended December 31, 2007, our revenue was $718.3 million and our net income was $24.6 million, or $0.76 per diluted share. During 2007, we generated $36.0 million in cash flow from operations. At year-end we had total debt of $39.5 million and $9.1 million of cash on the balance sheet, resulting in a net debt to total capitalization ratio of 7% as of December 31, 2007.
Nurse and Allied Health Staffing
We are a leading provider of travel nurse staffing services in the U.S. and also a provider of travel allied staffing and per diem nurse staffing services. We market our nurse and allied staffing services primarily to acute care hospitals, providing these clients with travel and per diem staffing solutions through our Cross Country Staffing and MedStaff brands. We provide credentialed RNs for travel and per diem staffing assignments at public and private healthcare facilities, and at for-profit and not-for-profit facilities located throughout the U.S. The vast majority of our assignments are at acute care hospitals, including teaching institutions and trauma centers located in major metropolitan areas. We also provide other healthcare professionals in a wide range of specialties that include operating room technicians and other allied health professionals, such as rehabilitation therapists, radiology technicians and respiratory therapists to acute care hospitals as well as to customers in non-acute care settings such as skilled nursing facilities, nursing homes and sports medicine clinics, and, to a lesser degree, in non-clinical settings, such as schools. Fees are paid directly by our clients and in certain cases, by third-party administrative payers. As a result, we have no direct exposure to any third-party reimbursements including, Medicare or Medicaid reimbursements.
Our Cross Country Staffing and MedStaff brands’ travel staffing businesses are certified by The Joint Commission under its Health Care Staffing Services Certification Program. The Joint Commission certification program offers an independent, comprehensive evaluation of a staffing agency’s ability to provide quality staffing services. We believe this certification program, which is subject to annual review, is an important quality initiative in our industry.
Our centralized travel staffing services are provided to hospital clients on a national basis from our headquarters in Boca Raton, Florida, as well as secondary offices in Malden, Massachusetts, Tampa, Florida and Newtown Square, Pennsylvania. Our per diem staffing services are provided through a network of branch offices serving certain major metropolitan markets. We also provide nurse staffing services to military hospitals and clinics.
Sales and Marketing
Cross Country Staffing is our largest brand and markets its staffing services to hospitals and healthcare facilities throughout the U.S., as well as operates differentiated recruiting brands to recruit RNs and allied healthcare professionals on a domestic and international basis. As a part of its business strategy, Cross Country Staffing is pursuing and implementing exclusive vendor managed and preferred provider relationships with hospital clients. In doing so, Cross Country Staffing provides clients with a suite of solutions to facilitate the efficient management of their temporary workforce. These range from efficiency-enhancing technology to vendor management solutions.
MedStaff markets both its travel nurse staffing and per diem staffing services to public and private hospitals and healthcare facilities across the United States. It primarily focuses on high levels of customized service to its clientele on a national basis and in those local markets where it maintains branch offices. Through its HealthStaffers affiliate, MedStaff markets its services to government and military treatment facilities.
Recruiting and Retention
We operate differentiated nurse recruiting brands including Cross Country TravCorps, MedStaff, NovaPro, Cross Country Local and Assignment America to recruit nurses and allied healthcare professionals on a domestic and international basis. We believe these professionals are attracted to us because we offer a wide range of diverse assignments at attractive locations, competitive compensation and benefit packages, as well as high levels of customer service.
In 2007, thousands of healthcare professionals applied with us through our recruitment brands. Historically, more than half of our field employees have been referred to us by other healthcare professionals. We also advertise in trade publications and on the Internet, which has become an increasingly important medium. We maintain a number of websites to allow potential applicants, for example, to obtain information about our recruitment brands and assignment opportunities as well as apply online.
3
Our recruiters are an important component of our travel staffing business, responsible for establishing and maintaining key relationships with candidates for the duration of their employment with our Company. Our recruiters work with candidates throughout their initial placement process as well as on subsequent assignments. We believe our strong retention rate is a direct result of these relationships. Recruiters match the supply of qualified candidates in our databases with the demand in terms of positions from our hospital clients. At year-end 2007, we had 153 recruiters in our travel staffing business.
We also have internal educational and training capabilities through Cross Country University, a division of Cross Country Staffing, that we believe gives us a competitive advantage by enhancing both the quality of our working nurses and the effectiveness of our recruitment efforts. Cross Country University offers our RNs and other healthcare professionals additional training, professional development and assistance in completing continuing education for state licensing requirements.
Our recruiters utilize our computerized databases of positions to match assignment opportunities with the experience, skills and geographic preferences of their candidates. Once an assignment is selected, our account managers review the candidate’s application package before submitting it to the hospital client for review. Account managers are knowledgeable about the specific requirements and operating environment of the hospitals that they service. In addition, our databases of open positions are kept updated by our account managers.
Contracts with Field Employees and Hospital Clients
Each of our traveling field employees works for us under a contract. Travel assignments are typically 13-weeks in duration. Our traveling field employees that are on payroll contracts are hourly employees whose contract specifies the hourly rate they will be paid and any other benefits they are entitled to receive during the contract period. For payroll contract employees, we bill clients at an hourly rate and assume all employer costs, including payroll, withholding taxes, benefits, professional liability insurance and Occupational Safety and Health Administration (OSHA) requirements, as well as any travel and housing arrangements.
Operations
We operate our travel nurse staffing business from a relatively centralized business model servicing all of the assignment needs of our field employees and client facilities through operation centers located in Boca Raton, Florida; Malden, Massachusetts; Tampa, Florida and Newtown Square, Pennsylvania. These centers perform key support activities such as coordinating assignment accommodations, payroll processing, benefits administration, billing and collections, contract processing, customer service and risk management. Our per diem staffing services are provided through a network of 16 branch offices serving major metropolitan markets predominantly located on the east and west coasts of the U.S.
Hours worked by field employees are recorded by our operations system, which then transmits the data directly to Automatic Data Processing, Inc. for payroll processing. Client billings are generated using time and attendance data captured by our payroll system. Our payroll department also provides customer support services for field employees.
During 2007, we had an average of approximately 2,800 apartments open under lease throughout the U.S. Our housing staff typically secures leases and arranges for furniture rental and utilities for field employees at their assignment locations. Apartment leases are typically three months in duration to match the assignment length of our field employees. Beyond the initial term, leases can generally be extended on a month-to-month basis. We typically provide accommodations at no cost to the healthcare professional on assignment with us based on our respective recruitment brand’s practices. We believe that our economies of scale help us secure competitive pricing and favorable lease terms.
Overview of the Nurse and Allied Staffing Industry
Industry Dynamics
Demographics are the primary long-term driver of growth opportunities in our core nurse and allied staffing business. Over the coming decades, demand for healthcare services is expected to increase due to an aging U.S. population while the national supply of RNs also ages and is projected to decline.
• The U.S. population nearly doubled between 1950 and 2000 to 282 million people, and is projected to exceed 420 million people in 2050 according to a Congressional Research Service report in March 2007. Similarly, accounting for population growth and aging, the number of people age 65 and older increased to 35 million in 2000 and is expected to approach 87 million in 2050. Population aging and higher per capita spending for older people contribute to growth in national healthcare spending. Healthcare spending is higher for older people than younger people and is 4 times higher
4
for hospital services compared to those under 65. The U.S. Centers for Disease Control and Prevention reports that currently 80% of people 65 and older have at least one chronic condition, such as diabetes, arthritis or cancer. Life expectancy for Americans is nearly 78 years, the highest in U.S. history, according to government statistics for 2005. Hospital utilization is significantly higher among older people. In 2005, the U.S. Department of Health and Human Services reported that people over the age of 65 comprised 38 percent of all inpatients.
• The 55-to-64 age group is expected to increase to 40 million by 2014. One-half of people in this age group – which includes the oldest baby boomers – have high blood pressure, and two in five are obese. In general, they are in worse medical condition than Americans born a decade earlier were when they were in this age group.
• Healthcare spending in the U.S. increased 6.7% in 2006 to $2.1 trillion from $2.0 trillion in 2005, according to the latest Centers for Medicare and Medicaid Services (CMS) data. Spending on hospital services accounted for 31% of the total and continued to be the leading component while growing approximately 7% to $648 billion. However, the CMS data noted that the rate of growth in hospital spending has slowed due to slower growth in utilization, especially inpatient care.
Along with an expanding and aging population that is anticipated to increasingly require hospital services, is an aging population of working RNs and a nurse education system constrained by an aging faculty and a lack of teaching facilities. Hospitals and other healthcare facilities utilize outsourced nurse staffing as a means to supplement their own recruitment and retention efforts, and in the process gain flexibility and a variable cost structure in managing their changing nurse staffing requirements. Similarly, RNs have turned to outsourced nurse staffing for greater job flexibility and better working conditions.
Temporary Nurses
The temporary nurse staffing alternatives available to hospital administrators are travel nurses and per diem nurses. Travel nurse staffing involves placement of RNs on a contract basis typically for a 13 week assignment, although assignments may range from several weeks to one year. Travel assignments usually involve temporary relocation to the geographic area of the assignment. Travel nurses provide hospitals and other healthcare facilities with the flexibility and variable cost to manage changes in their staffing needs due to shifts in demand, represent a pool of potential full-time job candidates, and enable healthcare facilities to provide their patients with a greater degree of continuity of care than per diem nurses. The staffing company generally is responsible for providing travel nurses with customary employment benefits and for coordinating travel and housing arrangements.
Per diem nurse staffing comprises the majority of outsourced temporary nurse staffing and involves the placement of locally-based healthcare professionals on short-term assignments, often for daily shift work, with little advance notice by the hospital client. However, housing and extensive travel are generally not required for this mode of staffing.
Demand Dynamics
Using temporary personnel enables healthcare providers to vary their staffing levels to match changes in demand for their permanent staff caused by both planned and unplanned vacancies, variability in patient admissions, as well as facility expansion and staff training activities. Healthcare providers also use temporary personnel to address budgeted shortfalls due to vacancy rates and to manage seasonal fluctuations in demand for their services, such as population swings in the sun-belt states in the winter months and the Northeast and other geographic areas in the summer months. The use of temporary RNs is no longer a stop-gap measure, but has become a way of life for many hospitals according to a survey by the PricewaterhouseCoopers’ Healthcare Research Institute in which hospital executives reported using temporary nurses for an average of 5% of all nursing hours.
The market for our nurse staffing services is determined by the demand from hospital customers and the available supply of RNs and other healthcare professionals. Demand is a function of hospital admission trends and their level relative to expectations, as well as dynamics of the national labor market and its impact on RN’s spouses (approximately 70% of RNs in the U.S. are married) which influences the number of shifts or hours that full- and part-time RNs are willing to work directly for hospitals at wages hospitals are able to pay. In general, we believe nurses are more willing to seek travel assignments during relatively high levels of demand for contract employment, and conversely, are more reluctant to seek travel assignments during and immediately following periods of weak demand for contract employment. We also believe demand for travel nurse staffing services will be favorably impacted in the long-term by an aging population and an increasing shortage of nurses.
5
In 2005, the national RN vacancy rate was 8.5%; although many hospitals continued to struggle with RN shortages that equated to a need for approximately 118,000 RNs to fill vacant positions nationwide (American Hospital Association, 2006). Independent national surveys conducted in 2004 and 2005 found that a majority of RNs (82%), physicians (81%), hospital CEOs (68%) and chief nursing officers (74%) perceived a nursing shortage in the hospitals where they admitted patients or were employed. Survey respondents also perceived the shortage had negatively impacted various indicators of care delivery processes, hospitals’ capacity to provide services, and RNs’ ability to provide patient care. Looking ahead, the number of unfilled RN positions is expected to increase to 340,000 by 2020 due to a combination of increasing RNs retiring from the workforce over the coming years and the number and composition of new RNs entering the workforce (Health Affairs, January/February 2007).
Aside from the PricewaterhouseCoopers’ Health Research Institute study mentioned above, a separate national tracking study found as many as 75% of hospitals use temporary nurses. In addition, a study by researchers at the University of Pennsylvania’s Center for Health Outcomes and Policy Research (Journal of Nursing Administration, August 2007) reported that hospital use of temporary RNs does not lower quality of care because these nurses are just as qualified – and in many cases more qualified – than permanent staff nurses. The study also found that temporary nurses were more likely than permanent nurses to hold a 4-year baccalaureate or more advanced degrees and more likely to have received their education in the past 10 years when compared to permanent nurses.
The current market for our nurse and allied staffing services reflects hospital admission trends that have been relatively flat since 2003 and, more recently, a softening labor market in such key states for us as California, Florida and Arizona. In 2007, our orders for travel nurses in these three key states, which accounted for approximately 40% of our working travel nurses, declined nearly 40% in aggregate from the prior year while increasing modestly in aggregate in the rest of the country. Nevertheless, in this operating environment we continued to increase the bill-pay spread in our nurse and allied staffing segment, which more than offset lower staffing volume resulting in higher contribution income. Bill rates, as measured by revenue per hour in our travel nurse staffing business, continued to rise in the low single-digit range that we have experienced over the past several years. While there is the potential for the business environment for nurse and allied staffing to weaken if the labor markets soften further, hospital operators appear to have incorporated a lower level of expectations into their nurse staffing plans. We believe that these lower admissions expectations hold a greater potential for an upside surprise, as compared to a downside surprise, and create a more favorable dynamic for us.
The Staffing Industry Report, an independent staffing industry publication, estimates that $11.4 billion in revenue was generated in the total U.S. healthcare staffing market in 2007, an 8% increase from the prior year. It also projects that in 2008 healthcare staffing will increase to $12.3 billion. The U.S. healthcare staffing market includes temporary staffing of travel nurses, per diem nurses, allied health professionals and locum tenens (physicians). We believe that approximately $70 billion is spent annually on RN wages by acute care hospitals and estimate that historically about 8% to 10% of hospital nurse staffing is outsourced. Of that amount, approximately one-fourth to one-third is travel nurse staffing and two-thirds to three-quarters is per diem nurse staffing. However, based on current market dynamics, we believe that outsourced nurse staffing at acute care hospitals remains below the peak historic levels achieved earlier this decade.
Hospital Construction
The United States is in the midst of the largest hospital construction expansion cycle in a half-century, which industry-experts estimate began in 2002. In a recent Healthcare Financial Management Association (HFMA) survey, about three quarters of hospital executives indicated they were anticipating capital investments for renovation of their current facilities in the next two years, citing expansion of current facilities, conversion to offer new services, and planning a satellite campus or clinic as the primary reasons for these projects.
According to HFMA, construction project starts doubled from 2004 to 2006 and are expected to continue at a rapid pace. Some estimates project the construction boom will exceed $60 billion a year by 2010. At the end of 2005, new hospitals and clinics valued at $22 billion were under construction and another $6 billion under renovations. The number of large-scale projects ($100 million or more) increased to 100 from 67 in 2003.
More than a fifth of the value of project starts is in projects in five states with declining population (MI, OH, IL, NY, and PA), while CA and FL account for 13%, far less than their share of population or population growth. In addition, there is collectively $1 billion of construction under way in IL, CA, CO, OH, TX, OR and SC. We believe initial staffing of new and expanded facilities drives greater utilization of contract labor.

6
Supply Dynamics
The number of RNs in the U.S. grew 7.9% between 2000 and 2004 to $2.9 million, according to the most recent information published by the Health Resources and Services Administration (HRSA) in December 2005. Of this total, approximately 2.4 million (83%) are employed in nursing. More recently, as of 2006, approximately 2.2 million RNs work full-time. The largest and most significant employment setting for RNs is hospitals (nearly 60%) where they represent the largest share of hospital employees at 28%.
Foreign-educated RNs also play a role in helping to stem the nursing shortage. Currently nearly 90,000 foreign-educated RNs work in American hospitals, or about 3.7% of the total RN workforce in the U.S., according to a 2007 study by the National Foundation for America Policy. However, entry to the U.S. is often blocked or delayed due to immigration quotas and a lack of appropriate temporary visa categories. The Philippines provides the largest share of foreign-educated RNs to the U.S., followed by India, Canada and South Korea. California employs the most foreign RNs, followed by Florida, New York and Texas.
In 2006, the nursing shortage entered its ninth year, making it the longest shortage in the past fifty years according to a recent study published in Health Affairs (January/February 2007), in which researchers concluded that the shortage is expected to expand to 340,000 unfilled RN positions by 2020 due to an aging population and an even more rapidly aging RN workforce that is approaching retirement age. This study also observed that large numbers of RNs are entering the profession in their late twenties and early thirties, and that the number of people entering nursing in their early to mid-twenties remains at its lowest point in forty years.
The average age of RNs is approximately 47 years, up from age 45 in 2000 and more than four years older than in 1996, according to the 2005 HRSA survey, which also indicated 41% of RNs were 50 or older. In comparison, in 1980 the largest age group of RNs was in their mid-to-late twenties. In 2005, the largest age group comprised RNs in their forties. By 2012, RNs in their fifties will be the largest age group, and by 2020, baby boomer nurses will be in their sixties, although most will have retired from working in an acute care hospital. Putting this into perspective, approximately 478,000 RNs are expected to retire between 2002 and 2012. In fact, 55% of surveyed RNs reported their intention to retire between 2011 and 2020, based on findings from the Nursing Management Aging Workforce Survey published by the Bernard Hodes Group in July 2006. New jobs plus retirements lead to predictions of 1.1 million additional RNs will need to be added to the inventory of RNs between 2002 and 2012 to maintain a steady state, according to an August 2007 study in Health Research and Educational Trust. We believe as RNs age they consider retiring from the workforce or switching to part-time status and they increasingly reduce the number of hours worked directly for hospital employers because of the physical demands of the job in an acute care hospital setting.
Educating Nurses
As a result of more RNs entering the profession in their late twenties and early thirties, RNs today are less likely to obtain their nursing education immediately after high school, as was more common in the past. Instead, people are increasingly entering the nursing profession by graduating from a two-year associate degree program after a substantial period in their early twenties spent in another career or not in the workforce. Additionally, people are entering nursing via “accelerated” bachelor-of-science degree programs designed for those with other (and usually unrelated) bachelor’s degrees.
Qualified applications to diploma, associates degree and bachelor’s degree programs increased by more than 25%, on a combined basis, while approximately 28% of applications were rejected in 2006 (the year for which certain of the most recent figures are available), according to National League for Nursing. Enrollments in entry-level baccalaureate nursing programs increased 5% in 2007, according to preliminary data by the American Association of Colleges of Nursing (AACN), down from 7.6% a year earlier. Baccalaureate program graduates also continued to grow by 7.4%, though at a slower rate than the 18.4% increase in 2006. Colleges and universities rejected approximately 30,700 qualified applications from students seeking four-year bachelor’s degrees in nursing in 2007, according to the AACN. The primary reason for not accepting all qualified students was a shortage of qualified faculty; insufficient clinical placement sites and inadequate classroom space were also contributing factors. According to the AACN (July 2006), a total of 637 faculty vacancies were identified at 329 nursing schools with baccalaureate and/or graduate programs across the country – most were faculty positions requiring a doctoral degree – reflecting a national nurse faculty vacancy rate of 7.9%. For master's degree-prepared nurse faculty, the average ages for professors, associate professors, and assistant professors were 57.8, 54.5 and 50.0 years, respectively.
7
In 2007, the number of domestically trained nurses sitting for the National Council of State Boards of Nursing Licensing Exam (NCLEX), which is required for all new nurses entering the profession in the U.S., increased 8% to 119,600 from the number of RNs who took this exam a year earlier. This represents the seventh consecutive year of growth since the most recent low point in 2001.
Legislative Dynamics
In the context of a worsening nursing shortage and legislative efforts to address minimum hospital patient-to-nurse ratios and the use of mandatory overtime, there is a growing body of research that substantiates concerns raised by consumer groups about the quality of care provided in healthcare facilities and by nursing organizations about the increased workloads and pressures on nurses. Legislation addressing patient-to-nurse ratios and limiting mandatory nurse overtime has already been passed or introduced at federal and state levels. The passage of such legislation is expected to increase the demand for nurses.
• A study published in the Journal of the American Medical Association (JAMA – October 23/30, 2002) researched hospital patient-to-nurse ratios and found that above a 4:1 ratio, the odds of patient mortality within 30 days of admission increased by 7% for every additional patient in the average nurse’s workload in the hospital. It also found an identical outcome among patients who experienced complications (failure-to-rescue). The study concluded that, all else being equal, substantial decreases in mortality rates could result from increasing registered nurse staffing, especially for patients who develop complications.
• A Health Affairs article (January 2006), suggested that approximately 6,700 deaths and 70,400 complications could be avoided each year if U.S. hospitals were to adopt nurse staffing strategies, which in part included increasing the size and skill level of their nursing workforce.
• A comprehensive analysis of several national surveys on the nursing workforce published in Nursing Economic$ (March 2006), found that majority of nurses reported that the RN shortage is negatively impacting patient care and undermining the quality of care goals set by the Institute of Medicine and the National Quality Forum.
• In another article published in Nursing Economic$ (September/October 2005) researchers found that the majority of RNs (79%) and Chief Nursing Officers (68%) believe the nursing shortage is affecting the overall quality of patient care in hospitals and other settings, including long-term care facilities, ambulatory care settings, and student health centers. Most hospital RNs (93%) report major difficulty in having enough time to maintain patient safety, detect complications early, and collaborate with other team members.
Federal Legislation
42 Code of Federal Regulations (42CFR 482.23(b)) requires hospitals certified to participate in Medicare to "have adequate numbers of licensed registered nurses, licensed practical (vocational) nurses, and other personnel to provide nursing care to all patients as needed". Reductions in nursing budgets have resulted in fewer nurses working longer hours, while caring for sicker patients. There are three general approaches to providing sufficient nurse staffing. The first approach is the implementation of nurse staffing plans, with input from practicing nurses, to institute safe nurse to patient ratios that are based on patient need and other criteria. The second approach is legislation or regulations mandating specific nurse to patient ratios. The third approach is a combination of nurse staffing plans and legislated nurse to patient ratios.
Nurse Staffing Plans and Nurse-to-Patient Ratios (pending)
The Quality Nursing Care Act of 2005 (H.R. 1372) and its companion bill in the Senate, S. 71 (titled the RN Safe Staffing Act of 2005), require hospitals to set unit-by-unit nurse staffing levels in coordination with the direct care nursing staff and based on the unique needs of each unit and its patients. The bill holds hospitals accountable for compliance and requires them to make information about staffing levels public. It also protects nurses who speak out about unsafe staffing.
Mandatory Overtime (pending)
In order to protect patient care, S. 351/H.R. 791 would amend title XVIII of the Social Security Act and set limits on the number of mandatory overtime hours RNs could work at Medicare participating hospitals, except in the case of a declared state of emergency. Mandatory overtime limitations would prevent these facilities from requiring a nurse to work in excess of the following: the scheduled work shift or duty period of the nurse; 12 hours during a 24-hour period; or 80 hours in a consecutive 14-day period. The bill also explicitly prohibits providers of services from penalizing, discriminating or retaliating, in any manner, with respect to a nurse who avails themselves of these protections. Voluntary overtime is not affected.
8
State Legislation
Nurse Staffing Plans
Enacted to Date
Passing legislation/regulations to address, waive or modify nurse staffing are CA, FL, IL, ME, NJ, OR, RI, TX, VT and the District of Columbia. NV is not included, although in 2003 legislation passed requiring a subcommittee to conduct an interim study on staffing.
2007
CT, CO, FL, MI, ME, MO, NV, OH and WA introduced legislation which would require hospitals to compile direct care staffing schedules/patterns and methods for determining/adjusting levels with disclosure to the public, as well as other various measures. IL passed the "Patient Acuity Staffing Plan", which provides flexibility for each hospital to meet changing patient care needs linked to nurse staffing with required input of direct care registered nurses.
2005
OR enacted legislation strengthening its patient protection law passed in 2002. RI enacted legislation requiring every licensed hospital to annually submit a core-staffing plan each year.
2002
TX enacted regulations requiring hospitals to adopt, implement and enforce a written staffing plan.
Nurse Staffing Ratios
2007
IL, KY, MI, MO, NY, NJ, WV and the District of Columbia introduced staffing ratio legislation (some carried over from 2006) setting minimum ratios for each type of care unit, requiring use of patient classification/patient acuity system before adjusting the legislated minimum ratios, as well as other provisions such as a float pool, staffing plans with ratios for different types of patient units, and disclosure of the staffing plan.
2006
FL enacted law requiring a registered nurse presence in the operating room during the entire surgical procedure. That same year, FL passed legislation addressing minimum staffing requirements for nursing homes.
1999
Legislation was enacted in CA calling for regulations to be adopted that would define unit specific nurse to patient ratios to be utilized in all California hospitals. The CA legislation became effective January 1, 2004, and approximately a year later, as mandated in the initial legislation, the nurse to patient ratios were reduced even further to required one nurse for every five patients in medical-surgical units, a change from the current ratio of one nurse for every six patients. Currently, a few states now require specific ratios in specialty areas such as intensive care and labor and delivery units, but none require ratios in every patient care unit in every hospital as does CA.
Mandatory Overtime
Due to inadequate RN staffing, employers have used mandatory overtime to staff healthcare facilities. Concern for the long term effects of overtime include impact on the care-givers health as well as the potential for errors or near misses from fatigue and diminished quality of care provided. Research indicates that risks of making an error are significantly increased when work shifts are longer than 12 hours, when nurses work overtime, or when they work more than 40 hours per week.
Federal legislation to prohibit mandatory overtime in the form of The Safe Nursing and Patient Care Act of 2007 (HR 2122), which amends title XVIII of the Social Security Act to provide for patient protection by limiting the number of mandatory overtime hours a nurse may be required to work in certain providers of services to which payments are made under the Medicare Program.
Enacted to Date
CT, IL, ME, MD, MN, NJ, NH, OR, RI, WA, and WV have enacted legislation prohibiting the use of mandatory overtime for nurses, while CA, MO, and TX have provisions in regulations restricting mandating overtime hours.
9
2007
AK, FL, IL, ME, MI, MN, MO, NH, NY, PA, RI, VT, WA, WV and the District of Columbia introduced legislation to prohibit employers from mandating overtime.
Competitive Strengths
• Brand Recognition. We have operated in the travel nurse staffing industry since the 1970s. Our Cross Country Staffing brand is well-recognized among leading hospitals and healthcare facilities and our Cross Country TravCorps and MedStaff brands are well-recognized by RNs and other healthcare professionals. We believe that through our existing relationships with travel nurse staffing clients, we are positioned to effectively market our complementary per diem nurse, allied health and clinical research staffing services. We believe our retained physician search business has one of the highest levels of brand recognition in its industry.
• Strong and Diverse Client Relationships. We provide staffing solutions to a national client base of approximately 4,000 contracts with hospitals, pharmaceutical companies and other healthcare providers. No single client accounted for more than 4% of our revenue. We work with the vast majority of the nation’s top “Honor Roll” hospitals as identified by U.S. News & World Report in its most recently published study.
• Vendor Management Capabilities. Our Cross Country Staffing brand has the ability to provide acute care facilities with comprehensive vendor management services. By leveraging technology and its single-point of contact service model, Cross Country Staffing can manage all job orders, credential verification, candidate testing, invoicing, and management reporting.
• Recruiting and Employee Retention. We are a leader in recruiting and retaining highly qualified healthcare professionals. We recruit healthcare professionals from all 50 states and Canada. We also recruit RNs from certain other English-speaking foreign countries, assist them in obtaining U.S. nursing licenses, sponsor them for U.S. permanent residency visas, and then place them in domestic acute care hospitals. In 2007, thousands of healthcare professionals applied with us through our differentiated recruitment brands. Referrals generated a majority of our new candidates. We believe we offer appealing assignments, competitive compensation packages, attractive housing options and other valuable benefits.
• The Joint Commission Certification. Our Cross Country Staffing and MedStaff brands’ travel staffing businesses are certified by The Joint Commission under its Health Care Staffing Services Certification Program. The Joint Commission certification program offers an independent, comprehensive evaluation of a staffing agency’s ability to provide quality staffing services. We believe this certification program, which is subject to annual review, is a very important quality initiative in our industry. While The Joint Commission program is voluntary for healthcare staffing companies, we believe it will result in differentiation among healthcare staffing providers, and we expect that hospitals will increasingly look for The Joint Commission certification when selecting a nurse staffing company to meet their temporary staffing needs.
• Continuing Education. Cross Country University, the first educational program in the travel nurse industry to be accredited by the American Nurse Credentialing Center, enables us to provide continuing education credits to our RN field employees, as well as provide accredited continuing education to other healthcare professionals.
• Scalable and Efficient Operating Structure. At year-end 2007, the databases for our travel and per diem staffing businesses included more than 200,000 RNs and other healthcare professionals who completed job applications with us. Our size and centralized travel nurse staffing structure provide us with operating efficiencies in key areas such as recruiting, advertising, marketing, training, housing and insurance benefits. Our proprietary information systems enable us to manage our travel nurse staffing operations. Our systems are scalable and designed to accommodate significant future growth.
• Strong Management Team with Extensive Healthcare Staffing and Acquisition Experience. Our management team has played a key role in the growth and development of the travel nurse staffing industry. Our management team, which averages more than 10 years of experience in the healthcare industry, has consistently demonstrated the ability to successfully identify, make and integrate strategic acquisitions.
10
Clinical Trials Services
We provide a flexible range of traditional contract staffing, clinical research outsourcing, drug safety monitoring, and regulatory consulting services to pharmaceutical, biotechnology and medical device companies, as well as contract research organization (CRO) customers. We market these services through our ClinForce brand, as well as through additional brands that we have acquired since August 2006. Together they have allowed us to establish a significant geographic footprint in the U.S. along with an important presence in the European market.
Among the various clinical trials services we provide, traditional contract staffing, project management, and outsourcing account for approximately 70% of segment revenue. The business units that comprise our clinical trials services segment are as follows:
ClinForce is our platform brand that primarily provides clinical research professionals for in-sourced and out-sourced contract assignments and permanent placement services. Customers include pharmaceutical, biotechnology and medical device companies, as well as contract research organization (CROs). We acquired ClinForce in March 2001. It is headquartered in the Research Triangle Park, North Carolina.
Metropolitan Research Associates (Metropolitan Research) provides clinical trials management services consisting of the monitoring and managing of clinical trials as well as providing functional drug safety solutions. Metropolitan Research has extensive experience across a wide range of therapeutic areas – including women’s health, Central Nervous System (CNS), pain management, infectious disease and obesity. Customers include pharmaceutical, biotechnology and medical device companies. We acquired Metropolitan Research in August 2006. It is based in New York City.
AKOS Limited provides drug safety, regulatory and clinical trial services. Customers include pharmaceutical and biotechnology companies in Europe, the U.S., Canada and Asia. We acquired AKOS in June 2007. It is based in Harpenden, Hertfordshire, United Kingdom.
Assent Consulting provides contract staffing services to pharmaceutical and biotechnology customers in the U.S. We acquired Assent in July 2007. It is based in Cupertino and Solana Beach, California.
Recruitment
We recruit qualified candidates for our clinical trials services segment on a national basis in the U.S., as well as internationally for clinical research opportunities, which include both temporary and permanent positions with our clients and within our CRO services businesses. For our contract staffing services businesses, we recruit professionals across numerous clinical research disciplines, including clinical monitors/contract research associates, clinical project managers, site coordinators/contract research coordinators, drug safety personnel, medical monitors, regulatory affairs personnel, medical writers, clinical data professionals, statistical and SAS programmers, and various pre-clinical related professionals. Recruiting for our CRO services businesses consist primarily of clinical monitors, clinical project managers, medical monitors, regulatory affairs personnel, and drug safety associates.
Overview of the Clinical Trials Services Industry
Pharmaceutical and biotechnology companies conduct clinical trials to demonstrate the safety and efficacy of new drug compounds, test drugs that have already been approved to monitor long-term safety and effectiveness, tests for additional labeling claims and proposed new uses of drugs previously approved for commercial sale. New medical devices as well as new procedures and approaches to diagnosing diseases must also undergo clinical testing to prove their merit and safety.
With respect to drugs, a pharmaceutical or biotechnology company must conduct extensive preclinical or laboratory research with potential drug candidates for many years before they can initiate testing in humans. If this stage of testing is successful, data is provided to the appropriate regulatory agency, such as the U.S. Food and Drug Administration (FDA), requesting approval to conduct human testing of the drug.
Clinical trials are conducted by teams of physicians and other clinical and data professionals in university facilities, hospitals and individual doctor’s offices around the world and are designed to determine if the drug is safe and an effective treatment for the disease in question. While the majority of clinical trials has historically been conducted in the U.S and Europe, for several decades research and development (R&D) has been increasing globally. The percentage of R&D sites outside the U.S. has grown from 45% to 66% over the last 30 years, according to a 2006 study by INSEAD and Booz Allen Hamilton entitled, “Innovation: Is Global the Way Forward?”. In addition, 41% of active FDA regulated principal investigators (the lead researcher responsible for a clinical study) were based outside the U.S. in 2006, according to an analysis by the Tufts Center for the Study of Drug Development.
11
There are three phases of human clinical trials and a regulatory process involved in bringing a drug to market.
Phase I: The medicine is tested in a small group of approximately 20 to 100 healthy volunteers, often in a hospital setting, to determine its safety profile, including the safe dose range. These studies also examine how a drug is absorbed, distributed, metabolized and excreted, as well as the duration of its action. Phase I studies can take from six months to one year to complete.
Phase II: Placebo-controlled trials involving approximately 100 to 500 volunteer patients who have the disease being studied. The goal of this phase is to establish the "proof of concept" - i.e., that the medicine effectively treats the disease. Researchers continue to evaluate the drug's safety and look for side effects and determine optimal dose strength and schedule (e.g., once or twice daily). Phase II studies can take from six months to one year to complete.
Phase III: The medicine is tested in large, randomized, placebo-controlled trials with much larger numbers of patient volunteers - from 1,000 to 5,000, in hospitals, clinics and/or physician offices - to generate statistically significant data. Researchers closely monitor patients at regular intervals to confirm that the drug is effective and to identify side effects (also called adverse events). Phase III studies can take from one to four years to complete, depending on the disease, length of the study, and the number of volunteers. While Phase I-III studies are taking place, researchers are also conducting a number of crucial parallel studies, including, among other things, toxicity tests and other long-term safety evaluations.
New Drug Application (NDA): Once all three phases of the clinical trials are complete, all of the data is analyzed. If the findings demonstrate that the experimental medicine is both safe and effective, an NDA is filed with the FDA or similar regulatory agency in other countries. NDAs contain all of the information about all of the studies – including preclinical testing, all clinical trials, dosing information, manufacturing details and proposed labeling for the new medicine.
FDA Review/Approval: In this final stage, the regulatory agency scientists review all the results from all the studies carried out over the years and determine if they show that the medicine is safe and effective enough to be approved. If the medicine is approved, or "cleared for marketing," it becomes available for physicians to prescribe to patients.
Ongoing Studies/Phase IV: Even after approval, the studies and observation continue. A much larger group of patients may begin to use a medicine upon approval compared with the thousands of patients in clinical trials and, in this larger scale usage, rare side effects may occur, so companies must continue to monitor the drug carefully. The FDA requires them to continue to submit periodic reports, including any cases of adverse events (side effects or complications). Sometimes, the FDA requires a company to conduct additional studies, known as Phase IV or "post-marketing" studies, to evaluate long-term safety or generate more data about how the medicine affects a particular group of patients (such as children or the elderly). Phase IV studies can continue for years.
Clinical Research and Development Spending and Outsourcing
According to various estimates, the global pharmaceutical and biotechnology industry’s spending on R&D has grown more than six-fold over the past 25 years, according to the National Science Foundation. Additionally, in 2007, R&D spending is expected to top $90 billion with two-thirds of it focused on testing (Barron’s, November 2007). Pharmaceutical companies have always depended on innovation and R&D for bringing new products to market. However, an increasing trend of outsourcing R&D has developed as the operating environment has grown more and more competitive and the number of challenges in drug development expanded. For over a decade, companies have commonly used outsourcing solutions for clinical research and testing. Traditionally thought of as a short-term strategy, outsourcing is now being used to lever the pharmaceutical industry’s core competencies to maximize productivity. Further, outsourcing is being considered and/or used to effectively manage multiple projects at a given time and, most importantly, to reduce the timeline for drug development, with a long-term view towards cost and resource management.
The global market for contract clinical research services is highly fragmented and comprises CROs of varying size, as well as hundreds of niche service providers and independent consultants. The global R&D outsourcing market is expected to grow from $9.3 billion in 2001 to $36 billion by 2010, representing an average growth rate of 16.3% compared to an expected average growth rate of 9.6% in global R&D expenditures (Reuter’s Business Insight, February 2003).

12
Other Human Capital Management Services
Education and Training Services
Our Cross Country Education (CCE) subsidiary, headquartered in Tennessee, provides continuing education programs to the healthcare industry. CCE offers one-day seminars and e-learning, as well as national and regional conferences on topics relevant to nurses and other healthcare professionals. In 2007, CCE held more than 5,400 seminars and conferences that were attended by more than 170,000 registrants in 221 cities across the U.S. We extend these educational services to our field employees on favorable terms as a recruitment and retention tool.
Retained Search
Our Cejka Search subsidiary, headquartered in Missouri, is a nationally recognized retained search organization that provides physician and executive search services throughout the U.S. exclusively to the healthcare industry, including physician group practices, hospitals and health systems, academic medical centers, managed care, and other healthcare organizations.
Additional Information about Our Business
Systems
Our placement and support operations are enhanced by sophisticated information systems that facilitate smooth interaction between our recruitment and support activities. Our proprietary information systems enable us to manage virtually all aspects of our travel staffing operations. These systems are designed to accommodate significant future growth of our business. In addition, their scalable design allows further capacity to be added to the existing hardware platform. We have proprietary software that handles most facets of our business, including contract pricing and profitability, contract processing, job posting, housing management, billing/payroll and insurance. Our systems provide support to our facility clients and field employees and enable us to efficiently fulfill and renew job assignments. Our systems also provide detailed information on the status and skill set of each registered field employee.
Our financial, management reporting and human resources systems are managed on the PeopleSoft Financial Suite. PeopleSoft is a leading enterprise resource planning software suite that provides modules used to manage our accounts receivable, accounts payable, general ledger and billing. This system is designed to accommodate significant future growth in our business.
Growth Strategy
Our goal is to continue to grow our businesses by:
• Expanding Our Nurse And Allied Staffing Market Share. We strive to increase our market share at the hospitals we currently serve and continue to pursue prospective large users of nurse staffing services. Exclusive vendor managed hospital customers currently represent the majority of our top ten customers nationally. We plan to continue to seek vendor management contracts with large users of temporary nursing services and/or establish exclusive and preferred provider relationships with hospitals and healthcare organizations. We intend to use our existing brand recognition, client relationships and database of nurses who have expressed an interest in flexible-term assignments to expand our per diem services. We also plan to utilize our relationships with existing travel staffing clients to more effectively market our complementary services, including staffing of clinical trials and allied health professionals, retained search, and education and training.
• Enhancing Our Recruitment Efforts to Increase Our Supply of RNs and Other Healthcare Professionals. Our recruitment strategy is focused on:
− Utilizing a multi-brand approach to recruit nurses and other healthcare professionals on a domestic and international basis while segmenting the nurse marketplace with differentiated brand offerings;
− Increasing the number of recruiters and improving the productivity of staff dedicated to the recruitment of new nurses;
− Using the Internet to accelerate the recruitment-to-placement cycle;
− Expanding our advertising presence to reach more nursing professionals; and
− Increasing the number of referrals from existing field employees by providing them with superior service.

13
• Improving Our Market Presence in the Clinical Trials Services Sector. We intend to continue to grow by increasing our geographic presence and expanding the range of services we provide to pharmaceutical and biotech companies.
• Acquiring Complementary Businesses. We continually evaluate opportunities to acquire complementary businesses to strengthen and broaden our market presence.
Competitive Environment – Nurse and Allied Staffing
The nurse staffing industry is highly competitive. While barriers to entry are relatively low, achieving substantial scale is more challenging. Of the market for outsourced nurse staffing services used by hospitals, we believe that approximately one-quarter to one-third is travel nurse staffing and approximately two-thirds to three-quarters is per diem nurse staffing. We compete with a number of nationally and regionally focused travel nurse staffing companies that have the capabilities to relocate nurses. The per diem nurse staffing sector is highly fragmented and comprises numerous temporary nurse staffing agencies that are typically small local providers, as well as providers with regional or national focus. National competitors in nurse staffing include AMN Healthcare Services, Inc., On Assignment, Inc., CompHealth and Medical Staffing Network Holdings, Inc. In addition, the markets for our clinical research staffing, travel allied staffing services and healthcare-oriented human capital management services are highly competitive and fragmented, with limited barriers to entry.
The principal competitive factors in attracting qualified candidates for temporary employment include a large, national pool of desirable assignments, wages and benefits, quality of accommodations, speed of placements, quality of service and recruitment teams, as well as overall reputation. We believe that healthcare professionals seeking temporary employment through us are also pursuing employment through other means, including other temporary staffing firms. Therefore, the ability to respond to candidate inquiries and submit candidates to clients more quickly than our competitors are important factors in our ability to fill assignments. We focus on retaining field employees by providing long-term benefits, such as 401(k) plans and bonuses. Although we believe that the relative size of our database and economies of scale derived from the size of our operations make us an attractive employer for nurses seeking travel opportunities, we expect competition for candidates to continue.
The principal competitive factors in attracting and retaining temporary healthcare staffing clients include the ability to fill client needs, price, quality assurance and screening capabilities, compliance with regulatory requirements, an understanding of the client’s work environment, risk management policies and coverages, and general industry reputation. In addition, the level of demand for outsourced nurse staffing is influenced by in-patient admissions, national healthcare spending on hospital care, general economic conditions and their impact on national, regional and local labor markets, and the corresponding supply of full-time and part-time hospital-based nurses willing to work at prevailing hospital wages.
Competitive Environment – Clinical Trials Services
The global clinical trials services business is both highly competitive and fragmented. Customers are typically large multi-national pharmaceutical companies and smaller drug developers, biotechnology companies and medical device manufacturers, as well as CROs (Contract Research Organizations). Competitors include divisions of publicly-held companies such as Kforce, Inc., inVentiv Health, Inc., and Kelly Services, as well as hundreds of niche service providers and free-lance consultants. We also supply our clinical trials staffing services to, and sometimes compete with, large CROs such as Quintiles, Covance Inc, Pharmaceutical Products Development, Inc. and Kendle International, among others.
We also compete to recruit qualified candidates in the U.S. and internationally for our clinical trials and research opportunities, which include both temporary and permanent positions with our clients and within our CRO services businesses. In total, we recruit a wide range of professionals across numerous clinical research disciplines for our staffing, drug safety, CRO and regulatory services.
Regulatory and Professional Liability
In order to service our client facilities and to comply with OSHA and The Joint Commission standards, we have a risk management program. Among other things, the program is designed to protect against the risk of negligent hiring. Effective October 2004, we implemented for the majority of our working nurses and other healthcare professionals individual occurrence-based professional liability insurance policies with no deductible, which substantially replaced a $2.0 million per-claim layer of self-insured exposure. For our remaining working nurses and other healthcare professionals, we provide primary coverage through insurance policies that contain various self-insured retention layers, which also provides us coverage related to other risks, such as negligent hiring. Separately our MedStaff subsidiary has a claims-made professional liability policy with a limit of $2.0 million per occurrence and $4.0 million in the aggregate and a $25,000 deductible. Subject to certain limitations, we also have up to $5.0 million in umbrella liability insurance coverage after the individual policies.

14
MedStaff’s policy and the $2.0 million primary coverage have been exhausted. While the implementation of the individual policies has substantially reduced our self-insured exposure and is expected to gradually reduce our professional liability expense going forward, the potential exists for other claims to emerge under the old claims-made policies, although the likelihood diminishes over time.
Professional Licensure
Nurses and most other healthcare professionals employed by us are required to be individually licensed or certified under applicable state law. In addition, the healthcare professionals that we staff are frequently required to be certified to provide certain medical care, such as CPR (cardiopulmonary resuscitation) and ACLS (Advanced Cardiac Life Support), depending on the positions in which they are placed. Our comprehensive compliance program is designed to ensure that our employees possess all necessary licenses and certifications, and we endeavor to ensure that our employees, including nurses and therapists, comply with all applicable state laws.
Business Licenses
A number of states require state licensure for businesses that, for a fee, employ and assign personnel, including healthcare personnel, to provide services on-site at hospitals and other healthcare facilities to support or supplement the hospitals’ or healthcare facilities’ workforces. A number of states also require state licensure for businesses that operate placement services for individuals attempting to secure employment. Failure to obtain the necessary licenses can result in injunctions against operating, cease and desist orders, and/or fines. We endeavor to maintain in effect all required state licenses.
Regulations Affecting Our Clients
Many of our clients are reimbursed under the federal Medicare program and state Medicaid programs for the services they provide. In recent years, federal and state governments have made significant changes in these programs that have reduced reimbursement rates. In addition, insurance companies and managed care organizations seek to control costs by requiring that healthcare providers, such as hospitals, discount their services in exchange for exclusive or preferred participation in their benefit plans. Future federal and state legislation or evolving commercial reimbursement trends may further reduce, or change conditions for, our clients’ reimbursement. Such limitations on reimbursement could reduce our clients’ cash flows, hampering their ability to pay us. Pharmaceutical, biotech and medical diagnostic companies are subject to regulations of the FDA in the U.S. and similar regulatory agencies in other countries.
Immigration
Changes in immigration law and procedures following September 11, 2001, have slowed our ability to recruit foreign nurses to meet demand, and changes to such procedures in the future could further hamper our overseas recruiting efforts. In addition, the use of foreign nurses entails greater difficulty in ensuring that each professional has the proper credentials and licensure.
Regulations Applicable to Our Business
Our business is subject to extensive regulation by numerous governmental authorities in the United States and the foreign jurisdictions in which we operate. In the U.S., complex federal and state laws and regulations govern, among other things, the eligibility of our foreign nurses to work in the U.S., the licensure of professionals, the payment of our employees (e.g. wage and hour laws, employment taxes and income tax withholdings, etc.) and the operations of our business generally. We conduct business on a national basis and are subject to the laws and regulations applicable to our business in such states, which may be amended from time to time. Future federal and state legislation or interpretations thereof may require us to change our business practices. Compliance with all of these applicable rules and regulations require a significant amount of resources. We endeavor to be in compliance with all such rules and regulations.
Employees
As of December 31, 2007, we had approximately 1,260 corporate employees and during 2007, we had an average of 5,025 full-time equivalent field employees in our nurse and allied staffing segment. We are not subject to a collective bargaining agreement with any of our employees. We consider our relationship with employees to be good.
Available Information
Financial reports and filings with the Securities and Exchange Commission (SEC), including this Annual Report on Form 10-K, are available free of charge as soon as reasonably practicable after filing such material with, or furnishing it to, the SEC, on or through our Internet website, www.crosscountryhealthcare.com.

15
Item 1A. Risk Factors.
You should carefully consider the following risk factors, as well as the other information contained in this Annual Report on Form 10-K.
We are unable to recruit enough nurses to meet our clients’ demands for our nurse staffing services, limiting the potential growth of our nurse staffing business.
We rely significantly on our ability to attract, develop and retain nurses and other healthcare professionals who possess the skills, experience and, as required, licensure necessary to meet the specified requirements of our healthcare staffing clients. We compete for healthcare staffing personnel with other temporary healthcare staffing companies, as well as actual and potential clients, some of which seek to fill positions with either regular or temporary employees. Currently, there is a shortage of qualified nurses in most areas of the United States and competition for nursing personnel is increasing. Although demand by our clients has slowed, at this time we still do not have enough nurses to meet our clients’ demands for our nurse staffing services. This shortage of nurses limits our ability to grow our nurse staffing business. Furthermore, we believe that the aging of the existing nurse population will further exacerbate the existing nurse shortage.
The costs of attracting and retaining qualified nurses and other healthcare professionals may rise more than we anticipate.
We compete with hospitals and other healthcare staffing companies for qualified nurses and other healthcare professionals. Because there is currently a shortage of qualified healthcare professionals, competition for these employees is intense. To induce healthcare professionals to sign on with them, our competitors may increase hourly wages or other benefits. If we do not raise wages or other benefits in response to such increases by our competitors, we could face difficulties attracting and retaining qualified healthcare professionals. In addition, if we raise wages in response to our competitors’ wage increases and are unable to pass such cost increases on to our clients, our margins could decline.
Our costs of providing housing for nurses and other healthcare professionals may be higher than we anticipate and, as a result, our margins could decline.
At any given time, we have several thousand apartments on lease throughout the U.S. Typically the length of an apartment lease is coterminous with the length of the assignment of the nurse or other healthcare professional. If the costs of renting apartments and furniture for our nurses and other healthcare professionals increase more than we anticipate and we are unable to pass such increases on to our clients, our margins may decline. To the extent the length of a nurse’s housing lease exceeds the term of the nurse’s staffing contract, we bear the risk that we will be obligated to pay rent for housing we do not use. To limit the costs of unutilized housing, we try to secure leases with term lengths that match the term lengths of our staffing contracts, typically 13 weeks. In some housing markets we have had, and believe we will continue to have, difficulty identifying short-term leases. If we cannot identify a sufficient number of appropriate short-term leases in regional markets, or, if for any reason, we are unable to efficiently utilize the apartments we do lease, we may be required to pay rent for unutilized housing, or, to avoid such risk, we may forego otherwise profitable opportunities.
Our clients may terminate or not renew their staffing contracts with us.
Our travel staffing arrangements with hospital clients are generally terminable upon 30 or 90 days’ notice. We may have fixed costs, including housing costs, associated with terminated arrangements that we will be obligated to pay post-termination.
Our clinical trials staffing business is conducted under long-term contracts with individual clients that may perform numerous clinical trials. Some of these long-term contracts are terminable by the clients without cause upon 30 to 60 days’ notice. The delay or loss of a clinical trials services contract could adversely affect our business.
Health systems may develop their own in-house staffing capabilities that may replace their need to outsource staffing to us.
Decreases of in-patient admissions at our clients’ facilities may adversely affect the profitability of our business.
The general level of in-patient admissions at our clients’ facilities significantly affects demand for our temporary healthcare staffing services. When a hospital’s admissions increase, temporary employees are often added before full-time employees are hired. As admissions decrease, clients may reduce their use of temporary employees before undertaking layoffs of their regular employees. We also may experience more competitive pricing pressure during periods of in-patient admissions downturn. In addition, if a trend emerges toward providing healthcare in alternative settings, as opposed to acute care
16
hospitals, in-patient admissions at our clients’ facilities could decline. This reduction in admissions could adversely affect the demand for our services and our profitability.
Any failure by our clinical trials services business to comply with certain policies and procedures and regulations specific to that business could harm our reputation and operating results.
Our clinical trials service business operates in a highly regulated industry. Any failure on our part to comply with the policies and procedures established for a trial or to comply with existing regulations could result in the termination of ongoing research or the disqualification of data for submission to the FDA and other regulatory authorities. This could harm our reputation, our ability to win future business and our operating results. In addition, if the FDA or another similar regulatory body finds a material breach by us of sound clinical practices, it could result in the termination of a clinical trial and that could harm our reputation, our ability to win future business and our operating results.
The nature of our clinical trials services contracts could hurt our operating results.
Some of our contracts are fixed price and, as such, we have limits on the amounts we can charge for our clinical trials services. As a result, the profitability of this business could be negatively impacted due to changes in the timing and progress of large contracts. In addition, we may be responsible for cost overruns on certain contracts unless the scope of work is revised from the original contract terms and we are able to negotiate an amendment with the client shifting the additional cost to the client. If we experience significant cost overruns, it may result in lower gross margins on those projects.
Our clinical trials business exposes us to potential liability for personal injury and wrongful death claims that could affect our reputation and operating results.
Our clinical trials services business is involved in the testing of new drugs and medical devices on volunteer human beings. Due to the risk of personal injury or death to patients participating in clinical trials, we are at risk for being sued in personal injury or wrongful death lawsuits due to possible unforeseen adverse side effects or the improper administration of a drug or device. Many of these patients are already seriously ill. Under our contracts, we are typically indemnified unless the resulting damages were caused by our negligence (e.g. serious adverse event is not reported timely to a sponsor or unblinding of material for a study is not done timely to respond with appropriate information for patient safety reasons). The amount of our liability could materially impact our operating performance and our reputation and our insurance program may not cover such event.
We are dependent on the proper functioning of our information systems.
We are dependent on the proper functioning of our information systems in operating our business. Critical information systems used in daily operations identify and match staffing resources and client assignments and perform billing and accounts receivable functions. Additionally, we rely on our information systems in managing our accounting and financial reporting. Our information systems are protected through a secure hosting facility and additional backup remote processing capabilities also exist in the event our primary systems fail or are not accessible. However, the business is still vulnerable to fire, storm, flood, power loss, telecommunications failures, physical or software break-ins and similar events which may prevent personnel from gaining access to systems necessary to perform their tasks in an automated fashion. In the event that critical information systems fail or are otherwise unavailable, these functions would have to be accomplished manually, which could temporarily impact our ability to identify business opportunities quickly, to maintain billing and clinical records reliably, to bill for services efficiently and to maintain our accounting and financial reporting accurately.
Losses caused by natural disasters, such as hurricanes could cause us to suffer material financial losses.
Catastrophes can be caused by various events, including, but not limited to, hurricanes and other severe weather. The incidence and severity of catastrophes are inherently unpredictable. The extent of losses from a catastrophe is a function of both the total amount of insured exposure and the severity of the event. We are insured for certain catastrophes, there can be no assurance that any such exposure would not exceed the insured amount and, therefore, we could suffer material financial losses as a result of such catastrophes.
If applicable government regulations change, we may face increased costs that reduce our revenue and profitability.
The temporary healthcare staffing industry is regulated in many states. In some states, firms such as our Company must be registered to establish and advertise as a nurse-staffing agency or must qualify for an exemption from registration in those states. If we were to lose any required state licenses, we could be required to cease operating in those states. The introduction of new regulatory provisions could substantially raise the costs associated with hiring temporary employees. For example,

17
some states could impose sales taxes or increase sales tax rates on temporary healthcare staffing services. These increased costs may not be able to be passed on to clients without a decrease in demand for temporary employees. In addition, if government regulations were implemented that limited the amounts we could charge for our services, our profitability could be adversely affected.
We are exposed to increased costs and risks associated with complying with increasing and new regulation of corporate governance and disclosure standards.
We are spending an increased amount of management’s time and resources, since the inception of the Sarbanes-Oxley Act of 2002, to comply with changing laws, regulations and standards relating to corporate governance and public disclosures. The compliance requires management’s annual review and evaluation of our internal control systems, and attestations of the effectiveness of these systems by our independent auditors. This process has required us to hire additional personnel and outside advisory services and has resulted in additional accounting and legal expenses. We may encounter problems or delays in completing the review and evaluation, the implementation of improvements and the receipt of a positive attestation by our independent auditors. If we are not able to timely comply with the requirements set forth in Section 404 of the Sarbanes-Oxley Act of 2002, we might be subject to sanctions or investigation by regulatory authorities. Any such action could adversely affect our business and financial results.
Future changes in reimbursement trends could hamper our clients’ ability to pay us.
While in most cases our fees are paid directly by our clients rather than by governmental or third-party payers, many of our clients are reimbursed under the federal Medicare program and state Medicaid programs for the services they provide. In recent years, federal and state governments have made significant changes in these programs that have reduced reimbursement rates. In addition, insurance companies and managed care organizations seek to control costs by requiring that healthcare providers, such as hospitals, discount their services in exchange for exclusive or preferred participation in their benefit plans. Future federal and state legislation or evolving commercial reimbursement trends may further reduce, or change conditions for, our clients’ reimbursement. Limitations on reimbursement could reduce our clients’ cash flows, hampering their ability to pay us.
Competition for acquisition opportunities may restrict our future growth by limiting our ability to make acquisitions at reasonable valuations.
Our business strategy includes increasing our market share and presence in the temporary nurse and allied staffing industry, clinical trials services industry and other human capital management services through strategic acquisitions of companies that complement or enhance our business. We have historically faced competition for acquisitions. In the future, this could limit our ability to grow by acquisition or could raise the prices of acquisitions and make them less accretive to our earnings. In addition, restrictive covenants in our credit facility, including a covenant that requires us to obtain lender’s approval for any acquisition over $25.0 million, or any acquisition that would put us over $125.0 million in aggregate payments during the term of the agreement, may limit our ability to complete desirable acquisitions. If we are unable to secure necessary financing under our credit facility or otherwise, we may be unable to complete desirable acquisitions.
We may face difficulties integrating our acquisitions into our operations and our acquisitions may be unsuccessful, involve significant cash expenditures or expose us to unforeseen liabilities.
We continually evaluate opportunities to acquire healthcare staffing companies and other human capital management services companies that would complement or enhance our business and at times have preliminary acquisition discussions with some of these companies.
These acquisitions involve numerous risks, including:
• potential loss of key employees or clients of acquired companies;
• difficulties integrating acquired personnel and distinct cultures into our business;
• difficulties integrating acquired companies into our operating, financial planning and financial reporting systems;
• diversion of management attention from existing operations; and
• assumption of liabilities and exposure to unforeseen liabilities of acquired companies, including liabilities for their failure to comply with healthcare and tax regulations.
18
These acquisitions may also involve significant cash expenditures, debt incurrence and integration expenses that could have a material adverse effect on our financial condition and results of operations. Any acquisition may ultimately have a negative impact on our business and financial condition.
We operate our business in a regulated industry and modifications, inaccurate interpretations or violations of any applicable statutory or regulatory requirements may result in material costs or penalties to our Company and could reduce our revenue and earnings per share.
Our industry is subject to many complex federal and state laws and regulations related to, among other things, the eligibility of our foreign nurses to work in the U.S., the licensure of professionals, the payment of our field employees (e.g., wage and hour laws, employment taxes and income tax withholdings, etc.) and the operations of our business generally. If we do not comply with the laws and regulations that are applicable to our business (both domestic and foreign), we could incur civil and/or criminal penalties or be subject to equitable remedies.
Significant legal actions could subject us to substantial uninsured liabilities.
In recent years, healthcare providers have become subject to an increasing number of legal actions alleging malpractice, negligent hiring, product liability or related legal theories. We may be subject to liability in such cases even if the contribution to the alleged injury was minimal. Many of these actions involve large claims and significant defense costs. In addition, we may be subject to claims related to torts or crimes committed by our employees or temporary staffing personnel. In most instances, we are required to indemnify clients against some or all of these risks. A failure of any of our employees or personnel to observe our policies and guidelines intended to reduce these risks; relevant client policies and guidelines or applicable federal, state or local laws, rules and regulations could result in negative publicity, payment of fines or other damages.
A key component of our business is the credentialing process. Ultimately, any hospital or other health care provider is responsible for its own internal credentialing process, and the provider typically makes the hiring decision for travel assignments. Nevertheless, in many situations, the provider will be relying upon the reputation and screening process of our Company. Errors in this process or failure to detect a poor or incorrect history could have a material effect on our reputation. In addition, we may not have access to all of the resources that are available to hospitals to check credentials.
To protect ourselves from the cost of these types of claims, we maintain professional malpractice liability insurance and general liability insurance coverage in amounts and with deductibles that we believe are appropriate for our operations. Our coverage is, in part, self-insured. However, our insurance coverage may not cover all claims against us or continue to be available to us at a reasonable cost. If we are unable to maintain adequate insurance coverage, we may be exposed to substantial liabilities.
If our insurance costs increase significantly, these incremental costs could negatively affect our financial results.
The costs related to obtaining and maintaining professional and general liability insurance and health insurance for healthcare providers has been increasing. If the cost of carrying this insurance continues to increase significantly, we will recognize an associated increase in costs, which may negatively affect our margins. This could have an adverse impact on our financial condition.
If we become subject to material liabilities under our self-insurance programs, our financial results may be adversely affected.
We provide workers compensation coverage through a program that is partially self-insured. In addition, we provide medical coverage to our employees through a partially self-insured preferred provider organization. A portion of our medical malpractice coverage is also through a partially self-insured program. If we become subject to substantial uninsured workers compensation, medical coverage or medical malpractice liabilities, our financial results may be adversely affected.
We are subject to litigation, which could result in substantial judgment or settlement costs.
We are party to various litigation claims and legal proceedings. We evaluate these litigation claims and legal proceedings to assess the likelihood of unfavorable outcomes and to estimate, if possible, the amount of potential losses. Based on these assessments and estimates, if any, we establish reserves and/or disclose the relevant litigation claims or legal proceedings, as appropriate. These assessments and estimates are based on the information available to management at the time and involve a significant amount of management judgment. While we do have certain business insurance, it may not be sufficient to cover our need. We caution you that actual outcomes or losses may differ materially from those estimated by our current

19
assessments. New or adverse developments in existing litigation claims or legal proceedings involving our Company could also require us to establish or increase litigation reserves or enter into unfavorable settlements or satisfy judgments for monetary damages for amounts in excess of current reserves, which could adversely affect our financial results for future periods.
Until the sale by certain selling stockholders of a significant portion of their remaining shares, those selling stockholders will be able to substantially influence the outcome of all matters submitted to our stockholders for approval, regardless of the preferences of other stockholders.
Charterhouse Equity Partners III (CEP III) and CHEF Nominees Limited (CHEF) own approximately [8%] of our outstanding common stock and continue to have two designees serving on our Board of Directors (which is currently comprised of seven members). Accordingly, they will be able to substantially influence:
• the election of directors;
• management and policies; and
• the outcome of any corporate transaction or other matter submitted to our stockholders for approval, including mergers, consolidations and the sale of all or substantially all of our assets.
Under our stockholders’ agreement, the CEP Investors had the right to designate two directors for nomination to our Board of Directors. This number decreased (i) to one director when CEP reduced its ownership pursuant to a Secondary Offering in November 2006 by more than 50% of their holdings prior to our initial public offering and (ii) the number will decrease to zero upon a reduction of ownership by more than 90% of their holdings prior to our initial public offering. Their interests may conflict with the interests of the other holders of our common stock.
A registration statement under the Securities Act covering resale of CEP III’s stock is presently in effect and sales of this stock could cause our stock price to decline.
The Company presently maintains an effective shelf registration under the Securities Act covering the resale of stock held by CEP III. These shares represent approximately 8% of our outstanding common stock and sales of the stock could cause our stock price to decline.
In addition, we registered 4,398,001 shares of common stock for issuance under our 1999 stock option plans and 1,500,000 shares of common stock for our 2007 Stock Incentive Plan. Options to purchase 2,186,696 shares of common stock were issued and outstanding as of February 29, 2008, of which, options to purchase 2,162,560 shares were vested. In addition, 164,500 shares of stock appreciation rights were issued and outstanding as of February 29, 2008, none of which were vested. Shares of restricted stock outstanding as of February 29, 2008, were 92,775, none of which were vested. Common stock issued upon exercise of stock options, stock appreciation rights and restricted stock, under our benefit plans, is eligible for resale in the public market without restriction.
We cannot predict what effect, if any, market sales of shares held by any stockholder or the availability of these shares for future sale will have on the market price of our common stock.
If provisions in our corporate documents and Delaware law delay or prevent a change in control of our Company, we may be unable to consummate a transaction that our stockholders consider favorable.
Our certificate of incorporation and by-laws may discourage, delay or prevent a merger or acquisition involving us that our stockholders may consider favorable. For example, our certificate of incorporation authorizes our Board of Directors to issue up to 10,000,000 shares of “blank check” preferred stock. Without stockholder approval, the Board of Directors has the authority to attach special rights, including voting and dividend rights, to this preferred stock. With these rights, preferred stockholders could make it more difficult for a third party to acquire us. Delaware law may also discourage, delay or prevent someone from acquiring or merging with us.
Terrorist attacks or armed conflict could adversely affect our normal business activity and results of operations.
In the aftermath of the terrorist attacks on September 11, 2001, we experienced a temporary interruption of normal business activity. Similar events in the future or armed conflicts involving the United States could result in additional temporary or longer-term interruptions of our normal business activity and our results of operations. Future terrorist attacks could also result in reduced willingness of nurses to travel to staffing assignments by airplane or otherwise.

20
Item 1B. Unresolved Staff Comments.
None.
Item 2. Properties.
We do not own any real property. Our principal leases as of December 31, 2007 are listed below.
Location Function Square
Feet Lease Expiration Boca Raton, Florida Headquarters and nurse and allied staffing
administration 70,406 May 1, 2018
Durham, North Carolina Clinical trials staffing headquarters 34,635 September 30, 2013Newtown Square, Pennsylvania Nurse and allied staffing administration and
general office use 31,959 July 30, 2013
Malden, Massachusetts Nurse and allied staffing administration and general office use
31,662 June 30, 2009
Creve Coeur, Missouri Retained search headquarters 27,051 June 14, 2017 New York, New York Clinical trials staffing office 16,915 May 30, 2010 Tampa, Florida Nurse and allied staffing administration and
general office use 15,698 February 15, 2015
Brentwood, Tennessee Education training corporate office 14,157 August 31, 2014 Item 3. Legal Proceedings.
Maureen Petray and Carina Higareda v. MedStaff, Inc.
On February 18, 2005, the Company’s MedStaff subsidiary became the subject of a purported class action lawsuit (Maureen Petray and Carina Higareda v. MedStaff, Inc.) filed in the Superior Court of California in Riverside County. The lawsuit relates only to MedStaff corporate employees. The claims alleged under this lawsuit are generally similar in nature to those brought by Darrelyn Renee Henry in a lawsuit against our Company (Darrelyn Renee Henry vs. MedStaff, Inc., et.al.), which was dismissed on July 5, 2007.
The lawsuit alleges, among other things, violations of certain sections of the California Labor Code, the California Business and Professions Code, and recovery of unpaid wages and penalties. MedStaff currently has less than 50 corporate employees in California. The Plaintiffs, Maureen Petray and Carina Higareda, purport to sue on behalf of themselves and all others similarly situated, allege that MedStaff failed, under California law, to provide meal periods and rest breaks and pay for those missed meal periods and rest breaks; failed to compensate the employees for all hours worked; failed to compensate the employees for working overtime; and failed to keep appropriate records to keep track of time worked. Plaintiffs seek, among other things, an order enjoining MedStaff from engaging in the practices challenged in the complaint; for full restitution of all monies MedStaff allegedly failed to pay Plaintiffs and their purported class; for interest; for certain penalties provided for by the California Labor Code; and for attorneys’ fees and costs. On February 5, 2007, the court granted class certification. The Company is unable to determine its potential exposure, if any, and intends to vigorously defend this matter.
The Company is also subject to other legal proceedings and claims that arise in the ordinary course of its business. In the opinion of management, the outcome of these other matters will not have a significant effect on the Company’s consolidated financial position or results of operations.
Item 4. Submission of Matters to a Vote of Security Holders.
There were no matters submitted to a vote of security holders during the fourth quarter of 2007.
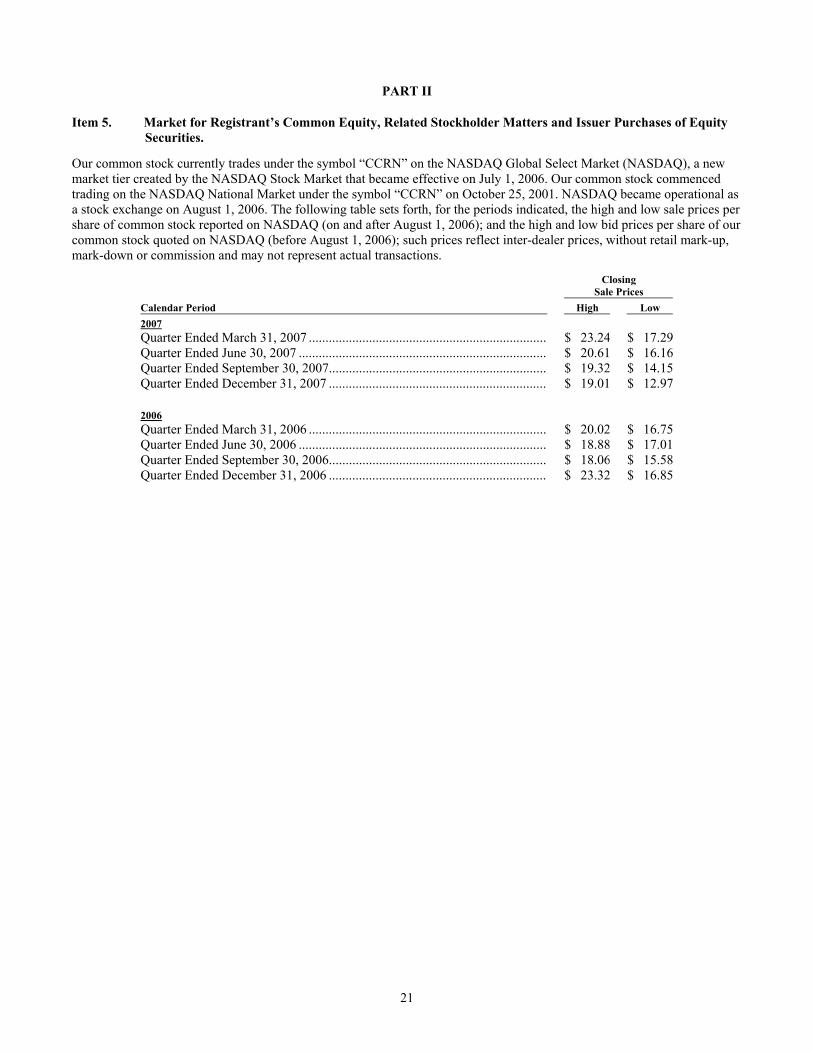
21
PART II
Item 5. Market for Registrant’s Common Equity, Related Stockholder Matters and Issuer Purchases of Equity Securities.
Our common stock currently trades under the symbol “CCRN” on the NASDAQ Global Select Market (NASDAQ), a new market tier created by the NASDAQ Stock Market that became effective on July 1, 2006. Our common stock commenced trading on the NASDAQ National Market under the symbol “CCRN” on October 25, 2001. NASDAQ became operational as a stock exchange on August 1, 2006. The following table sets forth, for the periods indicated, the high and low sale prices per share of common stock reported on NASDAQ (on and after August 1, 2006); and the high and low bid prices per share of our common stock quoted on NASDAQ (before August 1, 2006); such prices reflect inter-dealer prices, without retail mark-up, mark-down or commission and may not represent actual transactions.
Closing
Sale Prices Calendar Period High Low 2007 Quarter Ended March 31, 2007 ....................................................................... $ 23.24 $ 17.29Quarter Ended June 30, 2007 .......................................................................... $ 20.61 $ 16.16Quarter Ended September 30, 2007................................................................. $ 19.32 $ 14.15Quarter Ended December 31, 2007 ................................................................. $ 19.01 $ 12.97 2006 Quarter Ended March 31, 2006 ....................................................................... $ 20.02 $ 16.75Quarter Ended June 30, 2006 .......................................................................... $ 18.88 $ 17.01Quarter Ended September 30, 2006................................................................. $ 18.06 $ 15.58Quarter Ended December 31, 2006 ................................................................. $ 23.32 $ 16.85

22
The graph below matches Cross Country Healthcare, Inc.'s cumulative 5-year total shareholder return on common stock with the cumulative total returns of the NASDAQ Composite index and the Dow Jones US Health Care Providers index. The graph tracks the performance of a $100 investment in our common stock and in each of the indexes (with the reinvestment of all dividends) from December 31, 2002 to December 31, 2007.
COMPARISON OF 5 YEAR CUMULATIVE TOTAL RETURN*
Among Cross Country Healthcare, Inc., The NASDAQ Composite Index And The Dow Jones US Health Care Providers Index
$0
$50
$100
$150
$200
$250
$300
12 / 0 2 3 / 0 3 6 / 0 3 9 / 0 3 12 / 0 3 3 / 0 4 6 / 0 4 9 / 0 4 12 / 0 4 3 / 0 5 6 / 0 5 9 / 0 5 12 / 0 5 3 / 0 6 6 / 0 6 9 / 0 6 12 / 0 6 3 / 0 7 6 / 0 7 9 / 0 7 12 / 0 7
Cross Country Healthcare, Inc. NASDAQ Composite Dow Jones US Health Care Providers
* $100 invested on 12/31/02 in stock or index-including reinvestment of dividends. Fiscal year ending December 31.
12/02 3/03 6/03 9/03 12/03 3/04 6/04 9/04 12/04 3/05 Cross Country Healthcare, Inc. 100.00 82.44 94.34 100.36 107.38 119.43 130.11 111.11 129.61 120.14 NASDAQ Composite 100.00 99.35 120.21 133.69 149.75 150.16 154.24 144.26 164.64 151.53 Dow Jones US Health Care Providers 100.00 102.84 110.53 114.77 131.93 141.62 143.20 142.67 172.64 192.58
6/05 9/05 12/05 3/06 6/06 9/06 12/06 3/07 6/07 9/07 12/07
121.86 133.05 127.81 138.78 130.39 121.86 156.42 130.68 119.57 125.23 102.08 155.46 164.16 168.60 179.97 167.47 174.65 187.83 188.40 201.89 210.35 205.22 211.24 220.19 232.29 228.58 207.50 222.61 228.64 239.82 247.47 251.07 272.53
The stock price performance included in this graph is not necessarily indicative of future stock price performance.
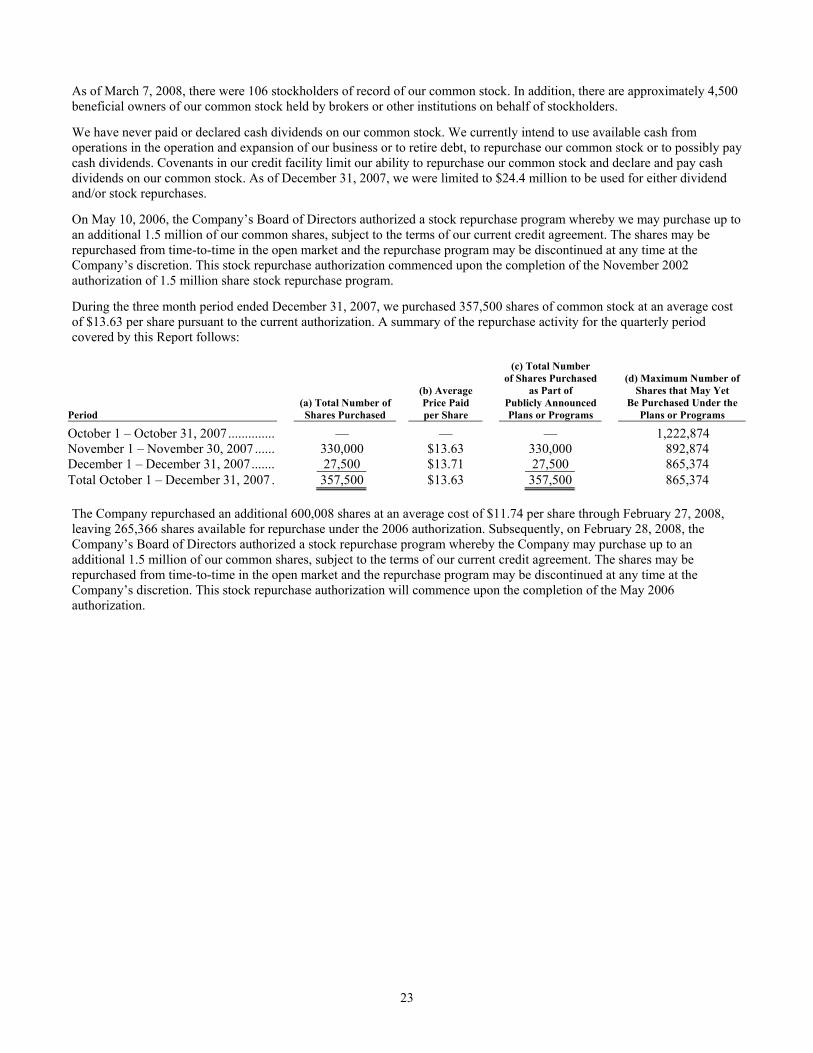
23
As of March 7, 2008, there were 106 stockholders of record of our common stock. In addition, there are approximately 4,500 beneficial owners of our common stock held by brokers or other institutions on behalf of stockholders.
We have never paid or declared cash dividends on our common stock. We currently intend to use available cash from operations in the operation and expansion of our business or to retire debt, to repurchase our common stock or to possibly pay cash dividends. Covenants in our credit facility limit our ability to repurchase our common stock and declare and pay cash dividends on our common stock. As of December 31, 2007, we were limited to $24.4 million to be used for either dividend and/or stock repurchases.
On May 10, 2006, the Company’s Board of Directors authorized a stock repurchase program whereby we may purchase up to an additional 1.5 million of our common shares, subject to the terms of our current credit agreement. The shares may be repurchased from time-to-time in the open market and the repurchase program may be discontinued at any time at the Company’s discretion. This stock repurchase authorization commenced upon the completion of the November 2002 authorization of 1.5 million share stock repurchase program.
During the three month period ended December 31, 2007, we purchased 357,500 shares of common stock at an average cost of $13.63 per share pursuant to the current authorization. A summary of the repurchase activity for the quarterly period covered by this Report follows:
Period (a) Total Number ofShares Purchased
(b) Average Price Paid per Share
(c) Total Number of Shares Purchased
as Part of Publicly Announced Plans or Programs
(d) Maximum Number of Shares that May Yet
Be Purchased Under the Plans or Programs
October 1 – October 31, 2007.............. — — — 1,222,874 November 1 – November 30, 2007 ...... 330,000 $13.63 330,000 892,874 December 1 – December 31, 2007....... 27,500 $13.71 27,500 865,374 Total October 1 – December 31, 2007 . 357,500 $13.63 357,500 865,374 The Company repurchased an additional 600,008 shares at an average cost of $11.74 per share through February 27, 2008, leaving 265,366 shares available for repurchase under the 2006 authorization. Subsequently, on February 28, 2008, the Company’s Board of Directors authorized a stock repurchase program whereby the Company may purchase up to an additional 1.5 million of our common shares, subject to the terms of our current credit agreement. The shares may be repurchased from time-to-time in the open market and the repurchase program may be discontinued at any time at the Company’s discretion. This stock repurchase authorization will commence upon the completion of the May 2006 authorization.
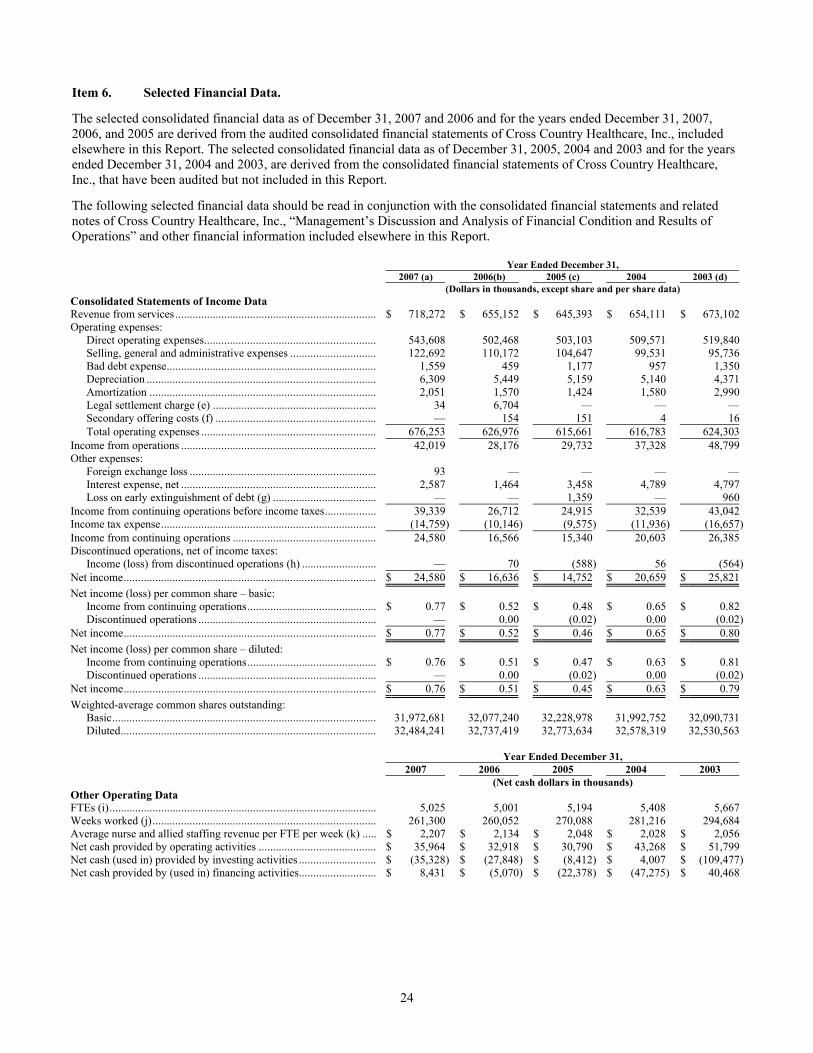
24
Item 6. Selected Financial Data.
The selected consolidated financial data as of December 31, 2007 and 2006 and for the years ended December 31, 2007, 2006, and 2005 are derived from the audited consolidated financial statements of Cross Country Healthcare, Inc., included elsewhere in this Report. The selected consolidated financial data as of December 31, 2005, 2004 and 2003 and for the years ended December 31, 2004 and 2003, are derived from the consolidated financial statements of Cross Country Healthcare, Inc., that have been audited but not included in this Report.
The following selected financial data should be read in conjunction with the consolidated financial statements and related notes of Cross Country Healthcare, Inc., “Management’s Discussion and Analysis of Financial Condition and Results of Operations” and other financial information included elsewhere in this Report.
Year Ended December 31, 2007 (a) 2006(b) 2005 (c) 2004 2003 (d) (Dollars in thousands, except share and per share data)
Consolidated Statements of Income Data Revenue from services ...................................................................... $ 718,272 $ 655,152 $ 645,393 $ 654,111 $ 673,102Operating expenses:
Direct operating expenses............................................................ 543,608 502,468 503,103 509,571 519,840Selling, general and administrative expenses .............................. 122,692 110,172 104,647 99,531 95,736Bad debt expense......................................................................... 1,559 459 1,177 957 1,350Depreciation ................................................................................ 6,309 5,449 5,159 5,140 4,371Amortization ............................................................................... 2,051 1,570 1,424 1,580 2,990Legal settlement charge (e) ......................................................... 34 6,704 — — —Secondary offering costs (f) ........................................................ — 154 151 4 16Total operating expenses ............................................................. 676,253 626,976 615,661 616,783 624,303
Income from operations .................................................................... 42,019 28,176 29,732 37,328 48,799Other expenses:
Foreign exchange loss ................................................................. 93 — — — —Interest expense, net .................................................................... 2,587 1,464 3,458 4,789 4,797Loss on early extinguishment of debt (g) .................................... — — 1,359 — 960
Income from continuing operations before income taxes.................. 39,339 26,712 24,915 32,539 43,042Income tax expense........................................................................... (14,759) (10,146) (9,575) (11,936) (16,657)Income from continuing operations .................................................. 24,580 16,566 15,340 20,603 26,385Discontinued operations, net of income taxes:
Income (loss) from discontinued operations (h) .......................... — 70 (588) 56 (564)Net income........................................................................................ $ 24,580 $ 16,636 $ 14,752 $ 20,659 $ 25,821Net income (loss) per common share – basic:
Income from continuing operations............................................. $ 0.77 $ 0.52 $ 0.48 $ 0.65 $ 0.82Discontinued operations .............................................................. — 0.00 (0.02) 0.00 (0.02)
Net income........................................................................................ $ 0.77 $ 0.52 $ 0.46 $ 0.65 $ 0.80Net income (loss) per common share – diluted:
Income from continuing operations............................................. $ 0.76 $ 0.51 $ 0.47 $ 0.63 $ 0.81Discontinued operations .............................................................. — 0.00 (0.02) 0.00 (0.02)
Net income........................................................................................ $ 0.76 $ 0.51 $ 0.45 $ 0.63 $ 0.79Weighted-average common shares outstanding:
Basic............................................................................................ 31,972,681 32,077,240 32,228,978 31,992,752 32,090,731Diluted......................................................................................... 32,484,241 32,737,419 32,773,634 32,578,319 32,530,563
Year Ended December 31, 2007 2006 2005 2004 2003 (Net cash dollars in thousands)
Other Operating Data FTEs (i)............................................................................................. 5,025 5,001 5,194 5,408 5,667Weeks worked (j).............................................................................. 261,300 260,052 270,088 281,216 294,684Average nurse and allied staffing revenue per FTE per week (k) ..... $ 2,207 $ 2,134 $ 2,048 $ 2,028 $ 2,056Net cash provided by operating activities ......................................... $ 35,964 $ 32,918 $ 30,790 $ 43,268 $ 51,799Net cash (used in) provided by investing activities ........................... $ (35,328) $ (27,848) $ (8,412) $ 4,007 $ (109,477)Net cash provided by (used in) financing activities........................... $ 8,431 $ (5,070) $ (22,378) $ (47,275) $ 40,468

25
Year Ended December 31, 2007 2006 2005 2004 2003 (Dollars in thousands) Consolidated Balance Sheet Data Working capital (l) ........................................................................... $ 98,730 $ 85,208 $ 72,810 $ 71,929 $ 79,532Cash and cash equivalents ................................................................ $ 9,067 $ — $ — $ — $ —Total assets (l) .................................................................................. $ 535,308 $ 500,926 $ 483,601 $ 455,995 $ 474,724Total debt.......................................................................................... $ 39,451 $ 21,529 $ 25,429 $ 42,274 $ 93,738Stockholders’ equity ......................................................................... $ 390,437 $ 374,856 $ 359,286 $ 346,374 $ 320,523———————
(a) Our 2007 results include results from the acquisitions of AKOS Limited (AKOS) and Assent Consulting (Assent) from their acquisition dates of June 6, 2007 and July 18, 2007, respectively. Refer to further discussion in our notes to the consolidated financial statements (Note 4 – Acquisitions).
(b) Our 2006 results include the results from the acquisition of substantially all of the assets of Metropolitan Research Associates, LLC and Metropolitan Research Staffing Associates, LLC (collectively “Metropolitan Research”) from August 31, 2006, the date of acquisition. Refer to further discussion in our notes to the consolidated financial statements (Note 4-Acquisitions).
(c) During the second quarter of 2005, we increased our reserve for professional liability insurance by $5.3 million, pretax, based on an independent actuarial calculation which reflected unfavorable developments relating to certain professional liability cases.
(d) Includes results of operations of MedStaff from June 5, 2003, the date of acquisition. (e) During the third quarter of 2006, we reached an agreement in principle to settle the wage and hour class action lawsuit,
Cossack, et.al. v. Cross Country TravCorps and Cross Country Nurses, Inc. On March 5, 2007, a final settlement of the matter was approved by the court. During 2006, the Company accrued a pre-tax charge of $6.7 million ($4.2 million after taxes), representing the final settlement amount, which was paid in 2007.
(f) Secondary offering costs include registration statement filings and public offering expenses incurred as a result of our secondary offerings in September 2006, April 2005, and March 2002. We did not register any shares of our common stock pursuant to these registration statements. Accordingly, we did not receive any proceeds from these offerings and, did not capitalize any of the associated costs. Refer to discussion in our notes to the consolidated financial statements (Note 12 – Stockholders’ Equity).
(g) Loss on early extinguishment of debt in the year ended December 31, 2005, relates to the write-off of debt issuance costs associated with the prior credit facility, which was refinanced in the fourth quarter of 2005. Loss on early extinguishment of debt in the year ended December 31, 2003, relates to the write-off of debt issuance costs associated with the early termination of a prior amended credit facility as a result of our refinancing in connection with the MedStaff acquisition.
(h) Income (loss) from discontinued operations reflects the operating results of Cross Country Consulting, Inc. and E-Staff, Inc. (E-Staff) for the year ended December 31, 2003. Cross Country Consulting, Inc. results are included in the years ended December 31, 2006, 2005, 2004 and 2003. In March 2002, we committed to a formal plan to dispose of E-Staff. E-Staff ceased operations in the first quarter of 2003. These amounts also include: 1) a $3.7 million pretax ($0.7 million after tax) gain recognized in the year ending December 31, 2004 relating to the sale of assets of our Jennings Ryan & Kolb and Gill/Balsano Consulting businesses to a third party; and 2) impairment charges relating to our valuation of discontinued net assets of $0.8 million in the year ended December 31, 2004. The remaining consulting practice was shut down in the third quarter of 2005 and, as a result, the shut-down costs were allocated to the impairment charge related to that business.
(i) FTEs represent the average number of nurse and allied contract staffing personnel on a full-time equivalent basis. Clinical trials services are not included in this statistic.
(j) Weeks worked is calculated by multiplying the FTEs by the number of weeks during the respective period. Clinical trials services are not included in this statistic.
(k) Average nurse and allied staffing revenue per FTE per week is calculated by dividing the nurse and allied staffing revenue by the number of weeks worked in the respective periods. Nurse and allied staffing revenue includes revenue from permanent placement of nurses. Clinical trials services are not included in this statistic.
(l) The Company has classified its consolidated balance sheets for the years ended December 31, 2007 through 2003, in accordance with the provisions of Emerging Issues Task Force (EITF) 03-08, Accounting for Claims-Made Insurance and Retroactive Insurance Contracts, as explained in the notes to the consolidated financial statements (Note 2 - Summary of Significant Accounting Policies). The Company has presented the current and non-current portions of its workers’ compensation and professional liability accounts as of December 31, 2007 and has reclassified its balance sheet as of December 31, 2006 to conform to the current presentation. Periods prior to December 31, 2006 have not been reclassified due to the excessive cost of applying the methodology, which, the Company believes outweighs the benefit of the additional information.
26
Item 7. Management’s Discussion and Analysis of Financial Condition and Results of Operations.
The following discussion and analysis of our financial condition and results of operations should be read in conjunction with Selected Financial Data, Risk Factors, Forward-Looking Statements and our Consolidated Financial Statements and the accompanying notes and other data, all of which appear elsewhere in this Annual Report on Form 10-K.
Certain prior year information has been reclassified to conform to the current year’s presentation.
Overview
We are a leading provider of nurse and allied staffing services in the United States, a provider of clinical trials services to global pharmaceutical and biotechnology customers, as well as a provider of other human capital management services focused on healthcare. Our nurse and allied staffing business segment represented approximately 80% of our 2007 revenue and is comprised of travel and per diem nurse staffing and travel allied health staffing. Travel nurse staffing, our core business, represented approximately 68% of our total revenue and 85% of our nurse and allied staffing business segment revenue. Other nurse and allied staffing services include the placement of per diem nurses and allied healthcare professionals, such as radiology technicians, rehabilitation therapists and respiratory therapists. Our clinical trials services business segment represented approximately 13% of our 2007 revenue. Our other human capital management services business segment represented approximately 7% of our 2007 revenue and consists of education and training and retained search services. For the year ended December 31, 2007, our revenue was $718.3 million, and net income was $24.6 million, or $0.76 per diluted share. During 2007, we generated $36.0 million in cash flow from operations and we ended the year with total debt of $39.5 million and $9.1 million of cash, resulting in a ratio of debt, net of cash, to total capitalization of 7.1% as of December 31, 2007.
In general, we evaluate the Company’s financial condition and operating results by revenue, contribution income (see Segment Information), and net income. We also use measurement of our cash flow generation and operating and leverage ratios to help us assess our financial condition. In addition, in our largest business segment, we monitor several key volume and profitability indicators such as number of orders, contract bookings, number of FTEs and price.
Nurse and Allied Staffing
Our nurse and allied staffing revenue and earnings are impacted by the relative supply of nurses and demand for our staffing services at healthcare facilities. We rely significantly on our ability to recruit and retain nurses and other healthcare professionals who possess the skills, experience and, as required, licensure necessary to meet the specified requirements of our clients. Shortages of qualified nurses and other healthcare professionals could limit our ability to fill open orders and grow our revenue and net income. In general, we believe nurses are more willing to seek travel assignments during relatively high levels of demand for contract employment, and conversely, are more reluctant to seek travel assignments during and immediately following periods of weak demand for contract employment. We also believe demand for travel nurse staffing services will be favorably impacted in the long-term by an aging population and an increasing shortage of nurses.
Cross Country Staffing is our core staffing brand that markets its staffing services to hospitals and healthcare facilities throughout the U.S. as well as operates differentiated recruiting brands to recruit registered nurses and allied healthcare professionals on a domestic and international basis. As a part of its business strategy, Cross Country Staffing is pursuing and implementing exclusive and preferred provider relationships with hospital clients and group purchasing organizations. Cross Country Staffing provides clients with a suite of solutions to facilitate the efficient management of their temporary workforce while decreasing overall operating costs. These range from efficiency-enhancing technology to full vendor management solutions.
We operate differentiated nurse recruiting brands including Cross Country TravCorps, MedStaff, NovaPro, Cross Country Local and Assignment America to recruit nurses and allied healthcare professionals on a domestic and international basis. We believe that these professionals are attracted to us because we offer a wide range of diverse assignments at attractive locations, competitive compensation and benefit packages, as well as high levels of customer service.
Typically, as admissions increase for our hospital customers, temporary employees are often added before full-time employees are hired. As admissions decline, clients tend to reduce their use of temporary employees before undertaking layoffs of their staff employees. The current market for our nurse and allied staffing services reflects hospital admission trends that have been flat since 2003 and, more recently, a softening labor market in key states for us such as California, Florida and Arizona. In 2007, our orders for travel nurses in these three key states, which accounted for 40% of our working nurses, declined 38% in aggregate from the prior year while increasing modestly in aggregate in the rest of the country. Nevertheless, in this operating environment we continued to increase the bill-pay spread in our nurse and allied staffing
27
segment, which more than offset lower staffing volume resulting in higher contribution income. Bill rates, as measured by revenue per hour per in our core travel nurse staffing business, continued to rise in the low single-digit range that we have experienced over the past several years. While there is the potential for the business environment for nurse and allied staffing to weaken if the labor markets soften further, hospital operators appear to have incorporated a lower level of expectations into their nurse staffing plans. We believe that these lower admissions expectations hold a greater potential for an upside surprise, as compared to a downside surprise, and create a more favorable dynamic for us.
Clinical Trials Services
We provide a flexible range of traditional contract staffing, clinical research outsourcing, drug safety monitoring, and regulatory consulting services to pharmaceutical, biotechnology and medical device companies, as well as contract research organization (CRO) customers. We market these services through our ClinForce brand, as well as through additional brands that we have acquired since August 2006. Together they have allowed us to establish a significant geographic footprint in the U.S. along with an important presence in the European market.
According to various estimates, the global pharmaceutical and biotechnology industry’s spending on R&D has grown more than six-fold over the past 25 years (Barron’s, November 2007). Additionally, in 2007, R&D spending is expected to top $90 billion with two-thirds of it focused on testing. Pharmaceutical companies have always depended on innovation and R&D for bringing new products to market. However, an increasing trend of outsourcing R&D has developed as the operating environment has grown more and more competitive and the number of challenges in drug development expanded. For over a decade, companies have commonly used outsourcing solutions for clinical research and testing. Traditionally thought of as a short-term strategy, outsourcing is now being used to lever the pharmaceutical industry’s core competencies to maximize productivity. Further, outsourcing is being considered and/or used to effectively manage multiple projects at a given time and, most importantly, to reduce the timeline for drug development, with a long-term view towards cost and resource management.
The global market for contract clinical research services is highly fragmented and comprises CROs of varying size, as well as hundreds of niche service providers and independent consultants. The global R&D outsourcing market is expected to grow from $9.3 billion in 2001 to $36 billion by 2010, representing an average growth rate of 16.3% compared to an expected average growth rate of 9.6% in global R&D expenditures.
Other Human Capital Management Services
Education and Training Services
Our Cross Country Education (CCE) subsidiary, headquartered in Tennessee, provides continuing education programs to the healthcare industry. CCE offers one-day seminars and e-learning, as well as national and regional conferences on topics relevant to nurses and other healthcare professionals. In 2007, CCE held more than 5,400 seminars and conferences that were attended by more than 170,000 registrants in 221 cities across the U.S. We extend these educational services to our field employees on favorable terms as a recruitment and retention tool.
Retained Search
Our Cejka Search subsidiary, headquartered in Missouri, is a nationally recognized retained search organization that provides physician and executive search services throughout the U.S. exclusively to the healthcare industry, including physician group practices, hospitals and health systems, academic medical centers, managed care, and other healthcare organizations.
History
In July 1999, an affiliate of Charterhouse Group, Inc (Charterhouse) and certain members of management acquired the assets of Cross Country Staffing, our predecessor, from W. R. Grace & Co. Upon the closing of this transaction, we changed from a partnership to a C corporation form of ownership. In December 1999, we acquired TravCorps Corporation (TravCorps), which was owned by investment funds managed by Morgan Stanley Private Equity (Morgan Stanley) and certain members of TravCorps’ management and subsequently changed our name to Cross Country TravCorps, Inc. Subsequent acquisitions and dispositions were made as discussed below. In 2001, we changed our name to Cross Country, Inc., and in October 2001, we completed our initial public offering. Subsequently, in May 2003, we changed our name to Cross Country Healthcare, Inc.

28
In March 2002, and November 2004, Charterhouse and Morgan Stanley sold a portion of their ownership through secondary offerings. Subsequently, in 2005, Morgan Stanley completed the sale of its investment in the Company. During 2006, Charterhouse sold a majority of its remaining ownership in Cross Country Healthcare but still owns approximately 2.5 million shares as of December 31, 2007.
Revenue
Our travel and per diem nurse staffing revenue is received primarily from acute care hospitals. Revenue from allied staffing services is received from numerous sources, including providers of radiation, rehabilitation and respiratory services at hospitals, nursing homes, sports medicine clinics and schools. Our clinical trials services revenue is received primarily from companies in the pharmaceutical, biotechnology and medical device industries, as well as from contract research organizations and acute care hospitals conducting clinical research trials. Revenue from our retained search and our education and training services is received from numerous sources, including hospitals, physician group practices, insurance companies and individual healthcare professionals. Our fees are paid directly by our clients and, in certain cases, by third-party administrative payers. As a result, we have no direct exposure to Medicare or Medicaid reimbursements.
Revenue is recognized when services are rendered. Accordingly, accounts receivable includes an accrual for employees’ time worked but not yet invoiced. Similarly, accrued compensation includes an accrual for employees’ time worked but not yet paid. Each of our field employees on travel assignment works for us under a contract. The contract period is typically 13 weeks. Payroll contract employees are hourly employees whose contract specifies the hourly rate they will be paid, and any other benefits they are entitled to receive during the contract period. For payroll contract employees, we bill clients at an hourly rate and assume all employer costs, including payroll, withholding taxes, benefits, professional liability insurance and Occupational Safety and Health Administration, or OSHA, requirements, as well as any travel and housing arrangements.
We have also entered into certain contracts with acute care facilities to provide comprehensive vendor management services. Under these contract arrangements, we use our nurses primarily, along with those of third party subcontractors, to fulfill customer orders. If a subcontractor is used, revenue is recorded at the time of billing, net of any related subcontractor liability. The resulting net revenue represents the administrative fee charged by us for our vendor management services.
Management fees are included in some of our clinical research contracts that cover the life of a project. These fees are recognized on a straight-line basis for the specific length of the project.
Acquisitions
Assent Consulting
On July 18, 2007, we completed an acquisition of the shares of privately-held Assent Consulting (Assent) for $19.6 million in cash paid at closing, including $1.0 million which was held in escrow to cover any post-closing liabilities. The purchase price was subject to a working capital adjustment that was settled with a payment of $0.5 million to us in the fourth quarter of 2007. This transaction also includes an earnout provision up to a maximum of $4.9 million based on 2007 and 2008 performance criteria. We financed this acquisition using our revolving credit facility.
Headquartered in Cupertino, California, Assent provides staffing services primarily consisting of highly qualified clinical research, biostatistics and drug safety professionals to companies in the pharmaceutical and biotechnology industries. We believe this acquisition expands our geographical presence on the West Coast of the U.S. and broadens our client base for our clinical trials services business.
The acquisition has been accounted for using the purchase method and it is included in the clinical trials services business segment. The results of Assent operations have been included in the consolidated statements of income since the date of acquisition, in accordance with Financial Accounting Standard Board (FASB) Statement No. 141, Business Combinations.
Based on an independent third-party appraisal, we assigned the following values to intangible assets: $5.2 million for customer relations with a useful life of 10 years, $0.5 million to database with a useful life of 6 years, $0.4 million to a noncompete agreement with a useful life of 5 years, and $0.3 million to trademarks with a useful life of 1.5 years. The excess of purchase price over the fair value of net tangible and intangible assets acquired is recorded as goodwill, which is expected to be deductible for tax purposes.
29
AKOS Limited
On June 6, 2007, we acquired all of the shares of privately-held AKOS Limited (AKOS), based in the United Kingdom, for a total purchase price of up to £7.2 million, consisting of an up-front payment of £4.0 million and potential earnout payments up to £3.2 million in 2007 and 2008. The share purchase agreement also specified an estimated additional payment of £0.5 million, paid at closing, consisting of cash purchased, along with a post-closing net working capital adjustment. An additional amount of £0.2 million was paid in the third quarter of 2007, based on changes in net working capital, as defined by the share purchase agreement.
The consideration for this acquisition was approximately $8.9 million in cash paid at closing, which included $1.0 million for the additional payment and $0.8 million which is being held in escrow to cover any post-closing liabilities. The post-closing working capital adjustment equated to approximately $0.4 million. We financed this transaction using our revolving credit facility.
The potential earnout payments are based on 2007 and 2008 performance, as defined by the share purchase agreement, and will be recorded in U.S. dollars using the exchange rate at the time of the payment. This contingent consideration is not related to the sellers’ employment. In the first quarter of 2008, we paid ₤1.1 million (approximately $2.1 million) related to the 2007 performance. This payment and any additional earnout payment will be allocated to goodwill as additional purchase price, in accordance with FASB Statement No. 141.
AKOS has been conducting business since 1986 and provides drug safety, regulatory and clinical trial services to pharmaceutical and biotechnology companies in Europe, the United States, Canada and Asia. AKOS is based approximately 30 miles north of London, England, and strategically located inside what is considered to be the United Kingdom’s research triangle that extends outward from London to Cambridge and Oxford Universities. We believe, with the addition of AKOS, we will provide a more global and comprehensive range of contract staffing and outsourcing services to pharmaceutical and biotech customers.
The acquisition has been accounted for using the purchase method and is included in the clinical trials services business segment. The results of AKOS’ operations have been included in the consolidated statements of income since the date of acquisition, in accordance with FASB Statement No. 141.
Based on an independent third-party appraisal, we assigned $1.7 million to trademarks with an indefinite life and not subject to amortization. In addition, we assigned $2.6 million to total other identifiable intangible assets as follows: $2.2 million was assigned to customer relations with a useful life of 8.6 years, and $0.4 million was assigned to other intangibles with an estimated useful life of 6 years. The excess of purchase price over the fair value of net tangible and intangible assets acquired was recorded as goodwill, which is not deductible for tax purposes.
Metropolitan Research
On August 31, 2006, we acquired substantially all of the assets of privately-held Metropolitan Research Associates, LLC and Metropolitan Research Staffing Associates, LLC (collectively “Metropolitan Research”) for a purchase price of $18.6 million. The consideration for this acquisition was approximately $16.1 million in cash paid at closing, of which $1.0 million is being held in escrow to cover any post-closing liabilities. The remaining approximate $2.5 million of the purchase price was held back at closing for potential milestone payments, as defined by the asset purchase agreement, and was paid as the milestones were reached throughout the fourth quarter of 2006. These payments were allocated to goodwill as additional purchase price at December 31, 2006. We financed this transaction using our revolving credit facility. In addition, the asset purchase agreement provided for a potential earnout payment of up to a maximum of $6.4 million based on 2006 and 2007 performance, as defined by the asset purchase agreement. This contingent consideration was not related to the sellers’ employment. We expect to pay out $6.4 million, pursuant to the earnout provision; this amount will be allocated to goodwill as additional purchase price.
Based in New York City, Metropolitan Research provides clinical trials staffing, drug safety monitoring and contract research services to the pharmaceutical, biotech and medical device industries while providing its healthcare professional candidates with temporary or permanent clinical staffing career opportunities. The acquisition has been included in the clinical trials services segment and the results of its operations are included in our consolidated statements of income since the date of acquisition, in accordance with FASB Statement No. 141.
Goodwill of $4.9 million, trademarks of $1.7 million and other identifiable intangible assets of $5.5 million were recorded at the time of the acquisition based on an independent, third-party appraisal. During 2007, a post-closing adjustment of approximately $0.5 million, which included a net working capital adjustment, was calculated and allocated to goodwill.
30
The following table provides certain information relating to our acquisitions to date:
Acquired Business Acquisition
Date Primary Services Purchase Price (a)
Potential Earnout
Earnout Earned
Assent Consulting July 2007 Clinical trials staffing of clinical research, biostatistics and drug safety professionals
$19.1 million $4.9 million (b)
AKOS Limited June 2007 Clinical trials staffing, drug safety and regulatory services providing services to the U.S., Europe, Canada, and Asia
$9.2 million (£4.7 million)
£3.2 million based on 2007 and 2008
£1.1 million for 2007
Metropolitan Research August 2006 Clinical trials staffing, drug safety monitoring and contract research services
$19.1 million $6.4 million based on 2006 and 2007
$6.4 million based on 2006 and 2007
Med-Staff June 2003 Healthcare staffing – travel, per diem nurse, and military nurse staffing
$102.2 million $37.5 million for full year 2003
—
Jennings Ryan & Kolb, Inc. (Sold in 2004)
March 2002 Healthcare management consulting services
$2.1 million $1.8 million over 34 months
$1.8 million
NovaPro January 2002 Nurse staffing $7.6 million — — Gill/Balsano Consulting, LLC (Sold in 2004)
May 2001 Healthcare management consulting services
$1.8 million
$2.0 million over 3 years
$2.0 million
ClinForce, Inc. March 2001 Clinical trials staffing $32.8 million — — Heritage Professional Education, LLC December 2000 Continuing education for
healthcare professionals $6.6 million
$6.5 million over 3 years
$3.5 million
E-Staff (Discontinued in 2002)
July 2000 Internet subscription based communication, scheduling, credentialing and training services
$1.5 million
$3.8 million over 3 years
$0.5 million
TravCorps Corporation December 1999 Healthcare staffing – nurse and allied professionals, retained search
$77.1 million — —
———————
(a) Acquisition purchase price includes cash paid, the assumption of debt and post-closing adjustments. The TravCorps acquisition price represents the approximate value of our common stock that was exchanged for all the outstanding shares of TravCorps – $32.1 million, plus the assumption of $45.0 million of debt.
(b) Earnout for 2007 results has not been finalized at the time of this filing.
Discontinued Operations
Discontinued operations during the years ended December 31, 2006 and 2005 include results from operations of the healthcare consulting business previously classified in our other human capital management services business segment. On October 4, 2004, Cross Country Healthcare sold assets of its Jennings Ryan & Kolb and Gill/Balsano Consulting practices to Mitretek Systems, Inc. and recognized a gain on sale of $3.7 million ($0.7 million after taxes). The remaining consulting practice was held for sale until the third quarter of 2005. During the third quarter of 2005, we abandoned our efforts to sell the remaining consulting practice and shut down the residual operations. We continued to account for the consulting practice as discontinued operations within the consolidated statements of income and cash flows and in the notes to the consolidated financial statements included in this Form 10-K. We estimated the remaining costs associated with the shut down of the business and recorded these costs in loss from discontinued operations in the third quarter of 2005. In accordance with FASB Statement No. 144, any adjustments to these estimated amounts have been recorded to discontinued operations in subsequent periods.
Goodwill and Other Identifiable Intangible Assets
Goodwill and other identifiable intangible assets from the acquisition of the assets of our predecessor, Cross Country Staffing, a partnership, as well as from subsequent acquisitions were $326.1 million and $35.1 million, respectively, net of accumulated amortization, at December 31, 2007. In accordance with FASB Statement No. 142, goodwill and certain other identifiable intangible assets are not subject to amortization; instead, we review impairment annually. See Critical Accounting Principles and Estimates for further discussion. Other identifiable intangible assets, which are subject to amortization, are being amortized using the straight-line method over their estimated useful lives ranging from 1.5 to 25 years. Goodwill and other intangible assets represented 93% of our stockholders’ equity as of December 31, 2007.
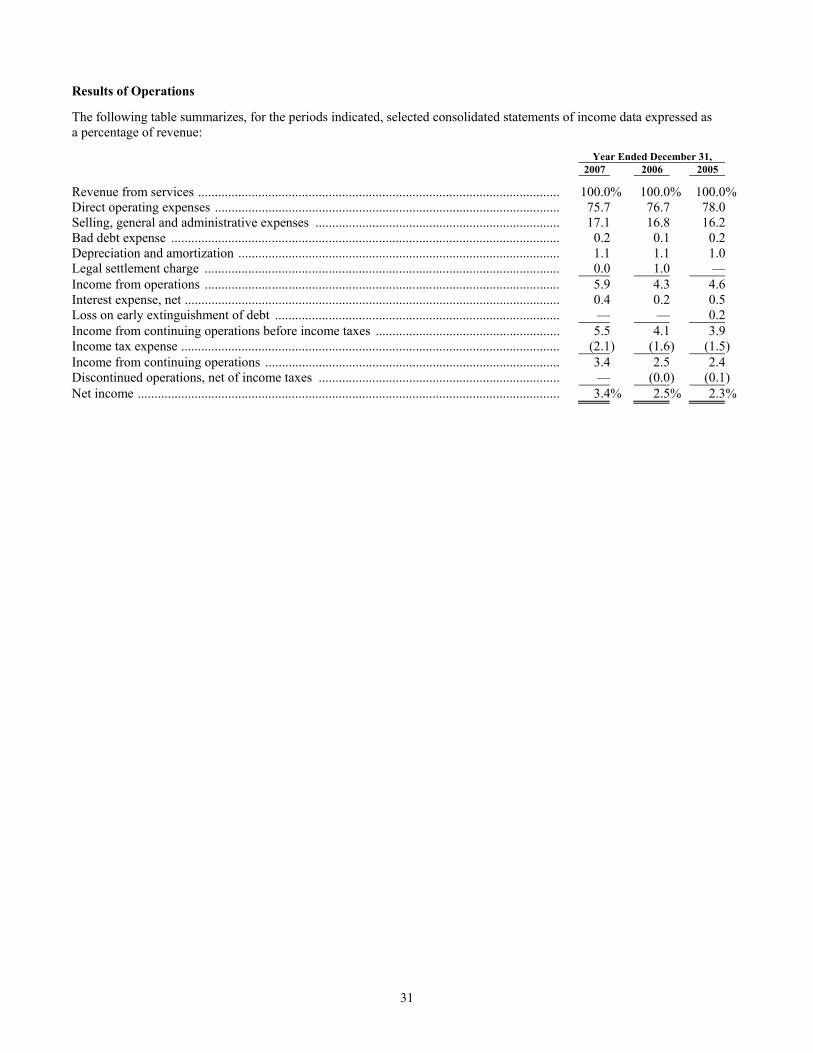
31
Results of Operations
The following table summarizes, for the periods indicated, selected consolidated statements of income data expressed as a percentage of revenue:
Year Ended December 31, 2007 2006 2005
Revenue from services ............................................................................................................ 100.0% 100.0% 100.0%Direct operating expenses ....................................................................................................... 75.7 76.7 78.0 Selling, general and administrative expenses ......................................................................... 17.1 16.8 16.2 Bad debt expense .................................................................................................................... 0.2 0.1 0.2 Depreciation and amortization ................................................................................................ 1.1 1.1 1.0 Legal settlement charge .......................................................................................................... 0.0 1.0 — Income from operations .......................................................................................................... 5.9 4.3 4.6 Interest expense, net ................................................................................................................ 0.4 0.2 0.5 Loss on early extinguishment of debt ..................................................................................... — — 0.2 Income from continuing operations before income taxes ....................................................... 5.5 4.1 3.9 Income tax expense ................................................................................................................. (2.1) (1.6) (1.5) Income from continuing operations ........................................................................................ 3.4 2.5 2.4 Discontinued operations, net of income taxes ........................................................................ — (0.0) (0.1) Net income .............................................................................................................................. 3.4% 2.5% 2.3%

32
Segment Information
In the second quarter of 2007, the Company reevaluated its reporting segments in conjunction with its recent acquisitions of clinical trials services businesses. As a result, the Company disaggregated clinical trials services from nurse and allied staffing, both formerly included in the healthcare staffing segment. The new reporting segment for clinical trials services includes the Company’s ClinForce business, Metropolitan Research, AKOS, and Assent. All prior period data has been reclassified to conform to the current period presentation.
Nurse and allied staffing primarily provides travel nurse and allied staffing services and per diem nurse services to acute care hospitals. Nurse and allied staffing services are also marketed to public and private healthcare facilities and for-profit and not-for-profit facilities throughout the U.S. Clinical trials services provide a flexible range of traditional contract staffing, clinical research outsourcing, drug safety monitoring, and regulatory consulting services to pharmaceutical, biotechnology and medical device companies, as well as contract research organization customers, primarily in the United States, Canada and Europe. Other human capital management services include the combined results of the Company’s education and training and retained search businesses.
Information on operating segments and a reconciliation to income from continuing operations before income taxes for the periods indicated are as follows: Year ended December 31, 2007 2006 2005 (Amounts in thousands) Revenue from unaffiliated customers:
Nurse and allied staffing .......................................................................... $ 576,779 $ 554,900 $ 553,236Clinical trials services .............................................................................. 90,613 53,348 46,110Other human capital management services.............................................. 50,880 46,904 46,047
$ 718,272 $ 655,152 $ 645,393 Contribution income (a):
Nurse and allied staffing .......................................................................... $ 54,941 $ 52,950 $ 46,730Clinical trials services .............................................................................. 14,425 6,928 6,209Other human capital management services.............................................. 7,609 9,048 8,116
Unallocated corporate overhead ................................................................... 26,562 26,873 24,589Depreciation.................................................................................................. 6,309 5,449 5,159Amortization................................................................................................. 2,051 1,570 1,424Legal settlement charge ................................................................................ 34 6,704 —Secondary offering costs............................................................................... — 154 151Foreign exchange loss................................................................................... 93 — —Interest expense, net...................................................................................... 2,587 1,464 3,458Loss on early extinguishment of debt ........................................................... — — 1,359Income from continuing operations before income taxes ............................. $ 39,339 $ 26,712 $ 24,915——————— (a) We define contribution income as earnings before interest, income taxes, depreciation, amortization, legal settlement
charge, secondary offering costs, foreign exchange loss and other corporate expenses not specifically identified to a reporting segment. Contribution income is a measure used by management to access operations and is provided in accordance with FASB Statement No. 131, Disclosure About Segments of an Enterprise and Related Information.
Consolidated Information
Year Ended December 31, 2007 compared to Year Ended December 31, 2006
Revenue from services increased $63.1 million, or 9.6%, to $718.3 million for year ended December 31, 2007 as compared to $655.2 million for the year ended December 31, 2006. The increase was partially due to the additional revenue from acquisitions. Excluding the impact of acquisitions, revenue increased $32.1 million or 4.9%. This increase was primarily due to an increase in revenue from our nurse and allied staffing business segment, supplemented by increases in revenue from our clinical trials services business segment and our other human capital management business services segment.

33
Revenue from our nurse and allied staffing business segment increased $21.9 million, or 3.9%, to $576.8 million in the year ended December 31, 2007, from $554.9 million in the year ended December 31, 2006. The increase in revenue from our nurse and allied staffing business segment was primarily from improved pricing in our travel nurse staffing operations and was partially offset by a decrease in revenue from our per diem staffing and travel allied staffing operations.
Average nurse and allied staffing revenue per full-time equivalent (FTE) and average bill rates increased approximately 3.4% and 4.1%, respectively, during the year ended December 31, 2007, compared to the year ended December 31, 2006. The average number of nurse and allied staffing FTEs on contract in the year ended December 31, 2007, increased 0.5% from the year ended December 31, 2006.
During the year ended December 31, 2007, nurse staffing operations generated 92.5% of nurse and allied staffing segment revenue and 7.5% was generated by allied staffing operations. For the year ended December 31, 2006, 91.8% of nurse and allied staffing segment revenue was generated from nursing operations and 8.2% was generated by allied staffing operations.
Revenue from our clinical trials services business segment increased $37.3 million or 69.9% to $90.6 million in the year ended December 31, 2007, from $53.3 million in the year ended December 31, 2006, primarily as a result of acquisitions. Excluding the impact of the acquisitions, revenue increased $6.2 million, or 11.6%. This increase is primarily due to an increase in temporary staffing volume, partially offset by a decrease in pricing due to mix.
Revenue from our other human capital management services business segment for the year ended December 31, 2007, increased $4.0 million, or 8.5%, to $50.9 million from $46.9 million in the year ended December 31, 2006, due to an increase in both our education and training business and our retained search business. Revenue from our education and training business increased due to increases in the number of seminars, the average attendance, and the average fee per registrant.
Direct operating expenses are comprised primarily of field employee compensation expenses, housing expenses, travel expenses and field insurance expenses. Direct operating expenses increased $41.1 million, or 8.2%, to $543.6 million for the year ended December 31, 2007, as compared to $502.5 million for year ended December 31, 2006. This increase was partially due to the impact of the clinical trials services acquisitions.
As a percentage of revenue, direct operating expenses represented 75.7% of revenue for the year ended December 31, 2007 and 76.7% for the year ended December 31, 2006. This decrease is primarily due to a change in mix of business segments due to the clinical trials services acquisitions. Clinical trials services tend to have lower direct costs as a percentage of revenue than our nurse and allied staffing business.
Selling, general and administrative expenses increased $12.5 million, or 11.4%, to $122.7 million for the year ended December 31, 2007, as compared to $110.2 million for the year ended December 31, 2006. The increase in selling, general and administrative expenses was primarily due to additional expenses from the clinical trials services acquisitions, higher compensation expense in our nurse and allied staffing business segment, higher direct mail costs in our education and training business, and higher legal expenses in our retained search business. As a percentage of revenue, selling, general and administrative expenses were 17.1% and 16.8% for the years ended December 31, 2007 and 2006, respectively.
Unallocated corporate overhead was $26.6 million in the year ended December 31, 2007 compared to $26.9 million in the year ended December 31, 2006. As a percentage of consolidated revenue, unallocated corporate overhead was 3.7% in the year ended December 31, 2007, and 4.1% in the year ended December 31, 2006, reflecting improved operating leverage.
Bad debt expense totaled $1.6 million in the year ended December 31, 2007 compared to approximately $0.5 million in the year ended December 31, 2006. During the year ended December 31, 2007, we increased our reserves, based on the aging of certain accounts for a few slow-paying customers.
Contribution income from our nurse and allied staffing segment for the year ended December 31, 2007, increased $2.0 million or 3.8%, to $54.9 million from $53.0 million in the year ended December 31, 2006. As a percentage of nurse and allied staffing revenue, contribution income was 9.5% for both the years ended December 31, 2007 and 2006.
Contribution income from our clinical trials services segment for the year ended December 31, 2007, increased $7.5 million to $14.4 million, compared to $6.9 million in the year ended December 31, 2006. As a percentage of segment revenue, contribution income from our clinical trials services business was 15.9% in the year ended December 31, 2007, compared to 13.0% in the year ended December 31, 2006. This increase is primarily due to the acquisitions, which had higher contribution margin than our base clinical trials services business coupled with a combination of higher margin business and improved operating leverage in our base clinical trials services business.
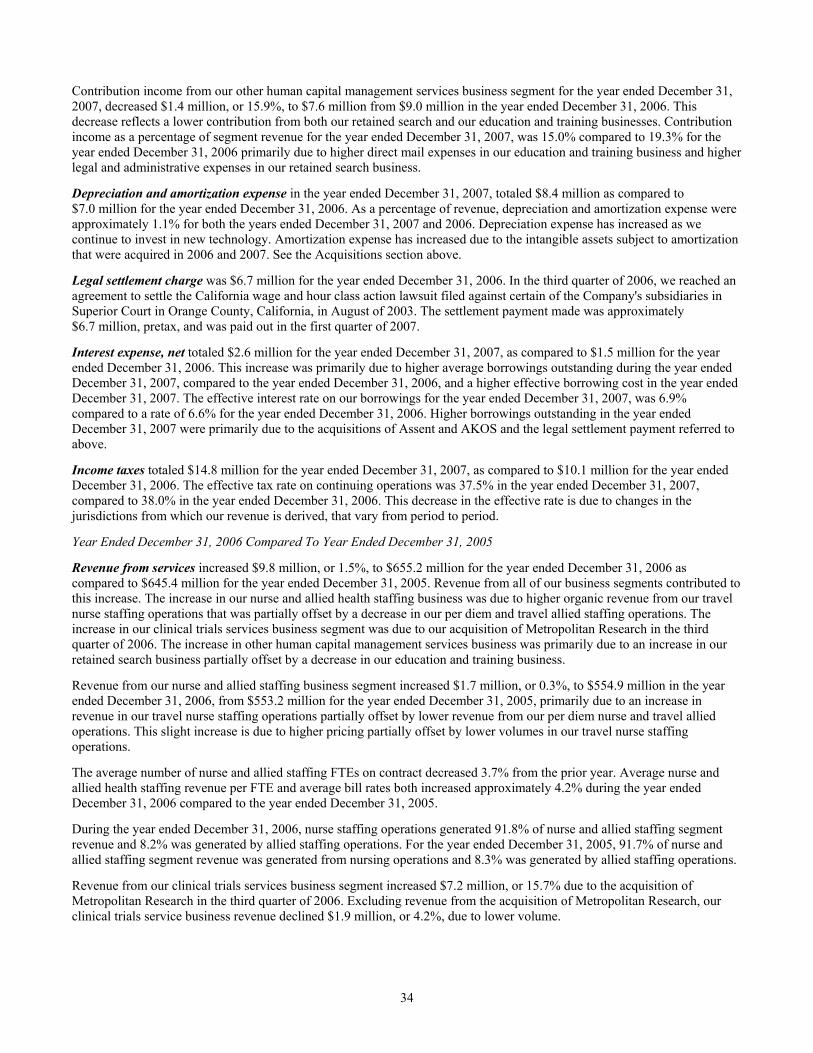
34
Contribution income from our other human capital management services business segment for the year ended December 31, 2007, decreased $1.4 million, or 15.9%, to $7.6 million from $9.0 million in the year ended December 31, 2006. This decrease reflects a lower contribution from both our retained search and our education and training businesses. Contribution income as a percentage of segment revenue for the year ended December 31, 2007, was 15.0% compared to 19.3% for the year ended December 31, 2006 primarily due to higher direct mail expenses in our education and training business and higher legal and administrative expenses in our retained search business.
Depreciation and amortization expense in the year ended December 31, 2007, totaled $8.4 million as compared to $7.0 million for the year ended December 31, 2006. As a percentage of revenue, depreciation and amortization expense were approximately 1.1% for both the years ended December 31, 2007 and 2006. Depreciation expense has increased as we continue to invest in new technology. Amortization expense has increased due to the intangible assets subject to amortization that were acquired in 2006 and 2007. See the Acquisitions section above.
Legal settlement charge was $6.7 million for the year ended December 31, 2006. In the third quarter of 2006, we reached an agreement to settle the California wage and hour class action lawsuit filed against certain of the Company's subsidiaries in Superior Court in Orange County, California, in August of 2003. The settlement payment made was approximately $6.7 million, pretax, and was paid out in the first quarter of 2007.
Interest expense, net totaled $2.6 million for the year ended December 31, 2007, as compared to $1.5 million for the year ended December 31, 2006. This increase was primarily due to higher average borrowings outstanding during the year ended December 31, 2007, compared to the year ended December 31, 2006, and a higher effective borrowing cost in the year ended December 31, 2007. The effective interest rate on our borrowings for the year ended December 31, 2007, was 6.9% compared to a rate of 6.6% for the year ended December 31, 2006. Higher borrowings outstanding in the year ended December 31, 2007 were primarily due to the acquisitions of Assent and AKOS and the legal settlement payment referred to above.
Income taxes totaled $14.8 million for the year ended December 31, 2007, as compared to $10.1 million for the year ended December 31, 2006. The effective tax rate on continuing operations was 37.5% in the year ended December 31, 2007, compared to 38.0% in the year ended December 31, 2006. This decrease in the effective rate is due to changes in the jurisdictions from which our revenue is derived, that vary from period to period.
Year Ended December 31, 2006 Compared To Year Ended December 31, 2005
Revenue from services increased $9.8 million, or 1.5%, to $655.2 million for the year ended December 31, 2006 as compared to $645.4 million for the year ended December 31, 2005. Revenue from all of our business segments contributed to this increase. The increase in our nurse and allied health staffing business was due to higher organic revenue from our travel nurse staffing operations that was partially offset by a decrease in our per diem and travel allied staffing operations. The increase in our clinical trials services business segment was due to our acquisition of Metropolitan Research in the third quarter of 2006. The increase in other human capital management services business was primarily due to an increase in our retained search business partially offset by a decrease in our education and training business.
Revenue from our nurse and allied staffing business segment increased $1.7 million, or 0.3%, to $554.9 million in the year ended December 31, 2006, from $553.2 million for the year ended December 31, 2005, primarily due to an increase in revenue in our travel nurse staffing operations partially offset by lower revenue from our per diem nurse and travel allied operations. This slight increase is due to higher pricing partially offset by lower volumes in our travel nurse staffing operations.
The average number of nurse and allied staffing FTEs on contract decreased 3.7% from the prior year. Average nurse and allied health staffing revenue per FTE and average bill rates both increased approximately 4.2% during the year ended December 31, 2006 compared to the year ended December 31, 2005.
During the year ended December 31, 2006, nurse staffing operations generated 91.8% of nurse and allied staffing segment revenue and 8.2% was generated by allied staffing operations. For the year ended December 31, 2005, 91.7% of nurse and allied staffing segment revenue was generated from nursing operations and 8.3% was generated by allied staffing operations.
Revenue from our clinical trials services business segment increased $7.2 million, or 15.7% due to the acquisition of Metropolitan Research in the third quarter of 2006. Excluding revenue from the acquisition of Metropolitan Research, our clinical trials service business revenue declined $1.9 million, or 4.2%, due to lower volume.
35
Revenue from our other human capital management services for the year ended December 31, 2006, increased 1.9% to $46.9 million from $46.0 million in the year ended December 31, 2005. An increase in revenue from our retained search business more than offset lower revenue from our education and training business. The lower revenue from our educational training business primarily reflects a lower number of seminars and lower average attendance per seminar, partially offset by an increase in pricing in the year ended December 31, 2006, compared to the year ending December 31, 2005.
Direct operating expenses are comprised primarily of field employee compensation expenses, housing expenses, travel expenses and field insurance expenses. Direct operating expenses totaled $502.5 million for the year ended December 31, 2006, as compared to $503.1 million for the year ended December 31, 2005. As a percentage of revenue, direct operating expenses represented 76.7% of revenue for the year ended December 31, 2006 and 78.0% for the year ended December 31, 2005. In the second quarter of 2005, we increased our insurance reserves by approximately $5.3 million, or 0.8% of revenue, based on specific unfavorable developments in certain professional liability cases as reported in our Form 10-K as filed for the year ended December 31, 2006. Excluding this charge in 2005, direct operating expenses as a percentage of revenue decreased primarily due to a widening of our bill-pay spread in our travel staffing operations, partially offset by higher housing and health insurance expenses.
Selling, general and administrative expenses were $110.2 million for the year ended December 31, 2006, as compared to $104.6 million for the year ended December 31, 2005. The increase in selling, general and administrative expenses was primarily due to increased compensation in our retained search business, an increase in unallocated corporate overhead, and additional expenses from Metropolitan Research. Unallocated corporate overhead was $26.9 million in the year ended December 31, 2006, compared to $24.6 million in the year ended December 31, 2005. This increase was primarily due to higher expenses to upgrade, protect, and maintain our key information systems, including incremental disaster recovery costs and higher legal fees. As a percentage of consolidated revenue, unallocated corporate overhead was 4.1% during the year ended December 31, 2006, and 3.8% during the year ended December 31, 2005.
As a percentage of revenue, selling, general and administrative expenses were 16.8% and 16.2% for the years ended December 31, 2006 and 2005, respectively, primarily due to the increase in corporate unallocated overhead, negative operating leverage in our per diem operations and higher selling expenses in our clinical trials services business.
Bad debt expense totaled $0.5 million for the year ended December 31, 2006, which represented approximately 0.1% of revenue compared to $1.2 million for the year ended December 31, 2005 which represented approximately 0.2% of revenue.
Contribution income from our nurse and allied staffing segment for the year ended December 31, 2006, increased 13.3%, or $6.2 million, to $52.9 million from $46.7 million in the year ended December 31, 2005. As a percentage of nurse and allied staffing revenue, contribution income was 9.5% for the year ended December 31, 2006, compared to 8.4% for the year ended December 31, 2005. In 2005, our profitability was negatively impacted by the significantly higher insurance reserves recorded in the second quarter as discussed previously. Excluding this $5.3 million charge, contribution margin as a percentage of revenue increased primarily due to a widening of our bill-pay spread in our travel staffing operations partially offset by higher housing and health insurance costs.
Contribution income from our clinical trials services business segment for the year ended December 31, 2006, increased $0.7 million to $6.9 million, compared to $6.2 million in the year ended December 31, 2006. As a percentage of revenue, contribution income from our clinical trials services business was 13.0% in the year ended December 31, 2007, compared to 13.5% in the year ended December 31, 2006, primarily due to negative operating leverage.
Contribution income from our other human capital management services business segment for the year ended December 31, 2006, increased 11.5% to $9.0 million from $8.1 million in the year ended December 31, 2005. This increase was primarily due to higher revenue from our retained search business combined with improved operating leverage in both the retained search and education and training businesses. Contribution income as a percentage of other human capital management services revenue for the year ended December 31, 2006, was 19.3% compared to 17.6% for the year ended December 31, 2005.
Depreciation and amortization expense for the year ended December 31, 2006, totaled $7.0 million as compared to $6.6 million for the year ended December 31, 2005. As a percentage of revenue, depreciation and amortization expense were 1.1% and 1.0%, respectively, for the years ended December 31, 2006 and 2005.
Legal settlement charge represents the total settlement amount of $6.7 million ($4.2 million after taxes) related to a specific class action lawsuit as explained above.
36
Secondary offering costs totaled $0.2 million during the years ended December 31, 2006 and 2005. Secondary offering costs include registration statement filing and public offering expenses incurred as a result of our secondary offerings in April 2005 and November 2006. Neither the Company nor management registered any shares pursuant to this registration statement; consequently, neither the Company nor management received any proceeds from the sale of shares by the selling shareholders. Accordingly, we did not capitalize any of the associated fees and expense related to the offering. Refer to discussion in the notes to our consolidated financial statements (Note 12 – Stockholders’ Equity).
Interest expense, net totaled $1.5 million for the year ended December 31, 2006, as compared to $3.5 million for the year ended December 31, 2005. This decrease was primarily due to lower average borrowings outstanding during the year ended December 31, 2006 compared to the year ended December 31, 2005 partially offset by a slightly higher effective borrowing cost in the year ended December 31, 2006. The effective interest rate on our borrowings for the year ended December 31, 2006, was 6.6% compared to a rate of 6.2% for the year ended December 31, 2005.
Income tax expense totaled $10.1 million for the year ended December 31, 2006, as compared to $9.6 million for the year ended December 31, 2005. The effective tax rate on continuing operations was 38.0% in the year ended December 31, 2006 compared to 38.4% in the year ended December 31, 2005, due to a more favorable mix of income among various tax jurisdictions from which our revenue is derived, that vary from period to period.
Discontinued operations, net of income taxes, relate to the discontinuance of our healthcare consulting practice, as previously discussed.
Transactions with Related Parties
We provide services to hospitals which are affiliated with certain Board of Director members. Revenue related to these transactions amounted to approximately $3.9 million, $4.7 million and $6.9 million in aggregate for the years ended December 31, 2007, 2006, and 2005, respectively. Accounts receivable due from these hospitals at December 31, 2007 and 2006 were approximately $0.6 million and $0.5 million, respectively. Pricing for our services is consistent with our other hospital customers. There are no contractual obligations with these hospitals.
Liquidity and Capital Resources
As of December 31, 2007, we had a current ratio, defined as the amount of current assets divided by current liabilities, of 3 to 1. Working capital increased by $13.5 million to $98.7 million as of December 31, 2007, compared to $85.2 million as of December 31, 2006. The increase in working capital is primarily due to the settlement of specific insurance related litigation we reserved for in the second quarter of 2005 (discussed previously), decreases in accounts payable and accrued expenses due to timing, and the 2007 acquisitions of Assent Consulting and AKOS Limited. Days’ sales outstanding were 59 days, 60 days, and 61 days at December 31, 2007, 2006, and 2005, respectively, and were consistent with historical ranges.
Our operating cash flows constitute our primary source of liquidity, and historically, have been sufficient to fund our working capital, capital expenditures, internal business expansion and debt service including our commitments as described in the Commitments table which follows. We believe that our capital resources are sufficient to meet our working capital needs including our earnout payment commitments for the next twelve months. We expect to meet our future needs for working capital, capital expenditures, internal business expansion, debt service, and any additional stock repurchases from a combination of operating cash flows and funds available under our current credit agreement. We also continue to evaluate acquisition opportunities that may require additional funding. In addition to those amounts available under our existing credit agreement, we may incur up to an additional $35.0 million in Indebtedness (as defined by the credit agreement). We also may, at our option, request an increase to the amount of principal borrowings of up to $50.0 million via an incremental increase in the revolving credit facility and/or through one or more term loan facilities.
Stockholders’ Equity
Stock Repurchase Programs
On May 10, 2006, our Board of Directors authorized a stock repurchase program whereby we may purchase up to 1.5 million of our common shares, subject to the constraints of our current credit agreement. The shares may be purchased from time to time on the open market. The repurchase program may be discontinued at any time at our discretion.
In November 2002, our Board of Directors authorized a stock repurchase program whereby we may purchase up to 1.5 million of our common shares at an aggregate price not to exceed $25.0 million. Under this program, we purchased and retired 1.5 million shares of our common stock at an average cost of $15.04 per share pursuant to the authorization. All of the
37
common stock was retired. The cost of such purchases was approximately $22.6 million. During the year ended December 31, 2007, the November 2002 stock repurchase program was depleted, and, accordingly, we commenced repurchases under this new authorization.
During the year ended December 31, 2007, we repurchased, under both programs, a total of 704,498 shares at an average cost of $15.45 per share. The cost of such purchases was approximately $10.9 million. All of the common stock was retired. Under the remainder of the new authorization, we can purchase up to an additional 865,374 shares, subject to the terms of our current credit facility. At December 31, 2007, we had approximately 31.6 million shares outstanding.
We repurchased an additional 600,008 shares at an average cost of $11.74 per share through February 27, 2008, leaving 265,366 shares available for repurchase under the 2006 authorization. Subsequently, on February 28, 2008, our Board of Directors authorized a stock repurchase program whereby we may purchase up to an additional 1.5 million of our common shares, subject to the terms of our current credit agreement. The shares may be repurchased from time-to-time in the open market and the repurchase program may be discontinued at any time at our discretion. This stock repurchase authorization will commence upon the completion of the May 2006 authorization.
Secondary Offering
In November 2004, we filed a Registration Statement on Form S-3 with the U.S. Securities and Exchange Commission (SEC) for the registration of approximately 11,403,455 shares of common stock owned by three of our existing stockholders. Neither the Company nor management registered any shares pursuant to this registration statement. In April 2005, we announced a public offering of 4,172,868 shares of common stock pursuant to this Form S-3 shelf registration statement. All net proceeds from the sale went to the selling stockholders. However, we incurred all fees and expenses relating to the registration statement which were approximately $0.2 million. Subsequently, on November 13, 2006, we announced a public offering of approximately 4.0 million shares pursuant to this Form S-3 shelf registration statement. All net proceeds from the sale went to the selling stockholders. However, we incurred all fees and expenses relating to the registration statement which were approximately $0.2 million and included in secondary offering costs on the consolidated statements of income.
Credit Facility
We entered into a credit agreement on November 10, 2005 (“the 2005 Credit Agreement”), consisting of a 5-year $75.0 million revolving credit facility, with a $10.0 million sublimit for the issuance of Swingline Loans (as defined by the 2005 Credit Agreement) and a $35.0 sublimit for the issuance of standby letters of credit. Swingline Loans and letters of credit issued under this facility reduce the revolving credit facility on a dollar for dollar basis. We may, at our option, request an increase to the amount of principal borrowings of up to $50.0 million via an incremental increase in the revolving credit facility and/or through one or more term loan facilities. This facility is provided by a syndicate led by Wachovia Bank, National Association, and comprised of General Electric Capital Corporation; Bank of America, N.A.; LaSalle Bank National Association; Carolina First Bank; National City Bank of Kentucky; Comerica Bank; and U.S. Bank, N.A. The revolving credit facility was used to refinance all of our existing senior secured debt and will continue to be used for general corporate purposes including working capital, capital expenditures and permitted acquisitions and investments, as well as to pay fees and expenses related to the credit facility.
Borrowings under the 2005 Credit Agreement bear interest, at our option, at the London Interbank Offered Rate (“LIBOR”) or the Base Rate plus an Applicable Margin as defined by the Credit Agreement. As of December 31, 2007, interest on this facility was based on LIBOR plus a margin of 1.50% or Base Rate plus a margin of 0.25%. We are required to pay a quarterly commitment fee on the average daily unused portion of the facility, which, as of December 31, 2007, was 0.25%. As of December 31, 2007, we had $38.0 million of borrowings outstanding and $1.3 million of standby letters of credit outstanding under this facility, leaving $35.7 available for additional borrowings.
The terms of the 2005 Credit Agreement include customary covenants and events of default. The agreement includes a mandatory prepayment provision, which requires us to make mandatory prepayments subsequent to receiving net proceeds from the sale of assets, insurance recoveries, or the issuance of our debt or equity. The dividends and distribution covenant limits our ability to repurchase our common stock and declare and pay cash dividends on our common stock. As of December 31, 2007, we were limited to $24.4 million to be used for either dividends and/or stock repurchases. This limitation increases each year by 25% of net income provided that our Debt/EBITDA ratio (as defined in the 2005 Credit Agreement) is less than 1.5 to 1.0 and we have $15.0 million in cash or available cash under the revolving credit facility. We are also required to obtain the consent of the lenders to complete any acquisition which exceeds $25.0 million or would cause us to exceed $125.0 million in aggregate payments during the term of the agreement. The commitments under the 2005 Credit Agreement are secured by substantially all of our assets.

38
Year Ended December 31, 2007 Compared to Year Ended December 31, 2006
Net cash provided by operating activities during 2007 was $36.0 million compared to $32.9 million during 2006. This increase is primarily due to higher net income partially offset by higher working capital requirements in 2007. During the year ended 2007, we paid out the legal settlement amount of $6.7 million, referenced previously. Investing activities used $35.3 million during 2007, primarily for the purchases of Assent Consulting and AKOS Limited as well as capital expenditures. During the year ended December 31, 2006, investing activities used $27.8 million for the acquisition of Metropolitan Research and capital expenditures. Net cash provided by financing activities in 2007 was $8.4 million. Cash flow from operations and net borrowings were used primarily for acquisitions and stock repurchases. Cash was also provided by the exercise of employee stock options. Net cash used in financing activities in 2006 was $5.1 million. We utilized net cash flow from operations and investing activities to repay debt and repurchase our common stock. These repayments were partially offset by the proceeds received from the exercise of stock options and other financing activities.
Year Ended December 31, 2006 Compared to Year Ended December 31, 2005
Net cash provided by operating activities during 2006 was $32.9 million compared to $30.8 million during 2005. This increase is primarily due to higher net income partially offset by higher working capital requirements in 2006. During the year ended 2006, we settled the specific insurance related litigation that was reserved for in the second quarter of 2005. Investing activities used $27.8 million during 2006, for the purchase of Metropolitan Research and capital expenditures. During the year ended December 31, 2005, investing activities used $8.4 million primarily for capital expenditures. Net cash used in financing activities in 2006 was $5.1 million compared to $22.4 million during the year ended December 31, 2005. In both years, we utilized net cash flow from operations and investing activities to repay debt and repurchase our common stock. These repayments were partially offset by the proceeds received from the exercise of stock options and other financing activities.
Commitments and Off-Balance Sheet Arrangements
We did not have any off-balance sheet arrangements.
The following table reflects our contractual obligations and other commitments as of December 31, 2007: Commitments Total 2008 2009 2010 2011 2012 Thereafter (Unaudited, amounts in thousands) Senior secured credit facility (a) .... $ 38,000 $ 4,500 $ — $ 33,500 $ — $ — $ — Capital lease obligations ............... 1,452 567 640 242 3 — — Operating leases obligations (b)..... 39,000 6,195 5,646 4,723 4,475 4,402 13,559 Purchase obligations (c)................. 945 582 177 62 62 62 — Earnouts (d) ................................... 8,559 8,559 (d) — — — — $ 87,956 $ 20,403 $ 6,463 $ 38,527 $ 4,540 $ 4,464 $ 13,559———————
(a) Under our credit facility, we are required to comply with certain financial covenants. Our inability to comply with the required covenants or other provisions could result in default under our credit facility. In the event of any such default and our inability to obtain a waiver of the default, all amounts outstanding under the credit facility could be declared immediately due and payable.
(b) Represents future minimum lease payments associated with operating lease agreements with original terms of more than one year.
(c) Other contractual obligations include contracts for information systems consulting services.
(d) Earnouts are contingent payments related to our recent acquisitions. Determined amounts, at the time of this filing are included in this schedule. Additional earnout payments may be made in 2009. See Note 4 – Acquisitions.
39
Critical Accounting Principles and Estimates
We have identified the following critical accounting policies that affect the more significant judgments and estimates used in the preparation of our consolidated financial statements. The preparation of our consolidated financial statements in conformity with accounting principles generally accepted in the United States of America requires us to make estimates and judgments that affect our reported amounts of assets and liabilities, revenues and expenses, and related disclosures of contingent assets and liabilities. We evaluate our estimates on an on-going basis, including those related to asset impairment, accruals for insurance, allowance for doubtful accounts, and contingencies and litigation. We state our accounting policies in the notes to the audited consolidated financial statements and related notes for the year ended December 31, 2007, contained herein. These estimates are based on information that is currently available to us and on various assumptions that we believe to be reasonable under the circumstances. Actual results could vary from those estimates under different assumptions or conditions.
We believe that the following critical accounting policies affect the more significant judgments and estimates used in the preparation of our consolidated financial statements:
1) We have recorded goodwill and intangibles resulting from our acquisitions through December 31, 2007. Upon the adoption of FASB Statement No. 142, we ceased amortizing goodwill and certain other intangible assets with indefinite lives in accordance with the provisions of FASB Statement No. 142. We also completed the annual impairment test of goodwill and indefinite lived intangible assets during the fourth quarters of 2007, 2006 and 2005. Based on the results of the tests, we determined that there was no impairment of goodwill or indefinite lived intangible assets relating to continuing operations as of December 31, 2007, 2006, and 2005. The calculation of fair value used in these impairment assessments included a number of estimates and assumptions, including projections of future income and cash flows, the identification of appropriate market multiples and the choice of an appropriate discount rate. If we are required to record an impairment charge in the future, it could have an adverse impact on our results of operations. We periodically evaluate the recovery of the carrying amount of net assets held for sale to determine if the net assets are impaired. This evaluation can also be triggered by various indicators of impairment which could cause the estimated discounted cash flows to be less than the carrying amount of net assets. As of December 31, 2007, we had total goodwill and intangible assets not subject to amortization of $345.0 million, net of accumulated amortization.
2) We maintain accruals for our health, workers’ compensation and professional liability policies that are partially self-insured and are classified as accrued employee compensation and benefits on our consolidated balance sheets. We determine the adequacy of these accruals by periodically evaluating our historical experience and trends related to health, workers’ compensation and professional liability claims and payments, based on actuarial models, as well as industry experience and trends. If such models indicate that our accruals are overstated or understated, we will reduce or provide for additional accruals as appropriate. Healthcare insurance accruals have fluctuated with increases or decreases in the average number of temporary healthcare professionals on assignment as well as actual company experience and increases in national healthcare costs. As of December 31, 2007 and 2006, we had $1.9 million and $2.4 million accrued, respectively, for incurred but not reported health insurance claims. Corporate and field employees are covered through a partially self-insured health plan. At December 31, 2007 and 2006, $0.6 million and $0.5 million, respectively, of the incurred but not reported health insurance claims accrual related to corporate employees. Workers’ compensation insurance accruals have generally increased over time due to an increase in the number of employees and inflation, as well as additional exposures arising from the current policy year. As of December 31, 2007, we had $4.8 million accrued for incurred but not reported workers’ compensation claims and retentions, net of related insurance recoveries receivable, an increase of $0.2 million over the amount accrued at December 31, 2006. The accrual for workers’ compensation is based on an internally prepared actuarial model reviewed by an independent actuary. As of December 31, 2007 and 2006, we had $6.6 million and $9.2 million accrued, respectively, for incurred but not reported professional liability claims and retentions, net of related insurance recovery receivable. The accrual for professional liability is based on an internally prepared actuarial model which is reviewed by an independent actuary.
3) We maintain an allowance for doubtful accounts for estimated losses resulting from the inability of our customers to make required payments, which results in a provision for bad debt expense. We determine the adequacy of this allowance by continually evaluating individual customer receivables, considering the customer’s financial condition, credit history and current economic conditions. If the financial condition of our customers were to deteriorate, resulting in an impairment of their ability to make payments, additional allowances may be required. We write off specific accounts based on an ongoing review of collectibility as well as our past experience with the customer. Historically, losses on uncollectible accounts have not exceeded our allowances. As of December 31, 2007, our allowance for doubtful accounts was $5.6 million.
40
4) We are subject to various claims and legal actions in the ordinary course of our business. Some of these matters include professional liability and employee-related matters. Our healthcare facility clients may also become subject to claims, governmental inquiries and investigations and legal actions to which we may become a party relating to services provided by our professionals. From time to time, and depending upon the particular facts and circumstances, we may be subject to indemnification obligations under our contracts with our healthcare facility clients relating to these matters. Material pending legal proceedings brought against the Company, other than ordinary routine litigation incidental to the business are described in Legal Proceedings.
5) We account for income taxes in accordance with FASB Statement No. 109, Accounting for Income Taxes. Deferred tax assets and liabilities are recognized for the future tax consequences attributable to differences between financial statement carrying amounts of existing assets and liabilities and their respective tax bases and operating loss and other loss carryforwards. Deferred tax assets and liabilities are measured using enacted tax rates expected to apply to taxable income in the years in which those temporary differences are expected to be recovered or settled.
In calculating the provision for income taxes on an interim basis, we use an estimate of the annual effective tax rate based upon the facts and circumstances known at each interim period. On a quarterly basis, the actual effective tax rate is adjusted as appropriate based upon the actual results as compared to those forecasted at the beginning of the fiscal year.
We are subject to income taxes in the United States and certain foreign jurisdictions. Significant judgment is required in determining our consolidated provision for income taxes and recording the related deferred tax assets and liabilities. In the ordinary course of our business, there are many transactions and calculations where the ultimate tax determination is uncertain. Accruals for unrecognized tax benefits are provided for in accordance with the requirements of FASB Interpretation No. 48, Accounting for Uncertainty in Income Taxes – an interpretation of FASB Statement No. 109 (FIN 48). An unrecognized tax benefit represents the difference between the recognition of benefits related to exposure items for income tax reporting purposes and financial reporting purposes. The current portion of the unrecognized tax benefit is classified as a component of the income taxes payable account, and the non-current portion is included within other long-term liabilities on the consolidated balance sheets. We have a reserve for interest and penalties on exposure items, if applicable, which is recorded as a component of the overall income tax provision. The Company is regularly under audit by tax authorities. Although the outcome of tax audits is always uncertain, we believe that the Company has appropriate support for the positions taken on its tax returns and that it’s annual tax provision includes amounts sufficient to pay any assessments. Nonetheless, the amounts ultimately paid, if any, upon resolution of the issues raised by the taxing authorities may differ materially from the amounts accrued for each year.
Adoption of FASB Statement No. 123 (Revised 2004)
On January 1, 2006, we adopted FASB Statement No. 123(R) using the modified prospective method. FASB Statement No. 123(R) requires all share-based payments to employees, including grants of employee stock options, to be recognized in the income statement based on their fair values. Under the modified prospective approach, the recognition provisions of FASB Statement No. 123(R) are applied prospectively. For prior periods, companies are required to disclose the pro forma impact of adopting the standard for prior periods. All of our options outstanding as of December 31, 2005 were fully vested as a result of the decision to accelerate the vesting of any unvested options as of December 31, 2005. A total of 436,368 options, with a weighted average exercise price of $15.25 per share, were accelerated. Of these options, 90% had exercise prices below market value (“in-the-money options”) as of December 28, 2005. The reason for the acceleration was to avoid recognizing associated compensation expense for these options in future periods’ consolidated statements of income. We estimated the pre-tax charge avoided in future periods by the acceleration of these options to be approximately $2.9 million (excluding the impact of forfeitures). In conjunction with the acceleration, we recorded a pre-tax charge of $0.1 million in the fourth quarter of 2005 related to the acceleration of in-the-money options we estimated would not have otherwise vested. This charge was included in selling, general, and administrative expenses on the consolidated statements of income. We expect there to be no further impact, from the share-based payments that were outstanding as of December 31, 2005, on our consolidated statements of income. However, stock-based compensation expense could become material to us depending on the number of options or other forms of equity-based compensation that are granted in the future.
We used the Black-Scholes method for disclosures prior to adoption. After reviewing alternative valuation methods, we selected to continue using the Black-Scholes method based on our prior experience with it, and its wide use by other issuers comparable to us. We will consider the use of another model if additional information becomes available in the future that indicates another model would be more appropriate for us, or, if grants issued in future periods have characteristics that cannot be reasonably estimated using Black-Scholes.
41
The 2007 Stock Incentive Plan (Plan) was approved by our stockholders at its 2007 Annual Meeting of Stockholders, held in May. The Plan provides for the issuance of stock options, stock appreciation rights, restricted stock, performance shares, and other stock-based awards, all as defined by the Plan, to eligible employees, consultants and non-employee Directors. See Note 12 – Stockholders’ Equity for further information about share-based payments granted subsequent to the adoption of FASB Statement No. 123(R).
Recent Accounting Pronouncements
In September 2006, the FASB issued Statement No. 157, Fair Value Measurements, which defines fair value, establishes a framework for measuring fair value under U.S. generally accepted accounting principles and expands disclosures about fair value measurements. FASB Statement No. 157 is effective for fiscal years beginning after November 15, 2007, and interim periods within those fiscal years. This standard is not expected to have a material impact on our consolidated financial statements.
In February 2007, the FASB issued Statement No. 159, The Fair Value Option for Financial Assets and Financial Liabilities. This standard allows companies to elect to follow fair value accounting for certain financial assets and liabilities in an effort to mitigate volatility in earnings without having to apply complex hedge accounting provisions. FASB Statement No. 159 is applicable only to certain financial instruments and is effective for fiscal years beginning after November 15, 2007. As we do not intend to elect fair value treatment for qualifying instruments that exist as of the effective date, we do not expect the adoption of this Statement to have a material impact on our consolidated financial statements. We may elect to measure qualifying instruments at fair value in the future.
In December 2007, the FASB issued FASB No. 141R, Business Combinations (FASB 141R), which replaces FASB 141. FASB 141R applies to all transactions or other events in which an entity obtains control of one or more businesses and requires that all assets and liabilities of an acquired business as well as any noncontrolling interest in the acquiree be recorded at their fair values at the acquisition date. Contingent consideration arrangements will be recognized at their acquisition date fair values, with subsequent changes in fair value generally reflected in earnings. Pre-acquisition contingencies will also typically be recognized at their acquisition date fair values. In subsequent periods, contingent liabilities will be measured at the higher of their acquisition date fair values or the estimated amounts to be realized. The Statement is effective for business combinations for which the acquisition date is on or after the beginning of the first annual reporting period beginning on or after December 15, 2008. We expect FASB 141R could have an impact on our future consolidated financial statements when effective, but the nature and magnitude of the specific effects will depend upon the nature, terms and size of the acquisitions we consummate after the effective date.
Seasonality
The number of nurse and allied professionals on assignment with us is subject to moderate seasonal fluctuations which may impact our quarterly revenue and earnings. Hospital patient census and staffing needs of our hospital and healthcare facilities fluctuate which impact our number of orders for a particular period. Many of our hospital and healthcare facility clients are located in areas that experience seasonal fluctuations in population during the winter and summer months. These facilities adjust their staffing levels to accommodate the change in this seasonal demand and many of these facilities utilize temporary healthcare professionals to satisfy these seasonal staffing needs. Likewise, the number of nurse and allied professionals on assignment may fluctuate due to the seasonal preferences for destinations of our temporary nurse and allied professionals. This historical seasonality of revenue and earnings may vary due to a variety of factors and the results of any one quarter are not necessarily indicative of the results to be expected for any other quarter or for any year.
Inflation
During the last several years, the rate of inflation in healthcare related services has exceeded that of the economy as a whole. This inflation has increased our direct operating costs. We are also impacted by fluctuations in housing costs and recently by increases in costs of professional, general and healthcare insurance. Depending on the demand environment, we may be able to recoup the negative impact of such fluctuations by increasing our billing rates. We may not be able to continue increasing our billing rates and increases in our direct operating costs may adversely affect us in the future. In addition, our clients are impacted by payments of healthcare reimbursements by federal and state governments as well as private insurers.

42
Item 7A. Quantitative and Qualitative Disclosures about Market Risk.
We are exposed to interest rate changes, primarily as a result of our credit facility, which bears interest based on floating rates. A 1% change in interest rates on variable rate debt would have resulted in interest expense fluctuating approximately $0.3 million in 2007, $0.2 million in 2006, and $0.3 million in 2005.
We are exposed to the impact of foreign currency fluctuations. Changes in foreign currency exchange rates impact translations of foreign denominated assets and liabilities into U.S. dollars and future earnings and cash flows from transactions denominated in different currencies. Our international operations generated less than 1% of our consolidated revenue during the year ending December 31, 2007, and were primarily from the United Kingdom. We have not entered into any foreign currency derivative instruments.
Our international operations transact business in their functional currency. As a result, fluctuations in the value of foreign currencies against the U.S. dollar have an impact on reported results. Revenues and expenses denominated in foreign currencies are translated into U.S. dollars at monthly average exchange rates prevailing during the period. Consequently, as the value of the U.S. dollar changes relative to the currencies of our non-U.S. markets, our reported results vary.
Fluctuations in exchange rates also impact the U.S. dollar amount of stockholders’ equity. The assets and liabilities of our non-U.S. subsidiaries are translated into U.S. dollars at the exchange rate in effect at the end of a reporting period. The resulting translation adjustments are recorded in stockholders’ equity, as a component of accumulated other comprehensive income, included in other stockholders’ equity on our consolidated balance sheet.
Item 8. Financial Statements and Supplementary Data.
See Item 15 – Exhibits, Financial Statement Schedules of Part IV of this Report.
Item 9. Changes in and Disagreements with Accountants on Accounting and Financial Disclosure.
None.
Item 9A. Controls and Procedures.
We carried out an evaluation, under the supervision and with the participation of our Chief Executive Officer and Chief Financial Officer, of the effectiveness of the design and operation of our “disclosure controls and procedures” (as defined in Rules 13a-15(e) and 15d-15(e) under the Securities Exchange Act of 1934, as amended (the “Exchange Act”)), as of the end of the period covered by this Report. Based upon the evaluation, our Chief Executive Officer and Chief Financial Officer concluded that our disclosure controls and procedures were effective as of such date. Disclosure controls and procedures are designed to ensure that information required to be disclosed in our reports filed or submitted under the Exchange Act is recorded, processed, summarized and reported within the time periods specified in the Securities and Exchange Commission’s rules and forms.
There were no changes in our internal control over financial reporting during the three months ended December 31, 2007, that have materially affected, or are reasonably likely to materially affect, our internal control over financial reporting.
Management’s Report on Internal Control Over Financial Reporting
Our management is responsible for establishing and maintaining adequate internal control over financial reporting as such term is defined in Rule 13a-15(f) of the Exchange Act. Under the supervision and with the participation of our senior management, including our Chief Executive Officer and Chief Financial Officer, we assessed the effectiveness of our internal control over financial reporting as of December 31, 2007, using the criteria set forth in the Internal Control – Integrated Framework issued by the Committee of Sponsoring Organizations of the Treadway Commission (COSO). Based on this assessment, management has concluded that our internal control over financial reporting as of December 31, 2007 was effective. An assessment of the effectiveness of our internal control over financial reporting as of December 31, 2007 has been performed by Ernst & Young LLP, an independent registered public accounting firm. Ernst & Young LLP’s attestation report is included below.
Item 9B. Other Information.
None.
43
Report of Independent Registered Public Accounting Firm
The Board of Directors and Stockholders Cross Country Healthcare, Inc.
We have audited Cross Country Healthcare, Inc.’s internal control over financial reporting as of December 31, 2007, based on criteria established in Internal Control—Integrated Framework issued by the Committee of Sponsoring Organizations of the Treadway Commission (the COSO criteria). Cross Country Healthcare, Inc.’s management is responsible for maintaining effective internal control over financial reporting, and for its assessment of the effectiveness of internal control over financial reporting included in the accompanying Management’s Report on Internal Control Over Financial Reporting. Our responsibility is to express an opinion on the Company’s internal control over financial reporting based on our audit.
We conducted our audit in accordance with the standards of the Public Company Accounting Oversight Board (United States). Those standards require that we plan and perform the audit to obtain reasonable assurance about whether effective internal control over financial reporting was maintained in all material respects. Our audit included obtaining an understanding of internal control over financial reporting, assessing the risk that a material weakness exists, testing and evaluating the design and operating effectiveness of internal control based on the assessed risk, and performing such other procedures as we considered necessary in the circumstances. We believe that our audit provides a reasonable basis for our opinion.
A company’s internal control over financial reporting is a process designed to provide reasonable assurance regarding the reliability of financial reporting and the preparation of financial statements for external purposes in accordance with generally accepted accounting principles. A company’s internal control over financial reporting includes those policies and procedures that (1) pertain to the maintenance of records that, in reasonable detail, accurately and fairly reflect the transactions and dispositions of the assets of the company; (2) provide reasonable assurance that transactions are recorded as necessary to permit preparation of financial statements in accordance with generally accepted accounting principles, and that receipts and expenditures of the company are being made only in accordance with authorizations of management and directors of the company; and (3) provide reasonable assurance regarding prevention or timely detection of unauthorized acquisition, use, or disposition of the company’s assets that could have a material effect on the financial statements.
Because of its inherent limitations, internal control over financial reporting may not prevent or detect misstatements. Also, projections of any evaluation of effectiveness to future periods are subject to the risk that controls may become inadequate because of changes in conditions, or that the degree of compliance with the policies or procedures may deteriorate.
In our opinion, Cross Country Healthcare, Inc. maintained, in all material respects, effective internal control over financial reporting as of December 31, 2007, based on the COSO criteria.
We also have audited, in accordance with the standards of the Public Company Accounting Oversight Board (United States), the consolidated balance sheets of Cross Country Healthcare, Inc. as of December 31, 2007 and 2006, and the related consolidated statements of income, stockholders’ equity, and cash flows for each of the three years in the period ended December 31, 2007 of Cross Country Healthcare, Inc. and our report dated March 10, 2008 expressed an unqualified opinion thereon.
/s/ ERNST & YOUNG LLP
Certified Public Accountants West Palm Beach, Florida March 10, 2008
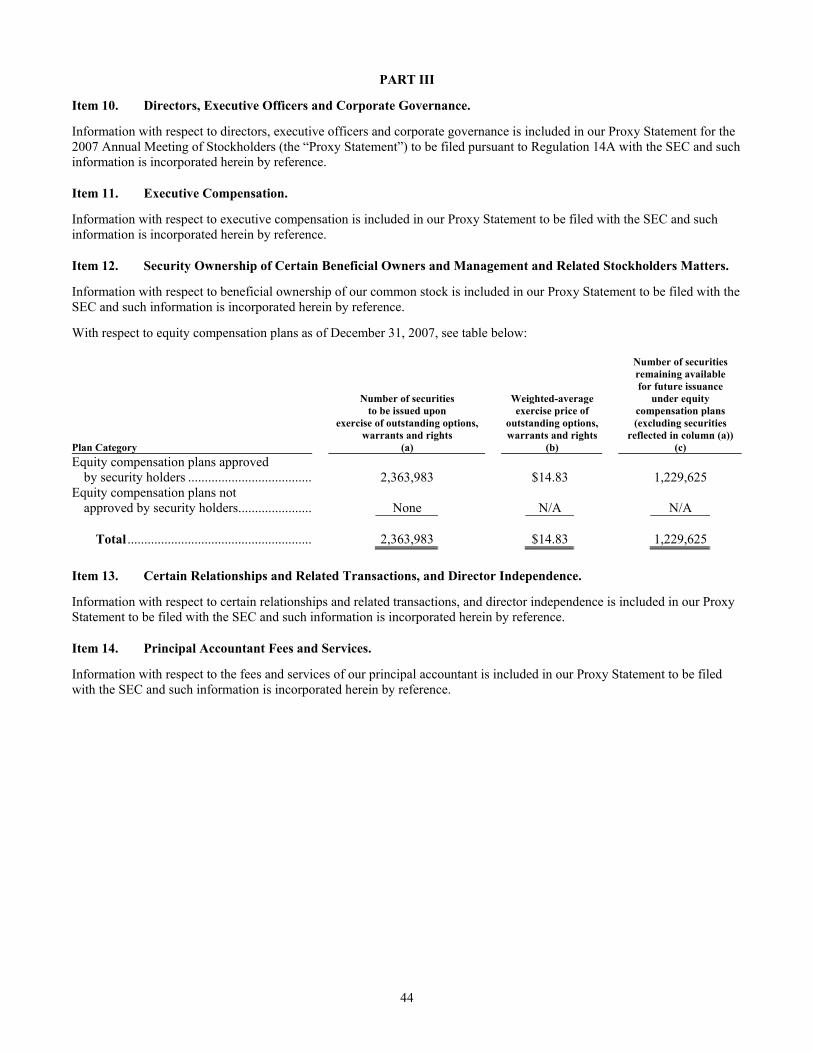
44
PART III
Item 10. Directors, Executive Officers and Corporate Governance.
Information with respect to directors, executive officers and corporate governance is included in our Proxy Statement for the 2007 Annual Meeting of Stockholders (the “Proxy Statement”) to be filed pursuant to Regulation 14A with the SEC and such information is incorporated herein by reference.
Item 11. Executive Compensation.
Information with respect to executive compensation is included in our Proxy Statement to be filed with the SEC and such information is incorporated herein by reference.
Item 12. Security Ownership of Certain Beneficial Owners and Management and Related Stockholders Matters.
Information with respect to beneficial ownership of our common stock is included in our Proxy Statement to be filed with the SEC and such information is incorporated herein by reference.
With respect to equity compensation plans as of December 31, 2007, see table below:
Plan Category
Number of securities to be issued upon
exercise of outstanding options, warrants and rights
(a)
Weighted-average exercise price of
outstanding options, warrants and rights
(b)
Number of securities remaining available for future issuance
under equity compensation plans (excluding securities
reflected in column (a)) (c)
Equity compensation plans approved by security holders ...................................... 2,363,983 $14.83 1,229,625
Equity compensation plans not approved by security holders....................... None N/A N/A
Total ........................................................ 2,363,983 $14.83 1,229,625
Item 13. Certain Relationships and Related Transactions, and Director Independence.
Information with respect to certain relationships and related transactions, and director independence is included in our Proxy Statement to be filed with the SEC and such information is incorporated herein by reference.
Item 14. Principal Accountant Fees and Services.
Information with respect to the fees and services of our principal accountant is included in our Proxy Statement to be filed with the SEC and such information is incorporated herein by reference.

45
PART IV
Item 15. Exhibits, Financial Statement Schedules.
(a) Documents filed as part of the report.
(1) Consolidated Financial Statements Report of Independent Registered Public Accounting Firm Consolidated Balance Sheets as of December 31, 2007 and 2006
Consolidated Statements of Income for the Years Ended
December 31, 2007, 2006 and 2005
Consolidated Statement of Changes in Stockholders’ Equity for the
Years Ended December 31, 2007, 2006 and 2005
Consolidated Statements of Cash Flows for the Years Ended
December 31, 2007, 2006 and 2005 Notes to Consolidated Financial Statements
(2) Financial Statements Schedule
Schedule II – Valuation and Qualifying Accounts for the Years Ended
December 31, 2007, 2006 and 2005
(3) Exhibits
See Exhibit Index immediately following signatures.

46
SIGNATURES
Pursuant to the requirements of Section 13 or 15(d) of the Securities Exchange Act of 1934, the Registrant has duly caused this Report to be signed on its behalf by the undersigned, thereunto duly authorized.
CROSS COUNTRY HEALTHCARE, INC. By: /s/ JOSEPH A. BOSHART Name: Joseph A. Boshart
Title: Chief Executive Officer and President Date: March 13, 2008
Pursuant to the requirements of the Securities Exchange Act of 1934, this Report has been signed by the following persons in the capacities indicated and on the dates indicated:
Signature Title Date
/s/ JOSEPH A. BOSHART March 13, 2008 Joseph A. Boshart
President, Chief Executive Officer, Director (Principal Executive Officer)
/s/ EMIL HENSEL March 13, 2008 Emil Hensel
Chief Financial Officer and Director (Principal Financial Officer)
/s/ DANIEL J. LEWIS Chief Accounting Officer March 13, 2008 Daniel J. Lewis
/s/ THOMAS C. DIRCKS Director March 13, 2008 Thomas C. Dircks
/s/ W. LARRY CASH Director March 13, 2008 W. Larry Cash
/s/ C. TAYLOr COLE Director March 13, 2008 C. Taylor Cole
/s/ GALE FITZGERALD Director March 13, 2008 Gale Fitzgerald
/s/ JOSEPH TRUNFIO Director March 13, 2008 Joseph Trunfio

47
EXHIBIT INDEX
No. Description 2.1 Cross Country Staffing Asset Purchase Agreement, dated June 24, 1999, by and among W. R. Grace & Co.-
Conn., a Connecticut corporation, Cross Country Staffing, a Delaware general partnership, and the Registrant, a Delaware corporation (1)
2.2 Agreement and Plan of Merger, dated as of October 29, 1999, by and among the Registrant, CCTC Acquisition, Inc. and Certain Stockholders of Cross Country Staffing, Inc. and TravCorps Corporation and the Stockholders of TravCorps Corporation (1)
2.3 Stock Purchase Agreement, dated as of December 15, 2000, by and between Edgewater Technology, Inc. and the Registrant (1)
2.4 Asset Purchase Agreement dated as of May 8, 2003, by and among Cross Country Nurses, Inc., the Registrant, Med-Staff, Inc., William G. Davis, Davis Family Electing Small Business Trust and Timothy Rodden (5)
2.5 Asset Purchase Agreement, dated as of July 13, 2006 by and among ARM Acquisition, inc., ARMS Acquisition, Inc., Metropolitan Research Associates, LLC, Metropolitan Research Staffing Associates, LLC, Patricia Daly and Stacy Mamakos Martin (11)
2.6 Share Purchase Agreement, dated June 6, 2007, among Cross Country Healthcare UK HoldCo Limited and Winston Paul John Evans, Susan Morag Evans and Cross Country Healthcare, Inc. (16)
2.7 Stock Purchase Agreement, dated July 13, 2007, among ClinForce LLC, the Stockholders of Assent Consulting and Cross Country Healthcare, Inc. (17)
3.1 Amended and Restated Certificate of Incorporation of the Registrant (1) 3.2 Amended and Restated By-laws of the Registrant (1) 4.1 Form of specimen common stock certificate (1) 4.2 Amended and Restated Stockholders Agreement, dated August 23, 2001, among the Registrant, a Delaware
corporation, the CEP Investors and the Investors (1) 4.3 Registration Rights Agreement, dated as of October 29, 1999, among the Registrant, a Delaware corporation,
and the CEP Investors and the MSDWCP Investors (1) 4.4 Amendment to the Registration Rights Agreement, dated as of August 23, 2001, among the Registrant, a
Delaware corporation, and the CEP Investors and the MSDWCP Investors (1) 4.5 Stockholders Agreement, dated as of August 23, 2001, among the Registrant, Joseph Boshart and Emil
Hensel and the Financial Investors (1) 10.1 Employment Agreement, dated as of June 24, 1999, between Joseph Boshart and the Registrant (1)(14) 10.2 Employment Agreement, dated as of June 24, 1999, between Emil Hensel and the Registrant (1)(14) 10.3 Employment Agreement, dated as of August 31, 2006, between Patricia Daly and ARM Acquisition,
Inc. (14) 10.4 Employment Agreement, dated as of August 31, 2006, between Stacy Mamakos Martin and ARM
Acquisition, Inc. (14) 10.5 Executive Service Agreement, dated June 6, 2007, between Akos Limited and Paul Evans (18) 10.6 Employment Agreement, dated July 13, 2007, between Assent Consulting and David Hnatek (18) 10.7 Employment Agreement, dated July 13, 2007, between Assent Consulting and Robert Adzich (18) 10.8 Lease Agreement, dated April 28, 1997, between Meridian Properties and the Registrant (1) 10.9 Lease Agreement, dated October 31, 2000, by and between Trustees of the Goldberg Brothers Trust, a
Massachusetts Nominee Trust and TVCM, Inc. (1) 10.10 222 Building Standard Office Lease between Clayton Investors Associates, LLC and Cejka & Company (1) 10.11 Amended and Restated 1999 Stock Option Plan of the Registrant (2)(14) 10.12 Amended and Restated Equity Participation Plan of the Registrant (2)(14) 10.13 Cross Country Healthcare, Inc. 2007 Stock Incentive Plan adopted April 5, 2007 (19) 10.14 Amendment to Lease by and between Meridian Commercial Properties Limited Partnership and Cross
Country, Inc. dated May 1, 2002 (3) 10.15 Cross Country, Inc. Deferred Compensation Plan (4)(14) 10.16 Restricted Stock Agreement between Company and Joseph A. Boshart (4)(14) 10.17 Restricted Stock Agreement between Company and Emil Hensel (4)(14)

48
EXHIBIT INDEX (CONTINUED)
No. Description 10.18 Restricted Stock Agreement between Company and Vickie Anenberg (4)(14) 10.19 Restricted Stock Agreement between Company and Jonathan Ward (4)(14) 10.20 Amendment to Lease Agreement, as of May 1, 2002, by and between Meridian Commercial Properties
Limited Partnership and Cross Country Healthcare, Inc. (3) 10.21 Lease Agreement by and between Edgewood General Partnership and HR Logic, dated July 6, 2000 (6) 10.22 First Amendment to Lease Agreement by and between Edgewood General Partnership and HR Logic, dated
December 7, 2000 (6) 10.23 Second Amendment to Lease Agreement by and between Edgewood General Partnership and Cross Country
TravCorps, dated April 29, 2002 (6) 10.24 Lease Agreement by and between Petula Associates, Ltd. and Principal Life Insurance Company and Clinical
Trials Support Services, Inc. dated November 3, 1999 (6) 10.25 First Amendment to Lease Agreement by and between Petula Associates, Ltd. and Principal Life Insurance
Company and Clinical Trials Support Services, Inc., dated December 20, 1999 (6) 10.26 Lease Agreement by and between Newtown Street Road Associates and Med-Staff, Inc., dated June 21,
2001 (6) 10.27 Lease Agreement by and between Newtown Street Road Associates and Med-Staff, Inc., dated June 23,
1998 (6) 10.28 Second Amendment to Lease, dated October 10, 2003, between Canterbury Hall IC, LLC and ClinForce,
Inc. (7) 10.29 Lease Agreement, dated January 30, 2004, between Goldberg Brothers Real Estate, LLC and TVCM, Inc. (7)10.30 First Amendment to Lease Agreement, dated December 11, 2001, between Clayton Investors Associates LLC
and Cejka & Company (8) 10.31 First Amendment to Lease Agreement, dated December 22, 1999, between Newtown Street Road Associates
and MedStaff, Inc. (8) 10.32 Second Amendment to Lease Agreement, dated June 21, 2001 between Newtown Street Road Associates and
MedStaff, Inc. (8) 10.33 Lease Agreement between Corporex Key Limited Partnership No. 8 and Cross Country Seminars, Inc. (8) 10.34 Form of Incentive Stock Option Agreement (8)(14) 10.35 Third Amendment to Lease, dated October 6, 2004, between Canterbury Hall IC, LLC and ClinForce,
Inc. (9) 10.36 First Amendment to Lease Agreement, dated February 24, 2005, between Blevens Family Storage, L.P., and
Cross Country Seminars, Inc. (10) 10.37 Fourth Amendment to Lease Agreement, dated December 15, 2005, by and between Canterbury Hall, IC,
LLC, and Clinforce, Inc. (13) 10.38 Lease Agreement, dated February 24, 2006, between MedStaff, Inc. and Campus Investors D Building,
L.P. (13) 10.39 Lease Guaranty Agreement by and between Cross Country Healthcare, Inc. and Campus Investors D
Building, L.P. dated February 17, 2006. (13) 10.40 Credit Agreement, dated November 10, 2005, with the Lenders referenced therein, and Wachovia Bank,
National Association, as Administrative Agent, Swingline Lender and Issuing Lender, General Electric Capital Corporation, as Syndication Agent, Bank of America, N.A., as Co-Documentation Agent, LaSalle Bank National Association, as Co-Documentation Agent, and Wachovia Capital Markets, LLC, as Sole Lead Arranger and Sole Book Manager (13)
10.41 Subsidiary Guarantee Agreement, dated as of November 10, 2005, by and among certain subsidiaries of Cross Country Healthcare, Inc., as Subsidiary Guarantors in favor of Wachovia Bank, National Association, as Administrative Agent (13)
10.42 Collateral Agreement, dated as of November 10, 2005, by and among Cross Country Healthcare, Inc. and certain of its subsidiaries as grantors, in favor of Wachovia Bank, National Association, as Administrative Agent (13)
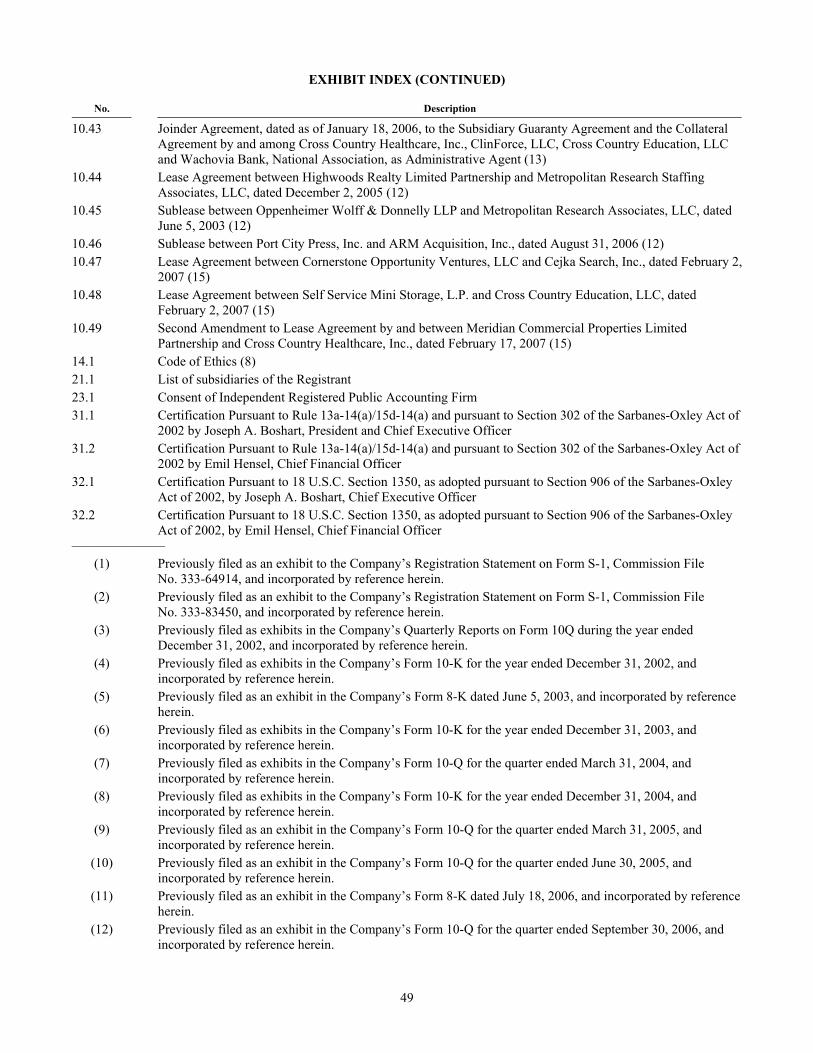
49
EXHIBIT INDEX (CONTINUED)
No. Description 10.43 Joinder Agreement, dated as of January 18, 2006, to the Subsidiary Guaranty Agreement and the Collateral
Agreement by and among Cross Country Healthcare, Inc., ClinForce, LLC, Cross Country Education, LLC and Wachovia Bank, National Association, as Administrative Agent (13)
10.44 Lease Agreement between Highwoods Realty Limited Partnership and Metropolitan Research Staffing Associates, LLC, dated December 2, 2005 (12)
10.45 Sublease between Oppenheimer Wolff & Donnelly LLP and Metropolitan Research Associates, LLC, dated June 5, 2003 (12)
10.46 Sublease between Port City Press, Inc. and ARM Acquisition, Inc., dated August 31, 2006 (12) 10.47 Lease Agreement between Cornerstone Opportunity Ventures, LLC and Cejka Search, Inc., dated February 2,
2007 (15) 10.48 Lease Agreement between Self Service Mini Storage, L.P. and Cross Country Education, LLC, dated
February 2, 2007 (15) 10.49 Second Amendment to Lease Agreement by and between Meridian Commercial Properties Limited
Partnership and Cross Country Healthcare, Inc., dated February 17, 2007 (15) 14.1 Code of Ethics (8) 21.1 List of subsidiaries of the Registrant 23.1 Consent of Independent Registered Public Accounting Firm 31.1 Certification Pursuant to Rule 13a-14(a)/15d-14(a) and pursuant to Section 302 of the Sarbanes-Oxley Act of
2002 by Joseph A. Boshart, President and Chief Executive Officer 31.2 Certification Pursuant to Rule 13a-14(a)/15d-14(a) and pursuant to Section 302 of the Sarbanes-Oxley Act of
2002 by Emil Hensel, Chief Financial Officer 32.1 Certification Pursuant to 18 U.S.C. Section 1350, as adopted pursuant to Section 906 of the Sarbanes-Oxley
Act of 2002, by Joseph A. Boshart, Chief Executive Officer 32.2 Certification Pursuant to 18 U.S.C. Section 1350, as adopted pursuant to Section 906 of the Sarbanes-Oxley
Act of 2002, by Emil Hensel, Chief Financial Officer ———————
(1) Previously filed as an exhibit to the Company’s Registration Statement on Form S-1, Commission File No. 333-64914, and incorporated by reference herein.
(2) Previously filed as an exhibit to the Company’s Registration Statement on Form S-1, Commission File No. 333-83450, and incorporated by reference herein.
(3) Previously filed as exhibits in the Company’s Quarterly Reports on Form 10Q during the year ended December 31, 2002, and incorporated by reference herein.
(4) Previously filed as exhibits in the Company’s Form 10-K for the year ended December 31, 2002, and incorporated by reference herein.
(5) Previously filed as an exhibit in the Company’s Form 8-K dated June 5, 2003, and incorporated by reference herein.
(6) Previously filed as exhibits in the Company’s Form 10-K for the year ended December 31, 2003, and incorporated by reference herein.
(7) Previously filed as exhibits in the Company’s Form 10-Q for the quarter ended March 31, 2004, and incorporated by reference herein.
(8) Previously filed as exhibits in the Company’s Form 10-K for the year ended December 31, 2004, and incorporated by reference herein.
(9) Previously filed as an exhibit in the Company’s Form 10-Q for the quarter ended March 31, 2005, and incorporated by reference herein.
(10) Previously filed as an exhibit in the Company’s Form 10-Q for the quarter ended June 30, 2005, and incorporated by reference herein.
(11) Previously filed as an exhibit in the Company’s Form 8-K dated July 18, 2006, and incorporated by reference herein.
(12) Previously filed as an exhibit in the Company’s Form 10-Q for the quarter ended September 30, 2006, and incorporated by reference herein.

50
EXHIBIT INDEX (CONTINUED)
(13) Previously filed as exhibits in the Company’s Form 10-K for the year ended December 31, 2005, and incorporated by reference herein.
(14) Management contract or compensatory plan or arrangement. (15) Previously filed as exhibits in the Company’s Form 10-K for the year ended December 31, 2006, and
incorporated by reference herein. (16) Previously filed as exhibit in the Company’s Form 8-K dated June 12, 2007, and incorporated by reference
herein. (17) Previously filed as exhibit in the Company’s Form 8-K dated July 9, 2007, and incorporated by reference
herein. (18) Previously filed as exhibit in the Company’s Form 10-Q dated August 9, 2007, and incorporated by reference
herein. (19) Previously filed as exhibit in the Company’s Form 8-K dated October 15, 2007, and incorporated by
reference herein.

F-1
INDEX TO CONSOLIDATED FINANCIAL STATEMENTS
Page
Cross Country Healthcare, Inc. Report of Independent Registered Public Accounting Firm ....................................................................................... F-2 Consolidated Balance Sheets as of December 31, 2007 and 2006 ............................................................................. F-3
Consolidated Statements of Income for the Years Ended December 31, 2007, 2006 and 2005 .......................................................................................................................... F-4
Consolidated Statement of Changes in Stockholders’ Equity for the Years Ended December 31, 2007, 2006 and 2005 ..................................................................................................... F-5
Consolidated Statements of Cash Flows for the Years Ended December 31, 2007, 2006 and 2005 .......................................................................................................................... F-6
Notes to Consolidated Financial Statements .............................................................................................................. F-7 Financial Statements Schedule
Schedule II – Valuation and Qualifying Accounts for the Years Ended December 31, 2007, 2006 and 2005 ..........................................................................................................................
II-1
Schedules not filed herewith are either not applicable, the information is not material or the information is set forth in the consolidated financial statements or notes thereto.

F-2
REPORT OF INDEPENDENT REGISTERED PUBLIC ACCOUNTING FIRM
The Board of Directors and Stockholders Cross Country Healthcare, Inc.
We have audited the accompanying consolidated balance sheets of Cross Country Healthcare, Inc. as of December 31, 2007 and 2006, and the related consolidated statements of income, changes in stockholders’ equity and cash flows for each of the three years in the period ended December 31, 2007. Our audits also included the financial statement schedule listed in the index at Item 15. These financial statements and schedule are the responsibility of the Company’s management. Our responsibility is to express an opinion on these financial statements based on our audits.
We conducted our audits in accordance with the standards of the Public Company Accounting Oversight Board (United States). Those standards require that we plan and perform the audit to obtain reasonable assurance about whether the financial statements are free of material misstatement. An audit includes examining, on a test basis, evidence supporting the amounts and disclosures in the financial statements. An audit also includes assessing the accounting principles used and significant estimates made by management, as well as evaluating the overall financial statement presentation. We believe that our audits provide a reasonable basis for our opinion.
In our opinion, the financial statements referred to above present fairly, in all material respects, the consolidated financial position of Cross Country Healthcare, Inc. at December 31, 2007 and 2006, and the consolidated results of its operations and its cash flows for each of the three years in the period ended December 31, 2007, in conformity with U.S. generally accepted accounting principles. Also, in our opinion, the related financial statement schedule, when considered in relation to the basic financial statements taken as a whole, presents fairly, in all material respects, the information set forth therein.
As discussed in Note 12 to the consolidated financial statements, in 2006 the Company adopted Statement of Financial Accounting Standards No. 123(revised 2004), Share-Based Payment. Additionally, as discussed in Note 11 to the consolidated financial statements, effective January 1, 2007, the Company adopted the provisions of Financial Accounting Standards Board Interpretation No. 48, Accounting for Uncertainty in Income Taxes, an Interpretation of FASB Statement No. 109.
We also have audited, in accordance with the standards of the Public Company Accounting Oversight Board (United States), Cross Country Healthcare, Inc.’s internal control over financial reporting as of December 31, 2007, based on criteria established in Internal Control-Integrated Framework issued by the Committee of Sponsoring Organizations of the Treadway Commission and our report dated March 10, 2008 expressed an unqualified opinion thereon. /s/ ERNST & YOUNG LLP Certified Public Accountants West Palm Beach, Florida March 10, 2008
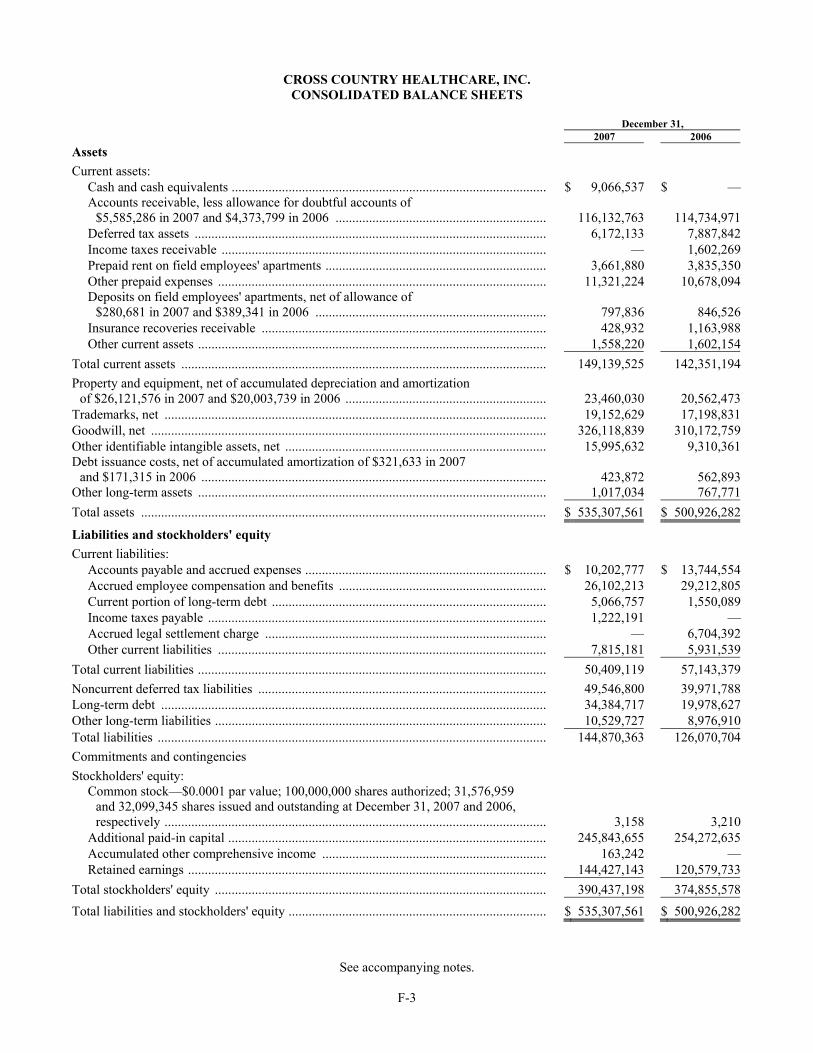
See accompanying notes.
F-3
CROSS COUNTRY HEALTHCARE, INC. CONSOLIDATED BALANCE SHEETS
December 31, 2007 2006 Assets Current assets:
Cash and cash equivalents .............................................................................................. $ 9,066,537 $ —Accounts receivable, less allowance for doubtful accounts of
$5,585,286 in 2007 and $4,373,799 in 2006 ...............................................................
116,132,763 114,734,971Deferred tax assets ......................................................................................................... 6,172,133 7,887,842Income taxes receivable ................................................................................................. — 1,602,269Prepaid rent on field employees' apartments .................................................................. 3,661,880 3,835,350Other prepaid expenses .................................................................................................. 11,321,224 10,678,094Deposits on field employees' apartments, net of allowance of
$280,681 in 2007 and $389,341 in 2006 .....................................................................
797,836 846,526Insurance recoveries receivable ..................................................................................... 428,932 1,163,988Other current assets ........................................................................................................ 1,558,220 1,602,154
Total current assets ............................................................................................................. 149,139,525 142,351,194Property and equipment, net of accumulated depreciation and amortization
of $26,121,576 in 2007 and $20,003,739 in 2006 ............................................................
23,460,030
20,562,473Trademarks, net .................................................................................................................. 19,152,629 17,198,831Goodwill, net ...................................................................................................................... 326,118,839 310,172,759Other identifiable intangible assets, net .............................................................................. 15,995,632 9,310,361Debt issuance costs, net of accumulated amortization of $321,633 in 2007
and $171,315 in 2006 .......................................................................................................
423,872 562,893Other long-term assets ........................................................................................................ 1,017,034 767,771Total assets ......................................................................................................................... $ 535,307,561 $ 500,926,282
Liabilities and stockholders' equity Current liabilities:
Accounts payable and accrued expenses ........................................................................ $ 10,202,777 $ 13,744,554Accrued employee compensation and benefits .............................................................. 26,102,213 29,212,805Current portion of long-term debt .................................................................................. 5,066,757 1,550,089Income taxes payable ..................................................................................................... 1,222,191 —Accrued legal settlement charge .................................................................................... — 6,704,392Other current liabilities .................................................................................................. 7,815,181 5,931,539
Total current liabilities ........................................................................................................ 50,409,119 57,143,379Noncurrent deferred tax liabilities ...................................................................................... 49,546,800 39,971,788Long-term debt ................................................................................................................... 34,384,717 19,978,627Other long-term liabilities ................................................................................................... 10,529,727 8,976,910Total liabilities .................................................................................................................... 144,870,363 126,070,704Commitments and contingencies Stockholders' equity:
Common stock—$0.0001 par value; 100,000,000 shares authorized; 31,576,959 and 32,099,345 shares issued and outstanding at December 31, 2007 and 2006, respectively ..................................................................................................................
3,158 3,210Additional paid-in capital ............................................................................................... 245,843,655 254,272,635Accumulated other comprehensive income ................................................................... 163,242 —Retained earnings ........................................................................................................... 144,427,143 120,579,733
Total stockholders' equity ................................................................................................... 390,437,198 374,855,578Total liabilities and stockholders' equity ............................................................................. $ 535,307,561 $ 500,926,282

See accompanying notes.
F-4
CROSS COUNTRY HEALTHCARE, INC. CONSOLIDATED STATEMENTS OF INCOME
Year ended December 31, 2007 2006 2005 Revenue from services .................................................................. $ 718,272,469 $ 655,151,931 $ 645,392,586Operating expenses:
Direct operating expenses ........................................................ 543,608,163 502,467,737 503,102,978Selling, general and administrative expenses ........................... 122,692,133 110,172,095 104,647,101Bad debt expense ..................................................................... 1,558,626 459,368 1,176,840Depreciation ............................................................................. 6,309,538 5,448,441 5,158,513Amortization ............................................................................ 2,051,311 1,570,005 1,423,629Legal settlement charge ........................................................... 33,654 6,704,392 —Secondary offering costs .......................................................... — 153,450 150,707
Total operating expenses ..................................................... 676,253,425 626,975,488 615,659,768 Income from operations ................................................................ 42,019,044 28,176,443 29,732,818Other expenses:
Foreign exchange loss .............................................................. 92,937 — —Interest expense, net ................................................................. 2,587,398 1,464,223 3,457,579Loss on early extinguishment of debt ...................................... — — 1,359,394
Income from continuing operations before income taxes ............. 39,338,709 26,712,220 24,915,845Income tax expense ....................................................................... (14,759,200) (10,145,868) (9,575,426)Income from continuing operations .............................................. 24,579,509 16,566,352 15,340,419Discontinued operations, net of income taxes:
Income (loss) from discontinued operations ............................ — 70,037 (588,033)Net income .................................................................................... $ 24,579,509 $ 16,636,389 $ 14,752,386 Net income (loss) per common share—basic:
Income from continuing operations ......................................... $ 0.77 $ 0.52 $ 0.48Discontinued operations ........................................................... — 0.00 (0.02)
Net income .................................................................................... $ 0.77 $ 0.52 $ 0.46 Net income (loss) per common share—diluted:
Income from continuing operations ......................................... $ 0.76 $ 0.51 $ 0.47Discontinued operations ........................................................... — 0.00 (0.02)
Net income .................................................................................... $ 0.76 $ 0.51 $ 0.45 Weighted average common shares outstanding—basic ................ 31,972,681 32,077,240 32,228,978 Weighted average common shares outstanding—diluted ............. 32,484,241 32,737,419 32,773,634
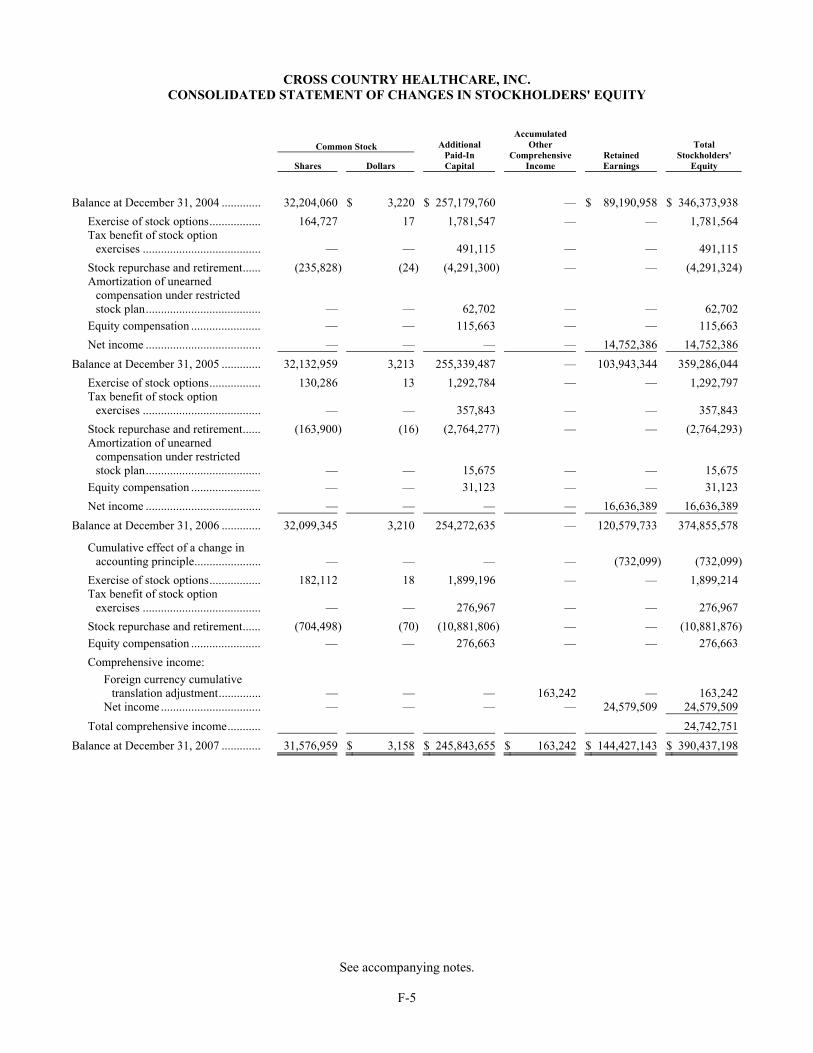
See accompanying notes.
F-5
CROSS COUNTRY HEALTHCARE, INC. CONSOLIDATED STATEMENT OF CHANGES IN STOCKHOLDERS' EQUITY
Common Stock Shares Dollars
Additional Paid-In Capital
AccumulatedOther
Comprehensive Income
Retained Earnings
Total Stockholders'
Equity Balance at December 31, 2004 ............. 32,204,060 $ 3,220 $ 257,179,760 — $ 89,190,958 $ 346,373,938
Exercise of stock options................. 164,727 17 1,781,547 — — 1,781,564Tax benefit of stock option
exercises ....................................... — — 491,115 — — 491,115Stock repurchase and retirement...... (235,828) (24) (4,291,300) — — (4,291,324)Amortization of unearned
compensation under restricted stock plan...................................... — — 62,702 — — 62,702
Equity compensation ....................... — — 115,663 — — 115,663Net income ...................................... — — — — 14,752,386 14,752,386
Balance at December 31, 2005 ............. 32,132,959 3,213 255,339,487 — 103,943,344 359,286,044Exercise of stock options................. 130,286 13 1,292,784 — — 1,292,797Tax benefit of stock option
exercises ....................................... — — 357,843 — — 357,843Stock repurchase and retirement...... (163,900) (16) (2,764,277) — — (2,764,293)Amortization of unearned
compensation under restricted stock plan...................................... — — 15,675 — — 15,675
Equity compensation ....................... — — 31,123 — — 31,123Net income ...................................... — — — — 16,636,389 16,636,389
Balance at December 31, 2006 ............. 32,099,345 3,210 254,272,635 — 120,579,733 374,855,578
Cumulative effect of a change in accounting principle...................... — — — — (732,099) (732,099)
Exercise of stock options................. 182,112 18 1,899,196 — — 1,899,214Tax benefit of stock option
exercises ....................................... — — 276,967 — — 276,967Stock repurchase and retirement...... (704,498) (70) (10,881,806) — — (10,881,876)Equity compensation ....................... — — 276,663 — — 276,663Comprehensive income:
Foreign currency cumulative translation adjustment.............. — — — 163,242 — 163,242
Net income ................................. — — — — 24,579,509 24,579,509Total comprehensive income........... 24,742,751
Balance at December 31, 2007 ............. 31,576,959 $ 3,158 $ 245,843,655 $ 163,242 $ 144,427,143 $ 390,437,198
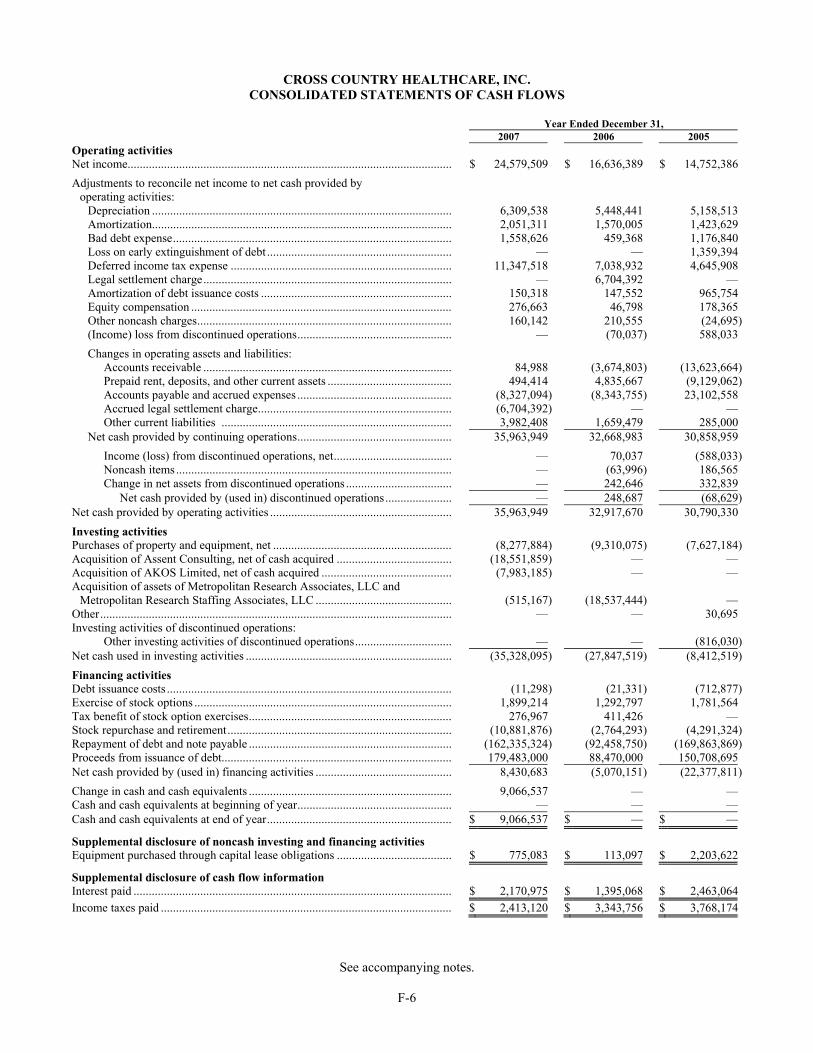
See accompanying notes.
F-6
CROSS COUNTRY HEALTHCARE, INC. CONSOLIDATED STATEMENTS OF CASH FLOWS
Year Ended December 31, 2007 2006 2005 Operating activities Net income........................................................................................................... $ 24,579,509 $ 16,636,389 $ 14,752,386Adjustments to reconcile net income to net cash provided by
operating activities: Depreciation ................................................................................................... 6,309,538 5,448,441 5,158,513Amortization................................................................................................... 2,051,311 1,570,005 1,423,629Bad debt expense............................................................................................ 1,558,626 459,368 1,176,840Loss on early extinguishment of debt ............................................................. — — 1,359,394Deferred income tax expense ......................................................................... 11,347,518 7,038,932 4,645,908Legal settlement charge.................................................................................. — 6,704,392 —Amortization of debt issuance costs ............................................................... 150,318 147,552 965,754Equity compensation ...................................................................................... 276,663 46,798 178,365Other noncash charges.................................................................................... 160,142 210,555 (24,695)(Income) loss from discontinued operations................................................... — (70,037) 588,033Changes in operating assets and liabilities:
Accounts receivable .................................................................................. 84,988 (3,674,803) (13,623,664)Prepaid rent, deposits, and other current assets ......................................... 494,414 4,835,667 (9,129,062)Accounts payable and accrued expenses ................................................... (8,327,094) (8,343,755) 23,102,558Accrued legal settlement charge................................................................ (6,704,392) — —Other current liabilities ............................................................................ 3,982,408 1,659,479 285,000
Net cash provided by continuing operations................................................... 35,963,949 32,668,983 30,858,959Income (loss) from discontinued operations, net....................................... — 70,037 (588,033)Noncash items ........................................................................................... — (63,996) 186,565Change in net assets from discontinued operations ................................... — 242,646 332,839
Net cash provided by (used in) discontinued operations...................... — 248,687 (68,629)Net cash provided by operating activities ............................................................ 35,963,949 32,917,670 30,790,330Investing activities Purchases of property and equipment, net ........................................................... (8,277,884) (9,310,075) (7,627,184)Acquisition of Assent Consulting, net of cash acquired ...................................... (18,551,859) — —Acquisition of AKOS Limited, net of cash acquired ........................................... (7,983,185) — —Acquisition of assets of Metropolitan Research Associates, LLC and
Metropolitan Research Staffing Associates, LLC ............................................. (515,167) (18,537,444) —Other.................................................................................................................... — — 30,695Investing activities of discontinued operations:
Other investing activities of discontinued operations................................ — — (816,030)Net cash used in investing activities .................................................................... (35,328,095) (27,847,519) (8,412,519)Financing activities Debt issuance costs .............................................................................................. (11,298) (21,331) (712,877)Exercise of stock options ..................................................................................... 1,899,214 1,292,797 1,781,564Tax benefit of stock option exercises................................................................... 276,967 411,426 —Stock repurchase and retirement.......................................................................... (10,881,876) (2,764,293) (4,291,324)Repayment of debt and note payable ................................................................... (162,335,324) (92,458,750) (169,863,869)Proceeds from issuance of debt............................................................................ 179,483,000 88,470,000 150,708,695Net cash provided by (used in) financing activities ............................................. 8,430,683 (5,070,151) (22,377,811)Change in cash and cash equivalents ................................................................... 9,066,537 — —Cash and cash equivalents at beginning of year................................................... — — —Cash and cash equivalents at end of year............................................................. $ 9,066,537 $ — $ —
Supplemental disclosure of noncash investing and financing activities Equipment purchased through capital lease obligations ...................................... $ 775,083 $ 113,097 $ 2,203,622
Supplemental disclosure of cash flow information Interest paid ......................................................................................................... $ 2,170,975 $ 1,395,068 $ 2,463,064Income taxes paid ................................................................................................ $ 2,413,120 $ 3,343,756 $ 3,768,174
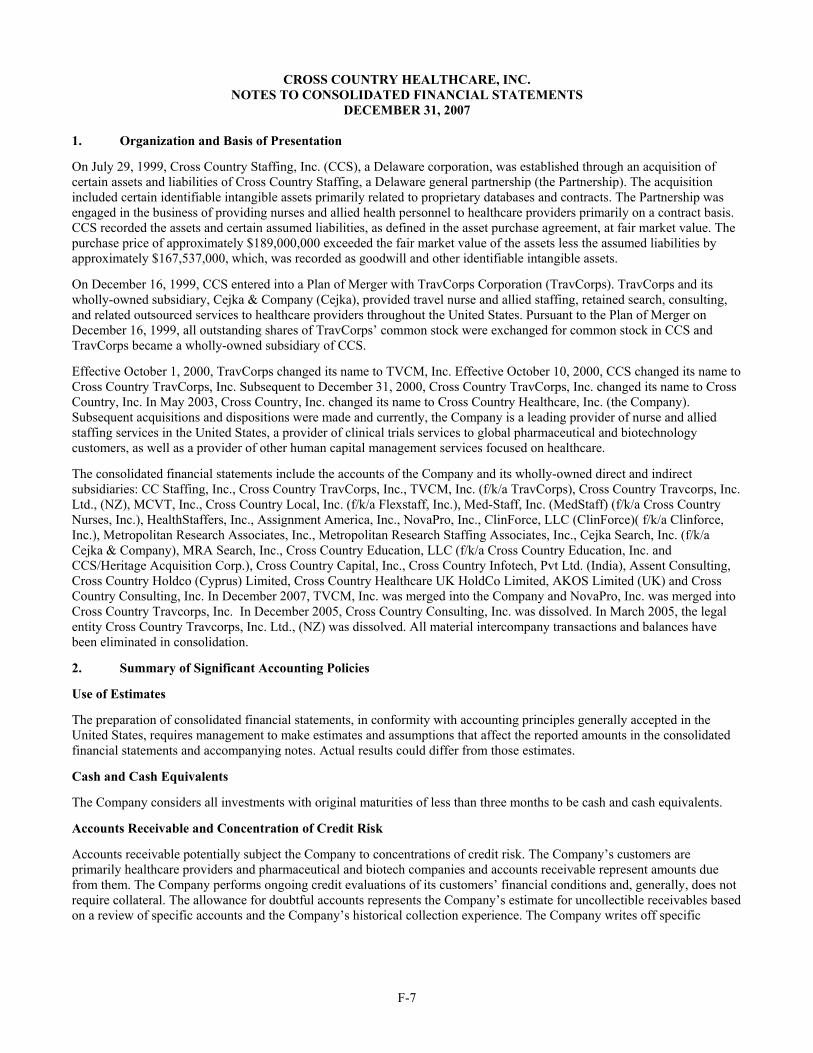
F-7
CROSS COUNTRY HEALTHCARE, INC. NOTES TO CONSOLIDATED FINANCIAL STATEMENTS
DECEMBER 31, 2007
1. Organization and Basis of Presentation
On July 29, 1999, Cross Country Staffing, Inc. (CCS), a Delaware corporation, was established through an acquisition of certain assets and liabilities of Cross Country Staffing, a Delaware general partnership (the Partnership). The acquisition included certain identifiable intangible assets primarily related to proprietary databases and contracts. The Partnership was engaged in the business of providing nurses and allied health personnel to healthcare providers primarily on a contract basis. CCS recorded the assets and certain assumed liabilities, as defined in the asset purchase agreement, at fair market value. The purchase price of approximately $189,000,000 exceeded the fair market value of the assets less the assumed liabilities by approximately $167,537,000, which, was recorded as goodwill and other identifiable intangible assets.
On December 16, 1999, CCS entered into a Plan of Merger with TravCorps Corporation (TravCorps). TravCorps and its wholly-owned subsidiary, Cejka & Company (Cejka), provided travel nurse and allied staffing, retained search, consulting, and related outsourced services to healthcare providers throughout the United States. Pursuant to the Plan of Merger on December 16, 1999, all outstanding shares of TravCorps’ common stock were exchanged for common stock in CCS and TravCorps became a wholly-owned subsidiary of CCS.
Effective October 1, 2000, TravCorps changed its name to TVCM, Inc. Effective October 10, 2000, CCS changed its name to Cross Country TravCorps, Inc. Subsequent to December 31, 2000, Cross Country TravCorps, Inc. changed its name to Cross Country, Inc. In May 2003, Cross Country, Inc. changed its name to Cross Country Healthcare, Inc. (the Company). Subsequent acquisitions and dispositions were made and currently, the Company is a leading provider of nurse and allied staffing services in the United States, a provider of clinical trials services to global pharmaceutical and biotechnology customers, as well as a provider of other human capital management services focused on healthcare.
The consolidated financial statements include the accounts of the Company and its wholly-owned direct and indirect subsidiaries: CC Staffing, Inc., Cross Country TravCorps, Inc., TVCM, Inc. (f/k/a TravCorps), Cross Country Travcorps, Inc. Ltd., (NZ), MCVT, Inc., Cross Country Local, Inc. (f/k/a Flexstaff, Inc.), Med-Staff, Inc. (MedStaff) (f/k/a Cross Country Nurses, Inc.), HealthStaffers, Inc., Assignment America, Inc., NovaPro, Inc., ClinForce, LLC (ClinForce)( f/k/a Clinforce, Inc.), Metropolitan Research Associates, Inc., Metropolitan Research Staffing Associates, Inc., Cejka Search, Inc. (f/k/a Cejka & Company), MRA Search, Inc., Cross Country Education, LLC (f/k/a Cross Country Education, Inc. and CCS/Heritage Acquisition Corp.), Cross Country Capital, Inc., Cross Country Infotech, Pvt Ltd. (India), Assent Consulting, Cross Country Holdco (Cyprus) Limited, Cross Country Healthcare UK HoldCo Limited, AKOS Limited (UK) and Cross Country Consulting, Inc. In December 2007, TVCM, Inc. was merged into the Company and NovaPro, Inc. was merged into Cross Country Travcorps, Inc. In December 2005, Cross Country Consulting, Inc. was dissolved. In March 2005, the legal entity Cross Country Travcorps, Inc. Ltd., (NZ) was dissolved. All material intercompany transactions and balances have been eliminated in consolidation.
2. Summary of Significant Accounting Policies
Use of Estimates
The preparation of consolidated financial statements, in conformity with accounting principles generally accepted in the United States, requires management to make estimates and assumptions that affect the reported amounts in the consolidated financial statements and accompanying notes. Actual results could differ from those estimates.
Cash and Cash Equivalents
The Company considers all investments with original maturities of less than three months to be cash and cash equivalents.
Accounts Receivable and Concentration of Credit Risk
Accounts receivable potentially subject the Company to concentrations of credit risk. The Company’s customers are primarily healthcare providers and pharmaceutical and biotech companies and accounts receivable represent amounts due from them. The Company performs ongoing credit evaluations of its customers’ financial conditions and, generally, does not require collateral. The allowance for doubtful accounts represents the Company’s estimate for uncollectible receivables based on a review of specific accounts and the Company’s historical collection experience. The Company writes off specific
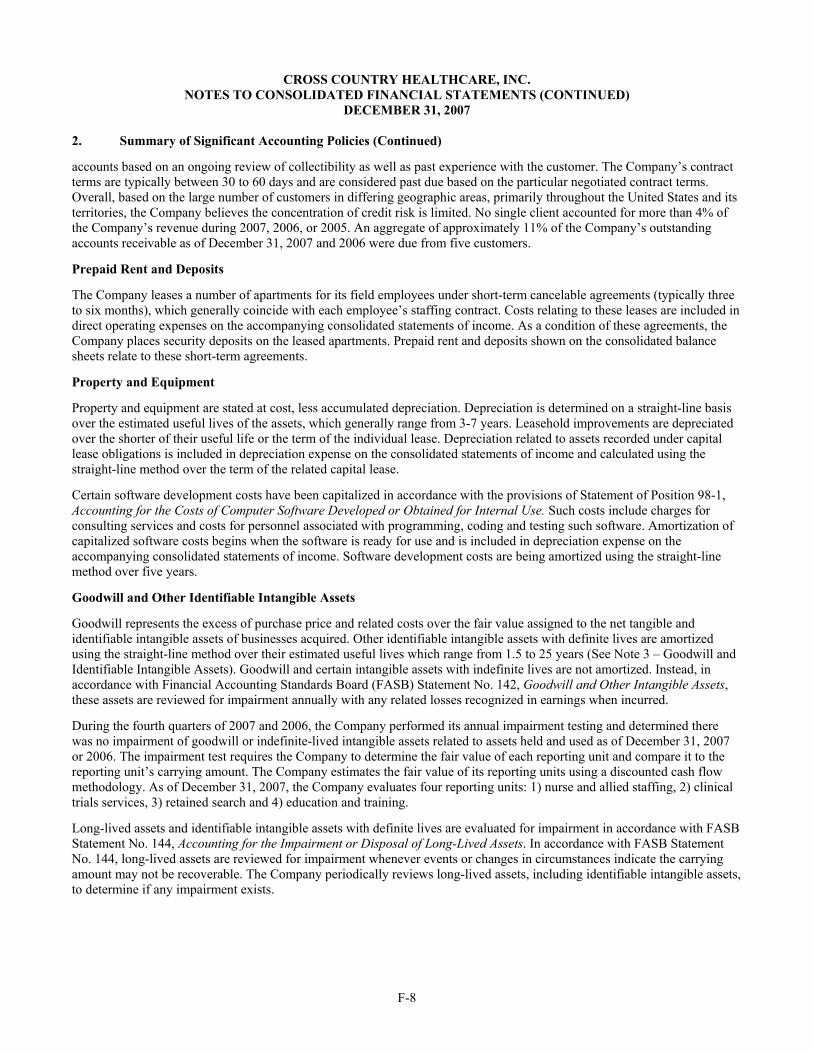
CROSS COUNTRY HEALTHCARE, INC. NOTES TO CONSOLIDATED FINANCIAL STATEMENTS (CONTINUED)
DECEMBER 31, 2007
F-8
2. Summary of Significant Accounting Policies (Continued)
accounts based on an ongoing review of collectibility as well as past experience with the customer. The Company’s contract terms are typically between 30 to 60 days and are considered past due based on the particular negotiated contract terms. Overall, based on the large number of customers in differing geographic areas, primarily throughout the United States and its territories, the Company believes the concentration of credit risk is limited. No single client accounted for more than 4% of the Company’s revenue during 2007, 2006, or 2005. An aggregate of approximately 11% of the Company’s outstanding accounts receivable as of December 31, 2007 and 2006 were due from five customers.
Prepaid Rent and Deposits
The Company leases a number of apartments for its field employees under short-term cancelable agreements (typically three to six months), which generally coincide with each employee’s staffing contract. Costs relating to these leases are included in direct operating expenses on the accompanying consolidated statements of income. As a condition of these agreements, the Company places security deposits on the leased apartments. Prepaid rent and deposits shown on the consolidated balance sheets relate to these short-term agreements.
Property and Equipment
Property and equipment are stated at cost, less accumulated depreciation. Depreciation is determined on a straight-line basis over the estimated useful lives of the assets, which generally range from 3-7 years. Leasehold improvements are depreciated over the shorter of their useful life or the term of the individual lease. Depreciation related to assets recorded under capital lease obligations is included in depreciation expense on the consolidated statements of income and calculated using the straight-line method over the term of the related capital lease.
Certain software development costs have been capitalized in accordance with the provisions of Statement of Position 98-1, Accounting for the Costs of Computer Software Developed or Obtained for Internal Use. Such costs include charges for consulting services and costs for personnel associated with programming, coding and testing such software. Amortization of capitalized software costs begins when the software is ready for use and is included in depreciation expense on the accompanying consolidated statements of income. Software development costs are being amortized using the straight-line method over five years.
Goodwill and Other Identifiable Intangible Assets
Goodwill represents the excess of purchase price and related costs over the fair value assigned to the net tangible and identifiable intangible assets of businesses acquired. Other identifiable intangible assets with definite lives are amortized using the straight-line method over their estimated useful lives which range from 1.5 to 25 years (See Note 3 – Goodwill and Identifiable Intangible Assets). Goodwill and certain intangible assets with indefinite lives are not amortized. Instead, in accordance with Financial Accounting Standards Board (FASB) Statement No. 142, Goodwill and Other Intangible Assets, these assets are reviewed for impairment annually with any related losses recognized in earnings when incurred.
During the fourth quarters of 2007 and 2006, the Company performed its annual impairment testing and determined there was no impairment of goodwill or indefinite-lived intangible assets related to assets held and used as of December 31, 2007 or 2006. The impairment test requires the Company to determine the fair value of each reporting unit and compare it to the reporting unit’s carrying amount. The Company estimates the fair value of its reporting units using a discounted cash flow methodology. As of December 31, 2007, the Company evaluates four reporting units: 1) nurse and allied staffing, 2) clinical trials services, 3) retained search and 4) education and training.
Long-lived assets and identifiable intangible assets with definite lives are evaluated for impairment in accordance with FASB Statement No. 144, Accounting for the Impairment or Disposal of Long-Lived Assets. In accordance with FASB Statement No. 144, long-lived assets are reviewed for impairment whenever events or changes in circumstances indicate the carrying amount may not be recoverable. The Company periodically reviews long-lived assets, including identifiable intangible assets, to determine if any impairment exists.
CROSS COUNTRY HEALTHCARE, INC. NOTES TO CONSOLIDATED FINANCIAL STATEMENTS (CONTINUED)
DECEMBER 31, 2007
F-9
2. Summary of Significant Accounting Policies (Continued)
Recoverability of intangible assets is measured by comparison of the carrying amount of the asset to net future cash flows expected to be generated from the asset. At December 31, 2007 and 2006, the Company believes no impairment of long-lived assets or identifiable intangible assets existed.
Reserves for Claims
Workers’ compensation, professional liability and health care benefits are provided under partially self-insured plans. The Company provides its eligible temporary healthcare professionals with individual professional liability insurance policies. The Company records its estimate of the ultimate cost of, and reserves for, workers’ compensation and professional liability benefits based on internally prepared actuarial models reviewed by an independent actuary using the Company’s loss history as well as industry statistics. Furthermore, in determining its reserves, the Company includes reserves for estimated claims incurred but not reported. The health care insurance accrual is for claims that have occurred but have not been reported and is based on the Company’s historical claim submission patterns. The ultimate cost of workers’ compensation, professional liability and health insurance costs will depend on actual costs incurred to settle the claims and may differ from the amounts reserved by the Company for those claims.
The workers’ compensation insurance carrier requires the Company to fund a reserve for payment of claims. These funds are maintained by the insurance carrier. The Company had approximately $6,719,000 and $5,541,000 recorded as prepaid workers’ compensation expense included in other prepaid expenses on the consolidated balance sheets at December 31, 2007 and 2006, respectively.
Effective October 2004, the Company implemented individual occurrence-based professional liability insurance policies with no deductible, for virtually all of its working nurses, other than those employed through its MedStaff subsidiary. This coverage substantially replaced a $2,000,000 per-claim layer of self-insured exposure. For its remaining working nurses and other healthcare professionals, the Company provides primary coverage through insurance policies that contain various self-insured retention layers, as well as coverage related to other risks, such as negligent hiring. Separately, the Company’s MedStaff subsidiary has a claims-made professional liability policy with a limit of $2,000,000 per occurrence, $4,000,000 in the aggregate and a $25,000 deductible. Subject to certain limitations, the Company also has up to $5,000,000 in umbrella liability insurance coverage, after the individual policies, MedStaff’s policy and the $2,000,000 self-insured primary coverage have been exhausted.
In August 2002, the Company changed its professional and general liability policy to include a self-insured limit of $2,000,000 per claim through a self-insured retention. Prior to that, in August 2001, the Company had changed its professional liability coverage from an occurrence to a claims-made basis. The professional liability policy provided for coverage on a claims-made basis in the amount of $1,000,000 per claim and $3,000,000 in the aggregate as well as excess coverage in the amount of $10,000,000 per claim and $10,000,000 in the aggregate. In addition, there was a $100,000 deductible per occurrence.
The Company records the receivable portion of its insurance claims in accordance with Emerging Issues Task Force (EITF) No. 03-8, Accounting for Claims-Made Insurance and Retroactive Insurance Contracts by the Insured Entity. The Company’s consolidated balance sheet as of December 31, 2007 reflects the current portion of the receivable of its insurance claims as insurance recoveries receivable and the long-term portion as other long-term assets. The related current liability is included in accrued employee compensation and benefits and the long-term portion of the liability is recorded in other long-term liabilities. The long-term portion of the receivable and the liability at December 31, 2006, have been reclassified to conform to the 2007 presentation. See Note 6 – Accrued Employee Compensation and Benefits.
Debt Issuance Costs
Deferred costs related to the issuance of the Company’s senior secured credit facility (see Note 7 – Long-term Debt) have been capitalized and are being amortized using the straight line method, which approximates the effective interest method, over the five-year term of the debt. Deferred costs related to the prior credit facility, which was terminated in the fourth quarter of 2005, had been capitalized and amortized using the effective interest method over the respective six-year term of the related debt. Related debt issuance costs of $1,359,394, net of amortization, relating to this prior credit facility were written off in the fourth quarter of 2005 and presented as loss on early extinguishment of debt in the other expenses section on the consolidated statements of income.

CROSS COUNTRY HEALTHCARE, INC. NOTES TO CONSOLIDATED FINANCIAL STATEMENTS (CONTINUED)
DECEMBER 31, 2007
F-10
2. Summary of Significant Accounting Policies (Continued)
Revenue Recognition
Revenue from services consists primarily of temporary staffing revenue. Revenue is recognized when services are rendered. Accordingly, accounts receivable includes an accrual for employees’ time worked but not yet invoiced. At December 31, 2007 and 2006, the amounts accrued are approximately $16,149,000 and $13,035,000, respectively.
The Company has entered into certain contracts with acute care facilities to provide comprehensive vendor management services. Under these contract arrangements, the Company uses its nurses along with those of third party subcontractors to fulfill customer orders. If a subcontractor is used, revenue is recorded at the time of billing, net of any related subcontractor liability. The resulting net revenue represents the administrative fee charged by the Company for its vendor management services. The subcontractor is paid once the Company has received payment from the acute care facility. Management fees are included in some of the Company’s clinical research contracts that cover the life of a project. These fees are recognized on a straight-line basis for the specific length of the project.
Revenue on permanent placements is recognized when services provided are substantially completed. The Company does not, in the ordinary course of business, give refunds. If a candidate leaves a permanent placement within a relatively short period of time, it is customary for the Company to provide a replacement at no additional cost. Allowances are established as considered necessary to estimate significant losses due to placed candidates not remaining employed for the Company’s guarantee period. During 2007, 2006 and 2005, such losses were nominal.
Revenue from the Company’s education and training services is recognized as the instructor-led seminars are performed and the related learning materials are delivered.
Stock-Based Compensation
The Company has, from time to time, granted stock options for a fixed number of common shares to employees. Prior to January 1, 2006, the Company accounted for its stock-based payments to employees in accordance with the recognition and measurement principles of Accounting Principles Board (APB) Opinion, No. 25, Accounting for Stock Issued to Employees, and related interpretations, as permitted by FASB Statement No. 123, Accounting for Stock-Based Compensation. Under APB Opinion No. 25, when the exercise price of the Company’s employee stock options equaled or exceeded the market price of the underlying stock on the date of grant, no compensation expense was recognized. The Company also provided disclosures in accordance with the requirements of FASB No. 123, as amended by FASB Statement No. 148, Accounting for Stock-Based Compensation, Transition and Disclosure. Effective January 1, 2006, the Company adopted FASB Statement No. 123(Revised 2004), Share-Based Payment, (FASB Statement No.123(R)) using the modified prospective approach. FASB Statement No.123(R) requires all share-based payments to employees, including grants of employee stock options, to be recognized in the income statement, over the requisite service period, based on their fair values.
In the fourth quarter of 2005, all unvested and outstanding options at December 31, 2005 were modified to accelerate vesting effective December 31, 2005. See Note 12 – Stockholder’s Equity for further discussion. In conjunction with the acceleration, the Company recorded a pre-tax charge of $115,663 in the fourth quarter of 2005 related to the acceleration of in-the-money options that the Company estimated would not have otherwise vested. This charge is included in selling, general and administrative expenses on the consolidated statement of income for the year ended December 31, 2005.
Under the modified prospective approach, the recognition provisions of FASB Statement No.123(R) are applied prospectively. Companies are required to disclose the pro forma impact of adopting the standard for prior periods. The pro forma disclosures of stock-based compensation are shown below.

CROSS COUNTRY HEALTHCARE, INC. NOTES TO CONSOLIDATED FINANCIAL STATEMENTS (CONTINUED)
DECEMBER 31, 2007
F-11
2. Summary of Significant Accounting Policies (Continued)
The Company’s consolidated net income would have changed to the pro forma amounts set forth below had compensation cost for stock options granted during 2005 been measured under the fair value based method prescribed by FASB Statement No. 123, Accounting for Stock-Based Compensation. The accounting for the acceleration of vesting under FASB Statement No. 123 resulted in the recognition of the remaining amount of compensation cost of those options and is included in the pro forma amounts in the following table.
Year ended
December 31, 2005
Net income as reported .............................................................................. $ 14,752,386 Stock based employee compensation, net of related tax effects,
included in the determination of net income as reported ......................... 109,819 Stock based employee compensation, net of tax,
applying FASB Statement No. 123 ......................................................... (3,565,084) Pro forma net income applying FASB Statement
No. 123 .................................................................................................... $ 11,297,121 Basic and diluted earnings per share as reported: Net income per common share – basic ...................................................... $ 0.46 Net income per common share – diluted ................................................... $ 0.45 Pro forma basic and diluted earnings per share: Pro forma net income – basic .................................................................... $ 0.35 Pro forma net income – diluted .................................................................. $ 0.34
In adopting FASB Statement No. 123(R), companies may choose from alternative valuation models. The Company used the Black-Scholes method of valuing its options prior to adoption. The Company has continued to use the Black-Scholes model to value its stock options and stock appreciation rights, based on its prior experience with it, and its wide use by other issuers comparable to the Company. The Company will consider the use of another model if additional information becomes available in the future that indicates another model would be more appropriate for the Company, or, if grants issued in future periods have characteristics that cannot be reasonably estimated using Black-Scholes.
The Company has elected to recognize compensation expense on a straight-line basis over the service period of the entire award. The Company uses historical data of options with similar characteristics to estimate pre-vesting option forfeitures as it believes that historical behavior patterns are the best indicators of future behavior patterns.
See Note 12 – Stockholders’ Equity for more information about the Company’s current share-based compensation programs.
Advertising
The Company’s advertising expense consists primarily of print media, online advertising, direct mail marketing and promotional material. Advertising costs that are not considered direct response are expensed as incurred and were approximately $5,936,000; $5,279,000; and $4,846,000 for the years ended December 31, 2007, 2006 and 2005, respectively. Direct response advertising costs associated with the Company’s education and training services are capitalized and expensed when the related event takes place. At December 31, 2007 and 2006, approximately $1,336,000 and $1,304,000, respectively, of these costs are included in other prepaid expenses on the consolidated balance sheets.
Operating Leases
The Company accounts for all operating leases on a straight-line basis over the term of the lease. In accordance with the provisions of FASB Statement No. 13, Accounting for Leases, any incentives or rent escalations are recorded as deferred rent and amortized with rent expense over the respective lease term.
CROSS COUNTRY HEALTHCARE, INC. NOTES TO CONSOLIDATED FINANCIAL STATEMENTS (CONTINUED)
DECEMBER 31, 2007
F-12
2. Summary of Significant Accounting Policies (Continued)
Income Taxes
The Company accounts for income taxes under FASB Statement No. 109, Accounting for Income Taxes. Deferred income tax assets and liabilities are determined based upon differences between the financial reporting and tax basis of assets and liabilities and are measured using the enacted tax rates and laws that will be in effect when the differences are expected to reverse.
In July 2006, the FASB issued FASB Interpretation No. 48, Accounting for Uncertainty in Income Taxes – an interpretation of FASB Statement No. 109 (FIN 48). FIN 48 creates a single model to address uncertainty in tax positions. FIN 48 requires that the Company recognize in its financial statements the impact of a tax position if that position is more likely than not of being sustained on audit, based on the technical merits of the position. The provisions of FIN 48 became effective for the Company on January 1, 2007, with the cumulative effect of the change in accounting principle recorded as an adjustment to opening retained earnings. The Company recognizes interest and penalties related to unrecognized tax benefits in the provision for income taxes. See Note 11 - Income Taxes for more information.
Comprehensive Income
Total comprehensive income includes net income and foreign currency translation adjustments. There were no other components of comprehensive income other than net income during the years ended December 31, 2006 and 2005. The Company’s foreign operations use their respective local currency as their functional currency. In accordance with FASB Statement No. 52, Foreign Currency Translation, assets and liabilities of these operations are translated at the exchange rates in effect on the balance sheet date. Income statement items are translated at the average exchange rates for the period. The impact of currency fluctuation is included in other stockholders’ equity on the consolidated balance sheets and was $163,242 at December 31, 2007. Total comprehensive income is stated on the face of the Company’s Statement of Changes in Stockholders’ Equity.
Reclassifications
Certain 2006 and 2005 amounts have been reclassified to conform to the 2007 presentation.
Recent Accounting Pronouncements
In September 2006, the FASB issued Statement No. 157, Fair Value Measurements, which defines fair value, establishes a framework for measuring fair value under U.S. generally accepted accounting principles and expands disclosures about fair value measurements. FASB Statement No. 157 is effective for fiscal years beginning after November 15, 2007, and interim periods within those fiscal years. This standard is not expected to have a material impact on the Company’s consolidated financial statements.
In February 2007, the FASB issued Statement No. 159, The Fair Value Option for Financial Assets and Financial Liabilities. This standard allows companies to elect to follow fair value accounting for certain financial assets and liabilities in an effort to mitigate volatility in earnings without having to apply complex hedge accounting provisions. FASB Statement No. 159 is applicable only to certain financial instruments and is effective for fiscal years beginning after November 15, 2007. As the Company does not intend to elect fair value treatment for qualifying instruments that exist as of the effective date, the Company does not expect the adoption of this Statement to have a material impact on its consolidated financial statements. The Company may elect to measure qualifying instruments at fair value in the future.
In December 2007, the FASB issued FASB Statement No. 141R, Business Combinations (FASB 141R), which replaces FASB Statement No. 141, Business Combinations. FASB 141R applies to all transactions or other events in which an entity obtains control of one or more businesses and requires that all assets and liabilities of an acquired business as well as any noncontrolling interest in the acquiree be recorded at their fair values at the acquisition date. Contingent consideration arrangements will be recognized at their acquisition date fair values, with subsequent changes in fair value generally reflected in earnings. Pre-acquisition contingencies will also typically be recognized at their acquisition date fair values. In subsequent periods, contingent liabilities will be measured at the higher of their acquisition date fair values or the estimated amounts to be realized. The statement is effective for business combinations for which the acquisition date is on or after the beginning of the first annual reporting period beginning on or after December 15, 2008. The Company expects FASB 141R could have an impact on its future consolidated financial statements when effective, but the nature and magnitude of the specific effects will depend upon the nature, terms and size of the acquisitions the Company consummates after the effective date.
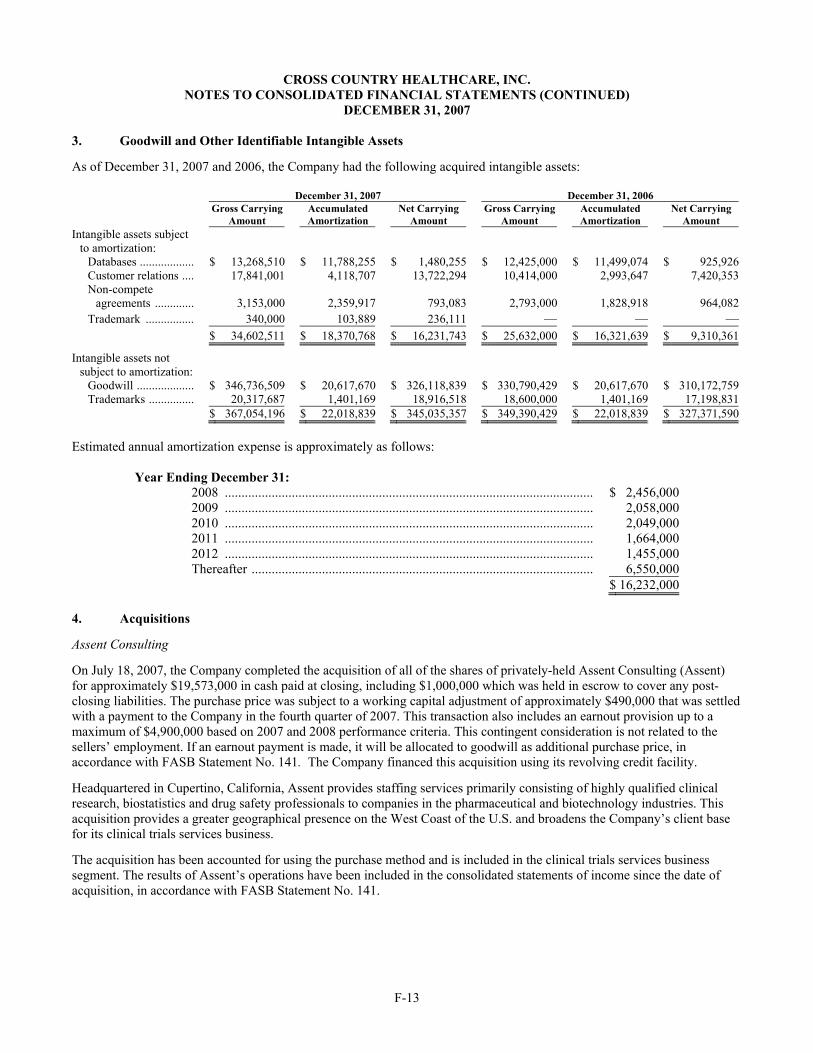
CROSS COUNTRY HEALTHCARE, INC. NOTES TO CONSOLIDATED FINANCIAL STATEMENTS (CONTINUED)
DECEMBER 31, 2007
F-13
3. Goodwill and Other Identifiable Intangible Assets
As of December 31, 2007 and 2006, the Company had the following acquired intangible assets: December 31, 2007 December 31, 2006
Gross Carrying
Amount AccumulatedAmortization
Net CarryingAmount
Gross CarryingAmount
Accumulated Amortization
Net CarryingAmount
Intangible assets subject to amortization:
Databases .................. $ 13,268,510 $ 11,788,255 $ 1,480,255 $ 12,425,000 $ 11,499,074 $ 925,926Customer relations .... 17,841,001 4,118,707 13,722,294 10,414,000 2,993,647 7,420,353Non-compete
agreements ............. 3,153,000 2,359,917 793,083 2,793,000 1,828,918 964,082Trademark ................ 340,000 103,889 236,111 — — — $ 34,602,511 $ 18,370,768 $ 16,231,743 $ 25,632,000 $ 16,321,639 $ 9,310,361
Intangible assets not subject to amortization:
Goodwill ................... $ 346,736,509 $ 20,617,670 $ 326,118,839 $ 330,790,429 $ 20,617,670 $ 310,172,759Trademarks ............... 20,317,687 1,401,169 18,916,518 18,600,000 1,401,169 17,198,831
$ 367,054,196 $ 22,018,839 $ 345,035,357 $ 349,390,429 $ 22,018,839 $ 327,371,590 Estimated annual amortization expense is approximately as follows:
Year Ending December 31: 2008 .............................................................................................................. $ 2,456,000 2009 .............................................................................................................. 2,058,000 2010 .............................................................................................................. 2,049,000 2011 .............................................................................................................. 1,664,000 2012 .............................................................................................................. 1,455,000 Thereafter ...................................................................................................... 6,550,000 $ 16,232,000
4. Acquisitions
Assent Consulting
On July 18, 2007, the Company completed the acquisition of all of the shares of privately-held Assent Consulting (Assent) for approximately $19,573,000 in cash paid at closing, including $1,000,000 which was held in escrow to cover any post-closing liabilities. The purchase price was subject to a working capital adjustment of approximately $490,000 that was settled with a payment to the Company in the fourth quarter of 2007. This transaction also includes an earnout provision up to a maximum of $4,900,000 based on 2007 and 2008 performance criteria. This contingent consideration is not related to the sellers’ employment. If an earnout payment is made, it will be allocated to goodwill as additional purchase price, in accordance with FASB Statement No. 141. The Company financed this acquisition using its revolving credit facility.
Headquartered in Cupertino, California, Assent provides staffing services primarily consisting of highly qualified clinical research, biostatistics and drug safety professionals to companies in the pharmaceutical and biotechnology industries. This acquisition provides a greater geographical presence on the West Coast of the U.S. and broadens the Company’s client base for its clinical trials services business.
The acquisition has been accounted for using the purchase method and is included in the clinical trials services business segment. The results of Assent’s operations have been included in the consolidated statements of income since the date of acquisition, in accordance with FASB Statement No. 141.
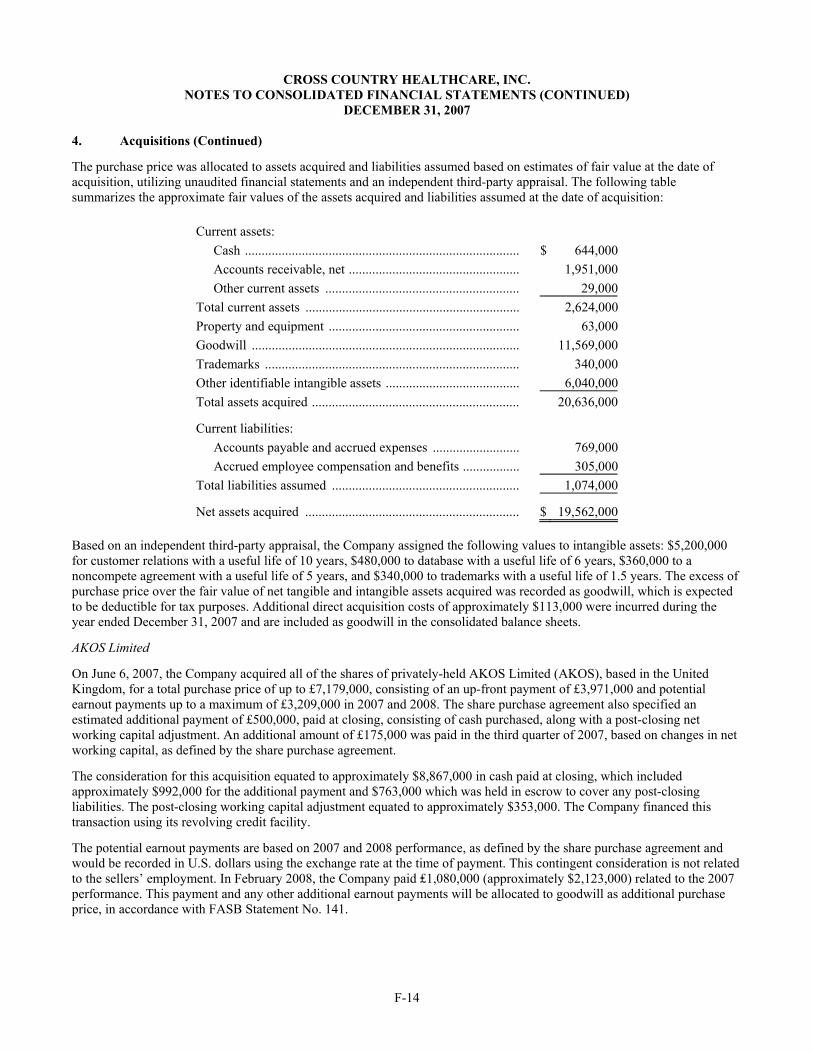
CROSS COUNTRY HEALTHCARE, INC. NOTES TO CONSOLIDATED FINANCIAL STATEMENTS (CONTINUED)
DECEMBER 31, 2007
F-14
4. Acquisitions (Continued)
The purchase price was allocated to assets acquired and liabilities assumed based on estimates of fair value at the date of acquisition, utilizing unaudited financial statements and an independent third-party appraisal. The following table summarizes the approximate fair values of the assets acquired and liabilities assumed at the date of acquisition:
Current assets: Cash .................................................................................. $ 644,000Accounts receivable, net ................................................... 1,951,000Other current assets .......................................................... 29,000
Total current assets ................................................................ 2,624,000Property and equipment ......................................................... 63,000Goodwill ................................................................................ 11,569,000Trademarks ............................................................................ 340,000Other identifiable intangible assets ........................................ 6,040,000Total assets acquired .............................................................. 20,636,000
Current liabilities: Accounts payable and accrued expenses .......................... 769,000Accrued employee compensation and benefits ................. 305,000
Total liabilities assumed ........................................................ 1,074,000
Net assets acquired ................................................................ $ 19,562,000 Based on an independent third-party appraisal, the Company assigned the following values to intangible assets: $5,200,000 for customer relations with a useful life of 10 years, $480,000 to database with a useful life of 6 years, $360,000 to a noncompete agreement with a useful life of 5 years, and $340,000 to trademarks with a useful life of 1.5 years. The excess of purchase price over the fair value of net tangible and intangible assets acquired was recorded as goodwill, which is expected to be deductible for tax purposes. Additional direct acquisition costs of approximately $113,000 were incurred during the year ended December 31, 2007 and are included as goodwill in the consolidated balance sheets.
AKOS Limited
On June 6, 2007, the Company acquired all of the shares of privately-held AKOS Limited (AKOS), based in the United Kingdom, for a total purchase price of up to £7,179,000, consisting of an up-front payment of £3,971,000 and potential earnout payments up to a maximum of £3,209,000 in 2007 and 2008. The share purchase agreement also specified an estimated additional payment of £500,000, paid at closing, consisting of cash purchased, along with a post-closing net working capital adjustment. An additional amount of £175,000 was paid in the third quarter of 2007, based on changes in net working capital, as defined by the share purchase agreement.
The consideration for this acquisition equated to approximately $8,867,000 in cash paid at closing, which included approximately $992,000 for the additional payment and $763,000 which was held in escrow to cover any post-closing liabilities. The post-closing working capital adjustment equated to approximately $353,000. The Company financed this transaction using its revolving credit facility.
The potential earnout payments are based on 2007 and 2008 performance, as defined by the share purchase agreement and would be recorded in U.S. dollars using the exchange rate at the time of payment. This contingent consideration is not related to the sellers’ employment. In February 2008, the Company paid ₤1,080,000 (approximately $2,123,000) related to the 2007 performance. This payment and any other additional earnout payments will be allocated to goodwill as additional purchase price, in accordance with FASB Statement No. 141.

CROSS COUNTRY HEALTHCARE, INC. NOTES TO CONSOLIDATED FINANCIAL STATEMENTS (CONTINUED)
DECEMBER 31, 2007
F-15
4. Acquisitions (Continued)
AKOS, conducting business since 1986, is a provider of drug safety, regulatory and clinical trial services to pharmaceutical and biotechnology companies in Europe, the United States, Canada and Asia. AKOS is based approximately 30 miles north of London, England, and strategically located inside what is considered to be the United Kingdom’s research triangle that extends outward from London to Cambridge and Oxford Universities. The Company believes, with the addition of AKOS, it will provide a more global and comprehensive range of contract staffing and outsourcing services to pharmaceutical and biotech customers.
The acquisition has been accounted for using the purchase method and is included in the clinical trials services segment. The results of AKOS’ operations have been included in the consolidated statements of income since the date of acquisition, in accordance with FASB Statement No. 141.
The purchase price was allocated to assets acquired and liabilities assumed based on estimates of fair value at the date of acquisition, utilizing unaudited financial statements and an independent third-party appraisal. The following table summarizes the approximate fair values of the assets acquired and liabilities assumed at the date of acquisition:
Current assets: Cash ........................................................................... $ 1,257,000Accounts receivable, net ............................................ 1,078,000Other current assets ................................................... 106,000
Total current assets ......................................................... 2,441,000Property and equipment .................................................. 165,000Trademarks ..................................................................... 1,707,000Goodwill ......................................................................... 3,849,000Other identifiable intangible assets ................................. 2,581,000Total assets acquired ....................................................... 10,743,000
Current liabilities: Accounts payable and accrued expenses ................... 175,000Income taxes payable ................................................ 52,000Other current liabilities .............................................. 405,000Deferred taxes ........................................................... 1,244,000
Total liabilities assumed ................................................. 1,876,000
Net assets acquired ......................................................... $ 8,867,000 Based on an independent third-party appraisal, the Company assigned $1,707,000 to trademarks with an indefinite life and not subject to amortization. In addition, the Company assigned $2,581,000 to total other identifiable intangible assets subject to amortization, as follows: $2,213,000 was assigned to customer relations with a useful life of 8.6 years, and $368,000 was assigned to other intangibles with an estimated useful life of 6 years. The excess of purchase price over the fair value of net tangible and intangible assets acquired was recorded as goodwill, which is not deductible for tax purposes. Additional direct acquisition costs of approximately $373,000 were incurred during the year ended December 31, 2007 and are included as goodwill in the consolidated balance sheets.
Metropolitan Research
On August 31, 2006, the Company acquired substantially all of the assets of privately-held Metropolitan Research Associates, LLC and Metropolitan Research Staffing Associates, LLC (collectively “Metropolitan Research”) for a purchase price of approximately $18,600,000. The consideration for this acquisition was approximately $16,100,000 in cash paid at closing, of which $1,000,000 is being held in escrow to cover any post-closing liabilities. The remaining approximate

CROSS COUNTRY HEALTHCARE, INC. NOTES TO CONSOLIDATED FINANCIAL STATEMENTS (CONTINUED)
DECEMBER 31, 2007
F-16
4. Acquisitions (Continued)
$2,500,000 of the purchase price was paid during the fourth quarter of 2006 as the associated milestones defined by the asset purchase agreement were reached. These payments were allocated to goodwill as additional purchase price. The Company financed this transaction using its revolving credit facility. During the year ended December 31, 2007, a post-closing adjustment of approximately $510,000, which included a net working capital adjustment, was paid and allocated to goodwill.
The asset purchase agreement also provides for a potential earnout payment of up to a maximum of $6,436,000 based on 2006 and 2007 performance, as defined. This contingent consideration is not related to the sellers’ employment. The Company expects to pay the entire amount pursuant to the earnout provision. This amount will be allocated to goodwill as additional purchase price, in accordance with FASB Statement No. 141.
Metropolitan Research is headquartered in New York City and provides drug safety monitoring, contract research, and clinical trials staffing and services to the pharmaceutical, biotech and medical device industries. The Company believes that the addition of Metropolitan Research enhances the breadth of the service offerings in its clinical trials services business.
The acquisition has been accounted for using the purchase method and is included in the clinical trials services business segment. The results of Metropolitan Research’s operations have been included in the consolidated statements of income since the date of acquisition, in accordance with FASB Statement No. 141.
The purchase price was originally allocated to assets acquired and liabilities assumed based on estimates of fair value at the date of acquisition, utilizing preliminary financial statements of Metropolitan Research and an independent third-party appraisal. These estimates were revised subsequent to the date of acquisition based on the final audited financial statements and the final independent third-party appraisal. The following table summarizes the approximate fair values of the assets acquired and liabilities assumed at the date of acquisition:
Current assets: Accounts receivable, net ............................................ $ 3,730,000Other current assets .................................................... 200,000
Total current assets .......................................................... 3,930,000Property and equipment .................................................. 350,000Trademarks ...................................................................... 1,700,000Goodwill .......................................................................... 4,890,000Other identifiable intangible assets ................................. 5,490,000Total assets acquired ....................................................... 16,360,000
Current liabilities: Accounts payable and accrued expenses .................... 260,000
Total liabilities assumed .................................................. 260,000
Net assets acquired .......................................................... $ 16,100,000 Based on the final independent third-party appraisal, total other identifiable intangible assets were $5,490,000, of which $4,100,000 was assigned to customer relations with a weighted-average useful life of 23 years, $1,000,000 to database with a useful life of 4.5 years and $390,000 to non-compete agreements with a useful life of 5 years. The excess of purchase price over the fair value of net tangible and intangible assets acquired was recorded as goodwill, which is expected to be deductible for tax purposes.

CROSS COUNTRY HEALTHCARE, INC. NOTES TO CONSOLIDATED FINANCIAL STATEMENTS (CONTINUED)
DECEMBER 31, 2007
F-17
5. Property and Equipment
At December 31, 2007 and 2006, property and equipment consist of the following: December 31, Useful Lives 2007 2006 Computer equipment ............................................................................... 3-5 years $ 9,267,318 $ 8,026,507 Computer software ................................................................................... 3-5 years 30,880,711 25,706,675 Office equipment ..................................................................................... 5-7 years 3,692,390 2,967,323 Furniture and fixtures .............................................................................. 5-7 years 3,268,976 2,500,955 Leasehold improvements ......................................................................... (a) 2,472,210 1,364,752 49,581,605 40,566,212 Less accumulated depreciation and amortization .................................... (26,121,576) (20,003,739) $ 23,460,029 $ 20,562,473——————— (a) See Note 2 – Summary of Significant Accounting Policies.
6. Accrued Employee Compensation and Benefits
At December 31, 2007 and 2006, accrued employee compensation and benefits consist of the following: December 31, 2007 2006
Salaries and payroll taxes .................................................................................................. $ 13,451,314 $ 12,771,637 Bonuses .............................................................................................................................. 4,897,946 5,772,488 Accrual for workers’ compensation claims ....................................................................... 2,608,767 2,773,964 Accrual for health care benefits ......................................................................................... 1,921,190 2,435,221 Accrual for professional liability insurance ....................................................................... 1,550,148 4,004,885 Accrual for vacation .......................................................................................................... 1,672,848 1,454,610 $ 26,102,213 $ 29,212,805 Workers’ compensation and professional liability amounts are also included in the following accounts, as follows: December 31, 2007 2006 Insurance recoveries receivable:
Insurance recovery for workers' compensation ............................................................. $ 346,932 $ 603,988Insurance recovery for professional liability ................................................................. 82,000 560,000
$ 428,932 $ 1,163,988Other long-term assets:
Insurance recovery for workers' compensation - long-term .......................................... $ 396,680 $ 690.285Insurance recovery for professional liability - long-term .............................................. 620,354 77,486
$ 1,017,034 $ 767,771Other long-term liabilities:
Unrecognized tax benefits - long-term .......................................................................... $ 1,751,675 $ —Accrual for workers' compensation claims - long-term ................................................ 2,982,846 3,170,309Accrual for professional liability insurance - long-term ............................................... 5,795,206 5,806,601
$ 10,529,727 $ 8,976,910
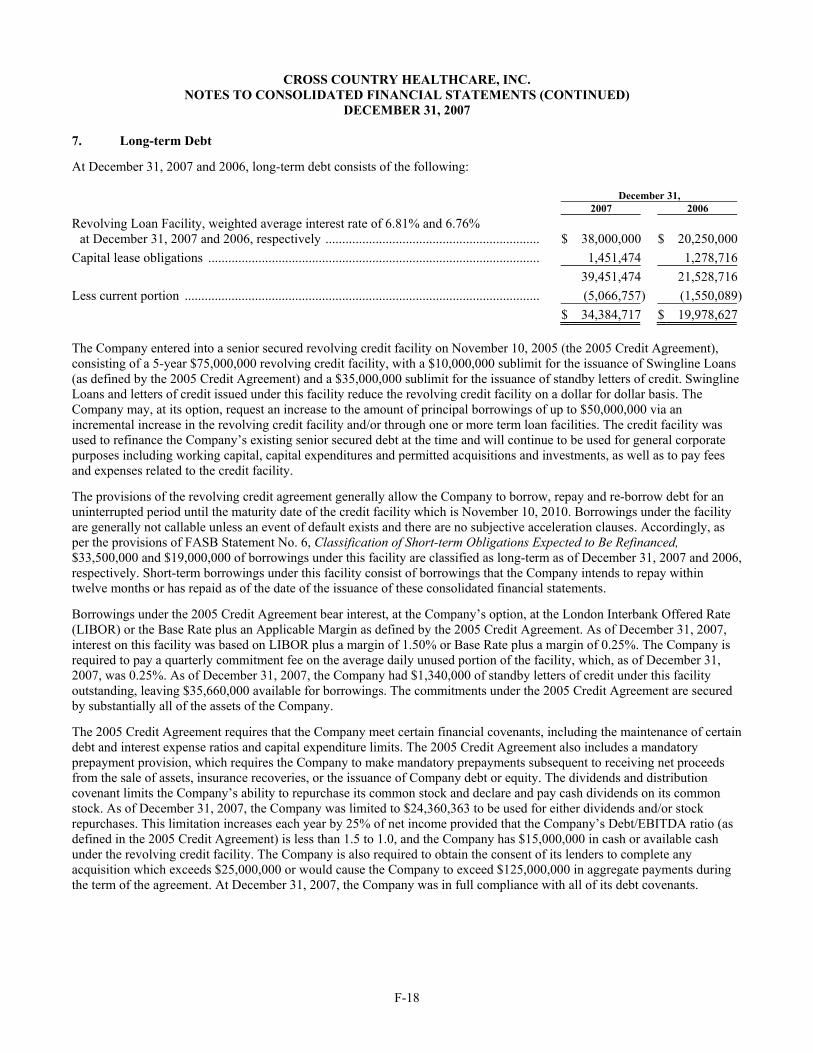
CROSS COUNTRY HEALTHCARE, INC. NOTES TO CONSOLIDATED FINANCIAL STATEMENTS (CONTINUED)
DECEMBER 31, 2007
F-18
7. Long-term Debt
At December 31, 2007 and 2006, long-term debt consists of the following:
December 31, 2007 2006
Revolving Loan Facility, weighted average interest rate of 6.81% and 6.76% at December 31, 2007 and 2006, respectively ................................................................ $ 38,000,000 $ 20,250,000
Capital lease obligations ................................................................................................... 1,451,474 1,278,716 39,451,474 21,528,716 Less current portion .......................................................................................................... (5,066,757) (1,550,089) $ 34,384,717 $ 19,978,627 The Company entered into a senior secured revolving credit facility on November 10, 2005 (the 2005 Credit Agreement), consisting of a 5-year $75,000,000 revolving credit facility, with a $10,000,000 sublimit for the issuance of Swingline Loans (as defined by the 2005 Credit Agreement) and a $35,000,000 sublimit for the issuance of standby letters of credit. Swingline Loans and letters of credit issued under this facility reduce the revolving credit facility on a dollar for dollar basis. The Company may, at its option, request an increase to the amount of principal borrowings of up to $50,000,000 via an incremental increase in the revolving credit facility and/or through one or more term loan facilities. The credit facility was used to refinance the Company’s existing senior secured debt at the time and will continue to be used for general corporate purposes including working capital, capital expenditures and permitted acquisitions and investments, as well as to pay fees and expenses related to the credit facility.
The provisions of the revolving credit agreement generally allow the Company to borrow, repay and re-borrow debt for an uninterrupted period until the maturity date of the credit facility which is November 10, 2010. Borrowings under the facility are generally not callable unless an event of default exists and there are no subjective acceleration clauses. Accordingly, as per the provisions of FASB Statement No. 6, Classification of Short-term Obligations Expected to Be Refinanced, $33,500,000 and $19,000,000 of borrowings under this facility are classified as long-term as of December 31, 2007 and 2006, respectively. Short-term borrowings under this facility consist of borrowings that the Company intends to repay within twelve months or has repaid as of the date of the issuance of these consolidated financial statements.
Borrowings under the 2005 Credit Agreement bear interest, at the Company’s option, at the London Interbank Offered Rate (LIBOR) or the Base Rate plus an Applicable Margin as defined by the 2005 Credit Agreement. As of December 31, 2007, interest on this facility was based on LIBOR plus a margin of 1.50% or Base Rate plus a margin of 0.25%. The Company is required to pay a quarterly commitment fee on the average daily unused portion of the facility, which, as of December 31, 2007, was 0.25%. As of December 31, 2007, the Company had $1,340,000 of standby letters of credit under this facility outstanding, leaving $35,660,000 available for borrowings. The commitments under the 2005 Credit Agreement are secured by substantially all of the assets of the Company.
The 2005 Credit Agreement requires that the Company meet certain financial covenants, including the maintenance of certain debt and interest expense ratios and capital expenditure limits. The 2005 Credit Agreement also includes a mandatory prepayment provision, which requires the Company to make mandatory prepayments subsequent to receiving net proceeds from the sale of assets, insurance recoveries, or the issuance of Company debt or equity. The dividends and distribution covenant limits the Company’s ability to repurchase its common stock and declare and pay cash dividends on its common stock. As of December 31, 2007, the Company was limited to $24,360,363 to be used for either dividends and/or stock repurchases. This limitation increases each year by 25% of net income provided that the Company’s Debt/EBITDA ratio (as defined in the 2005 Credit Agreement) is less than 1.5 to 1.0, and the Company has $15,000,000 in cash or available cash under the revolving credit facility. The Company is also required to obtain the consent of its lenders to complete any acquisition which exceeds $25,000,000 or would cause the Company to exceed $125,000,000 in aggregate payments during the term of the agreement. At December 31, 2007, the Company was in full compliance with all of its debt covenants.
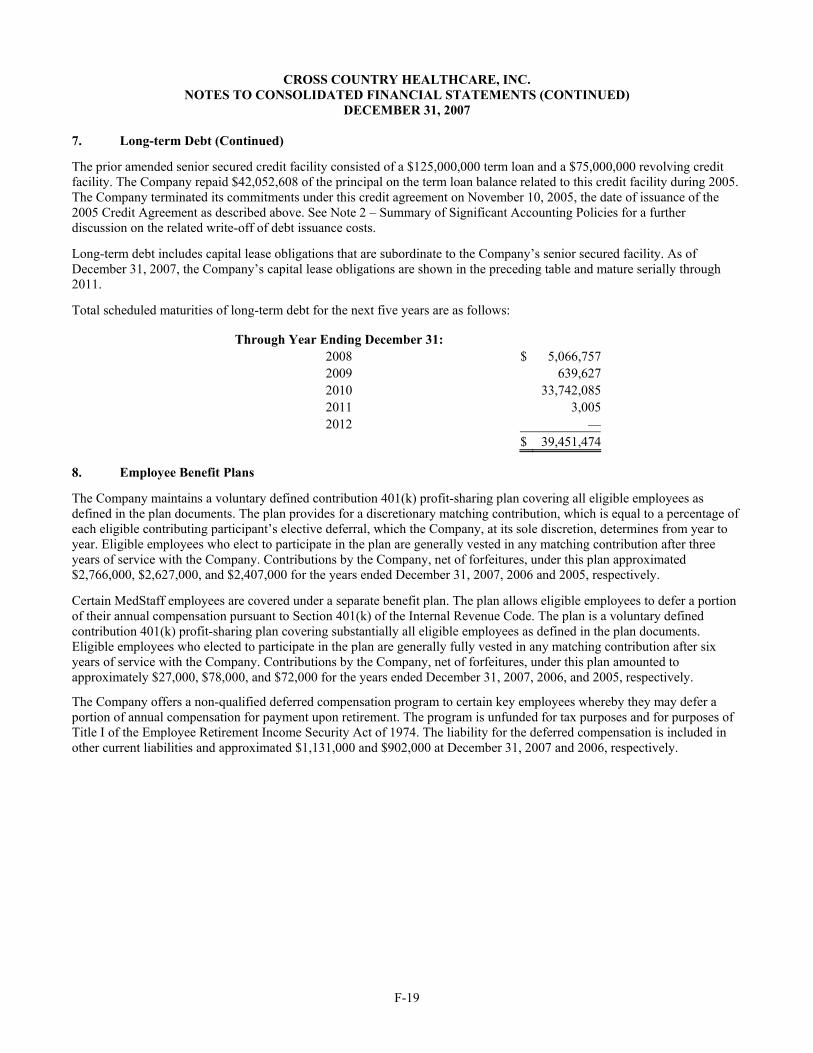
CROSS COUNTRY HEALTHCARE, INC. NOTES TO CONSOLIDATED FINANCIAL STATEMENTS (CONTINUED)
DECEMBER 31, 2007
F-19
7. Long-term Debt (Continued)
The prior amended senior secured credit facility consisted of a $125,000,000 term loan and a $75,000,000 revolving credit facility. The Company repaid $42,052,608 of the principal on the term loan balance related to this credit facility during 2005. The Company terminated its commitments under this credit agreement on November 10, 2005, the date of issuance of the 2005 Credit Agreement as described above. See Note 2 – Summary of Significant Accounting Policies for a further discussion on the related write-off of debt issuance costs.
Long-term debt includes capital lease obligations that are subordinate to the Company’s senior secured facility. As of December 31, 2007, the Company’s capital lease obligations are shown in the preceding table and mature serially through 2011.
Total scheduled maturities of long-term debt for the next five years are as follows:
Through Year Ending December 31: 2008 $ 5,066,7572009 639,6272010 33,742,0852011 3,0052012 —
$ 39,451,474 8. Employee Benefit Plans
The Company maintains a voluntary defined contribution 401(k) profit-sharing plan covering all eligible employees as defined in the plan documents. The plan provides for a discretionary matching contribution, which is equal to a percentage of each eligible contributing participant’s elective deferral, which the Company, at its sole discretion, determines from year to year. Eligible employees who elect to participate in the plan are generally vested in any matching contribution after three years of service with the Company. Contributions by the Company, net of forfeitures, under this plan approximated $2,766,000, $2,627,000, and $2,407,000 for the years ended December 31, 2007, 2006 and 2005, respectively.
Certain MedStaff employees are covered under a separate benefit plan. The plan allows eligible employees to defer a portion of their annual compensation pursuant to Section 401(k) of the Internal Revenue Code. The plan is a voluntary defined contribution 401(k) profit-sharing plan covering substantially all eligible employees as defined in the plan documents. Eligible employees who elected to participate in the plan are generally fully vested in any matching contribution after six years of service with the Company. Contributions by the Company, net of forfeitures, under this plan amounted to approximately $27,000, $78,000, and $72,000 for the years ended December 31, 2007, 2006, and 2005, respectively.
The Company offers a non-qualified deferred compensation program to certain key employees whereby they may defer a portion of annual compensation for payment upon retirement. The program is unfunded for tax purposes and for purposes of Title I of the Employee Retirement Income Security Act of 1974. The liability for the deferred compensation is included in other current liabilities and approximated $1,131,000 and $902,000 at December 31, 2007 and 2006, respectively.

CROSS COUNTRY HEALTHCARE, INC. NOTES TO CONSOLIDATED FINANCIAL STATEMENTS (CONTINUED)
DECEMBER 31, 2007
F-20
9. Commitments and Contingencies
Commitments:
The Company has entered into non-cancelable operating lease agreements for the rental of office space and equipment. Certain of these leases include options to renew as well as rent escalation clauses and in certain cases, incentives from the landlord for rent-free months and allowances for tenant improvements. The rent escalations and incentives have been reflected in the following table. Future minimum lease payments, as of December 31, 2007, associated with these agreements with terms of one year or more are approximately as follows:
Through Year Ending December 31: 2008 $ 6,195,0002009 5,646,0002010 4,723,0002011 4,475,0002012 4,402,000
Thereafter 13,559,000 $ 39,000,000
Total operating lease expense from continuing operations included in selling, general and administrative expenses was approximately $7,310,000, $6,099,000, and $5,567,000 for the years ended December 31, 2007, 2006, and 2005, respectively.
Contingencies:
Cossack, et. al. v. Cross Country TravCorps and Cross Country Nurses, Inc.
In the third quarter of 2006, the Company reached an agreement in principle to settle the California wage and hour class action lawsuit filed against certain of the Company's subsidiaries in Superior Court in Orange County, California, in August of 2003. The estimated settlement amount of $6.7 million was reported as legal settlement charge on the Company’s consolidated statements of income. The settlement payment made was approximately $6.7 million, pretax, and was paid out in the first quarter of 2007.
Maureen Petray and Carina Higareda v. MedStaff, Inc.
On February 18, 2005, the Company’s MedStaff subsidiary became the subject of a purported class action lawsuit (Maureen Petray and Carina Higareda v. MedStaff, Inc.) filed in the Superior Court of California in Riverside County. The lawsuit relates to only MedStaff corporate employees. The claims alleged under this lawsuit are generally similar in nature to those brought by Darrelyn Renee Henry in a lawsuit against the Company, which was dismissed (Darrelyn Renee Henry vs. MedStaff, Inc., Cross Country Healthcare, Inc., Victor Kalafa, Tim Rodden, Talia Pico and Melissa Hetrick).
The lawsuit alleges, among other things, violations of certain sections of the California Labor Code, the California Business and Professions Code, and recovery of unpaid wages and penalties. MedStaff currently has less than 50 corporate employees in California. The Plaintiffs, Maureen Petray and Carina Higareda, purport to sue on behalf of themselves and all others similarly situated, allege that MedStaff failed, under California law, to provide meal periods and rest breaks and pay for those missed meal periods and rest breaks; failed to compensate the employees for all hours worked; failed to compensate the employees for working overtime; and failed to keep appropriate records to keep track of time worked. Plaintiffs seek, among other things, an order enjoining MedStaff from engaging in the practices challenged in the complaint; for full restitution of all monies MedStaff allegedly failed to pay Plaintiffs and their purported class; for interest; for certain penalties provided for by the California Labor Code; and for attorneys’ fees and costs. On February 5, 2007, the court granted class certification. The Company is unable to determine its potential exposure, if any, and intends to vigorously defend this matter.
The Company is also subject to other legal proceedings and claims that arise in the ordinary course of its business. In the opinion of management, the outcome of these other matters will not have a significant effect on the Company’s consolidated financial position or results of operations.
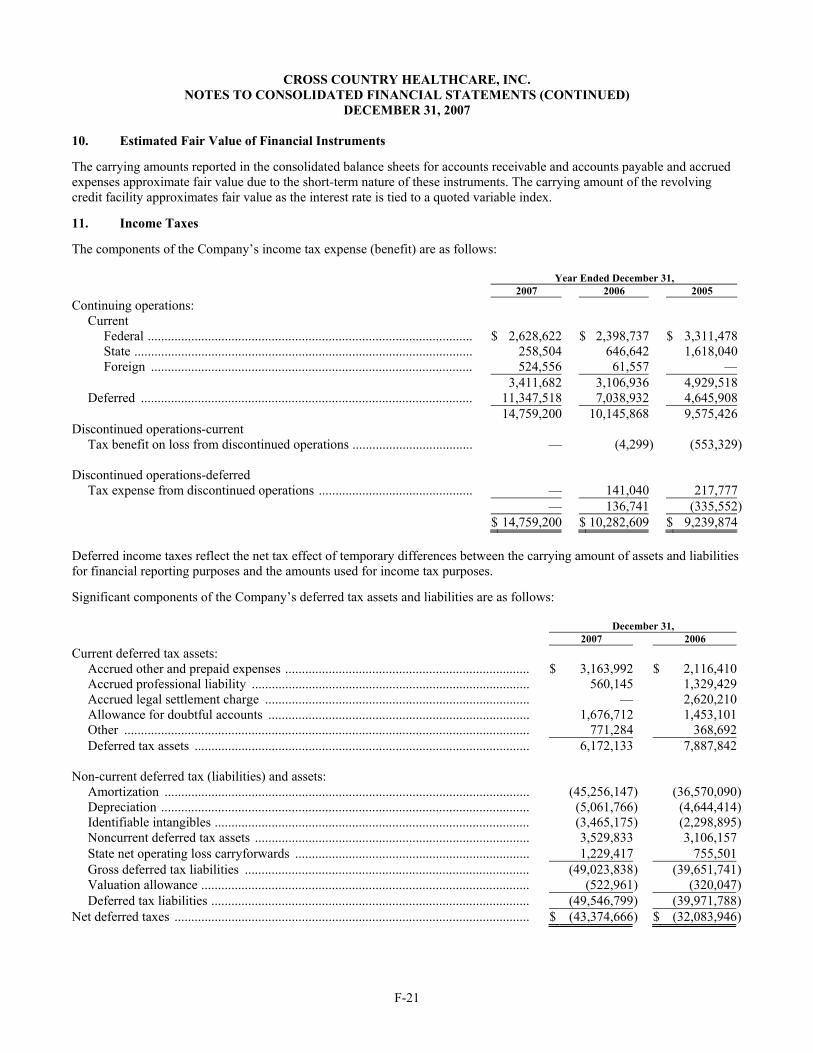
CROSS COUNTRY HEALTHCARE, INC. NOTES TO CONSOLIDATED FINANCIAL STATEMENTS (CONTINUED)
DECEMBER 31, 2007
F-21
10. Estimated Fair Value of Financial Instruments
The carrying amounts reported in the consolidated balance sheets for accounts receivable and accounts payable and accrued expenses approximate fair value due to the short-term nature of these instruments. The carrying amount of the revolving credit facility approximates fair value as the interest rate is tied to a quoted variable index.
11. Income Taxes
The components of the Company’s income tax expense (benefit) are as follows:
Year Ended December 31, 2007 2006 2005
Continuing operations: Current
Federal ................................................................................................. $ 2,628,622 $ 2,398,737 $ 3,311,478State ..................................................................................................... 258,504 646,642 1,618,040Foreign ................................................................................................ 524,556 61,557 —
3,411,682 3,106,936 4,929,518Deferred ................................................................................................... 11,347,518 7,038,932 4,645,908
14,759,200 10,145,868 9,575,426Discontinued operations-current
Tax benefit on loss from discontinued operations .................................... — (4,299) (553,329) Discontinued operations-deferred
Tax expense from discontinued operations .............................................. — 141,040 217,777 — 136,741 (335,552) $ 14,759,200 $ 10,282,609 $ 9,239,874 Deferred income taxes reflect the net tax effect of temporary differences between the carrying amount of assets and liabilities for financial reporting purposes and the amounts used for income tax purposes.
Significant components of the Company’s deferred tax assets and liabilities are as follows:
December 31, 2007 2006
Current deferred tax assets: Accrued other and prepaid expenses ......................................................................... $ 3,163,992 $ 2,116,410Accrued professional liability ................................................................................... 560,145 1,329,429Accrued legal settlement charge ............................................................................... — 2,620,210Allowance for doubtful accounts .............................................................................. 1,676,712 1,453,101Other ......................................................................................................................... 771,284 368,692Deferred tax assets .................................................................................................... 6,172,133 7,887,842
Non-current deferred tax (liabilities) and assets:
Amortization ............................................................................................................. (45,256,147 ) (36,570,090)Depreciation .............................................................................................................. (5,061,766 ) (4,644,414)Identifiable intangibles .............................................................................................. (3,465,175 ) (2,298,895)Noncurrent deferred tax assets .................................................................................. 3,529,833 3,106,157State net operating loss carryforwards ...................................................................... 1,229,417 755,501Gross deferred tax liabilities ..................................................................................... (49,023,838 ) (39,651,741)Valuation allowance .................................................................................................. (522,961 ) (320,047)Deferred tax liabilities ............................................................................................... (49,546,799 ) (39,971,788)
Net deferred taxes .......................................................................................................... $ (43,374,666 ) $ (32,083,946)

CROSS COUNTRY HEALTHCARE, INC. NOTES TO CONSOLIDATED FINANCIAL STATEMENTS (CONTINUED)
DECEMBER 31, 2007
F-22
11. Income Taxes (Continued)
FASB Statement No. 109 requires a valuation allowance to reduce the deferred tax assets reported if, based on the weight of the evidence, it is more likely than not that some of or all of the deferred tax assets will not be realized. As of December 31, 2007 and 2006, respectively, the Company had deferred tax assets of approximately $1,229,000 and $756,000 related to state net operating loss carryforwards. The state carry forwards will expire between 2009 and 2027. A valuation allowance has been recorded at December 31, 2007 and 2006, to reduce the Company’s deferred tax asset to an amount that is more likely than not to be realized and is based upon the uncertainty of the realization of certain state deferred assets related to net operating loss carryforwards.
The reconciliation of income tax computed at the U. S. federal statutory rate to income tax expense is as follows:
Year Ended
December 31, 2007 2006
Tax at U.S. statutory rate ....................................................................................................... $ 12,704,282 $ 9,349,277State taxes, net of federal benefit ........................................................................................... 881,449 607,903Non-deductible meals and entertainment ............................................................................... 60,742 56,245Non-deductible other ............................................................................................................. 35,100 9,690Foreign tax expense (benefit) ................................................................................................ 654,958 (210,685)Other ...................................................................................................................................... 422,669 333,438Income taxes on continuing operations .................................................................................. 14,759,200 10,145,868Expense from discontinued operations .................................................................................. — 136,741Total income tax expense ...................................................................................................... $ 14,759,200 $ 10,282,609 The Company adopted FASB Interpretation No. 48, Accounting for Uncertainty in Income Taxes, as of January 1, 2007. As a result of the implementation of FIN 48, the Company recognized an approximate $1,734,000 increase in the liability for unrecognized tax benefits of which, $732,000 was accounted for as a reduction to the January 1, 2007 balance of retained earnings.
A reconciliation of the beginning and ending amounts of unrecognized tax benefits is as follows: Balance at January 1, 2007 ............................................................................................................................ $ 2,668,000 Additions based on tax positions related to the current year .......................................................................... 489,000 Settlements of tax positions related to prior years ......................................................................................... (120,000) Reductions for tax positions as a result of a lapse of the applicable statute of limitations ............................ (431,000)
Balance at December 31, 2007 ...................................................................................................................... $ 2,606,000 As of the date of adoption, the Company had approximately $1,330,000 of unrecognized tax benefits, which would affect the effective tax rate if recognized. As of December 31, 2007 the Company had $1,310,000 of unrecognized tax benefits, which would affect the effective tax rate if recognized. During the year, the Company had gross increases of $489,000 to its current year unrecognized tax benefits, primarily related to state tax issues. In addition, the Company had gross decreases of $551,000 to its unrecognized tax benefits related to both the closure of a certain state tax controversies and the closure of open tax years.
The Company recognizes interest and penalties related to unrecognized tax benefits in the provision for income taxes. The Company had accrued approximately $672,000 and $492,000 for the payment of interest penalties at December 31, 2007 and 2006, respectively.
The tax years 2004 through 2007 remain open to examination by the major taxing jurisdictions to which the Company is subject.

CROSS COUNTRY HEALTHCARE, INC. NOTES TO CONSOLIDATED FINANCIAL STATEMENTS (CONTINUED)
DECEMBER 31, 2007
F-23
12. Stockholders’ Equity
Secondary Offerings
In November 2004, the Company filed a registration statement on Form S-3 with the Securities and Exchange Commission for the registration of 11,403,455 shares of common stock held by three of its existing shareholders. No members of management registered shares pursuant to this registration statement. On April 14, 2005, the Company announced a public offering of 4,172,868 shares of common stock pursuant to this Form S-3 shelf registration statement. All net proceeds from the sale went to the selling stockholders. However, the Company incurred all fees and expenses relating to the registration statement which were approximately $155,000 and are recorded as secondary offering costs in the consolidated statements of income for the years ended December 31, 2005 and 2004. Subsequently, on November 13, 2006, the Company announced a public offering of approximately 4,000,000 shares pursuant to this Form S-3 shelf registration statement. All net proceeds from the sale went to the selling stockholders. However, the Company incurred all fees and expenses relating to the registration statement which were approximately $153,000 and are recorded as secondary offering costs in the consolidated statements of income for the year ended December 31, 2006.
Stock Repurchase Programs
On May 10, 2006, the Company’s Board of Directors authorized a stock repurchase program whereby the Company may purchase up to 1,500,000 of its common shares, subject to the constraints of its current credit agreement. The shares may be repurchased from time-to-time in the open market and the repurchase program may be discontinued at any time at our discretion.
In November 2002, the Company’s Board of Directors authorized a stock repurchase program whereby the Company may purchase up to 1,500,000 of its common shares at an aggregate price not to exceed $25,000,000. Under this program, the Company purchased and retired 1,500,000 shares of its common stock at an average cost of $15.04 per share pursuant to the authorization. All of the common stock was retired. The cost of such purchases was approximately $22,557,000. During the year ended December 31, 2007, the November 2002 stock repurchase program was depleted and, accordingly, the Company commenced purchases under the May 2006 authorization.
During the year ended December 31, 2007, the Company purchased, under both programs, a total of 704,498 shares at an average cost of $15.45 per share. The cost of such purchases was approximately $10,882,000. All of the common stock was retired. Under the remainder of the new authorization, the Company may purchase up to an additional 865,374 shares, subject to the constraints of the Company’s current credit agreement. The shares may be purchased from time-to-time in the open market. The repurchase program may be discontinued at any time at the discretion of the Company.
The Company repurchased an additional 600,008 shares at an average cost of $11.74 per share through February 27, 2008, leaving 265,366 shares available for repurchase under the 2006 authorization. Subsequently, on February 28, 2008, the Company’s Board of Directors authorized a stock repurchase program whereby the Company may purchase up to an additional 1,500,000 of our common shares, subject to the terms of our current credit agreement. The shares may be repurchased from time-to-time in the open market and the repurchase program may be discontinued at any time at the Company’s discretion. This stock repurchase authorization will commence upon the completion of the May 2006 authorization.
Stock Options
2007 Stock Incentive Plan
The Company’s 2007 Stock Incentive Plan (2007 Plan) was approved by its stockholders at its 2007 Annual Meeting of Stockholders, held in May of 2007. The 2007 Plan provides for the issuance of stock options, stock appreciation rights, restricted stock, performance shares, and other stock-based awards, all as defined by the 2007 Plan, to eligible employees, consultants and non-employee Directors. The aggregate number of shares of common stock which may be issued or used for reference purposes under the 2007 Plan or with respect to which awards may be granted may not exceed 1,500,000 shares, which may be either authorized and unissued common stock or common stock held in or acquired for the treasury of the Company; provided, however, that 1,200,000 shares of this aggregate limit may be used for awards that are not “appreciation

CROSS COUNTRY HEALTHCARE, INC. NOTES TO CONSOLIDATED FINANCIAL STATEMENTS (CONTINUED)
DECEMBER 31, 2007
F-24
12. Stockholders’ Equity (Continued)
awards” (including restricted stock, performance shares or certain other stock-based awards). Due to the adoption of the 2007 Plan, no further grants will be issued under the 1999 Plans referred to below.
Under the 2007 Plan, the Compensation Committee of the Company’s Board of Directors (the Committee), has the discretion to determine the terms of the awards at the time of the grant. Provided, however, that, in the case of stock options and stock appreciation rights (share options): 1) the exercise price per share of the award is not less than 100% (or, in the case of 10% or more stockholders, the exercise price of the ISOs granted may not be less than 110%) of the fair market value of the common stock at the time of the grant; and 2) the term of the award will be no more than 10 years after the date the option is granted (or, shall not exceed five years, in the case of a 10% or more stock holder). In the case of restricted stock, the purchase price may be zero to the extent permitted by applicable law.
In October 2007, a total of 5,850 stock options, 170,500 stock appreciation rights and 84,600 shares of restricted stock were granted under the 2007 Plan to the Company’s management team. The stock appreciation rights can only be settled with stock. The awards granted vest over a 4 year period. Upon exercise, the Company’s policy is to issue new shares from its authorized but unissued balance of common stock outstanding or shares of common stock reacquired by the Company.
1999 Stock Option Plan and Equity Participation Plan
On December 16, 1999, the Company’s Board of Directors approved the 1999 Stock Option Plan and Equity Participation Plan (collectively, the 1999 Plans), which was amended and restated on October 25, 2001 and provided for the issuance of incentive stock options (ISOs) and non-qualified stock options to eligible employees and non-employee directors for the purchase of up to 4,398,001 shares of common stock. On December 30, 2005, the Compensation Committee approved the acceleration of the vesting of all unvested options to purchase the Company’s common stock held by employees, officers and directors of the Company issued under the Option Plan prior to December 31, 2005. All other terms and conditions applicable to the outstanding stock options remained in effect. A total of 436,368 options, with a weighted average exercise price of $15.25 per share, were accelerated. Of these options, 90% had exercise prices below market value (“in-the-money options”) as of December 28, 2005. The Committee members approved such acceleration of all unvested stock options pursuant to their authority under the Option Plan, effective December 31, 2005.
The Committee’s decision to accelerate the vesting of the affected options was based primarily upon the issuance of FASB Statement No. 123(R), which required the Company to treat unvested stock options as compensation expense effective January 1, 2006. See Note 2 – Summary of Significant Accounting Policies. The acceleration of the vesting of these options enabled the Company to avoid recognizing the associated stock-based compensation expense in future periods’ consolidated statements of income. The Company estimated the pre-tax charge avoided in future periods by the acceleration of these options to be approximately $2,900,000 (excluding the impact of forfeitures). The impact of this acceleration was reported by the Company on a pro forma basis in accordance with FASB Statement No. 123(R). In conjunction with the acceleration, the Company recorded a pre-tax charge of $115,663 in the fourth quarter of 2005 related to the acceleration of in-the-money options the Company estimated would not have otherwise vested. This charge was included in selling, general and administrative expenses on the consolidated statements of income.
Share option changes during the year ended December 31, 2007, were as follows:
December 31, 2007
Shares
Option Price
WeightedAverageExercise
Price
Share options outstanding at beginning of year .......................................... 2,391,434 $7.75-37.13 $14.25 Granted ....................................................................................................... 187,000 $15.71-$22.50 $18.42 Canceled ..................................................................................................... (19,120) $7.75-$26.15 $17.43 Exercised .................................................................................................... (195,331) $7.75-$17.50 $10.84
Share options outstanding at end of year .................................................... 2,363,983 $7.75-$37.13 $14.83 Share options exercisable at end of year ..................................................... 2,165,572 $7.75-$37.13 $14.52

CROSS COUNTRY HEALTHCARE, INC. NOTES TO CONSOLIDATED FINANCIAL STATEMENTS (CONTINUED)
DECEMBER 31, 2007
F-25
12. Stockholders’ Equity (Continued)
As of December 31, 2007, the Company had outstanding 2,328,434 share options that were fully vested or expected to vest at a weighted average exercise price of $14.78, aggregate intrinsic value of approximately $3,447,000, and weighted average contractual life of 3.6 years. As of December 31, 2007, 91.6% of share options outstanding, or 2,165,572 share options, were fully exercisable at a weighted average exercise price of $14.52, an aggregate intrinsic value of approximately $3,447,000 and a remaining contractual life of 3.1 years.
The following table represents information about stock options and stock appreciation rights granted and exercised in each year. During the years ended December 31, 2007, 2006 and 2005, the Company only issued options and stock appreciation rights at market price.
Year Ended December 31, 2007 2006 2005
Share option grants ............................................................................................... 187,000 27,650 319,000Weighted average grant date fair value of options granted during
the period ........................................................................................................... $ 9.24 $ 9.26 $ 9.06
Total intrinsic value of options exercised ............................................................ $ 1,606,538 $ 1,436,792 $ 1,176,671 During the year ended December 31, 2007, the Company issued 92,775 shares of restricted stock at a weighted average grant date fair value of $18.26. The shares vest ratably over a four year period ending on the anniversary date of the grant. There is no partial vesting and any unvested portion is forfeited.
The fair value of options granted used to compute pro forma net income disclosures here and within Note 2 were estimated on the date of grant using the Black-Scholes option-pricing model based on the following weighted average assumptions: Year Ended December 31, 2007 2006 2005 Expected dividend yield ....................................................................................... 0.00% 0.00% 0.00%Expected volatility ............................................................................................... 49.06 52.34 57.92 Risk-free interest rate ........................................................................................... 4.27% 4.82% 3.86%Expected life ........................................................................................................ 6 years 5 years 6 years The Company revised its methodology of estimating the expected life in conjunction with the adoption of FASB Statement No. 123(R) in the first quarter of 2006. The Company has been able to refine its estimate of expected life due to additional Company historical data being available. In prior periods, the Company had estimated expected life based only on the vesting and expiration dates of the options. Effective January 1, 2006, the expected life of the options is based on historical exercise behavior. The Company continues to compute expected volatility using the historical volatility of the market price of the Company’s common stock.
13. Earnings Per Share
In accordance with the requirements of FASB Statement No. 128, Earnings Per Share, basic earnings per share is computed by dividing net income by the weighted average number of shares outstanding (excluding nonvested restricted stock) and diluted earnings per share reflects the dilutive effects of stock options and restricted stock (as calculated utilizing the treasury stock method). Certain shares of common stock that are issuable upon the exercise of options have been excluded from the 2007, 2006 and 2005 per share calculations because their effect would have been anti-dilutive. Such shares amounted to 636,167, 347,019, and 404,462 during the years ended December 31, 2007, 2006 and 2005, respectively. For the years ended December 31, 2007, 2006 and 2005, respectively, 511,561, 660,179, and 544,656 incremental shares of common stock were included in diluted weighted average shares outstanding.

CROSS COUNTRY HEALTHCARE, INC. NOTES TO CONSOLIDATED FINANCIAL STATEMENTS (CONTINUED)
DECEMBER 31, 2007
F-26
14. Related Party Transactions
The Company provides services to hospitals which are affiliated with certain members of the Company’s Board of Directors. Pricing for the Company’s services is consistent with its other hospital customers. There are no contractual obligations with these hospitals. Revenue related to these transactions amounted to approximately $3,896,000, $4,656,000, and $6,895,000 in 2007, 2006 and 2005, respectively. Accounts receivable due from these hospitals at December 31, 2007 and 2006 were approximately $613,000 and $464,000, respectively.
15. Discontinued Operations
The following chart details amounts of revenue and pretax profit or loss reported in discontinued operations for the years ended December 31 2006 and 2005:
Year Ended December 31, 2006 2005
Revenue ............................................................................................................................. $ — $ 1,532,521
Discontinued operations, pretax ......................................................................................... $ 206,778 $ (923,585)
Tax (expense) benefit on discontinued operations ............................................................. (136,741) 335,552 $ 70,037 $ (588,033)
Discontinued operations during the years ended December 31, 2006 and 2005 include results from operations of the Company’s healthcare consulting business that was previously included in its other human capital management service business segment. On October 4, 2004, the Company sold assets of its Jennings Ryan & Kolb (JRK) and Gill/Balsano (GBC) consulting practices to Mitretek Systems, Inc. The remaining consulting practice was held for sale until the third quarter of 2005.
During the third quarter of 2005, the Company abandoned its efforts to sell the remaining consulting practice and shut down the remaining operations. The Company has continued to account for the consulting practice as discontinued operations within the consolidated financial statements and notes thereto. The Company estimated the remaining costs associated with the shut down of the business and recorded these costs in loss from discontinued operations in the third quarter of 2005. These costs were allocated to an impairment valuation previously recorded in 2004. In accordance with FASB Statement No. 144, any adjustments to these estimated amounts were recorded to discontinued operations in subsequent periods. There were no further adjustments subsequent to December 31, 2006.
16. Segment Information
In the second quarter of 2007, the Company reevaluated its reporting segments in conjunction with its recent acquisitions of clinical trials services businesses (See Note 4 – Acquisitions). As a result, the Company disaggregated clinical trials services from nurse and allied staffing, both formerly included in the healthcare staffing segment. The new reporting segment for clinical trials services includes the Company’s ClinForce business, Metropolitan Research, AKOS, and Assent. All prior period data has been reclassified to conform to the current period presentation.
Nurse and allied staffing primarily provides travel nurse and allied staffing services and per diem nurse services to acute care hospitals. Nurse and allied staffing services are also marketed to public and private healthcare facilities and for-profit and not-for-profit facilities throughout the U.S. Clinical trials services provides a flexible range of traditional contract staffing, clinical research outsourcing, drug safety monitoring, and regulatory consulting services to pharmaceutical, biotechnology and medical device companies, as well as contract research organization customers, primarily in the United States, Canada and Europe. Other human capital management services include the combined results of the Company’s education and training and retained search businesses.
The Company’s management evaluates performance of each segment primarily based on revenues and contribution income (which is defined as earnings before interest, income taxes, depreciation, amortization, legal settlement charge, secondary offering costs and corporate expenses not specifically identified to a reported segment). The Company’s management does not evaluate, manage or measure performance of segments using asset information; accordingly, asset information by

CROSS COUNTRY HEALTHCARE, INC. NOTES TO CONSOLIDATED FINANCIAL STATEMENTS (CONTINUED)
DECEMBER 31, 2007
F-27
16. Segment Information (Continued)
segment is not prepared or disclosed. See Note 3 – Goodwill and Other Identifiable Intangible Assets. The information in the following table is derived from the segments’ internal financial information as used for corporate management purposes. Certain corporate expenses are not allocated to and/or among the operating segments.
Information on operating segments and a reconciliation of such information to income from continuing operations before income taxes for the periods indicated are as follows: Year ended December 31, 2007 2006 (a) 2005 (a) Revenue from unaffiliated customers:
Nurse and allied staffing ........................................................... $ 576,779,440 $ 554,899,857 $ 553,235,536Clinical trials services ............................................................... 90,613,046 53,347,791 46,110,366Other human capital management services ............................... 50,879,983 46,904,283 46,046,684
$ 718,272,469 $ 655,151,931 $ 645,392,586Contribution income (b):
Nurse and allied staffing ........................................................... $ 54,941,170 $ 52,949,624 $ 46,730,084Clinical trials services ............................................................... 14,425,052 6,927,662 6,208,571Other human capital management services ............................... 7,609,281 9,048,367 8,116,062
Unallocated corporate overhead .................................................... 26,561,956 26,872,922 24,589,050Depreciation ................................................................................... 6,309,538 5,448,441 5,158,513Amortization .................................................................................. 2,051,311 1,570,005 1,423,629Legal settlement charge ................................................................. 33,654 6,704,392 —Secondary offering costs ................................................................ — 153,450 150,707Foreign exchange loss .................................................................... 92,937 — —Interest expense, net ....................................................................... 2,587,398 1,464,223 3,457,579Loss on early extinguishment of debt ............................................ — — 1,359,394Income from continuing operations before income taxes .............. $ 39,338,709 $ 26,712,220 $ 24,915,845———————
(a) Certain prior year income statement data has been reclassified to conform to the current year’s presentation.
(b) The Company defines contribution income as earnings before interest, income taxes, depreciation, amortization, legal settlement charge, secondary offering costs, foreign exchange loss and corporate expenses not specifically identified to a reporting segment. Contribution income is used by management when assessing segment performance and is provided in accordance with FASB No. 131, Disclosure about Segments of an Enterprise and Related Information.
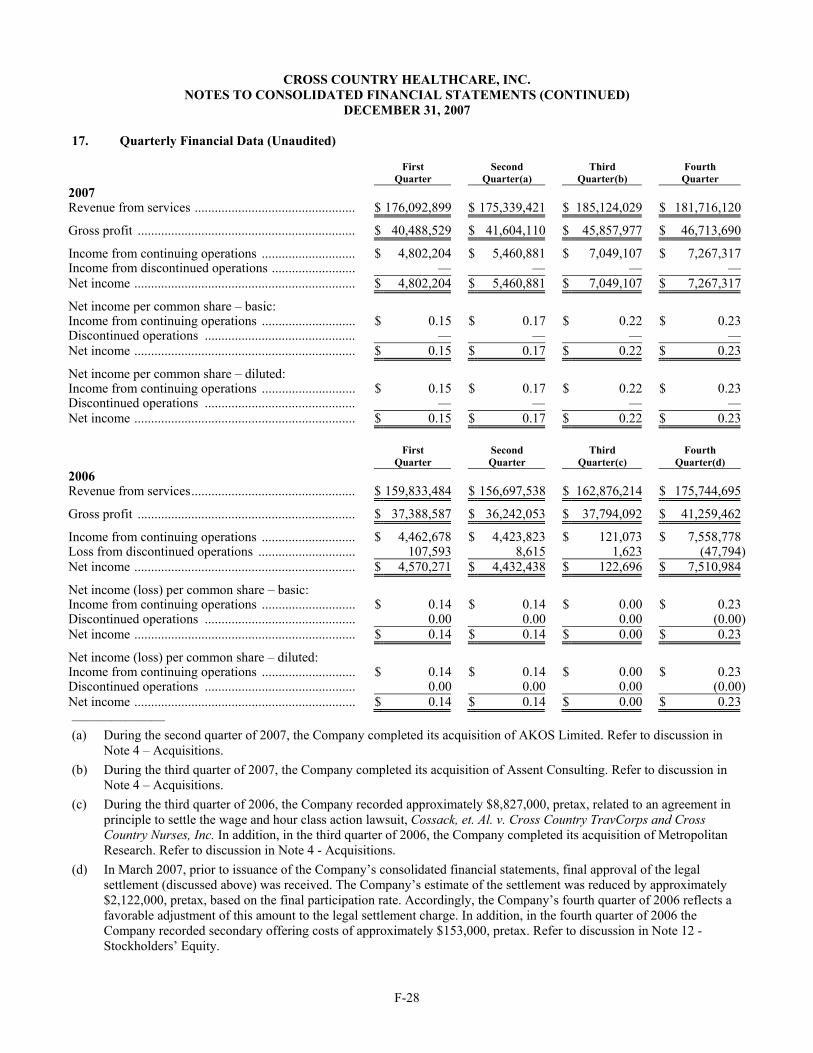
CROSS COUNTRY HEALTHCARE, INC. NOTES TO CONSOLIDATED FINANCIAL STATEMENTS (CONTINUED)
DECEMBER 31, 2007
F-28
17. Quarterly Financial Data (Unaudited)
First
Quarter Second
Quarter(a) Third
Quarter(b) Fourth Quarter
2007 Revenue from services ................................................ $ 176,092,899 $ 175,339,421 $ 185,124,029 $ 181,716,120
Gross profit ................................................................. $ 40,488,529 $ 41,604,110 $ 45,857,977 $ 46,713,690
Income from continuing operations ............................ $ 4,802,204 $ 5,460,881 $ 7,049,107 $ 7,267,317Income from discontinued operations ......................... — — — —Net income .................................................................. $ 4,802,204 $ 5,460,881 $ 7,049,107 $ 7,267,317
Net income per common share – basic: Income from continuing operations ............................ $ 0.15 $ 0.17 $ 0.22 $ 0.23Discontinued operations ............................................. — — — —Net income .................................................................. $ 0.15 $ 0.17 $ 0.22 $ 0.23
Net income per common share – diluted: Income from continuing operations ............................ $ 0.15 $ 0.17 $ 0.22 $ 0.23Discontinued operations ............................................. — — — —Net income .................................................................. $ 0.15 $ 0.17 $ 0.22 $ 0.23
First
Quarter Second Quarter
Third Quarter(c)
Fourth Quarter(d)
2006 Revenue from services................................................. $ 159,833,484 $ 156,697,538 $ 162,876,214 $ 175,744,695
Gross profit ................................................................. $ 37,388,587 $ 36,242,053 $ 37,794,092 $ 41,259,462
Income from continuing operations ............................ $ 4,462,678 $ 4,423,823 $ 121,073 $ 7,558,778Loss from discontinued operations ............................. 107,593 8,615 1,623 (47,794)Net income .................................................................. $ 4,570,271 $ 4,432,438 $ 122,696 $ 7,510,984
Net income (loss) per common share – basic: Income from continuing operations ............................ $ 0.14 $ 0.14 $ 0.00 $ 0.23Discontinued operations ............................................. 0.00 0.00 0.00 (0.00)Net income .................................................................. $ 0.14 $ 0.14 $ 0.00 $ 0.23
Net income (loss) per common share – diluted: Income from continuing operations ............................ $ 0.14 $ 0.14 $ 0.00 $ 0.23Discontinued operations ............................................. 0.00 0.00 0.00 (0.00)Net income .................................................................. $ 0.14 $ 0.14 $ 0.00 $ 0.23——————— (a) During the second quarter of 2007, the Company completed its acquisition of AKOS Limited. Refer to discussion in
Note 4 – Acquisitions. (b) During the third quarter of 2007, the Company completed its acquisition of Assent Consulting. Refer to discussion in
Note 4 – Acquisitions. (c) During the third quarter of 2006, the Company recorded approximately $8,827,000, pretax, related to an agreement in
principle to settle the wage and hour class action lawsuit, Cossack, et. Al. v. Cross Country TravCorps and Cross Country Nurses, Inc. In addition, in the third quarter of 2006, the Company completed its acquisition of Metropolitan Research. Refer to discussion in Note 4 - Acquisitions.
(d) In March 2007, prior to issuance of the Company’s consolidated financial statements, final approval of the legal settlement (discussed above) was received. The Company’s estimate of the settlement was reduced by approximately $2,122,000, pretax, based on the final participation rate. Accordingly, the Company’s fourth quarter of 2006 reflects a favorable adjustment of this amount to the legal settlement charge. In addition, in the fourth quarter of 2006 the Company recorded secondary offering costs of approximately $153,000, pretax. Refer to discussion in Note 12 - Stockholders’ Equity.
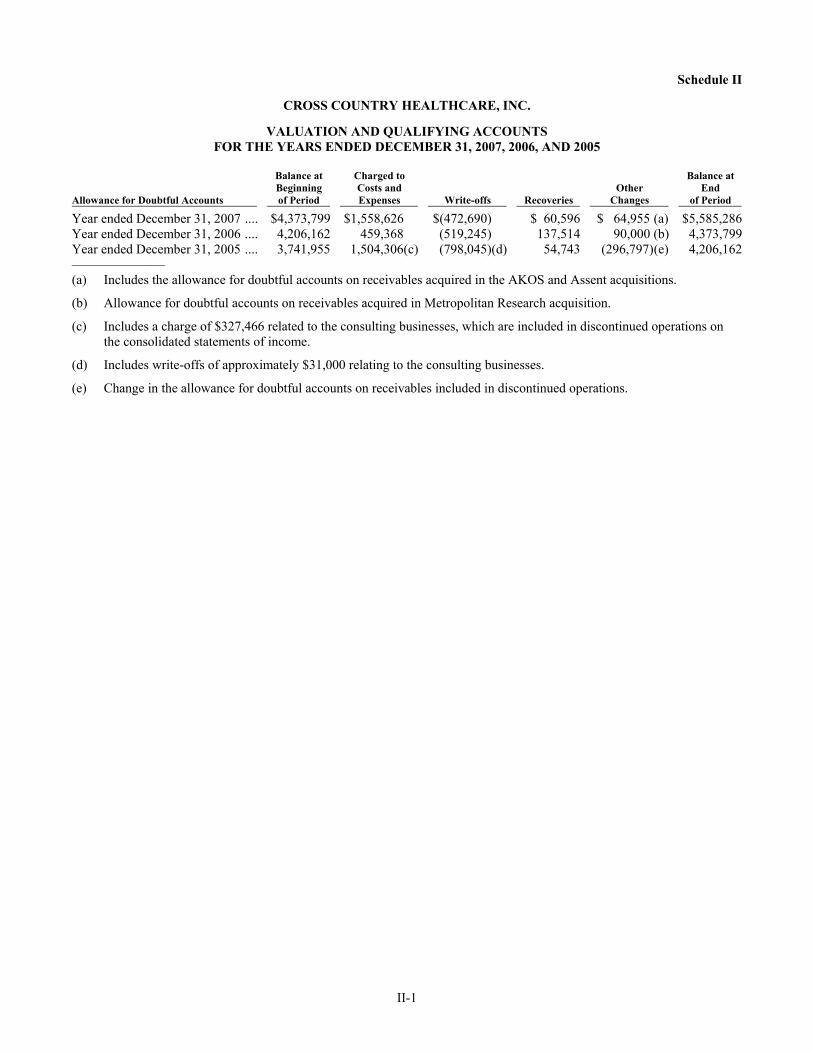
II-1
Schedule II
CROSS COUNTRY HEALTHCARE, INC.
VALUATION AND QUALIFYING ACCOUNTS FOR THE YEARS ENDED DECEMBER 31, 2007, 2006, AND 2005
Allowance for Doubtful Accounts
Balance at Beginning of Period
Charged to Costs and Expenses Write-offs Recoveries
Other Changes
Balance at End
of Period
Year ended December 31, 2007 .... $4,373,799 $1,558,626 $(472,690) $ 60,596 $ 64,955 (a) $5,585,286Year ended December 31, 2006 .... 4,206,162 459,368 (519,245) 137,514 90,000 (b) 4,373,799Year ended December 31, 2005 .... 3,741,955 1,504,306(c) (798,045)(d) 54,743 (296,797)(e) 4,206,162——————— (a) Includes the allowance for doubtful accounts on receivables acquired in the AKOS and Assent acquisitions.
(b) Allowance for doubtful accounts on receivables acquired in Metropolitan Research acquisition.
(c) Includes a charge of $327,466 related to the consulting businesses, which are included in discontinued operations on the consolidated statements of income.
(d) Includes write-offs of approximately $31,000 relating to the consulting businesses.
(e) Change in the allowance for doubtful accounts on receivables included in discontinued operations.

Exhibit 21.1
LIST OF SUBSIDIARIES
Subsidiary State of Incorporation Assignment America, Inc. Delaware Cejka Search, Inc. Delaware CC Staffing, Inc. Delaware ClinForce, LLC (f/k/a ClinForce, Inc.) Delaware Cross Country Capital, Inc. Delaware Cross Country Infotech, Pvt, Ltd. India Cross Country Local, Inc. (f/k/a Flex Staff, Inc.) Delaware Cross Country Education, LLC (f/k/a Cross Country Education, Inc., Cross
Country Seminars, Inc., and CCS /Heritage Acquisition Corp.)
Delaware Cross Country TravCorps, Inc. Delaware HealthStaffers, Inc. Delaware MCVT, Inc. Delaware Med-Staff, Inc. (f/k/a Cross Country Nurses, Inc.) Delaware Metropolitan Research Associates, Inc. Delaware Metropolitan Research Staffing Associates, Inc. Delaware Assent Consulting California Cross Country Holdco (Cyprus) Limited Cyprus Cross Country Healthcare UK Holdco United Kingdom Akos Limited United Kingdom MRA Search, Inc. Delaware

Exhibit 23.1
CONSENT OF INDEPENDENT REGISTERED PUBLIC ACCOUNTING FIRM
We consent to the incorporation by reference in the following Registration Statements: (1) Registration Statement (Form S-3 No. 333-120189) and the related Prospectus of Cross Country Healthcare, Inc.; (2) Registration Statement (Form S-8 No. 333-74862) pertaining to Cross Country Healthcare, Inc.’s Amended and
Restated 1999 Stock Option Plan and Cross Country Healthcare, Inc.’s Amended and Restated Equity Participation Plan; and
(3) Registration Statement (Form S-8 No. 333-145484) pertaining to Cross Country Healthcare, Inc.’s 2007 Stock
Incentive Plan of our report dated March 10, 2008 with respect to the consolidated financial statements and schedule of Cross Country Healthcare, Inc., and our report dated March 10, 2008, with respect to the effectiveness of internal control over financial reporting of Cross Country Healthcare, Inc. in this Annual Report (Form 10-K) for the year ended December 31, 2007.
/s/ ERNST & YOUNG LLP Certified Public Accountants
West Palm Beach, Florida March 10, 2008

Exhibit 31.1
CERTIFICATION
I, Joseph A. Boshart, certify that:
1. I have reviewed this annual report on Form 10K of Cross Country Healthcare, Inc.;
2. Based on my knowledge, this report does not contain any untrue statement of a material fact or omit to state a material fact necessary to make the statements made, in light of the circumstances under which such statements were made, not misleading with respect to the period covered by this report;
3. Based on my knowledge, the financial statements, and other financial information included in this report, fairly present in all material respects the financial condition, results of operations and cash flows of the registrant as of, and for, the periods presented in this report;
4. The registrant's other certifying officer(s) and I are responsible for establishing and maintaining disclosure controls and procedures (as defined in Exchange Act Rules 13a-15(e) and 15d-15(e)) and internal control over financial reporting (as defined in Exchange Act Rules 13a-15(f) and 15d-15(f)) for the registrant and have:
a) Designed such disclosure controls and procedures, or caused such disclosure controls and procedures to be designed under our supervision, to ensure that material information relating to the registrant, including its consolidated subsidiaries, is made known to us by others within those entities, particularly during the period in which this report is being prepared;
b) Designed such internal control over financial reporting, or caused such internal control over financial reporting to be designed under our supervision, to provide reasonable assurance regarding the reliability of financial reporting and the preparation of financial statements for external purposes in accordance with generally accepted accounting principles;
c) Evaluated the effectiveness of the registrant's disclosure controls and procedures and presented in this report our conclusions about the effectiveness of the disclosure controls and procedures, as of end of the period covered by this report based on such evaluation; and
d) Disclosed in this report any change in the registrant's internal control over financial reporting that occurred during the registrant's most recent fiscal quarter (the registrant's fourth fiscal quarter in the case of an annual report) that has materially affected, or is reasonably likely to materially affect, the registrant's internal control over financial reporting; and
5. The registrant's other certifying officer and I have disclosed, based on our most recent evaluation of internal control over financial reporting, to the registrant's auditors and the audit committee of registrant's board of directors (or persons performing the equivalent function):
a) All significant deficiencies and material weaknesses in the design or operation of internal control over financial reporting which are reasonably likely to adversely affect the registrant's ability to record, process, summarize and report financial information; and
b) Any fraud, whether or not material, that involves management or other employees who have a significant role in the registrant's internal control over financial reporting.
Date: March 13, 2008 /s/ JOSEPH A. BOSHART Joseph A. Boshart President and Chief Executive Officer

Exhibit 31.2
CERTIFICATION I, Emil Hensel, certify that: 1. I have reviewed this annual report on Form 10K of Cross Country Healthcare, Inc.; 2. Based on my knowledge, this report does not contain any untrue statement of a material fact or omit to state a
material fact necessary to make the statements made, in light of the circumstances under which such statements were made, not misleading with respect to the period covered by this report;
3. Based on my knowledge, the financial statements, and other financial information included in this report, fairly
present in all material respects the financial condition, results of operations and cash flows of the registrant as of, and for, the periods presented in this report;
4. The registrant's other certifying officer(s) and I are responsible for establishing and maintaining disclosure controls
and procedures (as defined in Exchange Act Rules 13a-15(e) and 15d-15(e)) and internal control over financial reporting (as defined in Exchange Act Rules 13a-15(f) and 15d-15(f)) for the registrant and have:
a) Designed such disclosure controls and procedures, or caused such disclosure controls and procedures to be
designed under our supervision, to ensure that material information relating to the registrant, including its consolidated subsidiaries, is made known to us by others within those entities, particularly during the period in which this report is being prepared;
b) Designed such internal control over financial reporting, or caused such internal control over financial
reporting to be designed under our supervision, to provide reasonable assurance regarding the reliability of financial reporting and the preparation of financial statements for external purposes in accordance with generally accepted accounting principles;
c) Evaluated the effectiveness of the registrant's disclosure controls and procedures and presented in this report
our conclusions about the effectiveness of the disclosure controls and procedures, as of end of the period covered by this report based on such evaluation; and
d) Disclosed in this report any change in the registrant's internal control over financial reporting that occurred
during the registrant's most recent fiscal quarter (the registrant's fourth fiscal quarter in the case of an annual report) that has materially affected, or is reasonably likely to materially affect, the registrant's internal control over financial reporting; and
5. The registrant's other certifying officer and I have disclosed, based on our most recent evaluation of internal control
over financial reporting, to the registrant's auditors and the audit committee of registrant's board of directors (or persons performing the equivalent function):
a) All significant deficiencies and material weaknesses in the design or operation of internal control over
financial reporting which are reasonably likely to adversely affect the registrant's ability to record, process, summarize and report financial information; and
b) Any fraud, whether or not material, that involves management or other employees who have a significant
role in the registrant's internal control over financial reporting. Date: March 13, 2008 /s/ EMIL HENSEL Emil Hensel Chief Financial Officer
Exhibit 32.1
CERTIFICATION PURSUANT TO 18 U.S.C. SECTION 1350 In connection with the accompanying Annual Report on Form 10-K of Cross Country Healthcare, Inc. (the "Company") for the year ended December 31, 2007 (the "Periodic Report"), I, Joseph A. Boshart, Chief Executive Officer of the Company, hereby certify pursuant to 18 U.S.C. Section 1350, as adopted pursuant to Section 906 of the Sarbanes-Oxley Act of 2002, that to my knowledge the Periodic Report fully complies with the requirements of Section 13(a) or 15(d) of the Securities Exchange Act of 1934 and that the information contained in the Periodic Report fairly presents, in all material respects, the financial condition and results of operations of the Company. Date: March 13, 2008 /s/ JOSEPH A. BOSHART Joseph A. Boshart Chief Executive Officer
The foregoing certification is provided solely for purposes of complying with the provisions of Section 906 of the Sarbanes-Oxley Act of 2002.

Exhibit 32.2
CERTIFICATION PURSUANT TO 18 U.S.C. SECTION 1350 In connection with the accompanying Annual Report on Form 10-K of Cross Country Healthcare, Inc. (the "Company") for the year ended December 31, 2007 (the "Periodic Report"), I, Emil Hensel, Chief Financial Officer of the Company, hereby certify pursuant to 18 U.S.C. Section 1350, as adopted pursuant to Section 906 of the Sarbanes-Oxley Act of 2002, that to my knowledge the Periodic Report fully complies with the requirements of Section 13(a) or 15(d) of the Securities Exchange Act of 1934 and that the information contained in the Periodic Report fairly presents, in all material respects, the financial condition and results of operations of the Company. Date: March 13, 2008 /s/ EMIL HENSEL Emil Hensel Chief Financial Officer
The foregoing certification is provided solely for purposes of complying with the provisions of Section 906 of the Sarbanes-Oxley Act of 2002.

[This page intentionally left blank]
At Cross Country Healthcare, we know that our
success is dependent on how well we serve our
clients. That’s why we make it a priority to work
and grow together. We motivate each other to go
beyond expectations and to achieve more than
we thought possible. It’s our belief that customers
are won over and held onto, one at a time. And
through reliable, honest communication, we will
do our best to ensure that our customers know
they are an integral part of our continued growth
and success.
Working Towards Our Goal
EXECUTIVE OFFICERSJoseph A. BoshartPresident and Chief Executive Officer
Emil HenselChief Financial Officer
Vickie AnenbergExecutive Vice President,Cross Country Staffing
Susan E. Ball, RNGeneral Counsel
Greg GreenePresident, Cross Country Education
Victor KalafaVice President, Corporate Development
Daniel J. LewisPrincipal Accounting Officer
Dr. Franklin A. Shaffer, EdD, RN, FAANChief Nursing Officer
Tony SimsPresident, ClinForce
Jonathan W. WardPresident, Cross Country Staffing
Carol WestfallPresident, Cejka Search
CORPORATE HEADQUARTERSCross Country Healthcare, Inc.6551 Park of Commerce Blvd.Boca Raton, Florida 33487Phone: 561.998.2232www.crosscountryhealthcare.com
STOCKHOLDER INQUIRIESNews releases, SEC filings, annual reports,corporate governance matters and additionalinformation about Cross Country Healthcareare available on our corporate website at nocost. Current and prospective investors canalso register to automatically receive by emailour press releases, SEC filings and othernotices. Information about the Company canalso be obtained by writing or contacting:
Howard A. GoldmanDirector of Investor & Corporate RelationsPhone: 561.998.2232Toll-Free: 877.686.9779Email: [email protected]
Certain exhibits in our Form 10-K for theyear ended December 31, 2007, as filedwith the SEC, are not included in the Form10-K enclosed as part of this AnnualReport. Our Form 10-K, including allexhibits, is available on our corporatewebsite or the SEC’s website atwww.sec.gov.
INDEPENDENT REGISTERED PUBLIC ACCOUNTING FIRMErnst & Young LLPOne Clearlake CentreSuite 900250 South Australian AvenueWest Palm Beach, Florida 33401
TRANSFER AGENTLaSalle Bank National Association135 South LaSalle StreetSuite 1960Chicago, IL 60603Toll-Free: 800.246.5761Fax: 312.904.2236
CORPORATE GOVERNANCEInformation concerning our corporate governance practices,including our Code of Conduct, Codeof Ethics, Committee Charters, andCertification of Financial Statements,is available on our corporate websiteat www.crosscountryhealthcare.com.
We also have established a toll-freephone number and an email addressfor stockholders to communicate withour Board of Directors. All such communications will be kept confidential and forwarded directly tothe appropriate party, as applicable.
Hotline: 800.354.7197 E-mail: [email protected]
STOCK LISTINGOur common stock trades under thesymbol “CCRN” on the NASDAQGlobal Select Market, a new markettier created by the NASDAQ StockMarket® that became effective on July 1,2006. NASDAQ became operational asa stock exchange on August 1, 2006.
FORWARD-LOOKING STATEMENTSInformation concerning forward-lookingstatements can be found on page 1 ofour Annual Report on Form 10-K forthe year ended December 31, 2007,as well as in Quarterly Reports onForm 10-Q to be filed by us in fiscalyear 2008.
BOARD OF DIRECTORSJoseph A. BoshartPresident and Chief Executive OfficerCross Country Healthcare, Inc.
W. Larry Cash (a)(b)
Executive Vice President and Chief Financial OfficerCommunity Health Systems
C. Taylor Cole, Jr.PartnerCharterhouse Group, Inc.
Thomas C. Dircks (b)(c)
Managing PartnerCharterhouse Group, Inc.
Gale Fitzgerald (a)
PrincipalTranspeed, Inc.
Emil HenselChief Financial OfficerCross Country Healthcare, Inc.
Joseph Trunfio (a)(c)
President and Chief Executive OfficerAtlantic Health Systems
(a) Member of the Audit Committee (b) Member of the Compensation Committee(c) Member of the Nominating Committee

Related Documents