Working Paper No. 611 Why Has China Succeeded—And Why It Will Continue To Do So by Jesus Felipe Utsav Kumar Norio Usui Arnelyn Abdon Asian Development Bank, Manila, Philippines* August 2010 * This paper represents the views of the authors and not those of the Asian Development Bank, its executive directors, or the member countries they represent. We are grateful to Justin Lin and Ha-Joon Chang for their very useful comments; the usual disclaimer applies. Contacts: [email protected] (corresponding author); [email protected]; [email protected]; [email protected]. The Levy Economics Institute Working Paper Collection presents research in progress by Levy Institute scholars and conference participants. The purpose of the series is to disseminate ideas to and elicit comments from academics and professionals. Levy Economics Institute of Bard College, founded in 1986, is a nonprofit, nonpartisan, independently funded research organization devoted to public service. Through scholarship and economic research it generates viable, effective public policy responses to important economic problems that profoundly affect the quality of life in the United States and abroad. Levy Economics Institute P.O. Box 5000 Annandale-on-Hudson, NY 12504-5000 http://www.levyinstitute.org Copyright © Levy Economics Institute 2010 All rights reserved

Welcome message from author
This document is posted to help you gain knowledge. Please leave a comment to let me know what you think about it! Share it to your friends and learn new things together.
Transcript

Working Paper No. 611
Why Has China Succeeded—And Why It Will Continue To Do So
by
Jesus FelipeUtsav Kumar
Norio UsuiArnelyn Abdon
Asian Development Bank, Manila, Philippines*
August 2010
* This paper represents the views of the authors and not those of the Asian Development Bank, its executivedirectors, or the member countries they represent. We are grateful to Justin Lin and Ha-Joon Chang for their veryuseful comments; the usual disclaimer applies. Contacts: [email protected] (corresponding author);[email protected]; [email protected]; [email protected].
The Levy Economics Institute Working Paper Collection presents research in progress byLevy Institute scholars and conference participants. The purpose of the series is todisseminate ideas to and elicit comments from academics and professionals.
Levy Economics Institute of Bard College, founded in 1986, is a nonprofit,nonpartisan, independently funded research organization devoted to public service.Through scholarship and economic research it generates viable, effective public policyresponses to important economic problems that profoundly affect the quality of life inthe United States and abroad.
Levy Economics InstituteP.O. Box 5000
Annandale-on-Hudson, NY 12504-5000http://www.levyinstitute.org
Copyright © Levy Economics Institute 2010 All rights reserved

1
ABSTRACT
The key factor underlying China’s fast development during the last 50 years is its ability
to master and accumulate new and more complex capabilities, reflected in the increase in
diversification and sophistication of its export basket. This accumulation was policy
induced and not the result of the market, and began before 1979. Despite its many policy
mistakes, if China had not proceeded this way, in all likelihood it would be a much
poorer country today. During the last 50 years, China has acquired revealed comparative
advantage in the export of both labor-intensive products (following its factor abundance)
and sophisticated products, although the latter does not indicate that there was
leapfrogging. Analysis of China’s current export opportunity set indicates that it is
exceptionally well positioned (especially taking into account its income per capita) to
continue learning and gaining revealed comparative advantage in the export of more
sophisticated products. Given adequate policies, carefully thought-out and implemented
reforms, and skillful management of constraints and risks, China has the potential to
continue thriving. This does not mean, however, that high growth will continue
indefinitely.
Keywords: China; Capabilities; Diversification; Export-led Growth; Leapfrogging; Open
Forest; Product Space; Sophistication
JEL Classifications: O20, O25, O53

1
1. INTRODUCTION
There is a vast literature trying to explain China’s very high GDP growth rate and
poverty reduction since it started its transition to the market system in 1979.1 The three
key stylized facts that underlie China’s high output growth rates are: first, its high growth
rates of capital accumulation, driven by high investment-output ratios; second, a marked
outward orientation through export-led growth policies (Felipe, Laviña, and Fan 2008); 2
and third, the pursuit of industrialization (in particular the production and export of
manufactures), a key ingredient for fast growth and development (Rodrik 2006a). China’s
miracle is that it has been able to sustain this process for three decades.3
In this paper we try to gain insight into China’s development by analyzing the
evolution of its export basket since the 1960s, in particular how it has become more
diversified and how it has shifted to products with higher income content. We argue that
while reforms after 1979 were important because they opened the economy and provided
incentives for the private sector to develop, they could not have succeeded without
acknowledging the stock of capabilities that existed in the country. We show that as far
back as the 1960s, China’s productive structure was quite complex already and this set
the basis for the country’s future high growth. Reforms toward a market system since the
1980s have been a key in China’s development. However, we stress the path-dependent
nature of development and emphasize the significant knowledge that had been
accumulated before reforms started.
The historical experience of the advanced economies and that of Asian countries
such as South Korea indicates that development entails a shift from dependence on
agricultural activities (especially on farming) into reliance on modern industrial and
1 Average GDP growth rate for 1960–2007 was 7.82%, and 6.21% in per capita terms. For 1980–2007, the rates were 9.93% and 8.74%, respectively. 2 Also, some growth accounting studies have documented that total factor productivity growth has been relatively high. On the contributions of factor accumulation and total factor productivity growth to overall growth, see, for example, Tsui, Hsueh, and Rawski (1995), Borensztein and Ostry (1996), Hu and Khan (1997), Young (2000), Felipe and McCombie (2002), Heytens and Zebregs (2003), Blanchard and Giavazzi (2005), and Islam, Dai, and Sakamoto (2006). Chow (1993) and Felipe and McCombie (2010) discuss the pre-reform period. 3 See the recent work by Storm and Naastepad (2005) and Lee and Mathews (2010). They emphasize different aspects of East Asia’s (China included) development, in particular the drive toward industrialization, the emphasis on capability building, export orientation, industrial targeting, and sequential upgrading. All of them are part of China’s story.

2
service sectors. This shift is referred to as structural transformation, and it is what leads to
fast and sustained growth. In other words, becoming a developed country requires
achieving sustained growth for a period of decades. In general, the only way to do this is
through significant structural transformation.4
More precisely, structural transformation is the process by which countries
change what they produce and how they do it, as well as how they move from low-
productivity and low-wage activities, to high-productivity and high-wage activities.
Structural transformation has three components: (i) shifts in the output structure, from
activities of relatively low productivity into high-productivity activities; (ii) shifts in the
employment structure, typically a decline in the share of employment in agriculture;5 and
(iii) upgrading and diversification of the production and export baskets. It is not obvious
how this process happens, except that in all successful cases, there has been some form of
government intervention. In the case of China, this process did not start taking place on a
major scale until after the Communist Revolution. 6
Along these lines, Hausmann, Hwang, and Rodik (2007), Hidalgo et al. (2007),
Hidalgo (2009) and Hidalgo and Hausmann (2009) have argued recently that growth and
development are the result of structural transformation, and, crucial in their story, show
4 This is a point forcefully emphasized by Chang (2009a) in his critique of some recent interpretations of development as poverty reduction. 5 The share of agriculture in total GDP has declined significantly, from about 60% during 1952–70, to slightly over 10% in recent years. However, agriculture is still the largest employer in the economy (still over 40% of total employment). Felipe (2009: 150–151) concludes that most of the growth in overall labor productivity in China during 1987–2002 was due to the growth in labor productivity within industry. The contributions of labor productivity growth within agriculture and within services were minimal. Likewise, the contribution of labor relocation from agriculture into industry to overall labor productivity growth was negative due to the decline in the employment share in industry during this period, while the contribution of labor relocation from agriculture into services was significant due to the large increase in the share of employment in services. Overall, the growth in labor productivity in industry plus the effect of relocation of labor from agriculture into services accounts for over 80% of overall labor productivity growth during said period. 6 Ward (1962) notes that despite China’s great knowledge (e.g., printing and gunpowder were invented far ahead of the West), the break-through (i.e., modern take-off as a result of the application of science to economic processes), never came. She argues that “the Confucian gentleman who dominated the official thinking of Chinese society thought science an occupation for charlatans and fools and, therefore, not really respectable […] They (the Confucians) turned their backs on experiment and, in doing so, on science as well. So in China, for ancient glory of its culture, for all the force and vitality of its intellectual tradition, the scientific break-through could not occur” (Ward 1962: 48–49).
3
that not all products carry the same consequences for a country’s development.7 The
reality is that developing countries face serious problems when they try to become
competitive in a new product, when they try to enter a new market, and when they try to
shift production and exports toward more sophisticated products. Hausmann, Hwang, and
Rodik (2007) show that the specific set of products that a country exports has important
consequences for the pattern of development. Empirically, a measure of the
sophistication of a country’s export basket proves to be a good predictor of future growth:
controlling for initial income, countries with a more sophisticated export basket (also
initially) grow faster. On these grounds, Hidalgo et al. (2007) argue that development has
to be understood as the process of accumulating more complex sets of capabilities and of
finding paths that create incentives for those capabilities to be accumulated and used. The
implication is that a growth miracle sustained for several decades must involve the
continual introduction of new goods, not merely continual learning on a fixed set of
goods. To analyze development and structural transformation from this perspective,
Hidalgo et al. (2007) have developed a new analytical tool called the product space.
In this paper, we study how China has progressed since the early 1960s as a result
of learning and accumulating the capabilities necessary to produce and export new and
more sophisticated products. China’s high growth rates during the last five decades, the
result of massive investment (reaching 40–50% of GDP) and successful integration into
the world economy through trade, only make sense in a context of high assimilation and
absorption capabilities, increasing capacity to employ new methods of production and
new inputs, and significant upgrading (Abramovitz 1986; Nelson and Pack 1999).8
We focus on two aspects: (i) the sophistication of China’s export basket; and (ii)
the number of products in which China has acquired revealed comparative advantage
(diversification). Sophistication and diversification capture different aspects of how
countries progress. The first one captures the ability to export products produced and
exported by the rich countries to the extent that, in general, they embody higher
productivity, wages, and income per capita. The second factor captures the ability to 7 Certainly these claims are not new. The importance of industrialization was highlighted by Nicholas Kaldor (1967) and others (on this see Felipe et al. [2009]). The contribution of this recent literature is the methods of analysis developed. 8 The success of China’s industrial development is a point also stressed by scholars like Brandt, Rawski, and Sutton (2008). Our analysis uses a different methodology.

4
become competitive in a wider range of products, measured by the number of products
exported with revealed comparative advantage. The rationale that underlies our analysis
is that technical progress and structural change evolve together (technical progress
induces structural change and vice versa; they jointly lead to growth), and underlying
both is the mastering of new capabilities. We look at these two issues at the level of 779
products exported.9
The rest of the paper is structured as follows. Section 2 provides an analysis of the
sophistication and diversification of China’s export basket. Section 3 discusses China’s
product space. Sections 4 and 5 provide an analysis of China’s future export
opportunities. Section 6 discusses whether it can continue growing so fast, in the context
of the risks and constraints that it faces. Section 7 summarizes the main findings and
draws some policy implications.
2. EXPORT SOPHISTICATION AND PRODUCT DIVERSIFICATION
Following Hausmann, Hwang, and Rodik (2007), we first calculate the level of
sophistication of a product (PRODY) as a weighted average of the GDP per capita of the
countries that export the product in question. 10 This is calculated individually for each
product. PRODY provides a measure of the income content of a product. It is, therefore, 9 Data for the period 1962–76 was downloaded from the National Bureau of Economic Research: http://www.nber.org/data/. See Feenstra et al. (2005) for details. Data for 1977–2006 was downloaded from the United Nations Commodity Trade Statistics: http://comtrade.un.org/
10 Algebraically:c
c
ci
ci
ci
ici
ci
i GDPPC
xvalxval
xvalxval
PRODY ×
⎥⎥⎥⎥⎥⎥⎥
⎦
⎤
⎢⎢⎢⎢⎢⎢⎢
⎣
⎡
⎟⎟⎟
⎠
⎞
⎜⎜⎜
⎝
⎛= ∑
∑ ∑
∑, where xvalci is the value of
country c’s export of commodity i and GDPPCc is country c’s per capita GDP. GDPPC is from World Development Indicators and is measured .in 2005 PPP. Therefore, the unit of PRODY is PPP dollars. We have calculated PRODY for the 779 products in our analysis. The product with the highest sophistication level is “furnace burners,” with an index of almost $40,000. The product with the lowest level is “tin ores,” with an index of $955. By categories, the average sophistication levels are as follows: machinery, $19,549; chemicals, $18,507; metal products, $15,804; forest products, $15,028; labor-intensive, $14,026; petroleum, $13,213; capital-intensive (excluding metals), $12,879; animal products, $12,199; raw materials, $10,967; cereals, $8,681; tropical agriculture, $8,363.

5
not an engineering notion. For example, a chair will have a high level of sophistication if
it is exported by a large group of developed countries. This will simply mean that
consumers in other countries are willing to pay a high price for the chair and therefore,
the chair will be most likely a product with a high income elasticity. Second, we calculate
the level of sophistication of a country’s export basket (EXPY) as the weighted average
of the level of sophistication of the products that it exports (i.e., of the different PRODY). 11
Figure 1 shows the EXPY index for China and a group of comparator countries,
as well as for some developed countries. The figure indicates that in the early 1960s,
when China was still one of the poorest economies in the world, EXPY was about
$10,000. By 2006, China’s export basket had achieved a relatively high level of
sophistication, $16,757, comparable to that of Japan in 1970–75, Spain, Italy and
Singapore in 1985–90, and Korea in 1990–95; it has already overtaken Portugal. In Asia,
only Japan, Singapore, Korea, and Malaysia are ahead of China today.
11 Algebraically: ∑ ∑ ⎟⎟⎟
⎠
⎞
⎜⎜⎜
⎝
⎛×=
ii
ici
cic PRODY
xvalxval
EXPY . Like PRODY, its unit of measurement is
dollars in PPP terms.

6
Figure 1. Level of Export Sophistication of the Export Basket (EXPY)
Source: Authors’ calculations
Figure 2 decomposes the level of EXPY into the contribution of Leamer’s (1984)
categories (see appendix table 1). The figure indicates that while in the 1960s most of the
level of EXPY was contributed to by animal and capital-intensive products, by 2006 the
largest contributor was machinery.
Figure 3 shows the relationship between export sophistication (EXPY) and GDP
per capita in 2006. The graph reveals that China’s export package is very sophisticated
given its income per capita. Felipe (2010: table 10.4) estimates that a 10% increase in
EXPY at the beginning of the period raises growth by about half a percentage point. In
2,500
7,500
12,500
17,500
22,500
EXP
Y (2
005
PPP
$)
1962 1966 1970 1974 1978 1982 1986 1990 1994 1998 2002 2006
Germany
Italy
Japan
Korea
Portugal
Spain
USA
2,500
7,500
12,500
17,500
22,500E
XPY
(200
5 P
PP $
)
1962 1966 1970 1974 1978 1982 1986 1990 1994 1998 2002 2006
PRC
India
Indonesia
Malaysia
Pakistan
Thailand
Singapore

7
our view, those who criticize today the role of export-led growth in China’s policy miss
the point that the true driver of growth has been the superb increase in sophistication of
its export basket.
Figure 2. China: EXPY by Leamer’s Classification
0
5,000
10,000
15,000
20,000
EXP
Y (2
005
PPP
$)
1962 1965 1970 1975 1980 1985 1990 1995 2000 2005 2006
Animal products
Capital intensive
Cereals
Chemicals
Forest products
Labor intensive
Machinery
Petroleum
Raw materials
Tropical agriculture
Source: Authors’ calculations Figure 3. Export Sophistication (EXPY) and GDP Per Capita, 2006
Source: Authors’ calculations

8
Diversification is measured as the absolute number of products that a country
exports with comparative advantage.12 This is shown in figure 4, which indicates that in
the early 1960s, China already exported a significant number of products with
comparative advantage, 105 (out of a total of 779 in the analysis), well ahead of Korea,
which exported only 41 products with comparative advantage, and Brazil 45. By 2006,
China exported 269 products with comparative advantage, marginally below the number
of products exported with comparative advantage by Italy and Spain (among the most
diversified countries in the world), and above countries like Japan (192 products) or
Korea (135 products). Since the 1960s, the number of products that China exports with
comparative advantage has increased very fast. For example, between 1975 and 1980,
China gained comparative advantage in 88 new products, and between 1985 and 1990 in
another 68.13
To gain insight into the products that China exports, we have split them into
Leamer’s (1984) categories. They are shown in table 1. The most sophisticated products
are machinery (with an average level of sophistication PRODY of $19,549), chemicals
(with an average PRODY of $18,507), and metal products (with an average PRODY of
$15,804). We refer to these as “core” commodities. These three categories contain a total
of 325 commodities (181 machinery, 95 chemicals, and 49 metal products) out of the
total 779, with an average sophistication level of $18,705 (the average sophistication
level of the remaining commodities is $11,794).
12 Specifically, this is the number of products with an index of revealed comparative advantage (RCA) greater than 1. The index of revealed comparative advantage is the ratio of the export share of a given product in the country’s export basket to the same share at worldwide level (Balassa 1965). Algebraically:
∑∑∑
∑=
i cci
cci
ici
ci
ci
xval
xval
xvalxval
RCA . The index of revealed comparative advantage can be a problematic
indicator, especially if used for comparison of different products. For example, a country very well endowed with a specific natural resource can have an RCA in the thousands. However, the highest RCA in automobiles is about 2. 13 These figures are the net gain, since China also lost comparative advantage in some products during the periods considered. The net gain is the difference between the number of (new) products in which China acquired comparative advantage and the number of (old) products in which China lost comparative advantage.

9
Figure 4. Diversification of the Export Basket
Source: Authors’ calculations. Note: there is a jump in 1973–74 that results from the oil price shock.
The table shows that China’s progression has been impressive. In 1962, out of the
105 products exported with comparative advantage, only fourteen (or 13% of the total)
were highly sophisticated, or “core,” products: six chemicals (three of which were
products with a level of sophistication above $20,000; one of the other three, pyrotechnic
articles, was exported with a very high revealed comparative advantage, 12.06), seven
metals, and one machinery.14 The bulk of products that China exported with comparative
14 The 14 products are: CHEMICALS 1. pharmaceutical goods (PRODY=$22,345, RCA=2.24); 2.woods and resin-based chemical products (PRODY=$17,335, RCA=2.92); 3. perfumery and cosmetics
0
100
200
300D
iver
sific
atio
n
1962 1966 1970 1974 1978 1982 1986 1990 1994 1998 2002 2006
PRC
India
Indonesia
Malaysia
Pakistan
Thailand
Singapore
0
100
200
300
Div
ersi
ficat
ion
1962 1966 1970 1974 1978 1982 1986 1990 1994 1998 2002 2006
Germany
Italy
Japan
Korea
Portugal
Spain
USA

10
advantage was shared equally between tropical agriculture, animal products, cereals,
labor-intensive, and capital-intensive.15
Table 1. Export Diversification According to Leamer’s Classification 1962 1965 1970 1975 1980 1985 1990 1995 2000 2005 2006 Petroleum 0 1 1 1 7 5 2 1 2 2 2 Raw materials 9 8 7 10 13 15 17 16 17 12 14 Forest products 3 6 5 4 6 4 4 5 8 7 7 Tropical agriculture 15 22 25 23 22 20 15 16 15 11 10
Animal products 18 24 22 28 30 23 21 19 18 10 10 Cereals 13 19 24 21 25 33 28 15 15 10 10 Labor‐intensive 18 22 32 36 54 47 61 62 66 71 69 Capital‐intensive (exc. metals) 15 14 15 21 31 34 37 37 39 45 47
Core Commodities Metal products 7 7 10 9 14 10 19 20 21 20 23 Machinery 1 4 7 8 6 6 22 36 42 54 57 Chemicals 6 11 11 13 26 19 24 23 18 19 20 Total 105 138 159 174 234 216 250 250 261 261 269
Source: Authors’ calculations. Metal products include iron and steel and manufactures of metals.
By 2006, the number of total products exported with comparative advantage had
increased to 269, out of which 100 were core products (37% of the total). Of the three
core categories, metal products has seen a steady increase, while the number of chemicals
increased until about 1980 and then declined slightly. Naturally, there have been
important shifts within metals and chemicals. Within the former, China has lost its
comparative advantage in the least sophisticated metals, where it had comparative
advantage in 1962,16 and has gained comparative advantage in metal products that have
significantly higher PRODY values.17
(PRODY=$13,616, RCA=3.94); 4. chemical elements (PRODY=$13,551, RCA=2.54); 5. pyrotechnic articles (PRODY=$9,774, RCA=12.06); 6. essential Oil, resinoid (PRODY=$6,709, RCA=2.88); METALS 7. base metals indoor sanitary ware (PRODY=$21,462, RCA=1.22); 8. tubes and pipes of cast iron (PRODY=$20,510, RCA=1.02); 9. locksmith, safes (PRODY=$17,675, RCA=1.14); 10. nails, screws, etc. of iron, steel, copper (PRODY=$16,762, RCA=1.80); 11. iron and steel powders (PRODY=$14,696, RCA=3.23); 12. bar rods from iron or steel (PRODY=$12,897, RCA=2.05); 13. pig iron, cast iron (PRODY=$8,380, RCA=1.18); MACHINERY 14. railway and tramway freight (PRODY=$10,663, RCA=2.32). 15 In 1962, Korea and Brazil exported fewer core products with comparative advantage, seven and three, respectively. 16 Pig iron, cast iron, PRODY=$8,380; iron and steel powders, PRODY=$14,696; and bars, rods, from iron or steel, PRODY=$12,897. 17 For example: “wire rod of iron or steel (PRODY=$22,634) and wire, cables, cordage, ropes, plaited bans, sling, and the like (PRODY=$18,478). Similarly, China has gained comparative advantage in more

11
There are two important observations to make. The first one is that China still
exports a high number of products that are labor-intensive with comparative advantage, a
total of 69 (the largest group). Second, the most remarkable change has taken place
within machinery: from one single product exported with comparative advantage in 1962
(railway and tramway freight not mechanically propelled, PRODY=$10,663, RCA=2.32),
to 57 in 2006. China lost its comparative advantage in transport equipment for railway
and tramway freight, but has gained comparative advantage in equipment for ships and
boats. Moreover, it has already gained comparative advantage in most telecommunication
and electronics equipment, as well as in a number of industrial and office equipment. The
unweighted average PRODY of the core products exported by China with comparative
advantage has increased from $14,741 in 1962, to $16,307 in 1980, and to $17,135 in
2006.18
A comparison of China with other countries is truly revealing. Table 2 shows the
number of products exported with revealed comparative advantage and the unweighted
average level of sophistication (PRODY) of these products, the number of core products
exported with comparative advantage (the ordering of the countries is based on this
variable) and the unweighted average level of sophistication (PRODY) of these products,
GDP per capita of the country, and the share of the number of core products exported
with comparative advantage in the total number of products exported with revealed
comparative advantage. As it could be expected, all of these countries are developed (see
figure 5). Only two developing countries, China and India, make it into this list (ahead,
of, for example, Brazil and Russia—these four countries are referred to as the BRICs;
China is also ahead of South Korea. These countries are shown at the bottom of the table.
See the analysis in Felipe, Kumar, and Abdon [2010a and 2010b]). Given their relatively
low income per capita, this is remarkable.19
sophisticated chemical products, including “provitamins and vitamins” (PRODY=$25,587) and “oxygen-function acids, and their derivatives,” (PRODY= $24,839). 18 The weighted (by the export shares) averages are: $7,893 in 1962, $8,096 in 1980, and $14,888 in 2006. This shows a clear shift to products with higher PRODY within the core. 19 A regression of the share of core commodities exported with comparative advantage in the total number of products exported with comparative advantage on GDP per capita shows that China is above the line (2006 data).

12
Table 2. Top 20 Countries According to the Number of Core Commodities Exported with Comparative Advantage in 2006
No. of products exported with RCA>1
Average PRODY of products exported with RCA>1
“Core” products
Average PRODY of “core” products
GDP per capita 2006 (2005 PPP$)
Share of “core”
commodities (%)
Germany 305 18,155 195 19,707 32,334 63.9 USA 313 16,197 168 19,489 42,672 53.7 Italy 309 16,015 151 19,297 28,478 48.9 France 303 15,971 140 18,656 31,131 46.2 Japan 192 19,063 139 19,925 31,041 72.4 Austria 235 17,239 131 19,305 34,520 55.7 Netherlands 278 15,720 125 19,343 35,789 45.0 Switzerland 191 18,248 124 20,444 36,702 64.9 United Kingdom 215 17,345 121 19,871 32,941 56.3 Czech Rep. 255 16,042 119 18,279 21,674 46.7 Spain 294 14,930 116 18,257 27,960 39.5 Sweden 197 18,238 113 19,751 33,432 57.4 Slovenia 214 16,185 104 18,549 24,766 48.6 China 269 13,323 100 17,136 4,524 37.2
Belgium 259 15,255 100 18,901 32,729 38.6 Denmark 227 16,017 95 19,945 34,440 41.9 Finland 163 17,671 94 18,922 32,056 57.7 Poland 256 14,404 91 16,682 14,648 35.5 India 258 12,124 88 17,557 2,416 34.1 Slovakia 193 15,379 86 17,368 17,535 44.6
Note: Korea (Rank=22) 135 16,974 81 18,986 23,884 60.0 Brazil (Rank=23) 195 13,290 81 16,881 8,745 41.5 Russian Federation (Rank=41)
113 14,054 53 15,296 12,797 46.9
Source: Authors’ calculations

13
Figure 5. No. of “Core” Commodities and GDP Per Capita
Source: Authors’ calculations
What does China export today? Table 3 shows the export share of the top 20
products (exported with a share of at least 1%), their level of sophistication (PRODY),
and the index of revealed comparative advantage (RCA). The table reveals the following:
(i) about half of these products have a sophistication level of about $20,000; (ii) the
products with the highest export share in China’s total exports are “parts and accessories
for machines,” with a share of 4.68%; and “peripheral units,” with a share of 4.11%; and
(iii) the products with the highest index of revealed comparative advantage are
“children’s toys” (RCA=5.01), “digital data processing machines” (RCA=4.49), and
“travel goods” (RCA=4.41).

14
Table 3. Top 20 Exports in 2006
Code Commodity Leamer’s
Classification PRODY Export Share (%)
RCA
7599 Parts, nes of and accessories for machines of headings 7512 and 752
Machinery 20,505 4.68 2.24
7525 Peripheral units, including control and adapting units
Machinery 19,438 4.11 3.07
8942 Children’s toys, indoor games, etc. Labor intensive
19,086 3.61 5.01
7643 Television, radio‐broadcasting; transmitters, etc. Machinery 22,238 3.50 1.91 7649 Parts, nes of and accessories for apparatus falling
in heading 76 Machinery 21,053 3.47 2.29
7522 Complete digital data processing machines Machinery 18,606 3.07 4.49 8510 Footwear Labor
intensive 9,997 2.83 3.77
7638 Other sound recording and reproducer, nes; video recorders
Machinery 19,579 2.58 3.81
7764 Electronic microcircuits Machinery 20,984 2.36 0.84 8310 Travel goods, handbags etc, of leather, plastics,
textile, others Labor intensive
12,957 1.54 4.41
7641 Electrical line telephonic and telegraphic apparatus
Machinery 20,649 1.50 2.91
8219 Other furniture and parts thereof, nes Labor intensive
13,763 1.36 2.33
8439 Women’s, girl’s, infant’s outerwear, textile, not knitted or crocheted; other outer garments of textile fabrics, not knitted, crocheted
Labor intensive
8,522 1.33 3.36
7788 Other electrical machinery and equipment, nes Machinery 16,447 1.31 1.55 7611 Television receivers, color Machinery 15,755 1.29 1.81 7721 Switches, relays, fuses, etc.; switchboards and
control panels, nes Machinery 16,544 1.26 1.06
7712 Other electric power machinery, parts, nes Machinery 20,237 1.23 2.86 8451 Outerwear knitted or crocheted, not elastic nor
rubberized; jerseys, pullovers, slip‐overs, cardigans, etc.
Labor intensive
8,045 1.20 3.37
8459 Outerwear knitted or crocheted, not elastic nor rubberized; other, clothing accessories, nonelastic, knitted, or crocheted
Labor intensive
8,085 1.12 3.21
8710 Optical instruments and apparatus Machinery 21,226 1.08 2.75 Source: Authors’ calculations

15
Figure 6. Diversification and Standardness in 2006
Source: Authors’ calculations
Finally, we have also analyzed the extent to which the products that China exports
are unique or not. Figure 6 graphs the number of products exported with comparative
advantage against an index of standardness of the products exported.20 A lower value of
standardness indicates that the products exported are more unique (i.e., exported by fewer
countries). The best positioned countries are those in the fourth quadrant (high
diversification and more unique products), while the worst are those in the second
quadrant (low diversification and standard products).21 Figure 6 indicates that China is in
the fourth quadrant, together with most of the developed countries. In Asia, only Japan,
Singapore, Korea, Malaysia, and Hong Kong export more unique products than China,
20 Specifically, standardness is the average ubiquity of commodities exported with comparative advantage
for each country c, and is calculated as: ∑i
icc
ubiquityationdiversific
1, where diversification is the
number of products exported by country c with comparative advantage and ubiquity of commodity i is the number of countries exporting commodity i with comparative advantage (Hidalgo and Hausmann 2009). 21 The negative relationship between both variables remains when we use the number of core commodities or the percentage of core commodities (out of the total number of commodities exported with comparative advantage) instead of standardness.

16
but all of them export fewer products with comparative advantage. Figure 7 shows the
relationship between standardness and GDP per capita in 2006. The figure shows that,
given its income per capita, China has a highly unique export package.
Figure 7. Standardness and GDP Per Capita, 2006
Source: Authors’ calculations
3. THE PRODUCT SPACE: COMPARATIVE ADVANTAGE OR INDUSTRIAL
POLICY?
Hidalgo et al. (2007) argue that the production (and export) of different products requires
different and very specific capabilities (resources—both human and physical—
knowledge of markets, legal system, institutions, etc.). For example, the capabilities
required to successfully export oranges are very different from those required to export
furniture. What differentiates these capabilities is that some of them can be easily
redeployed into the production and export of many other products. Probably this is the
case of different types of machinery or of electronics goods. However, there are many
other products that require very specific capabilities that cannot be easily redeployed.
This is the case of natural resources such as oil.
Hildago et al.’s recently developed concept of product space encapsulates these
ideas. The product space uses network theory to produce a graphical representation of all
17
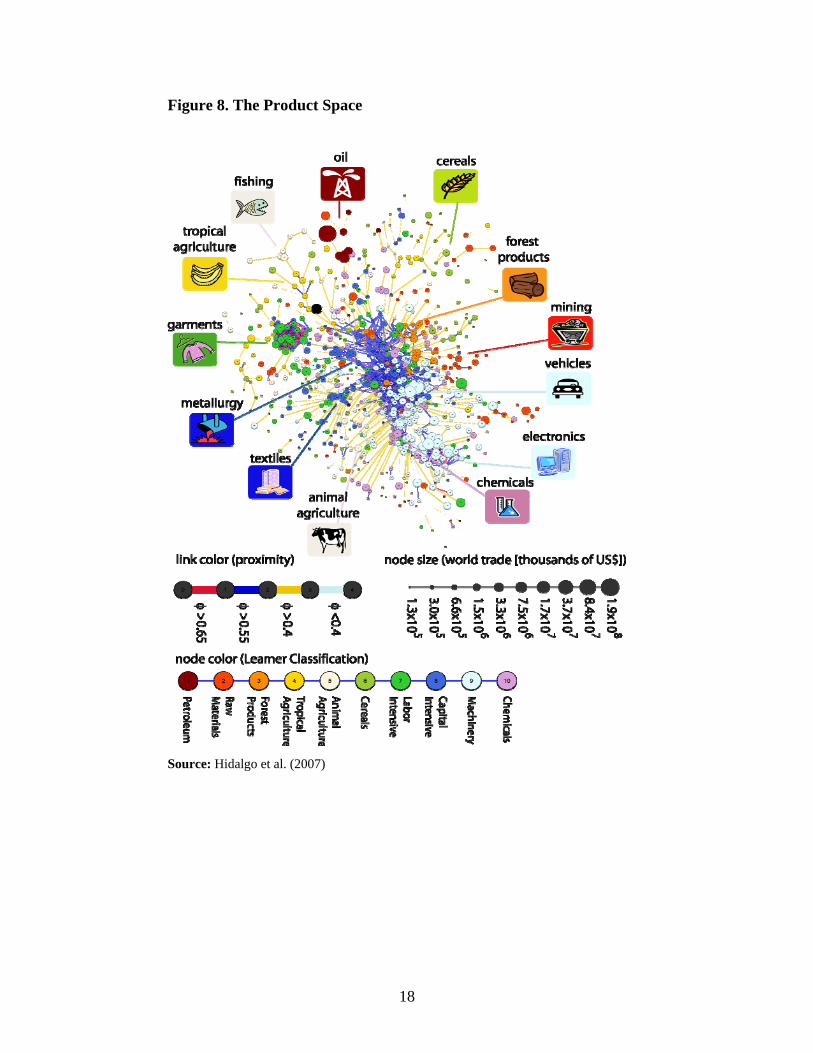
the products exported in the world (figure 8). The different circles represent products (a
total of 779 in our analysis). Their size is proportional to world trade. Colors represent
different product groups. The lines that link them represent the distance between them.
This is not a physical distance, rather it measures the likelihood that a country exports a
product given that it exports the other one. At one extreme, a red line indicates that
countries that export one product also export the other product with a high probability,
while a light blue line indicates a low probability that the two products can be exported
jointly. The rationale is that if two goods need the same capabilities, a country should
show a higher probability of having comparative advantage in both.
We can see that the product space is highly heterogeneous. Some peripheral
products are only weakly connected to other products. Some groupings appear among
these peripheral goods, such as petroleum products, seafood products, garments, and raw
materials. These products provide countries with a nature-based comparative advantage.
In the center of the network is a core of closely connected products, mainly machinery,
chemicals, and capital-intensive (metal) products. Nature does not provide an advantage
in these products. When acquired, it is man-made.
18
Figure 8. The Product Space
Source: Hidalgo et al. (2007)

19
The heterogeneous structure of the product space has important implications for
structural change. Products in the periphery are less sophisticated and with a lower
income elasticity of demand for exports than those in the core. That is, not all products
are the same qualitatively as carriers of economic development. If a country produces
goods in a dense part of the product space, then structural transformation is much easier
because the set of acquired capabilities can be easily redeployed to the production of
other nearby products. However, if a country specializes in the peripheral products, this
redeployment is more challenging, as no other set of products requires similar
capabilities. The conclusion is that a country’s position in the product space signals its
capacity for structural transformation.
Now we superimpose the products that China exports with revealed comparative
advantage onto the product space. This is shown in figure 9. For reasons of space, we
only show the product spaces corresponding to 1962, 1980, 1990, and 2006 (product
spaces for other years are available from the authors upon request). The products
exported with comparative advantage are shown with black squares. The number of black
squares is exactly the same that appears in table 1 above. The four product spaces reveal
important changes in China’s export structure, and in particular how the country has
managed to establish a strong foothold into the core areas of the product space. As
discussed earlier, in 1962, China exported 105 products with comparative advantage,
most of them outside the core: tropical agriculture, animal products, cereals, labor-
intensive, and capital-intensive (excluding metal products). China’s strength in tropical
agriculture, animal products, and cereals remained until 1980–1985 (see table 1), when
the number of these products exported with comparative advantage started declining. The
strength in labor-intensive (the garment cluster) and capital-intensive products, excluding
metal products (the textile cluster), has remained, and even increased, until now, most
likely reflecting China’s relatively low wages.
In 1980, at the start of reforms, China already exported a total of 234 products
with comparative advantage, with 46 in the core (of which 40 were metals and
chemicals), and 11 out of the latter had a sophistication level of $20,000 or above.22 And
22 In 1962, out of the fourteen products in the core exported with comparative advantage, only three had a level of sophistication of $20,000 or above. In 1970 the number of products in the core exported with

20
certainly China had set a very strong presence in the garments (labor-intensive) and
textiles (capital-intensive) clusters.
comparative advantage and with a level of sophistication above $20,000 had increased to eight (including “rails and railway track construction materials,” at $30,678), then to nineteen in 1995, and to twenty-nine in 2006.

21
Figure 9. China’s Product Spaces: 1962, 1980, 1990, 2006
1962
1990 2006
1980
22
Arguably, the most remarkable change probably occurred between 1985 and 1990 when
China got into electronics (grouped under machinery in Leamer’s classification). As table 1
above indicates, in 1980 and 1985, China had comparative advantage in the export of only six
machinery products.23 Figure 9 reveals that during the next five years, a significant change had
taken place, as China had set a foot into the electronics area of the product space (22 machinery
products exported with comparative advantage). Between 1990 and 2006, the number of
machinery products exported with comparative advantage increased to a total of 57. The product
spaces also show that China has never been a great exporter (in the sense of having comparative
advantage) of petroleum, raw materials, and forest products.
While the analysis shows that China has strong revealed comparative advantage in labor-
intensive products (a total of 69 products in 2006), it also reveals that its comparative advantage
in core products is impressive. In our view, the only way to understand this is by acknowledging
China’s increasing capacity to master and accumulate capabilities, and the role played by
industrial policy (table 4).24 China started using “export processing zones” as a key strategy to
learn (and accumulate capabilities) from foreign firms in the advanced countries when these
restructured their global production networks (Zhang and Song 2000).25 The landmark FDI
legislation was the Equity Joint Venture Law of 1979 (table 5). The law was historic in that it
signified a reversal of the political stance against economic opening, and in that it laid the
foundation for the foreign investments that have emerged since 1979. In 1986, the State Council
released a document entitled “Regulations to Encourage Foreign Investments” to shift the FDI
regime from “permitting” to “encouraging” FDI. The regulations allowed export-oriented and
technologically advanced foreign firms to enjoy various benefits relating to taxes, credit, input
charges, labor management, export rights, and foreign exchange requirements. Foreign investors
were required to enter joint ventures with domestic firms for technology transfer (Yueh 2009).
23 In 1980 these six products were: domestic electro-mechanical appliances, invalid carriages, clocks, sewing machines, electric filament lamps, and cycles (not motorized). In 1985 the six products were: watches, portable radio receivers, other radio receivers, clocks, machinery for the grain milling industry, and cycles (not motorized). 24 There is still a debate going on about the usefulness of industrial policy. The fact is that Western developed countries used industrial policy since the 15th century to protect and develop the manufacturing sector. See the detailed analyses in Chang (2002) and Reinert (2007), and the debate between Lin and Chang (2009). In our view, it is impossible to understand how rich countries got rich without being aware that they heavily protected their industries when they were taking off. China is doing nothing different. It is simply replicating what many other countries, including the United States, did (e.g., set industry standards, regulations, buy-local policies, procurements, patent laws advantageous to domestic producers, etc.) to build their own industries. 25 This took place after the currency realignment following the Plaza Accord (1985), which led to a significant appreciation of the yen.

23
China was able to bargain effectively with foreign investors because of the leverage of its large
market size.26
Table 4. China’s Industrial Policy State ownership Was extremely high as a result of Communist takeover, but thousands
of state enterprises have been privatized or shut down as the economy underwent massive market restructuring.
Subsidized credit Still significant subsidized credit through state owned banks, directed at state enterprises.
Tax incentives Strongly biased toward foreign investment and high technology Tariff and nontariff protection Levels have come down significantly with WTO entry, but still
significant nontariff barriers. Foreign direct investment (FDI) targeting
Initially there was very strong control on FDI. Then, policy changed strategically: country opened up and favored cutting-edge investment in key areas. Foreign firms have come to use China both as an export platform, low-cost manufacturing hub, and for its large domestic market. The government has been effective at creating strong competition among foreign firms and induced them to bring best technologies.
Local content requirements Important mechanism to develop backward linkages succeed because of capabilities of domestic firms.
Intellectual property rights Weak until required to update as part of WTO accession in 2001. Enforcement is weak and is likely to become a very controversial issue in future in relations with developed countries.
Government procurement Important mechanism to develop national firms in many areas. Also effective use of national standards to support competitiveness of indigenous firms.
Promoting large domestic firms Multiple instruments used to create world-class indigenous (public and private) companies to compete with multinational corporations (MNCs) domestically and eventually abroad.
Source: Dahlman (2009: 307)
Also, the jump into the electronics cluster in the 1990s (driven by foreign firms) was the
result of participation in global value chains (Felipe 2010: 249–252). The evidence, consistent
with the discussion in this paper, is that China has done a great deal of impressive catching up
through mechanisms such as “original equipment manufacturer,” “original design manufacturer,”
and “original brand manufacturer.” This shift into electronics was possible only because China
had previously acquired the capabilities necessary to assemble and export these goods. While
socialist controls and regulations inhibited private enterprise, the positive legacy is that they
provided a solid foundation for the forthcoming growth, e.g., wide access to education and
health, highly egalitarian land distribution, increased female labor force participation, a system
26 We have to add the role played by the undervaluation of the yuan, in the words of Rodrik (20100), “a kind of industrial policy.”

24
of economic regional decentralization, and a very active government that promoted technological
development.27
Table 5. Major FDI laws after 1978 Laws and Regulations Key components
Equity Joint Venture Law (1979) Laid down the foundation for successive laws on FDI, including income tax and labor management.
Wholly Foreign-owned Enterprises Law (1986) and Sino-Foreign Cooperative Joint Venture Law (1988)
Developed a legal infrastructure governing the three main forms of foreign invested enterprises (FIEs)—equity joint ventures, cooperative joint ventures, and wholly foreign-owned—and devising favorable policy treatments for FDI.
Regulations to Encourage Foreign Investments (1986)
Shifted FDI policy from “permitting” to “encouraging” FDI; separated FIEs into two categories—those qualifying for favorable treatments (export-oriented and technology-advanced FIEs) and those qualifying for normal treatment; and qualified FIEs enjoyed benefits related to taxes, credit access, input charges, labor management, export rights, and foreign exchange balance requirements.
Provisional Regulations for Guiding the Direction of Foreign Investment (1995, revised 1997)
Laid out a positive and negative list of economic sectors and official intentions of investment priorities. FDI-involved projects are divided into four categories—encouraged, allowed, restricted, and prohibited.
Source: Authors
What lies behind this progression? In the product space model, development is a path-
dependent process. There is no growth trajectory that acts as a “center of gravity” toward which
the economy is inexorably and inevitably drawn. Long-run growth and development depend on a
succession of short- and medium-term developments along a historical adjustment path. During
the 1960s and 1970s, China had already made inroads into the core of the product space. This
was part of China’s industrialization drive since the 1950s. It was deliberate and policy-induced,
27 Bardhan (2008) argues that there are three important myths about how globalization has stimulated China’s (and India’s) recent rapid growth. The standard argument, he claims, is that “decades of socialist controls and regulations stifled enterprise in India and China and led them to a dead end. A mix of market reforms and global integration finally unleashed their entrepreneurial energies. As these giants shook off their ‘socialist slumber,’ they entered the ‘flattened’ playing field of global capitalism. The result has been high economic growth in both countries and correspondingly large declines in poverty.” Regarding China, he argues that the country had already achieved growth rates of about 9% per annum between 1978 and 1993, higher than those of the successful East Asian countries between 1960 and 1980. Regarding poverty, about two-thirds of the decline in extremely poor people between 1981 and 2004 had taken place by the mid-1980s. This large decline was probably related to domestic factors and not to global competition. These factors included: (i) a significant increase in agricultural productivity following decollectivization; (ii) land reform program; and (iii) increased farm procurement prices.
25
a stated objective of Chinese policymakers (Wilcox, Weatherford, and Hunter 1962: 80–100;
Wang and Li 1995). Using data for 2000, Felipe and Estrada (2008) estimate that China’s actual
manufacturing sector as a share of GDP in 2000, 34.5%, was about five percentage points above
what a regression of this share on income per capita (and its square), population, and openness
predicted, 27.5%. This is consistent with the old notion that manufacturing is the “engine of
growth” embedded in Kaldor’s first law (Kaldor 1967; Felipe et al. 2009; see also Rodrik
2006a), and with the fact that growth accelerations are associated with structural changes in the
direction of manufacturing (Hausmann, Hwang, and Rodik 2006).
The heavy industrial expansion and huge capital construction projects undertaken during
the 1950s (employing labor-using and capital-saving methods), together with the speedy
introduction of modern technology (assistance from the Soviet Union), led to very significant
increases in industrial production, electric power and steel output (Wilcox, Weatherford, and
Hunter 1962: 92, table 5). We insist that we do not argue that the industrial policies before
market reforms were introduced were completely successful. Without any doubt they led to a lot
of waste, miscalculations, low-quality products, poor planning, and inefficiencies. It is likely the
capabilities created were not well utilized and scarce resources were wasted under ambitious
government policies. Our point is that the reason why in 1980 China could export 234
commodities with comparative advantage (46 of them in the core) is that during the previous
decades it had mastered and accumulated a large number of capabilities and know-how. Only
this way could Chinese entrepreneurs respond to the market incentives created by the market
reforms. For decades China protected its industry and slowly allowed it to graduate to the
international market. Moreover, China’s trade as far back as the 1950s was “an absolutely crucial
element (necessary, but not sufficient) in its headlong modernization. Imported machinery and
equipment, embodying modern technology, contributes an output-raising potential that
substantially outweighs short-run costs […] Without trade many years of painful technological
growth would be required” (Wilcox, Weatherford, and Hunter 1962: 90–91).28
Can this fast process be equated with what is referred to in the literature as leapfrogging,
that is, the idea that some stages of development can be bypassed (supported by government-led
28 Felipe (2009: 123–127) argues that for countries lagging behind the technological frontier, endogenous technical progress is partly dependent on the acquisition and mastery of more advanced production techniques from the leader countries, which, in turn, depends on the country’s capabilities. If technology is sector specific, its diffusion from the more to the less advanced countries will be faster the higher the degree of structural similarity between them.

26
industrial policy) in an attempt to move faster up the development ladder? Our view is that
leapfrogging is not supported by careful empirical and firm-level research (Hobday 1995).29
Case studies suggest that firms acquire technology through a costly, difficult, and incremental
learning process. The notions of learning and capability accumulation contradict the idea of
leapfrogging. China’s firms did not leapfrog from one vintage of technology to another. On the
contrary, firms engaged (and still are) in a painstaking and cumulative process of technological
learning. The route to advanced electronics and information technology has been a long difficult
learning process, driven by the manufacture of goods for export. Moreover, as we showed in
table 1, of the 269 products that China exported with comparative advantage in 2006, the largest
category was labor-intensive products (a total of 69 or 25% of the total).
We close this section with reference to a well-known paper by Gregory Chow (1993:
811), who argued that China’s 6% average rate of growth (of real national income) per annum
between 1952 and 1980 was entirely due to factor accumulation and that technological progress
during that period was absent. 30 We do not have data going back to the 1950s, and it is possible
that the Great Leap Forward and the Cultural Revolution inflicted significant losses in many
areas, including a decrease in output in some years (Naughton 2008). In the early stages, China
adopted a centrally planned economic system based on state and collective ownership of all
means of production, and resources, outputs, and prices were controlled. Authorities prioritized 29 Kim (1997) described Hyundai’s efforts to produce a car after it had purchased the foreign equipment, hired expatriate consultants, and signed licensing agreements with foreign firms, as follows:
“Despite the training and consulting services of experts, Hyundai engineers repeated trials and errors for fourteen months before creating the first prototype. But the engine block broke into pieces at its first test. New prototype engines appeared almost every week, only to break in testing. No one on the team could figure out why the prototypes kept breaking down, casting serious doubts even among Hyundai management on its capability to develop a competitive engine. The team had to scrap eleven more broken prototypes before one survived the test. There were 2,888 engine design changes […] Ninety-seven test engines were made before Hyundai refined its natural aspiration and turbocharger engines […] In addition, more than 200 transmissions and 150 test vehicles were created before Hyundai perfected them in 1992” (Kim 1997: 129).
This is far from the notion of leapfrogging. 30 Chow’s (1993) definition of technical progress, implicit in aggregate production function studies, is the portion of overall growth not due to factor accumulation. Chow estimated Cobb-Douglas production functions and technical progress was proxied by a linear time trend that, in his regressions, was statistically insignificant. However, see Felipe and McCombie (2002 and 2010). Felipe and McCombie (2010) prove that Chow’s (1993) regressions were dubious. He estimated Cobb-Douglas production functions for different sectors and proxied technical progress through a linear time trend. For reasons difficult to accept, he eliminated some years from the regressions to obtain a good fit. Felipe and McCombie show that the analysis and conclusions were flawed. Using his data set for the construction sector, Felipe and McCombie reestimated the regression and concluded, in Chow’s own terms, that there was technical progress. Our definition of (technical) progress, as noted in the introduction, is a process of accumulating capabilities that leads to an increase in the level of sophistication and diversification of the export basket.
27
heavy industrialization (iron and steel, chemical fertilizer, and petrochemicals) and the needed
resources for investment in heavy industries were extracted from rural areas. However, attempts
to increase industrial production through politically forced resource mobilization resulted in a
wide range of misreporting by production units. Further, industrial policy in this period
emphasized local self-sufficiency, which resulted in all local governments being involved in a
wide range of areas; moreover, “Chinese planning was extraordinarily haphazard and unrealistic”
(Naughton 1990: 746).31
Having said this, the evidence indicates that by 1980, at the time transition and market
reforms started, China had already gained revealed comparative advantage in the export of 234
products, of which 46 were core products, and that it had reached a level of export sophistication
(EXPY) of $11,000, higher than that of many other developing countries today. Given that in
1950 China was a very poor and backward economy, our interpretation of this evidence is that
the country’s progress during the next three decades was remarkable, and difficult to square with
the conclusion that growth had been essentially due to factor accumulation and that technical
progress had been absent. China’s impressive progression and growth after the introduction of
market reforms cannot be understood without factoring in the capabilities that had been
developed and accumulated over the three decades under the planning system and prior to the
introduction of market reforms. Without these capabilities, entrepreneurs could not respond to
the incentives created by the market reforms.32 We elaborate upon this in the next section.
Our view of China’s development is consistent with the key characteristic of
development embedded in the product space, namely, that it is path-dependent. For developing
countries to move fast in the product space and reach the core, they often need to defy their
comparative advantage. In the case of China, this was done by protecting certain capital and
technology-industries, giving them monopoly positions and subsidizing them through various
price distortions, including suppressed interest rates. These price distortions often created
shortages and the government had to resort to using administrative measures to allocate
resources directly to nonviable firms in priority industries. As we noted above, these policies 31 Brandt, Rawski, and Sutton (2008: 569) argue that prior to market reforms “…visitors to Chinese factories encountered obsolete and dysfunctional products; vans and transformers that failed to keep out rainwater, sewing machines that leaked oil onto the fabric, power tillers rusting outside a factory that churned out fresh batches of unwanted inventory, and so on” (Brandt et al. 2008, p.569). 32 We have to add that despite the erroneous agricultural policies that precipitated the famine of 1960–61, and again slowed agriculture during the “Cultural Revolution” of 1966–67, China’s progress in agriculture during 1962–2000 was remarkable (Lin 1998).

28
misallocated some resources, but this does not mean that economic performance was poor. The
conclusion is that if China had not proceeded this way, today it would be a much poorer country.
4. CHINA’S “OPEN FOREST”
Another complementary way of analyzing how China has progressed during the last forty years
is by looking at the country’s (future) export opportunity set at different points in time.
Hausmann and Klinger (2006) provide a measure of a country’s export structure that captures the
flexibility of an economy to adapt to external shocks and encapsulates the potential for further
structural change. This measure, which they call open forest, is a weighted average of the
sophistication of all potential export goods of a country (i.e., those goods not yet exported with
comparative advantage), where the weight is the density or distance between each of these goods
and the economy’s present export basket. Density (distance) in this context is not a physical
concept; rather, it measures how close (far) a commodity not exported with comparative
advantage is to the country’s export basket. It is a proxy for the probability that a country can
successfully export a “new” product (i.e., that it acquires revealed comparative advantage in it).33
Open forest captures the (expected) value of the goods that the country could potentially export,
i.e., the products that it currently does not export with comparative advantage. This value,
therefore, depends on how far the nonexported goods are from the current basket (i.e., distance,
33 Algebraically: ∑ ∑∑
⎥⎥⎥
⎦
⎤
⎢⎢⎢
⎣
⎡−=
jjcj
iij
cii
ij
c PRODYxx
ForestOpen )1(_ϕ
ϕ , where
∑∑
iij
iciij x
ϕ
ϕis the density
and ⎪⎩
⎪⎨⎧
<
≥=
c
cx
ji
jicjci countryfor1RCAif0
countryfor1RCAif 1
,
,, ; ijϕ denotes the proximity or probability that the country will shift
resources into good j , given that it exports good i ; jPRODY is a measure of the sophistication of product j (not exported with comparative advantage), calculated as a weighted average of the income per capita of the countries that export it; and jcj PRODYω is the expected value (in terms of the sophistication of exports) of exporting good j . First, we calculate the number of products in which China currently exhibits revealed comparative advantage (i.e., RCA>1). Second, we calculate the sophistication of all products. Third, we calculate the distance between the current export basket (i.e., the products in which China has currently revealed comparative advantage) and each of the products not currently exported with comparative advantage. Fourth, we compute open forest as the sum of the multiplications density times sophistication (for the products not exported with comparative advantage).

29
or the probability that the country can export them) and on how sophisticated these nonexported
goods are.
We have calculated open forest for China and for a group of comparator countries since
the 1960s. This is shown in figure 10. China’s open forest in 1962 was $1,003 (in thousands,
2005 PPP$). It ranked twenty-first in the world. By 2006 its open forest had increased to $2,414,
the ninth largest in the world.34
Figure 10. Trend in Open Forest
Source: Authors’ calculations
34 The ten largest open forest values in 2006 were (in thousands, 2005 PPP$): Poland, $2,618; Spain, $2,551; India, $2,548; Lithuania, $2,501; Czech Republic, $2,499; Italy, $2,462; Denmark, $2,436; Bulgaria, $2,435; China, $2,414; and Belgium, $2,401.
0
500
1,000
1,500
2,000
2,500
3,000
Ope
n Fo
rest
('00
0)
1962 1966 1970 1974 1978 1982 1986 1990 1994 1998 2002 2006
Germany
Italy
Japan
Rep. of Korea
Portugal
Spain
USA
0
500
1,000
1,500
2,000
2,500
3,000
Ope
n Fo
rest
('00
0)
1962 1966 1970 1974 1978 1982 1986 1990 1994 1998 2002 2006
PRC
India
Indonesia
Malaysia
Pakistan
Thailand
Singapore
30
As we argued in the previous section, this phenomenal progression is the result of path-
dependency. Once China had set a foot into the core, it could diversify and upgrade its export
basket quickly. In other words, once the country gained comparative advantage in some
sophisticated products in the core, it became easier to “move around.” These products are “close”
to many other sophisticated products (e.g., other types of machinery or chemicals) in the sense
that there is a high probability that China can export them successfully (i.e., that it can acquire
comparative advantage) because they use capabilities that are similar to the ones that the country
already possesses.
What about those commodities located “far” from the current basket (i.e., high distance
and hence low probability that China acquires comparative advantage in them)? These products
tend to be unsophisticated (e.g., natural resources, some agricultural products) and therefore
contribute little to open forest. Therefore, even though China has gained revealed comparative
advantage in the export of 269 products, still many of the products that it does not export with
comparative advantage are highly sophisticated and in the core (there are 325 core products and
China exports 100 of them with comparative advantage) and the probability of exporting them is
high. Hence, China’s high open forest.
Table 6 shows the top ten contributors to China’s open forest in 2006 ($2,414,000). All of
them are very sophisticated products (seven of them with PRODY above $30,000, and
including—although at a high distance—the most sophisticated product in our analysis, “furnace
burners”), indicating that China is very well-positioned in the core of the product space.

31
Table 6. Top 10 Contributors to Open Forest in 2006
Commodity Leamer’s
Classification PRODY Density
Contribution to Open Forest
Angles, shapes, sections, and sheet piling, of iron or steel
Capital-intensive
35,177 0.350 12,299
Pearls, not mounted, set, or strung Labor-intensive 25,242 0.457 11,546 Other electronic valves and tubes Machinery 21,976 0.510 11,205 Sulphonamides, sultones, and sultams Chemicals 30,593 0.355 10,847 Furnace burners; mechanical stokers, etc., and parts thereof, nes
Machinery 39,521 0.273 10,781
Sound recording tape, discs Labor-intensive 33,809 0.310 10,475 Safety glass consisting of toughened or laminated glass, cut or not
Labor-intensive 32,232 0.322 10,367
Bonded fibre fabrics, etc., whether or not impregnated or coated
Capital-intensive
31,250 0.327 10,216
Rails and railway track construction materials, of iron or steel
Capital-intensive
30,687 0.321 9,843
Swine, live Animal products
26,388 0.371 9,781
Source: Authors’ calculations Figure 11. Opportunities for Economic Transformation: Open Forest
Source: Authors’ calculations

32
Finally, we have estimated a regression of open forest on income per capita (and its
square), the investment-output ratio, and the number of export destinations, using data for 105
countries for 2006. The line in figure 11 provides the expected value of open forest given income
per capita; to draw it, we fix the investment-output ratio and the number of export destinations
their sample’s averages, 22.7% and 132, respectively.
Results indicate that China’s expected (i.e., predicted by the regression) open forest
($2,107,000), given the values of the three right-hand variables, is below the actual one
($2,414,000). This reinforces the conclusion that China’s future is bright.
5. WHAT ELSE CAN CHINA EXPORT?
Given the analysis and conclusions in the previous section, we can ask “what else can China
export?” Table 6, above, contains some of the most sophisticated products in the analysis (see
their PRODY). This is why China has a high open forest. But can China successfully export all
these products today? To answer this question we get back to the product space and analyze the
products that China does not export with revealed comparative advantage. This represents
China’s export opportunity set. In our analysis there are 509 products that China does not export
with comparative advantage (all the products in the open forest). Therefore, these are potential
“new” exports. They are shown in figure 12. Certainly China will not be able to export all of
them with comparative advantage, but certainly there is still room to increase the number of
exports with comparative advantage.35
Figure 12 shows how “far” each product is from the current export basket. This allows us
to divide all these products into three groups, depending on how far they are from the current
export basket: “nearby,” “middle distance,” and “far away.”36 The three groups are separated by
a dashed line. By construction of the product space, products “closest” to China’s current export
basket, i.e., those “nearby,” use capabilities that are similar to those the country already has and,
therefore, it should not be difficult for Chinese firms (that already export these products in small
35 Table 2 above shows that the United States, France, Italy, and Germany export slightly above 300 products with comparative advantage. 36 Products “nearby” are those with a distance (the inverse of density) of less than 0.5 standard deviations from the average of all unexploited products; products at “middle” distance are those with between ±0.5 standard deviations from the average; and products “far away” are those with a distance of at least 0.5 standard deviations from the average. A longer list of products can be provided by the authors upon request.

33
amounts) to become competitive exporters of these products (i.e., increase the export share of
these products and acquire revealed comparative advantage). These are a total of 247 products.
On the other hand, products farther to the right require more specific capabilities and it is more
likely that Chinese firms do not have these yet; therefore, their successful export today is
probably more challenging. There are total of 262 products in the two groups (171 “middle
distance” and 91 “far away”).
Table 7 shows the top ten products nearby, the top five products at middle distance, and
the top five far away, ordered by sophistication (PRODY), the Leamer category they belong to,
and the current index of revealed comparative advantage. All these products meet the condition
that their level of sophistication (PRODY) is above the country’s average level (EXPY). The
table also provides the strategic value of each of these products. The strategic value of a product
is a proxy for the spillovers derived from acquiring comparative advantage in the product in
question. Specifically, it is the increase in open forest assuming that China gains comparative
advantage in that product.37
The table shows an increasing level of sophistication in the products that China can
potentially export successfully as one moves to the right. All the products in the table are highly
sophisticated (most of them are core products), corroborating our previous observations on
China’s possibilities.
37 Algebraically, the “strategic value” of a product j is defined as:
ii
ci
jij
ijj PRODYxvalueStrategic ∑∑
−= )1( ϕ
ϕ, for all i and ji ≠ , where ijϕ is the proximity between i and j
and 1=cix if country c exports commodity i with comparative advantage. Strategic value is the potential contribution of commodity j to the open forest if it is assumed to be exported with comparative advantage (i.e., RCA>1).

34
Figure 12. Density of the Products in China’s Open Forest, 2006
0
10,000
20,000
30,000
40,000
PRO
DY
(200
5 PP
P $)
.5 1 1.5 2Distance
Petroleum Raw materials Forest products Tropical agriculture Animal products Cereals Labor intensive Capital intensive Machinery Chemicals
Source: Authors’ calculations
How can China acquire revealed comparative advantage in some of these products?
China needs to develop and carefully implement a set of policies that allow its firms to take
advantage of the huge potential warranted by their privileged position in the product space.
Given the success achieved during the last fifty years, policymakers need to measure well the
amount of intervention that they exert and think more about the quality of these interventions.
For example, at this point, China does not need to take strategic bets, i.e., to try to gain
comparative advantage in products that are “far away.” The country needs first to develop the
necessary capabilities to successfully export these products. Likewise, support to new activities
(e.g., provision of specific public inputs, tax breaks, subsidies, etc.) has to be guided by very
clear sunset clauses and performance benchmarks, and policymakers have to learn to identify
sectors that have no future as quickly as possible and, hence, to stop supporting them.
EXPY= $16,757

35
Table 7. Commodities with the Highest Strategic Values (ordered by PRODY) in 2006
Commodity Description Leamer’s
Classification PRODY
Strategic Value
RCA
Other nonelectric parts and accessories of machinery, nes
Machinery 28,754 13,146 0.590
Alkyds and other polyesters Chemicals 24,239 14,906 0.581 Medicaments (including veterinary medicaments) Chemicals 22,803 13,134 0.024 Aluminium and aluminium alloys, worked Raw materials 22,084 13,076 0.522 Passenger motor vehicles (excluding buses) Machinery 21,687 13,153 0.021 Non‐domestic refrigerators and refrigerating equipment, parts, nes
Machinery 20,836 13,936 0.854
Paper and paperboard, creped, crinkled, etc., in rolls or sheets
Forest products 20,183 13,027 0.310
Transmission, conveyor, or elevator belts, of vulcanized rubber
Capital‐ intensive
20,112 15,245 0.485
Special products of textile materials Capital‐ intensive
19,631 13,193 0.741
“Nearby”
Central heating equipment, not electrically heated, parts, nes
Capital‐ intensive
19,571 15,159 0.146
Industrial and laboratory furnaces and ovens, etc., parts, nes
Machinery 30,097 16,371 0.511
Other nitrogen‐function compounds Chemicals 29,237 15,996 0.303 Paper and paperboard, coated, impregnated, etc., in rolls or sheets
Forest products 28,853 15,763 0.258
Parts, nes of the machines falling within heading 725
Machinery 27,116 15,082 0.152 “Middle”
Work holders, dividing heads for machine‐tools, etc.; tool holders
Machinery 25,779 15,552 0.412
Furnace burners; mechanical stokers, etc., and parts thereof, nes
Machinery 39,521 14,696 0.505
Organo‐sulphur compounds Chemicals 31,440 14,221 0.485 Nonmechanical or electrical instruments for physical, etc., analysis
Machinery 28,222 14,194 0.224
Machinery, accessories for type‐setting, for printing blocks, etc.
Machinery 25,271 14,519 0.204
“Far Away”
Photographic film, plates and paper (other than cinematograph film)
Machinery 25,192 14,143 0.362
Source: Authors’ calculations

36
In our view, China needs to devise an optimal combination of horizontal and vertical
policy instruments.38 The objective of the first type of policies is to resolve economy-wide
market failures that affect broad sectors of the economy (e.g., provide subsidies to innovation,
relief financial constraints for SMEs), while the second aim at developing new comparative
advantages by promoting specific new activities (these are the products labeled “nearby” and
“middle” in table 7). To increase the possibility of success, China’s government needs to tailor
policies and tools to each sector and then implement these policies in close collaboration with the
private sector, which needs to be nurtured. Therefore, the spectrum of interventions is relatively
large, ranging from a hands-off approach (e.g., simply creating the necessary market institutions)
to acting as a central operator in a sector. Experience shows that coordination with the private
sector increases the chances of policy success.
Moreover, the more China becomes a market economy the more it will have to pay
attention to market failures. Indeed, the discovery of new products is subject to market failures
that result in the under-provision of entrepreneurship in pursuit of structural change (Hausmann
and Rodrik 2003). Two market failures in particular are rampant in developing countries,
namely: (i) information externalities incurred in discovering the cost structure of an economy,
i.e., discovery of the new activities that can be exported profitably;39 and (ii) coordination
externalities in the presence of scale economies.40 Both are reasons why diversification and
discovery are unlikely to take place in a market economy without some kind of government
action. China has been heavily involved in supporting its industry for decades. However, as it
advances in its quest to become more a market-oriented economy, the role of the state should be
to create a climate of collaboration with the private sector more than to provide subsidies.
38 I do not want to overstretch the distinction between horizontal and vertical industrial policies, as often it is difficult to differentiate both. On this see Chang (2009). 39 Information externalities derive from the fact that searching for a new product is an activity with great social value, one that is but poorly rewarded. If entrepreneurs fail in their attempts, they will have to bear all the search costs. However, if they succeed, other producers/exporters will quickly learn and follow them. In this case, there is a clear case for the government to subsidize investments (to the initial investor) in new, nontraditional activities, and not in activities already established. 40 Coordination externalities derive from the fact that many projects require simultaneous investments in order to be profitable (e.g., hotels will not be built unless the government provides good public infrastructure, but the government will not build infrastructure unless the private sector builds the hotels). Coordination failures often do not need subsidies to the private sector.

37
6. WILL GROWTH CONTINUE INDEFINITELY? RISKS, CONSTRAINTS, AND
SCENARIOS
The analysis in the previous sections indicates that China’s growth will remain strong, but it
should not be overstretched, as the country faces a number of serious challenges. Indeed, the
perennial questions in discussions about China’s performance are, first, whether growth will
remain fast (at about 10% per annum) in the longer term, and second, and related, whether the
challenges that it faces will prove to be an insurmountable barrier.41 Moreover, is high growth
desirable? Growing fast has both pros and cons. China’s problem is how to transform the
countryside, where hundreds of millions of people still live and are mostly engaged in
agriculture. While high growth is still important to lift living standards, it may not be a sufficient
condition for high employment creation. Moreover, it may lead to imbalances and inflation.
Our argument, developed in previous sections, is that China has amassed a huge stock of
capabilities that are key to continue growing. But this analysis should not be misconstrued: thirty
years of high growth does not imply unending growth. In fact, in our view, a more appropriate
statement is that it means that the probability that China continues to grow at 10% per annum is
diminishing. Naturally this will have consequences. In our view, there are three important
risks/constraints that policymakers should be aware of, as they will affect the country’s long-
term performance. First, China’s economy is in a state of delicate balancing in many fronts,
including coastal-interior/urban-rural areas and across income groups. It is well-known that
inequalities are on the rise. One key policy concern is how to redistribute wealth from the
wealthier to the poorer areas. Second, there are serious environmental concerns. Third, while on
many fronts China appears to be a market economy, it is not in many important aspects,
including the allocation of capital.42 Given these issues, there are three possible scenarios for the
medium-to-long term, 2010–2030:
(i) China continues registering very high growth rates (10% and above) much longer.
This is very unlikely. Growth during the previous thirty years has done wonders.
However, it has also created imbalances and inefficiencies;
41 Zeng and Wang (2007) provide a very useful SWOT analysis of China. They highlight China’s weak institutions, low overall educational attainment, weak indigenous innovation capacity, and poor linkages between research and development and industry. 42 Felipe et al. (2008) show that the productivity of capital has been on a downward trend for a long time.

38
(ii) a controlled deceleration that results in an average annual growth for the twenty-year
period of about 5% (Felipe, Kumar, and Abdon 2010c). As argued here, what underlies
China’s high growth during the last decades is the massive accumulation of capabilities.
The rate of accumulation will decline. As Felipe et al. (2010c) argue, for China to
continue growing at 8–10% per annum during the next twenty years, it would have to
continue gaining comparative advantage in more products and increasing the level of
sophistication of its export package in a way that does not seem plausible. With this
reduction in growth, China’s policymakers will have to monitor the employment
elasticity of growth (Felipe and Hasan 2006: table 3.6);43 or
(iii) a serious downturn, as a consequence of, for example, a financial crisis. As China
becomes more a market economy, this risk will increase (Minsky 2008). As argued
above, markets do not allocate capital in China and the degree of inefficiency is high. The
crisis can also be the result of the vertigo that the growth figures produce. To avoid a
crisis, either growth comes down or there is a drastic reduction in consumption of
resources per unit produced, as well as in the pattern of final consumption. 44 This is the
scenario to avoid as it would have very serious economic and social consequences. It is
worthwhile trading some of the high growth for stability.
7. CONCLUSIONS: WHAT LIES AHEAD AND WHAT CHINA SHOULD DO
In this paper we have discussed China’s impressive performance since the 1960s as a result of its
capacity to accumulate and master capabilities. China’s increasing capabilities are reflected in
the number of products exported with revealed comparative advantage (degree of diversification)
43 Felipe and Hasan (2006) note that China’s employment elasticity of growth declined between the 1980s and the 1990. While in the first decade 3% output growth generated 1% employment growth, in the 1990s the same employment growth required 8% output growth. 44 Brown (2005) estimates that if China reached the level of oil consumption that the United States had in 2004, in 2031 it (China) would need 99 million barrels/day. Note that this figure is well above total world production in 2007 (at about 82 million barrels/day). Also, if in 2031 China consumed the same amount of paper that the United States consumed in 2004, it would need 303 million tons, double the world production in 2004. Finally, if each Chinese family owned three cars per every four persons (the same as the typical American family), in 2031 there would be 1.1 billion cars, which would be difficult to fit into the country in the current circumstances.

39
and in the increasing sophistication of its export basket. We have used the recently developed
product space methodology to document and analyze these changes.
The analysis indicates that by 1962, China had acquired revealed comparative advantage
in the export of 105 products (out of 779 in our analysis), although only 14 were “core” products
(metals, chemicals, machinery) with a significant level of sophistication, especially taking into
account its income per capita. By 1980, when transition started, China had already attained
comparative advantage in the export of a significant number of products, a total of 234 (of which
46 were core products, mostly chemicals and metals), and it already had a relatively high index
of export sophistication (given its income level). Despite the hardship imposed by the Great Leap
Forward, the Cultural Revolution, and all the inefficiencies of the planning system, it is difficult
to square these gains, which had to entail significant structural transformation of the Chinese
economy, as well as mastering of a significant number of capabilities, with lack of technical
progress (however broadly defined). Our analysis indicates that the government’s priority
industries did not necessarily go against China’s factor abundance, as the country has gained
comparative advantage in the export of both labor-intensive and sophisticated products. This
strategy has paid off, as there is no doubt that a country with an inefficient industrial sector is
better off than one with a weak or no industrial sector at all. This evolution helps explain the
shift that occurred during the late 1980s, when China truly set foot into the core of the product
space and, in particular, into electronics and machinery. In 1990, the number of core products
exported with comparative advantage reached 65.
By 2006, China’s export basket was highly sophisticated and one of the most diversified
in the world: it exported 269 products with comparative advantage, of which 100 were core
products. No other developing country can match China’s spectacular performance. We have
argued that this was the result of industrial policies that allowed the accumulation of product-
specific capabilities. In our view, if in 1950 China had tried to go “the other way,” probably
today it would be a much poorer country.
A measure of the future export opportunities reveals that China is extremely well-
positioned to continue performing very well. From a policy perspective, this analysis, together
with that on sophistication and diversification, indicates that Chinese policymakers should not
feel pressure and rush to undertake major interventions and reforms, as the country has achieved
a relatively high level of sophistication and diversification in its export basket, as well as a very

40
large potential export opportunity set. In simple terms, “let it be.”45 An unorthodox and
gradualist development path, based on implementing well-focused reforms in key areas (Rodrik
2006b) while rejecting many of the so-called Washington-Consensus reforms, has served China
very well. While the country will have to implement many reforms (e.g., labor and capital
markets, the development of services) in the coming decades, something that policymakers know
well, a cautious pace is still the route to follow in the medium term. The private sector could be
invited to this process through, for example, sectoral round-tables, deliberation and investment
advisory councils, and public-private venture funds. In the words of Brandt, Rawski, and Sutton
(2008: 570): “Chinese experience shows that despite their undoubted benefits, neither
privatization of enterprise ownership nor extensive deregulation, full price flexibility, rule of
law, and other widely recommended institutional changes must necessarily precede a broad-
gauged advance of manufacturing capabilities.”
China is implementing policies to achieve a “harmonious society” (Felipe 2010: 1–6).
Chinese policymakers have realized that solving problems such as unemployment and
underemployment, a deteriorating environment, or increasing inequalities, will determine how
well the country does in the next decades (Wen 2010). Perhaps policymakers should think less in
terms of a growth target and more in terms of employment creation (and
unemployment/underemployment reduction) and structural transformation targets. Growth will
be a by-product. Development is a path-dependent process and China has acquired tremendous
knowledge and competency that will allow it to continue thriving in the next decade. This does
not mean, however, that growth rates of 10% and above will remain forever, as China faces a
number of constraints and risks.
Analyzing China in the year 2030, the miracle of the previous twenty years will not be,
most likely, that annual growth remained at 10%; rather, it should be that, in 2010, its
policymakers well understood the country’s potential, together with the constraints and risks that
it faced and, most importantly, that they successfully implemented a series of reforms that
allowed the country to continue transforming.
45 This is an expression used by Ricardo Hausmann.

41
REFERENCES Abramovitz, M. 1986. “Catching-Up, Forging Ahead and Falling Behind.” Journal of Economic
History 46: 386–406. Balassa, B. 1965. “Trade Liberalization and Revealed Comparative Advantage.” Manchester
School of Economics and Social Studies 33: 99–123. Bardhan, P. 2008. “What Makes a Miracle. Some Myths about the Rise of China and India.”
Boston Review January–February. Blanchard, O., and F. Giavazzi. 2005. “Rebalancing Growth in China: A Three-Handed
Approach.” Working Paper 05-32 (November 25). Cambridge, MA: Department of Economics. Massachusetts Institute of Technology.
Borensztein, E., and J.D. Ostry. 1996. “Accounting for China’s Economic Performance.” The
American Economic Review, Papers and Proceedings 86(2): 224–228. Brandt, L., T.G. Rawski, and J. Sutton. 2008. “China’s Industrial Development.” in L. Brandt
and T.G. Rawski (eds.), China’s Great Transformation. Cambridge, UK: Cambridge University Press.
Brown, L. 2005. “China is replacing the United States as World’s Leading Consumer.” New
Perspectives Quarterly (Spring). Chang, H.-J. 2002. Kicking Away the Development Ladder. London: Anthem Press. ————. 2009a. “Hamlet without the Prince of Denmark: How development has disappeared
from today’s ‘development’ discourse.” in S. Khan and J. Christiansen (eds.), Towards New Developmentalism: Markets as Means rather than Master. Abingdon: Routledge. Forthcoming.
————. 2009b. “Industrial Policy: Can we go beyond an unproductive confrontation?”
Presented at the Annual World Bank Conference on Development Economics (ABCDE). Version of September 30.
Chow, G.C. 1993. “Capital Formation and Economic Growth in China.” Quarterly Journal of
Economics 108(August): 809–842. Dahlman, C. 2009. “Growth and Development in China and India.” in M. Cimoli, G. Dosi, and J.
E. Stiglitz (eds.), Industrial Policy and Development: The Political Economy of Capability Accumulation. London: Oxford University Press.
Feenstra, R., R. Lipsey, H. Deng, A. Ma, and H. Mo. 2005. “World Trade Flows: 1962–2000.”
Working Paper 11040. Cambridge, MA: National Bureau of Economic Research (NBER).

42
Felipe, J. 2010. Inclusive Growth, Full Employment and Structural Change: Implications and Policies for Developing Asia, second edition. London: Anthem Press.
Felipe, J., and J.S.L. McCombie. 2002. “Productivity in China before and after 1978 revisited.”
Zagreb International Review of Economics and Business 5(1): 17–43. ————. 2010. “Modeling Technological Progress and Investment in China: Some Caveats.”
Mimeograph. Felipe, J., and R. Hasan. 2006. Labor Markets in Asia. Issues and Perspectives. London: Palgrave
Macmillan. Felipe, J., and G. Estrada. 2008. “Benchmarking Developing Asia’s manufacturing sector.”
International Journal of Development Issues 7(2): 97–119. Felipe, J., E. Laviña, and E.X. Fan. 2008. “The Diverging Patterns of Profitability, Investment and
Growth of China and India, 1980–2003.” World Development 36(5): 741–774. Felipe, J., M. León-Ledesma, M. Lanzafame, and G. Estrada. 2009. “Sectoral Engines of Growth
in Developing Asia: Stylized Facts and Implications.” Malaysian Journal of Economic Studies 46(2): 107–133.
Felipe, J., U. Kumar, and A. Abdon. 2010a. “Exports, capabilities, and industrial policy in India.”
Mimeograph. Manila: Asian Development Bank. Available at: http://jesusfelipe.com/download/industrial_policy_india.pdf ————. 2010b. “As you sow so shall you reap: from capabilities to opportunities.”
Mimeograph. Manila: Asian Development Bank. Available at: http://jesusfelipe.com/download/Index_of_Opportunities.pdf
————. 2010c. “Using capabilities to project growth 2010–2030” Mimeograph. Manila: Asian
Development Bank. Available at: http://jesusfelipe.com/download/Growth_Forecasts.pdf Hausmann, R., L. Pritchett, and D. Rodrik. 2006. “Growth Accelerations.” Journal of Economic
Growth 10: 303–329. Hausmann, R., J. Hwang, and D. Rodrik. 2007. “What you export matters.” Journal of Economic
Growth 12(1): 1–15. Hausmann, R., and B. Klinger. 2006. “Structural Transformation and Patterns of Comparative
Advantage.” CID Working Paper No. 128. Cambridge, MA: Center for International Development, Harvard University.
Hausmann, R., and D. Rodrik. 2003. “Economic Development as Self-discovery.” Journal of
Development Economics 72(2): 603–633.

43
Heytens, P., and H. Zebregs. 2003. “How Fast Can China Grow?” in W. Tseng and M. Rodlauer (eds.), China Competing in the Global Economy. Washington, DC: International Monetary Fund.
Hidalgo, C. 2009. “The Dynamics of Economic Complexity and the Product Space over a 42-
year Period.” Working Paper No.189. Cambridge, MA: Center for International Development at Harvard University.
Hidalgo, C., and R. Hausmann. 2009. “The Building Blocks of Economic Complexity.”
Proceedings of the National Academy of Sciences 106(26): 10570–10575. Hidalgo, C., B. Klinger, A. L. Barabasi, and R. Hausmann. 2007. “The Product Space Conditions
the Development of Nations.” Science 317: 482–487. Hobday, Michael. 1995. Innovation in East Asia. Cheltenham, UK: Edward Elgar. Hu, Z.F., and M.S. Khan. 1997. “Why is China Growing so Fast?” International Monetary Fund
Staff Papers 44(1): 103–131. Islam, N., E. Dai, and H. Sakamoto. 2006. “Sources of Growth.” in Y. Wu (ed.), Economic
Growth, Transition and Globalization in China. Northampton: Edward Elgar. Kaldor, N. 1967. Strategic Factors in Economic Development. Ithaca, NY: New York State
School of Industrial and Labor Relations, Cornell University. Kim, L. 1997. From Imitation to Innovation: Dynamics of Korea’s Technological Learning.
Boston, MA: Harvard Business School Press. Leamer, E. 1984. Sources of International Comparative Advantage: Theory and Evidence.
Cambridge: MIT Press. Lee, K., and J.A. Mathews. 2010. “From Washington Consensus to BeST Consensus for world
development.” Asian Pacific Economic Literature 24(1): 86–103. Lin, J. 1998. “How did China feed itself in the past? How will China feed itself in the future?”
Second Distinguished Economist Lecture, presented at the International Maize and Wheat Improvement Center, Mexico, DF. Downloaded from: http://apps.cimmyt.org/english/docs/special_publ/del/2del/2distecon_text.htm
Lin, J., and H.-J. Chang. 2009. “Should Industrial Policy in Developing Countries Conform to
Comparative Advantage or Defy It? A Debate between Justin Lin and Ha-Joon Chang.” Development Policy Review 27(5): 1–20.
Minsky, H. 2008. Stabilizing an Unstable Economy. New York: McGraw-Hill.

44
Naughton, B. 1990. “China’s Experience with Guidance Planning.” Journal of Comparative Economics 14: 743–767.
————. 2008. “A Political Economy of China’s Economic Transition.” in L. Brandt and T.G.
Rawski (eds.), China’s Great Transformation. Cambridge, UK: Cambridge University Press.
Nelson, R.R., and H. Pack. 1999. “The Asian Growth Miracle and Modern Growth Theory.”
Economic Journal 109(457): 416–436. Reinert, E. 2007. How Rich Countries Got Rich…and Why Poor Countries Stay Poor. London:
Constable. Rodrik, D. 2006a. “Industrial Development: Stylized Facts and Policies.” John F. Kennedy
School of Government, Harvard University. Available at: ksghome.harvard.edu/~drodrik/ industrial%20development.pdf
————. 2006b. “Goodbye Washington Consensus, Hello Washington Confusion?” The John
F. Kennedy School of Government, Harvard University. ————. 2010. “Making Room for China in the World Economy.” American Economic
Review, Papers and Proceedings (forthcoming). Storm, S., and C.W.M. Naastepad. 2005. “Strategic Factors in Economic Development: East
Asian Industrialization 1950–2003.” Development and Change 36(6): 1059–1094. Tsui, K.-Y., T.-T. Hsueh, and T.G. Rawski. 1995. Productivity, Efficiency and Reform in
China’s Economy. Hong Kong; The Chinese University of Hong Kong. Wang, H., and S. Li. 1995. Industrialization and Economic Reform in China. Beijing: New
World Press. Ward, B. 1962. The Rich Nations and the Poor Nations. New York: W.W. Norton and Company. Wen, J. 2010. “Report on the Work of the Government.” Delivered at the Third Session of the
Eleventh National People’s Congress, March 5. Wilcox, C., W.D. Weatherford, and H. Hunter. 1962. Economies of the World Today: Their
Organization, Development, and Performance. New York and Burlingame: Harcourt, Brace & World, Inc.
Young, A. 2000. “Gold into Base Metals: Productivity Growth in the People’s Republic of China
during the Reform Period.” Working Paper 7856. Cambridge, MA: National Bureau of Economic Research (NBER).

45
Yueh, L.Y. 2009. “Perspectives on Chnia’s Economci Growth: Prospects and Wider Imapct.” in N. Dinello and W. Shaoguang (eds.), China and India and Beyond: Development Drivers and Limitations. Cheltenham, UK: Edward Elgar.
Zeng, D.Z., and S. Wang. 2007. “China and the Knowledge Economy: Challenges and
Opportunities.” World Bank Policy Research Working Paper 4223. Washington, DC: The World Bank.
Zhang, K.H., and S. Song. 2000. “Promoting Exports. The role of inward FDI in China.” China
Economic Review 11: 385–396.

46
Appendix Table 1: Leamer’s Classification and SITC Rev. 2 (2-digit) 1. Petroleum 7. Labor-intensive Petroleum and petroleum products 33 Nonmetallic mineral 66 Furniture 82 2. Raw materials Travel goods, handbags 83 Crude fertilizer and crude minerals 27 Articles of apparel 84 Metalliferous ores 28 Footwear 85 Coal 32 Miscellaneous manufacture 89 Gas 34 Postal packages, not classified 91 Electric current 35 Special transactions, not classified 93 Nonferrous metals 68 Coin (other than gold coin) 96 Gold, nonmonetary 97 8. Capital-intensive 3. Forest products Leather 61 Cork and wood 24 Rubber 62 Pulp and waste paper 25 Textile yarn, fabrics 65 Cork and wood 63 Iron and steel 67 Paper 64 Manufactures of metals, nes 69 Sanitary fixtures and fittings, nes 81 4. Tropical Agriculture Vegetables and fruit 05 9. Machinery Sugar 06 Power generating 71 Coffee 07 Specialized for particular industries 72 Beverages 11 Metalworking 73 Crude rubber 23 General industrial 74 Office and data processing 75 5. Animal products Telecommunications 76 Live animals 00 Electrical 77 Meat 01 Road vehicles 78 Dairy products 02 Other transport equipment 79
Fish 03 Professional and scientific instruments 87
Hides, skins 21 Photographic equipment 88
Crude animal and vegetable materials 29 95
Animal and vegetable oils and fats 43
Armored vehicles, firearms, and ammunition
Animals, live (nes) 94 10. Chemicals 6. Cereals Organic 51 Cereals 04 Inorganic 52 Feeds 08 Dyeing and tanning 53 Miscellaneous edible products 09 Medicinal and pharmaceutical 54 Tobacco 12 Oils and perfume 55 Oil seeds 22 Fertilizers 56 Textile fibers 26 Explosives 57 Animal oils and fats 41 Artificial resins and plastic 58 Fixed vegetable oils and fats 42 Chemical materials, nes 59
Related Documents