INSTITUTE of TRANSPORT and LOGISTICS STUDIES The Australian Key Centre in Transport and Logistics Management The University of Sydney Established under the Australian Research Council’s Key Centre Program. WORKING PAPER ITLS-WP-17-15 Barriers and facilitators of integration between buses with a higher level of service and rail: An Australian case study By Geoffrey Clifton a and Corinne Mulley a a Institute of Transport and Logistics Studies (ITLS), The University of Sydney Business School, Sydney, Australia August 2017 ISSN 1832-570X

Welcome message from author
This document is posted to help you gain knowledge. Please leave a comment to let me know what you think about it! Share it to your friends and learn new things together.
Transcript

INSTITUTE of TRANSPORT and LOGISTICS STUDIES The Australian Key Centre in
Transport and Logistics Management
The University of Sydney Established under the Australian Research Council’s Key Centre Program.
WORKING PAPER
ITLS-WP-17-15
Barriers and facilitators of integration between buses with a higher level of service and rail: An Australian case study
By Geoffrey Cliftona and Corinne Mulleya a Institute of Transport and Logistics Studies (ITLS), The University of Sydney Business School, Sydney, Australia
August 2017 ISSN 1832-570X


NUMBER: Working Paper ITLS-WP-17-15
TITLE: Barriers and facilitators of integration between buses with a
higher level of service and rail: An Australian case study
ABSTRACT: The debate as to whether investment should be made in bus
based or rail based rapid transit systems continues within the
academic literature with entrenched arguments on both sides.
Within Australia, the debate has become increasingly political
with questions around the transport benefits, the environmental
impacts and the financial costs of the rival technologies being
significant issues in recent state and territory elections. However,
this tends to be a debate around the appropriate solution for
particular corridors. In practice all major Australian cities have
made investments in both bus serviced and rail serviced
corridors. If public transport services are to operate as a coherent
network then successful integration must occur between these
bus and rail corridors. This paper adds to the literature on the
success factors for network integration by examining the barriers
and facilitators of integration between buses with a higher level
of service and rail using two case studies from Australia. The
paper sets out a taxonomy of the elements of network integration
then examines cases from around Australia to show aspects of
where service integration has been successful and where it has
been less so. The paper includes a detailed study of a new public
transport infrastructure project in Sydney to examine the concept
of bus and rail integration more holistically and to show how a
framework of examining success factors for network integration
can inform policy.
KEY WORDS: Bus, Buses with a high level of service, Rail, Transfer,
Passenger value chain, Travel time, Frequency, Connectivity
AUTHORS: Clifton and Mulley
Acknowledgements: The authors would like to acknowledge the assistance of Liang
Ma and Loan Ho who created the maps shown in this paper.
CONTACT: INSTITUTE OF TRANSPORT AND LOGISTICS STUDIES
(H73)
The Australian Key Centre in Transport and Logistics
Management
The University of Sydney NSW 2006 Australia
Telephone: +612 9114 1824
E-mail: [email protected]
Internet: http://sydney.edu.au/business/itls
DATE: August 2017


Barriers and facilitators of integration between buses with a higher level of service and rail: An Australian case study Clifton and Mulley
1
1. Introduction The success of a transport corridor is typically considered in terms of the transport benefits to potential
users of that corridor relative to the cost of building and operating the service. More holistic evaluations
consider the benefits to the transport network as a whole and this is obviously essential when considering
integration between bus and rail serviced corridors. However, a transport centred approach to judging
the success of a transport corridor is increasingly seen as incomplete as governments are seen to be
placing more emphasis on the ability of transport investments to generate ancillary developments,
particularly in activating new high density housing developments but also in terms of ‘place making’
and the creation of employment opportunities. This paper follows this development and looks beyond
the generation of transport benefits to the ability of the transport network or corridor to generate transit
oriented development around interchanges and around the corridors themselves as an important element
of the success of an integrated bus-rail network.
For this paper, buses with a higher level of service have been selected as the unit of analysis to
encompass both Bus Rapid Transit and less intensive bus based transit systems as in the Australian
context, investments in bus services with a higher level of service exist on a continuum between full
BRT and enhanced bus corridor services. Investment in rail has included suburban rail, commuter rail,
metro rail and light rail so this paper will consider all types of rail services. The paper covers all
Australian implementations of bus services operating on dedicated roads but excludes buses with a
higher level of service in cities without passenger rail services (e.g. Hobart, Tasmania). Those cities are
covered in depth in Clifton and Mulley 2016.
The rest of the paper is structured as follows, section 2 looks at the literature on integrating modes within
urban areas and examines those aspects of interchange that are most relevant to users. Section 3 looks
at the current state of integration between rail based and bus based implementations of fast, frequent
public transport services and considers the likely impact of future light rail lines in Canberra and the
Gold Coast on integration with frequent bus networks. Section 4 examines a case study in more detail
looking at the impact on travel times when the network of direct bus services to the Central Business
District with a network of frequent feeder buses to the under construction North West metro. Section 5
draws conclusions and recommendations for future research in this area.
2. Literature context The literature context for this paper concentrates on two issues. First the issue of literature examining
the integration of modes within urban areas into coherent networks. Second, those aspects of interchange
which appear to be important to users in changing between one mode and another because these are
issues that a highly integrated system of urban transport will need to get right.
Within urban areas, there have been a number of studies that have looked at competition between the
same mode. For example, the deregulation of bus services in the UK in the mid-1980s provided much
data on intra-modal competition with papers looking at more theoretical aspects of a single route or
group of routes or aspects of competition such as the introduction of new vehicle sizes or fares (Glaister
1985, 1986). However, much more empirical research centres on the experience post-deregulation with
many authors identifying quality (frequency of service, comfort and other ‘soft’ factors) as being more
important than price for passengers (Mackie et al. 1995). However, most of the studies that have
considered inter-modal competition have been centred on longer journeys such as those made by air or
high speed rail (for example, Behrens and Pels, 2012; Dobruszkes et al., 2014) rather than inter-modal
competition within the same urban system as considered in this paper with a notable exception being
the paper by Yen et al (2017a) which used revealed preference data in the form of public transport smart
card data to investigate competition between the bus and heavy rail systems in Brisbane, Australia. This

Barriers and facilitators of integration between buses with a higher level of service and rail: An Australian case study
Clifton and Mulley
2
paper adds to the literature by providing a more in-depth review of the ways in which multi-modal
systems can and do interact with suggestions providing an evidence base for good and not so good
factors for network integration.
Good integration in multi-modal urban transport systems demands effective interchange between
modes. This is supported by Chowdhury and Ceder (2013) whose study of perceptions found that public
transport users were more willing to use a route which involved an interchange if there is a good
connection. There are however many studies that have looked at the implications of interchange from a
travellers’ perspective with travel time, waiting time and waiting time being revealed as increasingly
important important at interchange (Vande Walle and Steenberghen 2006; Xumei et al. 2011). Indeed,
it is commonly understood that there is a transfer penalty at interchange with different modes being
associated with different penalties and with commuters appearing to experience lower penalties than the
one-off or irregular traveller. Litman (2014) estimates penalties of between five and fifteen minutes of
in-vehicle or travel time. This penalty is at the lower end when information is good and where there
interchange facilities provide comfort. Travellers clearly dislike interchange (even if it exposes more of
the network to them for travel (Hitrans 2005) but more than the time of interchange, travellers dislike
interchange that involves a financial penalty (Yen et al 2017b). This brief discussion about interchange
identifies that considering the time taken travelling, the time waiting and walking, the provision of
information and whether there is a fare penalty are all important considerations in identifying whether a
multi-modal urban system is well integrated.
3. Integration between bus based systems and rail based systems
in Australia
3.1 Overview of integration The current levels of integration between bus based systems and rail based systems in Australia are
summarised in Tables 1 and 2. Services are evaluated in terms of those network planning factors
considered relevant in the academic literature for transfer between services. It is important to note that
these tables do not consider all factors of importance to public transport users. The physical
infrastructure of the transfer points themselves (e.g. covered walkways, distance between bus stops and
railway platforms, etc.) are outside the scope of this paper as are the waiting time for connecting services.
Some factors intrinsic to the individual routes (e.g. frequencies) are also outside the scope of this paper
but are covered in Clifton and Mulley 2016 for the bus based services.
Despite political debates being framed in terms of competition for investment money between modes,
there is actually quite strong integration between bus based and rail based systems in Australia. Outside
of Central Business Districts, there is little competition between modes on particular corridors.
Furthermore, all cities have single websites and apps covering all modes along with integrated smart
card ticketing systems and all cities except Sydney have integrated fares. Australian cities are less
consistent in terms of presenting information to the public in terms of maps, which remain important for
wayfinding before and during travel (Mulley, et al. 2017) with most cities not presenting frequent bus
and rail services on the same map (if a map of frequent services is produced at all).
Tables 1 and 2 track fourteen different implementations of buses with a higher level of service. The
majority are simply branded high frequency services operating on surface streets but there are instances
of services operating on dedicated bus only roads that meet the standard definition of Bus Rapid Transit
(e.g. Brisbane and Sydney’s busways and Adelaide’s OBahn). Most of these services operate in cities
which also have suburban heavy rail systems; the exception being Canberra, which only has a long
distance rail service and the Gold Coast which has an interurban heavy rail line. Adelaide, Sydney and

Barriers and facilitators of integration between buses with a higher level of service and rail: An Australian case study Clifton and Mulley
3
the Gold Coast each have a single light rail line, Melbourne has a network of light rail or tram lines and
Canberra is constructing its first light rail line. Adelaide is the only city which brands its high frequency
(headway of 15 minutes or better) rail services separately from the low frequency services using the Hi
Frequency brand on one heavy rail line (Adelaide Metro 2013) and one light rail line (Adelaide Metro
2016).

Barriers and facilitators of integration between buses with a higher level of service and rail: An Australian case study Clifton and Mulley
4
Table 1: Network structure of enhanced bus services, BRT and rail in Australian cities.
City Enhanced bus service Rail Network structure
Brisbane Busway, BUZ, glider Heavy rail Complementary, Competitive and Cooperative
Gold Coast Turn up and go Heavy rail, light rail Complementary and Cooperative
Sydney M2 busway, NW Transitway, Liverpool to
Parramatta Transitway, Metrobus Heavy rail, light rail Complementary and Cooperative
Canberra Red rapid, blue rapid, Gold Line, Green Line, Light rail under construction Complementary and Cooperative
Melbourne SmartBus network Heavy rail, light rail Complementary
Adelaide OBahn, Go Zone Heavy rail, light rail Complementary
Perth High Frequency Bus Services Heavy rail Complementary and Cooperative
Table 2: Integration of ticketing, fare structures and information for enhanced bus services, BRT and rail in Australian cities.
City
Fare payments and fare levels Integration of information
Single smart card system
across modes Integrated fares Apps Maps Website
Brisbane Yes Yes Yes Busways shown on rail map but frequent rail
services not shown on frequent bus map Yes
Gold Coast Yes Yes Yes Yes Yes
Sydney Yes
Bus and light rail fares are integrated;
Transfer discount applies for bus to
train transfers
Yes No Yes
Canberra Yes Fares will be integrated when light
rail opens in 2019 n/a
2017-2020 frequent network plan shows both
light rail and rapid bus routes Yes
Melbourne Yes Yes Yes No Yes
Adelaide Yes Yes Yes Frequent services not distinguished on network
map Yes
Perth Yes Yes Yes Yes Yes

Barriers and facilitators of integration between buses with a higher level of service and rail: An Australian case study Clifton and Mulley
5
3.2 Integration of network structures For the purposes of this paper, the network structure integration between bus and rail based systems has
been classified as complementary, competitive or cooperative. A complementary network structure has
bus and rail based services on separate corridors, facilitating the extension of frequent services over a
greater geographical area. All cities have complementary network structures. The stated rationales for
implementing buses with a higher level of service typically emphasise the desire to spread enhanced
services to areas not serviced by the existing heavy rail network (Clifton and Mulley 2016).
On the other hand, a competitive network structure would have bus and rail services competing for the
same passengers on the same corridors. Geographical constraints mean that some degree of competition
is inevitable (e.g. the Sydney Harbour bridge carries Metrobus, M2 busway services and heavy rail) so
bus and rail based networks are only classified as competitive if there is a substantial degree of overlap.
Brisbane is the only example of a competitive network structure with a seven kilometre corridor1 through
the inner city served by both a railway and a busway (Figure 1). It is perhaps not coincidental that this
competitive network has had two ‘owners’ with the Brisbane City Council taking the lead on
implementing buses with a higher level of service in Brisbane (Clifton and Mulley 2016) and until 2004
set separate fares to the state government operated rail network.
Figure 1. Competing Rail and Bus Rapid Transit corridors in Brisbane, Queensland
Source: https://translink.com.au/sites/default/files/assets/resources/plan-your-journey/maps/161219-train-
busway-ferry-tram-network-map.pdf
A cooperative network has tight integration between the two modes allowing for easy transfer between
bus and rail modes and maximising the network effects from investing in both rail and bus based
networks. Sydney’s network is highly cooperative, at least in the structure of the network, with cross-
regional Metrobus corridors connecting rail corridors (Ho and Mulley 2014) and the other buses with a
higher level of service networks radiating from train stations. Brisbane’s shared bus and rail corridor
also creates a cooperative network structure, although at the expense of duplicated service. Brisbane’s
Cross River Rail project (Queensland Government 2017) will redirect rail services onto a new corridor
1 Buranda station to Windsor station
Barriers and facilitators of integration between buses with a higher level of service and rail: An Australian case study
Clifton and Mulley
6
through the Inner-City. This project will dovetail with the Brisbane City Council’s planned Brisbane
Metro (Brisbane City Council 2017) which would replace most of the existing busway services with bi-
articulated BRT standard buses. The net effect of both developments would be to create a more
cooperative, less competitive network structure.
The Gold Coast (Figure 2) and Canberra (Figure 3) are examples of bus networks recast to create a
cooperative network structure as part of the development of light rail corridors. The first stage of the
Gold Coast Light Rail opened in 2014 and replaced a frequent bus service (Clifton and Mulley 2016).
The bus services released by the new light rail line were redirected to strengthen services on other
corridors creating a network of high frequency bus services alongside the light rail line. The second
stage of the Light Rail between Griffith University and Helensvale is due to open in 2018 releasing more
buses to strengthen services elsewhere (Translink 2017a).
Figure 2. Cooperative Rail and Frequent Bus corridors on the Gold Coast, Queensland
Note: The yellow line with a black centre running East and South from Griffith University is the light rail
line; thin red line is the lower frequency interurban rail service and the other lines are frequent bus services.
Source: https://translink.com.au/sites/default/files/assets/resources/plan-your-journey/maps/170123-gold-
coast-turn-up-and-go.pdf

Barriers and facilitators of integration between buses with a higher level of service and rail: An Australian case study Clifton and Mulley
7
A similar recasting of the Canberra bus network is planned for the opening of the first Light Rail line in
2018 (ACT Government 2015) which will replace the Northern half of the Red Rapid frequent bus
corridor from the City to Gungahlin and allow for the creation of additional rapid bus routes connecting
with the light rail line at three interchanges (Figure 3).
Figure 3. Cooperative Light Rail and Frequent Bus corridors proposed for Canberra, Australian Capital
Territory
Source: Transport for Canberra 2016
3.3 Integration of fare structures and payment methods Canberra only has bus services at present but all other surveyed cities offer smart card ticketing systems
that cover all modes within their respective cities. Furthermore all those cities, with the exception of
Sydney, offer integrated fares between modes defined as fares that do not differ between modes and no
separate flag-fall for transfer between modes. Brisbane and the Gold Coast share the same Go Card
system (Translink 2017b). Canberra’s current smart card and fare system will be extended to cover the
light rail line when it is opened (ACT Government 2015).
Sydney has a complicated fare structure with light rail and bus services sharing one distance based fare
structure that offers free transfers between bus and light rail. The rail network employs a different
distance based fare structure and the ferry system uses a third distance based system. People transferring
between modes using different fare structures pay the sum of the separate fares for each segment.
However an AUD2.00 rebate for journeys was introduced in 2016 (NSW Minister for Transport and
Infrastructure 2016) and in some cases this more than offsets the additional flag-fall.
Barriers and facilitators of integration between buses with a higher level of service and rail: An Australian case study
Clifton and Mulley
8
3.4 Integration of information provision A well-integrated public transport network of fast-frequent services will only be effective if the potential
users are aware of the services. Mulley, et al. 2017 looked at the importance of information provision
for public transport finding that trip planning apps, websites and physical maps are of most importance
for trip planning by regular and irregular users. Each of the surveyed cities have both websites and travel
planning apps offering transport information across all modes.
Authors such as Walker (2008) have looked at the importance of frequent network maps. Both the Gold
Coast (Translink 2017a) and Canberra (Figure 3) have produced maps showing their under construction
light rail lines and the frequent bus network that will operate alongside them. The Gold Coast also
produced a similar map for the currently operating services during the interim between the 2014 opening
of the first stage Light Rail line and the 2018 completion of the second stage. Perth’s takes a different
approach showing all bus, rail and ferry services on its network maps (Transperth 2017) but using a
different colour to highlight the frequent bus services (all rail services operate with headways of 15
minutes or better).
Brisbane has a less consistent approach to the mapping of high frequency services. A map of the high
frequency bus services are produced (Translink 2016) but not one of the high frequency rail or ferry
services. However, the rail map (Figure 2) does show the busways as well. Melbourne produces a stand
alone map of the SmartBus network (PTV 2017). Adelaide did produce a map of its Go Zone network
(Adelaide Metro 2009) but no longer does so. Sydney is also lacking here with no overall map of its
frequent services and no integrated network map.
3.5 Future developments in integration between bus and rail based systems This section has looked at the current state of integration between bus and rail based systems and has
identified those systems which are generally providing good integration (The Gold Coast and, from
2018, Canberra) and those systems were elements of integration are lacking with Sydney where the
network and fare structure are fragmented being the least well integrated. The next section will examine
a case study of investment in new transport infrastructure to examine the effect that these will have on
integration between bus and rail based systems and travel time for commuters.
4. Case study of investment in new transport infrastructure New investment in public transport infrastructure (predominantly rail) is taking place in several
Australian cities but only four of these projects will have major implications for existing networks of
buses with a higher level of service. The developments in Brisbane, Canberra and the Gold Coast have
been discussed in Section 3 and this section will provide a more detailed case study of the North West
metro project in Sydney. This section will discuss the project and its likely impacts on integration
between bus and rail based systems.

Barriers and facilitators of integration between buses with a higher level of service and rail: An Australian case study Clifton and Mulley
9
4.1 The Current network in North West Sydney
The Hills District of North Western Sydney by a number of ordinary bus routes connecting to
employment centres and railway stations outside the Hills District as well a Metrobus service offering a
fast and frequent cross regional service through the Hills District. There is also a network of bus only
roads. The M2 busway operates for part of the length of the M2 Toll Road connecting the Hills District
to Macquarie Park, North Sydney and the Sydney Central Business District whilst the The North West
Transitway or NW Tway has branches that connect the Hills District to Blacktown, Westmead and
Parramatta which are employment and activity centres in their own rights and also interchanges with the
rail network. These are shown on Figure 4. As is typical for Australia (Mulley, et al. 2016) the Tway
and M2 busways are operated by both trunk routes and combined trunk and feeder bus services that
connect into the surrounding suburban areas, one of these services (the M61 from Castle Hill to the
Sydney CBD via the M2 busway) is branded as a Metrobus service. Development of bus services and
the busway network area are discussed in Clifton and Mulley 2016.
Figure 4. Rail and Bus Rapid Transit corridors in Sydney, New South Wales
The current network is complex having developed over a number of years and the routes which provide
a higher level of service in terms of speed and frequency are not clearly separated from the peak hour
only commuter routes or the other routes which provide a lower level of service (Figure 5). The North
West Metro project is intended to replace the existing network with a revised hierarchy of routes based
around feeder services to rail and trunk routes (including the NW Tway) to regional centres not on the
North West Metro.

Barriers and facilitators of integration between buses with a higher level of service and rail: An Australian case study
Clifton and Mulley
10
Figure 5. Bus network map of the Hills District of North West Sydney, New South Wales
Source: Hillsbus 2017
4.2 North West Metro The North West Metro will consist of a 23 kilometre rail line between Cudgegong Road and Epping and
(Transport for NSW 2011, p.10). From Epping, the line will take over the existing Epping to Chatswood
Rail Link (ECRL) with passengers transferring to the existing Sydney Trains network at Chatswood for
onward travel to the lower North Shore and Sydney Central Business District (CBD). Eventually Metro
service will be extended through a new tunnel to the Sydney CBD and onwards to South West Sydney
(Transport for NSW 2016).

Barriers and facilitators of integration between buses with a higher level of service and rail: An Australian case study Clifton and Mulley
11
The North West Metro has been considered by other studies. Hensher and Rose 2007 conducted demand
modelling for an earlier version of the project and Hensher, et al. 2012 looked at the Wider Economic
Benefits (WEBs) and Impacts (WEIs) to develop new methodologies for evaluating transport projects.
Clifton, et al. 2014 discussed the history of planning for the proposed rail link and used a similar
methodology to this section to look at the potential impacts on users of the successive iterations of the
proposed rail link as plans altered over time. More recently, Douglas (2016) found the impact of the
long tunnel section on potential users of the North West Metro will be equivalent to a ‘penalty’ of 1.3
to 1.9 minute of in vehicle travel time.
4.3 Impact on travel times for existing users of enhanced bus services
Clifton et. al 2014 and Clifton and Mulley 2017 sets out the methodology by which travel times can be
estimated for the future bus and rail network after completion of the North West Metro from Cudgegong
Road to Chatswood based on published information in the Environmental Impact Statement (EIS,
Transport for NSW 2012) and assuming that the current bus network will be redirected to operate largely
as a feeder service to rail stations in line with the EIS. These can be compared to the travel times as at
September 2015 prior to the impacts of construction of the new Metro, Sydney CBD Light Rail and
Northconnex Motorway extension on the existing bus network.
Changes in travel times can be estimated on both an unweighted (actual minutes of travel time) or on a
weighted basis (see Table 3 for the weights) which recognises that a minute of in vehicle travel time
does not have the same effect on passengers as a minute of walking time or waiting time. For this paper,
the weights used in the Australian academic literature (Ho and Hensher 2017) with transfer penalties
from Booz Allen Hamilton and PCIE 2003 quoted in Douglas and Jones 2013 are used in preference to
the weights given in the official Transport for NSW Appraisal Guidelines (TfNSW 2013). The academic
weights were chosen as they put less weight on the out of vehicle components of travel time and
therefore provide lower weighted travel times for the after construction case than the official guidelines.
Table 3: Relative valuations of the components of travel time for non-business related trips
Component of travel
time
TfNSW appraisal
guidelines
Australia
academic
literature
Walking access 1.5 1.5
Waiting 1.2 0.8
In vehicle 1.0 1.0
Transfer penalty 14.8 8.5
Walking transfer 1.5 1.7
Waiting transfer 1.5 1.7
Walking egress 1.5 1.9
Average delay 3.0 n/a
Standard deviation of
delay 1.0 5.1
Sources: TfNSW Appraisal Guidelines is Transport for New South Wales 2013; Australia academic literature
is Ho and Hensher 2017 with the exception of the transfer values which are taken from Booz Allen Hamilton
and PCIE 2003 quoted in Douglas and Jones 2013.
The Methodology was used to estimate the before and after travel times for travel from six Origins
within the Hills District (Figure 6). Five destinations were selected as being important destinations on
the new North West Metro (Macquarie University and Chatswood) or on the existing heavy rail network

Barriers and facilitators of integration between buses with a higher level of service and rail: An Australian case study
Clifton and Mulley
12
(North Sydney, Wynyard and Central Station) requiring Metro passengers to transfer to the existing rail
network at Chatswood. Two additional Origin-Destination (O-D) pairs were selected to provide
additional coverage. The first O-D pair covers trips from one of the busway stations (at Winston Hills)
outside the main study area to Wynyard in the Central Business District; this route is likely to have its
busway services reduced once the new Metro commences. The second O-D pair covers reverse commute
trips from the Central Business District into the main employment hub of the Hills District at Norwest.
In total there are 32 Origin-Destination pairs selected (Figure 6) and travel times have been calculated
for both the peak hour (arrival at 08:30) and the off-peak (arrival at 12:30). All origins and destinations
are either busway stations or bus stops on existing busway or enhanced surface bus services routes
serving the North West to allow for comparability of existing enhanced bus services to new Metro
services.
Figure 6: The study area
Note: The coloured stars in Figure 2 represent origins (green stars) and destinations (red stars) for the
comparison of travel times and fares.
The impacts on travel times for the 32 Origin-Destination pairs are shown in Tables 4 and 5 below. The
tables indicate that there are travel time savings for many Origin-Destination pairs but some journey
times will remain consistent or even increase in travel time. Furthermore, travel time savings vary by
time of day as well as by location with some locations benefiting in the peak but not the off peak (e.g.
Castle Hill to Wynyard).

Barriers and facilitators of integration between buses with a higher level of service and rail: An Australian case study Clifton and Mulley
13
Looking at specific destinations shows how the travel time benefits are not evenly distributed. Generally
services to Macquarie University and Chatswood will be quicker in both the peak and off-peak hours
but there will not be as significant gains for areas close to the existing busway (i.e. Excelsior Avenue)
as a direct bus service will be replaced by an indirect bus service via Castle Hill.
Travellers to Wynyard, which is the current focus of most M2 busway services and accounts for most
of the patronage for these services, will face mixed benefits. Services in the off-peak will be more
frequent from some parts of the North West but not others (i.e. Castle Hill and Excelsior). However,
most passengers will face longer travel times with travel time savings only from the more distant parts
of the study area (e.g. Rouse Hill in the peak and Dural in the off-peak). Travel time benefits to the
Southern end of the Central Business District around Central Station will also be mixed, although there
are likely to be travel time benefits for more travellers given that buses currently run on-street on
congested CBD streets between Wynyard and Central Station.
However, some users are unambiguously better off. No direct service is currently provided in off-peak
hours to Chatswood or for reverse commuters from Wynyard to Norwest, by lowering travel times the
new rail link will open up new cross regional public transport opportunities and travellers will be benefit
from the off-peak fare discount that only applies to rail services.
Travel times from Winston Hills to Winston are higher across the day which is to be expected as Winston
Hills is on the M2 busway but not near a new Metro station. Replacing an existing busway service with
a new rail corridor will lead to losses in utility for some users unless the new rail line serves exactly the
same corridor as the bus service it replaces.
One noticeable benefit is that travel times will be more consistent with differences of only one or two
minutes between the expected peak and off-peak travel times once the Sydney Metro opens. Currently
travel times can be up to twenty minutes faster in the off-peak (e.g. most services to Central Station)
where there is extensive on-street running or up to fifteen minutes slower (e.g. Baulkham Hills Private
Hospital to Macquarie University) where no direct services exist in the off-peak. The more consistent
travel times after introduction of the rail link reflects the generally lower levels of congestion within the
study area and the relatively short feeder bus journeys.
4.4 Other impacts Apart from the Metrobus, Transitway and some M2 busway services most current bus routes only
operate in frequently outside of peak hours. The replacement feeder bus services and new Metro line are
being advertised as operating at high frequencies across the day (Transport for NSW 2017) although
exact services levels are not yet published. Many travellers will benefit in the off-peak from the higher
frequencies that will exist between most Origin-Destination pairs, as the driverless Metro will operate
at higher frequencies than most of the existing trunk bus routes.
Given Sydney’s fragmented fare structure, there will also be fare impacts from the new network structure
with some travellers paying lower fares and some paying higher fares. The level of fare changes will
depend on the distances travelled and the weekly travel behaviour of each passenger but there may be
savings of up to 35 per cent for some travellers and higher fares of up to 45 per cent for others.
Barriers and facilitators of integration between buses with a higher level of service and rail: An Australian case study Clifton and Mulley
14
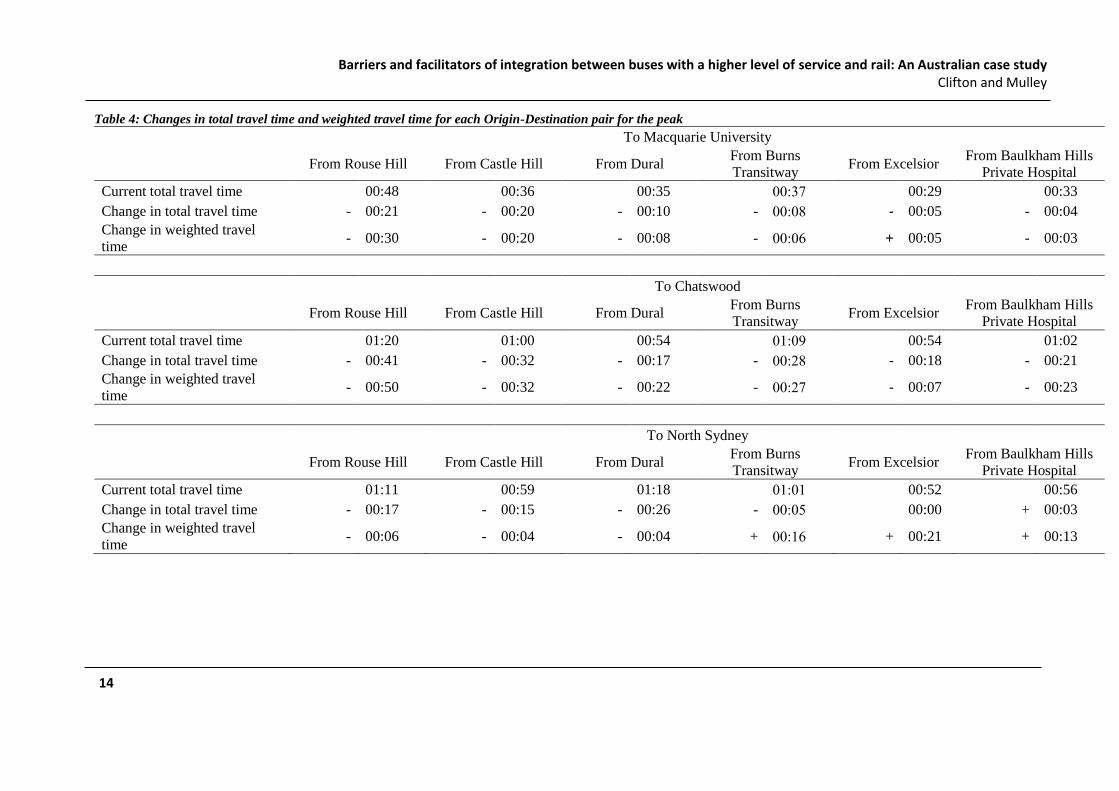
Table 4: Changes in total travel time and weighted travel time for each Origin-Destination pair for the peak
To Macquarie University
From Rouse Hill From Castle Hill From Dural From Burns
Transitway From Excelsior
From Baulkham Hills
Private Hospital
Current total travel time 00:48 00:36 00:35 00:37 00:29 00:33
Change in total travel time - 00:21 - 00:20 - 00:10 - 00:08 - 00:05 - 00:04
Change in weighted travel
time - 00:30 - 00:20 - 00:08 - 00:06 + 00:05 - 00:03
To Chatswood
From Rouse Hill From Castle Hill From Dural From Burns
Transitway From Excelsior
From Baulkham Hills
Private Hospital
Current total travel time 01:20 01:00 00:54 01:09 00:54 01:02
Change in total travel time - 00:41 - 00:32 - 00:17 - 00:28 - 00:18 - 00:21
Change in weighted travel
time - 00:50 - 00:32 - 00:22 - 00:27 - 00:07 - 00:23
To North Sydney
From Rouse Hill From Castle Hill From Dural From Burns
Transitway From Excelsior
From Baulkham Hills
Private Hospital
Current total travel time 01:11 00:59 01:18 01:01 00:52 00:56
Change in total travel time - 00:17 - 00:15 - 00:26 - 00:05 00:00 + 00:03
Change in weighted travel
time - 00:06 - 00:04 - 00:04 + 00:16 + 00:21 + 00:13

Barriers and facilitators of integration between buses with a higher level of service and rail: An Australian case study Clifton and Mulley
15
Table 4: Changes in total travel time and weighted travel time for each Origin-Destination pair for the peak continued
To Wynyard
From Rouse Hill From Castle Hill From Dural From Burns
Transitway From Excelsior
From Baulkham Hills
Private Hospital
Current total travel time 01:06 00:54 00:49 00:55 00:46 00:47
Change in total travel time - 00:05 - 00:04 + 00:10 + 00:09 + 00:12 + 00:19
Change in weighted travel
time + 00:05 + 00:06 + 00:31 + 00:19 + 00:33 + 00:40
To Central Station
From Rouse Hill From Castle Hill From Dural From Burns
Transitway From Excelsior
From Baulkham Hills
Private Hospital
Current total travel time 01:19 01:12 01:00 00:58 01:04 01:02
Change in total travel time - 00:11 - 00:15 + 00:08 00:00 + 00:01 + 00:11
Change in weighted travel
time - 00:00 - 00:04 + 00:10 00:00 + 00:22 + 00:32
To Wynyard To Norwest
From Winston Hills From Wynyard
Current total travel time 00:40 00:52
Change in total travel time + 00:16 + 00:02
Change in weighted travel
time + 00:26 + 00:02

Barriers and facilitators of integration between buses with a higher level of service and rail: An Australian case study Clifton and Mulley
16
Table 5: Changes in total travel time and weighted travel time for each Origin-Destination pair for the off-peak
To Macquarie University
From Rouse Hill From Castle Hill From Dural From Burns
Transitway From Excelsior
From Baulkham Hills
Private Hospital
Current total travel time 00:46 00:29 00:41 00:36 00:24 00:46
Change in total travel time - 00:19 - 00:13 - 00:16 - 00:07 00:00 - 00:18
Change in weighted travel
time - 00:28 - 00:13 - 00:05 - 00:05 + 00:10 - 00:31
To Chatswood
From Rouse Hill From Castle Hill From Dural From Burns
Transitway From Excelsior
From Baulkham Hills
Private Hospital
Current total travel time 01:12 00:53 00:55 01:02 00:46 00:53
Change in total travel time - 00:33 - 00:25 - 00:18 - 00:21 - 00:10 - 00:13
Change in weighted travel
time - 00:59 - 00:34 - 00:19 - 00:37 - 00:08 - 00:25
To North Sydney
From Rouse Hill From Castle Hill From Dural From Burns
Transitway From Excelsior
From Baulkham Hills
Private Hospital
Current total travel time 01:12 00:52 01:08 01:02 00:45 00:44
Change in total travel time - 00:18 - 00:08 - 00:16 - 00:06 + 00:07 + 00:12
Change in weighted travel
time - 00:22 - 00:07 - 00:06 - 00:00 + 00:18 + 00:12

Barriers and facilitators of integration between buses with a higher level of service and rail: An Australian case study Clifton and Mulley
17
Table 5: Changes in total travel time and weighted travel time for each Origin-Destination pair for the off-peak continued
To Wynyard
From Rouse Hill From Castle Hill From Dural From Burns
Transitway From Excelsior
From Baulkham Hills
Private Hospital
Current total travel time 00:55 00:45 01:05 00:45 00:38 00:40
Change in total travel time + 00:06 + 00:05 - 00:06 + 00:18 + 00:20 + 00:23
Change in weighted travel
time + 00:16 + 00:15 + 00:15 + 00:39 + 00:41 + 00:32
To Central Station
From Rouse Hill From Castle Hill From Dural From Burns
Transitway From Excelsior
From Baulkham Hills
Private Hospital
Current total travel time 01:08 00:58 01:22 00:58 00:51 00:53
Change in total travel time 00:00 - 00:01 - 00:16 + 00:09 + 00:14 + 00:17
Change in weighted travel
time + 00:10 + 00:09 - 00:06 + 00:28 + 00:35 + 00:26
To Wynyard To Norwest
From Winston Hills From Wynyard
Current total travel time 00:31 01:04
Change in total travel time + 00:06 - 00:10
Change in weighted travel
time + 00:18 - 00:19

Barriers and facilitators of integration between buses with a higher level of service and rail: An Australian case study
Clifton and Mulley
18
5. Discussion and conclusions
This paper has considered the current performance of Australian cities in terms of integration between
bus based and rail based rapid public transport services, services which can be characterised as fast,
frequent and direct. It was found that, despite the political discussion being framed around competition
between modes for the allocation of investment funds, there is actually reasonably strong integration
between bus and rail based systems in most Australian cities. What competition that does exist between
modes serving the same corridor is either incidental to geographic constraints (e.g. along the Harbour
bridge corridor in Sydney) or is planned to be eliminated (Brisbane). Fare structures and levels are
largely integrated (with the exception of Sydney) and, in terms of information provision, the systems
tend to be presented to the public as part of an integrated network. Sydney is a notable exception here
as information provision is more fragmented as is Adelaide which does not fully identify its frequent
rail and bus network online.
Currently investment mostly favours rail based solutions for particular corridors. Given the relative
expense of rail infrastructure, the number of corridors serviced by rail will necessarily be limited and
bus based frequent networks will continue to provide the breadth of coverage. In Canberra and the Gold
Coast the frequent bus network is being expanded at the same time as new light rail lines are replacing
parts of the existing frequent bus network, expanding opportunities for transit users. However, the case
study of North West Sydney showed that replacing bus based with rail based services can also have
more ambiguous results with some transit users experiencing improvements in travel times and others
experiencing longer trips.
Integration has been defined here as complementary or cooperative network structures and integration
of fares and information provision but there are other forms of integration that are outside the scope of
this paper. The physical connections between bus stops and railway stations or light rail stops are also
important with close proximity, covered walkways and clear directions being important to users
(Wardman, et al. 2001). Information provision at bus stops and train stations is also important,
irrespective of whether an interchange is taking place (Mulley, et al. 2017).
Consideration of these aspects of integration might improve the standing of Sydney and Adelaide.
Adelaide has good information provision at stations and frequent bus stops (Clifton and Mulley 2016)
and Sydney has invested heavily in this area with good interchange facilities between bus and heavy rail
at many stations (e.g. Parramatta) and good interchange facilities under construction at North West
Metro stations. Future work in this area could include stated preference modelling of travellers
preferences around interchange between bus based and rail based rapid public transport networks.

Barriers and facilitators of integration between buses with a higher level of service and rail: An Australian case study Clifton and Mulley
19
References
ACT Government 2015, ‘Transport Canberra Light Rail Network’, Canberra.
Adelaide Metro 2009, Go Zones, http://www.adelaidemetro.com.au/routes/gozones.html, retrieved 29
September 2009.
Adelaide Metro 2013, Gawler Central: Effective 4 February 2013,
http://www.adelaidemetro.com.au/content/download/1253/57929/file/Gawler_train_040213_ttable_ro
utemap.pdf, retrieved 31 July 2017.
Adelaide Metro 2016, Glenelg tram: Effective 26 January 2016,
http://www.adelaidemetro.com.au/content/download/667/56994/file/Glenelg-
Tram_ttable_routemap_26-01-16.pdf, retrieved 31 July 2017.
Behrens, C., Pels, E., (2012) Intermodal competition in the London-Paris passenger market: High-Speed
Rail and air transport. Journal of Urban Economics 71, 278-288.
Booz Allen Hamilton and PCIE 2003, ‘Sydney Light Rail stated preference survey report’, report to
New South Wales Department of Infrastructure Planning and Natural Resources (DIPNR) quoted in
Douglas and Jones (2013).
Brisbane City Council 2017, Brisbane Metro Business Case: Chapter 1 Executive Summary, Brisbane,
May 2017.
Chowdhury, S. and Ceder, A., 2013 Definition of Planned and Unplanned Transfer of Public Transport
Service and User Decisions to Use Routes with Transfers Journal of Public Transportation, vol. 16, pp.
1-20
Clifton, G.T., Mulley, C. and Hensher, D.A. 2014, ‘Bus Rapid Transit versus Heavy Rail in suburban
Sydney – Comparing successive iterations of a proposed heavy rail line project to the pre-existing BRT
network’, Research in Transportation Economics, vol. 48, pp. 126-141.
Clifton, G.T. and Mulley, C. 2016, 'A historical overview of enhanced bus services in Australian cities:
What has been tried, what has worked?', Research in Transportation Economics, vol. 59, pp. 11-25.
Clifton, Clifton, G.T. and Mulley, C. 2017, ‘The incidence of transport benefits for public transport
infrastructure: Winners and losers in the locality of the Sydney Metro North West, paper presented at
World Society for Transport and Land Use Research Conference, Brisbane, 2017.
Dobruszkes, F., Dehon, C., Givoni, M., (2014) Does European high-speed rail affect the current level
of air services? An EU-wide analysis. Transport Research Part A 69, 461-475.
Douglas, N.J. and Jones, M. 2013, ‘Estimating transfer penalties and standardised income values of time
by stated preference survey’, paper presented at 36th Australian Transport Research Forum (ATRF),
Brisbane, 2013.
Douglas, N.J. 2016, ‘Passenger preferences for surface versus underground rail travel’, paper presented
at 38th Australian Transport Research Forum (ATRF), Melbourne, 2016.
Glaister, S., (1985) Competition on an urban bus route. Journal of Transport Economics and Policy vol.
19, pp. 65-81.
Glaister, S., (1986) Bus deregulation, competition and vehicle size. Journal of Transport Economics
and Policy vol. 20, pp. 217-244.
Hensher, D.A. and Rose, J.M. 2007, ‘Development of Commuter and Non-Commuter Mode Choice
Models for the Assessment of New Public Transport Infrastructure Projects: A Case Study’, Transport
Research Part A, vol. 41, no. 5, pp. 428-443.

Barriers and facilitators of integration between buses with a higher level of service and rail: An Australian case study
Clifton and Mulley
20
Hensher, D.A., Truong, T.P., Mulley, C. and Ellison, R. 2012, ‘Assessing the wider economy impacts
of transport infrastructure investment with an illustrative application to the North-West Rail Link project
in Sydney, Australia’, Journal of Transport Geography, vol. 24, pp. 292-305.
Hitrans (written by Neilson G, Mulley C, and Nelson J) 2005, Public Transport - planning the network:
Hitrans Best Practice Guide 2, Hitrans Consortium, EU Interreg III b.
Hillsbus 2017, Hills District Bus Guide Effective from: 19 February 2017,
http://hillsbus.com.au/images/files/maps/hillsbus/Region_4_Network_Map.pdf, retrieved 31 July 2017.
Ho C. and Mulley C. 2014 'Metrobuses in Sydney: How high capacity and high frequency services are
benefiting the Metropolitan fringe', Research in Transportation Economics, vol.48, pp. 339-48.
Ho C. and Hensher D.A. 2017 ‘Joint estimation of mode and time of day choice accounting for arrival
time flexibility, travel time reliability and crowding on public transport’, Transportation Research
Procedia, forthcoming.
Mackie, P., Preston, J., Nash, C., (1995) Bus deregulation: Ten years on. Transport Review vol. 15, pp.
229-251.
Mulley C, Ma L, Clifton G, Yen B and Burke M 2016 'Residential property value impacts of proximity
to transport infrastructure: an investigation of bus rapid transit and heavy rail networks in Brisbane,
Australia', Journal of Transport Geography, vol.54, pp. 41-52.
Mulley C., Clifton G.T., Balbontin C. and Ma L. 2017 'Information for travelling: Awareness and usage
of the various sources of information available to public transport users in NSW', Transportation
Research Part A: Policy and Practice, vol.101, pp. 111-32.
NSW Minister for Transport and Infrastructure 2016, ‘Opal card fare freeze and weekly travel reward
reformed’, Media release 18 May 2016.
PTV 2017, ‘SmartBus network: Effective August 2010’,
https://static.ptv.vic.gov.au/siteassets/PDFs/Maps/Network-maps/SmartBus-Network.pdf, retrieved 29
July 2017.
Queensland Government 2017, Cross River Rail, https://www.crossriverrail.qld.gov.au, retrieved 30
July 2017.
Translink 2016, ‘ BUZ and CityGlider network map: Effective 12 December 2016’,
https://translink.com.au/sites/default/files/assets/resources/plan-your-journey/maps/161212-buz.pdf,
retrieved 29 July 2017.
Translink 2017a, ‘Have your say – Gold Coast bus changes’, https://haveyoursay.translink.com.au/gold-
coast-bus, retrieved 29 July 2017.
Translink 2017b, ‘About go card’, https://translink.com.au/tickets-and-fares/go-card/about-go-card,
retrieved 29 July 2017.
Transperth, 2017, ‘Transperth network maps’, http://www.transperth.wa.gov.au/Journey-
Planner/Network-Maps, retrieved 29 July 2017.
Transport for Canberra 2016 ‘Rapid Network 2017-2020’, Transport for Canberra, ACT.
Transport for NSW 2011, North West Rail Link Project Overview, NSW Government, Sydney, July
2011.
Transport for NSW 2012, Environmental Impact Statement Stage 1 – Major Civil Construction Works,
NSW Government, Sydney, April 2012.
Transport for NSW 2016, Sydney Metro City and South West: Chatswood to Sydenham Environmental
Impact Statement summary May – June 2016, NSW Government, Sydney, June 2016.

Barriers and facilitators of integration between buses with a higher level of service and rail: An Australian case study Clifton and Mulley
21
Transport for NSW 2017, Sydney Metro project update January 2017, NSW Government, Sydney,
January 2017.
Vande Walle, S and Steenberghen, T.,2006, Space and time related determinants of public transport use
in trip chains, Transportation Research Part A, vol. 40, pp. 151-162.
Walker, J. 2008, ‘Purpose-driven public transport: creating a clear conversation about public transport
goals’, Journal of Transport Geography, vol. 16, no. 6, pp. 436-442.
Wardman, M., Hine, J. and Stradling, S. 2001 Interchange and Travel Choice, Volume 1. Report for the
Scottish Executive.
Xumei C., L. Qiaoxian, D. Guang , 2011 Estimation of travel time values for urban public transport
passengers based on SP survey, Journal of Transportation Systems Engineering and Information
Technology, vol. 11, pp. 77-84.
Yen, B.T.H., Tseng, W-C., Mulley, C. and Chiou, Y-C. 2017a, ‘Inter-modal competition in an urbanized
area: Heavy rail and busways’, paper presented at 15th International Conference Series on Competition
and Ownership in Land Passenger Transport (Thredbo), Stockholm, 2017.
Yen, B.T.H., Tseng, W., Mulley, C., Chiou, Y., Burke,M. 2017b Assessing Interchange Effects in Public
Transport: A Case Study of South East Queensland, Transportation Research Procediai, vol. 25, pp.
4019-4037.
Related Documents