WORKING PAPER MARCH 2017 CMI WORKING PAPER NUMBER 5 REPOA WORKING PAPER 17/1 Policy Making in the Tanzanian Petro State: Building a Stascal Basis AUTHORS Jan Isaksen Blandina Kilama Fred Matola This REPOA/CMI working paper features research on Tanzania as a future petro state

Welcome message from author
This document is posted to help you gain knowledge. Please leave a comment to let me know what you think about it! Share it to your friends and learn new things together.
Transcript
WORKING PAPE RM A RCH 2 017
C M I WO R K I N G PA P E R N U M B E R 5R E P OA WO R K I N G PA P E R 1 7 / 1
Photo: xx
Policy Making in the Tanzanian Petro State: Building a Statistical Basis
AU T H O R S Jan IsaksenBlandina Kilama Fred Matola
Photo: xx
This REPOA/CMI working paper features research on Tanzania as a future petro state
2 P O L I C Y M A K I N G I N T H E TA N Z A N I A N P E T R O S TAT E
Policy Making in the Tanzanian Petro State: Building a Statistical BasisCMI Working Paper number 5 2017
Repoa number 17/1March 2017
AuthorsJan Isaksen
Blandina KilamaFred Matola
Graphic designerKristen Børje Hus
Cover photoKen Teegardin, CC license.
ISSN 0804-3639 (print)ISSN 1890-5048 (PDF)
ISBN 978-82-8062-641-7 (print)ISBN 978-82-8062-642-4 (PDF)
www.cmi.no

B U I L D I N G A S TAT I S T I C A L B A S I S 3
TABLE OF CONTENTS
List of tables and figures 4
1. INTRODUCTION 52. THE PETROLEUM SECTOR IN TANZANIA 6 Territorial boundaries 6 Geology and reserves 8 Legal framework, policies and public institutions 10 Exploration, development and extraction 11 Pipelines 12 Gas processing plants and gas fueled power plants 13 LNG processing 14 Operating companies and institutions 143. NATIONAL ECONOMIC CONTRIBUTION OF THE GAS RESOURCE 16 Investment 16 GDP – and GDP by sector 16 Imports and exports - balance of payments 18 Employment 19 State revenue, expenditure and financing 19 Social and welfare issues 20 Political and governance issues 20 The environment 20 The future 214. IMPROVING STATISTICS FOR MANAGEMENT OF THE PETRO ECONOMY 23 The role of good data 23 Tanzanian statistics and statistical development 24 Norway’s experience – relevant to Tanzania? 255. A DATA BASE FOR A PETRO FUTURE 28 Petroleum industry statistics – general issues 28 Territory, Geology and Reserves 30 Legal framework, policies, public institutions 30 Exploration, drilling 31 Extraction 31 Production, sales 32 Construction, rigs, platforms 32 Pipelines 33 Foreign trade 33 Industry 34 Investment 34 Energy 34 National Accounts 35 Government finance 36 Social issues – incomes – poverty 36 Political and Governance issues 36 Environment 37 International comparisons – international statistical sources 37 Analysis and models 376. CONCLUSIONS 39 REFERENCES 40
Annex 1: Oil and gas companies in Tanzania 44Annex 2: UN Fundamental Principles of official statistics 48Annex 3: Some Useful International Databases 49
4 P O L I C Y M A K I N G I N T H E TA N Z A N I A N P E T R O S TAT E
LIST OF TABLES AND FIGURES
TablesA: Gas production in Tanzania 2011–2015 (quantities and values on production and consumption also available quarterly) 13B: Electricity Generation and Capacity in Tanzania 14 C: Detailed Industrial composition of GDP, selected years (current prices) million Tshs 17D: Natural Gas composition of GDP selected years (constant 2007 and current prices) million Tshs 17E: Role of Mineral Fuels in external Trade 2010–2014, million Tshs 18F: State Revenue, Expenditure and Finance, million Tshs 19G: Composition of Revenue 2010–2015 million Tshs 20
Figures:Figure 1: UNCLOS Concepts applied to Tanzania’s Coastal waters 7Figure 2: Continental Shelf Tanzania 7Figure 3: Indian Ocean Territorial Claims 8Figure 4: Main basins with petroleum Potential 9Figure 5: Exploration Activity June 2016 Tanzania 15Figure 6: Tanzania: International Natural Gas Price 21
Boxes:Box 1: Key years for petroleum development in Tanzania 11
B U I L D I N G A S TAT I S T I C A L B A S I S 5
1. INTRODUCTION
This paper deals with needs and availability of data, statistics and information in Tanzania. It relates to a five-year (2014–19) research programme on prospects and challenges for the petroleum sector1.
The main objectives are a. to present a brief analysis based on data which is accessible at present
and b. to sketch a structure for the Tanzania Petro Data Hub (http://data.
tanpetstate.org).
The Data Hub will supply data, statistics and information of specific relevance for research on petroleum related issues in Tanzania. It forms one part of a two pronged web portal. The web site (http://www.tanpetstate.org/) will present information about research and the petroleum sector in Tanzania. The Petro Data Hub, presented below, will compile and present data related to Tanzania’s transition into the “petro” age which is not easily available from other sources. The Hub will focus on the data needs of four kinds of audiences: (a) researchers working under the various research components2 of the programme, (b) the wider research community, (c) civil society and (d) other individuals taking a special interest in the petroleum sector and its social and economic effects in Tanzania.
We will work closely with Tanzania’s National Bureau of Statistics (NBS). Also other institutions will assist the Petro Data Hub establish baselines. These will be used for tracking development during the five-year programme period and beyond. The Hub will also collate, compile and store data produced by the research components of the programme. It will make such data accessible for researchers outside the programme.
Sections 2 and 3 below provide information on the current state of the petroleum industry in Tanzania. We thus illustrate the present availability of data on the industry and its economic and social effects. We start (in section 2) by briefly sketching various aspects of the resource base and its exploitation. Section 3 looks at the economic contribution of the gas resource. We consider GDP, investment, external trade and balance of payments, employment and fiscal contribution.
Section 4 deals with statistical needs and challenges and section 5 sketches a proposed structure for the Petro Data Hub. We use experience from Norway to exemplify some of the challenges of supplying data for policymaking in Tanzania. Section 6 briefly summarizes. We stress the importance of cooperation between programme partners and other stakeholders.
1 The objectives of the programme are to enhance the empirical understanding of key prospects and challenges facing Tanzania as a new petro-state, and to provide contextualized, evidence based policy analysis in order to contribute to avoiding a resource curse situation. Funded by the Norwegian Embassy, Dar es Salaam the programme is implemented by the REPOA programme for Policy Research on Development, Dar es Salaam and the Chr. Michelsen Institute (CMI), Bergen, Norway in collaboration with the National Bureau of Statistics of Tanzania (NBS).
2 These are, in addition to “Data for policymaking and public engagement”: “Revenue and Expenditure Management in the Petrostate”, “Local content for the Petroleum industry in Tanzania” and “Governance in the petro state”.
6
2. THE PETROLEUM SECTOR IN TANZANIA Insection2and3weoutlinesalientfactsaboutthepetroleumsectorinTanzaniaanditseffectsontheeconomy.Thedescriptiveexercisehelpsuspinpointwheredataarepresentlyeasilyavailableorwheretheyaremissingordifficulttoaccess.Weshowthat,ingeneral,informationonallaspectsofthepetroleumsector inTanzania isnotreadilyavailable.Effortswillbeneededtobuildupagooddatabase.To assess the petroleum resource and its impact on the Tanzanian economy and societyweneedinformationbeyondstatisticsintheconventionalsense.Territorialboundariese.g.frametheareaswhere Tanzania can exploit its natural resources. Information on laws and institutions define thelegalandsocialframewithinwhichtheindustrywillhavetowork.Statistics in the conventional sense cover exploration and extraction, operation of pipelines andprocessing plants, including Liquefied Natural Gas (LNG). We enumerate and briefly describe (InAnnex1) companies,which are active in thepetroleum sector in Tanzania. Section3 sketches theeconomic contribution of petroleum as seen through the lens of national accounts. We includeinvestment, GDP by sector, external trade, employment and public finance. We make briefreferencestosocialandwelfaredata,politicalandgovernancedata,andenvironmentaldata.Finally,weincludeaforecastoffuturedevelopmentofrevenuesfromthepetroleumsector.
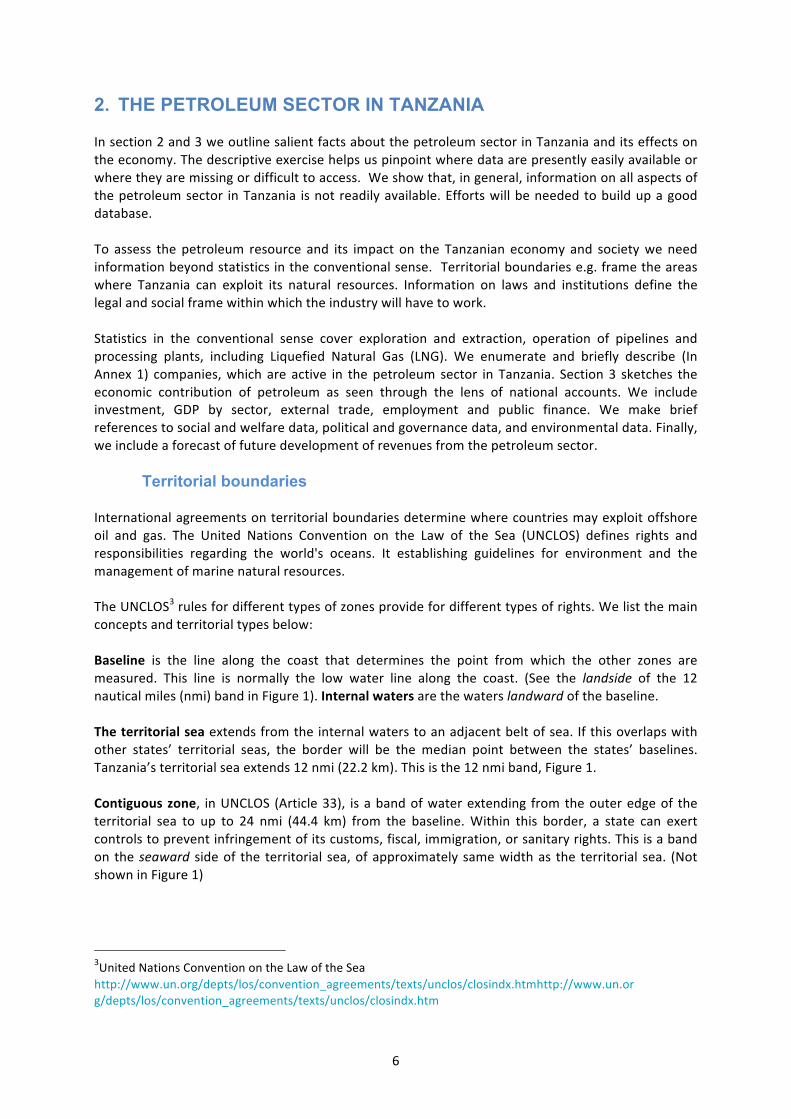
Territorial boundaries
Internationalagreementsonterritorialboundariesdeterminewherecountriesmayexploitoffshoreoil and gas. The United Nations Convention on the Law of the Sea (UNCLOS) defines rights andresponsibilities regarding the world's oceans. It establishing guidelines for environment and themanagementofmarinenaturalresources.TheUNCLOS3rulesfordifferenttypesofzonesprovidefordifferenttypesofrights.Welistthemainconceptsandterritorialtypesbelow:Baseline is the line along the coast that determines the point from which the other zones aremeasured. This line is normally the low water line along the coast. (See the landside of the 12nauticalmiles(nmi)bandinFigure1).Internalwatersarethewaterslandwardofthebaseline.Theterritorialseaextendsfromtheinternalwaterstoanadjacentbeltofsea.Ifthisoverlapswithother states’ territorial seas, the border will be the median point between the states’ baselines.Tanzania’sterritorialseaextends12nmi(22.2km).Thisisthe12nmiband,Figure1.Contiguouszone, inUNCLOS (Article33), isabandofwaterextending fromtheouteredgeof theterritorial sea to up to 24 nmi (44.4 km) from the baseline.Within this border, a state can exertcontrolstopreventinfringementofitscustoms,fiscal,immigration,orsanitaryrights.Thisisabandon theseaward sideof the territorial sea,ofapproximately samewidthas the territorial sea. (NotshowninFigure1)
3UnitedNationsConventionontheLawoftheSeahttp://www.un.org/depts/los/convention_agreements/texts/unclos/closindx.htmhttp://www.un.org/depts/los/convention_agreements/texts/unclos/closindx.htm
7
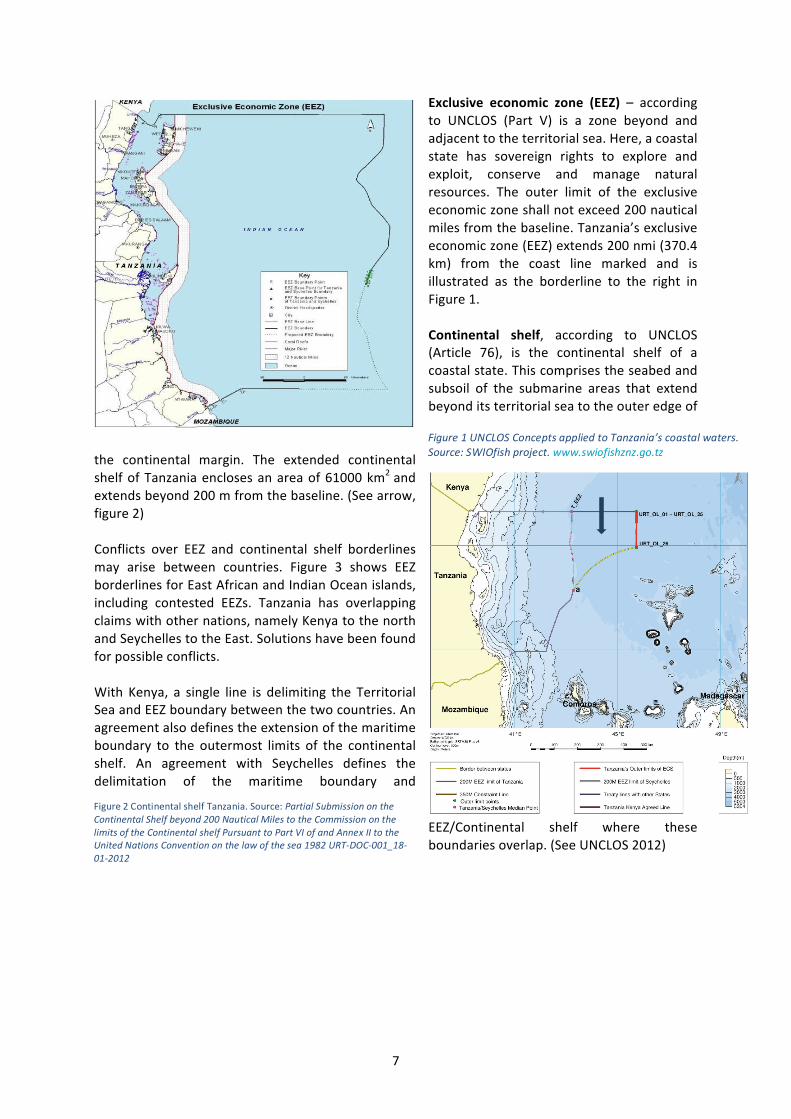
Exclusive economic zone (EEZ) – accordingto UNCLOS (Part V) is a zone beyond andadjacenttotheterritorialsea.Here,acoastalstate has sovereign rights to explore andexploit, conserve and manage naturalresources. The outer limit of the exclusiveeconomiczoneshallnotexceed200nauticalmilesfromthebaseline.Tanzania’sexclusiveeconomiczone(EEZ)extends200nmi(370.4km) from the coast line marked and isillustrated as the borderline to the right inFigure1.Continental shelf, according to UNCLOS(Article 76), is the continental shelf of acoastalstate.Thiscomprisestheseabedandsubsoil of the submarine areas that extendbeyonditsterritorialseatotheouteredgeof
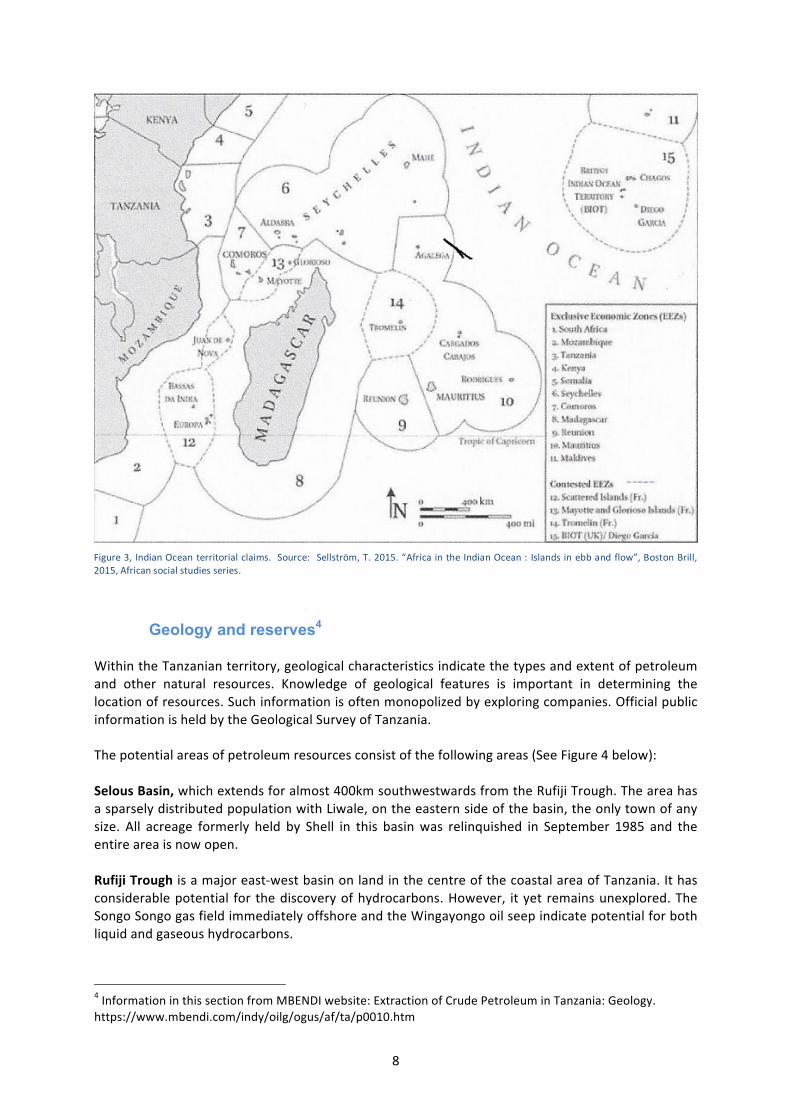
the continental margin. The extended continentalshelfofTanzaniaenclosesanareaof61000km2andextendsbeyond200mfromthebaseline.(Seearrow,figure2)Conflicts over EEZ and continental shelf borderlinesmay arise between countries. Figure 3 shows EEZborderlinesforEastAfricanandIndianOceanislands,including contested EEZs. Tanzania has overlappingclaimswithothernations,namelyKenyatothenorthandSeychellestotheEast.Solutionshavebeenfoundforpossibleconflicts.With Kenya, a single line is delimiting the TerritorialSeaandEEZboundarybetweenthetwocountries.Anagreementalsodefinestheextensionofthemaritimeboundary to the outermost limits of the continentalshelf. An agreement with Seychelles defines thedelimitation of the maritime boundary and
EEZ/Continental shelf where theseboundariesoverlap.(SeeUNCLOS2012)
Figure2ContinentalshelfTanzania.Source:PartialSubmissionontheContinentalShelfbeyond200NauticalMilestotheCommissiononthelimitsoftheContinentalshelfPursuanttoPartVIofandAnnexIItotheUnitedNationsConventiononthelawofthesea1982URT-DOC-001_18-01-2012
Figure1UNCLOSConceptsappliedtoTanzania’scoastalwaters.Source:SWIOfishproject.www.swiofishznz.go.tz
8
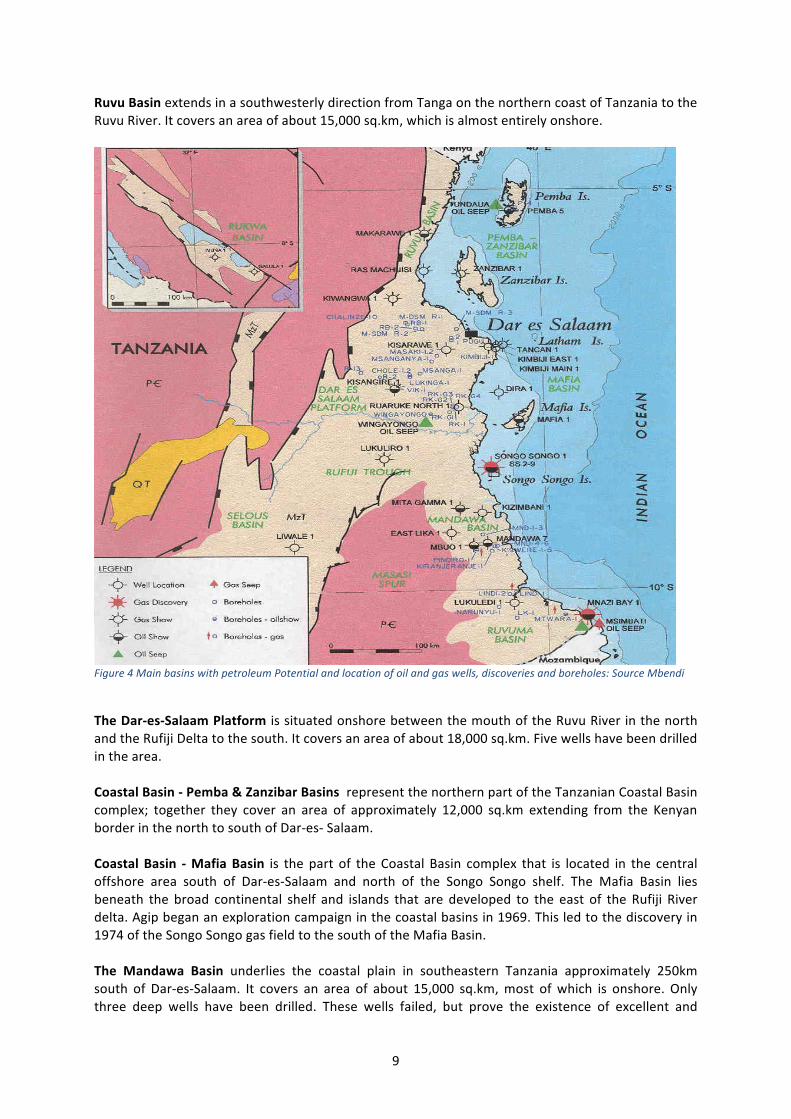
Geology and reserves4 WithintheTanzanianterritory,geologicalcharacteristicsindicatethetypesandextentofpetroleumand other natural resources. Knowledge of geological features is important in determining thelocationofresources.Suchinformationisoftenmonopolizedbyexploringcompanies.OfficialpublicinformationisheldbytheGeologicalSurveyofTanzania.Thepotentialareasofpetroleumresourcesconsistofthefollowingareas(SeeFigure4below):SelousBasin,whichextendsforalmost400kmsouthwestwardsfromtheRufijiTrough.TheareahasasparselydistributedpopulationwithLiwale,ontheeasternsideofthebasin,theonlytownofanysize. All acreage formerly held by Shell in this basinwas relinquished in September 1985 and theentireareaisnowopen.RufijiTroughisamajoreast-westbasinonlandinthecentreofthecoastalareaofTanzania.Ithasconsiderablepotential for thediscoveryofhydrocarbons.However, ityet remainsunexplored.TheSongoSongogasfieldimmediatelyoffshoreandtheWingayongooilseepindicatepotentialforbothliquidandgaseoushydrocarbons.
4InformationinthissectionfromMBENDIwebsite:ExtractionofCrudePetroleuminTanzania:Geology.https://www.mbendi.com/indy/oilg/ogus/af/ta/p0010.htm
Figure3, IndianOcean territorialclaims.Source: Sellström,T.2015.“AfricaintheIndianOcean:Islandsinebbandflow”,BostonBrill,2015,Africansocialstudiesseries.
9
RuvuBasinextendsinasouthwesterlydirectionfromTangaonthenortherncoastofTanzaniatotheRuvuRiver.Itcoversanareaofabout15,000sq.km,whichisalmostentirelyonshore.
Figure4MainbasinswithpetroleumPotentialandlocationofoilandgaswells,discoveriesandboreholes:SourceMbendi
TheDar-es-SalaamPlatform issituatedonshorebetweenthemouthoftheRuvuRiverinthenorthandtheRufijiDeltatothesouth.Itcoversanareaofabout18,000sq.km.Fivewellshavebeendrilledinthearea.CoastalBasin-Pemba&ZanzibarBasinsrepresentthenorthernpartoftheTanzanianCoastalBasincomplex; together they cover an area of approximately 12,000 sq.km extending from the KenyanborderinthenorthtosouthofDar-es-Salaam.Coastal Basin -MafiaBasin is the part of theCoastal Basin complex that is located in the centraloffshore area south of Dar-es-Salaam and north of the Songo Songo shelf. The Mafia Basin liesbeneath the broad continental shelf and islands that are developed to the east of the Rufiji Riverdelta.Agipbegananexplorationcampaigninthecoastalbasinsin1969.Thisledtothediscoveryin1974oftheSongoSongogasfieldtothesouthoftheMafiaBasin.The Mandawa Basin underlies the coastal plain in southeastern Tanzania approximately 250kmsouth of Dar-es-Salaam. It covers an area of about 15,000 sq.km,most ofwhich is onshore. Onlythree deep wells have been drilled. These wells failed, but prove the existence of excellent and
10
matureoil-pronesourcerocks.Shellrelinquishedtheacreagein1991andthewholeareaisavailableforlicensing.RuvumaBasinissituatedinthesoutheasterncoastalzoneofTanzaniaadjacenttotheMozambiqueborder. The basin covers some 16,000 sq.km. Several onshore seismic campaignswere conductedduringthe1980sandin1990;Texacodrilledthefirstonshorewellinthebasin.Thiswellwaslocatedoverashallowbasementand wasdry. ModernRiftBasinsincludestheLakeTanganyika,LakeRukwa,LakeNyasaandRuhuhuBasins.ThesearelocatedalongthewesternarmofthesystembetweentheTanzania/Burundiborderinthewestand the borders with Malawi and Mozambique in the south. Geological and geophysicalinvestigationshavebeenconductedintheriftvalleys.Itwashowevernotuntilresultsofseismicdatawerecollectedthattheoilindustrytookaseriousinterestinthearea.
Legal framework, policies and public institutions Legalframeworksandpoliciesareinstrumentsformanagementofthepetroleumindustry.Theysettherulesofthegamefortheplayersintheindustryandprovidedirectionsfortheuseofrevenuesfromtheindustry.FutureresearchandpolicyworkmustexaminenotonlytheimplementationandeffectsofTanzania’spetroleumlegislation.Itmustalsotakeintoaccounthowthelargerinstitutionalframeworkinteractswithpetroleuminstitutionsandinfluencespetroleumgovernanceinthecountry(LeeandDupuy,2016).Furthermore,legalframeworksshouldcompriseregulationsfortransparencyofthesector.InTanzania,thePetroleumUpstreamRegulatoryAuthority(PURA)hastheoptiontomakecontractsandlicensesavailabletothepublic.ThisincludesalsoinformationfromthePetroleumRegistryandtheNationalPetroleumandGasInformationSystem.TanzaniaExtractiveIndustries(TransparencyandAccountability)Committee(TEIAC)isresponsibleforimplementingtheglobalExtractiveIndustriesTransparencyInitiative(EITI)standardsonrevenuetransparency.TheTanzaniaExtractiveIndustriesTransparencyandAccountability(TEITA)Actmakesrevenuedisclosuresmandatory.Anumberofdocumentsspelloutrulesandpoliciesrelatedtothepetroleumsectorandareavailableongovernmentwebsites,themostimportantbeing:- PetroleumExplorationandProductionAct,1980(repealedby2015PetroleumAct)- PetroleumAct2008(repealedby2015PetroleumAct)- NaturalGasPolicy,2012(repealedbyTanzaniaNaturalGasPolicyof2013)
http://www.tanzania.go.tz/egov_uploads/documents/Natural_Gas_Policy_-_Approved_sw.pdf- NationalPetroleumPolicy,2014. http://www.tpdc-tz.com/wp-content/uploads/2015/04/National-Petroleum-Policy.pdf- LocalContentPolicy,2014
https://mem.go.tz/wp-content/uploads/2014/05/07.05.2014local-content-policy-of-tanzania-for-oil-gas-industry.pdf
- PetroleumAct,2015(replacingpreviousacts)providesforcomprehensiveregulatoryframeworkhttps://mem.go.tz/wp-content/uploads/2014/02/17.06.15A-BILL-PETROLEUM-ACT-2015-Updated-version-15.6.15.pdf
- OilandGasRevenuesManagementAct,2015http://parliament.go.tz/polis/uploads/bills/acts/1452057603-ActNo-22-2015-Book-21-25.pdf
- ExtractiveIndustriesTransparencyandAccountabilityAct,2015http://faolex.fao.org/docs/pdf/tan153762.pdf
11
Keypublicinstitutions,mostofwhichhavetheirlegalbasisfromtheaboveactsare:• ThePetroleumUpstreamRegulatoryAuthority(PURA)advisestheMinisteronagreements
andlicensesaswellasondevelopmentplansandprocesses.Itmanageslicenseapplicationsandmonitorslicenseholders.Italsopromoteslocalcontent,maintainspetroleumdata,andperformsoverallmonitoringandauditingofupstreamoperationsandactivities.
• TheCommissionerforPetroleumAffairsisresponsibleforadvisingtheMinisteronbothdailyadministrativeandregulatoryissueswithinthesector
• TheOilandGasAdvisoryBureauisplacedintheOfficeofthePresidentandisresponsibleforadvisingtheCabinetonstrategicmattersrelatingtotheoilandgaseconomy.
• TanzaniaPetroleumDevelopmentCorporation(TPDC)isthecountry’snationaloilcompany.Governmenthasa51%ownershipstake.TPDCisthevehicleforGovernment’scommercialparticipationinpetroleumprojects,eitherdirectlyorthroughsubsidiarycompanies.AnumberofitsothertasksareoutlinedinArt5ofthelaw.
• ThePetroleumRegistrywillbeestablishedandmaintainedbyPURA,andcontainsdataonpetroleumagreements,licenses,permitauthorizations.
• TheEnergyandWaterUtilitiesWaterRegulatoryAuthority(EWURA)regulatesthemid-anddownstreampetroleumandnaturalgassectors.Itgrantsoperationalandconstructionlicensesandmonitorspetroleumquality,standardsandsafety.Italsochargesandcollectsrevenuesandpromotesaccessandaffordabilityofpetroleumproductsandservices.EWURAmanagestheNationalPetroleumandGasInformationSystem.
• TheOilandGasRevenuesFundcontainsrevenuesaccruingtoGovernmentthroughroyalties,profitshares,participationinoperations,corporateincometax,andreturnsonFundinvestment.TheFundwillguaranteetransparencyandaccountabilityinthecollection,allocation,expenditureandmanagementofoilandgasrevenues.Itwillalsoensurethatfundsareusedforsustainabledevelopmentpurposesandbenefitpresentandfuturegenerations.ThelawdescribestherelationsandfunctionsbetweentheFundandotherTanzanianinstitutionssuchastheBankofTanzania,TanzaniaRevenueAuthorityandTPDC.
• TheDecommissioningFundisdesignedtocovercostsrelatedtoimplementingadecommissioningplanforpetroleumoperations.
• ExtractiveIndustriesTransparencyInitiative(EITI)isinstitutionalisedinTanzaniathroughExtractiveIndustriesTransparencyandAccountabilityAct(EITAA).
• TanzaniaExtractiveIndustries(TransparencyandAccountability)Committee(TEIAC),isanindependententitycomposedof15personsfromcivilsociety,extractiveindustrycompaniesandGovernment.ItensurestheimplementationofEITIrulesforTanzania.
Exploration, development and extraction Exploration activities entail investment andproduction that may contribute to GDP.Developmentcomprisespreparationofawellforthestart of extraction. It may require considerableinvestment. The activity of extraction - the“pumping”ofoilandgas-contributestoinvestment,production,employmentandgovernmentrevenueinthe local and national economy. Data on all these
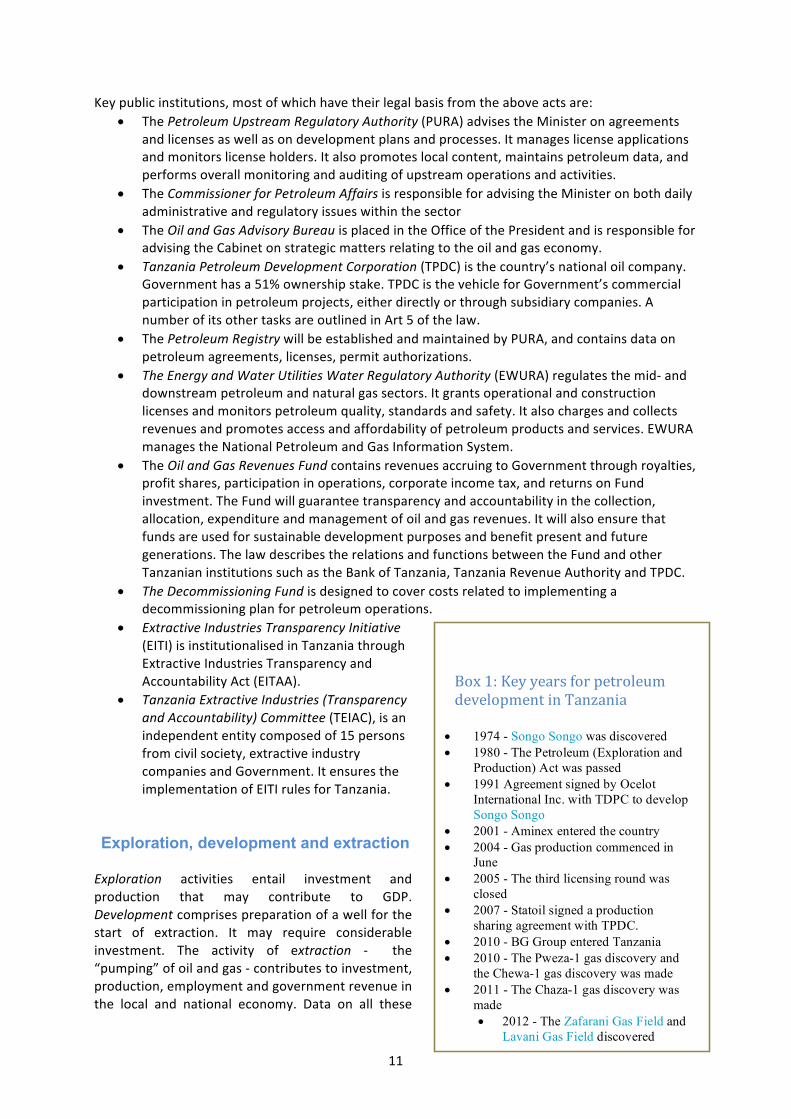
Box1:KeyyearsforpetroleumdevelopmentinTanzania
• 1974 - Songo Songo was discovered • 1980 - The Petroleum (Exploration and
Production) Act was passed • 1991 Agreement signed by Ocelot
International Inc. with TDPC to develop Songo Songo
• 2001 - Aminex entered the country • 2004 - Gas production commenced in
June • 2005 - The third licensing round was
closed • 2007 - Statoil signed a production
sharing agreement with TPDC. • 2010 - BG Group entered Tanzania • 2010 - The Pweza-1 gas discovery and
the Chewa-1 gas discovery was made • 2011 - The Chaza-1 gas discovery was
made • 2012 - The Zafarani Gas Field and
Lavani Gas Field discovered

12
activitiesareatpresentcollectedbyTanzaniaPetroleumDevelopmentCorporation(TPDC)andtheNational Bureau of Statistics for use in the national statistical system, for example in terms ofNationalAccounts.ExplorationofoilandgasinTanzaniahastakenplacesince1952.Thethefirstnaturalgasdiscoverywasmadein1974inSongoSongo,KilwadistrictinLindiRegion.Untiltheconcessionarysystemwasabolished in 1964, British Petroleum (BP) and Shell were awarded concessions along the coastincludingMafia, Pemba and Zanzibar. During this period there was no discovery of commerciallyviablehydrocarbons.AftertheestablishmentofTPDCin1969,TPDCandAGIP(AziendaGeneraleItalianaPetroli–GeneralItalianOilCompany)signedthefirstProductionSharingAgreement(PSA).From1978,TPDCventuredinto exploration, conductingonshore andoffshore seismic programmes. Theonshoreprogrammescovered Ruvu, Kimbiji/Bingwa, Pemba, and Mafia and Ruvuma area while the offshore includedSongoSongo,PembaandZanzibar.ThePetroleum(ExplorationandProduction)Actbecamelawin1980.Soonafter,gaswasdiscoveredinMnaziBay.Mostofthedrillingoccurredintheeighties,followingtheenactmentofthePetroleumActandspurredonbyhighoilpricesintheearly1980s.Thefirstyearsofthe1990swerecharacterisedbysparseexploratoryactivities.TPDCandTANESCO(TanzaniaElectricSupplyCompany),incollaborationwiththeCanadiancompaniesOcelotandTrans-Canada Pipelines,were actively engaged in the Songo Songo gas field (development, transmissionand utilization). Exploration licenses for the coastal basins were issued in 1995 to internationalcompaniesincludingTanganyikaOilCompany,ExxonMobil,Shell,KUFPEC(KuwaitForeignPetroleumExploration Company), and Amoco. Exploration agreements were signed between TPDC, theCanadiancompaniesAntrimResources (nowAtrimEnergyLimited),CanopWorld-wide,andNdovuResourcesofAustralia.The first decade of the 21st century was characterised by the licensing of several internationalcompanies.These includePetrobras (Block -5,2001),OphirEnergy (Block -1,2005),OphirEnergy(Blocks-3,4,2006),Statoil(Block-2,2007),Dominion(Block-7,2006),Petrobras(Block-8,2006).Significantdiscoveriesof gasweremade inblocks1, 2, 3 and4. InMarch2012, Statoil andExxonMobilmadethebiggestoffshoregasreservediscovery(Zafaranifield)offthecoastofIndianOcean.
Pipelines Pipelinesplaya largerole inthepetroleumindustry.Theytransportcrudepetroleumandgasfromthesourcesatseatoon-landprocessingplants.Theyalsotransportvariousproductsfromprocessingplants toconsumerareas.Theyareofkey importancefordistributionnetworks inconsumerareaslikeDar-es-Salaam.Constructionandoperationofpipelinescontributetonationaleconomicactivity.Insomecountries(e.g.Norway),theyare importantprovidersof informationfortaxauthorities. InTanzania,pipeline-datafromindividualcompaniesarecollectedbyTPDCandNBS.SongasLtdhasdevelopedtheSongoSongogas field inKilwaDistrict,LindiRegion,byconstructinggas-processing facilitiesonSongoSongo Islandandapipelinetotransport thenaturalgas.ThegasgoesfromSongoSongotoSomangaFunga,andthrougha207kmpipelinefromSomangaFungatoUbungo,DaresSalaam.TheexistingpipelinebetweenSomangaFungaandDaresSalaam isbeingexpanded.TheMtwara-Darpipelinewascommissioned inOctober2015. Itentailsan investmentofUSD1.5billionundertakenby theChinaNationalPetroleumCorporation financedbyaUSD1.2billion loan
13
fromChina’sEximBankandUSD275millionfromTPDC.Thepipelinehasan initialcapacityof350millionsofcubic feetperday (MMCFD),with thenumbersdoubling,atoptimalproduction, to750MMCFD of gas. The project involves the construction of a 24 - 36 inch diameter pipeline fromMadimbaVillageinMtwarathroughSomangatoDaresSalaam.Morepipelinesareunderconsideration:A530kmlongnaturalgaspipelinefromDaresSalaamtoTangainTanzaniaandMombasainKenyawasplannedasacooperativeprojectbetweenKenyanandTanzaniangovernments.TheproposedgaspipelinewouldincludegassupplyterminalsinTangaandMombasa.AttentionhaslatelyshiftedtoUgandathathasshowninterestinbuildingapipelinefromHoimatoconnectwithTanga5.The1443-kilometerpipelineatanestimatedcostofUSD3.55billionwouldtransportcrudeoilfromtheAlbertinebasininUgandatoTanga.
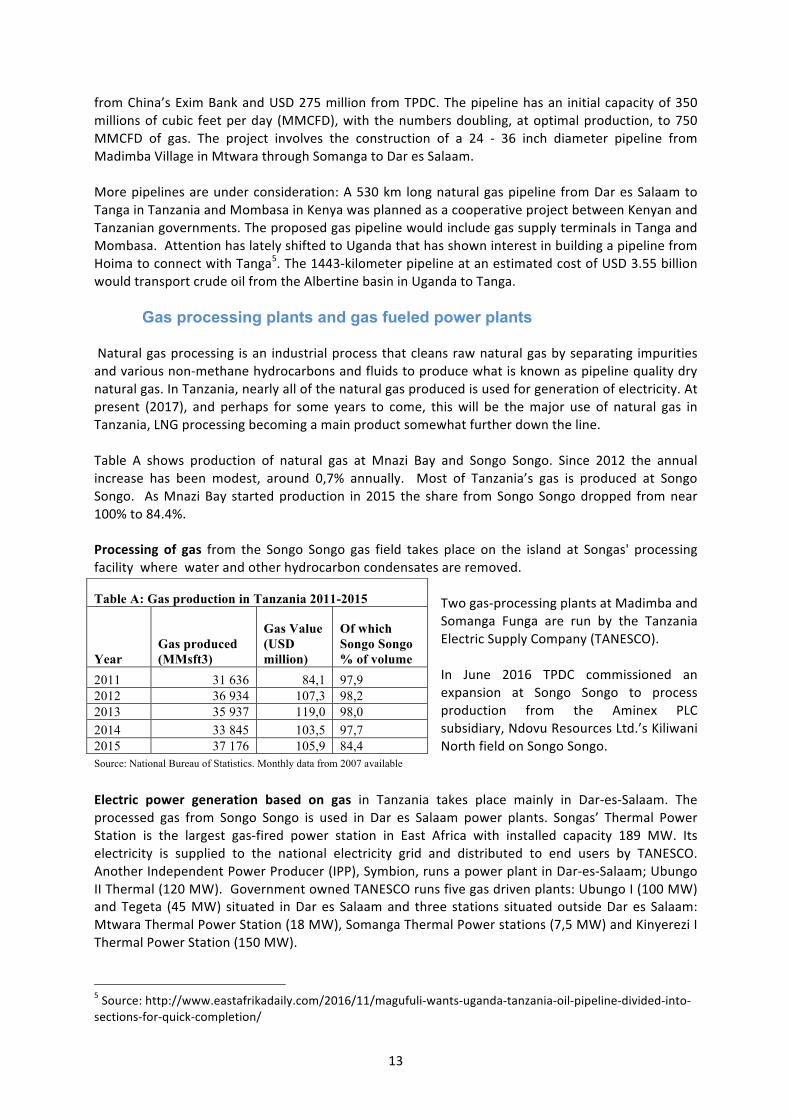
Gas processing plants and gas fueled power plants Naturalgasprocessing isan industrialprocessthatcleansrawnaturalgasbyseparating impuritiesandvariousnon-methanehydrocarbonsandfluidstoproducewhatisknownaspipelinequalitydrynaturalgas.InTanzania,nearlyallofthenaturalgasproducedisusedforgenerationofelectricity.Atpresent (2017), and perhaps for some years to come, thiswill be themajor use of natural gas inTanzania,LNGprocessingbecomingamainproductsomewhatfurtherdowntheline.Table A shows production of natural gas at Mnazi Bay and Songo Songo. Since 2012 the annualincrease has been modest, around 0,7% annually. Most of Tanzania’s gas is produced at SongoSongo. AsMnaziBay startedproduction in2015 the share fromSongoSongodropped fromnear100%to84.4%.Processing of gas from the Songo Songo gas field takes place on the island at Songas' processingfacilitywherewaterandotherhydrocarboncondensatesareremoved.
Twogas-processingplantsatMadimbaandSomanga Funga are run by the TanzaniaElectricSupplyCompany(TANESCO).In June 2016 TPDC commissioned anexpansion at Songo Songo to processproduction from the Aminex PLCsubsidiary,NdovuResourcesLtd.’sKiliwaniNorthfieldonSongoSongo.
Electric power generation based on gas in Tanzania takes place mainly in Dar-es-Salaam. Theprocessed gas from Songo Songo is used in Dar es Salaam power plants. Songas’ Thermal PowerStation is the largest gas-fired power station in East Africa with installed capacity 189 MW. Itselectricity is supplied to the national electricity grid and distributed to end users by TANESCO.AnotherIndependentPowerProducer(IPP),Symbion,runsapowerplantinDar-es-Salaam;UbungoIIThermal(120MW).GovernmentownedTANESCOrunsfivegasdrivenplants:UbungoI(100MW)andTegeta (45MW) situated inDares Salaamand three stations situatedoutsideDares Salaam:MtwaraThermalPowerStation(18MW),SomangaThermalPowerstations(7,5MW)andKinyereziIThermalPowerStation(150MW).
5Source:http://www.eastafrikadaily.com/2016/11/magufuli-wants-uganda-tanzania-oil-pipeline-divided-into-sections-for-quick-completion/
Table A: Gas production in Tanzania 2011-2015
Year Gas produced (MMsft3)
Gas Value (USD million)
Of which Songo Songo % of volume
2011 31 636 84,1 97,9 2012 36 934 107,3 98,2 2013 35 937 119,0 98,0 2014 33 845 103,5 97,7 2015 37 176 105,9 84,4 Source: National Bureau of Statistics. Monthly data from 2007 available
14
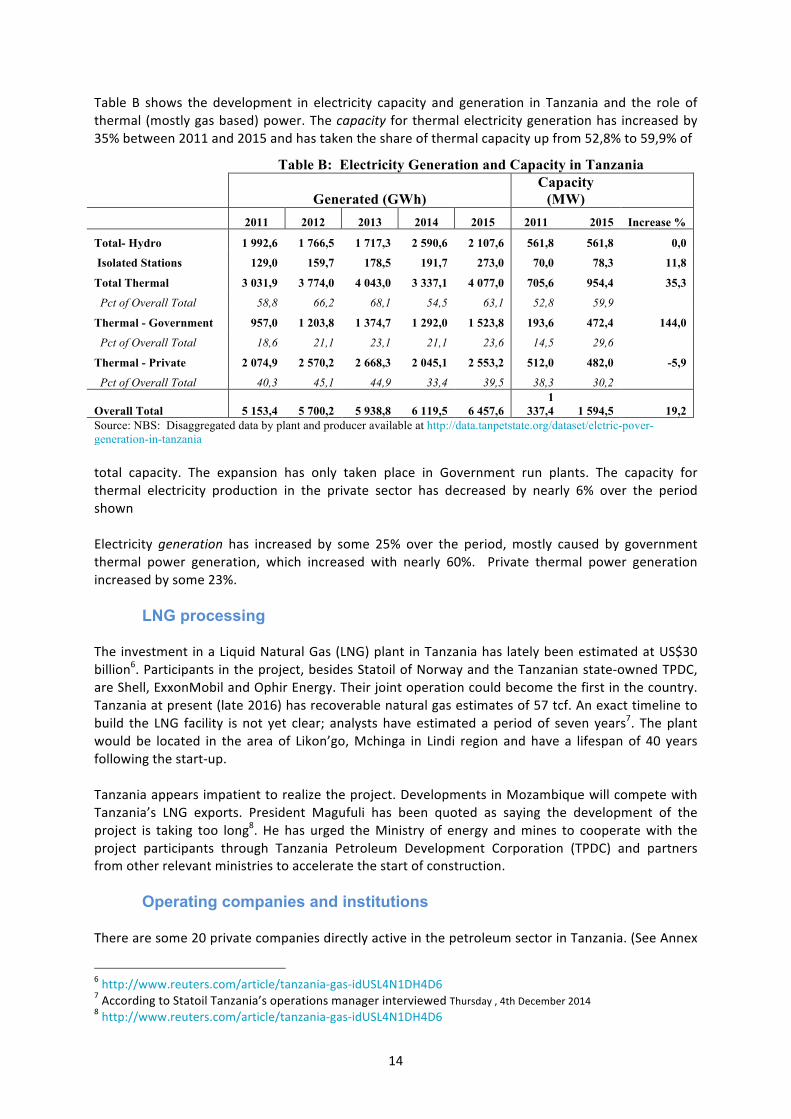
Table B shows the development in electricity capacity and generation in Tanzania and the role ofthermal(mostlygasbased)power.Thecapacity forthermalelectricitygenerationhas increasedby35%between2011and2015andhastakentheshareofthermalcapacityupfrom52,8%to59,9%of
total capacity. The expansion has only taken place in Government run plants. The capacity forthermal electricity production in the private sector has decreased by nearly 6% over the periodshownElectricity generation has increased by some 25% over the period,mostly caused by governmentthermal power generation, which increased with nearly 60%. Private thermal power generationincreasedbysome23%.
LNG processing The investment inaLiquidNaturalGas(LNG)plant inTanzaniahas latelybeenestimatedatUS$30billion6.Participantsintheproject,besidesStatoilofNorwayandtheTanzanianstate-ownedTPDC,areShell,ExxonMobilandOphirEnergy.Theirjointoperationcouldbecomethefirstinthecountry.Tanzaniaatpresent(late2016)hasrecoverablenaturalgasestimatesof57tcf.Anexacttimelinetobuild the LNG facility is not yet clear; analysts have estimated a periodof seven years7. Theplantwould be located in the area of Likon’go,Mchinga in Lindi region andhave a lifespanof 40 yearsfollowingthestart-up.Tanzaniaappearsimpatienttorealizetheproject.DevelopmentsinMozambiquewillcompetewithTanzania’s LNG exports. President Magufuli has been quoted as saying the development of theproject is taking too long8. He has urged theMinistry of energy andmines to cooperatewith theproject participants through Tanzania Petroleum Development Corporation (TPDC) and partnersfromotherrelevantministriestoacceleratethestartofconstruction.
Operating companies and institutions Therearesome20privatecompaniesdirectlyactiveinthepetroleumsectorinTanzania.(SeeAnnex
6http://www.reuters.com/article/tanzania-gas-idUSL4N1DH4D67AccordingtoStatoilTanzania’soperationsmanagerinterviewedThursday,4thDecember20148http://www.reuters.com/article/tanzania-gas-idUSL4N1DH4D6
Table B: Electricity Generation and Capacity in Tanzania
Generated (GWh)
Capacity (MW)
2011 2012 2013 2014 2015 2011 2015 Increase %
Total- Hydro 1 992,6 1 766,5 1 717,3 2 590,6 2 107,6 561,8 561,8 0,0
Isolated Stations 129,0 159,7 178,5 191,7 273,0 70,0 78,3 11,8
Total Thermal 3 031,9 3 774,0 4 043,0 3 337,1 4 077,0 705,6 954,4 35,3
Pct of Overall Total 58,8 66,2 68,1 54,5 63,1 52,8 59,9
Thermal - Government 957,0 1 203,8 1 374,7 1 292,0 1 523,8 193,6 472,4 144,0
Pct of Overall Total 18,6 21,1 23,1 21,1 23,6 14,5 29,6
Thermal - Private 2 074,9 2 570,2 2 668,3 2 045,1 2 553,2 512,0 482,0 -5,9
Pct of Overall Total 40,3 45,1 44,9 33,4 39,5 38,3 30,2
Overall Total 5 153,4 5 700,2 5 938,8 6 119,5 6 457,6 1
337,4 1 594,5 19,2 Source: NBS: Disaggregated data by plant and producer available at http://data.tanpetstate.org/dataset/elctric-pover-generation-in-tanzania

15
1) An additional number of companies supply goods and services to the sector. However, littleinformationexistsonsuchactivities.StateownedinstitutionsmostactiveinthepetroleumsectorareTanzaniaElectricSupplyCompanyLimited (TANESCO), Tanzania Petroleum Development Corporation (TPDC), Tanzanian Ministry ofEnergyandMinerals, theEnergyandWaterUtilitiesAuthority (EWURA)andtheTanzaniaMineralsAudit Agency(TMAA). Figure 5 below shows licenses for the Petroleum sector as at June 2016.
Figure5ExplorationActivityJune2016Tanzania.Source:TPDC
16
3. NATIONAL ECONOMIC CONTRIBUTION OF THE GAS RESOURCE
The physical and institutional structures described above contribute to production, wealth andwelfareforthepeopleofTanzania.Below,welookatthiscontributionthroughthelensofeconomicstatistics. National accounts include investment, GDP, external trade and state revenue. Alsoincludedinthissectionisabrieflooktothefuture.Forthedescriptioninthepresentsection,weuseofficial economic statistics. These build on the Tanzania economic surveys reports, the IntegratedLabourForceSurveyandHouseholdBudgetSurveys.Incaseswhentheroleofthepetroleumsectorcouldnotbemeasuredbymeansofregularstatisticalsources,weusedestimates,inparticularfromtheMACMODprojectionwork(seebelow).Ingeneral,therelativelyhighactivitylevelsintheTanzanianpetroleumsectorsincetheearlyyearsof the 2000s seem to have abated.One important reason for this is the drop in the internationalmarkets forpetroleumaround2008,which causedadownward slide. Thedevelopment shale gas,hydraulic fracking and horizontal drilling in the US as well as the slower growth of the Chineseeconomy have been important factors in subsequent development. In Tanzania, some companieshavetakenawait-and-seeattitude,alsoexacerbatedbydelaysinimportantpiecesoflegislation,taxregulationsandotherdecisionsonfurtherinfrastructuredevelopment.AfteranadirinMarch2016,prices have strengthened somewhat.9 As gas prices move up from the nadir there are majoruncertainties at play. However, the already sunk capital would indicate that in themedium term(barringcatastrophicpricecollapses)investmentactivitieswillpickup.So far,we have a rather poor statistical basis for gauging the economic importance of petroleumsectordevelopmentand its repercussions in termsof investment.Basedon thewealthaccountingworkbytheWorldBank(2011),rentsfromresources inTanzaniaareestimatedtobemorethan8percentofGDP.Themineral rentshavegrownquiterapidly inthepasttenyears.Asthisdoesnotinclude the newly discovered offshore gas reserves, one may expect that the size of the totalresourcerentsinTanzaniawillgrowquicklyinthefuture.
Investment According to EWURA’s 2014/15 annual report, there has been some progress in the level ofinvestment in gas infrastructure development. TheMtwara to Dar es Salaam pipelines has beencommissioned. The contractor has finalized the installationworks of two gas-processing plants atMadimba in Mtwara and Songo Songo Island in Lindi. The combined capacity of two processingplantsis350MMscfd.Inaddition,TPDChadcommissionedthelow-pressuregasdistributionpipelinefromUbungotoMikochenilightindustrialarea.
GDP – and GDP by sector Basedon the national accounts data fromNBS, the gas andmining sectors altogether constitutedabout 2.2 percent of GDP in 2011. According to the Second Extractive Industries TransparencyInitiative(EITI)PaymentReconciliationReportforFY2010/11(TEITI2013),totalgovernmentrevenuefromgasandminingcompanieswasequivalentto1.5percentofGDP.Whilethisisasignificantsize,ifwecompare itwith the sectors’ share inGDP it isonlyonequarterof theestimated rents fromthosesectors.
9U.S.NationalAverageNaturalGasPrice.EndofdayCommodityFuturesPriceQuotesforNaturalGas(NYMEX).see:http://www.nasdaq.com/markets/natural-gas.aspx#ixzz4LdFj9FAJ
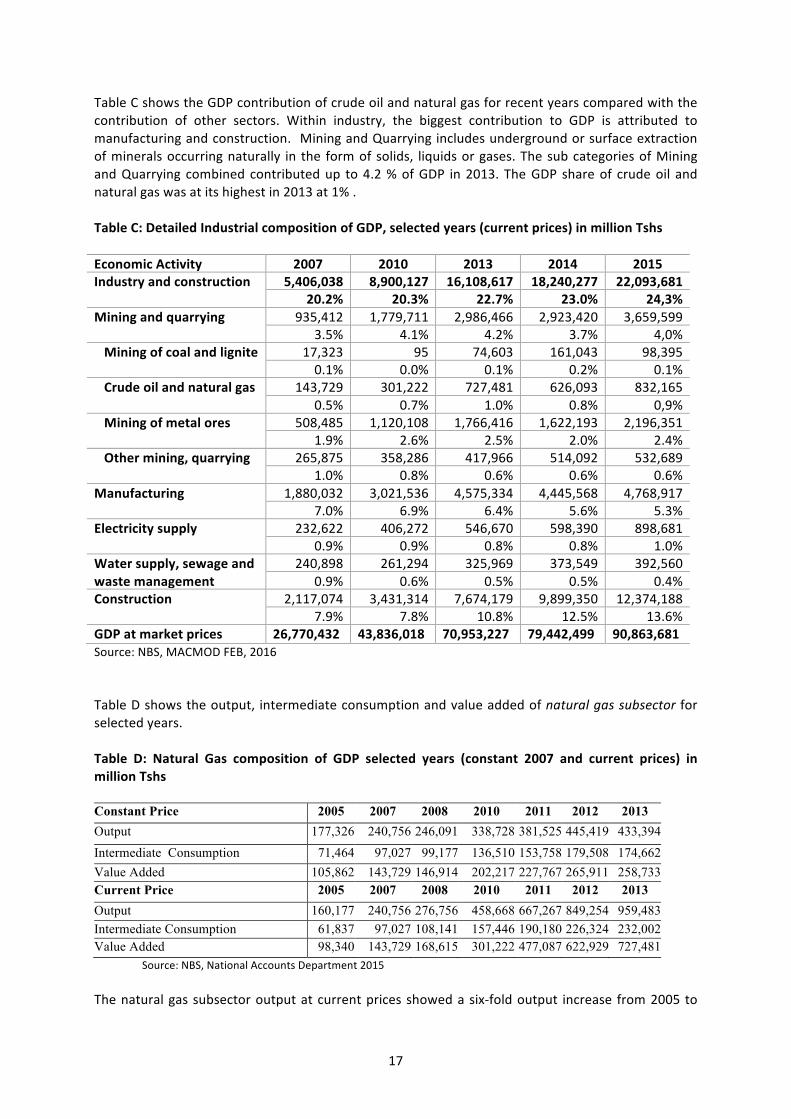
17
TableCshowstheGDPcontributionofcrudeoilandnaturalgasforrecentyearscomparedwiththecontribution of other sectors. Within industry, the biggest contribution to GDP is attributed tomanufacturingandconstruction. MiningandQuarryingincludesundergroundorsurfaceextractionofmineralsoccurringnaturally in the formofsolids, liquidsorgases.ThesubcategoriesofMiningandQuarrying combined contributedup to4.2%ofGDP in2013. TheGDP shareof crudeoil andnaturalgaswasatitshighestin2013at1%.TableC:DetailedIndustrialcompositionofGDP,selectedyears(currentprices)inmillionTshsEconomicActivity 2007 2010 2013 2014 2015Industryandconstruction 5,406,038 8,900,127 16,108,617 18,240,277 22,093,681
20.2% 20.3% 22.7% 23.0% 24,3%Miningandquarrying 935,412 1,779,711 2,986,466 2,923,420 3,659,599
3.5% 4.1% 4.2% 3.7% 4,0%Miningofcoalandlignite 17,323 95 74,603 161,043 98,395
0.1% 0.0% 0.1% 0.2% 0.1%Crudeoilandnaturalgas 143,729 301,222 727,481 626,093 832,165
0.5% 0.7% 1.0% 0.8% 0,9%Miningofmetalores 508,485 1,120,108 1,766,416 1,622,193 2,196,351
1.9% 2.6% 2.5% 2.0% 2.4%Othermining,quarrying 265,875 358,286 417,966 514,092 532,689
1.0% 0.8% 0.6% 0.6% 0.6%Manufacturing 1,880,032 3,021,536 4,575,334 4,445,568 4,768,917
7.0% 6.9% 6.4% 5.6% 5.3%Electricitysupply 232,622 406,272 546,670 598,390 898,681
0.9% 0.9% 0.8% 0.8% 1.0%Watersupply,sewageandwastemanagement
240,898 261,294 325,969 373,549 392,5600.9% 0.6% 0.5% 0.5% 0.4%
Construction 2,117,074 3,431,314 7,674,179 9,899,350 12,374,1887.9% 7.8% 10.8% 12.5% 13.6%
GDPatmarketprices 26,770,432 70,953,227 79,442,499 88,757,797
43,836,018 70,953,227 79,442,499 90,863,681Source:NBS,MACMODFEB,2016TableDshowstheoutput, intermediateconsumptionandvalueaddedofnaturalgassubsector forselectedyears.Table D: Natural Gas composition of GDP selected years (constant 2007 and current prices) inmillionTshsConstant Price 2005 2007 2008 2010 2011 2012 2013 Output 177,326 240,756 246,091 338,728 381,525 445,419 433,394 Intermediate Consumption 71,464 97,027 99,177 136,510 153,758 179,508 174,662 Value Added 105,862 143,729 146,914 202,217 227,767 265,911 258,733 Current Price 2005 2007 2008 2010 2011 2012 2013 Output 160,177 240,756 276,756 458,668 667,267 849,254 959,483 Intermediate Consumption 61,837 97,027 108,141 157,446 190,180 226,324 232,002 Value Added 98,340 143,729 168,615 301,222 477,087 622,929 727,481 Source:NBS,NationalAccountsDepartment2015Thenaturalgassubsectoroutputatcurrentpricesshowedasix-foldoutput increase from2005to
18
2013. Intermediate consumption increased less than fourfoldduring the sameperiod, leading toamorethansevenfoldincreaseinvalueadded.
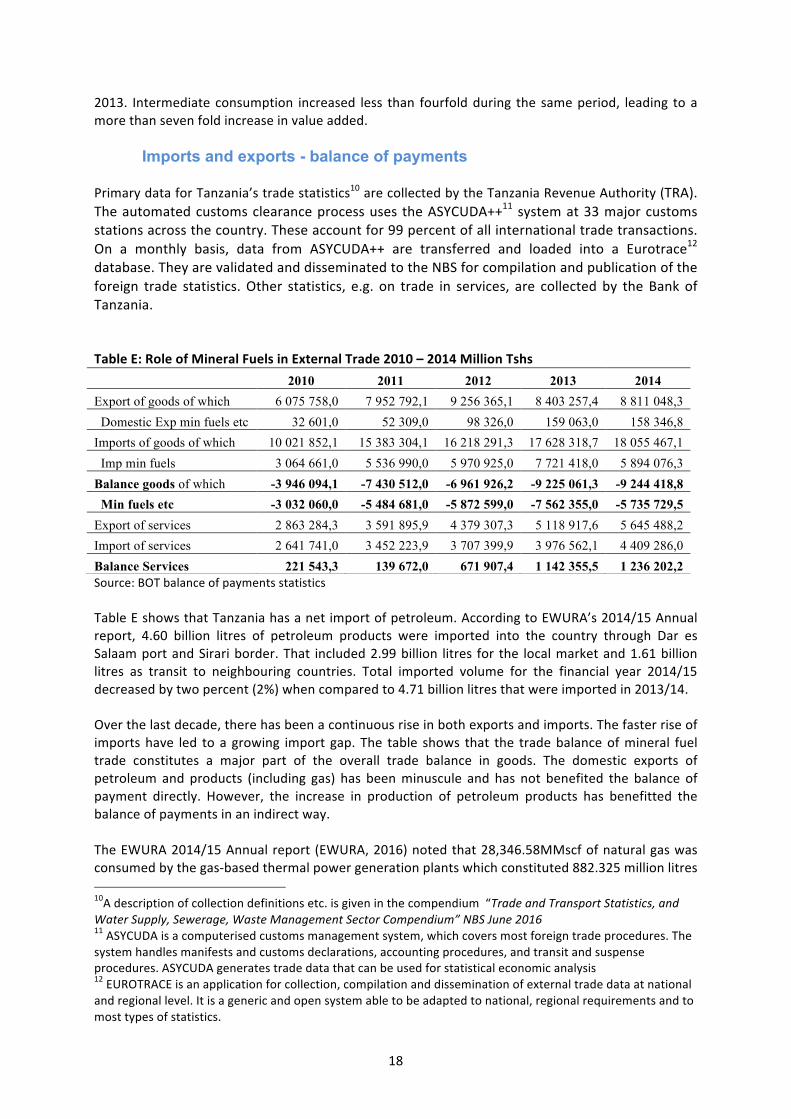
Imports and exports - balance of payments PrimarydataforTanzania’stradestatistics10arecollectedbytheTanzaniaRevenueAuthority(TRA).Theautomatedcustomsclearanceprocessuses theASYCUDA++11systemat33majorcustomsstationsacrossthecountry.Theseaccountfor99percentofallinternationaltradetransactions.On a monthly basis, data from ASYCUDA++ are transferred and loaded into a Eurotrace12database.TheyarevalidatedanddisseminatedtotheNBSforcompilationandpublicationoftheforeign trade statistics.Other statistics, e.g. on trade in services, are collected by theBank ofTanzania.TableE:RoleofMineralFuelsinExternalTrade2010–2014MillionTshs
Source:BOTbalanceofpaymentsstatisticsTableEshowsthatTanzaniahasanetimportofpetroleum.AccordingtoEWURA’s2014/15Annualreport, 4.60 billion litres of petroleum products were imported into the country through Dar esSalaamportandSirariborder.That included2.99billion litres for the localmarketand1.61billionlitres as transit to neighbouring countries. Total imported volume for the financial year 2014/15decreasedbytwopercent(2%)whencomparedto4.71billionlitresthatwereimportedin2013/14.Overthelastdecade,therehasbeenacontinuousriseinbothexportsandimports.Thefasterriseofimportshave led toa growing import gap. The table shows that the tradebalanceofmineral fueltrade constitutes a major part of the overall trade balance in goods. The domestic exports ofpetroleum and products (including gas) has beenminuscule and has not benefited the balance ofpayment directly. However, the increase in production of petroleum products has benefitted thebalanceofpaymentsinanindirectway.TheEWURA2014/15Annualreport (EWURA,2016)notedthat28,346.58MMscfofnaturalgaswasconsumedbythegas-basedthermalpowergenerationplantswhichconstituted882.325millionlitres10Adescriptionofcollectiondefinitionsetc.isgiveninthecompendium“TradeandTransportStatistics,andWaterSupply,Sewerage,WasteManagementSectorCompendium”NBSJune201611ASYCUDAisacomputerisedcustomsmanagementsystem,whichcoversmostforeigntradeprocedures.Thesystemhandlesmanifestsandcustomsdeclarations,accountingprocedures,andtransitandsuspenseprocedures.ASYCUDAgeneratestradedatathatcanbeusedforstatisticaleconomicanalysis12EUROTRACEisanapplicationforcollection,compilationanddisseminationofexternaltradedataatnationalandregionallevel.Itisagenericandopensystemabletobeadaptedtonational,regionalrequirementsandtomosttypesofstatistics.
2010 2011 2012 2013 2014
Export of goods of which 6 075 758,0 7 952 792,1 9 256 365,1 8 403 257,4 8 811 048,3 Domestic Exp min fuels etc 32 601,0 52 309,0 98 326,0 159 063,0 158 346,8 Imports of goods of which 10 021 852,1 15 383 304,1 16 218 291,3 17 628 318,7 18 055 467,1 Imp min fuels 3 064 661,0 5 536 990,0 5 970 925,0 7 721 418,0 5 894 076,3 Balance goods of which -3 946 094,1 -7 430 512,0 -6 961 926,2 -9 225 061,3 -9 244 418,8 Min fuels etc -3 032 060,0 -5 484 681,0 -5 872 599,0 -7 562 355,0 -5 735 729,5 Export of services 2 863 284,3 3 591 895,9 4 379 307,3 5 118 917,6 5 645 488,2 Import of services 2 641 741,0 3 452 223,9 3 707 399,9 3 976 562,1 4 409 286,0 Balance Services 221 543,3 139 672,0 671 907,4 1 142 355,5 1 236 202,2
19
of oil equivalent. In addition, 6280.42MMscf of natural gas, equal to 149.933 million litres of oilequivalentwereconsumedbyindustry.Thisconstitutedanestimatedtotalsaving(costavoided)ofUSD843.9millionduringtheperiod.
Employment In Tanzania, the Integrated Labour Force Survey (ILFS) is the main source of information onemployment. Neither the latest ILFS (2014) published early 2015, nor earlier issues, publishedemploymentnumbersforthepetroleumindustryseparately.Wearethereforegiventoguessesasto the employment numbers in this industry. The petroleum industry ismainly hidden under thesector mining and quarrying that in 2014 employed 218,024 persons on the Tanzania mainland(173,926menand44,098women)
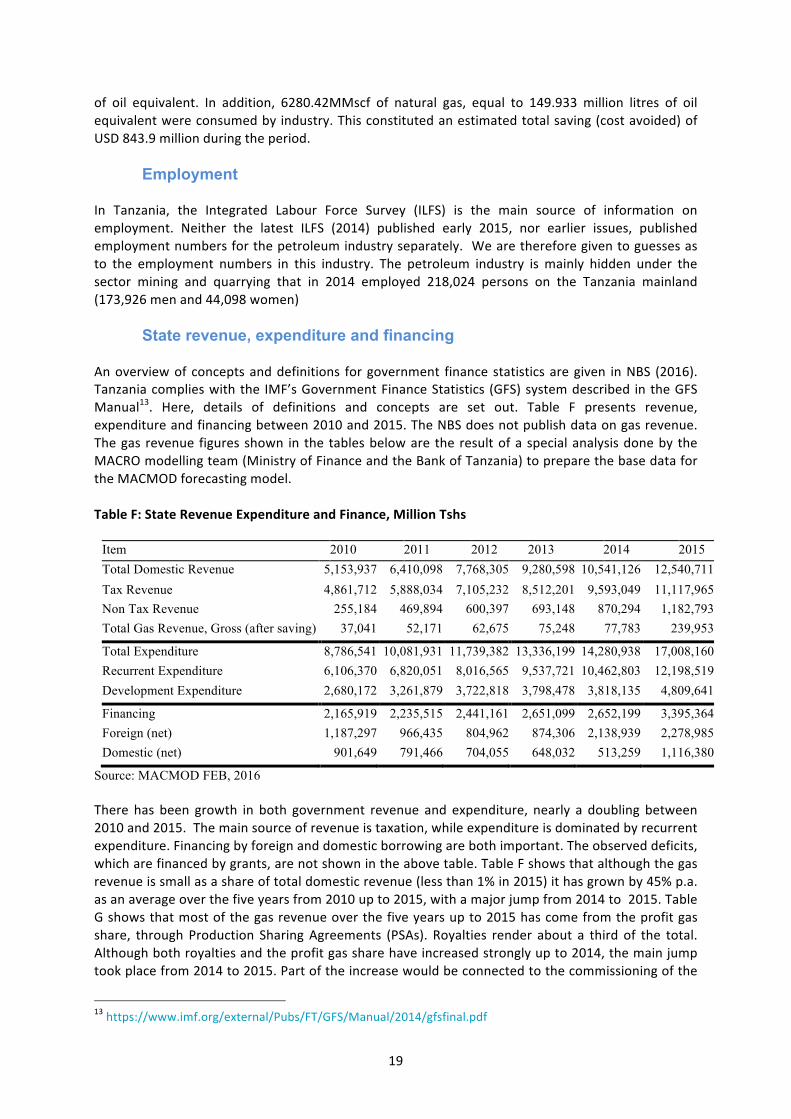
State revenue, expenditure and financing Anoverviewof conceptsanddefinitions forgovernment financestatisticsaregiven inNBS (2016).Tanzaniacomplieswiththe IMF’sGovernmentFinanceStatistics (GFS)systemdescribed intheGFSManual13. Here, details of definitions and concepts are set out. Table F presents revenue,expenditureandfinancingbetween2010and2015.TheNBSdoesnotpublishdataongasrevenue.Thegas revenue figuresshown in the tablesbeloware the resultofaspecialanalysisdoneby theMACROmodellingteam(MinistryofFinanceandtheBankofTanzania)topreparethebasedatafortheMACMODforecastingmodel.TableF:StateRevenueExpenditureandFinance,MillionTshs
Item 2010 2011 2012 2013 2014 2015 Total Domestic Revenue 5,153,937 6,410,098 7,768,305 9,280,598 10,541,126 12,540,711 Tax Revenue 4,861,712 5,888,034 7,105,232 8,512,201 9,593,049 11,117,965 Non Tax Revenue 255,184 469,894 600,397 693,148 870,294 1,182,793 Total Gas Revenue, Gross (after saving) 37,041 52,171 62,675 75,248 77,783 239,953
Total Expenditure 8,786,541 10,081,931 11,739,382 13,336,199 14,280,938 17,008,160 Recurrent Expenditure 6,106,370 6,820,051 8,016,565 9,537,721 10,462,803 12,198,519 Development Expenditure 2,680,172 3,261,879 3,722,818 3,798,478 3,818,135 4,809,641
Financing 2,165,919 2,235,515 2,441,161 2,651,099 2,652,199 3,395,364 Foreign (net) 1,187,297 966,435 804,962 874,306 2,138,939 2,278,985 Domestic (net) 901,649 791,466 704,055 648,032 513,259 1,116,380
Source: MACMOD FEB, 2016 There has been growth in both government revenue and expenditure, nearly a doubling between2010and2015.Themainsourceofrevenueistaxation,whileexpenditureisdominatedbyrecurrentexpenditure.Financingbyforeignanddomesticborrowingarebothimportant.Theobserveddeficits,whicharefinancedbygrants,arenotshownintheabovetable.TableFshowsthatalthoughthegasrevenueissmallasashareoftotaldomesticrevenue(lessthan1%in2015)ithasgrownby45%p.a.asanaverageoverthefiveyearsfrom2010upto2015,withamajorjumpfrom2014to2015.TableGshowsthatmostofthegasrevenueoverthefiveyearsupto2015hascomefromtheprofitgasshare, through Production SharingAgreements (PSAs). Royalties render about a third of the total.Althoughbothroyaltiesandtheprofitgassharehaveincreasedstronglyupto2014,themainjumptookplacefrom2014to2015.Partoftheincreasewouldbeconnectedtothecommissioningofthe
13https://www.imf.org/external/Pubs/FT/GFS/Manual/2014/gfsfinal.pdf

20
Mtwara–DaresSalaampipelinesecondhalfof2015.TableG:CompositionofRevenue2010–2015,MillionTshs 2010 2011 2012 2013 2014 2015
Tot. Gas Revenue Gross 37,041 52,171 62,675 75,248 77,783 239,953 0.7% 0.8% 0.8% 0.8% 0.7% 1.9% Royalties 11,949 16,829 20,218 24,274 25,091 75,107 0.2% 0.3% 0.3% 0.3% 0.2% 0.6% Profit Gas Share (PSA) 25,092 35,342 42,458 50,975 52,692 164,846 0.5% 0.6% 0.5% 0.5% 0.5% 1.3%
Source: MACMOD FEB, 2016
Social and welfareissues TheultimategoalfortheexploitationofTanzania’snaturalresourcesisthesustainablemaximizationof thebenefits totheTanzaniancitizens.Two issuesmake itdifficult tomeasurethemagnitudeofsuch benefits. a) the lack of reliable welfare indicators but most fundamentally b) the causalityproblem: in which way will a given increase in gas extraction affect the living standards of thecitizens?Thebasis formeasuringthematerial livingstandards inTanzaniaandmostothercountriesaretheregularhouseholdbudgetsurveysconductedbyofficialstatisticalbureaus.OthersurveysonwelfareareCensuses,DemographicandHealthSurveys,LabourforceSurveysandAgriculturalSurveys.ThesesurveysareavailableintheCentralDataCatalogueoftheNBS.However,tounravelthelinkbetweenpetroleum revenues andwelfarewewill need sophisticatedmethods and economicmodels usingthesedata.Itisnotpossibleatpresenttotracetheseconnectionsdirectlyfromavailablestatistics.Itisexpectedthatthepetrostateprogrammewillmakeprogress,bothincollectingrelevantstatisticsand inperforminganalysesthataddressessocialandwelfare issues inthecontextofTanzaniaasapetrostate.
Political and governance issues The links between welfare and petroleum exploitation “runs both ways”. On the one hand, thesociallyjustuseofpetroleumrevenuesislargelyamatterofgovernanceandpoliticaldecisions.Onthe other, the major natural resources will have an effect on politics in the country and ongovernance. Very little information on these phenomena are collected by the national statisticalsystem ina regularway.Exceptionsmaybeelectionstatisticsandcertaindemographicdata.Mostrelevantdataonpoliticsandgovernancearelikelytocomefromsurveysundertakenbyresearchers.SuchdataarenotincludedintheregularstatisticalsysteminTanzania.Notableinformationhasbeencollectedbye.g.theAfrobarometersurveyandfieldworkdonebylocalinstituteslike(e.g.REPOA).
The environment All humanactivityhas someeffecton theenvironment. It is howeveronly lately that sucheffectshavebeenincludedinofficialstatisticssuchastheNationalAccounts. InTanzania,the latestsetofenvironmentalstatisticswaspublishedbytheNBS(NationalBureauofStatistics,2015a).Thedataset,accordingtoNBS, inprincipleincludesmostofthevariablescollectedincountriessuchasUSAandUK. Some data are however not available due to technological and resource constraints. It is

21
envisagedthateventuallymostofthedatawillbecollected.AcompletesetofenvironmentalqualitydatawillinthefuturecomefromanumberofsectorsandinstitutionsinadditiontotheNBS.Themostrelevantdatarelatedtopetroleumareavailableinthe“EnvironmentStatisticsforTanzaniaMainland, 2014”. The energy section in the report presents data on capacity and generation ofelectricity, quantity of electricity sold by Tanesco (by region and by type of user) and number ofimported vehicles.Datamay alsobe found for imports of petroleumandpetroleumproducts andsources of energy for households’ lighting and cooking (2012 mainland only). The chapter onenvironmental quality presents a number of tables on pollutants and air/water quality, some bylocation.It isnotpossibleyettojudgetheenvironmentalimpactofthepetroleumindustrydirectlyfromavailablestatistics.
The future14 The extraction of petroleum resources that are at present provenmay give rise to a considerableeconomic growth in Tanzania. The following considerations build on the IMF country report no14/121(2014).Thepricesituationonthe internationalgasmarkets looksmoreencouraging thantheoilprices. Inparticular,prices intheJapanesegasmarket,which isassumedakeymarketforTanzaniangas,doseemtobepointingupwards(notethatthedataseriesendonlyin2012).
Figure6Tanzania:InternationalNaturalGasPrice
It isprematuretoprojecttherevenueimpactoftheoffshorenaturalgasfieldsgiventhesignificantuncertainty.IMFhoweverattemptstoevaluatethefiscalimpactunderspecificproduction,priceandfiscal assumptions. This is referred to below for two different sized projects (using commonassumptions about project design and cost). The first is built on a two-train LNG plant (with 10million metric tons per annum (mmtpa) LNG capacity) using 12 tcf in gas resources. The secondreflectsafour-trainLNGplant(with20mmtpaLNGcapacity)using24tcfingasresources.14ThebelowdrawsheavilyontheIMFCountryreportno14/121,2014.
22
IMFassumesa fiscal regime that reflectsbroadly theexisting regime.Theyuse the four train ideaimplementedinphasesstartingwithatwo-trainLNGplant.TwoLNGtrainsareaddedasproductionisscaledup.IMFpresentsthefiscaleffectsingraphsshowingrespectiveoverallrevenues,upstreamanddownstream. Thepaper illustrates that upstream revenueswill be thehighest, some5 billionUSDcomparedtoroughly1billionUSDfromdownstreamrevenueatthehighestpoint in2043-44.After2044therevenueflowswilldeclineandbephasedoutasanimportantfiscalflowbythemid-2050s.Thecostofexplorationanddevelopmentwillbeconsiderable,peakingatsome10-20%oftotalGDPin the three years before the first train starts producing in 2021-22. The costswill fall slightly, tosomewhatlowerthan5%to10%ofGDP15beforethesecondtraingoesintoactionsome8-9yearslater.TheclearlybiggestcapitalexpenditureelementwillbethecostoftheLNGplant.The analysis also presents a graphical illustration of the possible long-term revenue situation. Anotable feature is that the gas revenuedoesnot seem to “dwarf”other fiscal revenue. This is soeventhoughTanzania’smostsignificantbenefitsfromthegasresourcesarelikelytobefiscal.Thefiscalsituationwillbenegativelyaffectedbyanexpectedphaseoutofdevelopmentgrantsintheearly2020s.TheIMFconcludesthatthecharacteroftheresourceflowsmeansthatasetoffiscalruleswillhaveto be introduced in order tomanage the fiscal revenue flow in away that genuinely benefits thecountryanditscitizens(bothcurrentandfuturegenerations).Amacro-fiscalframeworkshouldachievemultipleobjectives:(a)preservemacro-fiscalstability,(b)savesomerevenueforfuturegenerations,and(c)financescaling-upofdevelopmentspending.The scaling up of growth-enhancing expenditure may need to be gradual if absorption andinstitutionalcapacityconstraintsarelarge.Adequateaccumulationoffinancialassetsforstabilizationand/orsavingspurposeswillhavetobeensuredwhilepreservingmacro-fiscalstability.Finally, thefiscalframeworkhastobeoperationallysimpletoimplement.
15PartlybecauseGDPwillhavegrowninthemeantime
23
4. IMPROVING STATISTICS FOR MANAGEMENT OF THE PETRO
ECONOMY ItislikelythatTanzania’spetroleumdevelopmentwillbringdramaticchangestothecountry.Section3 above indicates that even at the present level, gas-based activities influence the economy.Extractionandprocessingofnatural gas,energyproduction, fielddevelopmentand theuseof gasareimportant.Availabilityofdataforanalysis,projectionsandpolicymakingareimportantnowbutwillbeevenmoresointhefuture.
The role of good data TheeffectsonpolicymakinginAfricafrompoorstatistics,aswellasfrompooruseofstatisticsareoftenstressed.Differentauthorsfocusdifferentangles.CommentscomefromtheCenterforGlobalDevelopment(CGD)2014,SandefurandGlassman2015,Jerven2013andKiregyera2015.Challengesfor the production of adequate statistics appear to be many. Inadequate funding, diffuseresponsibilities,administrativebottlenecks,andworkingconditionsarekey.Political“vetting”ofdatabeforedisseminationoccursfrequently.Thesefactorshaveledtoaweakcapacitytocollect,manageandpublishdata.The lack of resources for statistics tends to start a vicious circle. Minimal budget allocations forstatistics lowers quality and accessibility of statistics. The resulting poorer data lowers the NSO’sstanding,resultinginstilllowerbudgetallocations.Thisleadstoevenpoorerstatistics,aconcomitantgreaterlackoftrustbyusersandsooninadownwardspiral.Donorsoftenworkoutsidethesystemtosecuredataneeded for theirownreports, thusexacerbating thewidespread feelings thatNSOsare“useless”.The Center for Global Development (CGD) 2014, has pointed out key challenges for sub SaharanAfricancountries:
• Nationalstatisticsofficeshavelimitedautonomyandunstablebudgets• Misalignedincentivescontributetoinaccuratedata• Donorprioritiesdominatenationalpriorities• limitedaccessto-andusabilityofdata
TheCGDhassuggested,asimportantareasofimprovement:
• Moreanddifferentformsoffunding• Buildingofinstitutionsthatcanproduceaccurate,unbiaseddata• PrioritytothecoreattributesofdataFocusaccuracy,timeliness,relevanceandavailability.
The launch of theMillenniumDevelopment Goals (MDG) and the Sustainable Development Goals(SDG) are important. They have emphasizedmeasurement of progress and intensified the debateabout data quality. The political and financial importance of statistics have drawn scholars,internationalfinancialinstitutions,journalistsandpublicofficialsintothedebate.Thereisconsensusthatasignificantdataqualityandavailabilityproblemexists inAfrica. Forfurther information,seeJervenandJohnston(2015).There issomedisagreementaboutthestateofaffairs inAfricanstatisticsandfuturedevelopment.WorldBankChiefEconomistDevarajan(2013)declaredanAfricanstatisticaltragedy.However,BenKiregyera, a leadingAfrican (Ugandan) statisticianhas adifferent view.He talks about a statisticalrenaissanceandan“EmergingDataRevolutioninAfrica”(Kiregyera,2015).Hedebunksthenegative

24
mythsspreadbyAfro-statisticalpessimists.Thechallenge is laidat thedoorofAfricanstatisticiansandauthorities.Thereisabodyofevidenceshowingthatbetterstatisticscanimprovesocialandeconomicdevelopment.Someexamplesfollow.
• A recent IMF Working paper, Neere et al (2016), says that better statistics can improvebudget forecasting. Statistical capacitybuilding leads toa reduction in fiscalpro-cyclicality.This is a particular problem for a resource rich country that Tanzania is likely to become.Successfuleffortstobuildstatisticalcapacitywillhelpimprovefiscalpolicyperformance.
• Jerven,DuncanandNyoni(2015)outlinetheneedforgoodmacroeconomicstatistics.Theyalsopointout thevarious costsofproducing such statistics. They stress the importanceofgoodmacromanagement and the improvement of fiscalmanagement. This is particularlyimportant when growth relies on a vulnerable income source threatening to lead to a“resourcecurse”.
• TheuseofwesternconceptsinAfricansettingscausestatisticalproblems.RandallandCoast
(2015) for example argue the need to reconsider aspects of statistical definitions ofhouseholds. Rizzo, Kilama andWuyts (2015) explore how key employment categories aretranslatedfromEnglishintoSwahili.Thetranslationbiasesrespondents’answerswithregardto ‘self-employment’. They show how this, in turn, leads to statistical invisibility of wagelabourinaninformaleconomy.
• The particular approach of our programmeon “Tanzania as a newpetro state” includes a
statistics component. This aims to break down the wall so often present between officialstatisticsanddatacollectionforacademicpurposes.Goodrelationsbetweenthestatisticalbureausanttheresearchersmaybeofgreatvalueforstrengtheningthequalityofstatistics.It is important to compare «official» datawith data from independent research (SandefurandGlassman 2015).One reason for this is that that someofficial statistics systematicallyexaggerate progress in development. Also, statistical service providers sometimesmisleadgovernments.
Tanzanian statistics and statistical development
Compared to other African countries, Tanzanian statistics are fairly well developed. A statisticalcapacity Indicator for 2013-201616 shows that Tanzania, compared to e.g. Kenya, Uganda andZambia, continuously has had a high score. Tanzania also does well in the sub-components“Methodology”,“SourceData”and“Periodicity”.Still, Tanzaniahasmany statistical challenges in commonwithAfricanSub-Saharan countries. Thenationalandinternationalinstitutionsbelowhavelaunchedremedialmeasures.Intheforefrontofstatisticalcapacitybuilding,wefindtheNationalBureauofStatistics.Thebureaucoordinates the Tanzania Statistical Master Plan. The plan aims to improve and strengthen theproductionanduseofofficial statistics in thecountry. Socio-economic statistics inTanzania followprinciplesandclassificationsofinternationalguidelines.(SeeAnnex2)16TheWorldBank’sStatisticalCapacityIndicatorprovidesindividualcountryscoresfortheoverallSCIaverageaswellasforthe3categories,i.e.Methodology,SourceData,andPeriodicity.AccessedNovember2016http://databank.worldbank.org/data/reports.aspx?source=Statistical-capacity-indicators&savedlg=1&l=en#
25
IMF’SRegionalTrainingCentresinsub-SaharanAfricaincludecapacitybuildinginstatistics.TanzaniabelongstotheEastAFRITACinDaresSalaamwhosefocusisthebuildingofmacroeconomiccapacityinEastAfrica.Assistanceandcapacitybuildingefforts include statisticson theeconomyaswell asprivate and public finance statistics. Amore recent venture, theAfrica Training Institute set up inJune2014wasco-locatedwiththeAFRITACSouth.The Special Data Dissemination Standard (SDDS) was established in 1996. SDDS will improvetransparency and openness. It will also set standards for dissemination of economic and financialdata. AGeneralDataDisseminationSystem(GDDS)wasestablished in1997formembercountrieswith less developed statistical systems. The GDDS serves as a framework for evaluating suchcountries’needsfordataimprovementandsetpriorities.Since2015,theenhancedGDDS(e-GDDS)hasreplacedGDDS.Membersthattakepartinthee-GDDScommittoseveralactions,suchasthefollowing:Usingthee-GDDS as a framework for statistical development. Designating a country coordinator. Preparingdescriptions of current statistical practices and preparing plans for improvement that would bepostedon the IMF’sDisseminationStandardsBulletinBoard (DSBB). Asamemberof thee-GDDS,Tanzania(ontheDSBB)haslistedplansforimprovement.PlanscomprisetheBankofTanzania,theMinistryofFinanceandtheNBS.Thelast(ninth)ReviewofIMF’sDataStandardsInitiativetookplacein2015.PlansaretoholdthenextReviewin2020.TheTrustFundforStatisticalCapacityBuilding(TFSCB)isamulti-donortrustfund.Itaimstoimprovethecapacityofdevelopingcountriestoproduceandusestatistics.Theoverallobjectiveistosupporteffectivedecision-makingfordevelopment.TheTFSCBworkscloselywiththePartnershipinStatisticsfor Development in the 21st Century (PARIS21). It advances coordinated international efforts toimprovestatisticsglobally.Ita)supportsthepreparationofaNationalStrategyfortheDevelopmentof Statistics (NSDS); b) performs statistical capacity building (SCB) activities in priority areas asidentified in the country’s NSDS; c) gives support to Data Production (DP) in key; d) implementsinnovationsindevelopmentdata(IDD)withtheaimtoimproveproduction,disseminationanduseofdata.TheAcceleratedDataProgram(ADP)isapartnershipbetweenthePARIS21atthe(OECD),theWorldBankandothertechnicalandfinancialpartners.TheADP/IHSNSecretariatsuppliesGlobalhostedbyPARIS21andtheWorldBank.17
Norway’s experience – relevant to Tanzania? Tanzania and Norway are very different countries. All the same, some of the problems andopportunitiestheyfacearesimilar.ThisisparticularlythecaseifwecomparethesituationtodayinTanzaniawiththatprevailinginNorwayinthelate1960s.Atthattimetheexplorationforoilandgas17TheimplementationofADPbenefitsfromthecontributionofmanypartners.InternationalHouseholdSurveyNetwork(IHSN)providestoolsandguidelines;AfricanDevelopmentBank:implementsADPinselectedcountries;EconomicandSocialCommissionforAsiaandthePacific(UN-ESCAP)implementedthepilotADP(firstphase)inselectedcountriesinAsiaandthePacific;conductsregionaltrainingandcapacitybuildingattheStatisticalInstituteforAsiaandthePacific(UNSIAP);ObservatoireÉconomiqueetStatistiqued'AfriqueSubsaharienne(AFRISTAT):providestrainingonmicrodataarchiveandtechnicalassistanceonmicrodatamanagementtoselectedcountriesinfrancophoneAfrica;SecretariatofthePacificCommunity(SPC):implementsADPinselectedcountries;(UNICEF)providestrainingandtechnicalsupporttodocumentationanddisseminationof(MICS)datasets;UnitedNationsWorldFoodProgram(WFP):supporttodocumentationanddisseminationoffoodsecuritysurveysdatasets.
26
on the Norwegian continental shelf had started and had shown some results. Building up thestatisticalsystemthatisnowinplaceinNorwayhastakenbothtimeandresources. Goingbackintimetosee“whereitallstarted”maybeofsomeusetoTanzania.Norway hasmanaged the incorporation of development of petroleumdata into themain body ofnational statisticswell. The report of the UN Secretary-General Statistical Commission (2006)wasauthored by Norway. It brought into focus national oil statistics as a key to the quality ofinternational oil statistics. The report analysed quality challenges. It made recommendations forimprovementatgovernanceandtechnicallevels.The integration of the petroleum sector in the statistical system of Norway gave rise to manyproblems. First, they arose because the sector became such amajor one. Second, the sector hadsome unusual features e.g. because of its location offshore. This forced re-considerations ofdefinitionsandconcepts.Statisticianshadtomakepracticabledecisionsforadheringtointernationalstandards.At thesametime,conceptsanddefinitionshad tokeeptheirusefulness inaNorwegiancontext. The recenthistoryofNorway’snational statistical systemmaybe interesting forTanzaniathatnowentersitsownpetroage.BelowwelookatsomegeneralfeaturesofstatisticaldevelopmentexperienceinNorway.WedealwithspecificsectoralfeaturesinSection5aspartoftheplanforthestructureofthePetroDataHub.StatisticsNorway(“StatistiskSentralbyrå”,SSBorinEnglish,“StatisticsNorway”(SN))wasestablishedin1876.Atpresent,theStatisticsActof1989providesthelegalframeworkforSN’sactivities.SNhasdevelopeditsownstyleandfunctionrelatedtospecificNorwegiansettings.First,SNisamorecentralizedorganisationthanwhatiscustomaryworldwide.Swedenhase.g.,putgreateremphasisonthevarioususersofstatistics.E.g.,ministriesproducedataandperformanalysisin line with their own needs. This style would keep analysis within the remit of the variousinstitutions.Itwouldthuslimittheindependenceoftheresearchfocusandthestatistical/analyticalwork.Second,andinlinewiththeSN’sstrongeremphasisonanalysisandresearch,Norwaybuiltupa research department in the post WWII years. The department worked with policy makers, inparticulartheMinistryofFinanceofwhichSNwaspart.TheSNbuiltandmaintainedmathematicalmodels for economic management used for analysis by the Ministry of Finance. The researchdepartment is still a powerful centre for policy analysis. It performs a role that in other countrieshavebeenundertakenbymoreindependentorganisations.ThecloserelationsbetweenstatisticiansandpolicymakersincludedparticipationofSNstaffinpolicywork.Theteamspreparingthemacroeconomicbaseforannualbudgetsupto1970comprisedhigh-levelstatisticalofficials.Thirdly, a feature that deserves particular mention is (since 1967) the “Technical Committee forIncomeSettlements”.ItsmainfunctionhasbeentoprepareawiderangeofstatisticsusedduringtheNorwegianwagebargainingprocess. Theheadof the committee is anofficial from theNorwegianCentral StatisticsOffice. It reviews recent developments in prices and incomes and prepares priceforecasts for the following year. It also forecasts the country’s competitive power. The reportpresentsreviewsoftheNorwegianeconomyinrelationtotheinternationaleconomy.While important in other respects, the close relations between the policymakers and SN causedlimiteddataaccessforoutsiders.Accordingtosomeresearchers,thestatisticsproducedbySNwasirrelevanttoimportantsocietalissues.Toremedythesituation,theNorwegianCentreforResearchData(NSD)wasestablishedin1971.Atfirst,itsmaintaskwastofacilitateaccesstodataheldbytheSN(LieandRoll-Hansen2001).Overtime,theNSDhasdeveloped. It istodayaresourcecentreforresearchers on data gathering and analysis. It also deals with issues ofmethodology, privacy andresearchethics.ThemaingoalofNSDistoimproveprospectsandworkingconditionsforempirical

27
researchers.TheNSDworkstoreducefinancial,technical,legalandadministrativebarriers.Atpresent, theeconomyofNorway is amature -orevendeclining -petro state. The countryhasdone well in managing the petro sector and its revenues in such a way that it has benefited allcitizens.AnimportantpillarhasbeentheavailabilityofdatadeliveredbytheSN.Theinformationhasincludedthesector’soperation, itseconomiceffects,thefiscalrevenueflowsandawidevarietyofotherissues.ThishascontributedtomakingthepolicydebateinNorwaybasedonfactsratherthanfeelings.
28
5. A DATA BASE FOR A PETRO FUTURE Sections2and3aboveillustratetheneedforstatisticstoanalysethepetroleumsectoranditseffecton theTanzanian society. Below,we lookat the structureandcontentof adatabasedesigned tocoverimportantdataneeds.ThePetroDataHub(http://data.tanpetstate.org)basedon“opendata”software(CKAN)hasalreadyanaddressonthewebandisbeingtestedwithdatainput.ThePetro Data Hub will consist of some 20 datagroups aimed to cover the interests of our keytargetaudiences.Foreachdatagroup,wesetoutbelow,asclearlyaspossible,thekindofstatisticsneeded.Wealsooutlinewhetherandhowtheyareproducedatthepresenttimeandtheperceivedneeds for the future. We take into consideration the plans of the NBS, as e.g. expressed in theTanzaniaStatisticalmasterPlan.WedrawonabriefsurveyondemandofusersinTanzania18aswellas the needs of researchers in the “Petrostate” programme. We take into account internationalexperience and advice from international statistical organizations. In a few cases, we suggest orrecommendconsiderationofstrengthenedornewmeasures.InbuildingaPetroDataHub several challengesmustbehandled.First, thedemand fordata frompolicy-orienteddatabaseswilldependpolicyquestionsandresearchneedsofthefuture.Second,theselectionofdatacontentforthePetroDataHubwillhavetobalancebetweentwoextremes.Ononehand, selection of a narrow data rangemay restrict rather than enhance research. On the otherhand,selectionofawidedatarangemayoverloadthesystemand includedata thatwillnotbe indemand. Third, the Hub will change and grow in response to expressed needs. In deciding thecoverageof thePetroDataHub at theoutset,we try to limit thedatabase.Weaimat areas thatdisplaylinksbetweenthepetroleumresources,economicgrowthanduseofpetroleumrevenues.The Petro Data Hub will have several functions. On the one hand, it may help build governmentcapacitybygatheringdatathatarenotincludedinanyofficialdatabase.Itmaysupplementexistingdata. Relying on government data collection, theHubwillmake data for analysis of “petro state”issuesmoreeasilyavailable.AnadvantageoftheHubwillbethatitmakesstatisticsavailableinoneplace. Itmay, in specificareas, improveonaccuracyofotherdatabut shouldneverbeseenasanalternativetogovernmentdata.Ineachofthebelowsections,wesketchoutbroadlythetypesofdatathatwillgointothePetroDataHub. It is not the intention at this stage to write a codebook for the eventual dataset. Manydecisionswillhavetobemadelater,whenbuildingtheHub.What,specificvariableswillbeincludedundereachofyoursub-sections?Howwilltheybedefined/measured?Fromwherewillthedatawillcome?Whatwillbetheyearsofcoverage,geo-locationetc.,etc?
Petroleum industry statistics – general issues Statistical definitions and classifications should aimatutility for local use. It is also important thatstatistics are in line with recommendations by the relevant international organisations. The UNStatisticsDivision,theInternationalEnergyAgency(IEA),theWorldBankandtheIMFgiveadviceonvarious aspects. Adherence to international recommendations will make it easier to compareTanzanian statistics internationally. It will also enable international stocktaking and assessment ofdevelopmentsininternationalmarkets.Thecharacterofthepetroleumsectormakesitimportanttobuildthestatisticsoncleardefinitions.18Surveyinstrument,seeAnnexxx.Unfortunatelytheresponsetothecallforinterviewswassolowthatresultswerelimitedtoafewbasicimpressions.
29
The prevalence of IOCs makes the definition of the distinction between domestic and foreign animportantissue.Pricingofproductsrelatetointernationalpricesbutalsodependwhichstageoftheproductionprocesspricingtakesplace.IfgasproducedoutsidetheTanzaniancustomsterritoryandisbroughtdirectlytoaforeigncountry,isitthenTanzanianexports?Anotherexampleisthequestionofthedomicile.Adecisionhase.g.tobetakenaboutthe(statistical)domicile of an establishment servicing the petroleum sector outside Tanzania’s borders. ThepetroleumsectorislikelytobeverylargecomparedtotherestofTanzania’seconomy.Contractsforexploration and drilling rigs will therefore also be large and affect value added and balance ofpayments numbers. Decisionsmay also be important for determination of tax liability. Statisticaldecisionsonpipelines that crossnationalborderspresent thesame typeofproblem. Ifnot clearlyexplained, the statistician’sdefinitionsmay lead tomisunderstandings. (Seesubsectoronpipelinesbelow)Collection,productionanddisseminationofpetroleumrelateddata inTanzaniapresentchallenges.Someofthefirmsandinstitutionsinthesectordonotseemtoappearinofficialstatistics.Formerlymost foreign investors in Tanzaniawere active inmining andmanufacturing activities.Major fuelswere imported. The NBS did not have to deal with petroleum companies. This meant that thebureau’s insight into the workings of the petroleum industry was lagging behind. Knowledge ofindustrialstructuresandprocessesarenecessaryforproducinggoodandrelevantstatistics.It is important that theNBSstartsplanning forabuild-upofpetroleumsectorexpertiseamong itsstaff.Briefcourses,longerpostingsinotherstatisticalbureauxwouldhelp.Also,briefsecondmentstorelevantpartsofsomeofthemajorIOCscouldbeuseful.Progressishoweverbeingmade.NBSconductsAnnualSurveysofIndustrialProduction(ASIPs)onasample basis between each comprehensive Census of Industrial Production (CIP). The CIP 2013(published September 2016) is the fourth Industrial Census tobe conducted in TanzaniaMainlandsince independence. The first, second and the third were conducted in 1963, 1978 and 1989respectively.Atthetimeofthe-89census,oilandgasproductionvalueswereminuteincomparisonto the totalmining sector. Data from the2013 census is included in thenext revisionofnationaleconomicstatisticssuchasthenationalaccounts.Theeffectsofthepetroleumindustryisnowbeingshownseparatelyintheofficialstatisticalpublicationsandmadeavailabletopolicymakers.19As the “oil age” in Norway dawned, SN produced a number of internal reports on the statisticalhandlingoftheindustry.ThereportsarenowavailableontheSNwebsite,butunfortunatelymostlyinNorwegian.Thesereportsillustrateconsiderationsmadeanddecisionstakeninvariousareaoftheoil and gas statistics. The earliest note on petroleum statistics was published by Bjørnland 1974shortlyafter thepumpingofoilhadstarted.Theanalysisanddecisions suggested in thisnoteandothershavebeendrawnoninthesector-by-sectorconsiderationbelow.The note recommended a sectoral sub structure of the sector. The sector was divided intoexploration, extraction, transport, infrastructure and “all other services”. The latter covered amultitude of activities including production and reparation of drilling ships, drilling platforms,
19MethodologicalReport:http://www.nbs.go.tz/nbs/takwimu/Industry/2013_Census_of_Industrial_Production-Methodology_Report.zipAnalyticalReport:http://www.nbs.go.tz/nbs/takwimu/Industry/2013_Census_of_Industrial_Production_Analytical_Report.zipSummaryReport:http://www.nbs.go.tz/nbs/takwimu/Industry/Census_of_Industrial_Production_2013-Summary_Report.zipStatisticalTables:http://www.nbs.go.tz/nbs/takwimu/Industry/2013_Census_of_Industrial_Production_Statistical_Report.zip
30
production platforms and parts; Building and reparation of oil pipes, supply ships, pipe layers;Supportactivitieslikedivers,helicopterservices,officesstoragespaceand“Otherservices”includinghi-techservices,seismographicexplorationaswellasrentalsofdrillingplatformwithoutcrew.The industrywas new and fastmoving, the registration apparatus slow or absent and the lack ofprimarydatawasaconsiderableproblem.DocumentsfromSNforthisearlystageshowthatavastamountofdetailedknowledgemusthavebuiltupintheSN.Thisalsogoesforotherrelevantsectors,e.g.thesupplysectors.Preciseknowledgeofthenatureofexplorationandextractionwasimportant,asitwillbeinTanzania.Alaterreport(StatistiskSentralbyrå1980)re-examinedthesysteminthelightofchangesandnewlywon information. Theannexesof the study included thedetailed statistical instruments thatwereusedatthetime.
Territory, Geology and Reserves Knowledge of territorial rights are important for analysing Tanzania’s natural resource potential.Relations to neighbouring states also depends on territorial clarity. Geological data, includingreservesestimationformthebasisfordecisionsonexploration.Typesofdataincludecadastraldata,geographiccoordinates,informationongeologyandstructures,territoryandboundaries.Dataon territorial rights, geologyandnatural resource stocksaregenerallynot included inofficialstatistics. Sources for data on territorial rights might include the Ministry of Foreign Affairs. InTanzania TPDC has its own database concentrating on exploration issues, geology and surfaceinformation,magnetic and gravity surveys and seismic surveys. TheGeological Survey of Tanzania(http://www.gst.go.tz/)alsosupplydataongeologyandreservesthrough itswebbasedGeologicaland Mineral Information System (http://www.gmis-tanzania.com/). The Geological survey alsosuppliesvariousspecificservicesandinformationatcost20.In Norway, the continental shelf was defined as part of Norway. Some exceptions weremade inrespectofcontractdrilling,pipesystemsandfieldsstretchingoverborders.TheNorwegianMappingAuthority (Statens Kartverk), formerly the Norwegian Geological Survey (Norges GeografiskeOppmåling) cooperated with the Norwegian Petroleum Directorate (NPD). They have built up anextensive database on geology and reserves. Much of the information is available in English onhttp://www.npd.no/en/About-us/Available-data/.TPDC,GeologicalSurveyandNBSmightcooperateonbuildingadatabasewithadequatecoverageofpetroleumandotherresources.ThereisaneedforNBSstafftogainmoreinsightintodatabasesforother countries suchasMozambique,BotswanaorNorway.An ‘MoU’betweenNBSand theTPDCandGeologicalSurveyonelectronicorwebdatasharingcouldbeestablished.
Legal framework, policies, public institutions Research and analyses of the effects of the petroleum industry on the Tanzanian economy andsociety are not only dependent on quantitative information. Information about the “system” thatgeneratessuchdataisalsoimportant.ThePetroDataHubwouldthereforenotonlyincludestatisticsascommonlyunderstood.Wewouldincludeinformationfromvariouspartsofthelegalsystem.Wewould also include Government policy documents. The Hub would also comprise descriptions ofrelevantinstitutionsinthepublicandprivatedomain.20LaboratoryServices,GeophysicalDigitalData,GeochemicalData,GeoPublications,Mappreparation
31
Such information could also be found elsewhere on the internet. However, the advantage ofdisseminating it from thePetroDataHub would be that correct current information is displayed.When laws, rules, regulations, policies and institutions change over time it is seldom reflectedsystematicallyonthenet.Whenseveralversionsordraftsofvariousdocumentsareavailableonthewebitiseasytoendupwithwronginformation.KeepinguptodatesuchinformationisnotamongtherolesofNBS. Thesourcesforsuchdatawillmainly be the variousministries as theMinistry of Energy andMinerals (MEM), theOffice of thePresidentandTPDC.Thewebsiteof theParliamentofTanzania (http://www.parliament.go.tz/acts-list)hasanextensiveregisterofacts.Italsoincludeslaws,bills,resolutions,subsidiarylegislationandotherparliamentarypapers.
Exploration, drilling Hydrocarbon exploration (or oil and gas exploration) is the search by petroleum geologists andgeophysicists forhydrocarbondepositsbeneaththeearth'ssurface,suchasoilandnaturalgas.Oilandgasexplorationaredependonpetroleumgeology.Asignificantamountofgeological,structuraland seismic investigation must be completed to redefine the potential hydrocarbon drill locationfromaleadtoaprospect. ThePetroDataHubwillcontainasmuchinformationaspossibleabouttheseactivitiesaswellinformationonexplorativeandextractivedrilling.Explorationcostsareinputs likechemicals,costofdrilling,siteclearingetc.Upstreamcost includesliftingandfindingcosts.TheEIAdefines findingcostsas“thecostsofexploringforanddevelopingreservesofoilandgasandthecoststopurchasepropertiesoracquireleasesthatmightcontainoilandgasreserves.”TPDCistheofficialdatasourceonexplorationinTanzania.TheInformationcenterattheTPDCwebpage contains a selectionofdataon seismic surveys (2000–2013) andon the statusof deep seawells(includingnameofwell,operator,location,depth,formation,age,dateandcurrentstatus).Alist of gas discoveries is planned but not implemented (end November 2016). A number ofdocuments, mostly with legal / regulatory contentmay be downloaded from the site. For othertypes of information concerning exploration, informationwill have to be sought directly from thecompanies. In Norway, theNorwegian PetroleumDirectorate’s (NPD) databases contain extensiveandopeninformationonexplorationandresultsbyfield.TPDC has a responsibility for furnishing data to the NBS and has its own database concentratedaroundhardtechnicaldata likeexploration,geologyandsurface information,magneticandgravitysurveys and seismic surveys. In the future, data needs will comprise also extraction, investment,transport,productionofbasicenergyrawmaterialsandtheuseofsuchmaterialsforgenerationandtransmissionofenergy.
Extraction Oilandgasextractionarepartsofthemining,quarryingandoil/gasextractionsector.Thissectorcomprisesestablishmentsthatextractnaturallyoccurringmineralsolids.Thesewillbecoalandores;liquidminerals and crude petroleum and gases, such as natural gas.Extraction includes lifting, by(EIA) defined as the costs to operate and maintain oil and gas wells. This includes also relatedequipment and facilities to bring oil and gas to the surface. The influence of IOCs and sharedownershipsmayobscurethenationalityofownership.Onemaystatisticallyneedpracticaldecisionson the nationality of companies. ThePetroDataHub should contain information on extraction of
32
naturalgasanditsuseafterextraction,inphysicalandeconomicterms.DataonextractionofnaturalgashasonlyrecentlybeenmadeavailablefromtheNBS.Formerly,dataon production volumes of gas and petroleum were made available from TPDC and MEM on aninformal basis. This has worked well. However, formal agreements between the parties wereneeded.Thiswouldbenecessarytolearnmoreaboutdatabasemaintenanceandreportingcriteria.DatashouldalsobemadeavailablethroughtheopendatainitiativesnowappearinginTanzania.ManyoftheenterprisesworkingintheNorthSeaandonlandwereownedjointlybyNorwegianandforeign companies. Borderline cases like the “Frigg” field covering both Norwegian and foreigncontinentalshelvesneededpragmaticsolutions.InternationalconventionsandNorwegianpracticalproblemshadtobebalanced.InsomecasesthestatisticalconceptsusedinNorwayweretodepartslightlyfrominternationalnorms:
• Decisionswereneededwith respect to “statistical” nationalitywhen thenationality of thevarious components of a company group were unclear. In some cases where territorialcriteriaweresuggestedbytheUN,Norwayusedownershipcriteria.Thiswasinlinewiththetreatment of the sizeable shipping sector in Norwaywhere all ships registered in Norwayweredefinedasdomestic.
• Ownershipcriteriawereneededforpipescrossingterritorialborders.Whenafieldstretchedacrossterritorialborders,theshareownedbyNorwaywasdeemedtobeNorwegian.
• Oil from a Norwegian owned field was considered exported when the flow crossed theborderofthefieldfromwhichitwaspumped.
• Investmentswerevaluedandregisteredinnationalstatisticswhendeliveredtotheoilfield.Internationallytheyarefrequentlyregardedtobedeliveredatcompletionoftheinvestment.
• Therewerealsoproblemswith'rentedorcontract'refiningofoil.Exportwouldstatisticallytakeplacewhenoilwentoutoftheterritorytoacontractrefinerbutwouldbecomeimportwhentherefinedproductcameback.
• Finally,thereweredifficultieswithdeterminationofvaluationofexportsandproduction.ForvaluationinNorwaythenormpricefortaxationpurposeswasusedbutadjustedforterminalandtransportcost.
Production, sales
Transformation of petroleum into usable products are statistically classified under manufacturingdivision. Products comprise e.g. petroleum refining and manufacture of gases such as ethane,propaneandbutane.In Tanzania the Annual Survey of Industrial Production (ASIP) records most types of petroleumproductsintermsofquantity/volume,unitpriceandhencevalueofmanufactureditems.ThesearenowavailableatISICrev4andreportedat4digitslevel.However,thecurrentcoveragedependingonthe lastrevisednationalaccountsseriesbasedon2007priceswillbeexpandedduringthenextrevision.ItwillthenincorporaterecentchangesinpetroleumindustryandtheusedatafromCensusof IndustrialProduction2013with figurescalibrated to ISIC rev.4.Moredisaggregatedstatisticsonmanufacturedproductsincludingpetroleumwillbeextracted.RelevanttablesfromtheCIP2013willbeintegratedinthePetroDataHub.
Construction, rigs, platforms The construction of rigs and platforms may be a significant contribution to investment andproductioninTanzania.Thiswilltakeplaceinthenearterminaninitialphaseofthebuild-upofthepetroleum industry. Statistical decisions on how to treat territorial and ownership definitions will
33
havetobemade.ThePetroDataHubwillaimatprovidingdetailedrecordoftheproductionofthelocal construction andmetalworking industry and the imports and exports of the relevant capitalgoods.InNorway, investment statisticswasof great importance, particularly in thebuildupperiod in theNorthSea.TheSNhad to lookcarefullyatbasicproblemsofdefinition.Whatwas investmentandwhatnot?Many shortcutshad tobe taken,oneexamplebeing theFrigg field21where investmentcostswerenotusedbutrealinvestmentestimated.In addition, some inconsistencies between the various sets of statistics collected by differentinstitutions arose. For example, there were major differences between the foreign exchangestatisticscollectedby theCentralBankofNorway (NorgesBank,NB)andthe investmentstatistics.Thesehadtobesortedoutsoasnottogivedifferentsignalstoprivatesector,thepublicandpubliceconomymanagers.
Pipelines Oilpipelinesaremadefromsteelorplastictubes,whichareusuallyburied.Theoilismovedthroughthepipelinesbypumpstationsalongthepipeline.Naturalgas(andsimilargaseousfuels)arelightlypressurisedintoliquidsknownasLiquefiedNaturalGas(LNGs).Pipesarealsousedfortransportofrefinedgasanddistributiontothefinalconsumersofgas.MuchoftheinformationplannedforthePetro Data Hub will be sourced from the CIP 2013 and earlier CIPs. Local production andimports/exportsofpipesandproduction indomestic industriesthatproducespipesandmachinerymay be important. Pipe transport of natural raw and refined gas will be registered from theproduction statistics. Most data would be from the NBS but possibly supported by data fromestablishmentsintherelevantsectors.Transportation systems, like petroleum fields, stretch across national borders. The question thenariseswhether theservicesperformedand thevalueof investment into infrastructurearedecidedfromthepointofviewofterritoryorbyownership.Apartfromthedisagreementthatthismayleadtobetweenneighbouringstates,themagnitudeoftheseflowsmayhavelargeeffectsonthemacrovariables of the economy. If not clearly defined and properly explained this may lead tomisunderstandings.InNorway,onehad todecideonwhether touseownership criteriaor territorial criteria.Practicalconsiderations caused “Norpipe” to be defined as Norwegian despite 50-50 split ownership withinternationalcompanyPhillipsPetroleum.Astheextractionofpetroleumgrows,alsoamajorpartoftherawproductsmay,atagiventime,lieinpipes.InNorway,astheamountofoilandgastransportin pipes rose and became an important part of inventories, such information was collected. InTanzaniathiswilldependonwhetherpipetransportwillbethepredominanttypeoftransportusedinthepetroleumindustryForeign trade Trade figures comprise imports and exports of gas and oil. Presently the foreign trade data arecompiled by NBS in collaboration with BOT and TRA. It is important to distinguish between totalexportsanddomesticexports. The latter isnettedout forproducts formerly imported. ThePetroDataHubwillcontainthesetradeflowsasdisaggregatedaspossible.Itwillalsoprovidetradedataforaselectionofgoodsandservicecloselyconnectedwithexploration,extractionandproductioninthepetroleumsector.21Seehttp://www.norskolje.museum.no/en/frigg-2/
34
InNorway,itbecamenecessarytocreatepracticalrulesforstatisticaltreatmentofoilstoragetakingplaceoutsidethecustomsarea. Anumberofprice issuesarosedependingonwhereandwhenoilflows and stores were measured. For instance, the price index used early made it impossible todecideonthepriceofdomesticuseofrawoilandgas.
Industry Industry statistics for the Petro Data Hub will comprise data on the production, employment,enterprises and capital formation in the petroleum industry itself. Besides, it should containinformation on industries positively or negatively affected by repercussions from the petroleumindustry. InTanzania,themainvehicleforcollectionofsuchdata istheAnnualSurveyof IndustrialProduction.Fromthe recordeddataof sector06“Extractionof crudepetroleumandnaturalgas” (for2009) itappears that therecouldhavebeenanumberof companiesactuallyoperating in thecountry thatweremissed in the recording process. The official statistics 2009 shows that the sector comprisesonlyoneestablishmenthavingstartedoperationsin2000-2004,locatedinDaresSalaam,theentiresectorcomprisingsome19employees.FromthecompanieslistedbyTPDCithoweverappearsthatsome 10 or 11 companies were engaged in activities within the sector in Tanzania before 2009.Analysisofthe2013IndustrialCensusmayhoweverchangethisimpression.Looking ahead to themajor developments that are expected in LNG production and exports, webelieve that an extra effort is needed to ensure that the petroleum sector is properly included. Abaselinesurveyofthe20-25companiesnowinvolvedinthesectorcouldbeundertaken.OnewouldnotduplicatethedatarequiredfortheCIP2013butattempttofurtherexploreproductionlinkages,ownershipdetailsandalsoincludeforwardlookingquestionse.g.oninvestmentplans.Inaddition,thesurveywould includeopportunities for thecompanies todiscusswith theNBStheirneedsandtheirparticularproblemsinsupplyingdatatotheNBS.
Investment The investment data group of the Hub will trace values of the various components and theirfinancing and ownership. In addition to drilling rigs, platforms, pipelines and refinery plants,investmentlinkedtothepetroleumindustrywillalsoincludeotherssuchaspowerplantsandvariousindustrialplantsusingproductsfromtheindustry.Theseareimportanttoincludeinanalysisontheoveralleffectsofthepetroleumresource.As alsomentionedabove, inNorway therewereearly inconsistenciesbetween the various setsofstatisticscollectedbydifferentinstitutions.Forexample,thereweremajordifferencesbetweentheforeign exchange statistics collected by the Central Bank of Norway (Norges Bank (NB)) and theinvestmentstatisticscomingfromindustrydata.
Energy Muchofthegasuseddomesticallyislikelytobeinputstotheenergyindustry.Gas/petroleumdrivengenerationofpowerandinvestmentinplantwillbepartofthePetroDataHub.Datashouldshowthe importance of the specific petroleum generated power in relation to the rest of the energysector, for example by IEA type flowcharts22. It is important to record both the investment andoperationofthisindustry.22https://www.iea.org/Sankey/#?c=UnitedRepublicofTanzania&s=Balance
35
TheMinistryofEnergyandMineralsfacilitatesthedevelopmentofenergyandmineralsectors.Itisalsotheofficialsourceofenergyandmineralstatistics.Variousinstitutionsandagencies,whichdealwith theenergy andmineral sector are alsounder theoverall guidanceof theMinistryof Energy.These include TanzaniaMinerals Audit Agency (TMAA), Tanzania Electric Supply Company Limited(TANESCO), the Rural EnergyAgency (REA), Tanzania PetroleumDevelopment Corporation (TPDC),GeologicalSurveyofTanzania(GST),StateMiningCorporation(STAMICO)andTheEnergyandWaterUtilitiesRegulatoryAuthority(EWURA).NBS handles harmonisation and dissemination of official energy statistics. The bureau maintainsstatistical compendia thatpresent collection rules,methods, conceptsanddefinitions regardingallofficialstatistics.International Recommendations for Energy Statistics (IRES) addresses the internationally agreedstandards and other necessary guidance for purpose of comparability. These recommendationsinclude relevant concepts and definitions, classifications, data sources, data compilationmethods,institutionalarrangements,dataqualityassurance,metadataanddisseminationpolicies.
National Accounts TheNationalAccountsisasystemofintegratedandmutuallyconsistentdatathatdrawinformationfromanumberofsources.Tanzania’sNationalAccountsStatisticsclassifyextractiveindustriesunderMiningandQuarrying.Thenationalaccountsof“Mining”,classifyfiguresonoilandgastogetherwiththoseofminerals.E.g.gold,diamondandtanzanite.LNGproduction,industrialgasandelectricitycomeunder‘’Electricity,gas,steamandairconditioningsupply’’.Asthepetroleumsectorbecomesmoreimportantextractedcrudepetroleumhastobeseparatelyreported.InthePetroDataHubItwillbeimportanttoshowtheeffectsofthepetroleumindustryseparatelyfor production accounts, income accounts and expenditure accounts. The financial accounts(acquisitionofassetsandliabilities)andcapitalaccounts(accumulationandfinancingofrealassets)shouldalsobeincluded.Bothcurrentandconstantpriceswillberelevant.An important feature of theNorwegian national accounts after the beginning of the “oil age” hasbeentheconceptof“MainlandNorway”.Theconcept,whichhadpreviouslybeenused informally,wasintroducedanddefinedinthenationalaccountsof1989.Withthisconcept,SNaimedtoexcludefromGDP,thepetroleumactivities(SeeHalvorsenandSkoglund2011).“MainlandGDP”isthesumof the gross products of all production sectors excluding extraction of crude oil and natural gas.Excluded activities include services linked to the extraction of crudepetroleumandnatural gas. Italso includes pipe-transport of crude oil and gas. Shipping in foreign waters, including shippingsupplying ocean based industry is also excluded. Note that the definition is not strictly spatiallybased. “Mainland”also includesactivities in Svalbard23 aswell as atNorwegianEmbassies abroad.MainofficesofOICsonNorwegiansoilareexcluded.Several factors led to the use of the “mainland” concept. An extraordinarily high level of naturalresource rent from the petroleum industry was important. The sector’s dominant position in theeconomy and its vulnerability to price variations could skew economic analysis. Today the“mainland”conceptisastandardconceptforanalysesoftheNorwegianeconomy.AstheTanzanian
23SvalbardisnotpartofanyNorwegiancounty,butformsanunincorporatedareaadministeredbyagovernorappointedbytheNorwegiangovernment.Seehttps://en.wikipedia.org/wiki/Svalbard
36
petroleumindustrygrows,theuseofa“mainland”conceptmayalsobeconsideredforTanzania.ThiscouldcomplementthepresentuseoftheconceptregardingtheTanzanianmainlandandZanzibar.
Government finance Government finance statistics include data on revenue, expenditure and budget balance at thecentralgovernment level.Forsomecountries,secondandthirdtiergovernmentdataare included.Since government accounts are often produced with major delays, budget data are sometimestemporarilysubstitutedforaccountingdata.Governmentaccountsareusuallydisaggregatedbypurpose,byeconomicoradministrativecategory.They may be used for a wide variety of analyses. Classification schemes differ from country tocountryandfromyeartoyearwithinthesamecountry.Governmentfinancedataareanimportantpart of the national accounts and is therefore reclassified to comply with national accountscategories. Internationally comparabledata for a largenumberof categories aredisseminatedbythe IMF (2016) through the IFS Government Finance (2016) database. IMF (2014) also presentsrecommendationsforclassificationsanddefinitionofconcepts.InTanzania,theExecutive’sbudgetproposalsassubmittedandaspassedbytheNationalAssemblyare available on theMinistry of Finance and Planningwebsite24. End year reports are not publiclyavailable but a good deal of detailed data on the government accounts are available on AuditorGeneral Website. The National Bureau of Statistics (2015b) supplies detailed accounts data onrevenueandsomeaggregateddataonexpenditure,debtandbudgetbalance(2002-2015)andsetsoutconceptsanddefinitionforthetaxstatistics.Data tobe included in thePetroDataHubwould comprise twomajor categories. Firstly, revenuefigures related to the petroleum sector and expenditure data for government contribution to thepetroleumandenergyindustry.Secondly,andimportantly,thedatabasewouldcontaininformationthatcouldrevealtheuseofgovernmentexpenditureforlivingstandardsimprovementforTanzaniancitizene.g. in termsofhousing,nutrition, educationandhealth.Government financedatamaybeusedforalargenumberofdifferentpurposesthataredifficulttopreguess.TheDataHubwillalsoprovidelinkstodetaileddatafromthesourcesmentionedabove.
Social issues - incomes - poverty NBShasmaintained a gooddatabaseon socio-economic statistics such as household expenditure,labour,demography,tradeandenvironment.ThePetroDataHubwillpartlylinktotheNBSdatatoguideresearchersandpartlysupplyimportantdataseriesdirectlyinthedatabaseforeasyaccess.Tanzania Socio Economic Database (http://www.devinfo.org/tanzania/) contains easily accessibledataondemography,economy,education,environment,health,HIV/AIDS,nutritionlandandlabourforce.Censusinformationisalsosearchablebytopicandbyareainthedatabaseandwillbelinkedtothe Petro Data Hub. The Tanzania National Data Archive (TNADA) contains reports on series likebusinessregisters,constructionindustryandcashtransferdata.Surveysondemographyandhealth,employment and earnings as well as household budgets are included. The TNADA also containsintegratedlaboursurveysandnationalpanelsurveys.SeveralofthesedataseriesareinpdfformatbuttheplanistoconvertaselectionofthemtoExcel.TheycanthenbeincludedinthePetrodataHubsothattheyareeasilyaccessibleformodelersandanalysts.
Political and Governance issues 24http://www.mof.go.tz/index.php?option=com_content&view=category&layout=blog&id=20&Itemid=560
37
OfficialsourcesdonotprovideextensivedataonpoliticalandGovernanceissuesbutsomeimportantcontributionsmaybefoundinthePopulationandHousingCensus.The Governance component and other components of the petro state project will be collectingrelevantdata.ThesewillbeincludedinthePetroDataHuband,ifpossible,amongthedatabasesoftheNBS. ThePetroDataHubwill alsohave links to internationaldatabaseswith relevantpoliticalandgovernancedata.
Environment Asthepetroleumsectorgrows,theenvironmentaleffectsofoilandgasextractionandrefiningneedtobe taken intoaccount. These compriseanumberofphenomena thatmaybe registered in thedatasystemsofthecountry.Dataontoxicalityandclimatechangescausedbypetroleumproductionprocesses,oilspillsandtheconsumptionofpetroleum-basedproductsareimportant.Recommendation for the full range of environmental statistics have been issued in the UNFramework for theDevelopment of Environment Statistics. (SeeUNDepartment of Economic andSocialAffairsStatisticsDivision2016).InTanzania,thelatestsetofenvironmentalstatisticswaspublishedbytheNBS(NationalBureauofStatistics,2015a).Thedataset,accordingtoNBS,inprincipleincludesmostofthevariablescollectedin countries such as USA and UK. Some data are however not available due to technological andresource constraints.A complete setof environmental qualitydatawill in the future come fromanumberofsectorsandinstitutionsinadditiontotheNBS.Themost relevant data related to petroleum are available in “Environment Statistics for TanzaniaMainland2014”(NationalBureauofStatistics2015a).Theenergysectioninthereportpresentsdataon capacity and generationof electricity, quantity of electricity soldby Tanesco (by region andbytypeofuser)andnumberofimportedvehicles.Datamayalsobefoundforimportsofpetroleumandpetroleum products and sources of energy for households’ lighting and cooking (2012 mainlandonly).Thechapteronenvironmentalqualitypresentsanumberoftablesonpollutantsandair/waterquality,somebylocation.ThePetroDataHubmayalsodrawondatafromtheHumansettlementreports(2012and2009)andthepopulationcensus2012.
International comparisons – international statistical sources Anumberofinternationalorganisationsfocusingonavarietyofissues,fromeconomicdevelopment,energy etc. to various social andpolitical issues, operate databases on theweb.Many are free ofcharge,open toallusersandeasilyaccessible,basedonattractive software forgraphingetc. Thedatamaybestandardizedintermsofclassificationandconceptstobecomparableacrosscountries,buttheoverwhelmingpartofthemarebasedonnationalofficialstatisticalsources.Annex4listsaselection of potentially useful databases, noting briefly what kinds of data they hold, coverage,frequencyandmostrecentavailability.
Analysis and models In Tanzania, there are two national expert groups dealing with economic modeling and forecast.These are the ‘Tanzania MACMOD’ group and the ‘Financial Programming’ group. The closely

38
workinggroupscompriseexperteconomistsandstatisticiansfromtheBankofTanzania,MinistryofFinance, National Bureau of Statistics, Tanzania Revenue Authority, TPDC and others. The groupsmeet routinely to assess the economic performance of the country and forecast future economictrends.The macroeconomic model for Tanzania (MACMOD) will include a line of indicators tracking theproductionofgasasseparatefromthegeneralminingactivity.TPDCandTRArequiresuchdatafortax estimation and NBS for its reporting on industrial performance. Most significantly, with thisdevelopment, NBS will be able to use detailed data on production costs right from the firms forestimatingthecostofinputsaspartofnationalaccountsstatistics.Theinput-outputratioscurrentlyusedweregenerated in1992(slightlymodified in2001)atatimewhenproductionofgaswasnotseparatedfromgeneralminingactivity.AjointmineralmodelingprojectisbeingcoordinatedbyTanzaniaRevenueAuthorityandNBSwithashared database. The project is funded by Norway. Study tour visits have been received fromexperienced countries in mineral production, including Botswana. Challenges in the projectdevelopmentwillinfuturebereportedbythePetrostateprogramwebsiteandthePetroDataHub.ThePetroDataHubwillbeabletosupplydataforfurthermodellingattempts.ModelanalystswillbenefitfromtheeconometricstrainingwithinthePetrostateprogramme.Itistheambitionthatsuchanalyticaleffortsbyawiderrangeofpersonsand institutionsbemadeaccessible topolicymakersthroughthePetroDataHub.InNorway,thedevelopmentoflarge-scalemodels(Leontief/Keynesianstyle)startedinthelate1950and continued in the sixtieswith additional CGE typemodels. Later alsopart-year (quarter) basedmodelswereused.TheSNResearchDepartmentrunsandmaintainsasystemofmodels forpolicyanalysisinconjunctionwiththeMinistryofFinance,whichisthepredominantuser.Otherusersmayhowever also “rent”model runs. Themodel system contains bothmicro andmacromodels. Theformer(e.g.ontaxation,householdconsumptionandthestatebudget)feedintothelatter(macromodelslikeKVARTS,MODAG,MSG)whichagaindeliverinputtomodelsforpollution,useofnaturalresourcesandregional integration.Atthetimeofdiscoveryofpetroleumresources inNorway,theSN undertook considerable statistical work to include petroleum sector in these models. Severalinternal(nowavailable)noteswereproduced,mostlyinNorwegian.
39
6. CONCLUSIONS Thispaperhas indicatedtherangeofdataneededtotrackandmakeforecast for thepetrosectoranditseffectontheeconomyofTanzania.ImprovementofpetroleumrelatedstatisticsinTanzaniawillentailcollection,presentationanddissemination.Thedataareimportanttoinformthedecisionmakersandresearchers.ThePetrostateprogrammeaimsat improving theempiricalunderstandingofkeychallenges facingTanzania. It will provide evidence based policy analysis to avoid a resource curse situation. Theprogrammeneedsdisaggregateddata toanswer itscorequestions.Theprogrammewill traindatausersandanalysts.ItwillsharethedifferentfindingsthroughtheprogrammewebsiteandthePetroDataHub.ItisclearfromtheabovethatmuchinformationonthepetroleumindustryinTanzaniaislackingornotaccessible.AnimportantfocusforthePetroprogrammeistocreategoodrelationswithnationalproducersofofficialdata. NBSe.g.holds themainresponsibility forofficial statisticsandwillbeakeysourceofdata for theprogramme.TheBureauwillhoweverneedsupportand input fromtheprogramme and other sources. Itwill be important for public, private andmultinational companystakeholderstoworkcloselywiththeNBS.NBS also has a particular role in ensuring that all data reported follow internationally agreedstandards.ThesestandardsarestatedgenerallybytheUnitedNation’sguideline(seeAnnexII)and,forspecificdatawillcomplywithrecommendationsoftheUNSD.

40
REFERENCES CenterforGlobalDevelopment,2014.DeliveringonthedatarevolutioninsubSaharanAfrica.FinalreportoftheDataforAfricanDevelopmentWorkingGroup.WashingtonDC2014.CIAWorldFactbookhttps://www.cia.gov/library/publications/the-world-factbook/fields/print_2106.htmlDevarajan, S. (2013). Africa’s statistical tragedy, Review of Income and Wealth, 59, S9–S15. EWURA, Energy and Water Utilities Regulatory Authority, 2016. Annual Report for the year Ended 30th June, 2015. Available at: http://144.76.33.232/wp-content/uploads/2015/04/EWURA-Annual-Report-ended-June-2015.pdf (Accessed November 2016) Gulløy,Elisabeth,andBjørnWold,eds.2004.StatisticsforDevelopment,PolicyandDemocracy:SuccessfulExperienceandLessonsLearnedthrough10YearsofStatisticalandInstitutionalDevelopmentAssistanceandCooperationbyStatisticsNorway. Oslo:StatisticsNorwayDevelopmentCooperation.www.ssb.no/a/english/publikasjoner/pdf/doc_200404_en/doc_200404_en.pdf.HalvorsenT.,T.Skoglund,2011.NoenproblematiskebegreperinNasjonalregnskapet–ethistorisktilbakeblikk.Økonomiskeanalyser2/2011,StatistiskSentralbyrå,Oslo,Norway,2011.(inNorwegianTitletranslatedtoEnglish«SomeProblematicconceptsofthenationalAccounts–anhistoricalreview»Availableathttps://www.ssb.no/a/publikasjoner/pdf/oa_201102/skoglund.pdfAccessedNovember2016.IMF,2014.FiscalImplicationofOffshoreNaturalGas.IMFCountryReportNo.14/121,2014.(ByThomasBaunsgardIMFrepresentativetoTanzania).IMF(2016).InternationalFinancialStatistics.http://data.imf.org/?sk=5DABAFF2-C5AD-4D27-A175-1253419C02D1&ss=1409151240976Accessed14.11.2016.ContainssubdatabasesonExchangerates,GovernmentFinance,InterestRates,Monetarydata,NationalAccounts,Price,Production,Labour,Reserves(InternationalLiquidity)andTradeofgoods.IMFWashington.IFSGovernmentFinance(2016).TheDatasetforTanzaniaat:http://data.imf.org/regular.aspx?key=60998109.IMFWashingtonIMF,2014.http://www.imf.org/external/Pubs/FT/GFS/Manual/2014/gfsfinal.pdfGovernmentfinancestatisticsmanual2014.–Washington,D.C.:IMFWashington,2014.Jerven,M.,Y.Kale,M.E.DuncanandM.Nyoni(2015).GDPRevisionsandUpdatingStatisticalSystemsinSub-SaharanAfrica:ReportsfromtheStatisticalOfficesinNigeria,LiberiaandZimbabwe,TheJournalofDevelopmentStudies,51:2,194-207,Jerven,M.,2013.PoorNumbers:HowWeAreMisledbyAfricanDevelopmentStatisticsandWhattoDoaboutit.Ithaca,NY:CornellUniversityPress.Sandefur,J.andA.Glassman(2015)ThePoliticalEconomyofBadData:EvidencefromAfricanSurveyandAdministrativeStatistics,TheJournalofDevelopmentStudies,51:2,116-132. Kiregyera,B.,2015.TheEmergingDataRevolutioninAfrica:StrengtheningtheStatistics,PolicyandDecision-makingChain.AfricanSunMediaStellenbosch,SouthAfrica2015.

41
Lee,B.andK.Dupuy,2016.PetroGovernanceinTanzania:OpportunitiesandChallenges.CMIBriefVolume15,Number14,REPOABriefNumber8,October2016.CMIandREPOA.Availableat:https://www.cmi.no/publications/5972-petro-governance-in-tanzaniaAccessedNovember2016Lie,E.andH.Roll-Hansen,2001.Faktisktalt.StatistikkenshistorieINorge.Universitetsforlaget,Oslo,Norway,2001.InNorwegian.Translated“True!ThehistoryofStatisticsinNorway”)Mbendiwebsitehttp://www.mbendi.com/MinistryofFinance(2013).TheEconomicSurvey2012.DaresSalaam:UnitedRepublicofTanzania.NationalBureauofStatisticsandMinistryofLabourandYouthDevelopment(1993).Tanzania(Mainland)LabourForceSurvey1990/91.DaresSalaam:UnitedRepublicofTanzania.NationalBureauofStatisticsandMinistryofLabour,YouthDevelopmentandSports(2002).IntegratedLabourForceSurvey2000/01:AnalyticalReport.DaresSalaam:UnitedRepublicofTanzania.NationalBureauofStatistics,2007.RevisedNationalAccountsEstimatesforTanzaniaMainlandbaseyear2001.DaresSalaam:UnitedRepublicofTanzania..NationalBureauofStatistics,TanzaniaGenderNetworkingProgramme(TGNP)&MinistryofLabourandYouthDevelopment(MLEYD),2007.AnalyticalReportforIntegratedLabourForceSurvey(ILFS)2006:KeyFindings,MinistryofLabour,YouthDevelopmentandSports(2014)NationalBureauofStatistics,2015a.EnvironmentStatistics2014,TanzaniaMainland.MinistryofFinance,DaresSalaamSeptember2015.Availableathttp://www.nbs.go.tz/nbs/takwimu/Environment/ENVIRONMENT_PUBLICATION_2014.pdf(AccessedNovember2016)NationalBureauofStatistics,2015b.2015TaxandGovernmentFinanceStatisticsReport,TanzaniaMainland.Availableathttp://www.nbs.go.tz/nbstz/index.php/english/statistics-by-subject/tax-statistics/743-2014-15-tax-and-government-finance-statistics-report-tanzania-mainland(AccessedNovember2106)NationalBureauofStatistics,MinistryofFinanceandPlanning,2016“ConceptsandDefinitions:ForOfficialStatisticsinTanzania.ThirdEdition”.Dar-es-Salaam.Availableathttp://www.nbs.go.tz/nbstz/index.php/english/standard/statistical-guidelines/739-concepts-and-definitions-for-official-statistics-in-tanzania-third-edition(AccessedNovember2016)NationalBureauofStatistics,MinistryofFinance,DarEsSalaam,Tanzania.Availableathttp://www.nbs.go.tz/nbstz/index.php/english/statistics-by-subject/tax-statistics/743-2014-15-tax-and-government-finance-statistics-report-tanzania-mainland.Accessed24November2016Rizzo,M.,B.KilamaandM.Wuyts(2015).TheInvisibilityofWageEmploymentinStatisticsontheInformalEconomyinAfrica:CausesandConsequences,TheJournalofDevelopmentStudies,51:2,149-161.Neere,C.G.M.N.,S.J.ATapsobaandR.C.York,2016.CanstatisticalCapacityBuildingHelpReduceProcyclicalFiscalPolicyindevelopingCountries?IMFWorkingpaper16/209.IMFWashingtonUSA.

42
StatisticalCommissionThirty-sixthsession1-4March2005Item4(a)oftheprovisionalagendaEconomicstatistics:programmereview:energystatisticsReportoftheprogrammereviewer(StatisticsNorway)onenergystatisticsNotebytheSecretary-GeneralBjørnland,L.,1974..DetnorskenasjonalregnskapetDokumentasjonsnotatnr.5Behandlingav"Oljesektorene"inasjonalregnskapet.(InNorwegiantranslatedtitle«TheNorwegiannationalAccounts:Documentationpaperno5.Treatmentofthe«oilsectors»inthenationalaccounts”).StatistiskSentralbyrå,Oslo,Norway,1974.Availableathttp://www.ssb.no/a/histstat/ano/ano_io75_04.pdfAccessedNovember2016StatistiskSentralbyrå,1980.RapporterfraStatistiskSentralbyrå80/15.DenStatistiskeBehandlingenavOljevirksomheten,(inNorwegian:Titlemtranslatedtoenglish:(Statisticaltreatmentoftheoilactivity.Oslo1980.ISBN82-537-1150-6ISSN0332-8422).Availableathttps://www.ssb.no/a/histstat/rapp/rapp_198015.pdfAccessedNovember2016TanzaniaOilandGasAlmanacWebsitehttp://wiki.openoil.net/index.php?title=Tanzania_Oil_and_Gas_AlmanacTEITI,2013.PaymentReconciliationReportforFY2010/11.DaresSalaam,TanzaniaTPDCwebsitehttp://www.tpdc-tz.com/tpdc/UNSecretary-General.StatisticalCommission,2006.ReportofStatisticsNorwayonqualitycomponentsofoilstatistics.Thirty-seventhsession.7-10March2006.Item3(h)oftheprovisionalagenda.Availableathttp://unstats.un.org/unsd/statcom/doc06/2006-11e-Norway-EnergyStats.pdf(Accessed21.11,2016)UNDepartmentofEconomicandSocialAffairsStatisticsDivision,2016.FrameworkfortheDevelopmentofEnvironmentStatistics(FDES2013).FinalofficialeditedversionUnitedNationsStatisticsDivisionNewYork27June2016.https://www.google.no/search?q=Framework+for+the+Development+of+Environment+Statistics&gws_rd=cr&ei=Tto2WN75F4i8sQHEnrRIUnited NationsConventionontheLaw oftheSea(UNCLOS)http://www.un.org/depts/los/convention_agreements/texts/unclos/closindx.htmUNCLOS,2012.“CommissionontheLimitsoftheContinentalShelf(CLCS)Outerlimitsofthecontinentalshelfbeyond200nauticalmilesfromthebaselines:SubmissionstotheCommission:SubmissionbytheUnitedRepublicofTanzania.Availableat:http://www.un.org/depts/los/clcs_new/submissions_files/submission_tza59_2012.htm(AccessedNovember2016)UnitedRepublicofTanzania,NationalBureauofStatistics,&MinistryofFinance,(2011),NationalAccountsofTanzaniaMainland2000-2010.DaresSalaam.

43
ANNEXES

44
Annex 1: Oil and gas companies in Tanzania
Company Contacts History/area/block
AfrenTanzania
Jeremy Martin Country Manager East Africa Exploration (Kenya Ltd) P.O.Box 38925-00623 Nairobi, Kenya Mob: +254 (0) 72 9943249 Email: [email protected]
Afren entered the country’s fast growing gas and oil sector in 2011 after it bought a 74 per cent working interest in the Tanga Block, and then wholly owned by Petrodel Resources that now retains a 26 per cent interest in the company.
BeachPetroleum
Marcus Mng'ong'o Beach Petroleum (Tanzania) Ltd Plot No. 34A, First Floor Norconsult Building Winding Avenue/Zambia Road Oysterbay P.O. Box 33353 Dar es salaam Tel/Fax: +255222667770 Website: beachpetroleum.com.au
In June 2013, we announced that our subsidiary Petrobras International Bras petro B.V. ("PIBBV"), together with the investment vehicle owned and managed by BTG Pactual ("BTG Pactual Vehicle"), entered into an agreement to form a joint venture (at the ratio of half each), for oil and gas exploration and production in Africa ("E&P"), which includes Tanzania
BGInternational
Mr. Derek Hudson President and Asset General Manager BG East Africa BG International, Tanzania Branch Plot 369, 1st Floor Kilwa House Toure Drive, Oysterbay P. O. Box 105833 Dar es salaam E-mail:[email protected]
BG Group came to Tanzania in 2010 when it farmed in to Ophir Energy held assets by taking a 60 per cent working interest acquiring an interest in offshore Blocks 1, 3 and 4. had by the third year (2013) of operations hit nine natural gas discoveries
Dodsal
Samir Kilachand Dodsal Hydrocarbons & Power Ltd, 9th Floor, Extelecoms House, Samora Avenue, P.O. Box 12049, Dar es Salaam, Tanzania +97143431515 Email: [email protected]
Dodsal, a Dubai based company through Dodsal Hydrocarbons and Power (Tanzania) Pvt Ltd in October 2007 signed a production sharing agreement with Ministry of Energy and Minerals and Tanzania Petroleum Development Corporation for exploration of oil and gas for the RUVU block which lies approximately 15,300 square kms towards the eastern part of Tanzania. Ruvu
Dominion
Doug Rycroft: General Manager Dominion Oil & Gas Limited, Hamza Aziz Road, Plot 1676, P.O. Box 23184, Dar es Salaam. Fax: +255 22 260 2532 Email: [email protected]
In 2006, Dominion Oil and Gas Limited, a 100 per cent subsidiary of Dominion Petroleum Limited was awarded an exploration permit for (part) of the Selous basin. [1] Dominion holds three Production Sharing Agreements (PSAs) in onshore Tanzania, namely Mandawa, Kisangire and Selous DeepSea Block-7
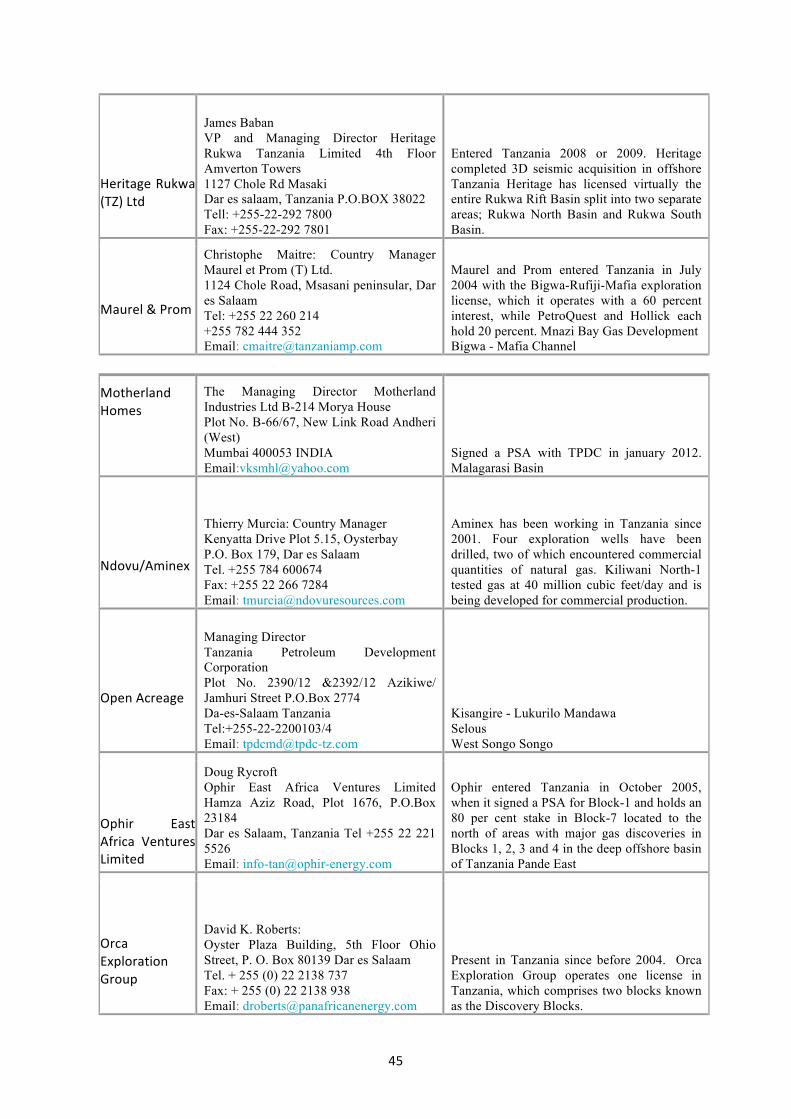
45
HeritageRukwa(TZ)Ltd
James Baban VP and Managing Director Heritage Rukwa Tanzania Limited 4th Floor Amverton Towers 1127 Chole Rd Masaki Dar es salaam, Tanzania P.O.BOX 38022 Tell: +255-22-292 7800 Fax: +255-22-292 7801
Entered Tanzania 2008 or 2009. Heritage completed 3D seismic acquisition in offshore Tanzania Heritage has licensed virtually the entire Rukwa Rift Basin split into two separate areas; Rukwa North Basin and Rukwa South Basin.
Maurel&Prom
Christophe Maitre: Country Manager Maurel et Prom (T) Ltd. 1124 Chole Road, Msasani peninsular, Dar es Salaam Tel: +255 22 260 214 +255 782 444 352 Email: [email protected]
Maurel and Prom entered Tanzania in July 2004 with the Bigwa-Rufiji-Mafia exploration license, which it operates with a 60 percent interest, while PetroQuest and Hollick each hold 20 percent. Mnazi Bay Gas Development Bigwa - Mafia Channel
MotherlandHomes
The Managing Director Motherland Industries Ltd B-214 Morya House Plot No. B-66/67, New Link Road Andheri (West) Mumbai 400053 INDIA Email:[email protected] [email protected]
Signed a PSA with TPDC in january 2012. Malagarasi Basin
Ndovu/Aminex
Thierry Murcia: Country Manager Kenyatta Drive Plot 5.15, Oysterbay P.O. Box 179, Dar es Salaam Tel. +255 784 600674 Fax: +255 22 266 7284 Email: [email protected]
Aminex has been working in Tanzania since 2001. Four exploration wells have been drilled, two of which encountered commercial quantities of natural gas. Kiliwani North-1 tested gas at 40 million cubic feet/day and is being developed for commercial production.
OpenAcreage
Managing Director Tanzania Petroleum Development Corporation Plot No. 2390/12 &2392/12 Azikiwe/ Jamhuri Street P.O.Box 2774 Da-es-Salaam Tanzania Tel:+255-22-2200103/4 Email: [email protected]
Kisangire - Lukurilo Mandawa Selous West Songo Songo
Ophir EastAfrica VenturesLimited
Doug Rycroft Ophir East Africa Ventures Limited Hamza Aziz Road, Plot 1676, P.O.Box 23184 Dar es Salaam, Tanzania Tel +255 22 221 5526 Email: [email protected]
Ophir entered Tanzania in October 2005, when it signed a PSA for Block-1 and holds an 80 per cent stake in Block-7 located to the north of areas with major gas discoveries in Blocks 1, 2, 3 and 4 in the deep offshore basin of Tanzania Pande East
OrcaExplorationGroup
David K. Roberts: Oyster Plaza Building, 5th Floor Ohio Street, P. O. Box 80139 Dar es Salaam Tel. + 255 (0) 22 2138 737 Fax: + 255 (0) 22 2138 938 Email: [email protected]
Present in Tanzania since before 2004. Orca Exploration Group operates one license in Tanzania, which comprises two blocks known as the Discovery Blocks.
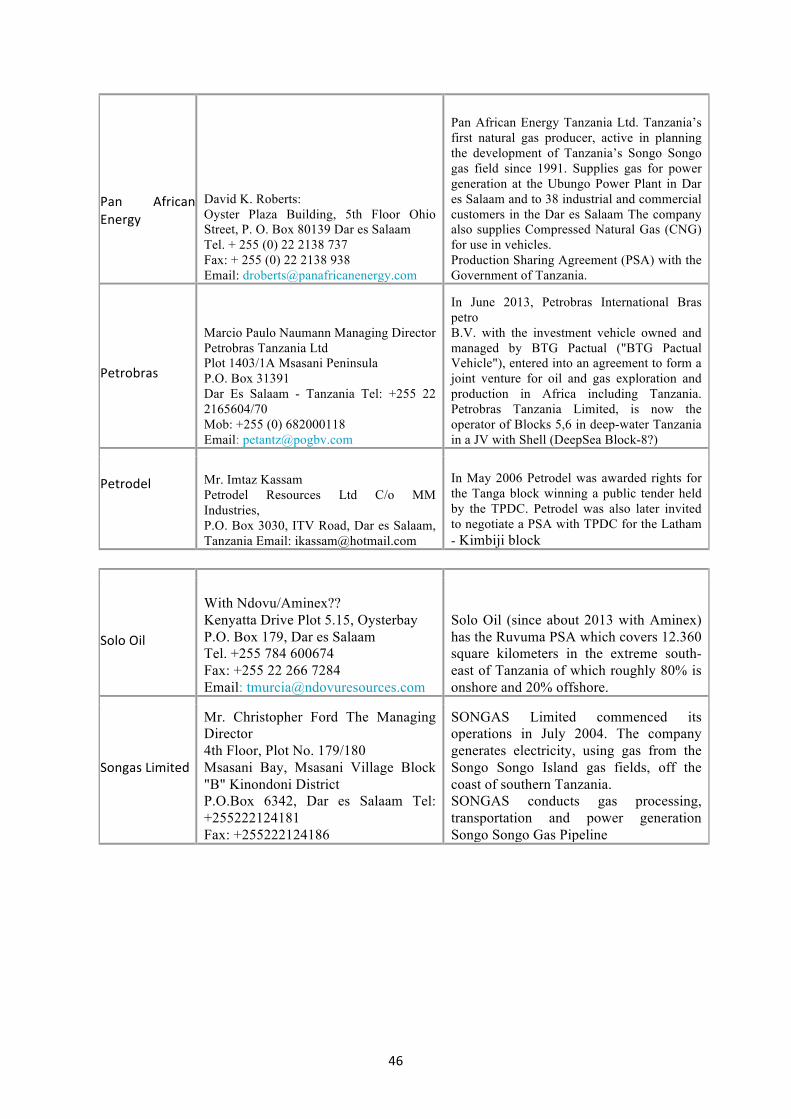
46
Pan AfricanEnergy
David K. Roberts: Oyster Plaza Building, 5th Floor Ohio Street, P. O. Box 80139 Dar es Salaam Tel. + 255 (0) 22 2138 737 Fax: + 255 (0) 22 2138 938 Email: [email protected]
Pan African Energy Tanzania Ltd. Tanzania’s first natural gas producer, active in planning the development of Tanzania’s Songo Songo gas field since 1991. Supplies gas for power generation at the Ubungo Power Plant in Dar es Salaam and to 38 industrial and commercial customers in the Dar es Salaam The company also supplies Compressed Natural Gas (CNG) for use in vehicles. Production Sharing Agreement (PSA) with the Government of Tanzania.
Petrobras
Marcio Paulo Naumann Managing Director Petrobras Tanzania Ltd Plot 1403/1A Msasani Peninsula P.O. Box 31391 Dar Es Salaam - Tanzania Tel: +255 22 2165604/70 Mob: +255 (0) 682000118 Email: [email protected]
In June 2013, Petrobras International Bras petro B.V. with the investment vehicle owned and managed by BTG Pactual ("BTG Pactual Vehicle"), entered into an agreement to form a joint venture for oil and gas exploration and production in Africa including Tanzania. Petrobras Tanzania Limited, is now the operator of Blocks 5,6 in deep-water Tanzania in a JV with Shell (DeepSea Block-8?)
Petrodel Mr. Imtaz Kassam
Petrodel Resources Ltd C/o MM Industries, P.O. Box 3030, ITV Road,Dar es Salaam, Tanzania Email: [email protected]
In May 2006 Petrodel was awarded rights for the Tanga block winning a public tender held by the TPDC. Petrodel was also later invited to negotiate a PSA with TPDC for the Latham - Kimbiji block
SoloOil
With Ndovu/Aminex?? Kenyatta Drive Plot 5.15, Oysterbay P.O. Box 179, Dar es Salaam Tel. +255 784 600674 Fax: +255 22 266 7284 Email: [email protected]
Solo Oil (since about 2013 with Aminex) has the Ruvuma PSA which covers 12.360 square kilometers in the extreme south-east of Tanzania of which roughly 80% is onshore and 20% offshore.
SongasLimited
Mr. Christopher Ford The Managing Director 4th Floor, Plot No. 179/180 Msasani Bay, Msasani Village Block "B" Kinondoni District P.O.Box 6342, Dar es Salaam Tel: +255222124181 Fax: +255222124186
SONGAS Limited commenced its operations in July 2004. The company generates electricity, using gas from the Songo Songo Island gas fields, off the coast of southern Tanzania. SONGAS conducts gas processing, transportation and power generation Songo Songo Gas Pipeline
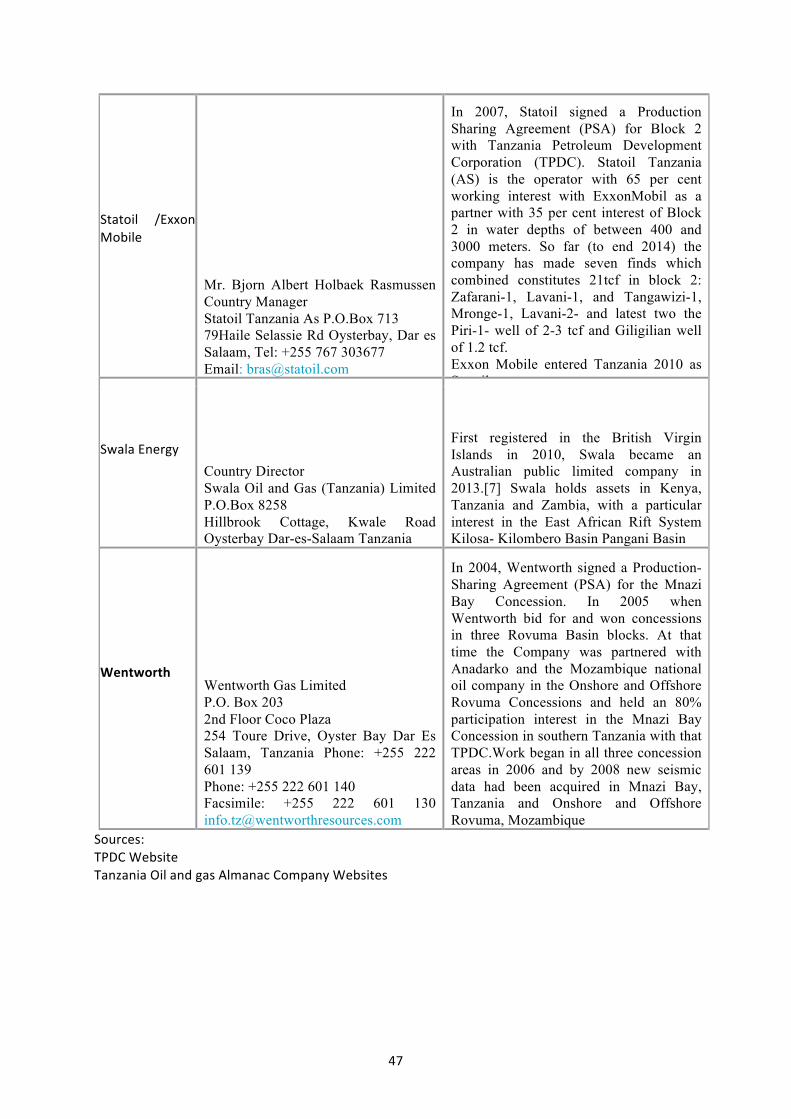
47
Statoil /ExxonMobile
Mr. Bjorn Albert Holbaek Rasmussen Country Manager Statoil Tanzania As P.O.Box 713 79Haile Selassie Rd Oysterbay, Dar es Salaam, Tel: +255 767 303677 Email: [email protected]
In 2007, Statoil signed a Production Sharing Agreement (PSA) for Block 2 with Tanzania Petroleum Development Corporation (TPDC). Statoil Tanzania (AS) is the operator with 65 per cent working interest with ExxonMobil as a partner with 35 per cent interest of Block 2 in water depths of between 400 and 3000 meters. So far (to end 2014) the company has made seven finds which combined constitutes 21tcf in block 2: Zafarani-1, Lavani-1, and Tangawizi-1, Mronge-1, Lavani-2- and latest two the Piri-1- well of 2-3 tcf and Giligilian well of 1.2 tcf. Exxon Mobile entered Tanzania 2010 as Statoil partner.
SwalaEnergy
Country Director Swala Oil and Gas (Tanzania) Limited P.O.Box 8258 Hillbrook Cottage, Kwale Road Oysterbay Dar-es-Salaam Tanzania
First registered in the British Virgin Islands in 2010, Swala became an Australian public limited company in 2013.[7] Swala holds assets in Kenya, Tanzania and Zambia, with a particular interest in the East African Rift System Kilosa- Kilombero Basin Pangani Basin
Wentworth
Wentworth Gas Limited P.O. Box 203 2nd Floor Coco Plaza 254 Toure Drive, Oyster Bay Dar Es Salaam, Tanzania Phone: +255 222 601 139 Phone: +255 222 601 140 Facsimile: +255 222 601 130 [email protected]
In 2004, Wentworth signed a Production-Sharing Agreement (PSA) for the Mnazi Bay Concession. In 2005 when Wentworth bid for and won concessions in three Rovuma Basin blocks. At that time the Company was partnered with Anadarko and the Mozambique national oil company in the Onshore and Offshore Rovuma Concessions and held an 80% participation interest in the Mnazi Bay Concession in southern Tanzania with that TPDC.Work began in all three concession areas in 2006 and by 2008 new seismic data had been acquired in Mnazi Bay, Tanzania and Onshore and Offshore Rovuma, Mozambique
Sources:TPDCWebsiteTanzaniaOilandgasAlmanacCompanyWebsites
48
Annex 2: UN Fundamental Principles of official statistics Principle 1: Official statistics provide an indispensable element in the information system of ademocratic society, serving the Government, the economy and the public with data about theeconomic,demographic,socialandenvironmentalsituation.Tothisend,officialstatisticsthatmeetthe test of practical utility are tobe compiled andmadeavailableon an impartial basis byofficialstatisticalagenciestohonorcitizens'entitlementtopublicinformation.Principle 2: To retain trust inofficial statistics, the statistical agenciesneed todecide according tostrictly professional considerations, including scientific principles and professional ethics, on themethodsandproceduresforthecollection,processing,storageandpresentationofstatisticaldata.Principle3:To facilitatea correct interpretationof thedata, the statisticalagenciesare topresentinformation according to scientific standards on the sources, methods and procedures of thestatistics.Principle4:Thestatisticalagenciesareentitledtocommentonerroneousinterpretationandmisuseofstatistics.Principle5:Dataforstatisticalpurposesmaybedrawnfromalltypesofsources,betheystatisticalsurveysoradministrativerecords.Statisticalagenciesaretochoosethesourcewithregardtoquality,timeliness,costsandtheburdenonrespondents.Principle6: Individualdatacollectedbystatisticalagenciesforstatisticalcompilation,whethertheyrefer to natural or legal persons, are to be strictly confidential and used exclusively for statisticalpurposes.Principle7:Thelaws,regulationsandmeasuresunderwhichthestatisticalsystemsoperatearetobemadepublic.Principle 8: Coordination among statistical agencies within countries is essential to achieveconsistencyandefficiencyinthestatisticalsystem.Principle9:Theusebystatisticalagencies ineachcountryof international concepts, classificationsandmethodspromotestheconsistencyandefficiencyofstatisticalsystemsatallofficiallevels.Principle 10: Bilateral andmultilateral cooperation in statistics contributes to the improvement ofsystemsofofficialstatisticsinallcountries.1.16Importanceofdevelopingenergystatisticsasofficialstatistics.Energyisanecessary.

49
Annex 3: Some Useful International Databases Source Variables Coverage,Frequency,andMost
RecentAvailable
GOVERNANCE
Afrobarometer(AFR)http://afrobarometer.org/data
PublicattitudesurveysondemocracyandgovernanceinAfrica
Morethan35countries,periodicrounds,latest2015
QOGfromtheQualityOfGovernmentInstitute,Gothenburghttp://qog.pol.gu.se/data
QoGStandardDataQoGOECDDataQoGExpertSurveyDatastructureandbehaviorofpublicadministrationQoGEURegionalDatathreelevelsofEuropeanregiongovernanceQoGEQIDatanovelsurveydataoncorruptionandgovernance
QoGStandardData2500variables100datasourcesQoGOECDData1300variablesfrom75datasources.QoGExpertSurveyDatacovers159countries.QoGEURegionalData450variablesQoGEQIData207regionswithintheEU
GlobalIntegrityIndex.AfricaIntegrityIndicatorshttp://aii.globalintegrity.org/scores-map?stringId=transparency_accountability&year=2016
114indicatorsdividedbetweentwomaincategoriesTransparencyandAccountability,SocialDevelopment
54countries,everytwoyears,2012-2015
ECONOMY
EconomistIntelligenceUnit(EIU)http://country.eiu.com/tanzania
CountryAnalysisPoliticalanalysisRiskAnalysisIndustryanalysis
205countries,updatesandforecastsExtensivesubscriptionservicesFreesubscriptiongiveslimitedfreedata,graphsandprojectionsTrialspossible
GlobalCompetitivenessReportDownloadspagehttp://reports.weforum.org/global-competitiveness-index/downloads/
114indicators.MaingroupsInstitutions,infrastructure,macroeconomicenvironment,health,education,andtraining,marketefficiency,technology,marketsize,businesssophisticationandinnovation
TheGlobalCompetitivenessReport2016-2017assessesthecompetitivenesslandscapeof138economies.
IMF,IFShttp://data.imf.org/?sk=5DABAFF2-C5AD-4D27-A175-1253419C02D1
ExchangeratesbycountryExternalsectorcurrent,financialaccountandinternationalinvestmentpositionbycountry
WorldBank Theopendatawebsitepointsto 243databases

50
Storesawidevarietyofdata.BestaccessprobablydirectlytotheWorldBankOpenDatawebsitehttp://datacatalog.worldbank.org/
243datasites.Acatalogueisdownloadable.NotalldatasetswillhavedataforTanzania.
UNCTADDatacenter http://unctadstat.unctad.org/wds/ReportFolders/reportFolders.aspx?sCS_ChosenLang=en
Internationaltrade,goodsandservicesEconomictrendsForeignDirectinvestmentExternalFinancialresourcesPopulationandLabourforceCommoditiesInformationEconomyCreativeEconomyMaritimetransport
150timeseriescoveringawiderangeoftopics.Builtuponcommonrulesandharmonizedproductionprocesses.Mosttimeseriescoverlongperiodsforcountriesaswellassome150analyticalcountrygroupings
UNCTADCountryprofileshttp://unctadstat.unctad.org/CountryProfile/en-GB/index.html
Keyeconomicstatisticsbycountry.Internationalindicatorsforcountrycomparisons.MostoftheselectedindicatorsareavailableinDataCenter
ILOStatisticsstartpagehttp://www.ilo.org/ilostat/faces/home/statisticaldata/new_link_10?_afrLoop=98521372783041#!%40%40%3F_afrLoop%3D98521372783041%26_adf.ctrl-state%3D13tgs0kj62_699Databasehttp://www.ilo.org/ilostat/faces/help_home/data_by_subject?_adf.ctrl-state=13tgs0kj62_154&_afrLoop=98317251898442#!
PopulationsandlabourforceEmploymentPublicsectoremploymentUnemploymentandlabourunderutilizationWokingtimeEarningsLabourcostConsumerprcesOccupationalhealthandsafetyIndustrialrelationsLabourproductivityWorkingpoorInformalsectorandinformalemployment
Thedatabaseforyear2015Includes193countries.Estimatesforreferenceperiod1990-2014Projectionsfor2015-2050
COMTRADEhttps://comtrade.un.org/
Repositoryofofficialinternationaltradestatisticsandrelevantanalyticaltables.AlldataalsoaccessiblethroughApplicationprogrammingInterface(API)API
TheUNCOMTRADEisthelargestdepositoryofinternationaltradedata.Itcontainswellover1.7billiondatarecordsfor45yearsandisavailableontheinternet!AccessisfreebutCOMTRADEmaychargeforexceptionallybigdownloads.
INDUSTRY
EITI Countrydataandreportson 56countries

51
https://eiti.org/data Extractiveindustries:Production,RevenuesTaxandlegalframeworks
ABarrelfullhttp://abarrelfull.wikidot.com/oil-and-gas-field-database
OilandgasfieldsOilandgaspipelinesOilrefineries
Databaseonoilandgasfields.Underconstructionbutpartlyuseful.
IEAhttps://www.iea.org/statistics/
EnergybalanceflowchartsEnergyatlasservesmaps/graphsonEmissions,coal,electricity,energybalance,energyindicators,naturalgas,oilandrenewables.Countrybalancepagesdisplaybalanceincludingcoal,oilandoilproducts,hydroelectricity,geothermal,biofuelsandnaturalgasfrom1990to2014
Coverageforanextensiverangeofenergyinformation(includingNaturalgas)forIEAs29membercountries.Alsogoodcoverageforthe102nonmembercountriese.g.Tanzania.ExtensivedatafreeofchargebutIEAalsochargeforsomedatabasesandpublications.
USGShttps://www.usgs.gov/products/data-and-tools/overview
Alargenumberofstatisticalseriesandstudyreportsonmainlygeologicaltopics.Anintegrateddatafinderprovidesaccesstodatawhichislargelyfreeofcharge.
USgovernmentwebsite.USGSisalsoactiveworldwideandcoversallcountriesasegTanzania
SOCIAL
LivingStandardsMeasurementStudy(LSMS)WorldBankwww.worldbank.org/lsmsDirecttodataforTanzania:http://econ.worldbank.org/WBSITE/EXTERNAL/EXTDEC/EXTRESEARCH/EXTLSMS/0,,contentMDK:21485765~menuPK:4196952~pagePK:64168445~piPK:64168309~theSitePK:3358997~isCURL:Y,00.html#Tanzania___NationalClickASDforsurveydocumentation
Widerangeofhouseholddata.Surveydocumentationcontainscompletelisting.Accesstodatafreebutrequiresfillingapplicationformwithfullinformationonuseridentity,purposeetc.
Datafor1993,2008-09,2010-11and2012-13.RegionaldataalsoforKagera1991-94,2004and2010.SourceNBS
TheDHSprogram,USAIDhttp://dhsprogram.com/data/available-datasets.cfm
DemographicandHealthSurveysincludingantenatalcare,childrenhealth,familyplanning,.Accesstodatarequiresregistrationandlogin.
ForTanzania12datasetsareavailableforyearsfrom1991-92to2014-15.SourceNBS
RANKINGS
CingranelliRichardsHumanRightsDatabase(HUM)
Quantitativeinformationon15internationallyrecognizedhuman
202countries,annual,1981-2011
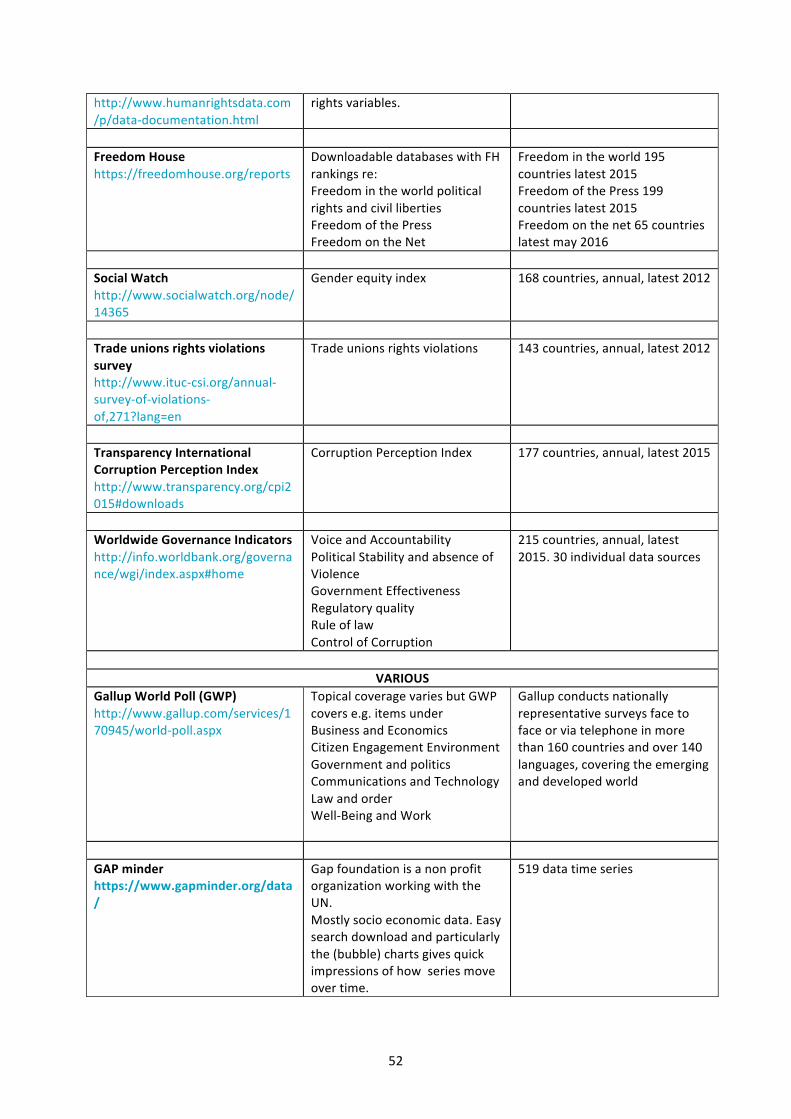
52
http://www.humanrightsdata.com/p/data-documentation.html
rightsvariables.
FreedomHousehttps://freedomhouse.org/reports
DownloadabledatabaseswithFHrankingsre:FreedomintheworldpoliticalrightsandcivillibertiesFreedomofthePressFreedomontheNet
Freedomintheworld195countrieslatest2015FreedomofthePress199countrieslatest2015Freedomonthenet65countrieslatestmay2016
SocialWatchhttp://www.socialwatch.org/node/14365
Genderequityindex 168countries,annual,latest2012
Tradeunionsrightsviolationssurveyhttp://www.ituc-csi.org/annual-survey-of-violations-of,271?lang=en
Tradeunionsrightsviolations 143countries,annual,latest2012
TransparencyInternationalCorruptionPerceptionIndexhttp://www.transparency.org/cpi2015#downloads
CorruptionPerceptionIndex 177countries,annual,latest2015
WorldwideGovernanceIndicatorshttp://info.worldbank.org/governance/wgi/index.aspx#home
VoiceandAccountabilityPoliticalStabilityandabsenceofViolenceGovernmentEffectivenessRegulatoryqualityRuleoflawControlofCorruption
215countries,annual,latest2015.30individualdatasources
VARIOUS
GallupWorldPoll(GWP)http://www.gallup.com/services/170945/world-poll.aspx
TopicalcoveragevariesbutGWPcoverse.g.itemsunderBusinessandEconomicsCitizenEngagementEnvironmentGovernmentandpoliticsCommunicationsandTechnologyLawandorderWell-BeingandWork
Gallupconductsnationallyrepresentativesurveysfacetofaceorviatelephoneinmorethan160countriesandover140languages,coveringtheemerginganddevelopedworld
GAPminderhttps://www.gapminder.org/data/
GapfoundationisanonprofitorganizationworkingwiththeUN.Mostlysocioeconomicdata.Easysearchdownloadandparticularlythe(bubble)chartsgivesquickimpressionsofhowseriesmoveovertime.
519datatimeseries
6 P O L I C Y M A K I N G I N T H E TA N Z A N I A N P E T R O S TAT E
ISSN 0804-3639 (print) ISSN 1890-5048 (PDF) ISBN 978-82-8062-641-7 (print) ISBN 978-82-8062-642-4 (PDF)
This paper deals with needs and availability of data, statistics and information in Tanzania. It relates to a five-year (2014–19) research programme on prospects and challenges for the petroleum sector.
The main objectives are a. to present a brief analysis based on data which is accessible at present
and b. to sketch a structure for the Tanzania Petro Data Hub (http://data.
tanpetstate.org).
This Working Paper is an output from Tanzania as a future petrostate: Prospects and challenges, a five-year (2014–19) institutional collaborative programme for research, capacity building, and policy dialogue. It is jointly implemented by REPOA and CMI, in collaboration with the National Bureau of Statistics. The programme is funded by the Norwegian Embassy, Dar es Salaam.
Related Documents