A Project Report on “WORKING CAPITAL MANAGEMENT” At Submitted in the partial fulfillment of the requirements of Post Graduate Diploma in Management At Indus Business Academy, Bangalore Under the guidance of Dr. Ramesh. S Mr. Niranjan Nanda Mentor Senior Manager (Finance) Indus Business Academy NALCO Bangalore-560062 Bhubaneswar-751001 Submitted By Shubhransu Kumar Patel (FPB1214/137)

Working Capital Management at NALCO
Oct 23, 2015
This report is made for education purpose
Welcome message from author
This document is posted to help you gain knowledge. Please leave a comment to let me know what you think about it! Share it to your friends and learn new things together.
Transcript

A
Project Report on
“WORKING CAPITAL MANAGEMENT”
At
Submitted in the partial fulfillment of the requirements of
Post Graduate Diploma in Management
At
Indus Business Academy, Bangalore
Under the guidance of
Dr. Ramesh. S Mr. Niranjan Nanda
Mentor Senior Manager (Finance)
Indus Business Academy NALCO
Bangalore-560062 Bhubaneswar-751001
Submitted By
Shubhransu Kumar Patel (FPB1214/137)

Project report on working capital management at NALCO
Indus Business Academy, Bangalore Page 2
Director’s Certificate
This is to certify that Mr. Shubhransu Kumar Patel is a bonafied student of
Indus Business Academy, Bangalore and is presently pursuing his Post Graduate
Diploma in Management.
Under my guidance he has submitted his Project titled “Working Capital
Management” at National Aluminium Company Limited in partial fulfillment of the
requirement during the Post Graduate Diploma in Management.
This project has not been previously submitted as part of another degree or
diploma of another Business School or University.
Dr. Subhash Sharma (Dean)
Indus Business Academy
Lakshmipura, Thataguni Post,
Kanakapura Main Road,
Bangalore-560062
Tel: +91-80-28435931/2/3/4
Fax: +91-80-28435935
Email: [email protected]
URL: www.ibainternational.org
Project report on working capital management at NALCO
Indus Business Academy, Bangalore Page 3
Guide’s Certificate
This is to certify that the project entitled “Working Capital Management” at
National Aluminium Company Limited (NALCO) Corporate Office; Bhubaneswar has
been carried out by Mr. Shubhransu Kumar Patel from 05th Aug 2013 to 14th Oct
2013, under my Supervision in partial fulfillment of the requirement for the Post
Graduate Diploma in Management at Indus Business Academy, Bangalore. I am
satisfied with his sincere performance and study.
I wish his all success in life.
Mr. Niranjan Nanda
Sr. Manager (Finance)/Project Guide
National Aluminium Company Limited
Bhubaneswar

Project report on working capital management at NALCO
Indus Business Academy, Bangalore Page 4
Mentor’s Certificate
This is to certify that Mr. Shubhransu Kumar Patel is a bonafied student of
Indus Business Academy, Bangalore and is presently pursuing his Post Graduate
Diploma in Management.
Under my guidance he has submitted his project titled “Working Capital
Management” at National Aluminium Company Limited in partial fulfillment of the
requirement during the Post Graduate Diploma in Management.
This paper has not been previously submitted as part of another degree or
diploma of another Business School or University.
Dr. Ramesh. S (Mentor)
Indus Business Academy
Lakshmipura, Thataguni Post,
Kanakapura Main Road,
Bangalore-560062
Tel: +91-80-28435931/2/3/4
Fax: +91-80-28435935
Email:[email protected]
URL:-www.ibainternational.org

Project report on working capital management at NALCO
Indus Business Academy, Bangalore Page 5
Declaration
I Mr. Shubhransu Kumar Patel the undersigned, a student of Indus Business
Academy, Bangalore, declare that this project report titled “Working Capital
Management” in partial fulfillment of the requirement for the Summer Internship
Program during the Post-Graduation Diploma in Management.
This work has not been previously submitted by me as a part of any other
degree or diploma of another school or University.
Shubhransu Kumar Patel
FPB1214/137
PGDM 2012-2014
Indus Business Academy
Lakshmipura, Thataguni Post,
Kanakpura Main Road,
Bangalore- 560062

Project report on working capital management at NALCO
Indus Business Academy, Bangalore Page 6
Acknowledgement
I take this opportunity to thank my college, Indus Business Academy, Bangalore
and Mr. Manish Jain (CEO) for giving me a chance to do a summer internship project,
adding the experience of practical knowledge so important to understand and to try and
bridge the gap between theoretical and practical knowledge.
I also express my sincere gratitude to Dr. Subhash Sharma, Director, Indus
Business Academy and Dr. Ramesh. S Faculty of Indus Business Academy for their
valuable inputs.
I am thankful to “National Aluminium Company Limited” for giving me an
opportunity to undertake a project on “Working Capital Management” and also for
providing me all the information required.
I express my gratitude to Mr. Niranjan Nanda, Senior Manager (Finance) at to
National Aluminium Company Limited, who through his vast experience and knowledge
has been able to guide me, both ably and successfully towards the completion of my
summer internship project.
I am sincerely grateful for the assistance of several individuals, who have
contributed towards fulfillment of this report. The knowledge, experience, guidance and
the most important factors – support from these people are indeed valuable.
Shubhransu Kumar Patel
Indus Business Academy,
Bangalore
Project report on working capital management at NALCO
Indus Business Academy, Bangalore Page 7
Table of Contents:
Director’s Certificate................................................................................................................ 2
Guide’s Certificate ................................................................................................................... 3
Mentor’s Certificate ................................................................................................................. 4
Declaration ............................................................................................................................... 5
Acknowledgement ................................................................................................................... 6
Executive Summary: ............................................................................................................... 9
Introduction: ........................................................................................................................... 10
Definition of Working Capital: .......................................................................................... 10
Important things about Working Capital: ....................................................................... 11
Importance of Working Capital ........................................................................................ 11
Concept of Working Capital: ............................................................................................ 12
Operating Cycle Concept of Working Capital: .............................................................. 11
Importance of Cash flow Management in Working Capital Management: ............... 15
Consequences of Under Assessment of Working Capital: ......................................... 16
Consequences of Over Assessment of Working Capital: ........................................... 16
Industry Profile ....................................................................................................................... 17
History: ................................................................................................................................ 17
Introduction: ....................................................................................................................... 18
Major producing countries: .............................................................................................. 19
Major Consuming Countries: ........................................................................................... 19
Top Aluminum Companies in India: ............................................................................... 20
Porter's Five Force Model Analysis: ............................................................................... 23
Company Profile .................................................................................................................... 25
NALCO: ............................................................................................................................... 25
Vision: ................................................................................................................................. 25
Mission: ............................................................................................................................... 25
Achievements: ................................................................................................................... 26
Organizational Structure: ................................................................................................. 27
General Information about NALCO: ............................................................................... 28
Balance Sheet as on 31.3.2013: ..................................................................................... 29
Statement of Profit and Loss account as on 31.3.2013: ............................................. 30

Project report on working capital management at NALCO
Indus Business Academy, Bangalore Page 8
Last Five Year Performance of NALCO: ....................................................................... 31
Comparisons of NALCO with Hindalco: ......................................................................... 32
Projects under Planning: .................................................................................................. 33
Brownfield Projects: ...................................................................................................... 33
Vertical Integration Projects: ........................................................................................ 33
Diversification Projects (Power): ................................................................................. 34
Diversification Projects (Other): .................................................................................. 34
Greenfield Projects: ...................................................................................................... 35
SWOT Analysis: ................................................................................................................ 36
Analysis and Interpretation: ................................................................................................. 38
Objective of the Study: ..................................................................................................... 38
Ratio Analysis: ................................................................................................................... 38
Role of Ratio Analysis: ..................................................................................................... 38
Financial ratio analysis: .................................................................................................... 39
Liquidity Ratios: ............................................................................................................. 39
Activity or Efficiency Ratio: .......................................................................................... 44
Profitability Ratio: .......................................................................................................... 49
Findings: ................................................................................................................................. 53
Suggestions: .......................................................................................................................... 53
Conclusion: ............................................................................................................................. 54
Bibliography: .......................................................................................................................... 55

Project report on working capital management at NALCO
Indus Business Academy, Bangalore Page 9
Executive Summary:
Cash is the life line of a company understanding a company’s cash flow is
essential for making essential decisions. A good way to judge a company’s cash flow
prospects is to look at its Working Capital Management. Working capital is also
known as operational capital. It represents the day to day liquidity available to a
business. The goal of working capital management is to ensure that a firm is able to
continue its operations and has sufficient ability to satisfy both maturing short term
debt and upcoming operational expenses.
Every start up business need funds for two purposes for its establishment and
for its day to day operations but the success of that business entirely depends on the
proper management of the day-today finance and the management of this short term
capital of the business is called Working Capital Management.
Working Capital is the money used to pay for the everyday trading activities
carried out by the business- stationary needs, staff salaries and wages, rent, energy
bills, payments for suppliers and so on.
This report is showing the financial performance of company through ratio
analysis related to working capital management.

Project report on working capital management at NALCO
Indus Business Academy, Bangalore Page 10
Introduction:
Definition of Working Capital:
“Working capital is an excess of current assets over current liabilities. In other
words, the amount of current assets which is more than current liabilities is known as
Working Capital. If current liabilities are nil then, working capital will equal to current
assets. Working capital shows strength of business in short period of time. If a
company have some amount in the form of working capital, it means Company have
liquid assets, with this money company can face every crises position in market."
Formula of Calculating Working Capital
Working Capital = Current Assets - Current Liabilities
Current Assets
Current assets are those assets which can be converted into cash within One
year or less than one year. Current assets include cash, bank, debtors, bill
receivables, prepaid expenses, outstanding incomes.
Current Liabilities
Current Liabilities are those liabilities which can be paid to respective parties
within one year or less than one year at their maturity. Current liabilities include
creditors, outstanding bills, bank overdraft, bills payable and short term loans,
outstanding expenses, advance income.
Other names of Working Capital
Some Professional accountants know working capital as operating capital,
operating liquidity, positive working capital.

Project report on working capital management at NALCO
Indus Business Academy, Bangalore Page 11
Important things about Working Capital:
1. Working Capital can be negative. At that time, we add one word “deficiency" in the
back of working capital. It means if Current Liabilities are more than current assets, it
is known as working capital deficiency or inverse working capital or negative working
capital.
2. Working capital can be easily adjusted, if Accounts manager knows different
techniques of managing working capital. He can try to get short term loan or he can
increase working capital by proper management of inventory and outstanding
incomes and debtors.
3. Working capital can also change by Changing in Cash Conversion period. Cash
conversion period is a period in which company changes current assets into cash or
bank.
4. Working capital can also positive by increasing growth rate of company. If
company does not invest more money and increase profit, the same amount will
increase in the cash position of company and with cash company can increase their
working capital position.
Importance of Working Capital
Some times, if creditors demand their money from company, at that time
company's high working capital saves company from that situation. You know that
selling of current assets is easy in small period of time but Company cannot sell their
fixed assets with in small period of time. So, if Company has sufficient working
capital, Company can easily pay off the creditors and create his reputation in market.
But if a company has zero working capital and then company cannot pay creditors in
emergency time and either company becomes bankrupt or takes loan at higher rate
of Interest. In both condition, it is very dangerous and always Company's Account
Manager tries to keep some amount of working capital for creating goodwill in
market.

Project report on working capital management at NALCO
Indus Business Academy, Bangalore Page 12
Positive working capital also enables to pay day to day expenses like wages,
salaries, overheads and other operating expenses. Because sufficient working capital
can not only pay maturity liabilities but also outstanding liabilities without any more
delay.
One of the advantage of positive working capital that Company can do every risky
work without any tension of self-security.
Concept of Working Capital:
1. Gross Working Capital
In this concept of working capital, we study gross working capital. We do not deduct
current liabilities in this concept but we use current liabilities as source of fund.
Suppose, if we buy goods on credit, it means we save our cash and we can use this
as working capital for paying other expenses.
2. Net Working Capital
Under this concept we use net working capital. For this, we first deduct all our current
liabilities from our current assets. Excess of current assets over current liabilities will
be current assets. We have to maintain minimum level of working capital in our
business for operation of business activities. This concept is also used for
preparation of balance sheet. In the vertical form of balance sheet, we show excess
of current assets over current liabilities.
Operating Cycle Concept of Working Capital:
In this concept of working capital, we make the operating cycle. In this cycle,
we calculate inventory conversion period. To know this, we can estimate when we
need cash for buying our inventory. We also calculate debtor or receivable
conversion period. To know this, we can estimate when we receive cash from our
debtors.
If inventory conversion period is less than debtor conversion period, we have
to manage other sources for buying our inventories. If we buy good on credit, we also
take care creditors' conversion period.

Project report on working capital management at NALCO
Indus Business Academy, Bangalore Page 13
(Operation cycle of Working Capital Management)

Project report on working capital management at NALCO
Indus Business Academy, Bangalore Page 14
Factors affecting Working Capital Management:
The working capital needs of a business are influenced by numerous factors.
The important parts are discussed in brief as given below:
Nature of Enterprise
The nature and the working capital requirements of an enterprise are interlinked.
While a manufacturing industry has a long cycle of operation of the working capital,
the same would be short in an enterprise involved in providing services. The required
amount is also varies as per the nature; an enterprise involved in production would
require more working capital than a service sector enterprise.
Manufacturing/Production Policy
Each enterprise in the manufacturing sector has its own production policy, some
follow the policy of uniform production even if the demand varies from time to time,
and others may follow the principle of 'demand-based production' in which production
is based on the demand during that particular phase of time. Accordingly, the working
capital requirements vary for both of them.
Operations
The requirement of working capital fluctuates for seasonal business. The working
capital needs of such businesses may increase considerably during the busy season
and decrease during the slack season. Ice creams and cold drinks have a great
demand during summer, while in winter the sales are negligible.
Market Condition
If there is high competition in the chosen product category, then one shall need to
offer shops like credit, immediate delivery of goods etc. for which the working capital
requirement will be high. Otherwise, if there is no competition or less competition in
the market then the working capital requirements will be low.
Availability of Raw Material
If raw material is readily available then one need not maintain a large stock of the
same, thereby reducing the working capital investment in raw material stock. On the

Project report on working capital management at NALCO
Indus Business Academy, Bangalore Page 15
other hand, if raw material is not readily available then a large inventory/stock needs
to be maintained, thereby calling for substantial investment in the same.
Growth and Expansion
Growth and expansion in the volume of business results is enhancement of the
working capital requirement. As business grows and expands, it needs a larger
amount of working capital. Normally, the need for increased working capital funds
precedes growth in business activities.
Price Level Changes
Generally, rising price level requires a higher investment in the working capital. With
increasing prices, the same level of current assets needs enhanced investment.
Manufacturing Cycle
The manufacturing cycle starts with the purchase of raw material and is completed
with the production of finished goods. If the manufacturing cycle involves a longer
period, the need for working capital would be more.
Importance of Cash flow Management in Working
Capital Management:
A company with healthy operating cash flow is in a position to plough this cash into
its projects/working capital projects/working capital cycle.. It can thus grow at a
steady pace, compared to the companies that mostly rely on external sources to fund
their growth. This was on display during the credit crisis last year, which put the
future of companies with poor cash flows in doubt.
It may be possible that company reports very good earnings but it may not be
generating sufficient cash. Cash flow can be negative while profitability is positive.
Income statement and cash flow statement should be analyzed to assess the
operational efficiency of the company.

Project report on working capital management at NALCO
Indus Business Academy, Bangalore Page 16
Consequences of Under Assessment of Working
Capital:
Growth may be stunted. It may become difficult for the enterprise to
undertake profitable projects due to non-availability of working capital.
Implementation of operating plans may become difficult and consequently the
profit goals may not be achieved.
Cash crisis may emerge due to paucity of working funds.
Optimum capacity utilization of fixed assets may not be achieved due
to non-availability of the working capital.
The business may fail to honors its commitment in time, thereby adversely
affecting its credibility. This situation may lead to business closure.
The business may be compelled to buy raw materials on credit and sell
finished goods on cash. In the process it may end up with increasing cost of
purchases and reducing selling prices by offering discounts. Both these
situations would affect profitability adversely.
Non-availability of stocks due to non-availability of funds may result in
production stoppage.
While underassessment of working capital has disastrous implications on
business, over assessment of working capital also has its own danger.
Consequences of Over Assessment of Working
Capital:
Excess of working capital may result in unnecessary accumulation of
inventories.
It may lead to offer too liberal credit terms to buyers and very poor recovery
system and cash management.
It may make management complacent leading to its inefficiency.
Over-investment in working capital makes capital less productive and may
reduce return on investment.
Working capital is very essential for success of a business and, therefore,
Need efficient management and control. Each of the components of the
working capital needs proper management to optimize the profit.

Project report on working capital management at NALCO
Indus Business Academy, Bangalore Page 17
Industry Profile
History:
Indian Aluminium Industry was first established in the year 1808 and it took
almost 46 years to make its production commercially viable. The research work of the
country took several years and resulted in extracting the Aluminium from the ore. On
earth Aluminium is third most available element constituting almost 7.3% by mass.
Currently Aluminium is also the second most used metal in the world after steel. Due
to the fact that consistent growth of Indian economy at a rate of 8%, the demand for
metals, used for various sectors, is also on the higher side. As a result, the Indian
Aluminium Industry is also growing consistently as in the year 2009 the aluminium
industry in India saw a growth of about 9%.
In the year 1938 the production of Aluminium started in India when the
Aluminum Corporation of India's plant was commissioned. The plant was set up with
a financial and technical collaboration with Alcan, Canada which had a capacity of
producing 2,500 tons per annum. In the year 1959 the Hindustan Aluminum
Corporation (Hindalco) was set up; which had a capacity of producing 20,000 tons
per annum. A public sector enterprise Malco which had a capacity of 10,000 tons per
annum was commissioned in 1965. Then later in the year 1987, National Aluminium
Company (NALCO) was commissioned to produce Aluminium with a capacity of
producing 0.218 million tons.
Indian Aluminium Industry Government started regulating and controlling
during the 1970's. Restrictions in entry and price distribution controls were common
in the Aluminium Industry. Aluminium Control Order has been implemented where
the aluminium producers had to sell 50% of their products for electrical usages in the
country. Later in 1989, the order was removed as the government decontrolling was
revoked. In the year 1991 with de-licensing of industry, the liberal import of
technologies and capital goods was started. The liberalization resulted in a growth
rate of 12% of the industry, comparing to the growth rate of 6% during the 1980.

Project report on working capital management at NALCO
Indus Business Academy, Bangalore Page 18
Introduction:
India was the second largest consumer of aluminium in Asia during the year
2012, with the electrical sector being the main driver of demand. As the largest
producer of aluminium in India, we are well positioned to cater to its growing demand
for aluminium.
In addition to the electrical sector, the automotive and construction sectors also
contribute a major share for the aluminium market in India. As per forecast, the
primary aluminium demand in India is expected to reach 6 million tonnes by 2025,
which equates to about 4.1kg of per capita aluminium consumption in 2025.
When compared to the current per capita aluminium
consumption of around 1.5 kg and aluminium
demand of 1.8 million tonnes, this underscores the
immense potential for demand growth in India.
Aluminium continues to outpace other base metals
in 2012-13, despite softer demand according to a
study. However the Indian aluminium industry would be affected by probable slower
Chinese growth in the years to come.

Project report on working capital management at NALCO
Indus Business Academy, Bangalore Page 19
Major producing countries:
Major Consuming Countries:

Project report on working capital management at NALCO
Indus Business Academy, Bangalore Page 20
Top Aluminum Companies in India:
Aluminum industry is one of the highly concentrated industry in India and the
top five companies in this sector offers a great share towards the production of the
country. With the increasing demand for aluminum in India, the top players in this
sector are also growing at a faster pace. The fact is that production of Aluminum in
India has presently outpaced the demand for aluminum in the country.
India holds second place in aluminum production after China and the country
has a competence of producing 3.95 million tons, which is nearly 8% of the total
aluminum production all over the world. The names of top players in the aluminum
industry in India are given below:
Top players in Aluminum Industry in India:
• HINDALCO
• Sterlite Industries
• NALCO
• BALCO
• MALCO
• INDAL
• Kennametal India
• Hindustan Zinc
• Sujana Metal Products
Some of the details regarding these top players in the aluminum industry in
India are given in next page.

Project report on working capital management at NALCO
Indus Business Academy, Bangalore Page 21
HINDALCO:
HINDALCO has a market share of 39% in the aluminum industry in India and
this company is a flagship of Aditya Birla Group. They have their aluminum plant in
the state of Uttar Pradesh and they are dealing with different types of aluminum
products like foils, wheels, rolled products, extrusions and primary aluminum.
Sterlite Industries:
This company’s aluminum production comprises of MALCO and BALCO, who
are two giants in the aluminum industry in India. MALCO is a wholly integrated
producer of aluminum, while BALCO is partially integrated. Sterlite industries have a
market share of 32% in the Indian aluminum industry.
NALCO:
The Indian Government has a stake of 87.15% in this company and they have
their aluminum plant at Damanjodi, which is located in the state of Orissa. The
present production capacity of the company if 345000 tons of aluminum and to
increase it to 460000 tons, the company is concentrating on a capex programme.
BALCO:
Bharat Aluminum Company Limited came into existence in the year 1965 as a
public sector undertaking. Nearly 51% of the equity share of this company is held by
Stertile industries. This is an ISO 9001:2000 company with ownership over smelters,
refineries, captive power plants, captive bauxite mines and of course, aluminum
mines.
MALCO:
MALCO stands for Madras Aluminum Company and this company is a
subsidiary of Vedanta Resources. They have their power plant at Salem in Tamil
Nadu and they are engaged in different activities like mining, refining and smelting in
the aluminum industry.

Project report on working capital management at NALCO
Indus Business Academy, Bangalore Page 22
INDAL:
INDAL stands for Indian Aluminum Company Limited and they are now
merged with Hindalco Industries Limited, who is the top player in the aluminum
industry in India. INDAL is operating from the state of West Bengal.
Kennametal India:
Kennametal India came into existence in the year 1964 and their former name
was Widia India Limited. They are dealing with the manufacture of different products
like products made out of hard metals, machines for special purposes, forming, jigs
and fixtures, metal castings and mining tools in the aluminum industry in India.
Hindustan Zinc:
ZL and the company came into existence in the year 1966 as public sector
undertaking. In the year 2002, government of India disinvested its stock holding with
HZL and this company became a part of Sterlite industries.
Sujana Metal Products:
This company came into existence in the year 2000 and they are gaining
popularity as the largest manufacturer aluminum products in the whole of south India.
They are dealing with four major division’s namely international trade, TMT bars,
structural steels and tower manufacturing.
Thus, the aluminum sector is growing by every means in India and this sector
is also contributing to the development of the country through offering employment
opportunities to a number of deserving people.

Project report on working capital management at NALCO
Indus Business Academy, Bangalore Page 23
Porter's Five Force Model Analysis:
Threat of New Entry:
Time and cost of entry
Specialist in Knowledge
Economies of Scale
Cost Advantages
Technology Perfection
Barriers to Entry
Porter's Five Force
Model
Threat of New Entry
Buyer Power
Threat of Substitution
Supplier Power
Competitive Rivalry

Project report on working capital management at NALCO
Indus Business Academy, Bangalore Page 24
Buyer Power:
Number of customer
Size of each order
Differences between competitors
Price sensitivity
Ability to substitute
Threat of Substitution:
Substitute performance
Cost of change
Supplier Power:
Number of suppliers
Size of suppliers
Uniqueness of service
Your ability to substitute
Cost of changing
Competitive Rivalry:
Number of competitors
Quality differences
Customer’s loyalty

Project report on working capital management at NALCO
Indus Business Academy, Bangalore Page 25
Company Profile
NALCO:
Incorporated in 1981, as a public sector enterprise of the Government of India
National Aluminium Company Limited (Nalco) is Asia's largest integrated aluminium
complex, encompassing bauxite mining, alumina refining, aluminium smelting and
casting, power generation, rail and port operations. Commissioned during 1985-87,
Nalco has emerged to be a star performer in production, export of alumina and
aluminium, and more significantly, in propelling a self-sustained growth.
Vision:
To be reputed global Company in the Metals and Energy Sectors.
Mission:
To continuously develop human resources, create safe working conditions,
improve productivity and quality and reduce cost and waste.
To be a good corporate citizen, protecting and enhancing the environment as
well as discharging social responsibility in order to ensure sustainable growth.
To intensify R&D for technology development.

Project report on working capital management at NALCO
Indus Business Academy, Bangalore Page 26
Achievements:
First Mines Safety Award-1988 by DGMS
Indira Priyadarshini Vrikshamitra (IPVM) Award-1994 from MOEF, Govt. of
India, for afforestation and wasteland development
Best Eco-friendly Factory Award 1994-95 to the Mines and Refinery Complex
by Orissa State Factory Inspectrate
State Award-1995 to Captive Power Plant from state Factory inspectorate for
Environment Management
FICCI Environment Award for Environment Conservation and Pollution
Control- 1996-97
WEC-IIEE-IAEWP Environment award -1997 for contributing towards
environment protection
Gem Granite Environment Award for -1997-98 by FIMI, New Delhi for Mines
Shri Sita Ram Rungta Memorial Social Awareness Award-1997-98 by FIMI,
New Delhi
Pollution Control Excellence Award - 1998 by Orissa State Pollution Control
Board for Mines
Special Commendation under Golden Peacock Environment Management
Award 1998 Scheme by World Environment Foundation
State Award for Best Occupational Health Centre to S&P Complex`-1998
Best Safety Performance Award to CPP by CII (ER)- 1999-2000
2nd Best Practice in Environment, Safety & Health in industries of Orissa
award by CII-ER to CPP -2006-07.
Best Environment Management Award to CPP for 2006-07.
Best Performance in Accident Prevention, Safety management &
communication System to CPP for 2006-07.
Pollution Control Excellent Award 2008 to Panchpatmali Bauxite Mines from
State Pollution Control Board, Bhubaneswar.
2nd Best Practice in Environment Management instituted by Confederation of
Indian Industry (CII) to Alumina Refinery for 2008-09.
Pollution Control Excellence Award 2009 by OSPCB to Alumina Refinery.

Project report on working capital management at NALCO
Indus Business Academy, Bangalore Page 27
Organizational Structure:
NALCO has an effective organizational structure Headed by Shri Ansuman
Das (Chairman cum Managing Director) along with seven full time and part time
official Directors, Eight Independent Directors (appointed by Govt. of India) and Eight
Executive Directors with total 7555 No. of Permanent Employees.
DIRECTOR
EXECUTIVE DIRECTOR
GENERAL MANAGER
D. GENERAL MANAGER
ASST. GENERAL MANAGER
SENIOR MANAGER
MANAGER
D. MANAGER
ASST. MANAGER
JUNIOR MANAGER
ASST. OFFICER

Project report on working capital management at NALCO
Indus Business Academy, Bangalore Page 28
General Information about NALCO:

Project report on working capital management at NALCO
Indus Business Academy, Bangalore Page 29
Balance Sheet as on 31.3.2013:

Project report on working capital management at NALCO
Indus Business Academy, Bangalore Page 30
Statement of Profit and Loss account as on 31.3.2013:

Project report on working capital management at NALCO
Indus Business Academy, Bangalore Page 31
Last Five Year Performance of NALCO:

Project report on working capital management at NALCO
Indus Business Academy, Bangalore Page 32
Comparisons of NALCO with Hindalco:
The major competitor of NALCO is Hindalco in Aluminium production in India.
…………….Rs in Cr……………..
Name Market Capital Sales Turnover Net Profit Total Assets
NALCO 8,272.94 6,916.48 592.83 11,932.45
Hindalco 23,521.13 26,056.93 1,699.20 58,117.16
The above table shows the comparative study of NALCO against its biggest rivalry
Hindalco in terms of aluminium production in India.
Above table indicates ₹8.57 profit against the sales of ₹100.00 each as compared to
Hindalco ₹6.52. Nalco is generating ₹2.02 more profit then Hindalco.
……………..Rs in Cr…………….
Name NALCO Hindalco
Mar '13 Mar '13
Sources Of Funds
Total Share Capital 1,288.62 191.48
Equity Share Capital 1,288.62 191.48
Share Application Money 0 541.31
Preference Share Capital 0 0
Reserves 10,643.83 33,239.60
Revaluation Reserves 0 0
Networth 11,932.45 33,972.39
Secured Loans 0 20,521.01
Unsecured Loans 0 3,623.76
Total Debt 0 24,144.77
Total Liabilities 11,932.45 58,117.16
This table shows the details related to companies Debt and Equity.
NALCO is having 672.98% more Share Capital of Hindalco, whereas Hindalco is
having 312.80% more Reserves of NALCO.
In terms of Debt NALCO has zero debt as compare to Hindalco ₹24,144.77 Cr.

Project report on working capital management at NALCO
Indus Business Academy, Bangalore Page 33
Projects under Planning:
Brownfield Projects:
Vertical Integration Projects:

Project report on working capital management at NALCO
Indus Business Academy, Bangalore Page 34
Diversification Projects (Power):
Diversification Projects (Other):

Project report on working capital management at NALCO
Indus Business Academy, Bangalore Page 35
Greenfield Projects:

Project report on working capital management at NALCO
Indus Business Academy, Bangalore Page 36
SWOT Analysis:
Strengths:
Nalco has achieved the “Zero Debt’ status. It has its own strong financial
resources. Due to effective implements of ‘state of the art’ technology its image in the
Global Market is excellent and in Indian Market it is the leader in Aluminum
market/sector.
The company has its own fully mechanized open cast mines along with its
own Aluminum plant. It has its own microprocessor-based burner at its own power
plant having automatic turbine run up system.
Skilled and committed manpower, good quality bauxite reserves, efficient
technology, efficient operations, production of quality alumina and aluminium
products at competitive cost, excellent customer service, prudential financial
management and sound corporate Governance practices in all facets of operations
are some of the key strengths of NALCO.
Weakness:
Due to present scenario of industrial development, there is an exodus of
experienced personnel from the company. The company work culture is poor due to
strong trade union activities and political interferences. Average age of workmen is
high which has becomes a hindrance of effective working.
Now a day’s coal supply has become a major problem for the company. As
the company is dependent upon imported coal is the major weakness. Exchange
rates are some of the weaknesses that continue to affect the profitability of the
company.

Project report on working capital management at NALCO
Indus Business Academy, Bangalore Page 37
Opportunities:
The company has commenced its project activities for the second phase
expansion and shall precede its own resources to a considered extent. The
availability of surplus Alumina with the company after 2nd phase expansion and the
sustaining demand for Alumina in the global market has put it in a demanding stage
and offers attractive opportunities for entering into creative business deals and for
participating in the JVS of overseas smelter.
The continuation of reform process focus on second generation liberalization
process and the ongoing globalization trend may bring ample opportunities for the
company in playing a key role in metal trading, hedging, tolling, capacity addition,
technology collaboration and in redefining new areas for application of its value
added rolled products and chemical business.
Threats:
Continuous rising of crude oil in global market, developments of fragmented
geopolitical scenario, slowdown in the economic activities across the global, possible
halt to the peace initiatives with neighboring countries, terrorism, reversal in global
economic scenario, hardening of interest rates, natural calamities, erratic monsoon,
poaching of its man power by competitors for their green field projects and levy of
anti-dumping duties on its raw material import are the major threats of NALCO.
Project report on working capital management at NALCO
Indus Business Academy, Bangalore Page 38
Analysis and Interpretation:
Objective of the Study:
To understand the practical aspects of working capital management.
To understand the role of ratios in working capital management.
To understand the day to day income and expenses of the organization.
Research Type:
This Research is purely based on Secondary Research.
Data Referred for Analysis:
Annual Reports of NALCO (Last 5 Years)
Ratio Analysis:
Ratio analysis is the powerful tool of financial statements analysis. A ratio is
define as “the indicated quotient of two mathematical expressions” and as “the
relationship between two or more things”. The absolute figures reported in the
financial statement do not provide meaningful understanding of the performance and
financial position of the firm. Ratio helps to summaries large quantities of financial
data and to make qualitative judgment of the firm’s financial performance.
Role of Ratio Analysis:
Ratio analysis helps to appraise the firms in the term of their profitability and
efficiency of performance, either individually or in relation to other firms in same
industry. Ratio analysis is one of the best possible technique available to manage for
impart the basic functions like planning and control. As future is closely related to the
immediately past, ratio calculated on the basis historical financial data may be of
good assistance to predict the future. E.g. On the basis of inventory turnover ratio or
debtor’s turnover ratio in the past, the level of inventory and debtors can be easily
ascertained for any given amount of sales. Similarly, the ratio analysis may be able to
locate the point out the various areas which need the management attention in order
to improve the situation. E.g. Current ratio which shows a constant decline trend may

Project report on working capital management at NALCO
Indus Business Academy, Bangalore Page 39
be indicate the need for further introduction of long term finance in order to increase
the liquidity position. As the ratio analysis is concerned with all the aspect of the
firm’s financial analysis liquidity, solvency, activity, profitability and overall
performance, it enables the interested persons to know the financial and operational
characteristics of an organization and take suitable decisions.
Financial ratio analysis:
Financial ratio analysis involves calculating certain standardized relationship
between figures appearing in the financial statements and then using those
relationships called ratios to analyze the business' financial position and financial
performance. Due to varying size of businesses different comparison of two
businesses is not possible. Certain techniques have to be applied in simplifying the
financial statements and making them comparable. These include financial ratio
analysis and common-size financial statements.
Ratios are divided into different categories such as liquidity ratios, Activity
ratio, profitability ratios, etc.
Liquidity Ratios:
Liquidity is the ability of a business to pay its current liabilities using its current
assets. Information about liquidity of a company is relevant to its creditors,
employees, banks, etc. current ratio, quick ratio, cash ratio and cash conversion
cycle are key measures of liquidity.
Current Ratio:
Current ratio is the ratio of current assets of a business to its current liabilities.
It is the most widely used test of liquidity of a business and measures the ability of a
business to repay its debts over the period of next 12 months.
Formula:
Current ratio is calculated using the following formula:
Current Ratio = Current Assets/Current Liabilities
Both the above figures can be obtained from the balance sheet of the
business. Current assets are the assets of a business expected to be converted to

Project report on working capital management at NALCO
Indus Business Academy, Bangalore Page 40
cash or used up in next 12 months or within the normal operating cycle of the
business. Current liabilities on the other hand are the obligations of a business which
need to be settled within next 12 months or within the normal operating cycle.
Graphical Representation of Current Ratio:
Analysis:
Current ratio matches current assets with current liabilities and tells us
whether the current assets are enough to settle current liabilities. Current ratio below
1 shows critical liquidity problems because it means that total current liabilities
exceed total current assets. General rule is that higher the current ratio better it is but
there is a limit to this. Abnormally high value of current ratio may indicate existence of
idle or underutilized resources in the company.
1.90
2.00
2.10
2.20
2.30
2.40
2.50
2.60
2.70
FY2012-13 FY2011-12 FY2010-11 FY2009-10 FY2008-09
YEARS
Current Ratio
Current Ratio
YEARS
(Amounts in
Crore)
FY2012-
13 FY2011-12
FY2010-
11 FY2009-10
FY2008-
09
Current Assets 7075.81 7022.33 6045.17 5209.64 4528.81
Current
Liabilities 3211.93 2676.89 2740.95 2219.93 1933.24
Current Ratio 2.20 2.62 2.21 2.35 2.34

Project report on working capital management at NALCO
Indus Business Academy, Bangalore Page 41
Quick Ratio or Acid Test Ratio:
Quick ratio or Acid Test ratio is the ratio of the sum of cash and cash
equivalents, marketable securities and accounts receivable to the current liabilities of
a business. It measures the ability of a company to pay its debts by using its cash
and near cash current assets (i.e. accounts receivable and marketable securities).
Formula
Quick ratio is calculated using the following formula:
Quick Ratio = (Cash +Marketable Securities +Receivables)/Current Liabilities
Marketable securities are those securities which can be converted into cash
quickly. Examples of marketable securities are treasury bills, saving bills, shares of
stock-exchange, etc. Receivables refer to accounts receivable. Alternatively, quick
ratio can also be calculated using the following formula:
Formula:
Quick / Acid Test Ratio = (Current Asset-Inventory)/Current Liabilities
YEARS
(Amounts in
Crore)
FY2012-
13
FY2011-
12
FY2010-
11
FY2009-
10
FY2008-
09
Current Assets 7075.81 7022.33 6045.17 5209.64 4528.81
Inventories 1380.64 1212.7 1058.47 944.92 841.9
Current
Liabilities 3211.93 2676.89 2740.95 2219.93 1933.24
Quick Ratio 1.77 2.17 1.82 1.92 1.91

Project report on working capital management at NALCO
Indus Business Academy, Bangalore Page 42
Graphical Representation of Quick Ratio:
Analysis:
Quick ratio measures the liquidity of a business by matching its cash and near
cash current assets with its total liabilities. It helps us to determine whether a
business would be able to pay off all its debts by using its most liquid assets (i.e.
cash, marketable securities and accounts receivable).
A quick ratio of 1.00 means that the most liquid assets of a business are
equal to its total debts and the business will just manage to repay all its debts by
using its cash, marketable securities and accounts receivable. A quick ratio of more
than one indicates that the most liquid assets of a business exceed its total debts. On
the opposite side, a quick ratio of less than one indicates that a business would not
be able to repay all its debts by using its most liquid assets.
Thus we conclude that, generally, a higher quick ratio is preferable because it
means greater liquidity. However a quick ratio which is quite high, say 4.00 is not
favorable to a business as whole because this means that the business has idle
current assets which could have been used to create additional projects thus
increasing profits. In other words, very high value of quick ratio may indicate
inefficiency.
0.00
0.50
1.00
1.50
2.00
2.50
FY2012-13 FY2011-12 FY2010-11 FY2009-10 FY2008-09
YEARS
Quick Ratio
Quick Ratio

Project report on working capital management at NALCO
Indus Business Academy, Bangalore Page 43
Cash Ratio:
Cash ratio is the ratio of cash and cash equivalents of a company to its
current liabilities. It is an extreme liquidity ratio since only cash and cash equivalents
are compared with the current liabilities. It measures the ability of a business to repay
its current liabilities by only using its cash and cash equivalents and nothing else.
Formula:
Cash ratio is calculated using the following formula:
Cash Ratio = Cash +Cash Equivalents/Current Liabilities
Cash equivalents are assets which can be converted into cash quickly
whereas current liabilities are those liabilities which are to be settled within 12
months or the business cycle.
YEARS
(Amounts in Crore)
FY2012-
13
FY2011-
12
FY2010-
11
FY2009-
10
FY2008-
09
Cash and Cash
Equivalents 3504.38 4168.35 3795.23 3125.35 2869.04
Current Liabilities 3211.93 2676.89 2740.95 2219.93 1933.24
Cash Ratio 1.09 1.56 1.38 1.41 1.48
Graphical Representation of Cash Ratio:
0.00
0.50
1.00
1.50
2.00
FY2012-13 FY2011-12 FY2010-11 FY2009-10 FY2008-09
YEARS
Cash Ratio
Cash Ratio

Project report on working capital management at NALCO
Indus Business Academy, Bangalore Page 44
Analysis:
Cash ratio of NALCO is1.00 it means, that the business will be able to pay all
its current liabilities in immediate short term. Therefore, creditors usually prefer high
cash ratio. But businesses usually do not plan to keep their cash and cash equivalent
at level with their current liabilities because they can use a portion of idle cash to
generate profits. This means that a normal value of cash ratio is somewhere below
1.00.
Activity or Efficiency Ratio:
Inventory Turnover Ratio:
Inventory turnover is the ratio of cost of goods sold by a business to its
average inventory during a given accounting period. It is an activity ratio measuring
the number of times per period; a business sells and replaces its entire batch of
inventory again.
Formula:
Inventory turnover ratio is calculated using the following formula:
Inventory Turnover Ratio = Net Sales/Inventories
Cost of goods sold figure is obtained from the income statement of a business
whereas the values of inventory are obtained from the balance sheets.
YEARS
(Amounts in
Crore)
FY2012-
13
FY2011-
12
FY2010-
11
FY2009-
10
FY2008-
09
Net Sales 6809.00 6500.00 5958.98 5055.66 5094.52
Inventories 1380.64 1212.7 1058.47 944.92 841.9
Inventory Turnover
Ratio 4.93 5.35 5.62 5.35 6.05

Project report on working capital management at NALCO
Indus Business Academy, Bangalore Page 45
Graphical Representation of Inventory Turnover Ratio:
Analysis:
Inventory turnover ratio is used to measure the inventory management
efficiency of a business. In general, a higher value of inventory turnover indicates
better performance and lower value means inefficiency in controlling inventory levels.
A lower inventory turnover ratio may be an indication of over-stocking which may
pose risk of obsolescence and increased inventory holding costs. However, a very
high value of this ratio may be accompanied by loss of sales due to inventory
shortage.
Inventory turnover is different for different industries. Businesses which trade
perishable goods have very higher turnover compared to those dealing in durables.
Hence a comparison would only be fair if made between businesses of same
industry.
Working Capital Turnover Ratio:
The working capital turnover ratio measures how well a company is utilizing
its working capital to support a given level of sales. Working capital is current assets
minus current liabilities. A high turnover ratio indicates that management is being
extremely efficient in using a firm's short-term assets and liabilities to support sales.
Conversely, a low ratio indicates that a business is investing in too many accounts
receivable and inventory assets to support its sales, which could eventually lead to
an excessive amount of bad debts and obsolete inventory.
0.001.002.003.004.005.006.007.00
FY2
01
2-1
3
FY2
01
1-1
2
FY2
01
0-1
1
FY2
00
9-1
0
FY2
00
8-0
9
YEARS
Inventory Turnover Ratio
Inventory Turnover Ratio

Project report on working capital management at NALCO
Indus Business Academy, Bangalore Page 46
Formula:
The working capital turnover ratio is calculated using the following formula:
The working capital turnover ratio = Net Sales/Working Capital
YEARS
(Amounts in
Crore)
FY2012-
13
FY2011-
12
FY2010-
11
FY2009-
10
FY2008-
09
Net Sales 6809 6500 5958.98 5055.66 5094.52
Working Capital 3863.88 4345.44 3304.22 2989.71 2595.57
Working Capital
Turnover Ratio 1.76 1.50 1.80 1.69 1.96
Graphical Representation of Working capital Turnover Ratio:
Analysis:
An extremely high working capital turnover ratio can indicate that a company
does not have enough capital to support it sales growth; collapse of the company
may be imminent. This is a particularly strong indicator when the accounts
payable component of working capital is very high, since it indicates that
management cannot pay its bills as they come due for payment.
0.00
0.50
1.00
1.50
2.00
FY2
01
2-1
3
FY2
01
1-1
2
FY2
01
0-1
1
FY2
00
9-1
0
FY2
00
8-0
9
YEARS
Working Capital Turnover Ratio
Working Capital TurnoverRatio

Project report on working capital management at NALCO
Indus Business Academy, Bangalore Page 47
An excessively high turnover ratio can be spotted by comparing the ratio for a
particular business to those reported elsewhere in its industry, to see if the business
is reporting outlier results.
Asset turnover ratio:
Asset turnover ratio is the ratio of a company's sales to its assets. It is an
efficiency ratio which tells how successfully the company is using its assets to
generate revenue.
There are a number of variants of the ratio like total asset turnover ratio, fixed
asset turnover ratio and working capital turnover ratio. In all cases the numerator is
the same i.e. net sales (both cash and credit) but denominator is average total
assets, average fixed assets and average working capital respectively.
Formula:
Following formulas are used to calculate each of the asset turnover ratios:
Total Asset Turnover Ratio=Net Sales/Total Assets
Fixed Asset Turnover Ratio = Net Sales/Fixed Assets
YEARS
(Amounts in
Crore) FY2012-13 FY2011-12 FY2010-11 FY2009-10 FY2008-09
Net Sales 6809 6500 5958.98 5055.66 5094.52
Total Assets 16326.95 15520.78 11872.95 11056.17 10391.16
Fixed Assets 6523.8 6498.98 7237.06 7079.71 6899.66
Total Assets
Turnover Ratio 0.42 0.42 0.50 0.46 0.49
Fixed Assets
Turnover Ratio 1.04 1.00 0.82 0.71 0.74

Project report on working capital management at NALCO
Indus Business Academy, Bangalore Page 48
Graphical Representation of Total Assets Turnover Ratio :
Analysis
If a company can generate more sales with fewer assets it has a higher
turnover ratio which tells it is a good company because it is using its assets
efficiently. A lower turnover ratio tells that the company is not using its assets
optimally. Total asset turnover ratio is a key driver of return on equity.
0.000.100.200.300.400.500.60
FY2
01
2-1
3
FY2
01
1-1
2
FY2
01
0-1
1
FY2
00
9-1
0
FY2
00
8-0
9
YEARS
Total Assets Turnover Ratio
Total Assets Turnover Ratio
0.000.200.400.600.801.001.20
FY2
01
2-1
3
FY2
01
1-1
2
FY2
01
0-1
1
FY2
00
9-1
0
FY2
00
8-0
9
YEARS
Fixed Assets Turnover Ratio
Fixed Assets Turnover Ratio
Project report on working capital management at NALCO
Indus Business Academy, Bangalore Page 49
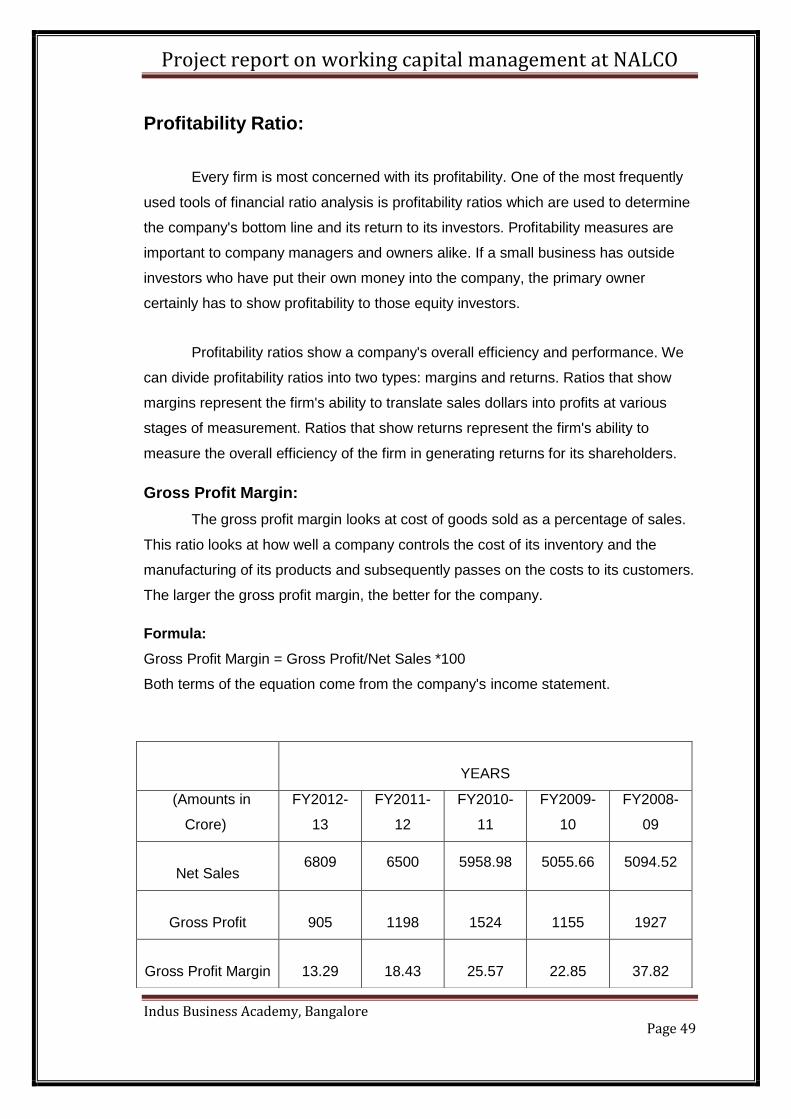
Profitability Ratio:
Every firm is most concerned with its profitability. One of the most frequently
used tools of financial ratio analysis is profitability ratios which are used to determine
the company's bottom line and its return to its investors. Profitability measures are
important to company managers and owners alike. If a small business has outside
investors who have put their own money into the company, the primary owner
certainly has to show profitability to those equity investors.
Profitability ratios show a company's overall efficiency and performance. We
can divide profitability ratios into two types: margins and returns. Ratios that show
margins represent the firm's ability to translate sales dollars into profits at various
stages of measurement. Ratios that show returns represent the firm's ability to
measure the overall efficiency of the firm in generating returns for its shareholders.
Gross Profit Margin:
The gross profit margin looks at cost of goods sold as a percentage of sales.
This ratio looks at how well a company controls the cost of its inventory and the
manufacturing of its products and subsequently passes on the costs to its customers.
The larger the gross profit margin, the better for the company.
Formula:
Gross Profit Margin = Gross Profit/Net Sales *100
Both terms of the equation come from the company's income statement.
YEARS
(Amounts in
Crore)
FY2012-
13
FY2011-
12
FY2010-
11
FY2009-
10
FY2008-
09
Net Sales 6809 6500 5958.98 5055.66 5094.52
Gross Profit 905 1198 1524 1155 1927
Gross Profit Margin 13.29 18.43 25.57 22.85 37.82

Project report on working capital management at NALCO
Indus Business Academy, Bangalore Page 50
Graphical Representation of Gross Profit Margin:
Operating Profit Margin:
Operating profit is also known as EBIT and is found on the company's income
statement. EBIT is earnings before interest and taxes. The operating profit margin
looks at EBIT as a percentage of sales. The operating profit margin ratio is a
measure of overall operating efficiency, incorporating all of the expenses of ordinary,
daily business activity.
Formula:
Operating Profit Margin = Operating Profit/Net Sales*100
Both terms of the equation come from the company's income statement.
YEARS
(Amounts in Crore)
FY2012-
13
FY2011-
12
FY2010-
11
FY2009-
10
FY2008-
09
Operating Profit 906 1145 1593 1102 1804
Net Sales 6809 6500 5958.98 5055.66 5094.52
Operating Profit Margin 13.31 17.62 26.73 21.8 35.32
0.00
5.00
10.00
15.00
20.00
25.00
30.00
35.00
40.00
FY2012-13 FY2011-12 FY2010-11 FY2009-10 FY2008-09
YEARS
Gross Profit Margin
Gross Profit Margin

Project report on working capital management at NALCO
Indus Business Academy, Bangalore Page 51
Graphical Representation of Operating Profit Margin:
Analysis
Operating margin ratio of 9% means that a net profit of ₹9.00 is made on
each ₹100.00 of sales. Thus a higher value of operating margin ratio is favorable
which indicates that more proportion of revenue is converted to operating income. An
increase in operating margin ratio overtime means that the profitability is improving. It
is also important to compare the gross margin ratio of a business to the average
gross profit margin of the industry. In general, a business which is more efficient is
controlling its overall costs will have higher operating margin ratio.
Net Profit Margin:
When doing a simple profitability ratio analysis, net profit margin is the most
often margin ratio used. The net profit margin shows how much of each sales shows
up as net income after all expenses are paid. For example, if the net profit margin is
5%, which means that ₹5.00 of every ₹100.00 is profit.
The net profit margin measures profitability after consideration of all expenses
including taxes, interest, and depreciation.
0.005.00
10.0015.0020.0025.0030.0035.0040.00
FY2
01
2-1
3
FY2
01
1-1
2
FY2
01
0-1
1
FY2
00
9-1
0
FY2
00
8-0
9
YEARS
Operating Profit Margin
Operating Profit Margin

Project report on working capital management at NALCO
Indus Business Academy, Bangalore Page 52
Formula:
Net Profit Margin = Net Income/Net Sales*100
Both terms of the equation come from the income statement.
YEARS
(Amounts in
Crore)
FY2012-
13
FY2011-
12
FY2010-
11
FY2009-
10
FY2008-
09
Net Sales 6809 6500 5958.98 5055.66 5094.52
Net Income 593 1050 1069 814 1272
Net Profit Margin 8.71 16.15 17.94 16.10 24.97
Graphical Representation of Net Profit Margin:
Analysis
Net profit margin shows the actual profit generated by company after paid all the
taxes and duties to Govt. As compare to FY 2011-12 this year it drastically reduce from
16.15% to 8.71% this year.
0.00
5.00
10.00
15.00
20.00
25.00
FY2012-13 FY2011-12 FY2010-11 FY2009-10 FY2008-09
YEARS
Net Profit Margin
Net Profit Margin

Project report on working capital management at NALCO
Indus Business Academy, Bangalore Page 53
Findings:
Current ratio of NALCO is 2.20 and it shows that company has enough
Current Assets to settle its Current Liability.
Quick ratio of NALCO is 1.70 it means for each ₹1.00 of Liability Company
has ₹1.70 to repay.
Working capital turnover ratio is 1.76 in the year 2012-13; it shows that
company has enough money to support its sales growth.
Asset turnover ratio is 0.42 which indicate that NALCO is not making the
optimum utilization its assets towards production.
Operating profit margin is decreased as compare to its previous year, mainly
due to the bad economy condition, shortage of domestic coal, high cost of
imported coking coal(six times cost more as compared to domestic coal)
NALCO has followed a very good investment strategy for its surplus amounts
as they are not keeping their surplus amount idle.
Suggestions:
Company should try to start production in Rolled product unit of NALCO
which is not operating and being idle since long.
The Debt-Equity ratio is 0:1 now, it means NALCO is presently a zero debt
company. It should try to reduce its equity and increase its debt component in
order to leverage its position.
The company should try and extend credit sales so that their sale increases.
Since NALCO has a sellers’ market, it can take advantages of this position
and expand its production to grow its sales further.
Company should try to take another coal block to overcome the problems
related to shortage of coal to improve their production.
Project report on working capital management at NALCO
Indus Business Academy, Bangalore Page 54
Conclusion:
The management of Working Capital deals with determination, maintenance,
control and monitoring of level of all the individual current assets. For the efficient
and optimal use of fixed assets, the existence and necessity of current assets is
implied. Working Capital is the amount necessary to cover the cost of operating the
enterprise which means to carry out the day to day operations. After studying the
components of working capital management system of NALCO, It is found that the
company has a sound and effective policy and its performance is very good even in
this bad recession situation company has managed to post good profit. Declining
cost of the products due to stiff competition from China accompanied with the rising
cost of inputs, particularly that of imported coking coal is likely to erode the profit
margin of Nalco in the current financial year. Company is competing well at the
domestic as well as the international level and it is among the low cost producers of
aluminium in the world only because of its proper management of finance, specially
the short term finance known as the working capital. The company is a matured one
and it has contributed well in the countries growth and development and will also
continue to perform and contribute to the whole nation. In conclusion, we can say
that the company’s management is an effective one and knows well the management
of finance, its working capital management system is very good because of which
only the company has got the status of NAVRATNA Company. The management
would try to make up for the loss by technology up gradation, improvement in
manufacturing rate and reduction in the cost of production ,the company’s exports
have perceptually increased and it has bright potential to carry on its endeavors to
achieve excellence in its field. Research and Development Endeavour of NALCO
have been product and process developments of value added products, waste
utilization, indigenization of improvement technology to the extent possible.

Project report on working capital management at NALCO
Indus Business Academy, Bangalore Page 55
Bibliography:
NALCO Annual Report 2008-09, 2009-10, 2010-11, 2011-12 & 2012-13
http://wirc-icai.org/material/sanjay%20kothari.pdf
http://www.ediindia.org/doc/SpecialPDF/chp-14.pdf
http://www.indianmirror.com/indian-industries/2013/aluminium-2013.html
http://www.nalcoindia.com
http://finance.toolbox.com/blogs/business-borrowing/how-to-read-a-ratio-
financial-statement-analysis-41501
http://accountingexplained.com/financial/ratios//
Related Documents