CHAPTER- 1 COMPANY PROFILE OF JAI PRAKASH ASSOCIATION 1

Welcome message from author
This document is posted to help you gain knowledge. Please leave a comment to let me know what you think about it! Share it to your friends and learn new things together.
Transcript
CHAPTER- 1
COMPANY PROFILEOF
JAI PRAKASH ASSOCIATION
1

JAYPEE ASSOCIATES LTD.
Shri Jaiprakash Gaur(Founder Of Jaypee Group)
“Growth with a Human Face”
The group is well diversified conglomerate with active interest in the
areas of civil engineering, design & construction for hydropower & river
valley projects, development of private hydro power projects, cement
manufacturing, hospitality, Business development and management of golf
resort, expressways and highways, real estate development information
technology and educational institutes.
2

VISION OF THE COMPANY :-
“To be amongst most trusted power utility company by providing
environment friendly power on most cost effective basis, ensuring
prosperity for its stakeholders and growth with human face.”
MISSION OF THE COMPANY: -
To achieve excellence in every activity we undertake.
To ensure most cost effective power for sustained growth of India.
To inculcate value system across the organization for ensuring
trustworthy relationship with associates and stake holders.
To be committed towards the safety and health of employees and the
public. The main motto of the company is Work for Safe, Healthy,
and Clean & Green Environment.
MAJOR AREAS OF OPERATION
CEMENT
CIVIL CONSTRUCTION
HYDRO POWER CONSTRUCTION
HOTEL AND TOURISM
INFORMATION TECHNOLOGY
EDUCATION & WELFARE
JAIPRAKASH VENTURES LTD.
3
Jaypee Cement
Jaiprakash Associates ltd.
Jaypee Korcham Hydro Corporation
JIL Information Technology Ltd.
Jaiprakash Power Ventures
Jaypee Hotels Ltd.
Jaypee Greens Ltd.
Jaypee Cements Ltd
Jaypee Ventures Ltd.
Jaiprakash Sewa Sansthan
Jaypee Cement
Jaypee Korcham Hydro Corporation
JIL Information Technology Ltd.
Jaiprakash Power Ventures
Jaypee Hotels Ltd.
Jaypee Greens Ltd.
Jaypee Cements Ltd
Jaypee Ventures Ltd.
Jaiprakash Sewa Sansthan
JAYPEE GROUP
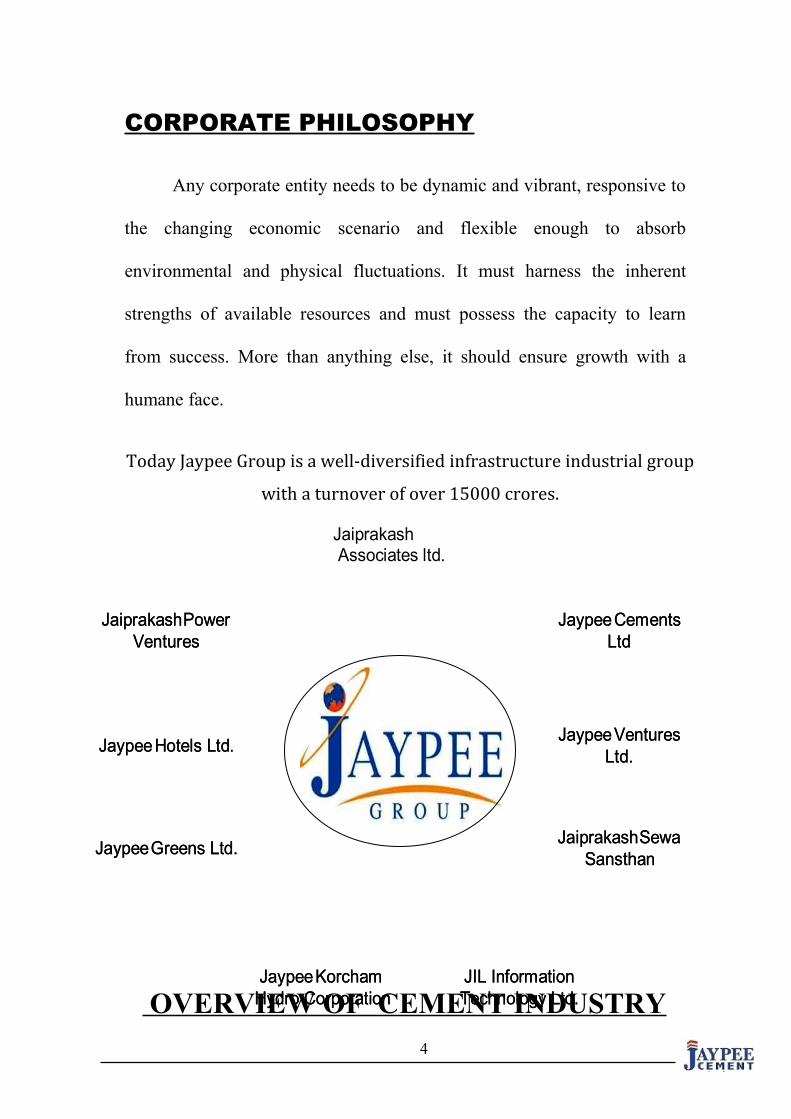
CORPORATE PHILOSOPHY
Any corporate entity needs to be dynamic and vibrant, responsive to
the changing economic scenario and flexible enough to absorb
environmental and physical fluctuations. It must harness the inherent
strengths of available resources and must possess the capacity to learn
from success. More than anything else, it should ensure growth with a
humane face.
Today Jaypee Group is a well-diversified infrastructure industrial group
with a turnover of over 15000 crores.
OVERVIEW OF CEMENT INDUSTRY
4

Cement is one of the core industries, which plays a vital role
in the growth of a nation. India ranks fifth among the cement
producing countries in the world. The present per capita cement
consumption is around 84kg, which is much lower than the per
capita consumption of the developed countries. During the last
couple of years, cement industry has been one of the main
beneficiaries of the infrastructure boom. While on the one hand
several big and small cement companies are actively considering
expansion plans in anticipation of further growth in demand for
cement, on the other, a phase of acquisitions and mergers among
the existing players is also not being ruled out in the immediate
future.
The present scenario of cement industry is very good in
terms of demand and with the prices going above Rs 170 - Rs 180
5

per bag everywhere and in some pockets even reaching Rs 200 per
bag. Most importantly, the gap between the demand and supply does
not exist any longer in any part of the country. Domestic
consumption with 11 per cent increase and exports keeping up with
the last year levels, the Indian cement industry is expected to cross
150 million tones in dispatches, including domestic consumption , and
exports during 2005-06 from all plants put together.
The Indian cement industry has a capacity to produce nearly 152
million tonnes a year and the demand has been growing by almost 10 per
cent annually, it has driven most of the cement companies to operate at
their full capacity or peak production levels. The consumption demand
for cement has risen substantially in states like Andhra Pradesh,
Karnataka, Rajasthan, Himachal Pradesh, West Bengal and Chattishgarh.
Moreover, healthy demand from Middle East Asian countries has helped
to push up the demand for cement export. The cement dispatches in the
last one year rose by a robust 11 percent aided by 10 per cent growth in
domestic dispatches. The exports have risen by 48 percent as against
clinker exports which are down by 43 per cent. As the demand has far
outstripped supply the cement companies’ capacities are at full throttle
with almost 94 percent utilization. A glance at the table below shows the
production and dispatches and more importantly the capacity utilization
levels of major Indian companies for the period April 05 to Feb 06.
JAYPEE: CEMENT DIVISION
6

Jaypee group is the 3rd largest cement producer in the country. The groups
cement facilities are located in the Satna Cluster (M.P.), which has one of
the highest cement production growth rates in India.
The group produces special blend of Portland Pozzolana Cement under the
brand name ‘Jaypee Cement’ (PPC). Its cement division currently operates
modern, computerized process control cement plants with an aggregate
installed capacity of 28 MnTPA. The company is in the midst of capacity
expansion of its cement business in Northern, Southern, Central, Eastern
and Western parts of the country and is slated to be a 35.90 MnTPA by
FY13 (expected) with Captive Thermal Power plants totaling 672 MW.
7

Keeping pace with the advancements in the IT industry, all the 260 cement
dumps are networked using TDM/TDMA VSATs along with a dedicated
hub to provide 24/7 connectivity between the plants and all the 120 points
of cement distribution in order to ensure “track – the – truck” initiative and
provide seamless integration. This initiative is the first of its kind in the
cement industry in India.
In the near future, the group plans to expand its cement capacities via
acquisition and greenfield additions to maximize economies of scale and
build on vision to focus on large size plants from inception. The Group is
committed towards the safety and health of employees and the public. Our
motto is.
‘Work For Safe, Healthy,
Clean & Green Environment'.
Mining
The cement manufacturing process starts from the mining of limestone,
which is the main raw material for making cement. Limestone is excavated
from open cast mines after drilling and blasting and loaded on to dumpers
8

which transport the material and unload into hoppers of the limestone
crushers.
Crushing Stacking & Reclaiming of Limestone
The LS Crushers crush the limestone to minus 80 mm size and discharge the
material onto a belt conveyor which takes it to the stacker via the Bulk
material analyzer. The material is stacked in longitudinal stockpiles.
Limestone is extracted transversely from the stockpiles by the declaimers
and conveyed to the Raw Mill hoppers for grinding of raw meal.
Crushing Stacking & Reclaiming of Coal
The process of making cement clinker requires heat. Coal is used as the fuel
for providing heat. Raw Coal received from the collieries is stored in a coal
yard. Raw Coal is dropped on a belt conveyor from a hopper and is taken to
and crushed in a crusher. Crushed coal discharged from the Coal Crusher is
stored in a longitudinal stockpile from where it is reclaimed by a reclaimer
and taken to the coal mill hoppers for grinding of fine coal.
Raw Meal Drying/Grinding & Homogenization
Reclaimed limestone along with some laterite stored in their respective
hoppers is fed to the Raw Mill for fine grinding. The hot gasses coming
from the clinkerisation section are used in the raw mill for drying and
transport of the ground raw meal to the Electrostatic Precipitator / Bag
House, where it is collected and then stored and homogenised in the
9

concrete silo. Raw Meal extracted from the silo (now called Kiln feed) is
fed to the top of the Preheater for Pyroprocessing.
Clinkerisation
Cement Clinker is made by pyroprocessing of Kiln feed in the preheater and
the rotary kiln. Fine coal is fired as fuel to provide the necessary heat in the
kiln and the Precalciner located at the bottom of the 5/6 stage preheater. Hot
clinker discharged from the Kiln drops on the grate cooler and gets cooled.
The cooler discharges the clinker onto the pan / bucket conveyor and it is
transported to the clinker stockpiles / silos. The clinker is taken from the
stockpile / silo to the ball mill hoppers for cement grinding.
Cement Grinding & Storage
Clinker and Gypsum (for OPC) and also Pozzolana (for PPC) are extracted
from their respective hoppers and fed to the Cement Mills. These Ball Mills
grind the feed to a fine powder and the Mill discharge is fed to an elevator,
which takes the material to a separator, which separates fine product and the
coarse. The latter is sent to the mill inlet for regrinding and the fine product
is stored in concrete silos.
Packing
Cement extracted from silos is conveyed to the automatic electronic packers
where it is packed in 50 Kgs. Polythene bags and dispatched in trucks.
Recent Achievements of Jai Prakash Associations
10
Year 2012 300 MW Baspa – II Hydropower project has been awarded the “Gold
Shield for 2009-10” and “Silver Shield for 2010-11” by the Ministry of
Power, Government of India in the category of “performance of
hydropower stations”.
Mr. Manoj Gaur, Executive Chairman, Jaypee Group and Mr.
Sameer Gaur, MD & CEO, Jaypee Sports International Ltd won the
Global Standards Award at NDTV Profit Business Leadership Awards
2011. The award was presented by Mr. Pranab Mukherjee, Union Finance
Minister of India on 7th January, 2012 at Mumbai.
Year 2011
Dalla Cement Factory (A unit of Jaiprakash Associates Ltd.) is
11

awarded first prize in the cement sector for the National Energy
Conservation Awards, 2011.
Chunar Cement Factory (A unit of Jaiprakash Associates Ltd.) is
awarded the Certificate of Merit in the cement sector for the National
Energy Conservation Awards, 2011.
Jaypee Rewa Cement Plant and Jaype Bela Cement Plant in Madhya
Pradesh of the Group have been awarded with the most prestigious “SWORD
OF HONOUR” award by the British Safety Council, UK in the field of Health
and Safety management system.
Year 2010
Jaypee Rewa Cement Plant and Jaype Bela Cement Plant in
Madhya Pradesh of the Group have been awarded with renowned and most
prestigious “SWORD OF HONOUR” award by the British Safety Council, UK. This
is a well acclaimed and celebrated international award in the field of
12

Health and Safety management system. 3.00 MnTPA Rewa and 2.40
MnTPA Bela are the only cement plants to be bestowed with this honour in
India.(For Details)
The garbage processing plant of Jaiprakash Associates Ltd.
located in Dadumajra, Chandigarh was awarded “Excellence for the best
solid waste management plant in the country” by Confederation of Indian
Industry (CII).
"Lifetime Achievement Award" being conferred to Shri Jaiprakash
Gaur, Founder Chairman by Merchants’ Chamber of Uttar Pradesh,
Kanpur for creating new milestones in Infrastructure development and his
achievement in Corporate Social Responsibility for the year 2010.
13
“Infrastructure Leader of the Year ” award being conferred to Shri
Jaiprakash Gaur, Founder Chairman by Shri Kamal Nath, the Union
Minister of Road Transport and Highways during the Essar Steel
Infrastructure Excellence Awards 2010 in association with CNBC TV18.
(For Details)
400 MW Vishnuprayag Hydropower Project of Jaiprakash Power
Ventures Ltd (JPVL) was awarded 1st Prize in the category “Energy &
Power’’ by the Essar Steel Infrastructure Excellence Awards 2010 in
association with CNBC TV18. (For Details)
300 MW Baspa – II Hydropower project being awarded with “Silver
Shield” by Shri Sushil Kumar Shinde, Union Minister of Power along with
Shri Bharatsinh Solanki, Union Minister of State for Power in the
prestigious National Awards for Meritorious Performance in Power Sector
by the Ministry of Power for 2008-09.
14
CHAPTER-2
INTRODUCTION
OF
WORKING CAPITAL
MANAGEMENT
What is Working Capital?
15
Working capital is how much in liquid assets that a company has on hand.
Working capital is needed to pay for planned and unexpected expenses,
meet the short-term obligations of the business, and to build the business.
A lack of working capital makes it hard to attract investors or to get
business loans or obtain credit.
Working capital is the money a business has available to sustain its
operations. It's the capital available to purchase inventory, pay employees,
keep the lights on, and finance other short term expenditures. This makes
managing working capital a critical business skill. If there is no working
capital, there is no business.
Thousands of companies fail each year due to poor working capital
management practices. Entrepreneurs often don't account for short term
disruptions to cash flow and are forced to close their operations. Many of
these companies have viable business models, and would have otherwise
succeeded had they better managed their working capital.
Working Capital is Required to Start and Grow a Business :-
When you first start a business you need start-up working capital since the
business is not yet making money to sustain itself. The number one reason
most businesses fail during their first two years of operation is due to a lack
of working capital.
Having ample working capital not only helps you to meet your obligations,
it is vital to growing your business.
16
Types of working capital:-
The operating cycle creates the need for current assets (working
capital).However the need does not come to an end after the cycle is
completed to explain this continuing need of current assets a destination
should be drawn between permanent and temporary working capital.
Permanent working capital:
The need for current assets arises, as already observed, because of the cash
cycle. To carry on business certain minimum level of working capital is
necessary on continues and uninterrupted basis. For all practical purpose,
this requirement will have to be met permanent as with other fixed assets.
This requirement refers to as permanent or fixed working capita.
Temporary working capital:
Any amount over and above the permanent level of working capital is
temporary, fluctuating or variable, working capital. This portion of the
required working capital is needed to meet fluctuation in demand
consequent upon changes in production and sales as result of seasonal
changes.
Sources of Working Capital:
1) Long- term sources: -
a) Issue of shares
b) Issue of debentures
c) Long –term loans
d) Retained earning
e) Sale of any old asset
17
2) Short –Term Sources: -
a) Internal sources: -
i) Provision for tax
ii) Depreciation funds
iii) Outstanding expanses
b) External sources: -
i) Normal trade credit
ii) Bills payable
iii) Overdraft
iv) Public deposit
v) Advance from customers
FACTORS AFFECTING THE REQUIREMENT OF
WORKING CAPITAL
1) Size of business:
This is very clear that if there is any big concern means it need
maximum of working capital to run the business smoothly but the
requirement of working capital will be reduced if we will reduced the
size of business as we do not have the sufficient long operating cycle
to invest the higher rate of working capital.
2) Nature of business:
Here we will discuss on the major part of firms -
i) The manufacturing unit
ii) The trading unit
Means we can easily understand that in case of manufacturing unit
the firm required maximum working capital to complete its
operating cycle.
18

3) Seasonal operation
The seasonal operation also effect the requirement of working capital
because the sale can be increased or decreased if they is any concern which
is manufacturing the seasonal goods.
4) Credit policy:
This policy normally takes an important place to impact on the
requirement of working capital means any company having a good credit
policy for a shorter period may required the less working capital on the
other hand the lenient credit policy may generate the risk of doubtful debts.
In this case the company requires more working capital during this period
this takes place to convert the credit into cash.
5) Marketable competition:
As per the present synerio of the market we can find the toughest
competition between every two company which are dealing with the same
time of product to reduce the competitiveness and to win the gain the
company gives or provides the some special offers to the buyer and to the
seller and these offers are not related with the operating cycle of the
company so the company needs exist amount of working capital to manage
the amount of these offers.
6) Growth and expansion:
As for as the growth and expansion is concerned it is very clear it will
increase the size of business we require some extra money for this purpose.
In the same condition if any company going to launch a new product they
again required exist amount of working capital to complete the operating
cycle of that particular product. The increment in the size is known as
growth and the establishment in the new sector or segment is called
expansion.
19

7) Shortage of raw material:
The requirement of working capital is also depends on the viability of
the raw material in the market. At the time of shortage of raw material
the price may also be high due to higher demand and less viability in this
case the firm has to purchase the raw material on higher price and required
some extra amount for the increment of cost. It means the company has to
invest more money for purchasing.
8) Dividend policy:
This factor is important because it is directly impact on the
financial position of the firm because the higher dividend rate makes the
company enable to get as strong position in the market. So to fulfill the
requirement of the dividend the company may use the retained earning or
profit or they have to generate the funds for dividend from other sources. So
this will impact on the operating cycle as well as this will degrees the cash
balance of the company, which the company is used to fulfill requirement
of temporary working capital.
9) Depreciation policy:
Depreciation policy also is treated as a source of working
capital because we can use the depreciation funds for the timing of fulfill the
requirement of temporary working capital. If the company is not
maintaining the depreciation policy in this case the company has to generate
the funds from the long term sources or any other source which can be
increase the liability of the firm.
20

Management of working capital:
Working capital management involves the relationship between a
firm's short-term assets and its short-term liabilities. The goal of working
capital management is to ensure that a firm is able to continue its operations
and that it has sufficient ability to satisfy both maturing short-term debt and
upcoming operational expenses. The management of working capital
involves managing inventories, accounts receivable and payable, and cash.
Working capital management will use a combination of policies and
techniques for the management of working capital. The policies aim at
managing the current assets (generally cash and cash equivalents,
inventories and debtors) and the short term financing, such that cash flows
and returns are acceptable.
• Cash management
• Inventory management
-Work in Process (WIP), Finished Goods, Supply chain
management, Just In Time, Economic order quantity, Economic
quantity.
• Debtors management
- Credit policy vice versa Discounts and allowances
• Short term financing
- Loan factoring
21

Working capital operating cycle
Investment in working capital is influenced by four key events in the
production and sales cycle. These events are: purchase of raw materials,
payment for their purchase, the sale of finished goods, and collection of
cash for the sales made.
Operating cycle and cash cycle are two important components of working
capital management. Together they determine the efficiency of a firm
regarding working capital management. While the operating cycle is the
time period from inventory purchase until the receipt of cash, the cash cycle
is the time period from when cash is paid out, to when cash is received.
The cash cycle is interpreted as the number of days between the payment for
inputs and getting cash by sales of commodities manufactured from that
input
Operating cycle of the company
The entire sequence of operations in a company can be summarized as
follows:
• The operating cycle for a company primarily begins with the purchase
of raw materials, which are paid for after a delay representing the
creditor's payable period.
• These purchased raw materials are then converted by the production
unit into finished goods and then sold. The time lag between the
purchase of raw materials and the sale of finished goods is known as
the inventory period.
22

• Upon sale of finished goods on credit terms, there exists a time lag
between the sale of finished goods and the collection of cash on sale.
This period is known as the accounts receivables period.
The operating cycle can be depicted as:
• The stage between purchase of raw materials and their payment is
known as the creditors’ payables period.
• The period between purchase of raw materials and production of
finished goods is known as the inventory period.
23

The following ratios will help in managing debtors, creditors and
inventories
1. Stock Turnover ratio = Cost of goods sold / Average Stock
2. Debtors Turnover ratio = [(Debtors+ Bills receivable*365] /
Net credit sales.
3. Debtors Turnover rate = Credit sales / (Average Debtors +
Bills receivable)
4. Creditors Turnover ratio = [(Creditors + Bills
payable)*365] / Credit purchases
5. Creditors Turnover rate = Credit purchases / Average
Creditors
24

CHAPTER- 3
INVENTORY MANAGEMENT
25
IN VENTORY MANAGEMENT :-
Material Management is concept which aims at a company wide,
integrated approach towards the management of materials in an Industrial
undertaking-Its objective is primarily cost reduction and efficient handling
of materials at all stages and in all parts of the undertaking.
Improving the capital turnover ratio covers the whole range of
functions involved in converting raw materials and ancillary supplies into
finished products.
IMPORTANCE OF MATERIALS MANAGEMENT :
1. Materials account for 60 to 64% fo the sales value of a production
hence small change in material costs can result in large sum of money
saved or lost.
The balance 36% accounts for wages and salaries, overheads and
profits.
2. Inventory carrying costs, briefly comprises of, interest charges on the
cost of inventory, storage and handling costs, cost of insurance, and
physical deterioration and obsolescence costs.
All these amounts to atleast 20% of the materials costs. These are
hidden costs generally covered by overheads.
3. So the total material cost will amount to be :
64% + ( 20% of 64 or 12.8%) = 76.8 say 77% of the sales revenue.
Hence, the inventories should be controlled to the minimum possible.
26
ADVANTAGES IN INTEGRATED MATERIALS MANAGEMENT
Organizations which have gone in a big way for the integrated
materials management usually enjoy the following advantages:
1. Better Accountability
2. Better Coordination
3. Better Performance
TOOLS AND TECHNIQUES OF INVENTORY MANAGEMENT
A-B-C Analysis (Applied in JRP based on consumption level):
The materials are divided into a number of categories for adopting a
selective approach for material control. It is generally seen that in
manufacturing concerns, a small percentage of items contribute a large
percentage of value of consumption and a large percentage of items of
material contribute a small percentage of value. In between these two
limits there are some items which have almost equal percentage of value
of materials. Under A-B-C analysis, the materials are divided into three
categories viz., A, B and C. Past experience has shown that almost 10
per cent of the items contribute to 70 per cent of value of consumption
and this category is called "A" Category. About 20 per cent of the items
contribute about 20 per cent of value of consumption and this is known
as category 'B' materials. Category 'C' covers about 70 per cent of items
of materials which contribute only 10 per cent of value of consumption.
There may be some variations in different organizations and an
adjustment can be made in these percentages.
27

PROCEDURE
1. RECEIPT OF STORES:
1. On arrival of consignment on visual inspection, if any damage is
found in packing of consignments of item/equipments, a damage
certificate is obtained from transporting agency and same is
forwarded to insurance Section for lodging transit insurance claim.
2. On receipt of the purchased product at the Stores, the delivery
documents are verified with corresponding purchase
orders/requisitions.
3. If purchased product is required CENVAT claim, handover
"Duplicate for Transporter copy" to Taxation Department
representative visiting Stores in morning hours of every working day.
4. Receipt of codified goods are recorded in goods receipt register as
and unique goods receipt number is allotted to each lot/consignment.
5. Physical verification of the quantities is carried out by counting
weight, measurement, etc.
6. An identification tag is affixed to one of the items, Bulk materials like
Steel, Grinding media, Casting, Refractory items, Lubricants, etc. are
directly unloaded at the designated place after due verification. Fuel
oils are directly taken into designated fuel tanks. Explosives are
directly unloaded at magazine located in the vicinity of mines after
due verification.
7. Fuel oils and explosive materials are unloaded, separately in separate
location i.e. HSD/Furnace Oil Tanks.
8. Inspection record generated accordingly.
9. Inspection of material being done within 07 days receipt to indenting
department with respect to the specifications in purchase orders and
actual receipts.
28

10. Non-confirming materials are documented in to Discrepancies Report
One copy of the same is forwarded to the supplies along with material
for appropriate action.
11. Bill of party, indicating the GR no. is forwarded to Accounts
Department for processing supplier payment.
12. All the non-conforming materials like returned to supplier supported
by Challan-cum gate pass.
2. STORAGE AND ISSUE OF STORES:
1. All items are issued to User Dept. against requisition slip as per
(Stores requisition slip)/ or reservation against SAP system.
2. Before issuing the materials necessary issue entries are made in
computer on line basis.
3. The items which require special storage condition like bearings,
instrumentation cards, vulcanizing materials, etc. are identified and
stored appropriately and special precautions are taken where
necessary.
4. All items which have a shelf-life are identified and first in first out
(FIFO) systems is followed for issue of such items, to ensure no
material with expiry date is stocked.
5. All shelf life items in stock are physically checked every month to
detect any deterioration. Expired material is being used with
permission of the indenter/user, in unproductive area or it is written
off and disposed off from the inventory after due approval of
Honorable MD.
6. All the items which gets surplus with user departments and further
usable can be returned to Stores through Stores Return Voucher
29

CHAPTER – 4
CASH MANAGEMENT
30
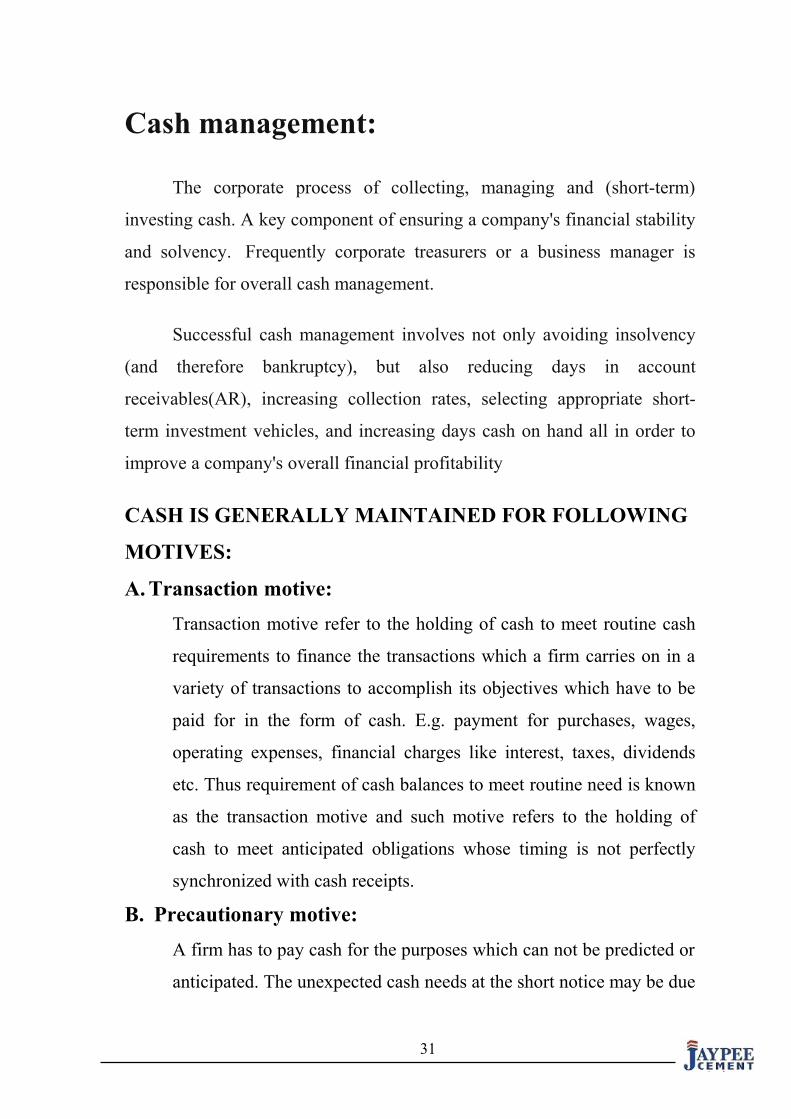
Cash management:
The corporate process of collecting, managing and (short-term)
investing cash. A key component of ensuring a company's financial stability
and solvency. Frequently corporate treasurers or a business manager is
responsible for overall cash management.
Successful cash management involves not only avoiding insolvency
(and therefore bankruptcy), but also reducing days in account
receivables(AR), increasing collection rates, selecting appropriate short-
term investment vehicles, and increasing days cash on hand all in order to
improve a company's overall financial profitability
CASH IS GENERALLY MAINTAINED FOR FOLLOWING
MOTIVES:
A. Transaction motive:
Transaction motive refer to the holding of cash to meet routine cash
requirements to finance the transactions which a firm carries on in a
variety of transactions to accomplish its objectives which have to be
paid for in the form of cash. E.g. payment for purchases, wages,
operating expenses, financial charges like interest, taxes, dividends
etc. Thus requirement of cash balances to meet routine need is known
as the transaction motive and such motive refers to the holding of
cash to meet anticipated obligations whose timing is not perfectly
synchronized with cash receipts.
B. Precautionary motive:
A firm has to pay cash for the purposes which can not be predicted or
anticipated. The unexpected cash needs at the short notice may be due
31

to:Floods, strikes & failure of customer Slow down in collection of
current receivables Increase in cost of raw material Collection of
some order of goods as customer is not satisfied The cash balance
held in reserves for such random and unforeseen fluctuations in cash
flows are called as precautionary balance. Thus, precautionary cash
provides a cushion to meet unexpected contingencies. The more
unpredictable are the cash flows, the larger is the need for such
balance.
C. Speculative motive:
It refers to the desire of the firm to take advantage of opportunities
which present themselves at unexpected moment & which are
typically outside the normal course of business. If the precautionary
motive is defensive in nature, in that firms must make provisions to
tide over unexpected contingencies, the speculative motive represents
a positive and aggressive approach. The speculative motive helps to
take advantages of: An opportunity to purchase raw material at
reduced price on payment of immediate cash. A chance to speculate
on interest rate movements by buying securities when interest rates
are expected to decline. Make purchases at favourable price. Delay
purchase of raw material on the anticipation of decline in prices.
D. Transaction motive:
Transaction motive refer to the holding of cash to meet routine cash
requirements to finance the transactions which a firm carries on in a
variety of transactions to accomplish its objectives which have to be
paid for in the form of cash. E.g. payment for purchases, wages,
operating expenses, financial charges like interest, taxes, dividends
32
etc. Thus requirement of cash balances to meet routine need is known
as the transaction motive and such motive refers to the holding of
cash to meet anticipated obligations whose timing is not perfectly
synchronized with cash receipts.
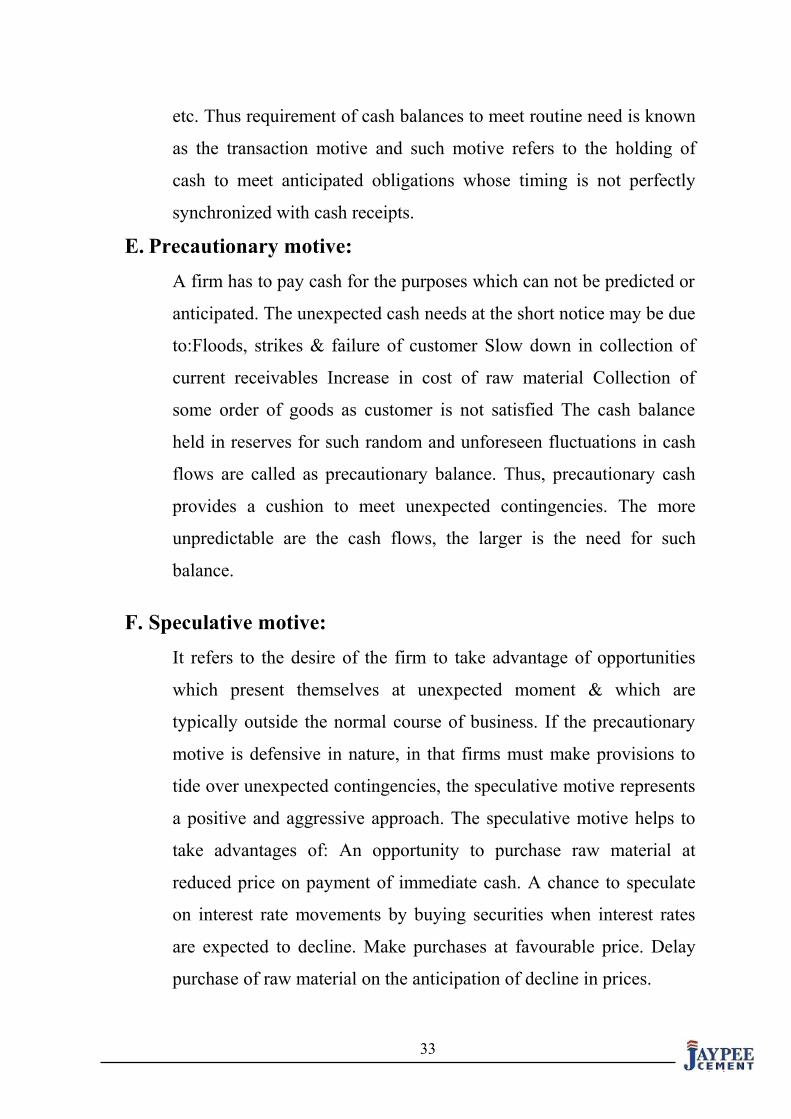
E. Precautionary motive:
A firm has to pay cash for the purposes which can not be predicted or
anticipated. The unexpected cash needs at the short notice may be due
to:Floods, strikes & failure of customer Slow down in collection of
current receivables Increase in cost of raw material Collection of
some order of goods as customer is not satisfied The cash balance
held in reserves for such random and unforeseen fluctuations in cash
flows are called as precautionary balance. Thus, precautionary cash
provides a cushion to meet unexpected contingencies. The more
unpredictable are the cash flows, the larger is the need for such
balance.
F. Speculative motive:
It refers to the desire of the firm to take advantage of opportunities
which present themselves at unexpected moment & which are
typically outside the normal course of business. If the precautionary
motive is defensive in nature, in that firms must make provisions to
tide over unexpected contingencies, the speculative motive represents
a positive and aggressive approach. The speculative motive helps to
take advantages of: An opportunity to purchase raw material at
reduced price on payment of immediate cash. A chance to speculate
on interest rate movements by buying securities when interest rates
are expected to decline. Make purchases at favourable price. Delay
purchase of raw material on the anticipation of decline in prices.
33

CHAPTER- 5
CREDIT MANAGEMENT
34
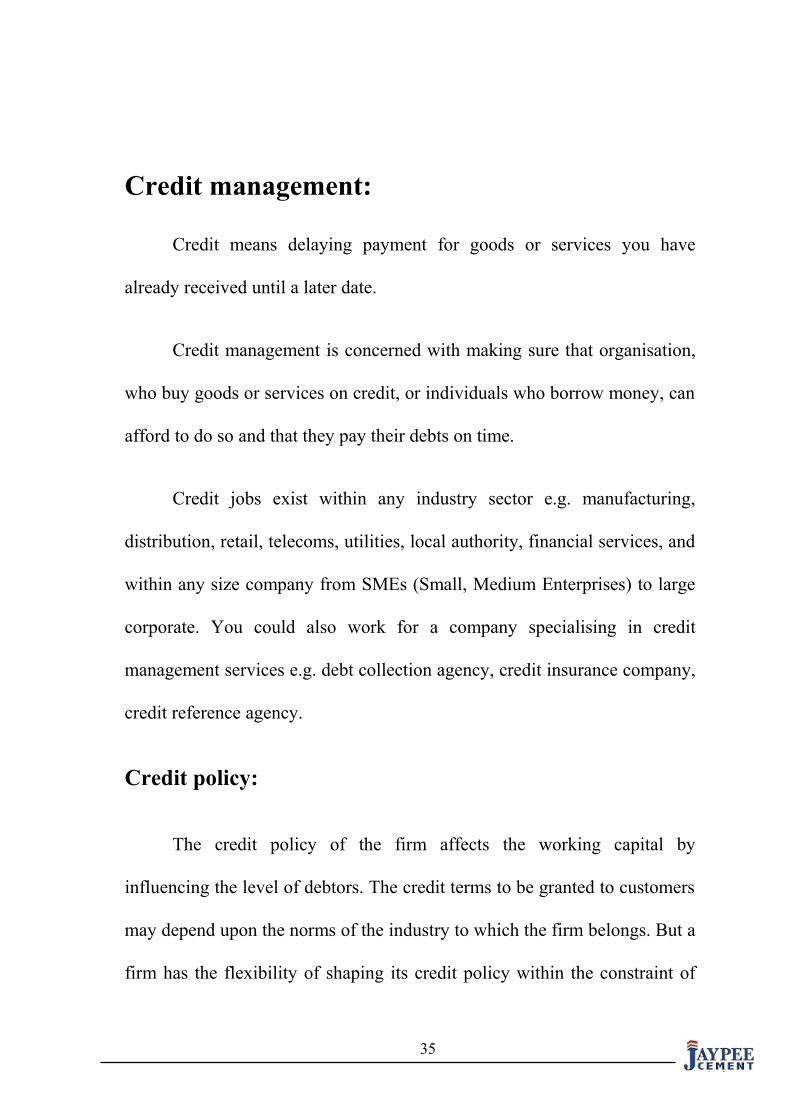
Credit management:
Credit means delaying payment for goods or services you have
already received until a later date.
Credit management is concerned with making sure that organisation,
who buy goods or services on credit, or individuals who borrow money, can
afford to do so and that they pay their debts on time.
Credit jobs exist within any industry sector e.g. manufacturing,
distribution, retail, telecoms, utilities, local authority, financial services, and
within any size company from SMEs (Small, Medium Enterprises) to large
corporate. You could also work for a company specialising in credit
management services e.g. debt collection agency, credit insurance company,
credit reference agency.
Credit policy:
The credit policy of the firm affects the working capital by
influencing the level of debtors. The credit terms to be granted to customers
may depend upon the norms of the industry to which the firm belongs. But a
firm has the flexibility of shaping its credit policy within the constraint of
35

industry norms and practices. The firm should be discretion in granting
credit terms to its customers. Depending upon the individual case, different
terms may be given to different customers. A liberal credit policy, without
rating the creditworthiness of customers, will be detrimental to the firm and
will create a problem of collections. A high collection period will mean tie-
up of large funds in book debts. Slack collection procedures can increase the
chance of bad debts. In order to ensure that unnecessary funds are not tied
up in debtors, the firm should follow a rationalized credit policy based on
the credit standing of customers and periodically review the
creditworthiness of the exiting customers. The case of delayed payments
should be thoroughly investigated.
36

CHAPTER- 6
RATIo ANAlysIs
AND
INTERpRETATIoN
37
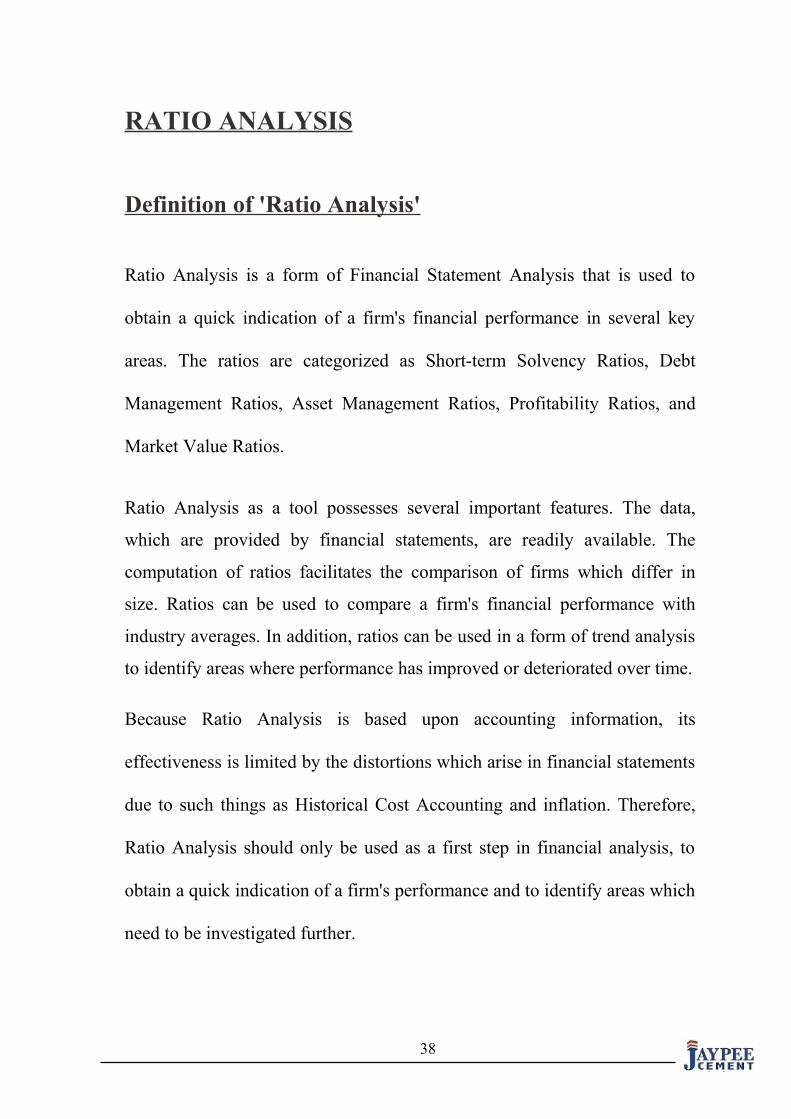
RATIO ANALYSIS
Definition of 'Ratio Analysis'
Ratio Analysis is a form of Financial Statement Analysis that is used to
obtain a quick indication of a firm's financial performance in several key
areas. The ratios are categorized as Short-term Solvency Ratios, Debt
Management Ratios, Asset Management Ratios, Profitability Ratios, and
Market Value Ratios.
Ratio Analysis as a tool possesses several important features. The data,
which are provided by financial statements, are readily available. The
computation of ratios facilitates the comparison of firms which differ in
size. Ratios can be used to compare a firm's financial performance with
industry averages. In addition, ratios can be used in a form of trend analysis
to identify areas where performance has improved or deteriorated over time.
Because Ratio Analysis is based upon accounting information, its
effectiveness is limited by the distortions which arise in financial statements
due to such things as Historical Cost Accounting and inflation. Therefore,
Ratio Analysis should only be used as a first step in financial analysis, to
obtain a quick indication of a firm's performance and to identify areas which
need to be investigated further.
38

ADVANTAGE OF RATIO ANALYSIS
1. Helpful in analysis of Financial Statements.
2. Helpful in comparative Study.
3. Helpful in locating the weak spots of the business.
4. Helpful in Forecasting.
5. Estimate about the trend of the business.
6. Fixation of ideal Standards.
7. Effective Control.
8. Study of Financial Soundness.
39

SOLVENCY RATIOS
CURRENT RATIO
This ratio explains the relationship between current assets and current
liabilities of a business. The formula of calculating the ratio is:-
Current Assets
Current ratio = Current Liabilities
Current Assets include those assets which can be converted into cash within
a year’s time and current liabilities include those liabilities which are
repayable in a year’s time. This ratio indicates the availability of current
assets in rupees for every one rupee of current liability.
Current Assets = Cash in hand + Cash at Bank + Short term investments +
Debtors +Stock +Prepaid expenses.
Current Liabilities = Bank overdraft + B/P + Creditors + Provision for
Taxation + Proposed dividend + Unclaimed dividend + Outstanding
dividend + Loans payable within a year.
14,684,085,101.69For the year 2011-2010 = = 1.11:1
13,215,999,829.69
12929562027.36For the year 2009 - 2010 = = 1.23 : 1
10441716877.19
8707767112.25For the year 2008 – 2009 = = 1.28 : 1
6759523242.53
40
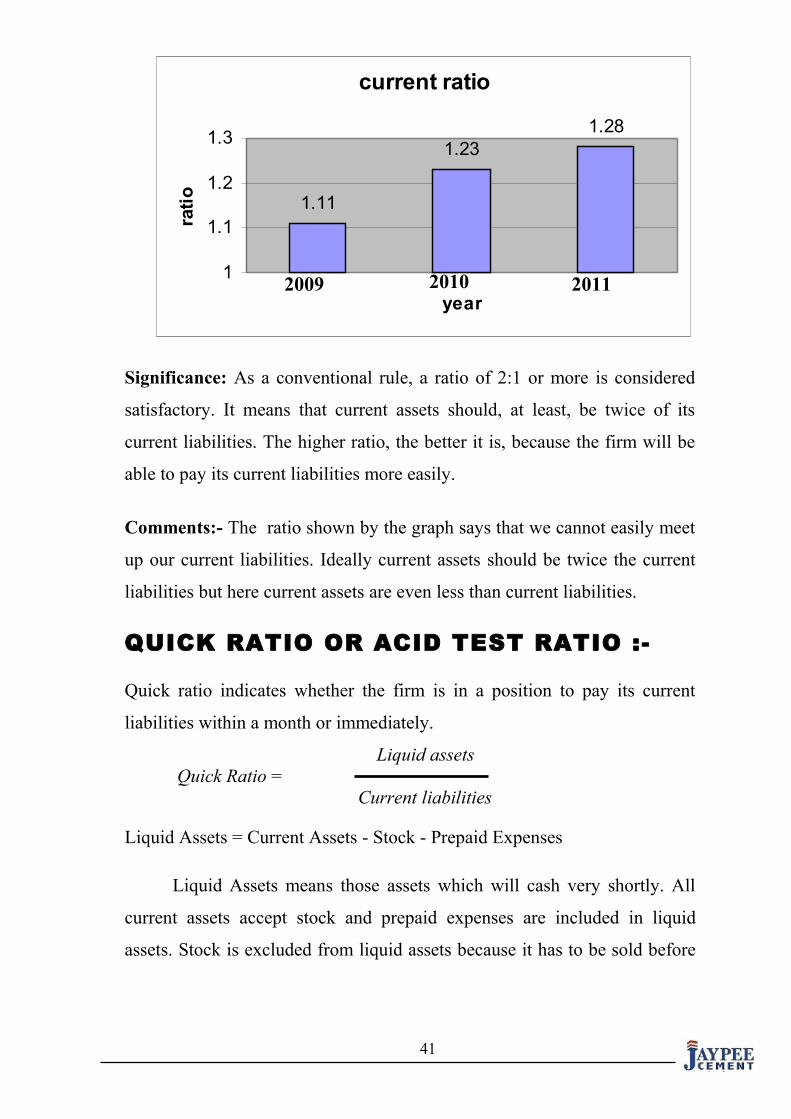
Significance: As a conventional rule, a ratio of 2:1 or more is considered
satisfactory. It means that current assets should, at least, be twice of its
current liabilities. The higher ratio, the better it is, because the firm will be
able to pay its current liabilities more easily.
Comments:- The ratio shown by the graph says that we cannot easily meet
up our current liabilities. Ideally current assets should be twice the current
liabilities but here current assets are even less than current liabilities.
QUICK RATIO OR ACID TEST RATIO :-
Quick ratio indicates whether the firm is in a position to pay its current
liabilities within a month or immediately.
Liquid assets Quick Ratio = Current liabilities
Liquid Assets = Current Assets - Stock - Prepaid Expenses
Liquid Assets means those assets which will cash very shortly. All
current assets accept stock and prepaid expenses are included in liquid
assets. Stock is excluded from liquid assets because it has to be sold before
41
current ratio
1.11
1.231.28
1
1.1
1.2
1.3
year
rati
o
2009 2010 2011

it converted into cash. Prepaid expenses are also excluded from it because
they are not expected to be converted into cash.
6081371899For the year 2009 - 2010 = = 0.60 : 1
10207269054
5868747252For the year 2008-2009 = = 0.90 :1 6504483042
Significance: Generally, the quick ratio of 1:1 is considered to be
satisfactory. Quick ratio thus more rigorous test of liquidity than the current
ratio and, when used together with current ratio, it gives a better picture of
short term financial position of the firm.
Comments:-
Since quick ratio is decreasing over the years [from 2009(0.90)-
2011(0.47)], it not gives a good picture of firm’ s short term financial
position so firm is not in the position to pay its current liabilities
immediately..
42

CASH RATIO
Since cash is the most liquid asset, a financial analyst may examine
cash ratio and its equivalent to current liabilities. Trade investments and
marketable securities equivalent to cash; so they may be included in cash
ratio.
Cash + Marketable securities Cash ratio = Current Liabilities
4943394564For the year 2010-2011 = = 0.38
12944132188
5344821803For the year 2009 - 2010 = = 0.52
10207269054
5578794627For the year 2008-2009 = = 0.86
6504483042
43

Significance:- Cash ratio generally helps in finding out whether the cash is
being proper utilised in the business or not and to check that whether or not
cash is lying ideal in the firm, if yes then to make proper utilisation of cash.
Comments:-As we can see that circulation of cash has decreased over the
past years. It shows that debtors are not making prompt payments and
company is not able to make better utilization of cash
ACTIVITY RATIO
INVENTORY TURNOVER RATIO
Inventory turnover indicates the efficiency of the firm in producing and
selling its products. It is calculated by dividing the cost of goods sold by the
average inventory.
Cost of Goods Sold Inventory Turnover Ratio = Average Inventory
Cost of Goods Sold = Opening Stock + Purchases + Direct Charges –
Closing Stock.
Or
Cost of Goods Sold = Net Sales – Gross Profit.
25344343015For the year 2010-2011 = = 7.78 times.
3256557159
15967226548For the year 2009-2010 = = 11.19 times.
1426463513
12521318155For the year 2008- 2009 = = 22.45 times
557573769
44

Significance:-
This ratio indicates whether or not the stock has been efficiently utilized. It
shows the speed with which the stock is rotated into sales. The higher the
ratio, the better it is, since it indicates that the stock is selling quickly. In
business where stock turnover is high goods can be sold at low margin of
profit and even then the profitability can be high.
Comments:
Inventory turnover ratio of the company is quite good earlier it means that
there is proper outflow of the stock and goods do not remain in the godown
for a long time. As we can see that the inventory turnover is decreasing
which shows that there is overspending in stock which is left unused .
TOTAL ASSETS TURNOVER RATIO
Assets are used to generate sales. Therefore, a firm should manage its assets
efficiently to maximize sales. The relationship between sales and assets is
called assets turnover.
45

Cost of goods sold / sales Total Assets turnover ratio = Total Assets
Total Assets = Fixed Assets + current assets
48520571504For the year ending (2010-2011) = = 0.29 times.
165871014877
35403563785For the year ending (2009-2010) = = 0.26. times.
134611476656
21958565843For the year ending (2008-2009) = = 0.206 times.
106429370209
.
Significance: This ratio is of particular importance in manufacturing
concerns where the investment in assets is quite high. This ratio reveals how
effectively the assets are being utilised, compared with previous year.
46
Comments:-
The graph clearly depicts that the total asset ratio was 0.20 times in 2008-
2009 which shows a gradual increase. The ratio gain momentum which
currently stood at 0.299 times which depicts efficient use of fixed assets
than earlier.
PROFITABILITY RATIO
GROSS PROFIT RATIO
The ratio shows the relationship between gross profit and sales.
Gross ProfitGross Profit Ratio = * 100
Net Sales
Net Sales = Gross revenue – Excise duty
23176228489For the year ending (2010-2011) = *100 = 47.76 %
48520571504
19436337237For the year ending (2009-2010) = *100 = 54.89 %
35403563785
12757686068For the year ending (2008-2009) = *100 = 58.098 %
21958565845
47
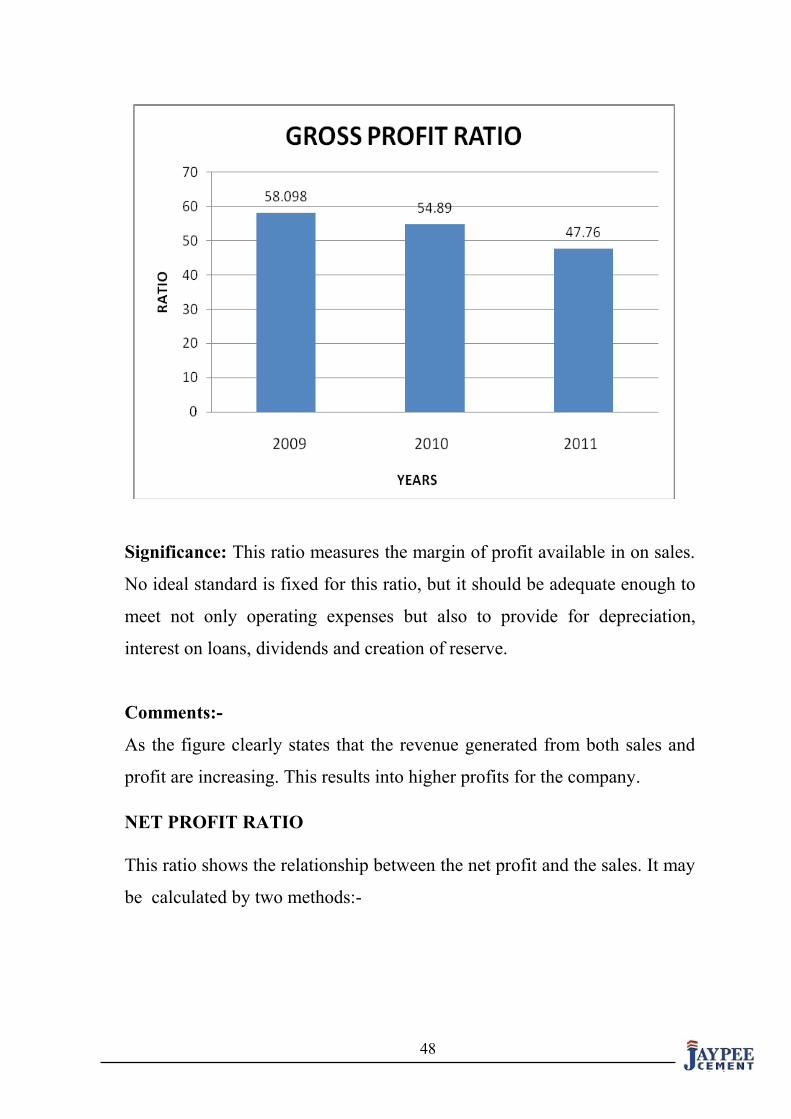
Significance: This ratio measures the margin of profit available in on sales.
No ideal standard is fixed for this ratio, but it should be adequate enough to
meet not only operating expenses but also to provide for depreciation,
interest on loans, dividends and creation of reserve.
Comments:-
As the figure clearly states that the revenue generated from both sales and
profit are increasing. This results into higher profits for the company.
NET PROFIT RATIO
This ratio shows the relationship between the net profit and the sales. It may
be calculated by two methods:-
48

Net Profit(a) Net Profit Ratio = * 100
Net Sales
3144921045For the year ending (2010-2011) = * 100 = 6.48 % 48520571504
7482523916For the year ending (2009-2010) = *100 = 21.1 %
35403563785
6143316501For the year ending (2008-2009) = *100 = 27.95 %
21958565485
helps in determining the overall efficiency of the business operations. An
increase in the ratio over the previous shows improvement in the overall
efficiency and profitability of the business.
49

Comments:-
The net profit ratio shows a decrease because the operating expenses have
increased in comparison to past year. So they should keep a watch on their
operating activities and try to reduce the expenditure incurred on them.
As the figure clearly states that the revenue generated from sales is
increasing but the profit is going down by few digits because of increase in
operational activities. But still the ratio of the current year is quite
significant but this continuous decrease in the ratio might be problematic.
WORKING CAPITAL TURNOVER RATIO
Working capital turnover indicates the rate of working capital utilization in
the company. This ratio can be compared either over a period of time or
with that of industry average
Net sales Working capital turnover ratio = Working capital
Working capital = Current Assets - Current Liabilities
21958565845For the year ending (2008-2009) = = 9.96 times.
2203284070
35403563785For the year ending (2009-2010) = = 13 times.
2722292973
48520571504For the year ending (2010-2011) = = 27.88 times.
1739952913
.
50
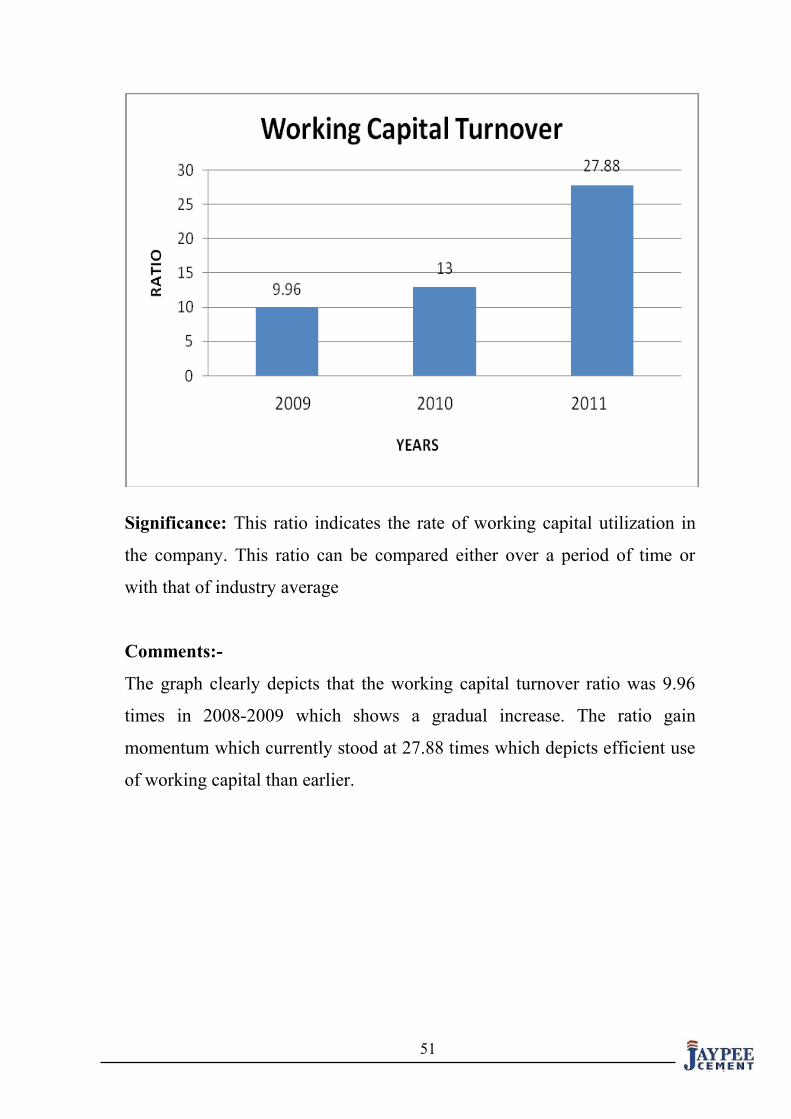
Significance: This ratio indicates the rate of working capital utilization in
the company. This ratio can be compared either over a period of time or
with that of industry average
Comments:-
The graph clearly depicts that the working capital turnover ratio was 9.96
times in 2008-2009 which shows a gradual increase. The ratio gain
momentum which currently stood at 27.88 times which depicts efficient use
of working capital than earlier.
51

Ratios of operating cycle:
Operating cycle of the company
The entire sequence of operations in a company can be
summarized as follows:
• The operating cycle for a company primarily begins with the purchase
of raw materials, which are paid for after a delay representing the
creditor's payable period.
• These purchased raw materials are then converted by the production
unit into finished goods and then sold. The time lag between the
purchase of raw materials and the sale of finished goods is known as
the inventory period.
• Upon sale of finished goods on credit terms, there exists a time lag
between the sale of finished goods and the collection of cash on sale.
This period is known as the accounts receivables period.
52

RAW MATERIAL CONVERSION PERIOD
11.71
21.06
13.03
0
5
10
15
20
25
1 2 3
YEAR
RA
TIO
SRaw material conversion period: Raw material inventory * 365 Raw material conversion period = Raw material consumption
70710592.77 * 360For the year ending (2008-2009) = = 11.8 days
2173747305
239033379* 360For the year ending (2009-2010) = = 21.06 days
2722292973 229265138* 360
For the year ending (2010-2011) = = 13.03 days. 6330718841.
Comments:-
The graph clearly depicts that the raw material conversion period was
11.71 days in 2008-2009 which shows a gradual increase. The ratio gain
momentum which currently stood at 13.03 days.
53
2009 2010 2011

Work in process conversion period:
Work in progress inventory * 360 Work in progress = Cost of goods sold
975694875*360
For the year ending (2008-2009) = = 28.44 days 12521318155
975694875*360For the year ending (2009-2010) = = 18.35 days
19135687722 2364032473* 360
For the year ending (2010-2011) = = 34.04 days. 25344343016
Comments:-
The graph clearly depicts that the work in process was 28.44 days in 2008-
2009 and then it declines to 18.35. The ratio gain momentum which
currently stood at 34.04 days.
Finished goods inventory conversion period:
54
WORK IN PROCESS
28.44
18.35
34.04
0
1020
30
40
1 2 3
YEAR
RA
TIO
S
2009 2010 2011

FINISHED GOODS INVENTORY
9.23
24.98 26.21
0
10
20
30
1 2 3
YEAR
RA
TIO
S Finished goods inventory * 360 Finished goods = Cost of goods sold
316863358*360For the year ending (2008-2009) = = 9.23 days
12521318155
1327961605*360For the year ending (2009-2010) = = 24.98 days
19135687722
1845425365* 360For the year ending (2010-2011) = = 26.21 days.
25344343016
Comments:-
The graph clearly depicts that the finished goods inventory was 9.23 days in
2008-2009 and then it comes to 24.98 which shows a gradual increase. The
ratio gain momentum which currently stood at 26.21 days.
Debtor conversion period:
debtors * 360
55
2009 2010 2011

DEBTORS CONVERSION PERIOD
5.287.68
10.89
0
5
10
15
1 2 3
YEAR
RA
TIO
S
Debtor conversion period = Credit sales
317844444*360For the year ending (2008-2009) = = 5.28 days
21958565845
841866444*360For the year ending (2009-2010) = = 7.68 days
39430701026
1448699776* 360For the year ending (2010-2011) = = 10.89 days. 48520571504
.
Comments:-
The graph clearly depicts that the debtors’ conversion period was 5.28 days
in 2008-2009 and then it comes to 7.68 which shows a gradual increase. The
ratio gain momentum which currently stood at 10.89 days.
Gross operating cycle:
56
2009 2010 2011

GROSS OPERATING CYCLE
49.3
64.873.3
0
20
40
60
80
1 2 3
YEAR
DA
YS
Gross operating cycle= raw material conversion period + work in
process + finished goods conversion period.
2008-2009= 11.7 + 28.4 + 9.23 = 49.3
2009-2010= 21.6+ 18.3 +24.9= 64.8
2010-2011=13.03+ 34.04+26.21= 73.28
GRAPH PPRESENTATION
Comments- The graph clearly depicts that the gross operating cycle was
49.3 days in 2008-2009 and then it comes to 64.8 days which shows a
gradual increase. The ratio gain momentum which currently stood at 73.3
days.
Net operating cycle-
57
2009 2010 2011

NET OPERATING CYCLE
4457.1 62.4
0
20
40
60
80
1 2 3
YEAR
DA
YS
Net operating cycle also referred as cash conversion cycle.
Operating cycle is the time duration required to convert sales, after
the conversion of resources into inventories, into cash.
Net operating cycle= gross operating cycle- debtors
conversion period
2008-2009= 49.3 -5.3= 44 days
2009-2010= 64.8- 7.7= 57.1 days
201-2011= 73.3- 10.9=62.4 days
GRAPH PPRESENTATION
Comments- The graph clearly depicts that the net operating cycle was 44
days in 2008-2009 and then it comes to 57.1 days which shows a gradual
increase. The ratio gain momentum which currently stood at 62.4 days.
58
2009 2010 2011

SUGGESTIONS AND
RECOMMENDATIONS
• The Liquidity Ratio shows that the liquidator’s position of the
company is quite satisfactory. All the ratios such as the current ratio,
quick ratio and cash ratio show a satisfactory position of the
company. The company has to make full utilization of its assets.
• Leverage position of the company is good as we can see that the ratio
continuously decreases and lastly the firm is able to pay all its debt in
current year. So the firm should try to maintain it and should invest its
money in some profitable activities.
• Gross Profit ratio of the company is declining, this could be due to :-
Increase in the prices of raw material.
Increase in the manufacturing expenses.
There is fall in prices of unsold goods, there by reducing
the value of unsold goods.
• Focused attention should be paid by initiating a special drive to
expedite recoveries from sundry debtors.
59
• The Net Profit Ratio of the firm also decreases. It shows the
inefficiency and unpredictability of the business. This decline is
because of increase in expenses borne by operating activities.
CONCLUSION
Finance is the basic pillar on which the structure of industrial
undertaking is based. This pillar should be properly placed. A
good working environment and attractive incentives for the
achievement of targets has obviously created ideal conditions in
Jaypee cements for the both management and workers. Not a
single day of production has been lost this shows efficiency in
management.
In my report I have calculated some of the ratio that was very
regularly used at Jaypee group for the necessary analysis activities
performed by it from time to time. Jaypee group uses this
technique usually to check out its current functioning and to
compare its performance on regular basis with the past years.
60
This technique is useful in inter-firm analysis and to judge
once performance standard as ratio helps to set some standard
marks which the firm target to achieve in the given span of time.
BIBLIOGRAPHY
I. I. M. Pandey - Financial Management Vikas-2003
II. Annual reports – Jaypee Associates Ltd. (Cement division)
III. Company website - www.jalindia.com
IV. Websites - www.google.com
61

62
Related Documents