Coaches on Fire or Firing the Coach? Evidence of the Impact of Coach Changes on Team Performance from Italian Serie A 023.2019 Alessandro Argentieri, Luciano Canova, Matteo Manera September 2019 Working Paper Electronic copy available at: https://ssrn.com/abstract=3475379

Welcome message from author
This document is posted to help you gain knowledge. Please leave a comment to let me know what you think about it! Share it to your friends and learn new things together.
Transcript

Coaches on Fire or Firing the Coach? Evidence of the Impact of Coach Changes on Team Performance from Italian Serie A
023.2019
Alessandro Argentieri, Luciano Canova, Matteo Manera
September 2019
WorkingPaper
Electronic copy available at: https://ssrn.com/abstract=3475379

Economic Theory and Applications Series Editor: Matteo Manera
Coaches on Fire or Firing the Coach? Evidence of the Impact of Coach Changes on Team Performance from Italian Serie A By Alessandro Argentieri, Agricultural University of Ecuador Luciano Canova, Eni Corporate University, Scuola Eni Enrico Mattei Matteo Manera, University of Milano-Bicocca, Center for European Studies and Fondazione Eni Enrico Mattei Summary In this paper, football data from the 2007/2008 to 2016/2017 seasons of the Italian Serie A were used to identify the effects of replacing a coach mid-season due to poor team performance. We used an instrumental variable approach to correlate coach turnover within a season with player productivity and found a very low positive impact of the coach change in the short term but a significant negative impact in the long term. Our findings are also relevant to the literature on management replacement in small-size firms. Keywords: Italian Football Data, Coach Changes, Team Performance, Models for Panel Data, Instrumental Variables JEL Classification: C23, C36, M51, Z22
Address for correspondence: Matteo Manera University of Milan-Bicocca Department of Economics, Management and Statistics Via Bicocca degli Arcimboldi, 8 20126 Milan Italy E-mail: [email protected]
Electronic copy available at: https://ssrn.com/abstract=3475379

1
Coaches on fire or firing the coach?
Evidence of the impact of coach changes
on team performance from Italian Serie A
Alessandro Argentieri(*), Luciano Canova(**) , Matteo Manera(***)
Abstract
In this paper, football data from the 2007/2008 to 2016/2017 seasons of the Italian Serie A were used
to identify the effects of replacing a coach mid-season due to poor team performance. We used an
instrumental variable approach to correlate coach turnover within a season with player productivity
and found a very low positive impact of the coach change in the short term but a significant negative
impact in the long term. Our findings are also relevant to the literature on management replacement
in small-size firms.
Keywords
Italian football data; coach changes; team performance; models for panel data; instrumental variables.
JEL classification
C23; C36; M51; Z22.
(*) Agricultural University of Ecuador, Guayaquil, Ecuador: Department of Agricultural Economics.
Email address: [email protected]
(**) Eni Corporate University, San Donato Milanese, Italy: Scuola Eni Enrico Mattei. Email:
(***) University of Milano-Bicocca, Italy: Department of Economics, Management and Statistics
(DEMS), and Center for European Studies (CefES); Fondazione Eni Enrico Mattei (FEEM), Milano,
Italy. Email: [email protected] (corresponding author)
Electronic copy available at: https://ssrn.com/abstract=3475379
2
I. INTRODUCTION AND LITERATURE
In this paper, we used football data from Italian Serie A to answer the following research question:
Does changing a football team coach due to poor results improve the performance of the team? In
addition to sports management, this question is also relevant for labour economics research, as it
reflects possible mechanisms emerging in firms facing management turnover.
Sports data have been used in a large, and increasing, number of scientific studies. Due to the
availability of detailed and reliable measures of team performance and of data on individual careers,
they are mostly used to analyse issues related to incentives and labour market outcomes (Szymanski
2003, Kahn 2000). In this context, sports data can help in the evaluation of the effects of incentives
on behaviour, through the observation of player performance when influenced by monetary incentive
schemes.
The analysis of sports data also provides material for another issue, related to the tendency of firms
and organisations to replace their managers to improve their economic results. Considering the
importance of top managers, if a firm performs poorly, it is believed that the firing and replacement
of the management board may lead to improved performance and financial results. Attempting to
predict the outcome of replacing a manager before the expiration of his or her contract is a crucial
element in business decision-making.
Football data have frequently been used to define the determinants and consequences of management
changes, since the outcomes are measured weekly on a match-by-match basis (i.e. the results of the
match) in an objective way and are not affected by measurement errors. In contrast, data on firm
performance are usually collected on a yearly basis (i.e. financial reports), and the definition and
measurement of manager productivity is influenced by external exogenous factors, such as
macroeconomics or environmental contingencies, and lacks identifiable objective indicators of
individual performance.
To avoid the problem of sparse data due to infrequent financial reports, some studies in the
management field use stock prices, available on a daily basis, as a measure of firm performance.
Stock prices, however, are strongly correlated with expectations and more influenced by market
beliefs about the manager turnover than by the actual effect of the turnover on firm performance.
Electronic copy available at: https://ssrn.com/abstract=3475379

3
On the other hand, according to Pieper, Nuesch and Franck (2014), head coaches and top managers
show similar characteristics: age (from 40 to 60), stress management capabilities, and well-honed
media skills. Like a top manager in a firm, a coach is a fundamental representative of the owners and
managers of football clubs, is given responsibilities in a variety of areas and makes a number of
strategic and operational decisions which affect team performance. The roles of a coach may include
motivating players, selecting the players for each match, selecting tactics and game strategies and
determining which players to buy, sell or borrow during the market transfer season. Due to the crucial
role of the coach, the replacement of one typically occurs in cases of poor team performance.
From a theoretical perspective, coach-firing might have conflicting effects on team performance. A
new coach may provide motivation for the players by rearranging positions in team composition,
resulting in the players making a greater effort in order to be selected for future games. On the other
hand, coach change may be the result of pressure from fans and media, who generally do not take
into account the fact that the replacement sacrifices the knowledge base and team skills developed by
the fired coach (Hoffler & Sliwka, 2003).
There are two important econometric problems which need to be addressed when evaluating the
consequences of coach turnover on team performance (De Paola, Scoppa 2011). First, coaches are
not randomly fired. Dismissals are often decided after a streak of continuous negative results, and
weaker teams tend to replace coaches more frequently within a season. Therefore, we found that
coach turnover may influence team performance, but, in the same way, team performance may
influence the decision of team managers on whether or not to change coach. This fact implies the
possibility of an inverse causality relationship between team performance and coach turnover.
Second, in a stochastic environment such as a football competition, unusually strong or unusually
poor results are statistically followed by outcomes that are closer to the mean. This phenomenon is
known in econometrics as ‘regression to the mean’ or ‘Ashenfelter’s dip’, and it may influence team
results during a football season.
Analyses and studies that do not take into account these aspects may incorrectly conclude that coach
change has negative effects (i.e. negative correlation between coach change and team performance)
or, alternatively, that the forced coach turnover leads to an improvement in team performance, even
if its actual effects are negligible (because results tend naturally to improve after a string of bad
matches). In statistical language, such misconceptions lead to inconsistent estimates. Similar
Electronic copy available at: https://ssrn.com/abstract=3475379

4
problems occur when analysing firm performance and managerial turnover, and, probably because of
these econometric problems, the literature on the effects of manager turnover on organisational
performance fails to reach clear conclusions.
The business literature reports a range of results, even if it overall suggests small positive effects of
management turnover on corporate performance. In the past, Bonnier and Bruner (1989) and
Weisbach (1988) observed strong positive stock price reactions after a turnover-of-management
announcement, while Khanna and Poulsen (1995) found the opposite result. In the same period,
Reinganum (1985) and Warner, Watts and Wruck (1988) reported small, statistically insignificant
price changes associated with turnover events.
Other studies have attempted to examine the relationship between management turnover and changes
in operating performance using accounting information. Denis and Denis (1995) showed that forced
resignations of top managers are followed by large improvements in firm performance. Similar results
were found by Khurana and Nohria (2000). Later, Huson, Malatesta and Parino (2004) showed that
turnover announcements were associated with significantly positive stock returns and positively
related to accounting measures of performance.
As for management-specialised studies, research based on sports data has not been able to reach clear
results regarding the effects of coach turnover on team performance. Several previous analyses on
coach turnover are based on simple models which fail to consider the serious econometric issues
discussed above. Some of them showed that a coach change improves team performance (Fabianic,
1994; McTeer, White & Persad, 1995), while others found a negative effect (Brown, 1982). Mixed
results emerge also from studies carried out with more sophisticated econometric evaluations from
2000 to 2010. For example, Bruinshoofd and TerWeel (2004) showed that forced resignations were
ineffective in improving team performance. Similar results appeared in Koning (2003), Maximiano
(2006), Balduck and Buelens (2007) and Wirl and Sagmeister (2008). On the other hand, Salomo and
Teichmann (2000), Audas, Dobson, and Goddard (2002) and Audas, Goddard and Rowe (2006) found
a negative effect.
This work approaches the analysis from three different points of view. In particular, estimates are
articulated in three different specifications, according to the choice of response variable, regressors
and dataset dimension.
Electronic copy available at: https://ssrn.com/abstract=3475379

5
In each specification, team performance is the response variable of the regression analysis, although
it is measured with three different indicators:
A. Player marks of each team
B. Number of points earned by a team by the end of each football season
C. Average score of teams during a football season.
In this study, only coach changes taking place within the season are considered, as replacement
between years does not allow for distinguishing between effects caused by the coach change and
those caused by other factors, such as different team composition, different quality of opponents and
turnover of players.
II. Description of the dataset
All data used in the three specifications are collected from the records of La Gazzetta dello Sport, the
most important Italian sports newspaper, and from Wikipedia, the well-known online encyclopaedia.
Overall, 33 Serie A teams (over ten seasons) were examined, each of which having made at least one
appearance in Serie A from 2007–2008 to 2016–2017. In a single season, Serie A is composed of 20
teams, which play against each other twice (once as the home team and once as the visiting one), for
a total of 38 matches. Moreover, in each season, the composition of the league changes due to
movements from Serie A to Serie B and vice versa.
A. Performance measure 1: player marks
For each team and match, player performances are recorded in the form of marks collected by La
Gazzetta dello Sport. The newspaper gives each player participating in the match a mark from 1 to
10, with 1 indicating a poor performance and 10 indicating an outstanding one. From these marks,
we calculated an average that can serve as an indicator for overall team performance in that match
(the variable average). The players are then divided into sub-categories: strikers (strikers),
midfielders (midfielders), defenders (defenders) and goalkeeper (goalie). For each of these
categories, we calculated the average marks to give an indicator of performance for each player role.
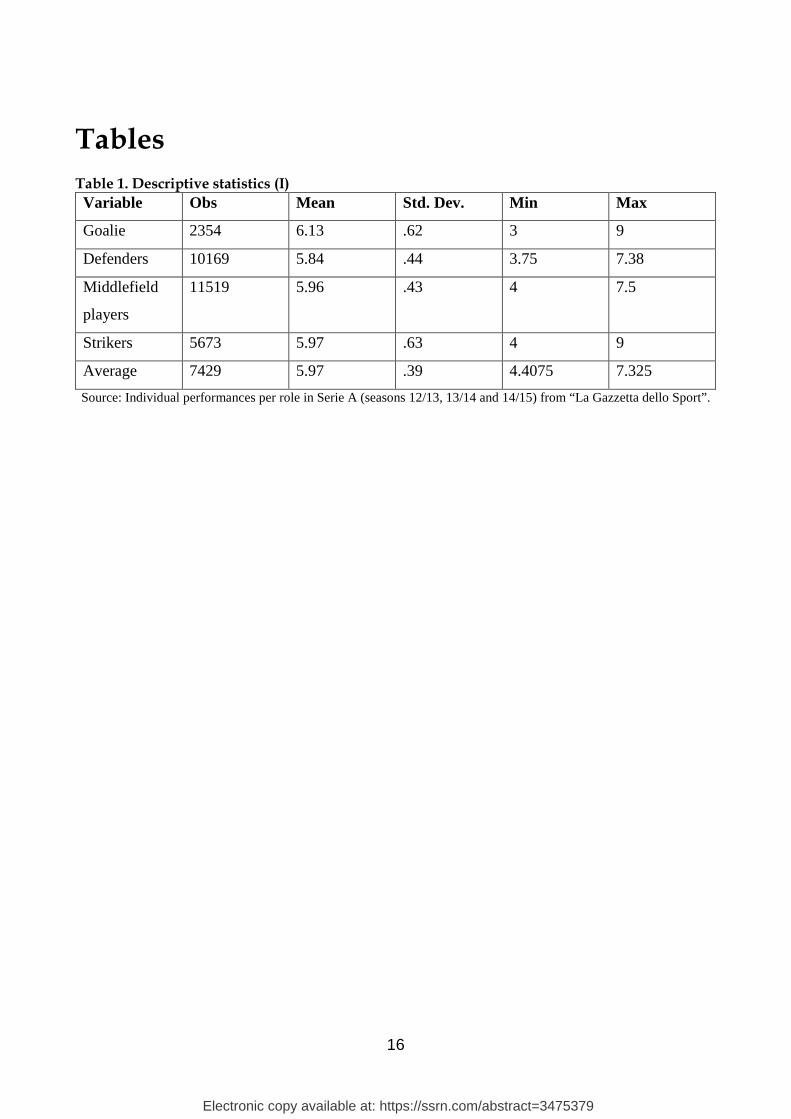
Table 1 contains a summary of these variables. It is notable that the marks are all within the range of
3 to 9 and that the averages for all categories are close to 6.
[TABLE 1 ABOUT HERE]
Electronic copy available at: https://ssrn.com/abstract=3475379

6
For each season, we recorded the teams that changed coach within that season and created from this
record the discrete variable counter, with three values: 0, 1 and 2.
For all teams, the first match of each season always begins with a counter of 0. Since having more
than two coach changes in one season is very rare, this event is categorised the same way as having
two coach changes.1
Within the data collected, changing coach multiple times within a season was not found to be a rare
occurrence in Serie A in the previous eight leagues. Out of the 30 teams presented in the dataset, 17
teams changed their coaches at least twice in one season during the reference period, and there are no
seasons in which there is not at least one team changing its coach twice.
B. Performance measure 2: points made by a team in a season
For this analysis, we structured a panel dataset with a time-series dimension of 10 seasons (all seasons
from 2007–2008 to 2016–2017) and a cross-section dimension of 33 teams. Since only 20 of the 33
teams compete during a season, the panel structure is unbalanced, and the number of observations is
20*10=200.
Given the panel structure of the data, alternative definitions of the dependent variable and the
regressors are observed for each team and each year.
The dependent variable is now recorded with the total points obtained by teams at the end of each
season. This variable, named points, shows exactly the outcome obtained by each team, reducing the
reliability problem of the use of player marks.
The descriptive statistics of points, as with the other variables used in this section, are presented in
Table 2. On average, teams earn about 52 points in a season, but a more significant insight is that the
standard deviation within the groups/teams (9.4) is lower than the total standard deviation (16.2), so
teams tend not to diverge significantly from their results from one year to the next.
1 In fact, there are only three occurrencies of three coach changes in one season out of the 30 teams during this period.
Electronic copy available at: https://ssrn.com/abstract=3475379

7
[TABLE 2 ABOUT HERE]
We measured coach changes within a season using two types of variables, as a robustness check on
our regression results:
- a dummy variable named change, which takes the value ‘1’ if there is at least one turnover
during a season and otherwise takes the value ‘0’
- a count variable named changes_number, which takes the values ‘0, 1, 2, 3, 4’, based on the
number of coach turnovers.
We included in the regression several controls, designed to capture other characteristics of a team that
may influence its performance. We added, in particular, an economic variable, a performance
indicator and a variable capturing the age structure of the team:
- salary_cap, which contains the aggregate net yearly wage of the players who played at least
one match
- drawn_matches, which refers to the number of matches drawn by each team during each
season
- average_age, which measures the average age of the players who played at least one match.
As mentioned earlier, we observed that a standard regression model may be affected by inconsistency
of estimates. This problem concerns the coefficients of the two regressors for coach turnover.
According to a well-known statistical theory, there is an endogeneity problem when the explanatory
variable is correlated with the error term of a regression model, and this problem occurs when changes
in the dependent variable cause changes in the explanatory variable.
This is, in fact, the case for our analysis, since the performance of a team during a season (dependent
variable) influences the decision of a team’s managers on whether or not to change coach (explanatory
variable), and this effect is simultaneous, within the same league’s season (time unit of the panel).
We then focused on the identification of the instrumental variables used to avoid the endogeneity
problem. The aim is to find variables with two important characteristics: correlation with the
endogenous regressors and a lack of correlation with the error term, so as not to suffer from the same
problem as the original predicting variables.
We settled on the following three instrumental variables:
Electronic copy available at: https://ssrn.com/abstract=3475379

8
- goal_scored, which refers to the number of goals that each team scored in each season
- goal_conceded, which refers to the number of goals that each team concedes in each season
- past_changes, which counts the number of coaches that each team has hired during the
previous ten seasons.
The first two variables are linked directly to the match and correlated with the decision of changing
coaches, so they respect the first condition for eligible instruments. We argue that they are exogenous
in the model because points gained by teams during a season do not influence player performance in
terms of goals scored and conceded.
We analysed only three seasons and estimated six regression models, two for each season, with
goal_scored and goal_conceded as dependent variables (see Table 3). The intent was to estimate the
causal effect of the lagged points on team performance measured by goals, including also other
regressors (number of goals scored by the team and number of goals scored against the team), which
more accurately explains the number of goals during a match. Estimates show that the coefficients
for the variables which refer to the lagged points gained in previous matches are not statistically
significant, meaning that there is no significant causal effect between them and that the variables
goal_scored and goal_conceded are exogenous with respect to points.
[TABLE 3 ABOUT HERE]
The variable past_changes attempts to capture the propensity of a team’s CEO to fire the coach
during the football season. It is a lagged variable with respect to the points gained in the league’s
season, so it is clearly exogenous in the model.
C. Performance measure 3: average score of teams during a football season
In this section, the purpose is to evaluate the effect of coach turnover in the short term, specifically
on the match immediately following the coach change. The analysis was carried out on four leagues’
seasons, from 2013/2014 to 2016/2017, although these do not represent the time dimension in the
analysis. The datasets used in the empirical analysis are four in total, one for each season, with the
same structure and variables, but different from the data described in subsections A and B of Section
II. Here, the time-series dimension of the panel is represented by the 38 days of the league and the
cross-section dimension by the 20 teams competing in a league.
Electronic copy available at: https://ssrn.com/abstract=3475379

9
These four datasets are very similar, as the only differences depend on the teams promoted in Serie
A and on those relegated to Serie B. These characteristics allow for a comparison of the estimates,
season by season, and for increasing the robustness of our results.
We used a new dependent variable to measure the performance of teams during a league: the
cumulative average score of teams. This variable, named mean_points, varies after each match
according to the points obtained, so it functions to capture the short-term effect of coach turnover.
Intuitively, we observed in the data a temporal evolution in the dependent variable. In fact, within a
season, it is possible for the score gained in some close matches to follow a trend. Developing this
intuition, we implemented a dynamic panel regression model, where the first lag of mean_points is
included in the regressors (named lag1_mean_points).
As a preliminary descriptive analysis, we compared the mean of variable mean_points only for teams
which had changed coach, calculated for the matches before and after changes. As shown in Table 5,
we observed some conflicting results: during the 2013/2014 season, the average score increases after
changes; during the 2015/2016 season, it decreases; and during the other two seasons, it remains
stable.
The coach turnover is measured for each team during a season by a dummy step variable, named
1stchange, that captures only the first coach’s change (instances of further changes offer too few
observations). It takes a value of 0 for every match as long as the coach is not changed and then takes
value 1 from when a new coach takes over until the end of the season.
To reinforce the reliability of our estimates, we included two independent variables linked with player
performance during a match:
- shots_on_target, which refers to the number of shots made by each team in each match, in
the other team’s goal
- shots_suffered, which refers to the number of shots suffered by each team in each match, in
their own goal (i.e. goals conceded by the team).
Electronic copy available at: https://ssrn.com/abstract=3475379

10
III. Empirical results
In this section, we show the main results for each of the three types of analysis, having estimated the
effect of changing coaches on team performance, when the latter is measured with the three indicators
explained in the previous section.
A. Performance measure 1: player marks
We first performed a cross-section regression analysis in which the dependent variables are the
different marks given to players, categorised according to player role, after each match. The
coefficient of interest is associated with coach change within a season (data are for leagues from
2012/2013 to 2014/2015).
(1) Player performancei = α + β1coach_change1i + β2coach_change2i + εi,
i=1,…,N. The results of regression (1) are summarised in Table 5.
[TABLE 5 ABOUT HERE]
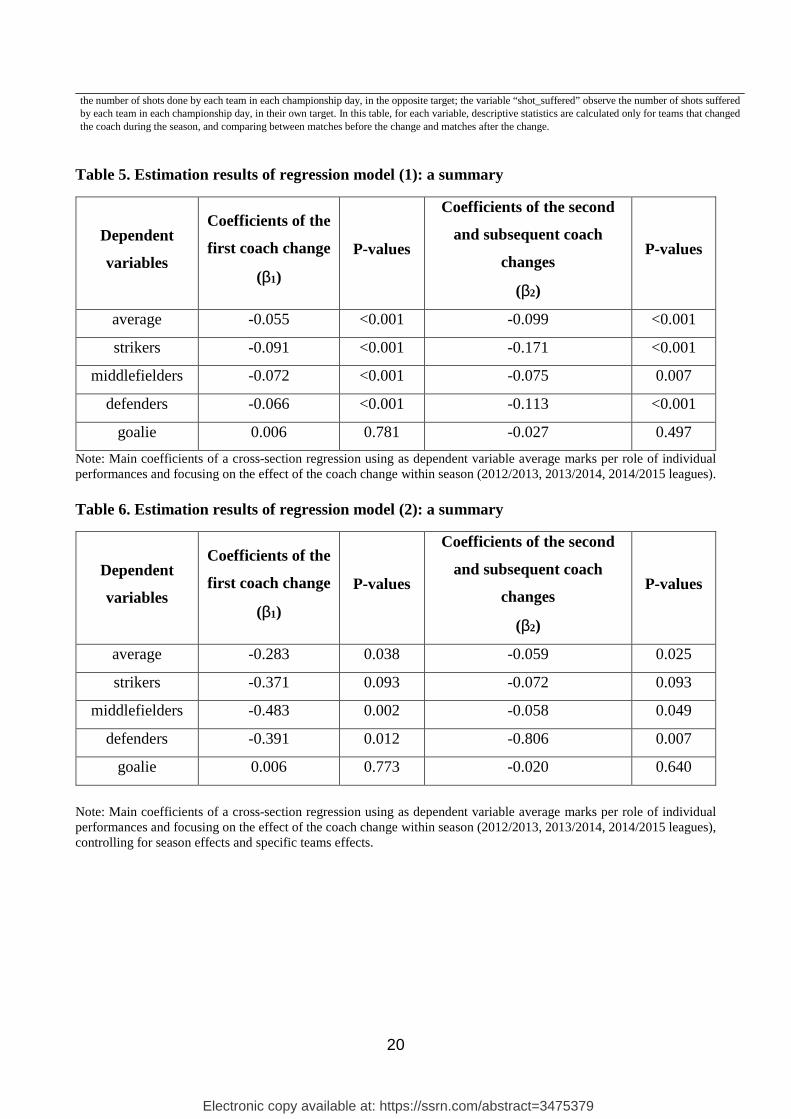
In general, coach change appears to have a negative effect on the team, as well as on the different
sub-categories of players. All the coefficients are negative, which means that, compared to the
performance of the first coach, on average, players perform slightly worse under the second and
subsequent coaches. In addition, the magnitude of the second coefficients is larger than the first,
which suggests that the second and subsequent coaches worsen player performance to a larger extent
than the first coach change. The only exception to this trend is the case of the goalkeeper, upon whom
the change of coach was found to have no effect.
Despite this clear trend, the magnitude of the coefficients indicates that the change in player
performance due to the coach’s influence is minimal. Considering an average mark of 6, a change of
-0.1 represents a 2% decrease in performance.
We then controlled for teams and season in the regressions using the following equation:
Electronic copy available at: https://ssrn.com/abstract=3475379

11
(2) Player performancei = α + β1coach_change1i + β2coach_change2i + γ1season1i +
γ2season2i + γ3season3i + θ1team1i +…+ θ30team30i + εi
i=1,…,N. The coefficients for coach change in regression (2) are shown in Table 6.
[TABLE 6 ABOUT HERE]
While seasons were not found to have any significant effect on player performance, the team effect
is prominent for specific teams. Particularly in the case of the strikers, the coach change effect is
insignificant. This may be because, like goalkeepers, but to a lesser extent, striker is a role depending
less on coaching style or strategy and more on individual talent.
Looking at the team effect, our reference team is Juventus, and the coefficients represent how the
other teams perform compare to this reference. In our case, as expected, the fact of being a player on
a team different from Juventus produces a negative effect on the performance of the player.
Player performance data is based only on the marks given by La Gazzetta dello Sport, the most
important Italian sport newspaper. Therefore, there is a possibility of bias in the evaluation process:
players on stronger teams often face a higher expectations. For example, with the same match
parameters, a midfielder who plays for Juventus will have a lower mark than a midfielder of Verona
will.
B. Performance measure 2: points made by a team in a season
We estimated two types of regression: one using the regressor change to estimate the effect of
changing at least one coach and another using the regressor changes_number to estimate the effect
of multiple coach changes:
(3) ln_pointsit = αi + β1changeit + β2ln(salary_cap)it + β3ln(matches_drawn)it +
β4ln(average_age)it + uit
(4) ln_pointsit = αi + β1number_changesit + β2ln(salary_cap)it + β3ln(matches_drawn)it +
β4ln(average_age)it + uit
Electronic copy available at: https://ssrn.com/abstract=3475379

12
All the variables were previously transformed into logarithms to mitigate the presence of asymmetries
in their empirical distributions. Since variables change and changes_number are endogenous, we
implemented a two-stage instrumental variable estimation procedure. This procedure allowed us to
instrument, in the first stage, the two endogenous variables, by regressing change and
changes_number on a set of exogenous variables. We call the instrumented variables change_fitted
and changes_number_fitted. It is worth noting that, given the nature of the variables change (binary)
and number_changes (count), the first-stage regression models are Logit and Poisson regressions,
respectively (see Tables 7 and 8). In the second stage, regressions (3) and (4) are estimated by
replacing change and number_changes with change_fit and number_changes_fit and including
different variables to collect information about many different aspects of the team’s performance.
[TABLES 7 AND 8 ABOUT HERE]
The estimates of regression models (3) and (4) in Table 9 show that coach turnover generates a
negative effect on the points obtained by the end of a league. In both the models, the estimate
coefficient for the variable that captures coach change is negative and statistically significant,
confirming the results presented in subsection A of Section III.
[TABLE 9 ABOUT HERE]
The magnitude of the two coefficients is similar: -0.34 for variable change_fitted and -0.3 for
variable changes_number_fitted. This means that, after the first substitution, further changes are not
influential.
Focusing on the other regressors, we noted that the average increase of salary cap significantly
improves team performance (+0.17) in model (3), with the fitted dummy variable. The average age
of teams was not found to be significant in either model.
Finally, we computed the Hausman’s specification test, which was useful to demonstrate the stronger
validity of the instrumental variable method over the simple least-squares regression without
instruments. The test rejects the null hypothesis of superior efficiency of the simple least squares
regression (p-value less than 0.001 in both models with dummy and count variable), supporting our
choice of the instrumental variables method.
Electronic copy available at: https://ssrn.com/abstract=3475379
13
C. Performance measure 3: average score of teams during a football season
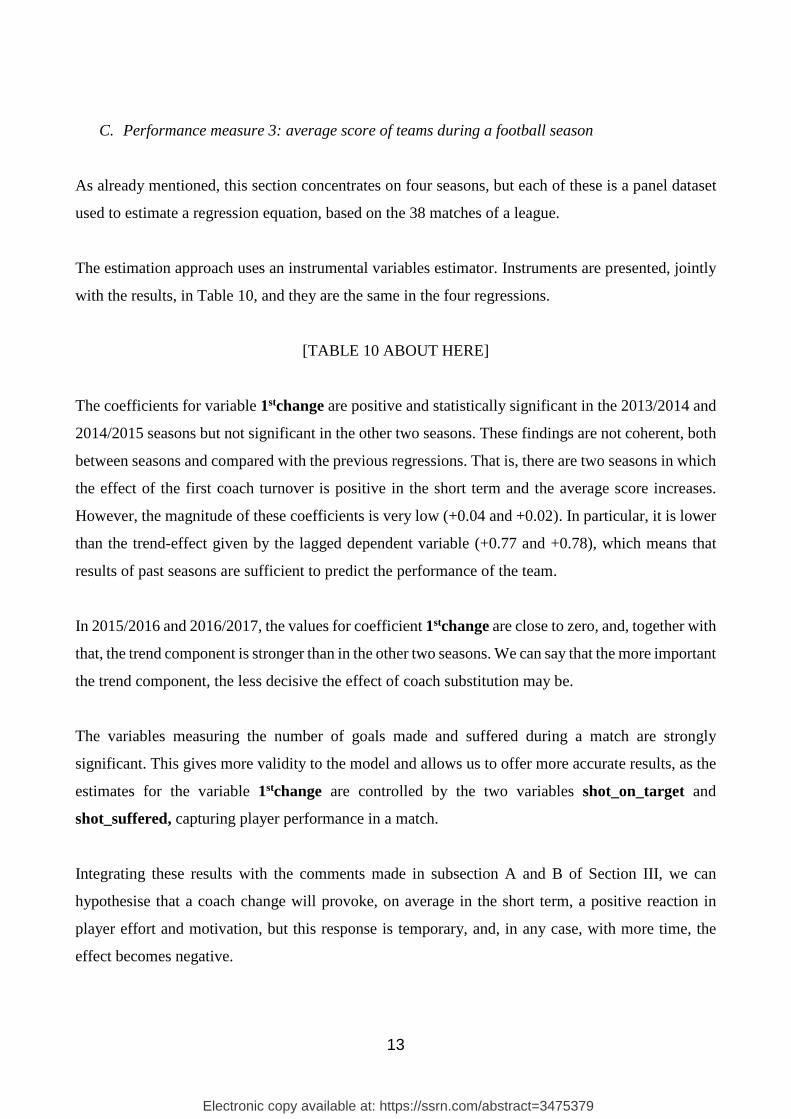
As already mentioned, this section concentrates on four seasons, but each of these is a panel dataset
used to estimate a regression equation, based on the 38 matches of a league.
The estimation approach uses an instrumental variables estimator. Instruments are presented, jointly
with the results, in Table 10, and they are the same in the four regressions.
[TABLE 10 ABOUT HERE]
The coefficients for variable 1stchange are positive and statistically significant in the 2013/2014 and
2014/2015 seasons but not significant in the other two seasons. These findings are not coherent, both
between seasons and compared with the previous regressions. That is, there are two seasons in which
the effect of the first coach turnover is positive in the short term and the average score increases.
However, the magnitude of these coefficients is very low (+0.04 and +0.02). In particular, it is lower
than the trend-effect given by the lagged dependent variable (+0.77 and +0.78), which means that
results of past seasons are sufficient to predict the performance of the team.
In 2015/2016 and 2016/2017, the values for coefficient 1stchange are close to zero, and, together with
that, the trend component is stronger than in the other two seasons. We can say that the more important
the trend component, the less decisive the effect of coach substitution may be.
The variables measuring the number of goals made and suffered during a match are strongly
significant. This gives more validity to the model and allows us to offer more accurate results, as the
estimates for the variable 1stchange are controlled by the two variables shot_on_target and
shot_suffered, capturing player performance in a match.
Integrating these results with the comments made in subsection A and B of Section III, we can
hypothesise that a coach change will provoke, on average in the short term, a positive reaction in
player effort and motivation, but this response is temporary, and, in any case, with more time, the
effect becomes negative.
Electronic copy available at: https://ssrn.com/abstract=3475379

14
In this paper, we have considered only coach changes within the same season. A possible further
improvement of this research might include an analysis of the effects of such a change during the
summer break between seasons. However, as already mentioned, it is important to note that analysing
coach replacements between seasons does not allow for distinguishing between effects caused by the
coach change and effects caused by other factors, such as different team composition and different
quality of opponents.
IV. CONCLUSIONS
There is often said to be a close link between sports economics and labour economics. Using a highly
original dataset from Italian Serie A in the seasons from 2007-2008 to 2016-2017 to analyse employee
behaviour and morale after a management (coach) change, we have gained a few insights.
In our analysis, and consistent with the available literature, coach replacement was not found to be
useful in influencing team performance and therefore does not have any significant effect on the
team’s results.
We used an instrumental variable approach to eliminate the problem of endogeneity between the
progress of a team’s performance within the season and the decision of changing a coach. Our
estimates show no significant impact of coach changes in the long term.
When coach turnover was found to have an effect on team performance, it was only in the very short
term and, we believe, mainly driven by increased motivation and effort of players, which probably
contributed to a streak of wins. With more time, however, this effect disappears and, in fact, turns out
to be negative.
How do these results translate to the corporate environment? We stressed in the introduction the
usefulness of sports data due to their objectivity and the quasi-experimental nature of the sports
environment, both of which help the researcher to objectively measure performance and productivity
of workers—in this case, players.
We believe that the results found in this paper may of interest as potential insights, specifically for
small companies, with regard to their industrial organisation and the possible effects of management
turnover on economic performance.
Electronic copy available at: https://ssrn.com/abstract=3475379

15
The effects of a company management renewal would require an assessment period longer than one
year, so it is necessary to be prudent in the generalisation of these results to a corporate environment.
Nonetheless, we found a significant negative effect of coach change on individual performance of
players and, due to the similarities between a football team and a corporate team as complex systems,
our empirical analysis provides evidence for the importance of organisational strategy to employee
morale.
Electronic copy available at: https://ssrn.com/abstract=3475379
16
Tables Table 1. Descriptive statistics (I)
Variable Obs Mean Std. Dev. Min Max
Goalie 2354 6.13 .62 3 9
Defenders 10169 5.84 .44 3.75 7.38
Middlefield
players
11519 5.96 .43 4 7.5
Strikers 5673 5.97 .63 4 9
Average 7429 5.97 .39 4.4075 7.325
Source: Individual performances per role in Serie A (seasons 12/13, 13/14 and 14/15) from “La Gazzetta dello Sport”.
Electronic copy available at: https://ssrn.com/abstract=3475379

17
Table 2. Descriptive statistics (II)
Variables Mean Std. Dev. Min Max Observations points overall 51.945 16.29 18 102 N= 200
between 13.935 20 80.1 n= 33 within 9.414 26.845 76.833 T-bar= 6.06
change overall 0. 435 0. 497 0 1 N= 200 between 0. 315 0 1 n= 33 within 0. 432 -0. 453 1. 335 T-bar= 6.06
number_changes overall 0. 645 0. 873 0 4 N= 200 between 0. 649 0 2 n= 33 within 0. 722 -1.243 3.2 T-bar= 6.06
salary_cap overall 41. 648 35. 566 8.3 160 N= 200 between 29. 749 9.8 112.89 n= 33 within 11.052 -0.051 88.898 T-bar= 6.06
matches_drawn overall 10.005 2. 85 3 18 N= 200 between 1. 502 6.5 13 n= 33 within 2. 591 4.227 16. 755 T-bar= 6.06
average_age overall 27. 178 1. 284 23.6 30.5 N= 200 between 1.019 24.7 28.755 n= 33 within 0. 949 23.368 29. 54 T-bar= 6.06
goal_scored overall 50.045 14.022 18 94 N= 200 between 11.173 32 69.6 n= 33 within 8.639 19. 845 77.845 T-bar= 6.06
goal_conceded overall 50.21 11.5 20 84 N= 200 between 10. 081 31.5 82.5 n= 33 within 7. 806 31.61 74.71 T-bar= 6.06
past_changes overall 11.64 5.195 2 31 N= 200 between 4.134 4 21.333 n= 33 within 2.226 6.44 23.64 T-bar= 6.06
Note: The listed variables are observed for a Panel of 33 teams of Italian Serie A and 10 football seasons, from 2007/2008 to 2016/2017. In each season, only 20 of the 33 teams participated at the Serie A championship, because some of them are in Serie B. So, the panel structure is unbalanced, and number of observations is 20*10=200. For each variable, are calculated the “overall” mean and the “overall”, “between” and “within” standard deviation. Variable “points” observes the numbers of points that each team obtain in each season; variable “change” is a dummy variable that observes, for each team in each season, the change of at least one coach during the season; variable “number_changes” counts how many coaches have been changed during each season, by each team; variable “salary_cap” observes, for each season, the aggregate salary of the players in a team; variable “matchs_drawn” observes the number of matches that each team drew during each season; variable “average_age” observes the average age of the players that played at least one match during the season; variable “goal_scored” observes the number of goals that each team scored in each season; variable “goal_conceded” observes the number of goals that each teams conceded in each season; variable “past_changes” observes the number of coaches that each team has hired during the previous ten seasons.
Electronic copy available at: https://ssrn.com/abstract=3475379

18
Table 3. Analysis of endogeneity for variables goal_scored and goal_conceded
Football season 2013/2014 2014/2015 2015/2016
(1) (2) (3) Dependent variable: goal_scored
shots_on_target 0.22*** (0.01)
0.164*** (0.01)
0221*** (0.01)
lag1_points -0.015 (0.03)
-0.031 (0.02)
-0.021 (0.02)
lag2_points -0.062 (0.03)
-0.008 (0.03)
0.03 (0.03)
lag3_points 0.035 (0.02)
-0.041 (0.02)
0.03 (0.03)
Wald chi-2(4) (p-value)
217.6 (0.000)
249.22 (0.000)
269.2 (0.000)
(4) (5) (6)
Dependent variable: goal_conceded
shots_suffered 0.223*** (0.01)
0.161*** (0.01)
0.233*** (0.01)
lag1_points -0.004 (0.02)
0.003 (0.02)
0.006 (0.02)
lag2_points -0.011 (0.03)
-0.002 (0.03)
0.023 (0.03)
lag3_points -0.002 (0.02)
-0.001 (0.03)
0.029 (0.029)
Wald chi-2(4) (p-value)
403.4 (0.000)
178.8 (0.000)
364.19 (0.000)
Note: The models (1), (2), (3) are estimated using regression for panel data (fixed effects). Each model refers to one football season were cross-sectional dimension is N=20 teams, and time-series dimension in T=38 championship days. First three days are dropped because of lagged variables, so the number of observations is 700 (there are some missing values so the number of observation is 698 in models 1 and 2, 692 in models 4 and 5). Numbers in brackets, under estimated regression coefficients, are bootstrap standard errors. The t-test (*p<0.05;**p<0.01;***p<0.001) shows that in all the models only the variables “shots_on_target” and “shots_suffered” are significant to explicate respectively “goal_scored” and “goal_conceded”. Variables which refers to the lagged points made by teams, until the third lag, are not statistically significant in the models, so there isn’t a causality effect between the points gained in the previous matches and the numbers of goals scored and conceded in a match.
Electronic copy available at: https://ssrn.com/abstract=3475379

19
Table 4. Descriptive statistics (III) (1) (2) (3) (4) 2013/2014 2014/2015 2015/2016 2016/2017
Variables
mean_points
before change mean overall 0.919 0.92 1.352 1.069
std. dev. overall 0.493 0.475 0.61 0.702
between 0.39 0.362 0.643 0.542
within 0.34 0.371 0.371 0.433 after change mean overall 1.029 0.934 1.077 1.081
std. dev. overall 0.277 0.294 0.374 0.521
between 0.274 0.284 0.384 1.445
within 0.091 0.123 0.108 0.101 shots_on_target before change mean overall 4.725 4.013 4.545 4.53
std. dev. overall 2.555 2.371 2.48 2.043
between 0.878 1.182 0.883 0.906
within 2.433 2.154 2.338 1.942 after change mean overall 4.787 5.606 4.497 4.99
std. dev. overall 2.748 2.87 2.516 2.643
between 1.08 0.993 1.012 1.445
within 2.612 2.714 2.338 2.26
shots_suffered before change mean overall 5.28 5.753 4.933 6.037
std. dev. overall 2.534 2.747 2.503 2.942
between 0.904 0.632 0.702 0.872
within 2.409 2.681 2.401 2.844 after change mean overall 5.435 6.478 5.124 5.577
std. dev. overall 3.001 2.981 2.693 3.074
between 1.045 1.014 0.852 0.728
within 2.864 2.858 2.578 3.005 N: Observations number before change after change
164 216
73 117
165 177
81 109
n: Teams number
10 5 9 5
T: number of days before change after change
16.4 21.6
14.6 23.4
18.3 19.6
16.2 21.8
Note: The descriptive statistics reported in the table are referred to teams that have changed coach. These variables are observed for four football seasons of Italian Serie A, from 2013/2014 to 2016/2017, each one is a panel consisting in 20 teams (cross-sectional dimension) and 38 championship days (time series dimension). The variable “mean_points” is the cumulative mean points, by championship days, for each team; the variable “shots_on _target” observe
Electronic copy available at: https://ssrn.com/abstract=3475379
20
the number of shots done by each team in each championship day, in the opposite target; the variable “shot_suffered” observe the number of shots suffered by each team in each championship day, in their own target. In this table, for each variable, descriptive statistics are calculated only for teams that changed the coach during the season, and comparing between matches before the change and matches after the change.
Table 5. Estimation results of regression model (1): a summary
Dependent
variables
Coefficients of the
first coach change
(β1)
P-values
Coefficients of the second
and subsequent coach
changes
(β2)
P-values
average -0.055 <0.001 -0.099 <0.001
strikers -0.091 <0.001 -0.171 <0.001
middlefielders -0.072 <0.001 -0.075 0.007
defenders -0.066 <0.001 -0.113 <0.001
goalie 0.006 0.781 -0.027 0.497
Note: Main coefficients of a cross-section regression using as dependent variable average marks per role of individual performances and focusing on the effect of the coach change within season (2012/2013, 2013/2014, 2014/2015 leagues). Table 6. Estimation results of regression model (2): a summary
Dependent
variables
Coefficients of the
first coach change
(β1)
P-values
Coefficients of the second
and subsequent coach
changes
(β2)
P-values
average -0.283 0.038 -0.059 0.025
strikers -0.371 0.093 -0.072 0.093
middlefielders -0.483 0.002 -0.058 0.049
defenders -0.391 0.012 -0.806 0.007
goalie 0.006 0.773 -0.020 0.640
Note: Main coefficients of a cross-section regression using as dependent variable average marks per role of individual performances and focusing on the effect of the coach change within season (2012/2013, 2013/2014, 2014/2015 leagues), controlling for season effects and specific teams effects.
Electronic copy available at: https://ssrn.com/abstract=3475379

21
Table 7. first step of IV regression for endogenous variable "change"
Dependent variable: change (1)
Individual effects fixed effects
ln(goal_scored) -5.1 (2.8)
ln(goal_conceded) 4.04*** (1.09)
past_changes -0.14 (0.1)
ln(salary_cap) 0.47 (0.65)
ln(matches_drawn) 1.73* (0.68)
ln(average_age) -1.92 (6.44)
Number of observations 188 Number of groups 25 Wald chi2(6) (p-value)
25.83 (0.000)
Note: Model (1) is the first step, in the Instrumental Variable regression, for endogenous variable "change" (Table 2, model (1)). Estimates are made using a Logistical regression for panel data. Dataset includes observations for 33 teams of Italian Serie A and 9 seasons, from 2007/2008 to 2016/2017. Each season, only 20 of the 33 teams participate at the Serie A championship, because some of them are in Serie B, so the panel structure is unbalanced. Estimate uses only 25 of the total 33 groups, 8 groups (12 observations) are dropped because of all positive or all negative outcomes. Numbers in brackets, under estimated regression coefficients, are bootstrap standard errors. Dependent dummy variable is "change" (0,1). Instruments used in this first step are "ln(goal_scored)", "ln(goal_conceded)" and "past_changes". T-test (*p<0.05;** p<0.01;*** p<0.001) shows that only "ln(goal_conceded)" is significant between instruments. Fitted values from this model are called "change_fitted".
Electronic copy available at: https://ssrn.com/abstract=3475379
22
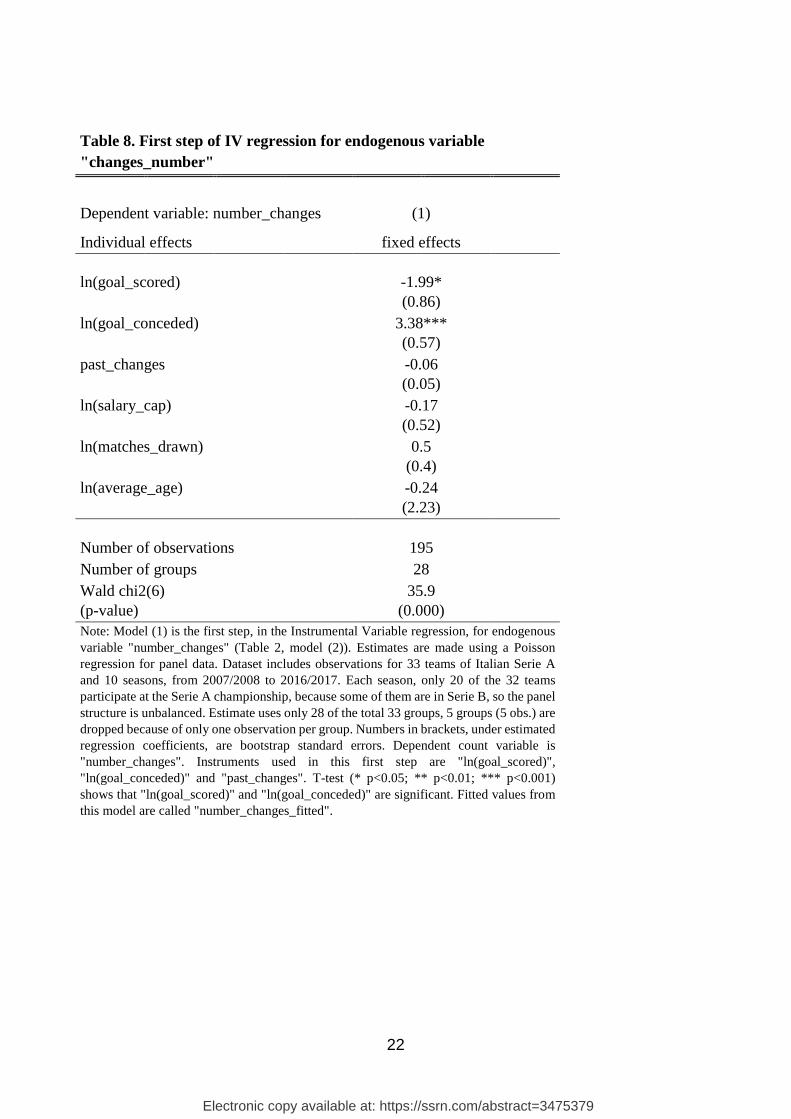
Table 8. First step of IV regression for endogenous variable "changes_number"
Dependent variable: number_changes (1)
Individual effects fixed effects
ln(goal_scored) -1.99* (0.86)
ln(goal_conceded) 3.38*** (0.57)
past_changes -0.06 (0.05)
ln(salary_cap) -0.17 (0.52)
ln(matches_drawn) 0.5 (0.4)
ln(average_age) -0.24 (2.23)
Number of observations 195 Number of groups 28 Wald chi2(6) (p-value)
35.9 (0.000)
Note: Model (1) is the first step, in the Instrumental Variable regression, for endogenous variable "number_changes" (Table 2, model (2)). Estimates are made using a Poisson regression for panel data. Dataset includes observations for 33 teams of Italian Serie A and 10 seasons, from 2007/2008 to 2016/2017. Each season, only 20 of the 32 teams participate at the Serie A championship, because some of them are in Serie B, so the panel structure is unbalanced. Estimate uses only 28 of the total 33 groups, 5 groups (5 obs.) are dropped because of only one observation per group. Numbers in brackets, under estimated regression coefficients, are bootstrap standard errors. Dependent count variable is "number_changes". Instruments used in this first step are "ln(goal_scored)", "ln(goal_conceded)" and "past_changes". T-test (* p<0.05; ** p<0.01; *** p<0.001) shows that "ln(goal_scored)" and "ln(goal_conceded)" are significant. Fitted values from this model are called "number_changes_fitted".
Electronic copy available at: https://ssrn.com/abstract=3475379

23
Table 9. Second step of IV regression for coach change effect on team's final results
Dependent variable: ln(points) (1) (2)
Individual effects fixed effects fixed effects
change_fitted -0.34*** (0.07)
changes_number_fitted -0.3*** (0.03)
ln(salary_cap) 0.17** (0.06)
0.08 (0.06)
ln(matches_drawn) -0.1** (0.03)
-0.09** (0.03)
ln(average_age) 0.09 (0.36)
0.16 (0.34)
�� within 0.21 0.58
between 0.7 0.43 overall 0.61 0.58 Number of observations 200 200 Number of groups 33 33 Wald chi2(4) (p-value)
40.31 (0.000)
112.82 (0.000)
Note: The models (1) and (2) are the second step of the Instrumental Variables regression. Hausman test proves that instrumental variables regression is better specified than standard regression without instruments (Tab.1). The explanatory variables "change_fitted" and "number_changes_fitted" are both predicted variables, at first step of IVregression. Estimates are made using unbalanced panel dataset of 33 teams of Italian Serie A, observed for 10 seasons, from 2007/2008 to 2016/2017. Each season, only 20 of the 33 teams participate at the Serie A championship, because some of them are in Serie B. So the panel structure is unbalanced, and number of observations is 20*10=200. Both estimates, in columns (1) and (2), are made with GLS method for linear model, with individual fixed effects and bootstrap standard errors. Numbers in brackets, under estimated regression coefficients, are robust standard errors. Model (1) uses fitted variable “change_fitted" to observe the predicted change of at least one coach. Model (2) uses fitted count variable “number_chages_fitted” to observe the predicted number of coach changes during the season. Estimated coefficients for these two variables are negative and t-tests (*p<0.05; **p<0.01; ***p<0.001) show the significance of results. Furthermore, in model (1), estimated coefficient for the salary cap of the teams, ln(salary_cap), is positive and statistically significant and estimated coefficient for the number of matches drawn, ln(matches_drawn), is negative and statistically significant. In model (2), only estimated coefficient for the number of matches drawn, ln(matches_drawn), is negative and statistically significant.
Electronic copy available at: https://ssrn.com/abstract=3475379

24
Table 10. Coach change effect on the single match result
Dependent variable: mean_points (1) (2) (3) (4)
Football season 2013/2014 2014/2015 2015/2016 2016/2017
lag1_mean_points 0.77*** (0.03) 0.78*** (0.03) 0.86*** (0.03) 0.81*** (0.02)
1stchange 0.04** (0.01) 0.02** (0.01) -0.002 (0.01) -0.0002 (0.02)
shots_on_target 0.01*** (0.001) 0.01*** (0.001) 0.01*** (0.001) 0.01*** (0.001)
shots_suffered -0.01*** (0.001) -0.01*** (0.001) -0.01*** (0.001) -0.01*** (0.001)
R� within 0.76 0.78 0.82 0.76
between 0.99 0.99 0.99 0.99
overall 0.97 0.96 0.96 0.97
Number of observations 676 666 680 680
Wald chi-2(4) (p-value) 1780.04 (0.000)
627.93 (0.000)
715.53 (0.000) 1120.2 (0.000)
F-test that all u_i=0 (p-value) 5.66 (0.000) 5.54 (0.000) 2.66 (0.000) 4.01 (0.000)
Instrumented: lag1_mean_points
Insrtuments: change, shots_on_target, shots_suffered, lag2(mean_points), lag3(mean_points), lag4(mean_points), lag1(shots_on_target), lag1(shots_suffered)
Note: The models (1), (2), (3) and (4) are estimated using dynamic regression for panel data (fixed effects), with Anderson-Hsiao method. Each model refers to one football season were cross-sectional dimension is N=20 teams, and time-series dimension in T=38 championship days. The F-tests reject the null hypothesis that all individual fixed effects are equal to zero. First four days are dropped because of lagged variables, so the number of observations is 680 (there are some missing values in model 1 and 2 so the number of observation is 676 and 666). The instruments for "lag1_mean_points" are "lag2(mean_points)", "lag3(mean_points)", "lag4(mean_points)", "lag1(shots_on_target)" and "lag1(shots_suffered)". Variable "1stchange" is a dummy variable, that observes only the first coach change (ulterior changes have only few observations). Numbers in brackets, under estimated regression coefficients, are bootstrap standard errors. The t-test (*p<0.05;**p<0.01;***p<0.001) shows that "lag1_mean_points" is always significant and with positive sign. Variable "1stchange " is significant and positive in models (1) and (2), not significant in model (3) and (4). We can conclude that first coach change has a positive and statistically significant effect on the mean points of the following match in seasons (1) and (2), excluding the autocorrelation effect; it has null effect in seasons (3) and (4)
Electronic copy available at: https://ssrn.com/abstract=3475379

25
REFERENCES
• Audas, R., Dobson, S., & Goddard, J. (2002). ‘The impact of managerial change on team
performance in professional sports’, Journal of Economics and Business, 54, 633-650.
• Audas, R., Goddard, J., & Rowe, G. (2006). ‘Modelling employment durations of NHL head coaches: Turnover and post-succession performance’, Managerial and Decision Economics, 27, 293-306.
• Balduck, A., & Buelens, M. (2007). ‘Does sacking the coach help or hinder the team in the short term? Evidence from Belgian soccer’, Working Papers of Faculty of Economics and Business Administration, Ghent University, Belgium 07/430.
• Bonnier, A., & Bruner, R. (1989). ‘An analysis of stock price reaction to management change in distressed firms’, Journal of Accounting and Economics, 11, 95-106.
• Brown, M. C. (1982). ‘Administrative succession and organizational performance: The succession effect’, Administrative Science Quarterly, 27, 1-16.
• Bruinshoofd, A., & Ter Weel, B. (2004). ‘Manager to go? Performance dips reconsidered with evidence from Dutch football’, European Journal of Operational Research, 148, 233-246.
• De Paola, M., Scoppa, V. (2011). ‘The effects of managerial turnover: evidence from coach dismissals in Italian soccer teams’, Journal of Sport Economics, 1-17.
• Fabianic, D. (1994). ‘Managerial change and organizational effectiveness in major league baseball: Findings for the eighties’, Journal of Sport Behavior, 17, 135-147.
• Hoffler, F., Sliwka, D. (2003). ‘Do newbrooms sweep clean?When and why dismissing a manager increases the subordinates performances’, European Economic Review, 47, 877-890.
• Huson, M., Malatesta, P., & Parrino, R. (2004). Managerial succession and firm performance. Journal of Financial Economics, 74, 237-275.
• Khanna, N., & Poulsen, A. (1995). ‘Managers of financially distressed firms: Villains or scapegoats?’, Journal of Finance, 50, 919-940.
• Khurana, R., & Nohria, N. (2000). The performance consequences of CEO turnover. SSRN Working Paper Series.
• Koning, R. H. (2003). An econometric evaluation of the firing of a coach on team performance. Applied Economics, 35, 555-564.
• Maximiano, S. (2006). Does replacing a manager improve performance? University of Amsterdam: Mimeo.
• McTeer, W., White, P., & Persad, S. (1995). Manager/coach mid-season replacement and team performance in professional team sport. Journal of Sport Behaviour, 18, 58-68.
• Pieper, J., S. Nuesch and E. Franck (2014). How performance expectations affect managerial replacement decisios. Schmalenbach Business Review, 66, 5-23.
• Reinganum, M. (1985). The effect of executive succession on stock holder wealth. Administrative Science Quarterly, 30, 46-60.
• Salomo, S & Teichmann, K 2000, 'The relationship of performance and managerial succession in the German premier football league' European Journal for Sport Management (EJSM), vol. 7, pp. 99-199.
• Warner, J., Watts, R., & Wruch, K. (1988). Stock prices and top management changes. Journal of Financial Economics, 20, 461-492.
Electronic copy available at: https://ssrn.com/abstract=3475379

26
• Weisbach, M. (1988). Outside directors and CEO turnover. Journal of Financial Economics, 20, 431-460.
• Wirl, F., & Sagmeister, S. (2008). Changing of the guards. New coaches in Austria’s premier football league. Empirica, 47, 1-12.
Electronic copy available at: https://ssrn.com/abstract=3475379

NOTE DI LAVORO DELLA FONDAZIONE ENI ENRICO MATTEI Fondazione Eni Enrico Mattei Working Paper Series
Our Working Papers are available on the Internet at the following addresses:
http://www.feem.it/getpage.aspx?id=73&sez=Publications&padre=20&tab=1
NOTE DI LAVORO PUBLISHED IN 2019
1. 2019, FEP Series, Michel Noussan, Effects of the Digital Transition in Passenger Transport - an Analysis of Energy Consumption Scenarios in Europe
2. 2019, FEP Series, Davide Mazzoni, Digitalization for Energy Access in Sub-Saharan Africa : Challenges, Opportunities and Potential Business Models
3. 2019, ET Series, Edilio Valentini, Paolo Vitale, Uncertainty and Risk-aversion in a Dynamic Oligopoly with Sticky Prices
4. 2019, ET Series, Elkhan Richard Sadik-Zada, Andrea Gatto, Determinants of the Public Debt and the Role of the Natural Resources: A Cross-Country Analysis
5. 2019, ET Series, Jian-Xin Wu, Ling-Yun He, ZhongXiang Zhang, Does China Fall into Poverty-Environment Traps? Evidence from Long-term Income Dynamics and Urban Air Pollution
6. 2019, FEP Series, Pier Paolo Raimondi, Central Asia Oil and Gas Industry - The External Powers’ Energy Interests in Kazakhstan, Turkmenistan and Uzbekistan
7. 2019, ET Series, Bladimir Carrillo, Present Bias and Underinvestment in Education? Long-run Effects of Childhood Exposure to Booms in Colombia
8. 2019, ES Series, Luca Farnia, On the Use of Spectral Value Decomposition for the Construction of Composite Indices
9. 2019, ET Series, Francesco Menoncin, Sergio Vergalli, Optimal Stopping Time, Consumption, Labour, and Portfolio Decision for a Pension Scheme
10. 2019, FEP Series, Samuel Carrara, Assessing the Techno-economic Effects of the Delayed Deployment of CCS Power Plants
11. 2019, ET Series, Nicola Comincioli, Sergio Vergalli and Paolo M. Panteghini, Business Tax Policy under Default Risk
12. 2019, ET Series, Wolfgang Buchholz, Richard Cornes, Dirk Rübbelke, Matching in the Kolm Triangle: Interiority and Participation Constraints of Matching Equilibria
13. 2019, FEP Series, Achim Voss, The Adverse Effect of Energy-Efficiency Policy
14. 2019, ES Series, Angelo Antoci, Simone Borghesi, Giulio Galdi and Sergio Vergalli, Adoption Gaps of Environmental Adaptation Technologies with Public Effects
15. 2019, ES Series, Ángela García-Alaminos and Santiago J. Rubio, Emission Taxes, Feed-in Subsidies and the Investment in a Clean Technology by a Polluting Monopoly
16. 2019, ES Series, Paolo Casini, Edilio Valentini, Emissions Markets with Price Stabilizing Mechanisms: Possible Unpleasant Outcomes
17. 2019, FEP Series, Kristina Govorukha, Philip Mayer, Dirk Rübbelke, Stefan Vögele, Economic Disruptions in Long-Term Energy Scenarios – Implications for Designing Energy Policy
Electronic copy available at: https://ssrn.com/abstract=3475379

18. 2019, ES Series, Luca Farnia, Laura Cavalli and Sergio Vergalli, Italian Cities SDGs Composite Index: A Methodological Approach to Measure the Agenda 2030 at Urban Level
19. 2019, FEP Series, Samuel Carrara, Reactor Ageing and Phase-out Policies: Global and European Prospects for Nuclear Power Generation
20. 2019, ET Series, Banchongsan Charoensook, On the Interaction between Small Decay, Agent Heterogeneity and Diameter of Minimal Strict Nash Networks in Two-way Flow Model: A Note
21. 2019, ETA Series, Maria Rosaria Alfano, Claudia Cantabene, Damiano Bruno Silipo, Mafia Firms and Aftermaths
22. 2019, ETA Series, Michele G. Giuranno, Marcella Scrimitore, Giorgos Stamatopoulos, Vertical Integration under an Optimal Tax Policy: a Consumer Surplus Detrimental Result
23. 2019, ETA Series, Alessandro Argentieri, Luciano Canova, Matteo Manera, Coaches on Fire or Firing the Coach? Evidence of the Impact of Coach Changes on Team Performance from Italian Serie A
Electronic copy available at: https://ssrn.com/abstract=3475379

Fondazione Eni Enrico Mattei Corso Magenta 63, Milano – Italia
Tel. +39 02.520.36934Fax. +39.02.520.36946
E-mail: [email protected] www.feem.it
Electronic copy available at: https://ssrn.com/abstract=3475379
Related Documents