Workers’ Remittances and Economic Growth in the Philippines Alvin P. ANG, PhD * Research Associate Social Research Center, University of Santo Tomas 2 nd Floor Thomas Aquinas Research Complex University of Santo Tomas, Espana, Manila, Philippines 1015 Tel/Fax: 63-2-731-3535 E-mail: [email protected] ABSTRACT This paper considers the present issues surrounding the role of workers remittances and its contribution/effect on economic growth and development. In particular, this paper focuses on how such remittances have been able to spur development and growth. As a case study, the paper focuses on the Philippines, one of the countries in the world with a long history of sending workers abroad. In 2005, the Philippines received approximately US$11Bn of remittances, almost 10% of its GDP. It ranks as the 3 rd largest recipient of remittances in the world after India and Mexico. Along this line, the paper looks into the following areas: (a) remittance and overall growth, (b) linkages between remittances and microfinance, (c) tracing the contribution of remittances to countryside development, and (d) relationship between worker remittances and structural reform policies. We are also concerned at how these remittances have impacted the poor in general. This is important as the expected benefits have generally been unfelt at the level of the poor. We hypothesize that workers’ remittance have not been properly utilized into productive and investment uses in the Philippines. There are strong anecdotal evidences that show that most of these resources are being used to fund conspicuous consumption. Hence, we would like to find ways where these resources can be harnessed into funding development needs of the country. Key words: Remittances, Development, Migrant Workers JEL Classification: E21, F2, G21, J61, O16 * Author wishes to recognize the excellent research assistance provided by Leah Estacio (Instructor) Kevin Reyes and Paulo Mercado, (students) Social Science Department, Faculty of Arts and Letters, University of Santo Tomas and the comments of peers at the 2 nd Development Conference of the GRES, Bordeaux, France

Welcome message from author
This document is posted to help you gain knowledge. Please leave a comment to let me know what you think about it! Share it to your friends and learn new things together.
Transcript
Workers’ Remittances and Economic Growth in the Philippines
Alvin P. ANG, PhD*
Research Associate Social Research Center, University of Santo Tomas
2nd Floor Thomas Aquinas Research Complex University of Santo Tomas, Espana, Manila, Philippines 1015
Tel/Fax: 63-2-731-3535 E-mail: [email protected]
ABSTRACT
This paper considers the present issues surrounding the role of workers remittances and its contribution/effect on economic growth and development. In particular, this paper focuses on how such remittances have been able to spur development and growth. As a case study, the paper focuses on the Philippines, one of the countries in the world with a long history of sending workers abroad. In 2005, the Philippines received approximately US$11Bn of remittances, almost 10% of its GDP. It ranks as the 3rd largest recipient of remittances in the world after India and Mexico. Along this line, the paper looks into the following areas: (a) remittance and overall growth, (b) linkages between remittances and microfinance, (c) tracing the contribution of remittances to countryside development, and (d) relationship between worker remittances and structural reform policies. We are also concerned at how these remittances have impacted the poor in general. This is important as the expected benefits have generally been unfelt at the level of the poor. We hypothesize that workers’ remittance have not been properly utilized into productive and investment uses in the Philippines. There are strong anecdotal evidences that show that most of these resources are being used to fund conspicuous consumption. Hence, we would like to find ways where these resources can be harnessed into funding development needs of the country.
Key words: Remittances, Development, Migrant Workers JEL Classification: E21, F2, G21, J61, O16
*Author wishes to recognize the excellent research assistance provided by Leah Estacio (Instructor) Kevin Reyes and Paulo Mercado, (students) Social Science Department, Faculty of Arts and Letters, University of Santo Tomas and the comments of peers at the 2nd Development Conference of the GRES, Bordeaux, France
I. Introduction The Philippine version of the diaspora is a well-known phenomenon that can be traced back to the early 1900s when the first group of migrants arrived in Hawaii as sugar plantation workers (Ramos, 2006). As the centennial of this event unfolds, the number of Filipinos living and working abroad has reached roughly reached 10% of the total estimated population of 85 million (Commission on Filipino Overseas, 2004]). Called Overseas Filipino Workers (or OFWs), they are recognized as modern heroes in the Philippines. No doubt their remittances have shielded the economy from the wild swings of the Asian Financial Crisis in the late 1990s and have fueled the surge of the country’s foreign reserves to an all-time high of US$21Bn as of end-September this year. Contextualizing this phenomenon on a global scale, the 2005 Global Development Finance Report of the World Bank identifies the Philippines as the 3rd largest remittance-receiving country after Mexico and India. The same report also shows that these three countries also exhibit strong remittance growth over the past eight years. Undoubtedly, these data validate the observation that remittance now plays a major role in the development finance of developing countries. However, there is a need to validate how these remittances affect the overall development process of the remittance recipient countries. Considering that these are private flows, there has been no standard public policy on how these funds can be utilized for development. In particular, it will be interesting to answer how remittances have increased incomes, reduced poverty and contributed to balance development through its multiplier effects. Recent literature has posited that there exist positive relationships between remittance and economic growth, capital accumulation and poverty reduction of recipient countries. Though the results seem varied, most of them utilized cross country data and therefore there is a need to validate it further into country specific case studies. On a micro-basis, a number of household level studies and surveys have been done before and some stylized facts can be deduced from them (Chami et al., 2003). However, a gap still persists on the country level. Thus, this study attempts to contribute to the country-specific case study literature by exploring how a remittance- recipient country like the Philippines has made use of its remittances for development purposes. The paper will look into both the national and regional impact of remittances in the economy. The paper will be divided into five sections. The next section gives a general description of the OFW; the third, considers the macroeconomic impact of remittances; the fourth section discusses the regional effects; and the fifth section summarizes and concludes.
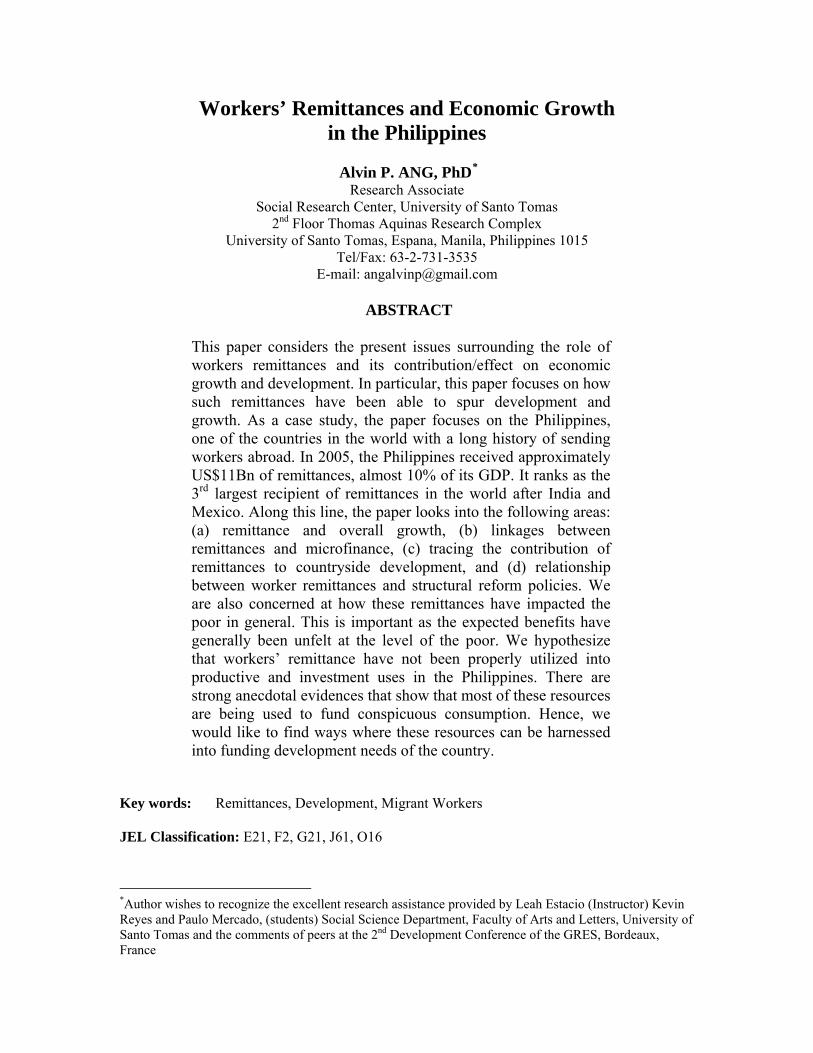
II. Historical Growth and Occupational Structure of OFWs and Remittances a. Waves of Deployment Deployment of Filipino workers abroad started to gain national importance in the early 70’s. Recorded annual deployment has reached new highs of almost a million deployed in 2005. More than 70% of these are land-based and the rest are sea-based. It is a well-known fact that the Philippine government has played major role in overseas employment. This is substantiated by the existence of two major government agencies, the Philippine Overseas Employment Administration (POEA) and the Overseas Workers Welfare Administration (OWWA), created to facilitate, regulate and ensure overseas employment.
Figure 1
Number of OFWs deployed annually
0100000200000300000400000500000600000700000800000900000
1000000
1972
1975
1978
1981
1984
1987
1990
1993
1996
1999
2002
Sea-Based
Oceania
Trust TerritoriesAmericas
Africa
Europe
AsiaMiddle-East
Long-term data shows that bulk of the workers were initially sea-based and in the Middle East. By the late 1980s, the emergence of the tiger economies in Asia, shifted direction of deployment into countries like Hong Kong, Singapore and Taiwan (See Figure 1). It can be noted also that part of the shift in the direction of deployment is the shift in the occupational structure. In the early 1970s, most of the workers were production and construction workers in the Middle East. The shift to Asia was mainly due to the increase in service workers, primarily domestic help. In late 1990s to the present, the occupational structure is again shifting towards to the professionals and highly skilled workers (See Figure 2). We can observe three occupational waves in the deployment of OFWs. These waves reveal substantial information about the nature and quality of workers and the amount they are sending. Firstly, we can observe that the pattern of deployment follows global economic development. Note that in the 1970s it was the construction boom in the Middle East and Northern Africa fueled by the petro-dollars. In the 1980s, the rising affluence of the Asian tiger economies led to the opening of domestic help and
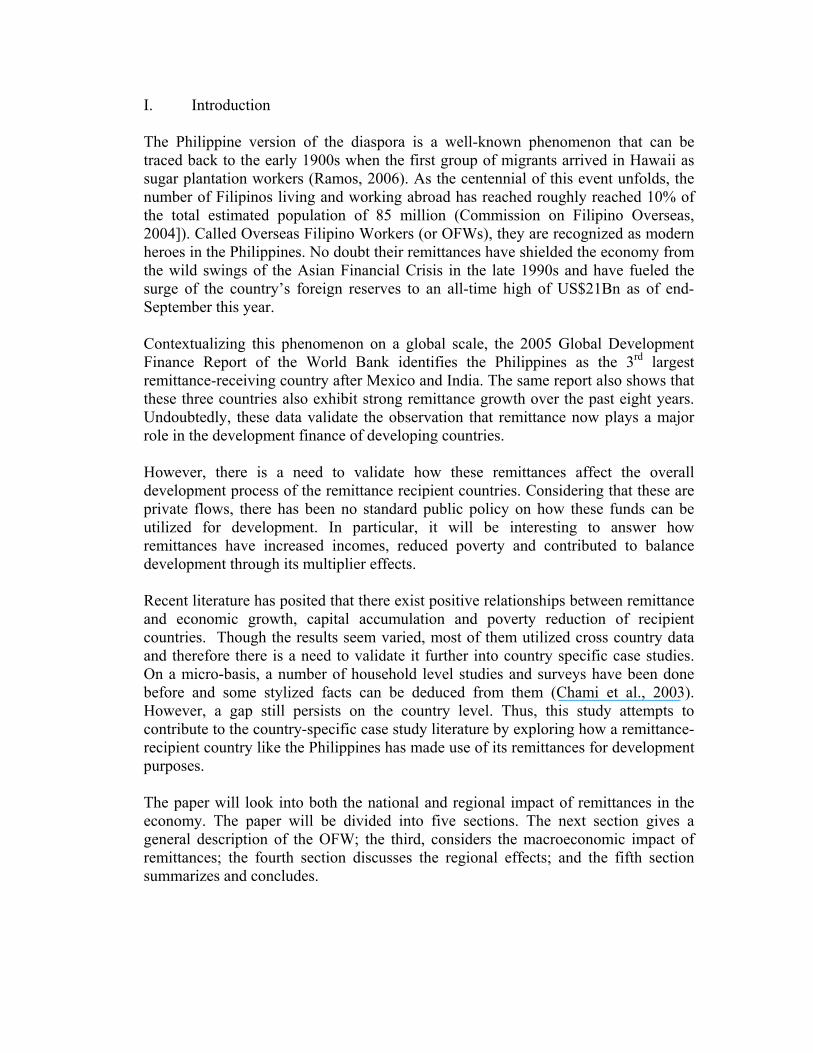
blue collar opportunities; while in the 1990s to the present, the knowledge economy and the aging population of the developed countries called the higher educated professionals and technical workers. Second, despite the changing demand pattern towards worker quality and higher skills, the number of OFWs has grown steadily as is their remittance per worker. These clearly show the variety of skills available in the Philippines. It is apparent from Figure 2 that the reason for the increasing remittance per worker is the rising share of professionals and the relatively steady share of service workers. From approximately US$2,000 per worker in 1988, per worker remittance has reached almost US$11,000 in 2005 or more than 500% increase. Lastly, as observed by Burgess and Haksar (2005), this diversity of occupational structure and source has contributed greatly to the stability of remittance flows.
Figure 2 Figure 3 Occupational Structure of OFWs
0%
20%
40%
60%
80%
100%
1992
1993
1994
1995
1996
1997
1998
1999
2000
2001
2002
2003
2004
Professional & Technical Workers Sales Workers Service Workers Production Workers
Occupation Share of Emigrants
0%
20%
40%
60%
80%
100%
1981 1983 1985 1987 1989 1991 1993 1995 1997 1999 2001 2003Professional, Technical and Related Workers M anagerial, Execut ive and Administrative WorkersClerical Workers Sales WorkersService Workers Agri, Animal Husbandry,Production Process and Equipment Operators & Laborers M embers of the Armed ForcesNo Occupation Reported Housewives
b. Sources of Remittances Another interpretation of the stability of remittance flows to the Philippines is the increasing shares of highly paid professionals to total OFW deployed. This can be explained by the bulk of remittances actually come from the Americas where a number of doctors and nurses are currently based. In addition, data on the occupational structure of Filipino emigrants or permanent migrants also register a significant share from the same group (see Figure 3). However, it is important to note that data on the sources of remittance show inconsistency. Consider Figure 4 which
ed by the Bangko Sentr g Pilipinas (BSP) and Table 1 which m the Survey of Overseas Filipinos conducted by the
SO).
shows data gatherre
al nveals data gathered fro
National Statistics Office (N A reason for this inconsistency can be traced to the fact that the Central Bank records all inflows without distinction if the sending party is an OFW or an immigrant, while the NSO Survey primarily targeted OFWs. This disparity is clarified in the stock of Filipinos overseas (as of 2004) which reveals that about 40% of Filipinos abroad is permanent or immigrant status (see Table 2). Approximately 85% of these immigrants reside in the United States and Canada. This is why Mellyn (2003) cautions that data on this aspect is misleading because the Philippine diaspora is geographically and demographically complex.
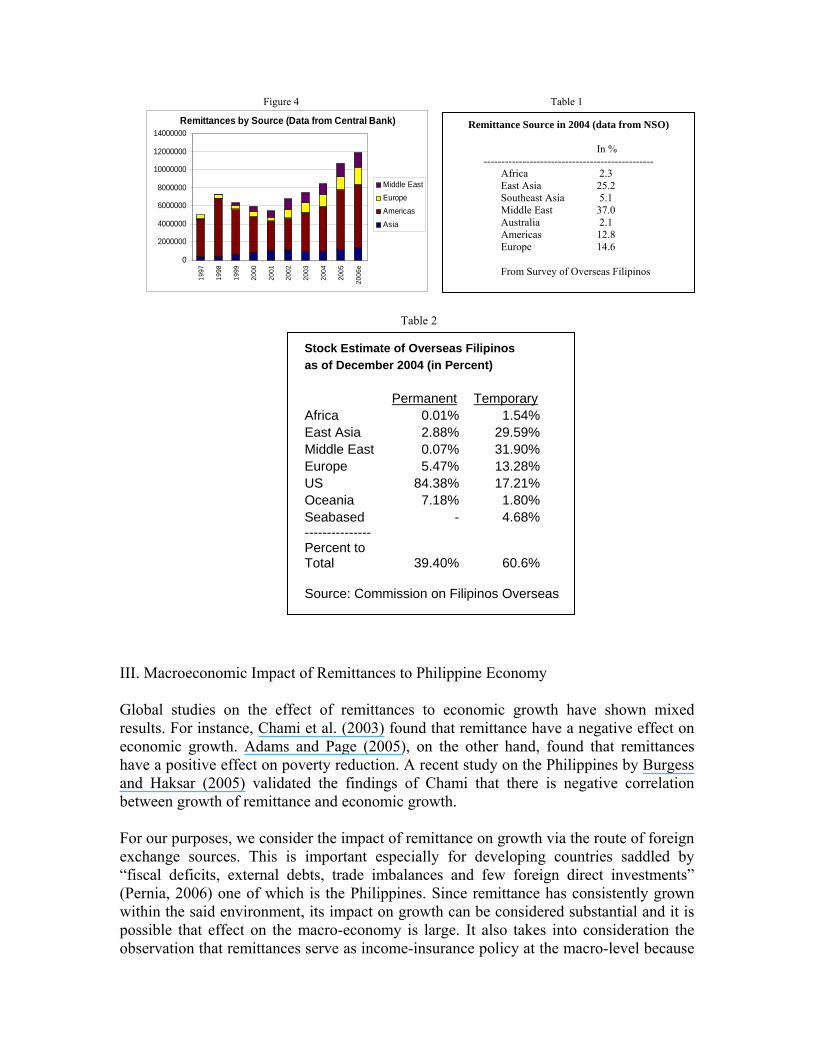
Figure 4 Table 1
Remittances by Source (Data from Central Bank)
0
2000000
4000000
6000000
8000000
10000000
12000000
14000000
1997
1998
1999
2000
2001
2002
2003
2004
2005
2006
e
Middle EastEuropeAmericasAsia
Table 2
III. M
For our purposes, we consider the impact of remittance on growth via the route of foreign xchange sources. This is important especially for developing countries saddled by
direct investments” ernia, 2006) one of which is the Philippines. Since remittance has consistently grown
observation that remittances serve as income-insurance policy at the macro-level because
Remittance Source in 2004 (data from NSO) In %
------------------------------------------------ Africa 2.3 East Asia 25.2 Southeast Asia 5.1 Middle East 37.0 Australia 2.1 Americas 12.8 Europe 14.6 From Survey of Overseas Filipinos
Stock Estimate of Overseas of December 2004 (in Percen Permanen
as Filipinos t)
t Temporary
Africa 0.01%East Asia 2.88%Middle East 0.07%Europe 5.47% 1US 84.38% 17.21%Oceania 7.18% 1.80%Seabased - 4.68%--------------- Percent to Total 39.40% 60.6% Source: Commission on Filipinos Overseas
1.54%29.59%31.90%
3.28%
acroeconomic Impact of Remittances to Philippine Economy
Global studies on the effect of remittances to economic growth have shown mixed results. For instance, Chami et al. (2003) found that remittance have a negative effect on economic growth. Adams and Page (2005), on the other hand, found that remittances have a positive effect on poverty reduction. A recent study on the Philippines by Burgess and Haksar (2005) validated the findings of Chami that there is negative correlation between growth of remittance and economic growth.
e“fiscal deficits, external debts, trade imbalances and few foreign(Pwithin the said environment, its impact on growth can be considered substantial and it is possible that effect on the macro-economy is large. It also takes into consideration the
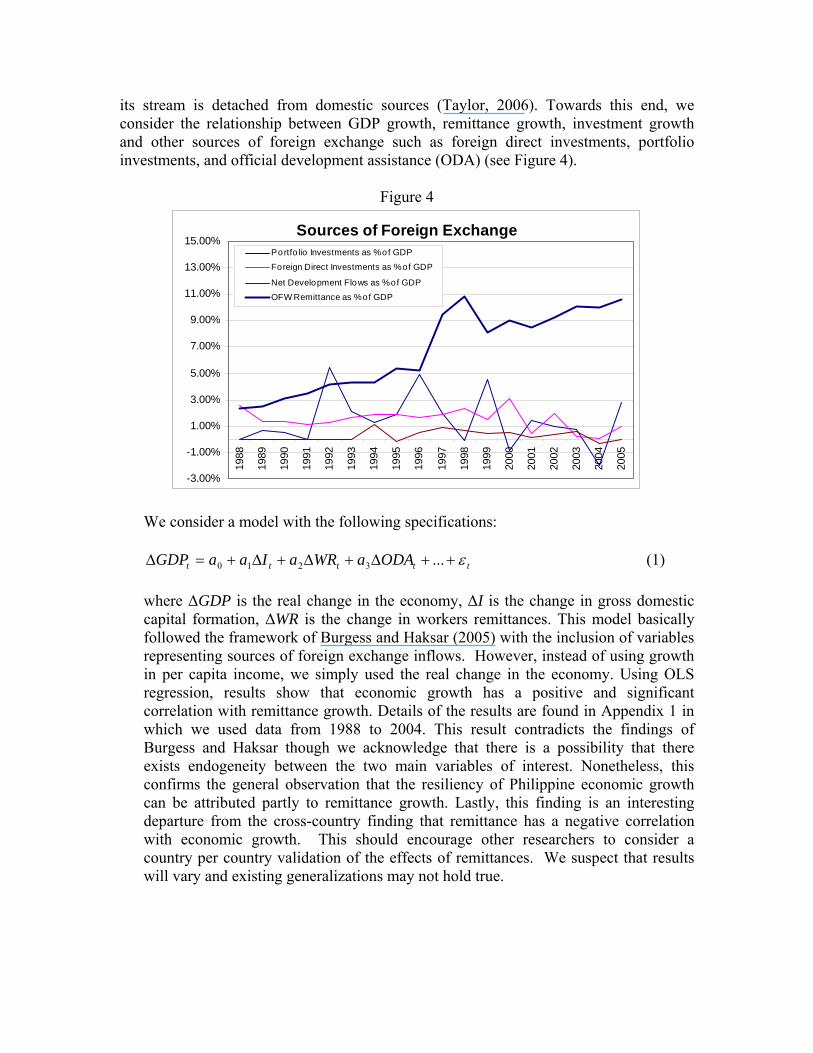
its stream is detached from domestic sources (Taylor, 2006). Towards this end, we consider the relationship between GDP growth, remittance growth, investment growth and other sources of foreign exchange such as foreign direct investments, portfolio investments, and official development assistance (ODA) (see Figure 4).
Figure 4
Sources of Foreign Exchange
5.00%
7.00%
9.00%
11.00%
13.00%
15.00%
-3.00%
-1.00%
1.00%
3.00%
1988
1989
1990
1991
1992
1993
1994
1995
1996
1997
1998
1999
2000
2001
2002
2003
2004
2005
Po rtfo lio Investments as % o f GDP
Foreign Direct Investments as % of GDP
Net Development Flows as % of GDPOFW Remittance as % of GDP
We consider a model with the following specifications:
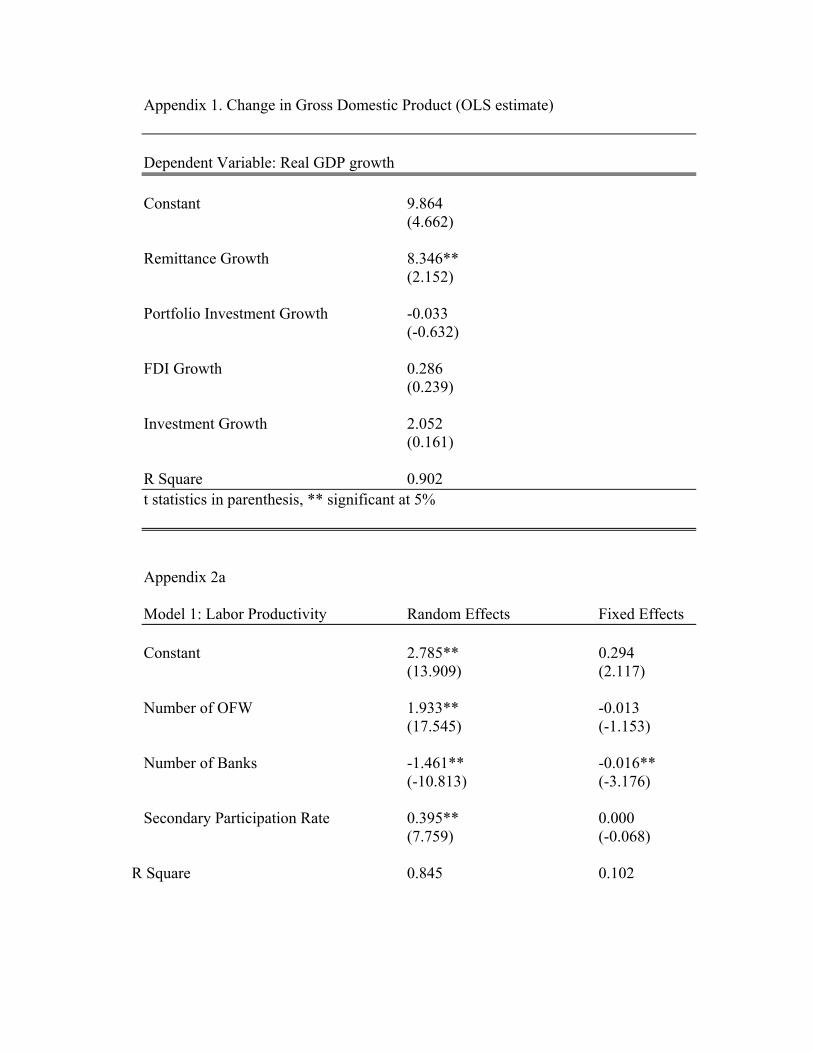
ttttt ODAaWRaIaaGDP ε++Δ+Δ+Δ+=Δ ...3210 (1) where ΔGDP is the real change in the economy, ΔI is the change in gross domestic capital formation, ΔWR is the change in workers remittances. This model basically followed the framework of Burgess and Haksar (2005) with the inclusion of variables representing sources of foreign exchange inflows. However, instead of using growth in per capita income, we simply used the real change in the economy. Using OLS regression, results show that economic growth has a positive and significant
ittance growth. Details of the results are found in Appendix 1 in s the findings of
re is a possibility that there xists endogeneity between the two main variables of interest. Nonetheless, this
confirms the general observation that the resilienan be attributed partly to remittance growth. Lastly, this finding is an interesting
correlation with remwhich we used data from 1988 to 2004. This result contradictBurgess and Haksar though we acknowledge that thee
cy of Philippine economic growth cdeparture from the cross-country finding that remittance has a negative correlation with economic growth. This should encourage other researchers to consider a country per country validation of the effects of remittances. We suspect that results will vary and existing generalizations may not hold true.
IV.
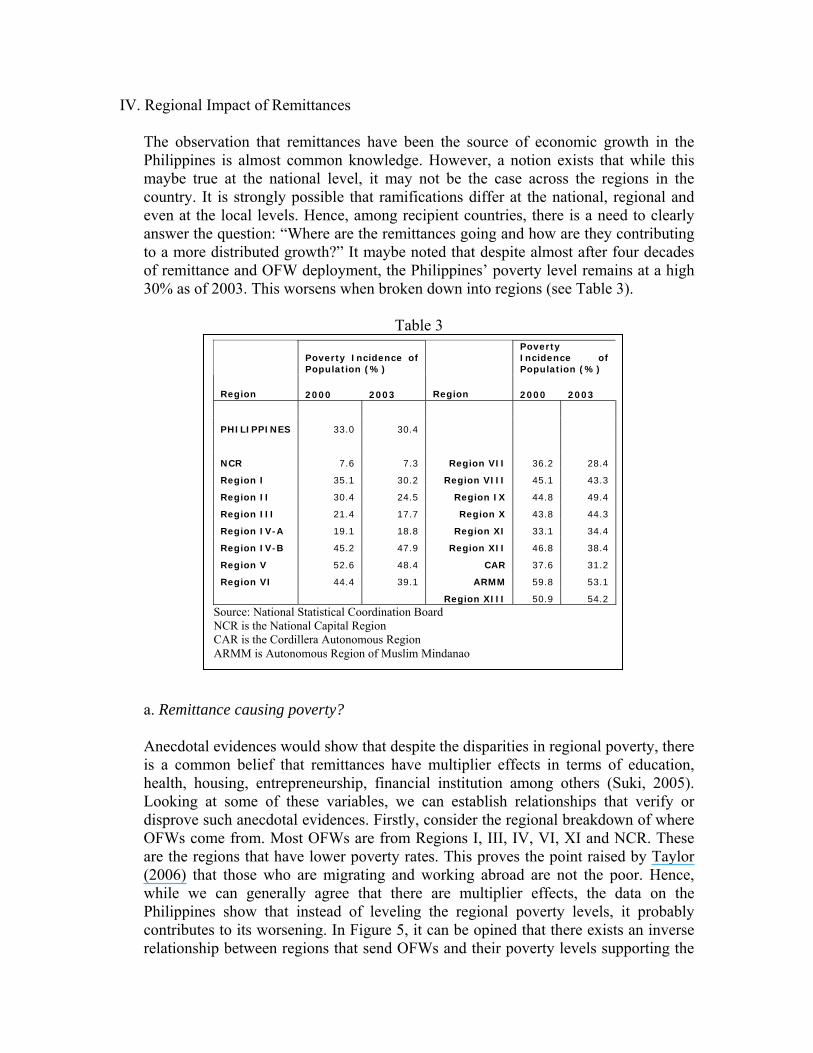
te almost after four decades of remittance and OFW deployment, the Philippines’ poverty level remains at a high 30% as of 2003. This worsens when broken down into regions (see Table 3).
Table 3
ce, e
hilippines show that instead of leveling the regional poverty levels, it probably Figure 5, it can be opined that there exists an inverse
relationship between regions that send OFWs and their poverty levels supporting the
Regional Impact of Remittances The observation that remittances have been the source of economic growth in the Philippines is almost common knowledge. However, a notion exists that while this maybe true at the national level, it may not be the case across the regions in the country. It is strongly possible that ramifications differ at the national, regional and even at the local levels. Hence, among recipient countries, there is a need to clearly answer the question: “Where are the remittances going and how are they contributing to a more distributed growth?” It maybe noted that despi
a. Remittance causing poverty? Anecdotal evidences would show that despite the disparities in regional poverty, there is a common belief that remittances have multiplier effects in terms of education, health, housing, entrepreneurship, financial institution among others (Suki, 2005). Looking at some of these variables, we can establish relationships that verify or disprove such anecdotal evidences. Firstly, consider the regional breakdown of where OFWs come from. Most OFWs are from Regions I, III, IV, VI, XI and NCR. These are the regions that have lower poverty rates. This proves the point raised by Taylor (2006) that those who are migrating and working abroad are not the poor. Henwhile we can generally agree that there are multiplier effects, the data on th
Poverty Poverty Incidence of Population (%)
Incidence of Population (%)
Region 2000 2003 Region 2000 2003
PHILIPPINES 33.0 30.4 NCR 7.6 7.3 Region VII 36.2 28.4
Region I 35.1 30.2 Region VIII 45.1 43.3
Region II 30.4 24.5 Region IX 44.8 49.4
Region III 21.4 17.7 Region X 43.8 44.3
Region IV-A 19.1 18.8 Region XI 33.1 34.4
Region IV-B 45.2 gion XII 46.8 38.4 47.9 Re
Region V 52.6 48.4 CAR 37.6 31.2
Region VI 44.4 39.1 ARMM 59.8 53.1
Region XIII 50.9 54.2 Source: National Statistical Coordination Board NCR is the National Capital Region CAR is the Cordillera Autonomous Region ARMM is Autonomous Region of Muslim Mindanao
Pcontributes to its worsening. In
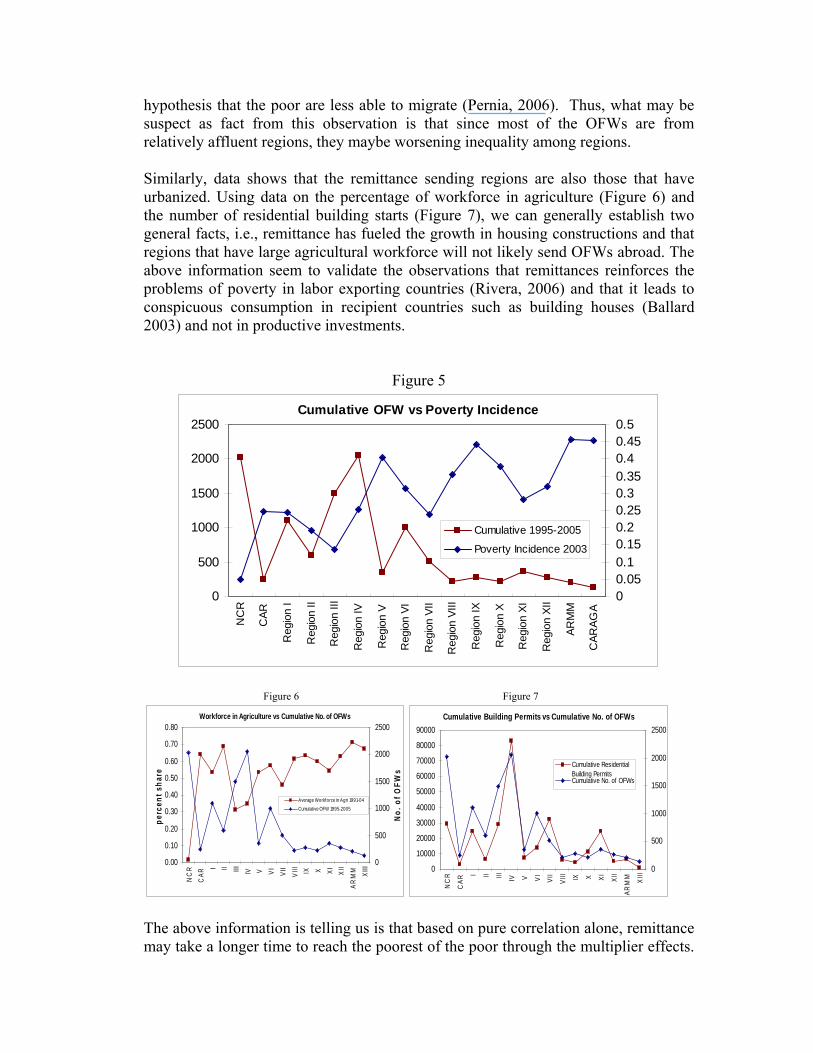
hypothesis that the poor are less able to migrate (Pernia, 2006). Thus, what may be suspect as fact from this observation is that since most of the OFWs are from relatively affluent regions, they maybe worsening inequality among regions. Similarly, data shows that the remittance sending regions are also those that have urbanized. Using data on the percentage of workforce in agriculture (Figure 6) and the number of residential building starts (Figure 7), we can generally establish two general facts, i.e., remittance has fueled the growth in housing constructions and that regions that have large agricultural workforce will not likely send OFWs abroad. The above information seem to validate the observations that remittances reinforces the problems of poverty in labor exporting countries (Rivera, 2006) and that it leads to conspicuous consumption in recipient countries such as building houses (Ballard 2003) and not in productive investments.
Figure 5
Cumulative OFW vs Poverty Incidence
500
1000
1500
2000
2500
0.150.20.250.30.350.40.450.5
0
NC
R
CAR
Reg
ion
I
Reg
ion
II
Reg
ion
III
Reg
ion
IV
Reg
ion
V
Reg
i
Reg
iI
Reg
iII
Reg
ion
IX
Reg
ion
X
Reg
ion
XI
Reg
ion
XII
ARM
M
CAR
AGA
00.050.1
Cumulative 1995-2005
Poverty Incidence 2003
on V
I
on V
I
on V
I
Figure 6 Figure 7
Workforce in Agriculture vs Cumulative No. of OFWs
0.00
0.10
0.20
0.30
0.40
0.50
0.60
0.70
0.80
NC
RC
ARI II III IV V VI VII
VIII IX X XI XII
ARM
M XIII
perc
ent s
hare
0
500
1000
1500
2000
2500
No. o
f OFW
s
Average Workforce in Agri 1991-04Cumulative OFW 1995-2005
Cumulative Building Permits vs Cumulative No. of OFWs
0
10000
20000
30000
40000
50000
60000
70000
80000
90000
NC
R
CAR
I II III IV V VI VII
VIII IX X XI XII
ARM
M XIII 0
500
1000
1500
2000
2500
Cumulative ResidentialBuilding PermitsCumulative No. of OFWs
The above information is telling us is that based on pure correlation alone, remittance may take a longer time to reach the poorest of the poor through the multiplier effects.
However, since remittances are private flows and they are directly received by beneficiary families, it is the how these families use their remittances that will hasten or slow down multiplication of benefits (Pernia, 2006). This is why the observation of Ballard (2003) that classifying remittances as development aid may mislead the understanding of aid, since the remitter sends it with a very specific personal purpose and not of a country-to-country character. b. Regional Models In order to further verify the regional development impact of remittances, we hereto consider the common observation among analysts that it is the lack of attention to
ral development that limits the translation of remittances into positive impacts to
Figure 8
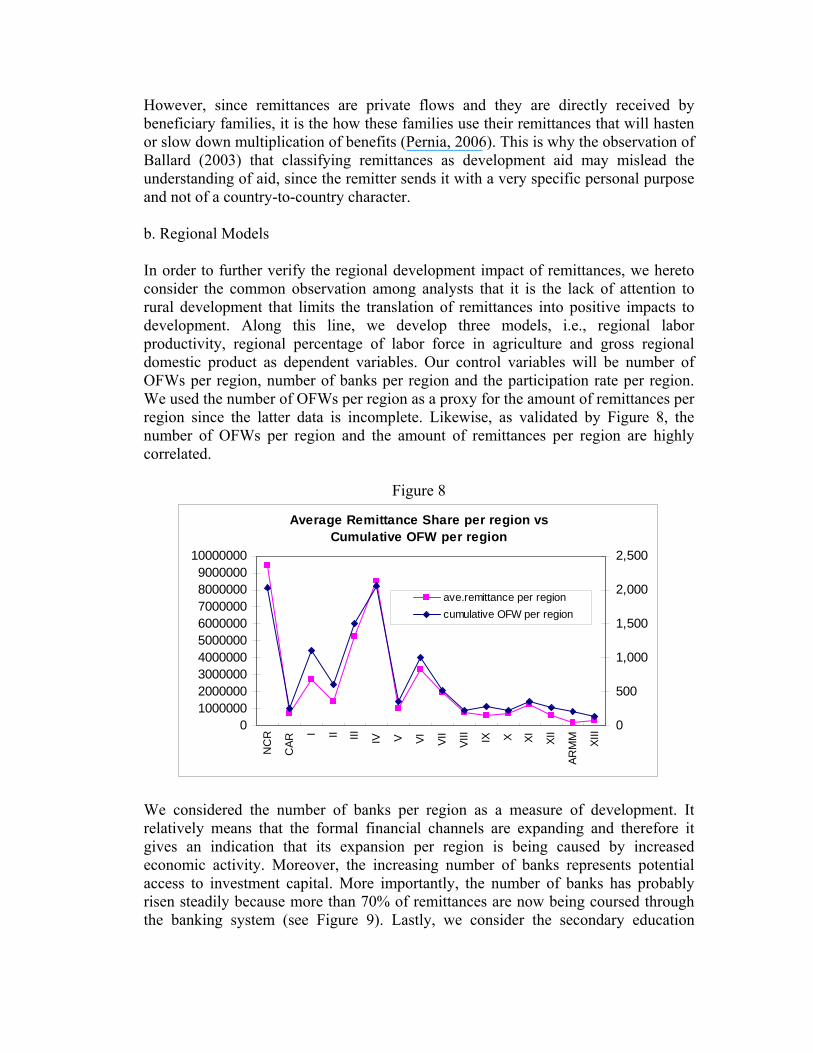
rudevelopment. Along this line, we develop three models, i.e., regional labor productivity, regional percentage of labor force in agriculture and gross regional domestic product as dependent variables. Our control variables will be number of OFWs per region, number of banks per region and the participation rate per region. We used the number of OFWs per region as a proxy for the amount of remittances per region since the latter data is incomplete. Likewise, as validated by Figure 8, the number of OFWs per region and the amount of remittances per region are highly correlated.
Average Remittance Share per region vs Cumulative OFW per region
10020000003000000400000050000006000000700000080000009000000
10000000
500
1,000
1,500
2,000
2,500
ave.remittance per regioncumulative OFW per region
00000
NC
R
CAR
I II III IV VIII IX X XI XII
ARM
M XIII
0
V VI VII
We considered the number of banks per region as a measure of development. It relatively means that the formal financial channels are expanding and therefore it gives an indication that its expansion per region is being caused by increased economic activity. Moreover, the increasing number of banks represents potential access to investment capital. More importantly, the number of banks has probably risen steadily because more than 70% of remittances are now being coursed through the banking system (see Figure 9). Lastly, we consider the secondary education
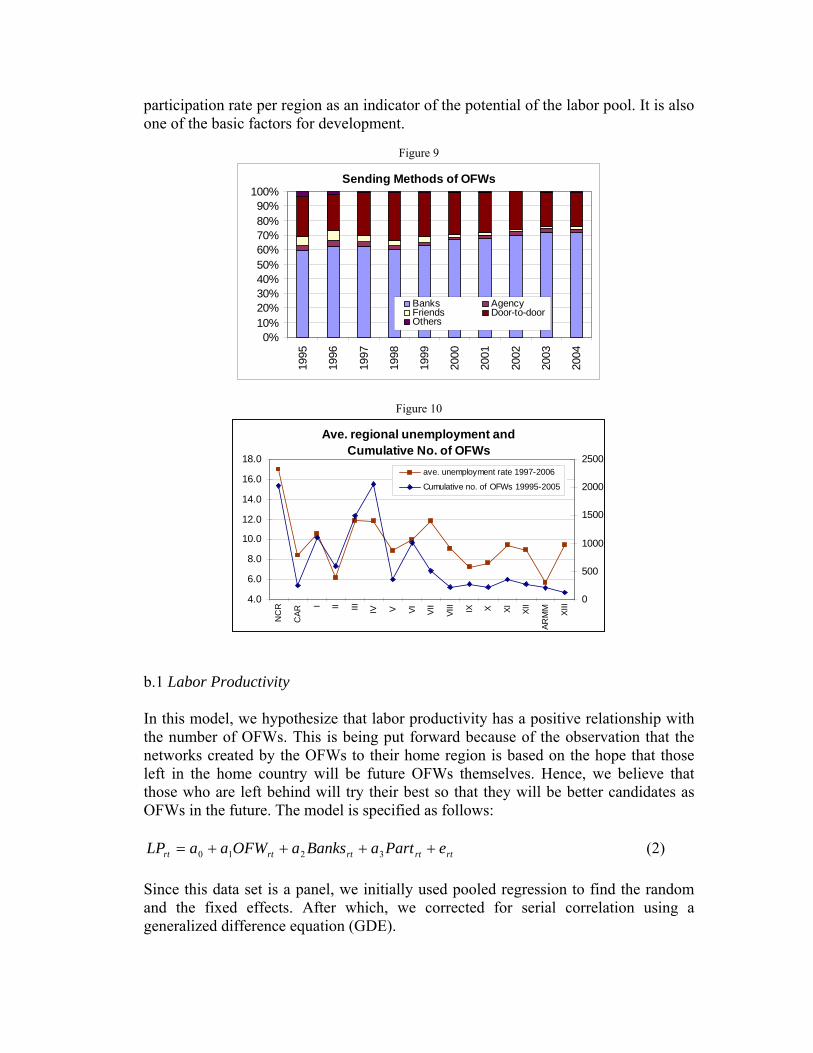
participation rate per region as an indicator of the potential of the labor pool. It is also one of the basic factors for development.
Figure 9
Sending Methods of OFWs
0%10%20%30%40%50%60%70%80%90%
100%
1995
1996
1997
1998
1999
2000
2001
2002
2003
2004
Banks AgencyFriends Door-to-doorOthers
Figure 10
Ave. regional unemployment and Cumulative No. of OFWs
8.0
10.0
12.0
14.0
16.0
18.0
1000
1500
2000
2500
4.0
6.0
NC
R
CAR
I II III IV V VI VII
VIII IX X XI XII
ARM
M XIII 0
500
ave. unemployment rate 1997-2006
Cumulative no. of OFWs 19995-2005
b.1 Labor Productivity In this model, we hypothesize that labor productivity has a positive relationship with the number of OFWs. This is being put forward because of the observation that the networks created by the OFWs to their home region is based on the hope that those left in the home country will be future OFWs themselves. Hence, we believe that those who are left behind will try their best so that they will be better candidates as OFWs in the future. The model is specified as follows:
rtrtrtrtrt ePartaBanksaOFWaaLP ++++= 3210 (2) Since this data set is a panel, we initially used pooled regression to find the random and the fixed effects. After which, we corrected for serial correlation using a generalized difference equation (GDE).
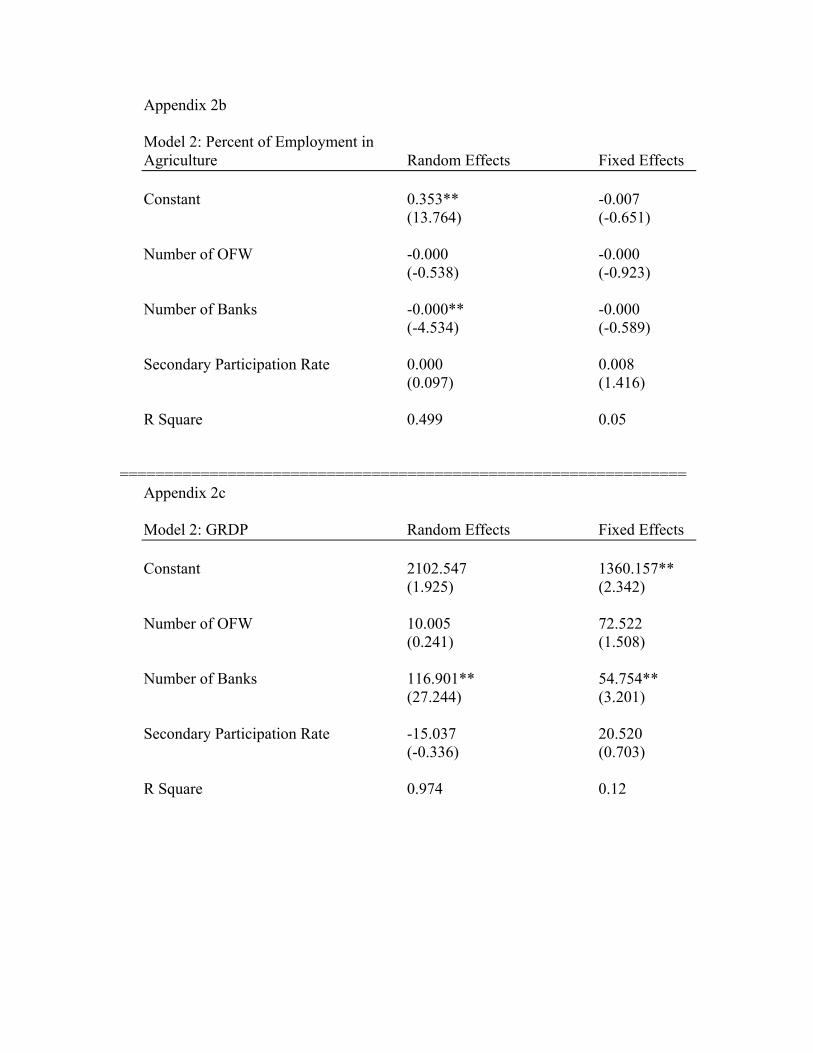
The random effects model show that the labor productivity is positively related to the number of OFWs per region and it is significant at the 5% level. However, using a first difference estimator for the fixed effects model, we find that all the independent variables are insignificant and their signs are inconsistent with our hypothesis. b.2 Percent of Labor Force in Agriculture Taylor (2006) observed that “as per capita incomes grow, people leave the agricultural sector, and they move out of rural areas.” We would like to validate if such observation exists in the Philippines. In particular, the data on the percentage of the labor force in agriculture is used to represent such observation. Likewise, this data can also represent the economic structure of the regions. We can therefore test how
e number of OFWs has contributed to the changing economic structure of the gions. Our hypothesis is that it this relationship is negative. The model is specified
threbelow:
rtrtrtrtrt ePartaBanksaOFWaaPercAgri ++++= 3210 (3) Both the random and fixed effects models yielded insignificant results. However, both models confirmed our hypothesis that there is an inverse relationship between the percent of labor force in agriculture and the number of OFWs per region, number of banks per region and educational participation rate. b.3 Gross Regional Domestic Product
nces. Similarly, our hypothesis is that the umber of OFWs contributes positively to regional development.
ePartaBanksaOFWaa
This follows the specification of Pernia (2006) in which he considers the effect of OFW remittances on regional development. The difference is our use of number of OFWs instead of the amount of remittan We specify the model as: GRDP + rtrt +rtrtrt ++= (4)
3210
Both the random effects and fixed effect models show that the number of OFWs has no significant impact on GRDP across regions, though its sign is consistent with our hypothesis that the relationship is positive. . The details of the above results are summarized in Appendix 2, a to c.
V. Summary and Conclusions
particularly as regards levels nd amounts of remittances. There is also a need to consider that possible actual
re than what is being reported in the official hannels. Notwithstanding these limitations, we find that at the national level,
e far from being onclusive, they give us indications that there is a need to further study and nderstand how remittances can be harnessed for development purposes. .
hese results generally confirm the observations of Taylor (2006) and Ballard (2003) at while remittance may contribute to economic g
olicies and nurturing environment for it to be an effective engine of development.
ple regression analysis we
Considering the arguments of Ballard (2003) on the entrepreneurial network of South Asian migration, this does not jive with the Philippine experience. From common knowledge, most of the OFWs that leave spent the 1st contract repaying debts and may actually start saving only after the 3rd contract is consummated. It is not farfetched that remittances have not really created and impacted small enterprise
is enough capital available for that, the question lies in the Filipinos. Data from the Department of Trade shows
We have attempted to show the relationship between workers remittance and economic growth at the national and at the regional levels. Firstly, we must caution that there is lack of consistent data sets on the regions,aamounts of remittances sent are far mocremittances do influence economic growth positively and significantly. Later, we broke down our analysis at the regional level to confirm the national results. Here we find mixed results giving rise to our anecdotal observations that remittances do not positively affect economic growth. Though our findings arcu Tth rowth, there is a need for correct pTaylor (2006) is also adds that the same problems of basic infrastructure, access to credit and other underdevelopment concerns remain. They undoubtedly stymie efforts towards entrepreneurship. We confirm these observations to be generally true in the
hilippines through the data correlation and the simPconducted.
development. Though, theree entrepreneurial culture ofth
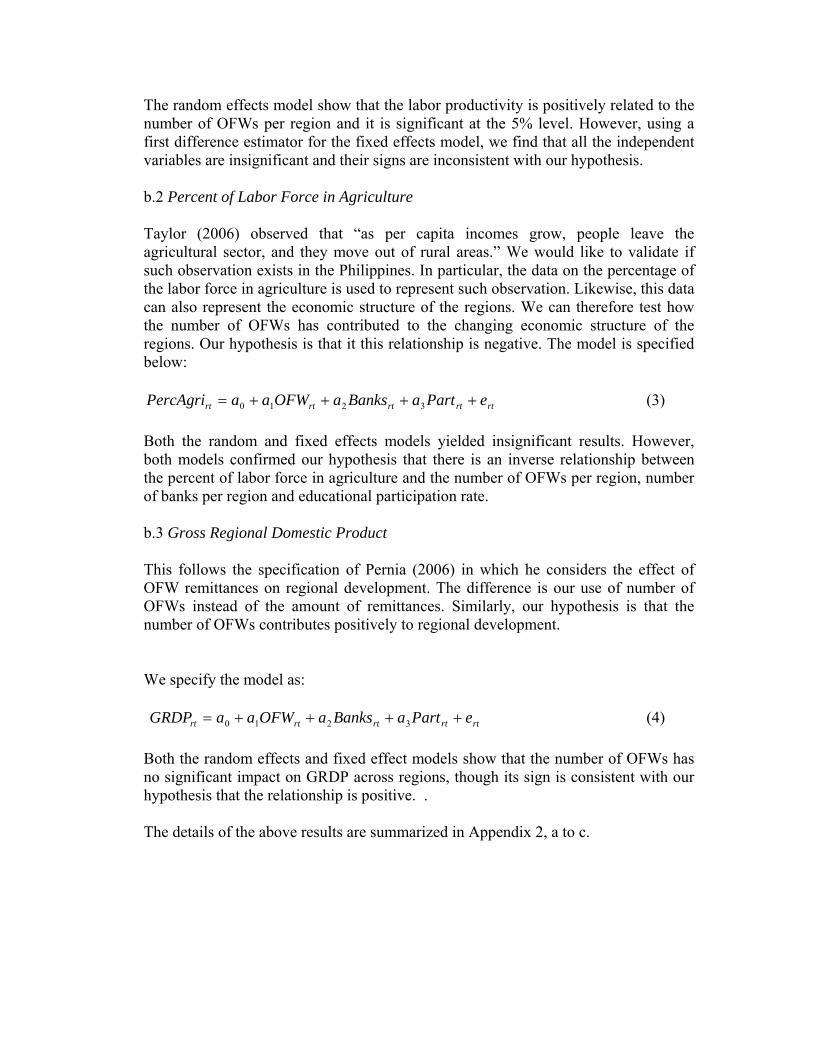
that during the period 2000-2003, the growth of small enterprises in the Philippines was flat. It is also observed that if OFWs do invest in small enterprises, they do invest in what seems to be an entrepreneurial fad in the Philippines called franchising. They are mostly seen in malls as food cart business. In addition, our econometric findings on labor productivity and the number of laborers in agriculture generally point to the weak link of remittances with that of entrepreneurs. These observations also connect with the point of Ballard (2003) that remittances are causing sharp declines in agriculture production because they become unprofitable. This is what Ballard calls “Capital-rich, underdevelopment.” It seems that labor would rather wait for the opportunity to be an OFW than work in the farms. This is what seems to be the positive relationship between remittances and national and
gional unemployment rates (see Figure 10). re

What may be more worrisome is that if this trend remains unchecked, they will lead to the urban higher income members of society enjoying the benefits from the hard work sent remittance of the lower income majority. This is not farfetched as the main indicator of local development in the Philippines is the existence of an SM or a Robinson’s mall. These mall developers are mainly located in the regions where there are large concentrations of OFWs. In sum, we find that remittances have yet to be translated to value-added activities and investments which are more foundational sources of development and growth. Hence the expected multiplier effects even from consumer activities remain slow and unable to reach areas that need them the most. As long as policy initiatives remain as they are, OFWs will continue to be limited in transforming their communities and regions. Their remittances will remain as records that help keep afloat the national government. In the final analysis, government has to pursue reforms that will help improve the domestic economy regardless of the source of investments. These reforms will surely help in creating new jobs and that are crucial in sustaining growth and reducing poverty and inequality among regions.
Ref Adams, R. and Page, J. (2005). “Do International Migration and Remittances Reduce Poverty in Developing Countries.” World Development. Vol 33, No.10, pp. 1645-1669 Asian Development Bank (2004), Enhancing the Efficiency of Overseas Filipino Workers, Final Report. Ballard, R. (2003). “Remittances and Economic Development.” Migration and Development 2003-04 Bureau of Labor and Employment Statistics (2006). “The Philippine Overseas Employment: Understanding its Trend and Cultural Change, Parts 1 to 5. Labstat Updates Vol. 10 Issues 5-9, May 2006. Burgess, R. and Haksar, H. (2005). “Migration and Foreign Remittances in the Philippines.” IMF Working Paper WP/05/111 Chami, R, Fullenkamp, C. and Jahjaj, S (2003). “Are Immigrant Remittance Flows a Source of Capital for Development?” IMF Working Paper WP/03/189 Dacanay, A. and Huang, F. (2005). “Recent Trends in OFWs and Remittances.” SGV Review Vol. 3 No. 4. December 2005. van Doom, J. (2006). “Migration, Remittances and Small Enterprise Development” in www.ilo.org/public/english/employment/finance/remit.htm
erences:
(accessed August 2006) de Haas, H. (2005). “International Migration, Remittances and Development: Myths and Fact.” Global Migration Perspectives No. 30, April 2005 Mellyn, K. (2003). “Worker Remittances as a Development Tool: Opportunity for the Philippines” Asian Development Bank 2003 Pernia, E. (2006). “Diaspora, Remittances and Poverty RP’s Region.” University of the Philippines School of Economics Rivera, J. (2006). “International Migration, Remittances and Economic Development: Policy Recommendations” Workshops on Global Migration Regimes, June 2006 Taylor, J. (2006). International Migration and Economic Development.” International Symposium on International Migration and Development, Population Division, Department of Economic and Social Affairs, United Nations, Turin, Italy, June 2006 World Bank (2005). Global Development Finance. World Bank, Washington D.C. Data from: Asian Development Bank (ADB), www.adb.org; Bangko Sentral ng Pilipinas (BSP), www.bsp.gov.ph; National Statistical Coordination Board (NSCB), www.nscb.gov.ph; National Statistics Office (NSO), www.nso.gov.ph;
Appendix 1. Change in Gross Domestic Product (OLS estimate) Dependent Variable: Real GDP growth Constant 9.864 (4.662)
Growth 8.346**
(-0.632)
(0.239)
(0.161)
0.902
Remittance (2.152) Portfolio Investment Growth -0.033 FDI Growth 0.286
Investment Growth 2.052
R Square t statistics in parenthesis, ** significant at 5%
Appendix 2a
Model 1: Labor Productivity Random Effects Fixed Effects Constant 2.785** 0.294 (13.909) (2.117)
(-1.153)
000 0.068)
Number of OFW 1.933** -0.013 (17.545)
Number of Banks -1.461** -0.016** (-10.813) (-3.176) Secondary Participation Rate 0.395** 0.
(7.759) (- R Square 0.845 0.102
Appendix 2b Model 2: Percent of Employment in
Random Effects Fixed Effects Agriculture Constant 0.353** -0.007
-0.000
* -0.000 (-0.589)
0.008 (1.416)
0.05 === =====================
odel 2: GRDP Random Effects Fixed Effects
(13.764) (-0.651) Number of OFW -0.000 (-0.538) (-0.923) Number of Banks -0.000* (-4.534) Secondary Participation Rate 0.000 (0.097) R Square 0.499
=======================================Appendix 2c M Constant
2102.547 1360.157** (1.925) (2.342)
Number of OFW 10.005 72.522 (0.241) (1.508)
umber of Banks 116.901** 54.754** N (27.244) (3.201) Secondary Participation Rate -15.037 20.520 (-0.336) (0.703) R Square 0.974 0.12
Related Documents


![Do Workers' Remittances Matter for the Egyptian Economy?ijorlu.liau.ac.ir/article-1-316-en.pdf · Do Workers' Remittances Matter for the Egyptian Economy? 3 Bryan R. [4] suggested](https://static.cupdf.com/doc/110x72/5ee114f7ad6a402d666c179e/do-workers-remittances-matter-for-the-egyptian-economy-do-workers-remittances.jpg)

