ANNALES D’ ´ ECONOMIE ET DE STATISTIQUE. – N 41/42 — 1996 Worker’s Limited Liability, Turnover and Employment Contracts Jonathan S. LEONARD, Marc Van AUDENRODE* ABSTRACT. – We develop a model of turnover and wages based on the legal limits on workers’ liability. A simple two-period model generates differences among firms in entry level wages, and in returns to age and tenure. It predicts that both quits and discharges are negatively correlated with the steepness of the age-earning profile. The discharge prediction is contrary to a job matching or pure human capital model. The predictions of the model are tested on a sample of firms from the Belgian manufacturing sector. We find that 1) the dispersion of pay policy across firms is similar in Belgium and the U.S., 2) this dispersion does not reflect simple rent- sharing or omitted variables, 3) about 8% of workers separate annually with discharges concentrated in the first years, and 4) steeper seniority profiles are associated with lower quit and discharge rates. Responsabilit ´ e limit ´ ee des travailleurs, rotation et contrats de salaire R ´ ESUM ´ E. – Nous d´ eveloppons un mod` ele expliquant la formation des salaires et les mouvements de travailleurs bas ´ e sur l’engagement limit ´ e des travailleurs. Notre mod` ele simple ` a deux p´ eriodes peut expliquer les diff´ erences existant entre les firmes en ce qui concerne les salaires d’embauche, et les rendements li ´ es ` a l’ˆ age et l’anciennet ´ e. Il pr´ edit ´ egalement que les s´ eparations volontaires et involontaires de travailleurs seront inversement reli ´ ees avec la pente du profil de salaire. Nous testons ces pr´ edictions sur un ´ echantillon de grandes firmes du secteur manufacturier belge. Nous montrons que : 1. La dispersion des politiques de salaires en Belgique est comparable ` a celle existant aux ´ Etats-Unis ; 2. Cette dispersion ne refl` ete pas une simple situation de partage de rente ou encore un cas de variable omise ; 3. Environ 8% des travailleurs se s´ eparent chaque ann ´ ee de leur employeur, les licenciements ayant principalement lieu aux cours des premi` eres ann´ ees ; 4. Les entreprises offrant un profil de salaire avec pente plus forte connaissent moins de s´ eparations volontaires et involontaires. * J. S. LEONARD: University of California; M. Van AUDENRODE: Universit ´ e Laval. We thank George Akerlof, Bill Dickens and participants at seminars at Columbia, Montr ´ eal, Rochester, Seattle and UCLA for helpful comments on a previous version of this manuscript. We also benefited from the comments of participants at the ADRES Paris Conference.

Welcome message from author
This document is posted to help you gain knowledge. Please leave a comment to let me know what you think about it! Share it to your friends and learn new things together.
Transcript
ANNALES D’ECONOMIE ET DE STATISTIQUE. – N� 41/42 — 1996
Worker’s LimitedLiability, Turnover andEmployment Contracts
Jonathan S. LEONARD, Marc Van AUDENRODE*
ABSTRACT. – We develop a model of turnover and wages based onthe legal limits on workers’ liability. A simple two-period model generatesdifferences among firms in entry level wages, and in returns to age andtenure. It predicts that both quits and discharges are negatively correlatedwith the steepness of the age-earning profile. The discharge prediction iscontrary to a job matching or pure human capital model. The predictions ofthe model are tested on a sample of firms from the Belgian manufacturingsector. We find that 1) the dispersion of pay policy across firms is similarin Belgium and the U.S., 2) this dispersion does not reflect simple rent-sharing or omitted variables, 3) about 8% of workers separate annuallywith discharges concentrated in the first years, and 4) steeper seniorityprofiles are associated with lower quit and discharge rates.
Responsabilit ´e limit ee des travailleurs, rotation etcontrats de salaire
RESUME. – Nous developpons un modele expliquant la formation dessalaires et les mouvements de travailleurs base sur l’engagement limitedes travailleurs. Notre modele simple a deux periodes peut expliquerles differences existant entre les firmes en ce qui concerne les salairesd’embauche, et les rendements lies a l’age et l’anciennete. Il preditegalement que les separations volontaires et involontaires de travailleursseront inversement reliees avec la pente du profil de salaire. Noustestons ces predictions sur un echantillon de grandes firmes du secteurmanufacturier belge. Nous montrons que : 1. La dispersion des politiquesde salaires en Belgique est comparable a celle existant aux Etats-Unis ;2. Cette dispersion ne reflete pas une simple situation de partage derente ou encore un cas de variable omise ; 3. Environ 8% des travailleursse separent chaque annee de leur employeur, les licenciements ayantprincipalement lieu aux cours des premieres annees ; 4. Les entreprisesoffrant un profil de salaire avec pente plus forte connaissent moins deseparations volontaires et involontaires.
* J. S. LEONARD: University of California; M. Van AUDENRODE: Universite Laval. Wethank George Akerlof, Bill Dickens and participants at seminars at Columbia,Montreal, Rochester, Seattle and UCLA for helpful comments on a previous versionof this manuscript. We also benefited from the comments of participants at theADRES Paris Conference.
1 Introduction
Two major sets of economic theories compete with one another to explainobservedwagedifferentialsbetweenindustriesandestablishments,andmoregenerally to explain the functioning of the labor market. The first set, thejob matchingtheories,is of marketclearinginspiration,andrelatesthewageto the quality of the match between the worker and the job he is assignedto. Low quality matcheswill result in low wages and a high probabilityof rupture by quit or discharge, while high quality matches will result inhigh wagesand will likely last longer. The second set, which includes therent sharing and the efficiency wage theories, links wage differentials todifferences across firms in available rents and workers’ bargaining powerin the rent sharing models, or to the inability of the firm to perfectlyenforce its employment contracts in the efficiency wage theories. While theimplicationsof thesenon-marketclearing theories on wages have begun tobe scrutinized,their effect on job turnover is less studied.
In this paper the reasons for the existence of both voluntary andinvoluntary separationsare studiedwithin the frameworkof the efficiencywagetheory. Efficiency wagetheory providesa fruitful initial frameworkfor the study of turnover as it naturally accommodateswage differentialsacrossemployersthat makesomejobs more desirablefor the workers andso inducesquits. In estimatingthe importanceof these differentials, theexpectedstream of future lifetime earningsis a crucial element in thedecision.Whena worker is indifferent betweenall the non-wage aspects oftwo jobs, the elementthat will determinehis decision to stay or quit willbe the expectedvalue of the future earningsin both jobs. This question isof particular importancebecausethe slope of the age-earning profile canbe unrelatedto the marginal productivity of the worker (LAZEAR [1979]).The particular policies of each employer in that matter will be of primeimportance in estimating the quit risk facing the firm.
In the model developed here, we show that the higher the wage premiumpaid by the employer, the lower the level of discharge and quits. Conversely,firms paying low wage premia will suffer many quits and will have to firemore workers. The model’s prediction on quits is similar to the job matchingtheory’s predictions. The major difference between the model developedhere and the job matching model comes from the predicted relationshipbetweenwages and separations initiated by the employer. Job matchingmodels have always been uneasy with the explanation of the existence ofseparations initiated by the employer, and consequently do not developthesequestionsdeeply.
Two reasons can,a priori, be found to explain why firms drawing theirworkers from the same population might end up having different age-earning profiles, on average. The simplest way to justify these differencesis to assume that the return to tenure differs between firms. As the rentobtained by the employer is a share of the rent created by the worker,there would be an accrued incentive for the employer to terminate the
42
unsuccessful matches when productivity returns to tenure are high. In thisframework, high wages would be associated with a high level of firings.
However, even when assuming that all firms are identical, differencesin profiles can still be found. Higher wages and steeper age-earningprofiles, on average at the firm level, would simply be associated withmoresuccessful matches, and hence with a higher level of selectivity by theemployerin decidingwhich employmentrelationshipto continueandwhichto terminate. In either case, a clear positive correlation between the wagesandthe steepnessof the age-earningprofile andthe rateof firings would bepredicted. Finally, the predictions on firings found in rent sharing modelsare relatively unclear. Traditionally, thesemodelsdiscuss the implicationsof wages on layoffs rather than on firings. In LINDBECK and SNOWER [1988],as an example, none of the models of insider behavior require firing forcause. It is however, fair to say that pure models of union behavior wouldalsotendto predict a negative correlation between firings and wages: steepage earning profiles and high wages are signs of a strong union. When astrongunion is present,a higher level of job protectionmight be expectedto exist, resulting in fewer firings.
This paper develops an efficiency wage model with the distinctiveprediction that steep earnings profiles are associatedwith both fewerquits and fewer firings. To our knowledgeno previouspapermodelsthisquestionformally, or testsit empirically. We testour model’sclearturnoverpredictionsusingdataon Belgianmanufacturingfirms, andfind results thatgive somecredit to the efficiency wageinterpretationof turnover.
Section 2 will present a model of job turnover when efficiency wagesare paid in a situation of heterogeneous firms and workers. Empiricalevidencefrom theBelgianmanufacturingsectoris presentedon wage policy(section3), turnover(section4), and the impactof the former on the latter(section5). The chief empirical innovationin this paper is using matchedemployer-employeedata to first estimatefirm specific pay functions, andsecondto estimatethe impact of pay policy on turnover at the firm level,a relationship of paramount interest.
2 Efficiency Wages and Turnover
Among the numerous reasons considered in explaining labor turnover,job matching is undoubtedly the most popular. The theory of job matchingbases turnover, quits and firings, on the need for both employers and workersto find the correct match, i.e., the most productive-between the worker’sskills and the job’s characteristics (MORTENSEN [1978], JOVANOVIC [1979],and ANTEL [1985]).
A secondclass of turnover models links quits and layoffs to unexpectedshocks in firm demand. These shocks, together with stickiness in the designof the employment contract, might cause quits during the firm’s good times
TURNOVER AND EMPLOYMENT CONTRACTS 43
and layoff during downturns (HALL and LAZEAR [1984], ARNOTT, HOSIOS
and STIGLITZ [1988]).
Finally, the third class of models of turnover puts forward problems ofadverseselectionand signaling. The wage paid by an employer affectsthe quality of the applicant pool (WEISS [1980], GREENWALD [1986] andWALDMAN [1985]).
Efficiency wage models present an attractive ground for explainingturnover. Firms that imperfectly enforce their employment contracts haveto pay an efficiency premium to their workers in order to induce faithfulbehaviorfrom them. This premium will be larger the worse the employer’sability to enforce the contract. Hence, jobs with high efficiency premiumswill bein high demandamongworkers.At any point of their career, workerswill be willing to quit their jobs to accept an offer where the expected valueof their future earning is larger. In this case, the labor market will neverclear. Therewill be an excess supply of labor to high wage premium jobsbut this will not create downward pressure on the wages.
2.1. Overview of the Model
In this model,we single out an institutional featureof the labor market,common to most of the industrialized economiesthat illustrates howindustrializedcountriestreat employmentcontractsdifferently than othercontracts.We claim that the legal limits on workers’ liability, which exist inmostcountries,area possiblefoundationfor a modelof efficiency wages thatis not subjectto the bondingcritique and which is able to describe severalregularitiesof the labor market,amongwhich the question of turnover.
Many developedcountrieshave designed laws that, in contrast to theircommon law, limit workers’ liability for the possibledamagesthey cancauseduring the execution of their work and place the burden of thisliability upon the employer.
Situationswhere workers can make mistakesharmful to the firm or tothird parties are frequent in employment relationships: a driver having atraffic accident, a worker ruining a production batch, and so on. Sometimesdamagesare huge, as they may be for airline pilots, oil tanker captainsor anybody working with dangerous substances and products. When anaccident occurs on the job in the U.S., the employer is responsible to thirdparties for a worker’s torts committed within the scope of the worker’semployment, even though the worker’s conduct was wanton and malicious(PROSSERet al. [1988]). Some courts also limit an employer’s ability torecoveragainstits own employees,when the employer is injured becauseof employees’ negligence. (AMERICAN LAW INSTITUTE [1964]).
In Canadasimilar reasoningallows courtsto hold employers responsiblefor the damages caused by his employees. Courts are however less clearthan in the U.S. on the question of knowing whether the employer willbe held responsible when the employee’s conduct is intentional, maliciousor out of the scope of his work. (BLANPAIN et al. [1976]. In Germany,workers are not responsible for any damage – either toward third parties,or towards the employer – caused during the course of work performance.
44

They will however be responsible in cases of particularly gross negligenceor intentional conduct (BLANPAIN et al. [1976]). Finally, Belgium’s Actconcerningindividual Labor Contracts [1978] and Sweden’s EmploymentAct of 1972 both contain a rule similar to the German one. (BLANPAIN
et al. [1976]).
This free insurance system for the workers can induce a suboptimal levelof care or effort among them. Optimal behavior can therefore only beinducedthroughpayment of a wage premium to the workers who correctlyperform their duties –i.e., who do not make any costly mistakes – as theemployer is not allowed to protect himself legally against having to assumethe financialrisk of suchoccurrences. Of course, the employer will be ableto insure himself against some of these risks. However, such insurance iscommonly experience rated and limited to the employer’s liability towardthird parties. In addition, these insurance contracts are not complete anddo not cover some losses – most importantly the negative reputation effectsthat someof theseaccidentscan have for the firm.
The model developedhere is able to explain several regularities ofthe labor market: inter-firm and inter-industrywagedifferentials,observeddifferencesin returns to age and to tenure, the movements of workersbetweenjobsaswell aswhy firms andworkersdo notsign lifetime contracts.
2.2. The Model
In our model, workers can be employed either in firms paying efficiencywages,or in the spot market. Firms paying efficiency wageswill pay awagepremiumto compensatefor their inability to hold their workers liablefor their mistakes.In the spot market,workers are paid a lower wage andearn a zero rent.
Workers differ in ability. Some workers have a lower probability ofmakingmistakes.Thesedifferencesamongthemhold regardless of the firmin which they are employed (among the firms paying efficiency wages).Firms differ by the magnitude of the cost of a worker’s mistake. Somefirms suffer large costs if a worker fails. For others, this cost is close tonegligible. Obviously, as long as the probability of an accident is reducedby payingan efficiencypremiumto the worker, firms with potentially highcosts of mistakes will pay higher wages to their workers to reduce the risk.Workers will want to work for thesehigh paying employers and will tryto signal themselves as highly reliable workers in order to obtain a job inone of these firms. Workers in this model know their own type. However,they cannot truthfully reveal it to their employer. Because of the legallymandated limits on workers’ responsibility, the employer cannot make anypaymentconditionalupon the cost of a mistake, nor can he sell or auctionthese contracts, as this would be considered as forcing workers to surrenderan unalienable right.
TURNOVER AND EMPLOYMENT CONTRACTS 45

The basic assumptions underlying the model are:
Assumption 1:
There are two types of firms. Firms of type 1 pay efficiency wagesaccordingto the cost to them of a worker’s mistake. Type 2 firms pay thespot market wage, here normalized to zero, for simplicity.
Assumption 2:
Jobsin type 1 firms are in short supply, while type 2 firms will absorball the remaininglabor supply at the current wage.
Assumption 3:
Type1 firms earnrents that make them always better off by hiring workersat the efficient wage than when not hiring.
Assumption 4:
There is exactly one position in each type I firm.
Assumption 5:
Both firms and workers face a zero interest rate.
Assumption 6:
Workers differ only by their probability of making a costly mistake1.Eachworker will be characterizedby a probability of mistakeP= 1 – C,where C is the level of effort (or “carefulness”) produced by the worker.The ’s will be distributeduniformly between * and *, * <1. Workershavethe utility functionU =W–C2 whereW is thewagepremiumpromisedto the worker. Individual ’s are not observed,but firms know all therelevantparametersof their distribution. Specifically,we assume that firmsknow E ( ), E ( 2), ...
Assumption 7:
Firms receive the value of the worker’s production, but pay the promisedwages and potentially have to pay for the worker’s mistakes. The cost of amistakewill vary acrossfirms and will be identified byVj.
Assumption 8:
At equalsalaries, workers are indifferent between jobs. This implies thatthe expected value of the lifetime earnings associated with a job will be theonly element they will consider when choosing their jobs.
Assumption 9:
Workers live for two periods. Firms are immortal.
Assumption 10:
Both firms and workers are risk neutral.
Assumption 11 :
If a worker makesa mistake, he does not receive the wage premiumand he is fired.
1. This assumptionallows us to disregard the possibility of having the employer try to induceworkers to self-select, by tying the conditions of the contract to other characteristics of theworkers (productivity, for example).
46
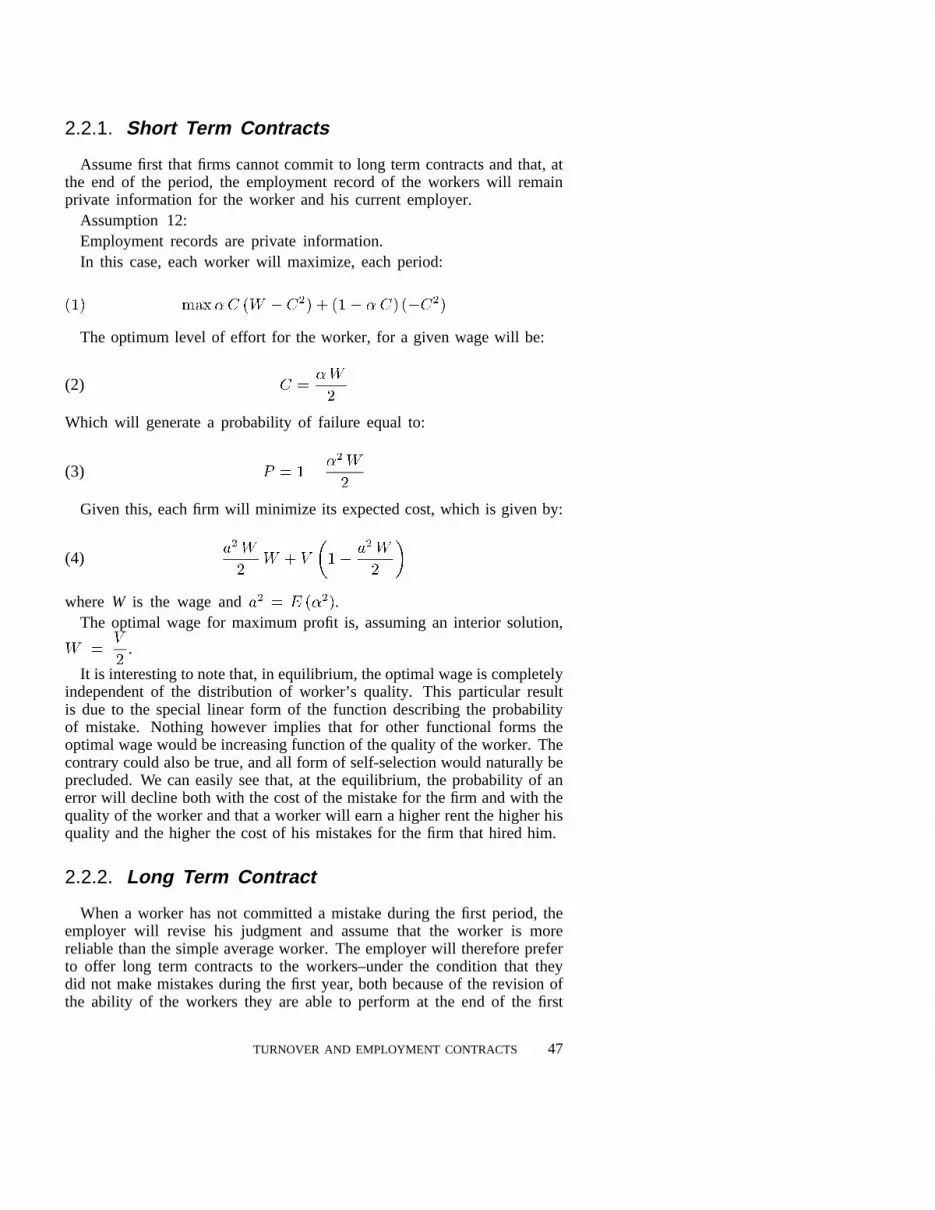
2.2.1. Short Term Contracts
Assume first that firms cannot commit to long term contracts and that, atthe end of the period, the employment record of the workers will remainprivate information for the worker and his currentemployer.
Assumption 12:Employment records are private information.In this case, each worker will maximize, each period:
The optimumlevel of effort for the worker, for a given wage will be:
(2)
Which will generate a probability of failure equal to:
(3)
Given this, each firm will minimize its expected cost, which is given by:
(4)
where W is the wage and .The optimal wage for maximum profit is, assuming an interior solution,
.
It is interesting to note that, in equilibrium, the optimal wage is completelyindependent of the distribution of worker’s quality. This particular resultis due to the special linear form of the function describing the probabilityof mistake. Nothing however implies that for other functional forms theoptimalwagewould beincreasingfunction of the quality of the worker. Thecontrary could also be true, and all form of self-selection would naturally beprecluded. We can easily see that, at the equilibrium, the probability of anerror will decline both with the cost of the mistake for the firm and with thequality of the worker and that a worker will earn a higher rent the higher hisquality andthe higher the costof his mistakesfor the firm that hired him.
2.2.2. Long Term Contract
When a worker has not committed a mistake during the first period, theemployer will revise his judgment and assume that the worker is morereliable than the simple average worker. The employer will therefore preferto offer long term contracts to the workers–under the condition that theydid not make mistakes during the first year, both because of the revision ofthe ability of the workers they are able to perform at the end of the first
TURNOVER AND EMPLOYMENT CONTRACTS 47

period and because, in addition, the wage premium promised for the secondperiod will also have some spillover effects and serve as an incentive duringthe first period. As we keep our assumption of private information of thequality of the worker, and as type 1 jobs are relatively scarce, the workercannotsignalhimself asa high quality worker outside the firm, and he willacceptthe long term contract. In addition, since workers cannot signal theirtrue quality, type I firms alwaysprefer to hire young workers.
During the second period, the problem will be the same for the workeras in the previous case. Hence, the level of effort he will produce will stillbe given by equation (2). During the first period, the problem will changefor the worker, as he will haveto considerthat defaulting at that time willjeopardize his future rents.
The first problem for the worker will be:
(5)
Where the subscripts refer to the period of the worker’s productive life.Solving the first order conditions,we find:
(6)
Where the expectedsurplus is given by:
(7)
In steadystate,a firm will havea youngworkeremployed with probability
, where is the probability for a young worker to make a
mistake,andthe probability of employing an old worker will be .
(AppendixA).Therefore, a firm will, in steady state solve the following problem,
representing its expected cost:
(8)
In order to make the problem more tractable, a first order Taylorapproximation around was performed. (8) becomes:
(8b)
48
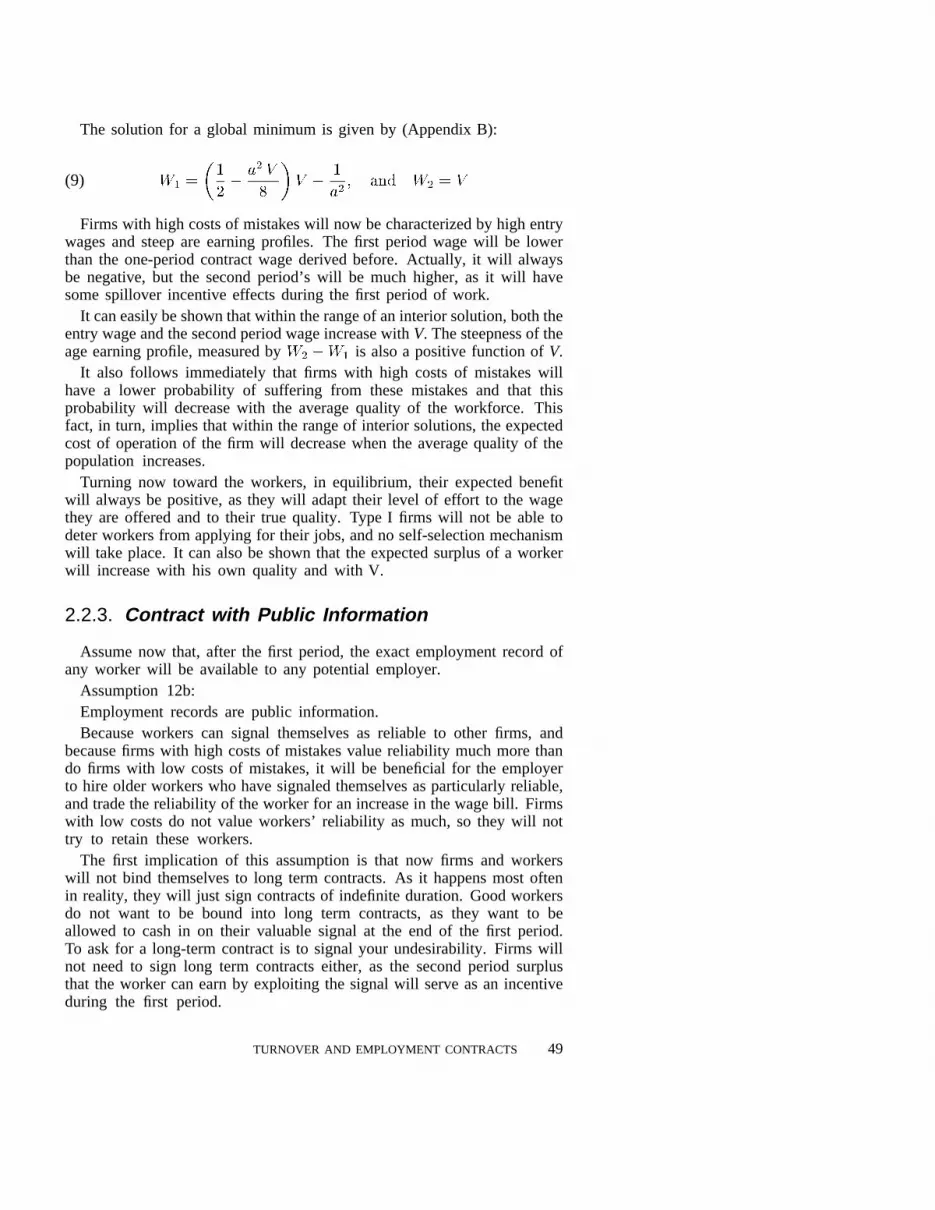
The solution for a global minimum is given by (Appendix B):
(9)
Firms with high costs of mistakes will now be characterized by high entrywages and steep are earning profiles. The first period wage will be lowerthan the one-periodcontractwagederivedbefore. Actually, it will alwaysbe negative, but the second period’s will be much higher, as it will havesomespillover incentiveeffectsduring the first period of work.
It caneasilybeshownthatwithin the range of an interior solution, both theentry wage and the second period wage increase withV. The steepness of theage earning profile, measured by is also a positive function ofV.
It also follows immediately that firms with high costs of mistakes willhave a lower probability of suffering from these mistakes and that thisprobability will decrease with the average quality of the workforce. Thisfact, in turn, implies that within the range of interior solutions, the expectedcost of operationof the firm will decrease when the average quality of thepopulation increases.
Turning now toward the workers, in equilibrium, their expected benefitwill alwaysbe positive, as they will adapt their level of effort to the wagethey are offered and to their true quality. Type I firms will not be able todeterworkersfrom applyingfor their jobs,andno self-selectionmechanismwill takeplace. It canalsobe shownthat the expected surplus of a workerwill increasewith his own quality and with V.
2.2.3. Contract with Public Information
Assumenow that, after the first period, the exact employment record ofany worker will be availableto any potential employer.
Assumption 12b:Employmentrecordsare public information.Becauseworkers can signal themselvesas reliable to other firms, and
becausefirms with high costs of mistakes value reliability much more thando firms with low costs of mistakes, it will be beneficial for the employerto hire older workers who have signaled themselves as particularly reliable,and trade the reliability of the worker for an increase in the wage bill. Firmswith low costs do not value workers’ reliability as much, so they will nottry to retain these workers.
The first implication of this assumption is that now firms and workerswill not bind themselves to long term contracts. As it happens most oftenin reality, they will just sign contracts of indefinite duration. Good workersdo not want to be bound into long term contracts, as they want to beallowed to cash in on their valuable signal at the end of the first period.To ask for a long-term contract is to signal your undesirability. Firms willnot need to sign long term contracts either, as the second period surplusthat the worker can earn by exploiting the signal will serve as an incentiveduring the first period.
TURNOVER AND EMPLOYMENT CONTRACTS 49
The content of the contract that firms with very high costs of mistakeswill offer to the young workers is not basically changed–as they are payingthe highestwages on the market. They will offer them aW1 wage,asgivenby (9), and offer te worker the option to work for them during the secondperiodat a wagealsogivenby (9). However, the situation of the firms withlow costs of mistakes is no longer the same. At the end of the period now,if one of their workershasnot defaulted,he will be allowed to apply to ahigher paying firm. Therefore, the incentive effect during the first periodwill not comeanymorefrom thewagespromisedby the initial employer forthe first and second periods, but from the first period wage and the expectedsurplusthat the worker canearnduring the secondperiod by exploiting thesignal and being hired by a high wage firm.
In this framework, only the workers with very high will not defaultduring the first period. Firms with high cost of mistakes will value thispiece of information very much, and the increase in worker’s reliability willoffset the increasein wage bill for the firm.
Finally, note that an older worker recently hired will be paidV/2, whilean older worker who is spending his second year with the same firm willbe paid V. Therefore, the difference between these two wages (V/2) willbe interpretedas return to tenure,while the differenceV/2 and W1 will beinterpretedas return to age. Theseobviously differ from firm to firm andwill be positively correlatedwith the cost of potential worker’s mistakesfor the firm.
2.3. Testable Implications of the Model
This model has shown that the legal limitations on worker’s liabilitycan generatethe paymentof non-marketclearing wages. The predictionsof the model on the wage structureare consistentwith severalempiricalregularities.
We have also shown that, even in an efficiency wage framework thatprovidesa strong incentive for long-term employment relationships, quitsand discharges can be explained. Firings arise from the employer’s need toenforce efficiency requirements. Quits are the result of the willingness of theworker to cashin on the signal their employment record sends to the marketand to potential employers. By holding a job in a company that requiresa certain level of risk of mistake, the worker signals himself as a workerwith higher ability and reduces the uncertainty about his performance. Thispositive signal often offsets the cost to the employer of paying an efficiencypremium at the end of the worklife even if the employeehas spent lesstime with the company.
Quits will occur less often when the efficiency premium to be paid atthe end of the working life is higher, as workers will find fewer lucrativeopportunities to quit. This implies that firms with steeper age-earning-profiles should suffer less quits than those firms with flatter profiles. In thismodel, return to age, return to tenure and entry level wages are positivelycorrelated– all three being positive functions of the cost of mistake – we canextend this conclusion to return to tenure and entry level wages. Dischargesor firings will also occur less often in firms paying higher wages, as these
50

higher wages reflect the need for the firm to reduce farther the risk of mistakeby their employees. When longer employment relationships take place, thisneedfor the employer to reduce the risk of failure will be reflected in thepremium to be paid at the end of the contract, which can be approximatedby the steepnessof the ageearningprofile. Here too, firms with steeper ageearningprofiles will fire fewer workers than firms with flatter profiles.
3 Empirical Evidence on Wages andTurnover
The presumption in this paper and in much of compensation literature isthat firms differ in their compensation policy. Obviously with homogeneousworkers, homogeneousfirms, and perfect competition there would be nodifferences in pay or pay policy to analyze. So our first goal is tocompareobservedwage distributions with those predicted by the mostparsimoniousand simple model of a competitive labor market. Laboreconomistshowever,havelong known that wageuniformity is morelikelyto reflect controlled than competitive labor markets. Europe in general,and Belgium in particular, are then especially interesting because of 1)high levels of government intervention in industry to set wage growth ratesand minimum wagelevels; 2) high ratesof unionization (all the firms westudy are unionized),and 3) and a centralized industry bargaining system(comparedto the U.S.). In addition Belgium is a geographicallycompactcountrywith a densetransportationnetworkthat bringsmostjobs and mostworkers within less than an hour of eachother. The geographic barriersare linguistic more than temporal.
While they recognizethat the systemhasfrayed around the edges in thelast decade,expertson the Belgian labor marketroutinely describe it as asystemin which wagesaresetin industrywide bargaining, with little if anydeviationat the firm or worker level. Indeed,this type of wage uniformityand rigidity has commonly been alleged to contribute to high unemploymentin Europe. However, most of the evidence presented on this issue has beenbasedon macroeconomicaggregates,and these can easily be spectacularlymisleadingconcerning the underlying microeconomic behavior. Our secondgoal is then is to compare wage setting, in the U.S. and in a Europeancountry, not on the basis of commonly asserted folktales or aggregatepatterns, but on the basis of observed microeconomic behavior. Finally, wewill showhow worker turnoverdiffers betweenBelgium andthe U.S., andshow how differences in pay policies affect turnover.
In a matched employer-employee data-set, the previous hypotheses cannow be empirically tested. 312 companies from the Belgian manufacturingindustry will be used2. This dataset, built using data from the Belgian
2. The choiceof thesefirms has been dictated only by the availability of non-wage related datafor the firm (sales, assets, liabilities,...). The sample may not be representative of the Belgianmanufacturing sector, which includes many smaller firms.
TURNOVER AND EMPLOYMENT CONTRACTS 51

retirement funds for private workers, contains annual individual informationon every person who has been working for these companies between 1983and1985. Although we only consider here the work experience of workersin one of these 312 firms, we can observe the result of a worker separationfrom one of them and infer from this result whether the separation wasinitiated by the employer or by the employee, or whether the separationresultedin unemployment,or droppingout of the labor force 3.
In this application, we will explain the quit and discharge rates during1984 in terms of firm pay policy. The 312 study firms have in 1984 anaverage of 814 employees, ranging in size from 7 to 20,801 with a standard-deviation of 1844. They employ 175,570 blue collar workers and 69,125white collar workers. Given the structural differences between blue- andwhite-collars labor markets, we estimate separate equations for each classof worker. These are population–not sample–data on employees withinthesefirms. One could then treat the results that follow as calculationsbased on the population of workers in these firms, rather than as the usualestimatesbasedon a sample. From that perspective,the standard-errorscannot reflect sampling error (of which there can be none in the population),but rather must reflect true dispersion of behavior in the population, orequivalently specificationerror. This reflects the inability of this or anyother model to perfect capture reality. The firms themselvesare thosefor which financial information is available. Most of them represent thelargestindustrial employersin Belgium. In total, they account for almost30% of Belgian manufacturingemployment. To place what follow inmacroeconomiccontext,in 1984the Belgianunemploymentratewas14%,after almost10 yearsof stagnantoverall macrogrowth.
3.1. Wage Dispersion Across Workers, Industries andFirms
The first surprising finding is that wages in a compact European countrywith a reputation for centralized industry-wide wage setting are in fact widelydispersed across firms within each industry, and across workers within eachfirm. Thesecondsurprisingfinding is that wages in Belgium are only slightlymorecompressedthanin the U.S. Table1 presents population statistics andTable2 presents a standard log wage equation for the pooled 175,570population of Bue-Collar workers in 1984 in 312 Belgium manufacturingfirms.
The first two equations of Table 2 control only for worker characteristics(age, sex, tenure with the current firm), and so are directly comparable withsimilar estimates from microdata on individual workers. The amount of wagevariation explainedby this simple equationin Belgium is similar to thattypically observed in the U.S. In both cases, there is substantial individual
3. A small minority of Belgian workers are not covered by the pension system from which thedataare built. The largestof these uncovered groups are the tenured employees of the federalgovernment. When a worker under the normal age of retirement disappears from the data, heis said to have dropped out of the labor force. A small fraction of them might have actuallygone to work for the federal government. Since only a very small number of these workers arehired with tenure, this problem is likely to be of limited magnitude.
52
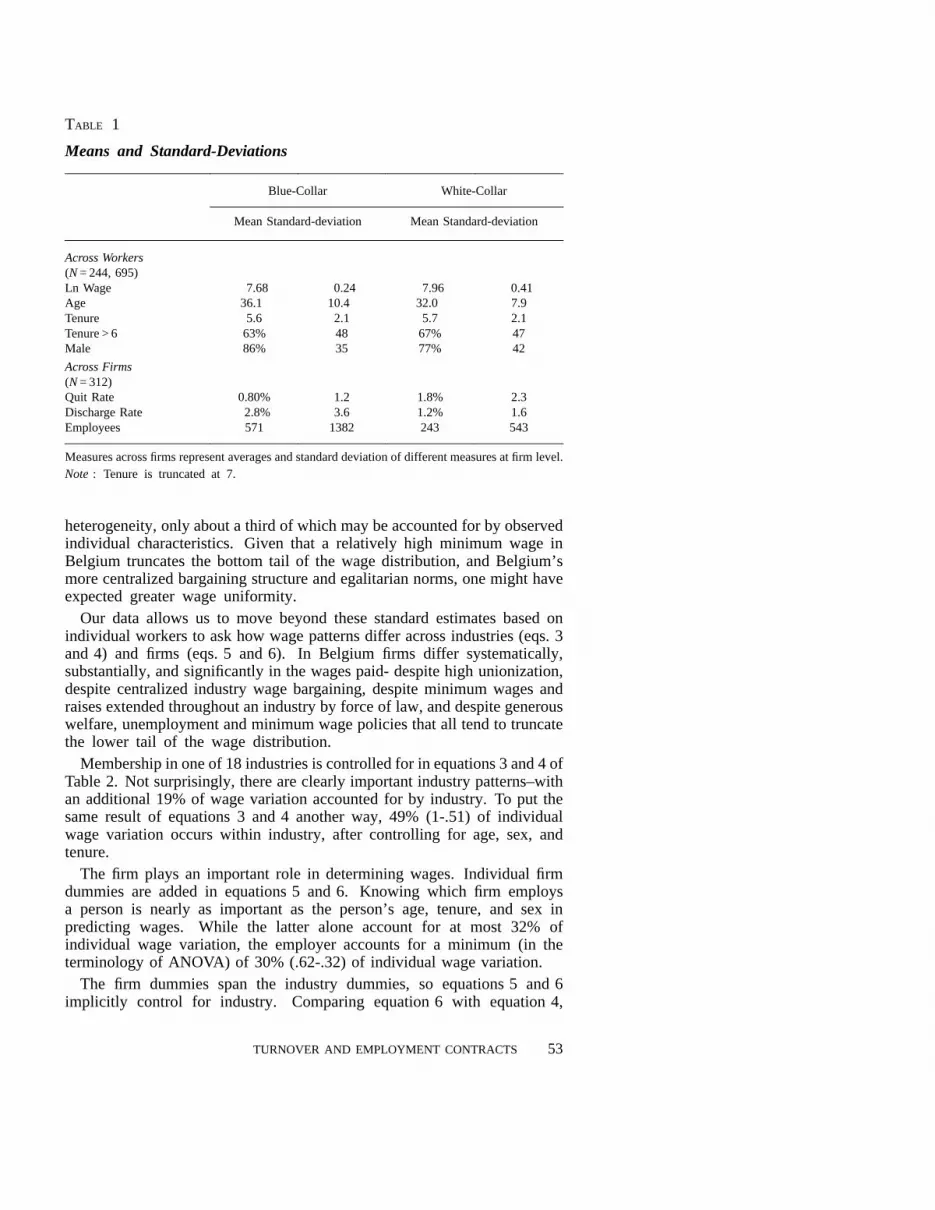
TABLE 1
Means and Standard-Deviations
Blue-Collar White-Collar
MeanStandard-deviation MeanStandard-deviation
AcrossWorkers(N = 244, 695)Ln Wage 7.68 0.24 7.96 0.41Age 36.1 10.4 32.0 7.9Tenure 5.6 2.1 5.7 2.1Tenure > 6 63% 48 67% 47Male 86% 35 77% 42
Across Firms(N = 312)Quit Rate 0.80% 1.2 1.8% 2.3Discharge Rate 2.8% 3.6 1.2% 1.6Employees 571 1382 243 543
Measuresacrossfirms representaveragesandstandarddeviationof differentmeasures at firm level.Note : Tenure is truncated at 7.
heterogeneity,only abouta third of which may be accounted for by observedindividual characteristics.Given that a relatively high minimum wage inBelgium truncatesthe bottom tail of the wagedistribution, and Belgium’smorecentralizedbargainingstructureandegalitariannorms,onemight haveexpectedgreaterwage uniformity.
Our data allows us to move beyond these standard estimates based onindividual workersto askhow wagepatternsdiffer acrossindustries(eqs.3and4) and firms (eqs.5 and6). In Belgium firms differ systematically,substantially,andsignificantlyin the wagespaid- despite high unionization,despitecentralized industry wage bargaining, despite minimum wages andraises extended throughout an industry by force of law, and despite generouswelfare,unemploymentandminimumwage policies that all tend to truncatethe lower tail of the wage distribution.
Membershipin one of 18 industries is controlled for in equations 3 and 4 ofTable 2. Not surprisingly, there are clearly important industry patterns–withan additional 19% of wage variation accounted for by industry. To put thesame result of equations 3 and 4 another way, 49% (1-.51) of individualwage variation occurs within industry, after controlling for age, sex, andtenure.
The firm plays an important role in determining wages. Individual firmdummiesare addedin equations5 and6. Knowing which firm employsa person is nearly as important as the person’s age, tenure, and sex inpredicting wages. While the latter alone account for at most 32% ofindividual wage variation, the employer accounts for a minimum (in theterminologyof ANOVA) of 30% (.62-.32) of individual wage variation.
The firm dummies span the industry dummies, so equations 5 and 6implicitly control for industry. Comparing equation 6 with equation 4,
TURNOVER AND EMPLOYMENT CONTRACTS 53
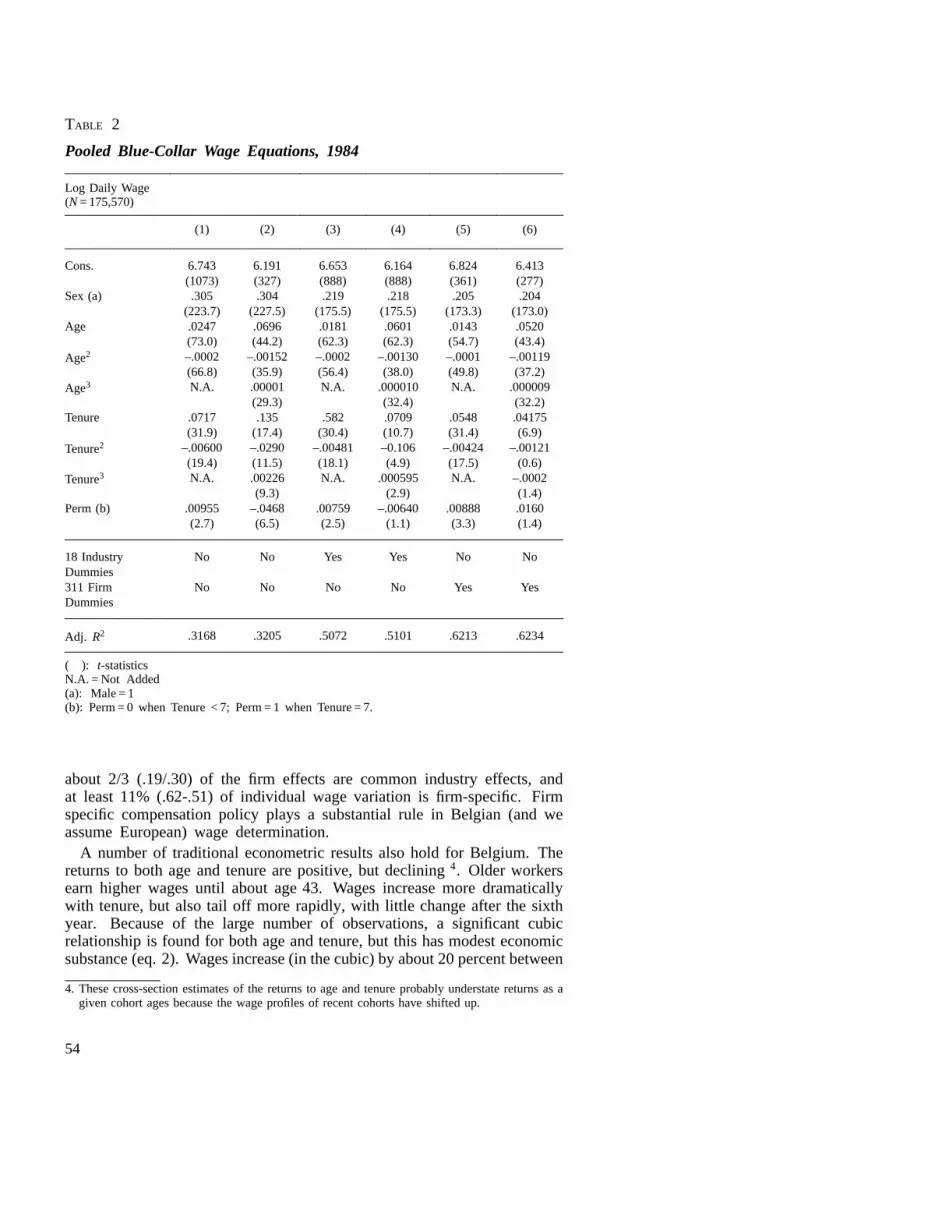
TABLE 2
Pooled Blue-Collar Wage Equations, 1984
Log Daily Wage(N = 175,570)
(1) (2) (3) (4) (5) (6)
Cons. 6.743 6.191 6.653 6.164 6.824 6.413(1073) (327) (888) (888) (361) (277)
Sex (a) .305 .304 .219 .218 .205 .204(223.7) (227.5) (175.5) (175.5) (173.3) (173.0)
Age .0247 .0696 .0181 .0601 .0143 .0520(73.0) (44.2) (62.3) (62.3) (54.7) (43.4)
Age2 –.0002 –.00152 –.0002 –.00130 –.0001 –.00119(66.8) (35.9) (56.4) (38.0) (49.8) (37.2)
Age3 N.A. .00001 N.A. .000010 N.A. .000009(29.3) (32.4) (32.2)
Tenure .0717 .135 .582 .0709 .0548 .04175(31.9) (17.4) (30.4) (10.7) (31.4) (6.9)
Tenure2 –.00600 –.0290 –.00481 –0.106 –.00424 –.00121(19.4) (11.5) (18.1) (4.9) (17.5) (0.6)
Tenure3 N.A. .00226 N.A. .000595 N.A. –.0002(9.3) (2.9) (1.4)
Perm(b) .00955 –.0468 .00759 –.00640 .00888 .0160(2.7) (6.5) (2.5) (1.1) (3.3) (1.4)
18 Industry No No Yes Yes No NoDummies311 Firm No No No No Yes YesDummies
Adj. R2 .3168 .3205 .5072 .5101 .6213 .6234
( ): t-statisticsN.A. = Not Added(a): Male= 1(b): Perm= 0 when Tenure< 7; Perm = 1 when Tenure = 7.
about 2/3 (.19/.30) of the firm effects are common industry effects, andat least 11% (.62-.51) of individual wage variation is firm-specific. Firmspecific compensation policy plays a substantial rule in Belgian (and weassume European) wage determination.
A number of traditional econometric results also hold for Belgium. Thereturns to both age and tenure are positive, but declining4. Older workersearn higher wagesuntil about age43. Wages increase more dramaticallywith tenure, but also tail off more rapidly, with little change after the sixthyear. Because of the large number of observations, a significant cubicrelationship is found for both age and tenure, but this has modest economicsubstance (eq. 2). Wages increase (in the cubic) by about 20 percent between
4. These cross-section estimates of the returns to age and tenure probably understate returns as agiven cohort ages because the wage profiles of recent cohorts have shifted up.
54

ages 20 and 31, increase an additional 2 percent to the peak at age 39, anddecline 2 percent until age 56 with a slight rise thereafter. In the caseof both tenure and age, the returns are concentrated in the first third orless of work life.
3.2. Sorting and the Returns to Age and Tenure
Even if no firm increased wages with age, typical wage estimates (withoutfirm data) would show such a relationship if older workers sort into higherwagefirms. Similarly, even if wages did not increase with tenure, such arelationship might commonly be estimated if workers in good job matcheswere rewarded with higher wages and so tended to stay to develop hightenure(ABRAHAM andFARBER). In the first case,the interesting question ishow much of the returns to age occur within as opposed to across firms.In other words, do the observed returns to age reflect common senioritywagepolicies within each firm, or are they driven by the sorting of olderworkers into high wage firms. In the second case, the question is howmuch of the observed returns to tenure reflect successful sorting and matchspecific premiums.
The returns to both age and tenure observed in Belgian microdata onindividual workers overstates the returns within the average firm. Compareequations5 and 6 of Table2 with equations 1 and 2. Controlling for firm,the returnsto ageand tenureare reduced,dramaticallyin the caseof age.The averageworker earns20% moreby age31 than at age 20. Controllingfor firm, however,the averageworker’s earningsincreaseby only half asmuch,10% 5. Half of theobservedreturns to age among these firms is thenaccountedfor by the movementof older workers to higher wage firms6.Moversamongthesefirms apparentlyearna premium. This strong result issurprisingin the Belgian contextbecausefew havethoughtof it as a fluidlabormarketwith job shopping(turnover)sufficientto produce such a result.U.S. microdatausually doesnot permit estimationof firm effects but thegreater turnover of U.S. workers suggests that the estimated returns to agein the U.S. may overstate even more what happens within the average firm.
Table 3 limits the sample to a group of stayers–here those with morethan 7 years tenure at the same firm. The results in equation 6 show thatamong these stayers, the returns to age are muted and practically negligible.Because7 yearsof tenure are required to be in this sample, it is practicalto compare wages starting at age 27 (the estimates imply a 2 to 3 percentwage gain before this age, but these must be largely extrapolations beyondthe observedrange). Betweenage 27 and their peak at age 41, earningsincrease by only 2.6 percent. For seasoned workers, wages are remarkablyflat within the firm.
Thecontrast between strong returns to age in Table 2 and negligible returnsin Table 3 indicates bigger returns to age among low tenure workers. Oldworkers with low tenure are unusual. Among these firms, they are also
5. This estimate includes both movers and stayers, but conditions on employer in 1984.6. We will show that the bulk of these movements happens during the first few years of
employment.
TURNOVER AND EMPLOYMENT CONTRACTS 55

TABLE 3
PooledBlue-Collar Wage Equations, 1984, High Tenure
Log Daily Wage(Workers with more than 7 years seniority)(N = 111,994)
(1) (2) (3) (4) (5) (6)
Cons. 7.064 6.705 7.003 6.777 7.141 6.979(691) (177) (624) (204) (91) (84)
Sex (a) .296 .296 .223 .222 .209 .209(183) (183) (151) (151) (150) (150)
Age .0193 .0474 .0114 .0289 .0079 .0206(38) (16) (6) (12) (20) (10)
Age2 –.000280 –.000927 –.000126 –.00057 –.000108 –.00041(33) (13) (24) (9) (19) (8)
Age3 N.A. .0000057 .N.A. .00001306 N.A. .00000259(10) (7) (6)
18 Industry No No Yes Yes No NoDummies311 Firm No No No No Yes YesDummies
Adj. R2 .2501 .2507 .4648 .4650 .5963 .5965
( ): t-statisticsN.A. = Not added(a): Male= 1.
unusually well paid–again consistent with firms paying a wage premium toattract experiencedworkers.
The returns to tenure are also lower once firms are controlled for.Comparingequations6 and 2 of Table2 indicates that workers are morelikely to build up high tenure in high wage firms, so estimates such asthosein equation 2 overstate the true return to tenure within firms. Similarconclusions are drawn for the U.S. by ABRAHAM and FARBER [1987].
Previous work in the U.S. (LEONARD [1988]) developed models inwhich the wage distribution within a firm becomes truncated as wageoutliers leave the firm to find better matches. In this model, wagesalso become less predictable on the basis of characteristics observableto the econometrician–asthe firm uncoverstrue variationsin productivityunobservable to an outsider. These models predict that as a group ofworkersincreasetheir tenurewithin firms, the firm effectsbecomestronger(as selection across firms proceeds), but the R2 of wage equations decreasesas wages are determined more by factors observed by the firm but not bythe econometrician. Comparing the high tenure workers in Table 3 withthe entire work force in Table 2, we see that publicly observed personalcharacteristicssuch as age and sex explain less wage variation amongseasoned workers than among entrants. This result for Belgium is consistentwith earlier work for the U.S. (LEONARD [1988]). In both countries wages
56

depend less on publicly observed characteristics, and relatively more onprivate information as tenure increases.
A putty-clay view holds that the equalizing forces of labor marketcompetition are strongest for new hires (the active margin). Wages can varymore amonghigh tenureworkers becauseof larger fixed costs that limittheir mobility. This predicts less wage variation across workers and firmsat low tenurewho aremore directly exposed to competition. In contrast, arent-sharing model (or any firm-wide firm-specific effect) predicts constantfirm effectsacrosstenuregroups.A final, competitivemodelallowsworkersto be forward-looking, and equalize present-values of career earnings. Thevarianceof wagesacrossfirms with different returnsto tenure will then fallas they reach the cross-over point some years after hiring.
Competition does not force more compressed firm effects among newhires than among tenured workers, contrary to the active margin theory.Nor is the variance of firm effects constant across tenure groups, contrary tosimpleomittedcommon factor models such as rent-sharing or compensatingdifferentials. Separately for workers with one and seven years of tenure, weestimatepooled(across firm) log wage equations as a function of age and itssquare,sex, and firm dummies. The standard-deviationof the firm effectsamongnewly hired blue-collarsis .44, falling to .38 amongworkers with7 yearsof tenure. Among White-Collar workers, the new hire standard-deviationof firm effectsis .47, falling to .39 at sevenyears of tenure. Thefirm effectswe observearenot duesimply to the lock-in of tenured works,nor to a commonomitted firm factor. Nor are differences across firms inskill requirementsor occupationaldistribution likely to accountfor thesewage patterns,for if that were the casewe would have expected muchgreaterdispersionfor white thanfor Blue-Collarworkers. These results arecongruentwith forcesthat tend to level the present-valueof earningsoverthe career.We shall reinforcethis point later in examining the relationshipbetweenstarting pay and returnsto tenure.
Note also that the wage penalty for being a woman has been remarkablypersistentand stable. Among workers hired into their firm more than7 years ago, women earn 30% less than men, controlling for age, and 20%less controlling for age and firm. The penalty is nearly identical in thefull populationwhich includesmore recent entrants. One-third of the wagepenaltyoccurs because Belgian women are more likely to work in low wagefirms. Pay equity proposals that end at each firm’s walls cannot touch this.
3.3. Differences in Firm Compensation Policy
Previous work in the U.S. has shown that the standarddeviation offirm wage effects within industry, typically lies in the range of 7 to 21%,even within industries and labor markets thought of as competitive, evenwithin narrowly focused industries and geographic regions, and even aftercontrolling for narrow occupations (GROSHEN [1991]; LEONARD [1989],[1990]). In Europe, we expect less variation across firms–not because themarkets are more competitive (although they are shifted toward smallerestablishments), but because they are more unionized, more subject tocentralized bargaining, and more constrained by government wage regulation
TURNOVER AND EMPLOYMENT CONTRACTS 57
directly through the minimum wage as well as indirectly through wage floorscreated by generous social welfare programs.
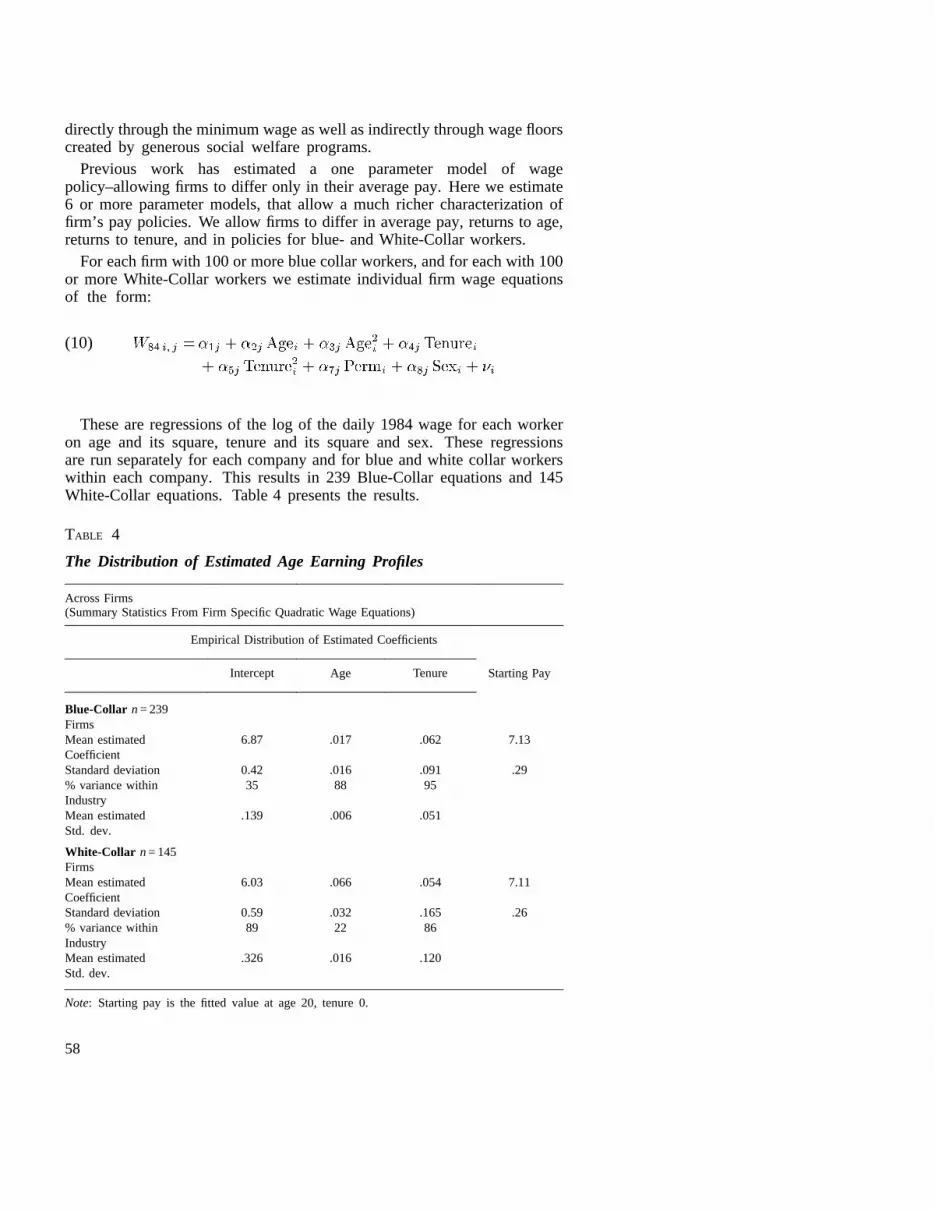
Previous work has estimated a one parameter model of wagepolicy–allowing firms to differ only in their average pay. Here we estimate6 or more parametermodels,that allow a much richer characterization offirm’s pay policies. We allow firms to differ in average pay, returns to age,returnsto tenure,and in policies for blue- and White-Collar workers.
For each firm with 100 or more blue collar workers, and for each with 100or more White-Collar workerswe estimateindividual firm wage equationsof the form:
i i i(10)
i i i
Theseare regressions of the log of the daily 1984 wage for each workeron age and its square, tenure and its square and sex. These regressionsarerun separately for each company and for blue and white collar workerswithin eachcompany. This results in 239 Blue-Collar equations and 145White-Collar equations.Table4 presentsthe results.
TABLE 4
The Distribution of EstimatedAge Earning Profiles
AcrossFirms(Summary Statistics From Firm Specific Quadratic Wage Equations)
Empirical Distribution of Estimated Coefficients
Intercept Age Tenure Starting Pay
Blue-Collar n = 239FirmsMean estimated 6.87 .017 .062 7.13CoefficientStandard deviation 0.42 .016 .091 .29% variance within 35 88 95IndustryMean estimated .139 .006 .051Std. dev.
White-Collar n= 145FirmsMean estimated 6.03 .066 .054 7.11CoefficientStandard deviation 0.59 .032 .165 .26% variance within 89 22 86IndustryMean estimated .326 .016 .120Std. dev.
Note: Starting pay is the fitted value at age 20, tenure 0.
58

Simply put, common depictions of Belgian (and perhaps European) paypolicy as rigidly uniform across firms are wrong. Belgian manufacturingfirms exhibit large differences from each other in starting pay, as well as inthe returns to tenure and age. Moreover, most of this variation take placewithin, not across,industry lines.
The dispersion in pay across Belgian firms is not only large–it iscomparablein magnitudeto that observedin the U.S. Again the evidenceis contrary to common assertions. The standard deviation of blue collarstarting pay acrosslarge Belgian manufacturingfirms is .289 (Table 4).None of this can be accounted for by differences in age (held fixed at20), tenure (held fixed at 0), sex (controlled for), broad occupation (thepopulation is limited to blue collars), macroeconomic conditions (year isheld fixed), region (Belgium is too compact), or broad industry (controlledfor). In other words, to encompass 95% of these firms requires a rangeof firm daily wages from 2190 BF to 705BF, a 3:1 ratio. One standarddeviation above and below the mean would range from 1659BF to 931BF, a1.8:1ratio. Pay dispersion across Belgian manufacturing firms is substantial.
It contributeslittle to compare these results to the theoretical constructof a perfectly informed and perfectly competitive market with no wagedispersionbecauseasan empiricalmatter,wagesarerarely identicalacrossworkers, establishmentsor firms, even within what are often thought ofas competitivemarkets. For example,a survey of 2087 workers in U.S.fast-food restaurantsin 1982 showedthat for the proverbial hamburger-flippersandtheir managers,thestandard-deviationof wagesarerespectively10 percentand 22 percentof averagewage(KRUEGER [1991], p. 88).
A distinct empirical questionis whetherthereare systematicdifferencesacrossfirms or establishmentsin thelevel of pay in the relatively unregulatedUS markets. Even within unregulatedindustries, substantialdifferenceshave typically been found. GROSHEN [1991] presentssuch evidenceforsix different US manufacturingindustries7. Controlling for occupation,sex, region, and incentive pay, she finds that the standard-deviation ofpay across establishments within industry is about 14 percent of theaverage wage. In a study of compensation at some 200 plants in theCalifornia electronicsindustry between1980 and 1985, LEONARD [1989]finds,controlling for occupation,that the standard-deviationof plant effectsaverages7.3 percent in what is usually thought of as a competitive industry.Even greater dispersion is found among managers and executives acrossfirms and industries. LEONARD [1990] examined executive and managerialpay for executives at 439 of the largest U.S. corporations between 1981 and1985. The standard-deviationof estimatedfirm wageeffectsis .21 for thelogarithm of base salary plus bonus, controlling for occupation, education,position in the corporate hierarchy and unit sales.
7. Groshen uses data from U.S. Bureau of Labor Statistics Industry Occupational Wage Surveysbetween1974and1978for productionworkers.Wages reported are straight-time hourly wagesfor hourly workers, and average hourly earnings for workers under incentive pay schemes.Groshen statistically controls for sex, region (where available), incentive pay, and detailedoccupation.Shefindssignificantestablishmentwage differentials in all six industries, averaging.14 log points. The standard-deviation of establishment wage differentials in each industry areplastics (0.15), industrial chemicals (0.15), wool textiles (0.15), men’s and boy’s shirts andnightwear (0.13), cotton and man-made textiles (0.09), and fabricated structural steel (0.18).
TURNOVER AND EMPLOYMENT CONTRACTS 59
All of these studies are of employers in unregulated industries. Allfind substantial wage variation across employees and across employers.The standard-deviationof establishment or firm wage differentials in thesestudies range from 7 percent to 21 percent. The roughly comparable figuresfor startingpay in Belgium are26 percentfor white-collars and 29 percentfor blue-collars. The wage differentials observed among large Belgianmanufacturingfirms exceedsthat observedin US industries.
It is not possible to perform a perfectly identical analysis of US wagesacross firms. Some part of the larger pay dispersion observed here forBelgium is probably due to the finer occupational categories used in theUS studies. Part of what we label here as firm differences in pay mayreflectdifferent skill distributionsacrossBelgianfirms, althoughit may alsobe that US firms hide some pay differentials for identical workers behinddifferent job titles. The definition of industry, and its administration to firmsmay also result in broader and more heterogeneous firms within industry inBelgium than in some of the US studies. US firms are also more likely todiffer in benefits, more of which are privately provided in the US than inBelgium. Counterbalancing this, the US studies tend to include firms thatare more widely dispersed across regions and across firm size. Educationis not directly controlled for here, nor in most of the US studies. In theoneUS studythat doescontrol for education(LEONARD [1990]), it haslittleimpact on wagesoncedetailedoccupationis controlledfor.
The US results that follow most closely the methods we apply here toBelgium comefrom an analysisof wages for workers divided into two jobclasses(productionand non-production)analogousto the blue and whitecollarclassificationsweuse,andinto 2-digit industries within manufacturing,a similar level of industry classification. DAVIS and HALTIWANGER [1991]reportthestandard-deviationsof plantmeans(Table2) andthe overall means(Table6) of hourly wages. From this data, we calculate the coefficientof variation to be .37 for Blue-Collar and .35 for White-Collar. Usingsimilar broad occupationalclassesand 2-digit industry classes,Davis andHaltiwanger’sdata indicatesthat the standard-deviationof firm effects is35% for White-Collar and 37% for Blue-Collar within US manufacturingindustries in 1984. They also report that 26% of the Blue-Collar betweenplant variation is accounted for by differences in plant size (p. 151). Thedispersion of size in our Belgian firms is roughly one-third that observedacross U.S. plants. To isolate our comparison from differences due todiffering size dispersions, we eliminate two-thirds of the 26% of U.S.between plant variation. If U.S. plants varied as little in size as ourBelgian firms do, we would expectto seeroughly a 30 percent standard-deviation of Blue-Collar firm effects. This is quite close to what we actuallyobservein Belgium. The point of this exerciseis not to claim that thistechnique is without flaw, but rather to show that the observed differencesin wage dispersion across employers in Belgium compared to the U.S. arewell within the range of uncertainty created by differences in populationsstudied, in industrial and occupational classification, and in measurementand classificationtechniques. Differences in the size distribution alone aresufficient to account for most of the differences observed across countriesin cross-employer wage dispersion.
60

Nor is Belgium alone among European countries in its wage dispersion.The only similar analysis for Europe of which we are aware is the remarkablework by ABOWD, KRAMARZ [1992] and ABOWD, KRAMARZ, and MARGOLIS
[1994]. The former paper reports (Table 1) that in the French economy,the standard-deviationof enterpriseeffects on annualcompensationis 34percentof mean pay, rising slightly to 35 percent among unskilled workers.This includes both within and acrossindustry components,but, like ourstudy, shows substantial differences in pay across firms.
On this evidence,it appearsmistakento claim that Belgian (European?)wage structures across employers within manufacturing are too compressedand too uniform compared to the supposedly more competitive US. Indeed,Belgian manufacturing firms appear to be roughly comparable in wagedispersion to their US counterparts. Belgian wage dispersion may vary indegree, but certainly not in type from that observed in the U.S.
A significant advantageof the richer parameterization of pay policyemployed here is that it allows us to see that Belgian firms differ not onlyin terms of starting (or average) pay, but also in terms of the returns toage and tenure. The latter differences are exceedingly large. As one wouldexpect,givengreaterdifferences in ability, observability, and responsibility,therearegreatervariationsin the returnsto age and tenure for white collarthan for blue collar workers.
The magnitudeof the slope differencesacrossfirms is such that it isnaturalto suspectmeasurementor specificationerror. Again, samplingerroris precludedbecausethere is no samplingof employees.An exampleofthe type of error we suspectis as follows. Suppose the true age earningsprofile werequadraticandidenticalover firms, A linear function fit to firmswith different agedistributionsof workerswill yield steeper slopes in firmswith youngerworkers. Indeed,amongblue collar workers the estimatedreturn to age within a firm is negativelycorrelatedwith averageage. Weattemptto guardagainstthis typeof error by limiting the calculation to firmswith more than 100 workers in the particular collar color, and by fittingcubic equations. If the differences in pay policy found here across firms areall spurious statistical artifacts despite our precautions, then by definition,they can haveno real effects. The best evidence that at least part of thesedifferences are real is to show that they have a real impact on workers orfirms. We present such results in the last section.
Both economic and institutional explanations of pay policy would usuallypredict differences across industry. Such differences could arise in theoryif industries differ in production functions, shirking costs, monitoring costs,observabilityof output,specifichumancapital investments and investmentshares, and default risk. In institutional accounts industries differ by historyor by tautology.
Most of the variation in Belgian pay policy occurs within–notacross–industries(Table4). Pay policy is more heterogeneous across firmsthan can be accounted for by any of the simple models that predictdifferences across but not within industries.
Comparing returns to age and tenure shows that the average worker(Table 2, eq. 1) is in a firm that is less steeply sloped than the average firm
TURNOVER AND EMPLOYMENT CONTRACTS 61
(Table 4) (slopes are steeper in smaller firms). Clearly, the returns to tenureduring the first six years are dramatic within these firms.
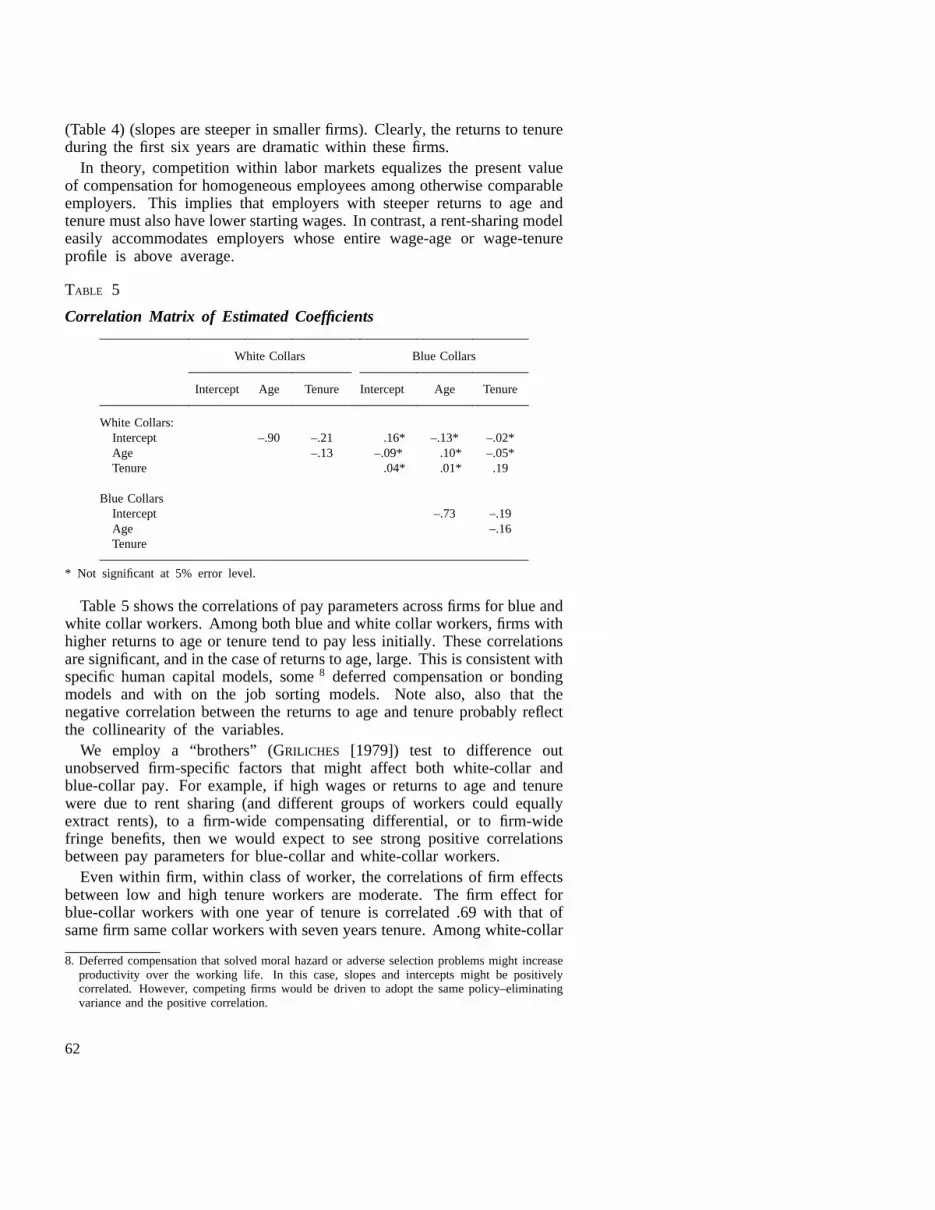
In theory, competition within labor markets equalizes the present valueof compensationfor homogeneous employees among otherwise comparableemployers. This implies that employers with steeper returns to age andtenuremustalsohavelower startingwages.In contrast, a rent-sharing modeleasily accommodates employers whose entire wage-age or wage-tenureprofile is above average.
TABLE 5
Correlation Matrix of EstimatedCoefficients
White Collars Blue Collars
Intercept Age Tenure Intercept Age Tenure
White Collars:Intercept –.90 –.21 .16* –.13* –.02*Age –.13 –.09* .10* –.05*Tenure .04* .01* .19
Blue CollarsIntercept –.73 –.19Age –.16Tenure
* Not significant at 5% error level.
Table5 showsthecorrelationsof payparametersacross firms for blue andwhite collar workers.Amongbothblueandwhite collar workers, firms withhigher returnsto ageor tenuretendto pay less initially. These correlationsaresignificant,andin thecaseof returnsto age,large. This is consistent withspecific humancapital models,some8 deferredcompensationor bondingmodels and with on the job sorting models. Note also, also that thenegativecorrelationbetweenthe returnsto ageand tenure probably reflectthe collinearity of the variables.
We employ a “brothers” (GRILICHES [1979]) test to difference outunobserved firm-specific factors that might affect both white-collar andblue-collar pay. For example, if high wages or returns to age and tenurewere due to rent sharing (and different groups of workers could equallyextract rents), to a firm-wide compensating differential, or to firm-widefringe benefits,then we would expect to see strong positive correlationsbetween pay parameters for blue-collar and white-collar workers.
Even within firm, within class of worker, the correlations of firm effectsbetween low and high tenure workers are moderate. The firm effect forblue-collar workers with one year of tenure is correlated .69 with that ofsamefirm samecollar workerswith seven years tenure. Among white-collar
8. Deferred compensation that solved moral hazard or adverse selection problems might increaseproductivity over the working life. In this case, slopes and intercepts might be positivelycorrelated. However, competing firms would be driven to adopt the same policy–eliminatingvariance and the positive correlation.
62
workers, the correlation across tenure groups is only .43. These correlationsrestate the fact that firms with steeper returns to tenure pay less initially.Theseresults are consistent with labor market competition that tends toequalize not starting wages but rather the present-value of career earnings.
Table 5 shows that with the exception of returns to tenure, pay policiestoward blue- and white-collar workers are not significantly correlated. Inother words, pay policy does not reflect a common firm-wide force orcondition. This rules out widely shared rents; compensating differentials forfirm-wide risks, amenities,working conditionsor fringe benefits;growthbooms; or locale specific differences. The observed heterogeneitywithinfirms acrossclassesof workers is a simple but powerful result becauseit makes a firm-wide, firm-specific force an unlikely cause of observedpay differences. Because efficiency wages depends on monitoring orobservability problems that might easily differ across classes of workerswithin a firm, the absence of common firm effects leaves open an efficiencywage interpretation of the data.
An efficiency wage model appears more relevant than a rent-sharinginterpretation. Even in a strongly unionized9 country, no significantcorrelation (with the exception of the return to tenure) can be foundbetweenthewagescheduleof blue-andwhite-collarworkers. A rent sharinginterpretationwould imply strong positive correlationbetweenthem. Onthe other hand,an efficiency wage interpretation,groundedin monitoringand the uncertaintyexisting on workers’ performancesdoesnot makethesameprediction.This distinctionarisesbecause,while blueandwhite collarworkersin a samefirm facethe samerentsthey do not face the same costsof monitoring,shirking, or the samecostsof potential mistakes.
4 Employee Turnover
Before examining the impact of pay policy on turnover, we first describethe nature of flows out of firms. Employee turnover is low in Belgiumcomparedto the U.S., but it is still substantial. Firms in this sample havehad a relatively high level of turnover between 1984 and 1985. Turnoverfigures are calculated from individual data. A worker who was presentin 1984 and disappears from the firm’s payroll in 1985 is classified ashaving left the firm. The reasons for the separation are inferred from theemploymenthistoryof theworker. If hespendssometime unemployedafterhe leaves the firm, he will be assumed to have been laid-off. Temporarylayoffs do not exist in Belgium. The discharges reported here are permanentseparations. If he goes directly to another employer, he will be assumedto have quit the firm. Finally, if he disappears from the records of theprivate sector social security system, he will be classified as having leftthe labor force.
9. All companies in the study are unionized.
TURNOVER AND EMPLOYMENT CONTRACTS 63

These definitions are of course subject to some criticisms. Some workerswilling to leave the labor force might ask their employer to fire them inorder to be allowed to collect some unemployment compensation. Someworkers laid off might find a new job between the day when they arenotified of their dischargeand the day their employment effectively ends,as Belgian law requires in most cases short advance notice of the lay off.These discrepancies,however, are likely to be minor 10. However, thelongernotice typically required for white- than for blue-collar workers mayresult in a higher ratio of quits to discharges among white-collars.
When a separation is initiated by an employer, the data do not allowus to retrieve the cause of the separation. The data on layoffs includeindistinguishablylayoffs in response to a fall in product demand, and firingsthat would occur even with fixed demand. Our theory concerns firingsfor cause, so the regressions that follow count as discharges only thoseseparations resulting in unemployment that are in excess of the decline inpositions at the firm.
Table 6 shows the distribution of 1984 labor stocks and outflows between1984 and 1985 by tenure and by job class. 8.3% of blue-collar and 8.8%of white-collar workers had left their 1984 employer by 1985. Neitherrestrictivelabor regulationsnor unionnor insiderpowereliminate the firm’sability to reduce its work force. Leaving aside discharges,the annualoutflow ratesare 4.5% for blue collar and 7.1% for white-collar. Theseattrition ratesaresufficientto adjustto mostmacroeconomic shocks. (Evenin the “unregulated”U.S., aggregateemploymentrarely declinesby morethen 4% per year).
Quite clearly, Belgianfirms cananddo fire workers,at an annualrateof3.8% for blue collar and 1.7% for white-collar, despitemore restrictivelabor law and wider union representation. Much of the turnover ofemployeescan be accountedfor by the turnover of jobs. Our previouswork (LEONARD and VAN AUDENRODE [1993]) demonstrated that about 3%of Belgianmanufacturingjobs weredestroyedannually.A large part of therelatively low rate of Belgian employeeturnovercan be accounted for bythe relatively low rate of Belgian job turnover.
Directly comparable U.S. data on employee turnover at the firm orestablishmentlevel is no longer available. The most recent Federalgovernmentsurvey of turnover indicates a separation rate of 4.1 percentper month11. Multiplying by 12, separations equal to 49% of employmentcould be expected to occur annually. These separation rates are similar tothosereported in another survey published by the U.S. Bureau of LaborStatistics.For 1980, the last full year for which statistics are available, theaverage monthly separation rate was 4.1% per month (U.S. Bureau of LaborStatistics,Employmentand Earning, Revised Establishment Data, August1981, p. 315). The average quit rate was 1.5% per month. Multiplying by12,separationsequalto 49%andquitsequalto 18% of the work force would
10. The Belgian social security system requires workers to be continuously in the labor force toretaintheir socialrights. Therefore, unless a laid-off workers finds a job starting the day afterhis previous contract has been terminated, he has to register as unemployed, even for a fewdays.
64
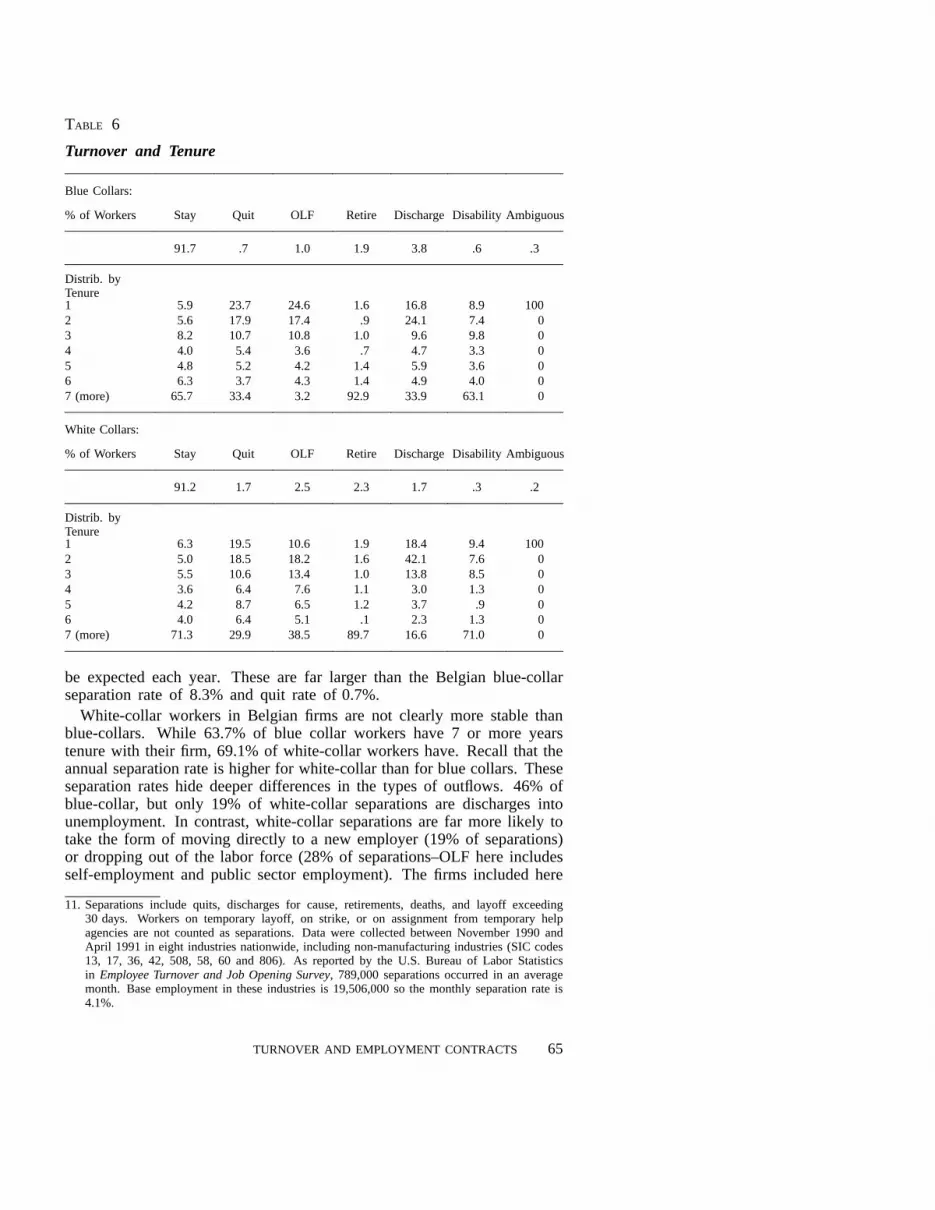
TABLE 6
Turnover and Tenure
Blue Collars:
% of Workers Stay Quit OLF Retire Discharge Disability Ambiguous
91.7 .7 1.0 1.9 3.8 .6 .3
Distrib. byTenure1 5.9 23.7 24.6 1.6 16.8 8.9 1002 5.6 17.9 17.4 .9 24.1 7.4 03 8.2 10.7 10.8 1.0 9.6 9.8 04 4.0 5.4 3.6 .7 4.7 3.3 05 4.8 5.2 4.2 1.4 5.9 3.6 06 6.3 3.7 4.3 1.4 4.9 4.0 07 (more) 65.7 33.4 3.2 92.9 33.9 63.1 0
White Collars:
% of Workers Stay Quit OLF Retire Discharge Disability Ambiguous
91.2 1.7 2.5 2.3 1.7 .3 .2
Distrib. byTenure1 6.3 19.5 10.6 1.9 18.4 9.4 1002 5.0 18.5 18.2 1.6 42.1 7.6 03 5.5 10.6 13.4 1.0 13.8 8.5 04 3.6 6.4 7.6 1.1 3.0 1.3 05 4.2 8.7 6.5 1.2 3.7 .9 06 4.0 6.4 5.1 .1 2.3 1.3 07 (more) 71.3 29.9 38.5 89.7 16.6 71.0 0
be expectedeachyear. Theseare far larger than the Belgian blue-collarseparationrate of 8.3% and quit rate of 0.7%.
White-collar workers in Belgian firms are not clearly more stable thanblue-collars. While 63.7% of blue collar workers have 7 or more yearstenurewith their firm, 69.1% of white-collar workers have. Recall that theannual separation rate is higher for white-collar than for blue collars. Theseseparationrateshide deeper differences in the types of outflows. 46% ofblue-collar, but only 19% of white-collar separations are discharges intounemployment. In contrast, white-collar separations are far more likely totake the form of moving directly to a new employer (19% of separations)or droppingout of the labor force (28% of separations–OLFhereincludesself-employmentand public sector employment). The firms included here
11. Separations include quits, discharges for cause, retirements, deaths, and layoff exceeding30 days. Workers on temporary layoff, on strike, or on assignment from temporary helpagencies are not counted as separations. Data were collected between November 1990 andApril 1991 in eight industries nationwide, including non-manufacturing industries (SIC codes13, 17, 36, 42, 508, 58, 60 and 806). As reported by the U.S. Bureau of Labor Statisticsin EmployeeTurnoverand Job OpeningSurvey, 789,000 separations occurred in an averagemonth. Base employment in these industries is 19,506,000 so the monthly separation rate is4.1%.
TURNOVER AND EMPLOYMENT CONTRACTS 65

offer most of the best and most stable jobs available for blue collar workers.White-collar workers have broader opportunities in the service, finance andthe public sectors.
Newjob matcheshavehigh infantmortality rates.Firms that have recentlyhired the most also layoff the most. The correlation of new hire rates andlayoff ratesacrossfirms is .30 for blue-collars and .32 for white-collars.Firms do sort on-the-job during the first year’s tenure, although as we shallshow in the next section,this doesnot itself accountfor the variation inseniority profiles. It is also worth noting that we see no evidence of thenegativecorrelationbetweenquitsandlayoffs predicted by theories in whichthe two are different names for the same thing, and so perfect substitutes(McLAUGHLIN [1991]).
TABLE 7
Turnover and Age
Blue Collars:
% of Workers Stay Quit OLF Retire Discharge Disability Ambiguous
91.7 .7 1.0 1.9 3.8 .6 .3
Distrib. by Age< 25 14.4 36.5 39.6 0 40.1 6.0 51.825-30 15.4 18.0 15.6 0 15.6 5.2 18.530-40 30.6 21.9 20.6 0 17.4 18.3 18.640-50 24.3 13.7 15.8 0 9.2 25.4 7.750-60 15.0 8.0 8.4 81.2 16.9 39.2 3.2>60 .3 1.8 0 18.8 .7 6.1 .2
White Collars:
% of Workers Stay Quit OLF Retire Discharge Disability Ambiguous
91.2 1.7 2.5 2.3 1.7 .3 .2
Distrib. by Age< 25 6.4 18.8 16.8 0 51.5 4.0 56.325-30 11.4 25.1 21.3 0 19.6 5.8 16.330-40 30.8 32.1 31.1 0 14.5 12.0 19.240-50 28.7 15.1 22.7 0 6.0 12.5 8.250-60 20.7 7.1 8.1 62.7 8.2 43.8 0>60 2.0 1.7 0 37.3 .1 21.9 0
The time pathof separationsalso differs between blue and white-collars.Tables 6 and 7 clearly show that discharges are a disease of the youngand the recently hired, as one would expect from a matching process withimperfect information. 41% of blue collar discharges occur within the firsttwo calendar years of employment (representing 13.3% of employed) and40% occur among those under 25 years of age (representing 15.6% ofemployment). Surprisingly, discharges are even more front-loaded amongwhite-collar workers. 61% of white-collar discharges occur in the first
66
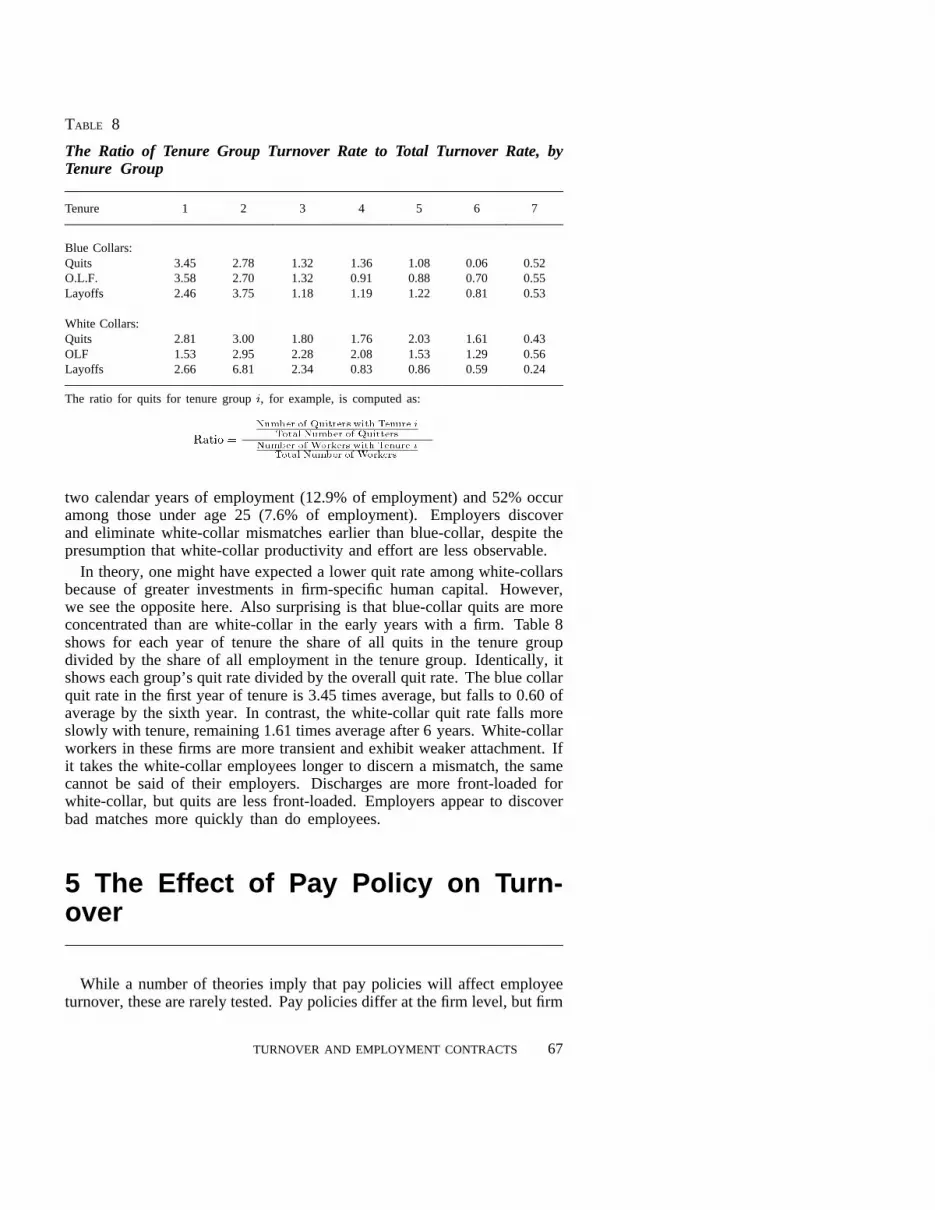
TABLE 8
The Ratio of Tenure Group Turnover Rate to Total Turnover Rate, byTenure Group
Tenure 1 2 3 4 5 6 7
Blue Collars:Quits 3.45 2.78 1.32 1.36 1.08 0.06 0.52O.L.F. 3.58 2.70 1.32 0.91 0.88 0.70 0.55Layoffs 2.46 3.75 1.18 1.19 1.22 0.81 0.53
White Collars:Quits 2.81 3.00 1.80 1.76 2.03 1.61 0.43OLF 1.53 2.95 2.28 2.08 1.53 1.29 0.56Layoffs 2.66 6.81 2.34 0.83 0.86 0.59 0.24
The ratio for quits for tenure group, for example, is computed as:
Number of Quitters with Tenure i
Total Number of Quitters
Number of Workers with Tenure i
Total Number of Workers
two calendar years of employment (12.9% of employment) and 52% occuramong those under age 25 (7.6% of employment). Employers discoverand eliminatewhite-collar mismatchesearlier than blue-collar,despitethepresumptionthat white-collarproductivity andeffort are lessobservable.
In theory, one might have expected a lower quit rate among white-collarsbecause of greater investments in firm-specific human capital. However,we seethe oppositehere. Also surprisingis that blue-collar quits are moreconcentratedthan are white-collar in the early yearswith a firm. Table 8showsfor eachyear of tenure the shareof all quits in the tenure groupdivided by the shareof all employmentin the tenure group. Identically, itshowseachgroup’squit ratedividedby the overall quit rate. The blue collarquit rate in the first year of tenure is 3.45 times average, but falls to 0.60 ofaverage by the sixth year. In contrast, the white-collar quit rate falls moreslowly with tenure,remaining1.61 times average after 6 years. White-collarworkersin these firms are more transient and exhibit weaker attachment. Ifit takes the white-collar employees longer to discern a mismatch, the samecannotbe said of their employers. Discharges are more front-loaded forwhite-collar, but quits are less front-loaded. Employers appear to discoverbad matches more quickly than do employees.
5 The Effect of Pay Policy on Turn-over
While a number of theories imply that pay policies will affect employeeturnover, these are rarely tested. Pay policies differ at the firm level, but firm
TURNOVER AND EMPLOYMENT CONTRACTS 67

level data on human resource practices and outcomes are usually not publiclyavailable. Here we take pay parameters estimated from the relatively richfirm and class specific quadratic wage equations and ask whether theseaffect the firm’s quit and discharge rates as economic theory predicts.
5.1. Competing Predictions
The first theory is that competition among homogeneous firms and workersforces homogeneous pay policies. The differences we observe across firms inpay policy are then statisticalartifactsdue to measurement or specificationerror. This theory carries a strong prediction: differences in estimatedparametersthat do not reflect true differences cannot have real effects. Onlytrue differences in pay policy should covary with human resource outputs.The theory of compensating differentials makes the same unambiguousprediction for quits. Pay differences that are compensating differentialsunambiguouslypredict no correlation with quit rates.
A variant of this statistical theory combines error with differing agedistributionsacrossfirms. Again suppose all firm’ pay follows the samequadraticfunction of age,with error. Firms with younger workers will tendto yield steeperslope estimateseven with the correct specification. Thispredicts that steeperslopeswill be associatedwith younger work forces(which tend to have higher turnover).
If causationis reversed,andfirms adoptsteeper profiles when troubled byhigh turnover,thecorrelationof steepnessandturnoveris again predicted tobe positive. On-the-jobsorting alsopredictsa positive correlationbetweensteepnessand the dischargerate. Firms draw new hires with randomunobservedproductivity. Over time low productivity workers becomeapparentand are fired, and the pay of survivors is increasedto reflectthe expectedproductivity of the truncateddistribution. Higher dischargerates producesteeperwage profiles.
Wage profiles that reflect generalhumancapital predict no differencesin turnover. If human capital is firm specific, slopes may increase eitherbecause worker’s share of investment (and returns) is greater or because thelevel of investmentis greater. The first case reduces quits but may increasedischarges.The second case reduces both quits and discharges.
Compensation policies may also be designed to induce self-selectionamong workers. Suppose that productivity is only slowly revealed over time.Firms with deferred compensation (that in effect require workers to post aperformancebond) will induce low productivity (or poorly matched) workersto self-select out. Steeper profiles are associated with lower turnover.
The efficiency wage model developed here predicts that steeper wageprofiles will be associated with lower rates of both quits and discharges. Aswe described before, we expect firms whose difference in observed wagescan be interpreted as either differences in the efficiency premium they haveto pay or difference in their policy concerning the temporal distributionof the lifetime earnings to face different turnover behavior. From theestimation of the age earning profile in each company, we obtained 239 setsof coefficients for the blue collars and 145 for the white. These coefficients
68

were then used to estimate the effect of the wage policy by the firms ontheir turnover. To do that, we will assume that the workers perceive thecurrent existing age earning profile as being what they can expect as theevolution of their own wage.
The following regression was performed separately on the 239observations for the blue collars and the 145 observations for the white-collars:
(11)
Where , , , and are respectively the intercept, coefficient onage, tenure and sex for the estimated age earning profile for company
estimated in (10), SIZE represents the size of the company measuredby the total employment in the considered group, GROWTH measuresthe employmentgrowth in the companybetween84 and 85, AGE andSEX represent, respectively, the average age and proportion of men in thecompany. Finally,Q is a logit transformation of either the quit rate or thedischargerate 12 in the companybetween1984 and 1985 13.
5.2. The Impact of Pay Policy on Turnover
The relationshipbetweenpay policy andquits and discharges is shown inTable9 for bluecollars,andin Table10 for white-collars. In all cases, higherwagelevels(intercepts)significantlyreducebothquitsand layoffs. The quitresult is unremarkable,that for dischargesis not so readily explained.Theories of pay differences as measurementerror or as compensatingdifferentialscanbothbedismissed.Thesepaydifferentialshaverealeffects,reducingboth quits and discharges.Theseeffectsare both significant andsubstantial.A one standard-deviationincreasein the return to agewill cutthe quit rate in half, and the dischargerate by 39% for blue-collars. Forwhite-collars,quits anddischargeswould be driven to zero. A one standarddeviation increase in the returns for tenure has somewhat similar effects:reducing blue collar quits by 38% and discharges by 32%, and reducingwhite-collar quits by 47% and discharges by 43%. The behavioral effecton quits is stronger among white-collars. That steeper slopes reduce quitsand discharges is consistent with a number of theories, including specifichuman capital, induced prior self-selection, and the efficiency wage modeldevelopedhere.
Theseresultsstandin clear conflict with on-the-jobsorting models. Inthesemodels, firms are uncertain about individual productivities, so paymean expected productivity. As firms uncover low productivity workers,theyfire them,truncatingthebottomtail of the productivity distribution, and
12. As our theory deals essentially with discharges for cause, as opposed to layoffs for economicreasons, we used as an approximation for discharges the variable:j (LAYOFFSj ,LAYOFFSj + GROWTHj). The results are not fundamentally different from the ones obtainedby using the total layoffs as the left hand side variable.
13. To avoid losing observations with zero quits or discharges, we used Haldane’s transformation(Gart & Zweifel [1967]).
TURNOVER AND EMPLOYMENT CONTRACTS 69
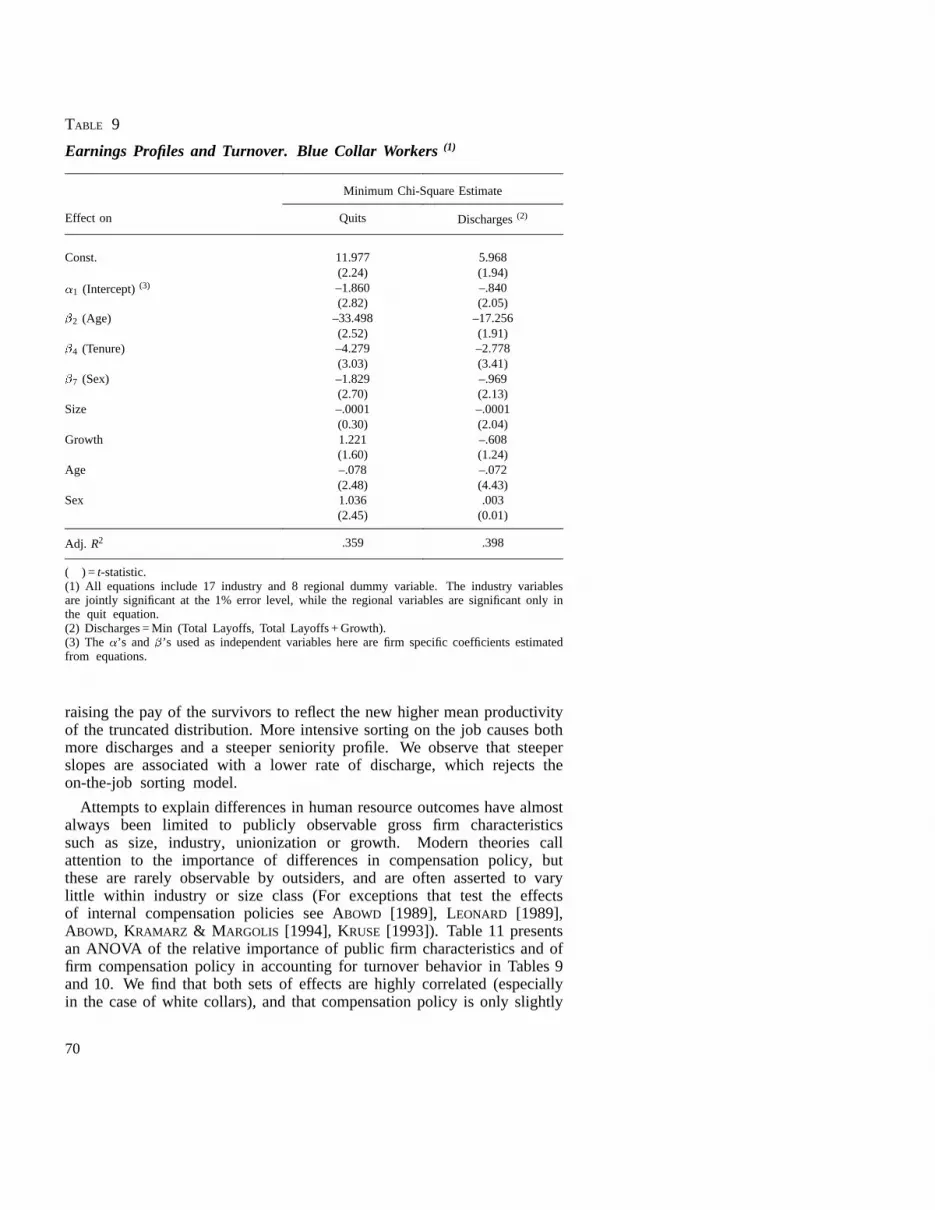
TABLE 9
Earnings Profiles and Turnover. Blue Collar Workers(1)
Minimum Chi-Square Estimate
Effect on Quits Discharges(2)
Const. 11.977 5.968(2.24) (1.94)
1 (Intercept)(3) –1.860 –.840(2.82) (2.05)
2 (Age) –33.498 –17.256(2.52) (1.91)
4 (Tenure) –4.279 –2.778(3.03) (3.41)
7 (Sex) –1.829 –.969(2.70) (2.13)
Size –.0001 –.0001(0.30) (2.04)
Growth 1.221 –.608(1.60) (1.24)
Age –.078 –.072(2.48) (4.43)
Sex 1.036 .003(2.45) (0.01)
Adj. R2 .359 .398
( ) = t-statistic.(1) All equations include 17 industry and 8 regional dummy variable. The industry variablesare jointly significantat the 1% error level, while the regional variables are significant only inthe quit equation.(2) Discharges= Min (Total Layoffs, Total Layoffs+ Growth).(3) The ’s and ’s used as independent variables here are firm specific coefficients estimatedfrom equations.
raising the pay of the survivors to reflect the new higher mean productivityof the truncateddistribution. More intensivesortingon the job causes bothmore dischargesand a steeperseniority profile. We observe that steeperslopes are associated with a lower rate of discharge, which rejects theon-the-job sorting model.
Attemptsto explain differences in human resource outcomes have almostalways been limited to publicly observable gross firm characteristicssuch as size, industry, unionization or growth. Modern theories callattention to the importance of differences in compensation policy, buttheseare rarely observableby outsiders,and are often asserted to varylittle within industry or size class (For exceptions that test the effectsof internal compensation policies see ABOWD [1989], LEONARD [1989],ABOWD, KRAMARZ & M ARGOLIS [1994], KRUSE [1993]). Table 11 presentsan ANOVA of the relative importance of public firm characteristics and offirm compensation policy in accounting for turnover behavior in Tables 9and 10. We find that both sets of effects are highly correlated (especiallyin the case of white collars), and that compensation policy is only slightly
70

TABLE 10
Earnings Profiles and Turnover. White Collar Workers(1)
Minimum Chi-Square Estimate
Effect on Quits Discharges(2)
Const. 20.319 16.915(2.65) (4.85)
(Intercept)(3) –2.712 –2.404(2.60) (5.44)
2 (Age) –42.696 –39.300(2.50) (5.10)
4 (Tenure) –3.676 –2.564(2.78) (4.09)
7 (Sex) –4.109 –1.607(3.13) (2.09)
Size –.0001 –.0001(.66) (0.70)
Growth –1.519 –.694(1.48) (.75)
Age –.061 –.054(1.49) (2.22)
Sex –.624 –1.206(.58) (2.29)
Adj. R2 .427 .530
( ) = t-statistic.(1) All equations include 17 industry and 8 regional dummy variable. The industry variablesare jointly significantat the 1% error level, while the regional variables are significant only inthe quit equation.(2) Discharges= Min (Total Layoffs, Total Layoffs+ Growth).(3) The ’s and ’s used as independent variables here are firm specific coefficients estimatedfrom equations.
less important than commonly measured public characteristics in explainingwhy turnover varies across firms.
The other variablesintroducedhave more surprising effects. The sizeof the company reduces the probability of layoffs for blue collars, but hasno effect on quits. Growth of employment does not significantly affecteither layoff or quits. The most surprising result is that the gender wagedifferential has a strong negative effect on quits. Firms with higher wagegaps between men and women suffer less quits and layoffs. On the otherhand, the sex composition of the work force, which could be expected tobe stronglynegativelycorrelatedwith quits and layoffs is rarely significantand has conflicting predictions.
The major difference between this work, and previous studies of turnoverlies in the fact that not the current wage, but the complete future streamof earningsis taken into account to explain turnover. Such a distinction isof major importance when wages vary over the lifetime. This study differsfrom MINCER and HIGUCHI’s [1988] because we use firm data as opposedto industry data and because we consider not only quits, but discharges andconsider intra-industry movements. This study differs from the handful of
TURNOVER AND EMPLOYMENT CONTRACTS 71
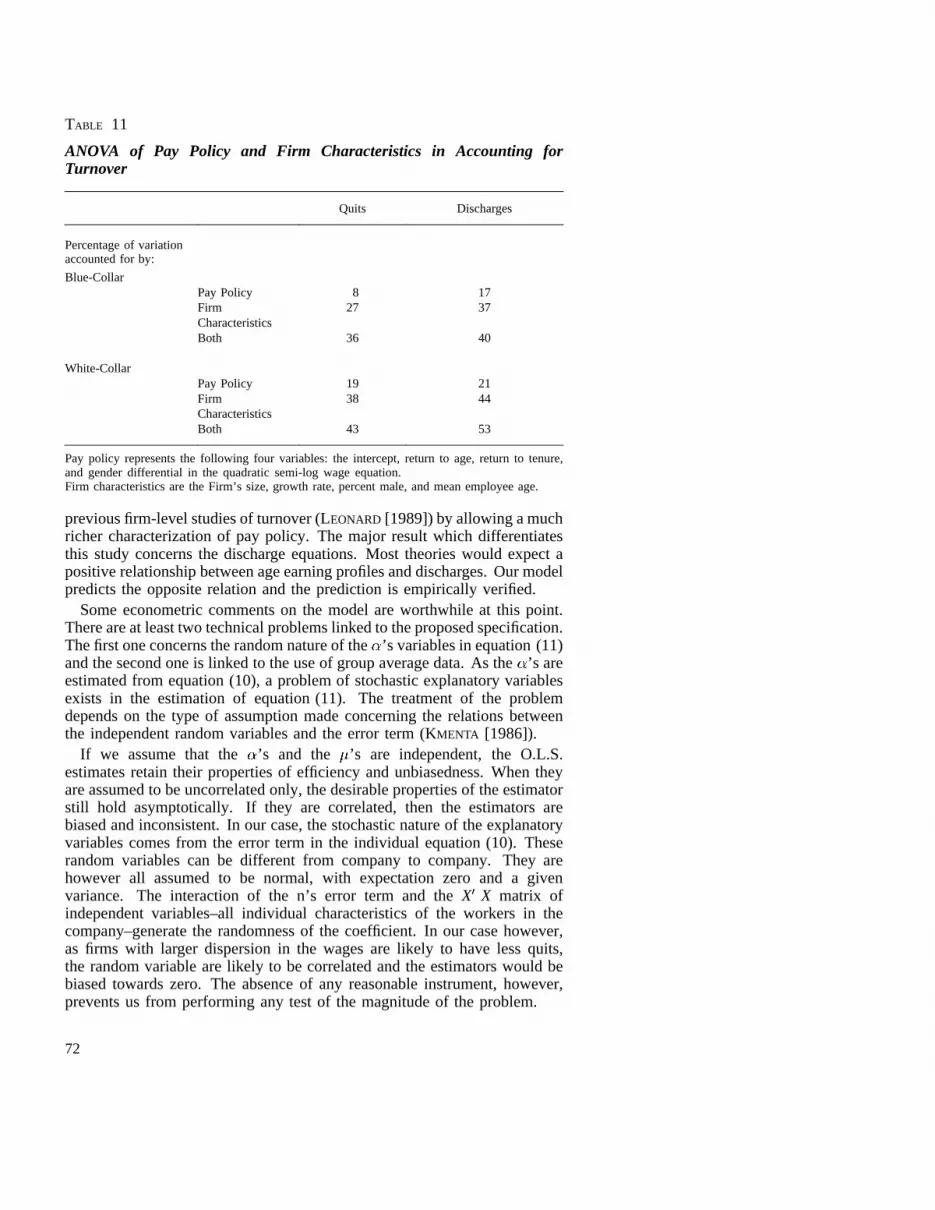
TABLE 11
ANOVA of Pay Policy and Firm Characteristics in Accounting forTurnover
Quits Discharges
Percentageof variationaccounted for by:
Blue-CollarPayPolicy 8 17Firm 27 37CharacteristicsBoth 36 40
White-CollarPay Policy 19 21Firm 38 44CharacteristicsBoth 43 53
Pay policy representsthe following four variables:the intercept,return to age,return to tenure,and genderdifferential in the quadraticsemi-log wage equation.Firm characteristicsare the Firm’s size, growth rate, percent male, and mean employee age.
previousfirm-level studies of turnover (LEONARD [1989])by allowing a muchricher characterizationof pay policy. The major result which differentiatesthis study concernsthe dischargeequations.Most theorieswould expectapositiverelationshipbetweenageearningprofilesanddischarges.Our modelpredictsthe oppositerelation andthe predictionis empirically verified.
Someeconometric comments on the model are worthwhile at this point.Thereareat leasttwo technicalproblemslinkedto the proposed specification.Thefirst oneconcernstherandomnatureof the ’s variables in equation (11)and the second one is linked to the use of group average data. As the’s areestimatedfrom equation(10), a problemof stochastic explanatory variablesexists in the estimation of equation (11). The treatment of the problemdepends on the type of assumption made concerning the relations betweenthe independentrandomvariablesand the error term (KMENTA [1986]).
If we assume that the ’s and the ’s are independent, the O.L.S.estimatesretain their properties of efficiency and unbiasedness. When theyareassumed to be uncorrelated only, the desirable properties of the estimatorstill hold asymptotically. If they are correlated, then the estimators arebiased and inconsistent. In our case, the stochastic nature of the explanatoryvariablescomesfrom the error term in the individual equation(10). Theserandom variables can be different from company to company. They arehowever all assumedto be normal, with expectationzero and a givenvariance. The interaction of the n’s error term and theX X matrix ofindependent variables–all individual characteristics of the workers in thecompany–generate the randomness of the coefficient. In our case however,as firms with larger dispersion in the wages are likely to have less quits,the random variable are likely to be correlated and the estimators would bebiased towards zero. The absence of any reasonable instrument, however,prevents us from performing any test of the magnitude of the problem.
72
Finally, to accommodate the random nature of the’s in the estimationof the standard errors, we use White’s robust estimation technique.
The second econometric problem in performing the estimation of (11) islinked to the use of group-average data. As we know, group average dataneverperforms as well as a direct regression on the individual observations.In our case,however,two difficulties in implementing an estimation on theindividual data made us prefer the simpler technique. The first difficultyis purely computational. Performing logit estimationson more than onehundred and fifty thousand observations is difficult and extremely costly.The seconddifficulty comesfrom the interpretationof the coefficient ofthe age earning profile. We only dispose of as many estimations of theageearning profile as there are firms in the sample–less than 300 for morethan 150,000 observations. Econometric problems arising when mergingaggregate data with micro observations have now been extensively beendocumented (see GREENWALD [1983] or MOULTON [1986], among others).The difficulties and cost of implementing an efficient estimation in thiscontext,and the fact that we had a consistent estimator available, made uschoose to prefer grouped averaged estimation.
6 Conclusions
In this paper, we estimated the impact of the age earning profile on quitsandlayoffs. Thequestionis of major importancebecausein efficiencywagemodels,the paymentsmadeat the end of an employee’s working life canbe unrelatedto spotproductivity, but linked to efficiency considerations.
A theoretical model has been developed showing that firms with steeperage earning profiles–or forced to pay higher efficiency premiums–wouldsuffer lessquits than firms with flatter or spot wagepayments.Our modelalsoyieldslayoffs thatdecreasewith thesteepnessof the age earning profile.This surprising result occurs because, in our framework, a steep age-earningprofile is a sign that the employer cannot easily monitor workers or detectthem shirking. The empirical evidenceclearly sustain these results. Quitsand layoffs are shown to decrease with steepness in both return to ageand return to seniority, even after controlling for other factors such asthe growth of employment, the general level of wages and the structuralcompositionof the work force of the company. The use of a single yearof observationsof quits implicitly controlsfor the generalmacroeconomicconditions prevailing at the time.
The introduction of a heterogeneous labor force in a model of efficiencywages seems to explain relatively well the turnover movements betweencompanies.The power of this model arises because it allows for a job-matching process among a heterogeneous workforce, as well as recognizingthat efficiency wage premiums create incentives for turnover.
TURNOVER AND EMPLOYMENT CONTRACTS 73

APPENDIX A
Steady State in the Two-Period Model
We know that, at any time, the probability of employing a young worker(Y) conditional on the fact that a young worker was employed during thepreviousperiod is , the probability for a young worker
fail during period –1 and be replacedby another young worker duringperiod . The probability for a young workerremain employed and becomean old worker is, of course .
Similarly, when an old worker was employed in , a young worker willbe employedin , no matterwhat. We have , and .
Using the definition of conditionalprobability, we can write:
(A1)
and
(A2)
Rememberingthat, by construction, , and substituting(A2) into (A1), we find:
74

APPENDIX B
Solution of the Long-Term Contract
The first order conditions for an extremum are given by the followingof equations:
(A3)
and
(A4)
Inverting (A3), we get:
Substitutinginto (A4), we obtain the three following roots for :
(A5a)
(A5b)
where (A5a) correspondsto a global minimum.
v References
ABRAHAM, K., FARBER, H. (1987). – “Job Duration, Seniority, and Earnings”,AmericanEconomic Review, 77, pp. 278-297.
ABOWD, J. (1990). – “Does Performance-Based Managerial Compensation AffectCorporate Performance?”,Industrial and Labor Relations Review,43, pp. S52-S53.
ABOWD, J., KRAMARZ, F. (1992). – “A Test of Negotiation and Incentive CompensationModels using Longitudinal French Enterprise Data”,mimeo, National Bureau ofEconomic Research.
ABOWD, J., KRAMARZ, F., MARGOLIS, D. (1994). – “High Wage Workers and High WageFirms: Compensation Policies and Firm Performance in France”,mimeo, NationalBureau of Economic Research.
TURNOVER AND EMPLOYMENT CONTRACTS 75

AKERLOF, G., KATZ, L. (1989). – “Do Deferred Wages Eliminate the Need for InvoluntaryUnemployment as a Worker Discipline Device?”,Quarterly Journal of Economics.
AMERICAN LAW INSTITUTE (1964). – “Restatement of the Law of Torts”, 2nd edition.
ANTEL, J. (1985). – “Costly Employment Contract Renegotiation and the Labor Mobilityof the Young Men”,American Economic Review,75, No. 5, pp. 976-991.
ARNOTT, R., HOSIOS, A., STIGLITZ, J. (1988). – “Implicit Contracts, Labor Mobility andUnemoployment”,American Economic Review, 78, No. 5, pp. 1046-1066.
BLANPAIN, R. (1976). – “InternationalEncyclopediaof IndustrialRelations”,Deventer,The Netherlands; Kluwer.
DAVIS, S. J., HALTIWANGER, J. (1991). – “Wage Dispersion between and Within U.S.Manufacturing Plants, 1963-1986”,Brookings Papers: Microeconomics,pp. 115-200.
DICKENS, W. T. (1986). – “Error Components in Grouped Data: Is it Ever WorthWeighting?”, mimeo,University of California, Berkeley.
GART, J., ZWEIFEL, J. (1967). – “On the Bias of Various Estimator of the Logit and itsVariance with Application to Quantal Bioessay”,Biometrika, 54, No. 1, pp. 181-187.
GREENWALD, B. (1986). – “Adverse Selection in the Labor Market”,Review of EconomicStudies,53, pp. 325-347.
GRILICHES, Z. (1979). – “Sibling Models and Data in Economics:Beginningsof aSurvey”, Journal of Political Economy,87, No. 5, Part 2, pp. S37-S64.
GROSHEN, E. (1991). – “Sources of Intra-Industry Wage Dispersion: How Much DoEmployers Matter?”,Quarterly Journal of Economics,106, Issue 3, pp. 869-884.
HALL , R., LAZEAR, E. (1984). – “The Excess Sensitivity of Layoff and Quits toDemand”,Journal of Labor Economics,2, No. 2, pp. 233-257.
JOVANOVIC, B. (1979). – “Job Matching and the Theory of Turnover”, Journal ofPolitical Economy,87, No. 5, pp. 972-990.
KMENTA, J. (1986). – “Elements of Econometrics”, 2nd Ed., McMillan, New York.
KRUEGER, A. (1991). – “Ownership, Agency, and Wages: An Examination ofFranchising in the Fast Food Industry”,Quarterly Journal of Economics,106,Issue 1, pp. 75-102.
KRUSE, D. (1993). –Profit Sharing: Does It Make a Difference? The Productivityand Stability Effects of Employee Profit Sharing Plans,W. E. Upjohn Institute forEmploymentResearch,Kalamazoo,MI.
LAZEAR, E. P. (1979). – “Why is There Mandatory Retirement?”,Journal of PoliticalEconomy, 87, pp. 1261-1284.
LEONARD, J. (1990). – “Executive Pay and Firm Performance”,Industrial and LaborRelations Review,43, pp. S13-S29.
LEONARD, J. (1989). – “Wage Structure and Dynamics in the Electronics Industry”,Industrial Relations,28, No. 2, pp. 251-275.
LEONARD, J. (1988). – “CareerPathsof Managersand Executives”,mimeo.
LEONARD, J., Van AUDENRODE, M. (1993). – “Corporatism Run Amok: Job Stabilityand Industrial Policy in Belgium and the United States”,Economic Policy, No. 17,pp. 355-389.
LINDBECK, A., SNOWER, D. J. (1988). – “The Insider Outsider Theory of Employmentand Unemployment”,M.I.T. Press, Cambridge.
McLAUGHLIN, K. J. (1991). – “A Theory of Quits and Layoffs with Efficient Turnover”,Journal of Political Economy,99, No. 1, pp. 1-29.
MINCER, J., HIGUCHI, Y. (1988). – “Wage Structures and Labor Turnover in the UnitedStates and Japan”,Journal of the Japanese and International Economy,2, pp. 97-133.
76

MORTENSEN, D. (1978). – “Specific Capital and Labor Turnover”,Bell Journal ofEconomics,9, pp. 572-586.
MOULTON, B. (1988). – “An Illustration of a Pitfall in Estimating the Effects ofAggregate Variables on Micro Units”,mimeo, working paper of the Bureau of LaborStatistics, No 181.
PROSSER, W., WADE, J. W., SHWARTZ, V. E. (1988). – “Torts: Cases and Material”,Wilsbury, New York: Foundation Press.
WALDMAN , M. (1984). – “Jobs Assignments,Signaling and Efficiency”,Rand Journalof Economics,15, No. 2, pp. 255-267.
WEISS, A. (1980). – “Job Queuesand Layoffs in Labor Markets with Flexible Wages”,Journal of Political Economy,88, No. 3, pp. 526-438.
TURNOVER AND EMPLOYMENT CONTRACTS 77
Related Documents