Workers Compensation Insurance: The Role of State Funds, Market Trends and Economic Influences October 12, 2010 Robert P. Hartwig, Ph.D., CPCU, President & Economist Insurance Information Institute 110 William Street New York, NY 10038 Tel: 212.346.5520 Cell: 917.453.1885 [email protected]

Workers Compensation Insurance: The Role of State Funds, Market Trends and Economic Influences October 12, 2010 Robert P. Hartwig, Ph.D., CPCU, President.
Jan 02, 2016
Welcome message from author
This document is posted to help you gain knowledge. Please leave a comment to let me know what you think about it! Share it to your friends and learn new things together.
Transcript

Workers Compensation Insurance: The Role of State Funds, Market
Trends and Economic Influences
October 12, 2010
Robert P. Hartwig, Ph.D., CPCU, President & EconomistInsurance Information Institute 110 William Street New York, NY 10038
Tel: 212.346.5520 Cell: 917.453.1885 [email protected] www.iii.org

2
Presentation Outline
The Role of Workers Compensation State Funds History Organizational Structure and Evolution Market Share Analysis Performance
Property Casualty Insurance and Workers Compensation Market Overview &Outlook Financial Overview Underwriting Trends
State of the Economy and Impacts on Employers and Workers Compensation Insurance Impacts of the “Great Recession” on Exposure & Growth
A Brief History: The Role of Workers
Compensation State Funds
3
Social Policy, History, Economics, Insurance Market Forces and Politics
All Played Important Roles in the Development of Modern WC Systems,
State Funds and Their Structure

4
Workers Compensation Timeline
Industrialization of US in the Late 19th/Early 20th Century Led to Increasing & Unacceptably High Number of Deaths and Injuries Among Workers
In 1912, an estimated 18,000 to 23,000 workers were killed on the job (compared to 5,071 in 2008) and approximately 4.7 million (12% or workforce) suffered a nonfatal illness or injury (compared to 3.7 million 2008)
The 1912 death/injury rates would imply 75,600 deaths and 17 million injuries today
More awareness of broader impacts on families of injured/killed workers
Workers Could Seek Redress Under Tort Law, But Seldom Prevailed
Employers usually won suits filed by injured workers by arguing:– Contributory Negligence: Employee was at least partially to blame for the accident– Assumed Risk: By taking the job, the employee understood the hazards involved– Fellow Servant Rule: A fellow worker caused the accident, so the employer was not at fault
European Countries Began to Implement Workers Compensation Programs
Germany (1884); England (1897)
Insurers Began to Sell Commercial Liability Coverage in the Late 1800s
Coverage for inadvertent errors became more commonplace
In the workforce, such policies became the first employer liability policies
Source: Insurance Information Institute.
5
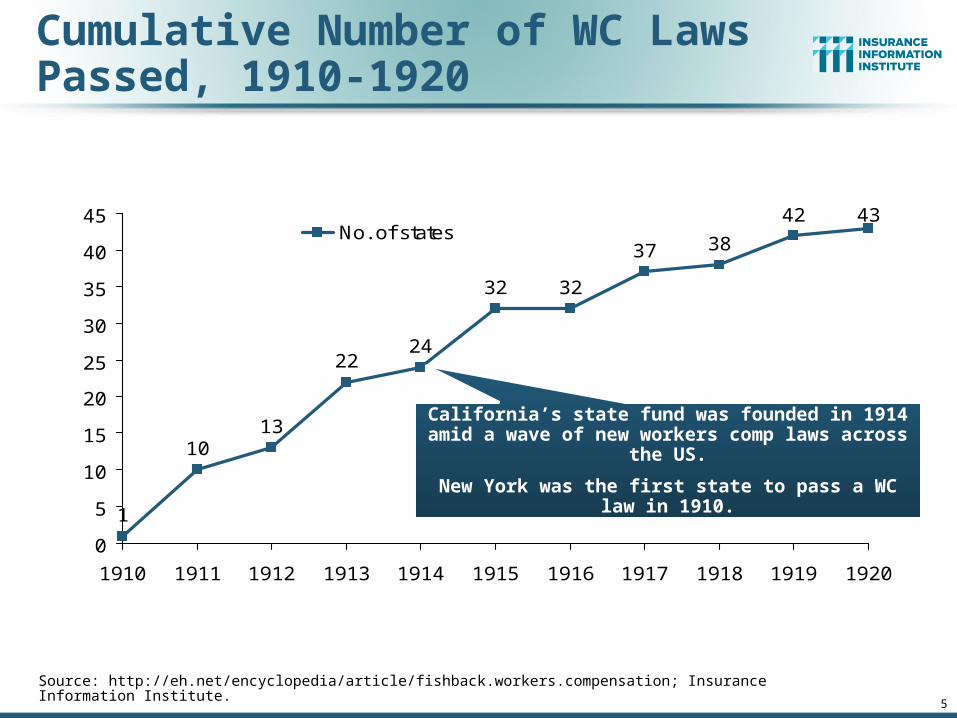
Cumulative Number of WC Laws Passed, 1910-1920
1
1013
2224
32 32
37 38
42 43
0
5
10
15
20
25
30
35
40
45
1910 1911 1912 1913 1914 1915 1916 1917 1918 1919 1920
No. of states
Source: http://eh.net/encyclopedia/article/fishback.workers.compensation; Insurance Information Institute.
California’s state fund was founded in 1914 amid a wave of new workers comp laws across the US.
New York was the first state to pass a WC law in 1910.

6
The Role of Workers Compensation State Funds: Public Policy & Economic Missions
The Core Public Policy Mission of WC State Funds is to Assure the Availability of Affordable Workers Compensation Coverage to Employers The original catalyst for WC was the recognition that the rapidly increasing number of occupational
injuries and deaths were exacting a high and unfair physical and financial toll on injured workers and their families
Prior to 1920, there was some question whether the private insurance sector could meet the demand and affordably supply this new type of coverage on its own. State funds were a tool for meeting this new public policy objective.
States adopted differing strategies for assuring this obligation was met: competitive and monopolistic state funds whereas others allowed the private sector to satisfy demand (subject to state oversight and regulation)
For the state funds formed in the late 1980s and 1990s, states sought to bring stability to a market where costs were rising rapidly and residual market shares exploding
Secondary Core Public Policy Mission: Reduce Workplace Injuries/Deaths Provision of loss control services and loss sensitive pricing help achieve this goal
Core Economic Mission: Support of the State Economy The availability of affordable WC coverage is a key consideration in many business location and
expansion decisions
This issue is likely increase in importance in the job-starved 2010s
To Operate Self-Sufficiently (i.e., Minimal Public Financial Support)
Source: Insurance Information Institute; Conning.

7
Number of Workers Comp State Funds Formed by Decade, 1910–2010
01
9
01
001
0
13
0
2
4
6
8
10
12
14
1910s 1920s 1930s 1940s 1950s 1960s 1970s 1980s 1990s 2000s**
* Nevada’s monopolistic state fund, founded in 1913, was privatized in 1999. There is currently no state fund in the state.**West Virginia’s original (monopolistic) state fund was formed in 1915. Its successor, BrickStreet Mutual, became a competitive state fund in 2006. Oregon’s original (monopolistic) fund, formed in 1914, adopted a competitive structure in 1980.Sources: Insurance Information Institute research.
Number of State Funds Formed
All But Three of the 26 State Funds Ever Formed Were Founded in the 1910s (the Decade in which Workers Comp Laws Were Put on
the Books in Most States) and the 1990s (During a Period of Massive Reform of WC Systems Countrywide)
California’s state fund was founded in 1914 amid a wave of new workers comp laws across the US. At that time, state’s were experimenting with different
systems: private, monopolistic state funds and competitive state funds
CACOID
MDNV*NYNDOH
OR**PAUTWA
WV**WY OK AZ MN
HIKYLAMEMOMTNMRITX

8
Monopolistic State Funds: Where Are they Today?
State Date started StatusOhio 1911 Still monopolistic
Washington 1911 Monopolistic; referendum sought in 2010
Nevada 1913 State fund privatized in 1999
Oregon 1913 Allowed competition in 1980
West Virginia 1913 Allowed competition in 2008
Wyoming 1915 Still monopolistic
North Dakota 1919 Still monopolistic
Source: Economic History Association, http://eh.net/encyclopedia/article/fishback.workers.compensation, Insurance Information Institute research.
9
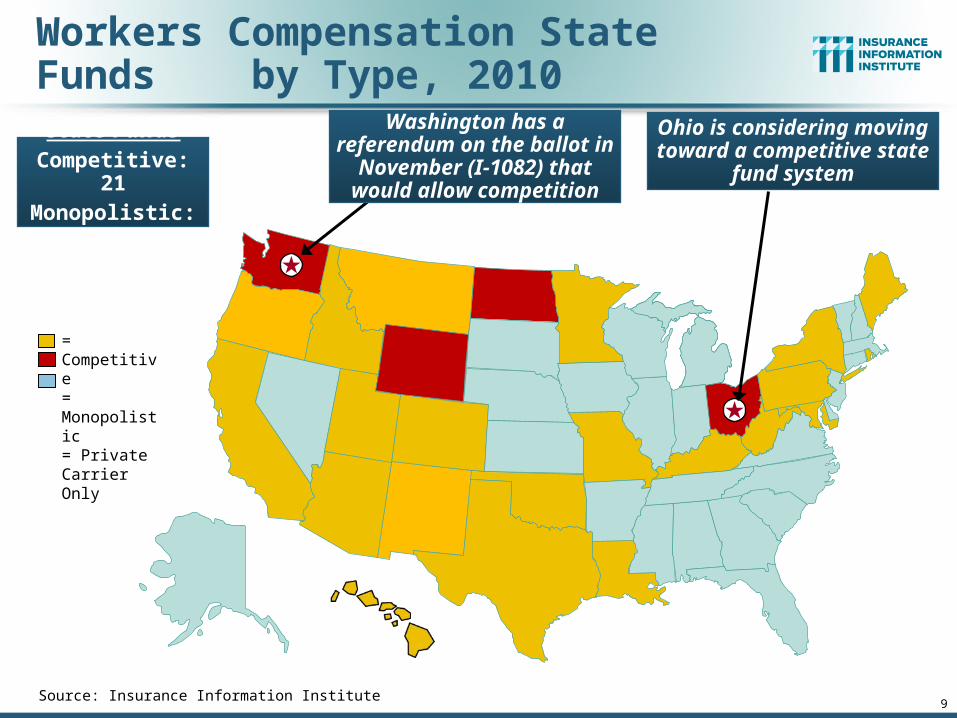
Workers Compensation State Funds by Type, 2010
Source: Insurance Information Institute
Ohio is considering moving toward a competitive state
fund systemState Funds
Competitive: 21Monopolistic: 4
= Competitive= Monopolistic= Private Carrier Only
Washington has a referendum on the ballot in
November (I-1082) that would allow competition

10
Identity Crisis: The Role of State Funds in 2010 and Beyond
The Role and Need for State Funds Is Being Questioned from Within and from Without
Two monopolistic state funds have disappeared in recent years (NV and WV); OH and WA are being challenged.
AZ will convert to a mutual structure by 2013
A number of state funds can write WC risk for companies domiciled in their home state
Several state funds now own subsidiaries that allow them to write risks with no ties to their home state (breach of core mission?)
Factors that Can Lead to Questioning of the Role of WC State Funds
Shrinking Residual Markets
Intense Private Insurer Competition
Prolonged Soft Market
Increasing Options (e.g., Captives, Large Deductible Programs)
Passage of Time Since Last WC Crisis (early 1990s)
State Budget Woes
Source: Insurance Information Institute.

11
The Curious Case of Arizona: Conversion of State Fund to a Mutual Insurer
Arizona Seems to Have Decided it Doesn’t Need a State Fund (As Did NV)
Excerpts from Arizona Senate Bill 1045 (2010 Second Regular Session)
On or before January 1, 2013, the state compensation fund board of directors, which terminates on July 1, 2012 pursuant to section 41-3012.19, Arizona Revised Statutes, shall perform all acts necessary to establish a successor mutual insurer corporation. The successor mutual insurer corporation shall operate to the same extent as any mutual casualty insurer that is licensed and authorized to write insurance in this state, subject to the authority and regulation by the department of insurance pursuant to title 28 20, chapter 4, article 1, Arizona Revised Statutes, and with all the powers and subject to all the laws, rules and requirements of a mutual insurer corporation that is organized under the laws of this state.
The successor mutual insurer corporation is not an agency of this state or a public entity of this state. The successor mutual insurer corporation shall not use the term "state compensation fund" or "SCF" in its new name or logo from and after June 30, 2014.
Source: State of Arizona; Insurance Information Institute.

Workers Compensation Premium Continues Its Sharp DeclineNet Written Premium
$ Billions
Calendar Yearp Preliminary
Source: 1990–2008 Private Carriers, Best's Aggregates & Averages; 2009p, NCCI1996–2009p State Funds: AZ, CA, CO, HI, ID, KY, LA, MD, MO, MT, NM, OK, OR, RI, TX, UT Annual Statements
State Funds available for 1996 and subsequent

13
WC Competitive State Fund Market Share,1996 – 2009p
22.4%
26.4% 25.4%
21.0%
16.9%15.2%
14.1%12.7%
18.7%
12.9%10.8%10.2%10.0%10.6%
0%
5%
10%
15%
20%
25%
30%
1996 1997 1998 1999 2000 2001 2002 2003 2004 2005 2006 2007 2008 2009
Market Share (%) Private insurance markets are highly competitive. State
fund market shares have been falling steadily since 2003.
Competition, favorable underwriting trends, coverage options, private insurer innovations in risk management have all helped to make the private
sector WC insurance the most attractive option in most cases
Source: 1990–2008 Private Carriers, Best's Aggregates & Averages; 2009p, NCCI, Insurance Information Institute Market Share calculations1996–2009p State Funds: AZ, CA, CO, HI, ID, KY, LA, MD, MO, MT, NM, OK, OR, RI, TX, UT Annual Statements
State Funds available for 1996 and subsequent; p: Preliminary

14
Workers Compensation State Fund Market Shares, 2008
100.
0
100.
0
100.
0
100.
0
87.4
67.2
65.4
61.3
60.8
58.3
56.4
52.2
47.4
38.7
35.1
31.5
29.2
26.5
24.9
24.3
22.6
22.3
14.4
11.0
10.9
0
20
40
60
80
100
ND OH WA WY WV MT CO ME RI ID OR UT AZ NY OK NM TX LA MD KY CA HI MO MN PA
Sta
te F
und
Mar
ket S
hare
(%)
Source: Conning; Insurance Information Institute.
State funds market shares among the 21 competitive state funds vary widely, from nearly 90% in WV (in transition from a monopolistic to a competitive
fund market) to barely 10% in PA

15
Workers Compensation State Fund Incurred Loss Ratio, 2008
120.
6%
111.
9% 120.
6%
61.6
%
81.2
%
111.
9%
46.2
%
63.2
%
96.0
%
81.8
%
61.6
%
92.2
%
83.2
%
87.0
%
91.9
% 103.
8%
117.
1%
72.4
%
64.8
% 72.1
%
46.2
%
77.1
%
20%
40%
60%
80%
100%
120%
140%
AZ CA CO HI ID KY LA ME MD MN MO MT NM NY OK OR PA RI TX UT WV US*
Incu
rred
Los
s R
atio
(%)
Yellow bars = states where the state fund is also the market of last resort
Source: Conning; A.M. Best; Insurance Information Institute.
The average competitive workers comp state fund ran a
loss ratio of 84.2% in 2008 compared to 77.1% for the US
WC market overall
13 of the 21 competitive state funds also serve as the market of last resort

16
Comparison of State WC rates
Source: Oregon Workers’ Compensation Premium Rate Ranking 2008. Rates weighted by Oregon’s distribution of exposures by classification
WC rates, on average, do not appear to be significantly higher or lower in states with workers comp state funds
California’s WC rates are about average

P-C Insurance and Workers Compensation Overview &
Outlook
17
A Slow Motion Cyclical Turn is Underway

18
Profitability
Historically Volatile

P/C Net Income After Taxes1991–2010:H1 ($ Millions)
$1
4,1
78
$5
,84
0
$1
9,3
16
$1
0,8
70
$2
0,5
98
$2
4,4
04 $3
6,8
19
$3
0,7
73
$2
1,8
65
$3
,04
6
$3
0,0
29
$6
2,4
96
$3
,04
3
$1
6,5
31$2
8,3
11
-$6,970
$6
5,7
77
$4
4,1
55
$2
0,5
59
$3
8,5
01
-$10,000
$0
$10,000
$20,000
$30,000
$40,000
$50,000
$60,000
$70,000
$80,000
91 92 93 94 95 96 97 98 99 00 01 02 03 04 05 06 07 08 09 10:H1
2005 ROE*= 9.6% 2006 ROE = 12.7% 2007 ROE = 10.9% 2008 ROE = 0.3% 2009 ROAS1 = 5.8% 2010:H1 ROAS = 6.3%
* ROE figures are GAAP; 1Return on avg. surplus. Excluding Mortgage & Financial Guaranty insurers yields a 7.5% ROAS for 2010:H1 and 4.6% for 2009. 2009:H1 net income was $19.2 billion and $10.2 billion in 2008:H1 excluding M&FG.Sources: A.M. Best, ISO, Insurance Information Institute
P-C Industry 2010:H1 profits rose $10.6B from $6.0B in 2009:H1, due mainly to $2.2B in realized
capital gains vs. -$11.1B in previous realized capital losses

20
ROE: P/C vs. All Industries1987–2009*
* Excludes Mortgage & Financial Guarantee in 2008 and 2009.Sources: ISO, Fortune; Insurance Information Institute.
-5%
0%
5%
10%
15%
20%
87 88 89 90 91 92 93 94 95 96 97 98 99 00 01 02 03 04 05 06 07 08 09
US P/C Insurers All US Industries
P/C Profitability IsCyclical and Volatile
Hugo
Andrew
Northridge
Lowest CAT Losses in 15 Years
Sept. 11
Katrina, Rita, Wilma
4 Hurricanes
Financial Crisis*
(Percent)

A 100 Combined Ratio Isn’t What ItOnce Was: 90-95 Is Where It’s At Now
Combined Ratio / ROE
* 2009 and 2010:Q1 figures are return on average statutory surplus. 2008, 2009 and 2010:H1figures exclude mortgage and financial guaranty insurersSource: Insurance Information Institute from A.M. Best and ISO data.
97.5
100.6 100.1 100.7
92.6
99.5 100.1101.0
7.5%7.3%
9.6%
15.9%
14.3%
12.7%
4.4%
8.9%
80
85
90
95
100
105
110
1978 1979 2003 2005 2006 2008* 2009* 2010:H1*0%
3%
6%
9%
12%
15%
18%
Combined Ratio ROE*
Combined Ratios Must Be Lower in Today’s DepressedInvestment Environment to Generate Risk Appropriate ROEs
A combined ratio of about 100 generated a 7% ROE in 2009,10% in 2005 and 16% in 1979

P/C Insurer Impairments, 1969–20098
15
12
71
19
34
91
31
21
99
16
14
13
36
49
31 3
45
04
85
56
05
84
12
91
61
23
11
8 19
49 50
47
35
18
14 15
7 65
0
10
20
30
40
50
60
70
69
70
71
72
73
74
75
76
77
78
79
80
81
82
83
84
85
86
87
88
89
90
91
92
93
94
95
96
97
98
99
00
01
02
03
04
05
06
07
08
09
Source: A.M. Best; Insurance Information Institute.
The Number of Impairments Varies Significantly Over the P/C Insurance Cycle, With Peaks Occurring Well into Hard Markets
5 of the 11 are Florida companies (1 of these
5 is a title insurer)

24
Reasons for US P/C Insurer Impairments, 1969–2008
38.1%
14.3%8.1%
7.6%
7.9%
7.0%
9.1%
4.2%
3.7%
Source: A.M. Best: 1969-2008 Impairment Review, Special Report, Apr. 6, 2009
Deficient Loss Reserves and Inadequate Pricing Are the Leading Cause of Insurer Impairments, Underscoring the Importance of Discipline.
Investment Catastrophe Losses Play a Much Smaller Role
Deficient Loss Reserves/In-adequate Pricing
Reinsurance Failure
Rapid GrowthAlleged Fraud
Catastrophe Losses
Affiliate Impairment
Investment Problems
Misc.
Sig. Change in Business

P/C Premium Growth Primarily Driven by the
Industry’s Underwriting Cycle, Not the Economy
25

26
-5%
0%
5%
10%
15%
20%
25%
71 72 73 74 75 76 77 78 79 80 81 82 83 84 85 86 87 88 89 90 91 92 93 94 95 96 97 98 99 00 01 02 03 04 05 06 07 08 09
10F
Soft Market Appears to Persist in 2010 but May Be Easing: Relief in 2011?
(Percent)1975-78 1984-87 2000-03
Shaded areas denote “hard market” periodsSources: A.M. Best (historical and forecast), ISO, Insurance Information Institute.
Net Written Premiums Fell 0.7% in 2007 (First Decline Since 1943) by 2.0% in 2008, and 4.2% in 2009, the First 3-Year Decline Since 1930-33.
NWP was flat with 0.0% growth in 10:H1 vs. -4.4% in 09:H1
27
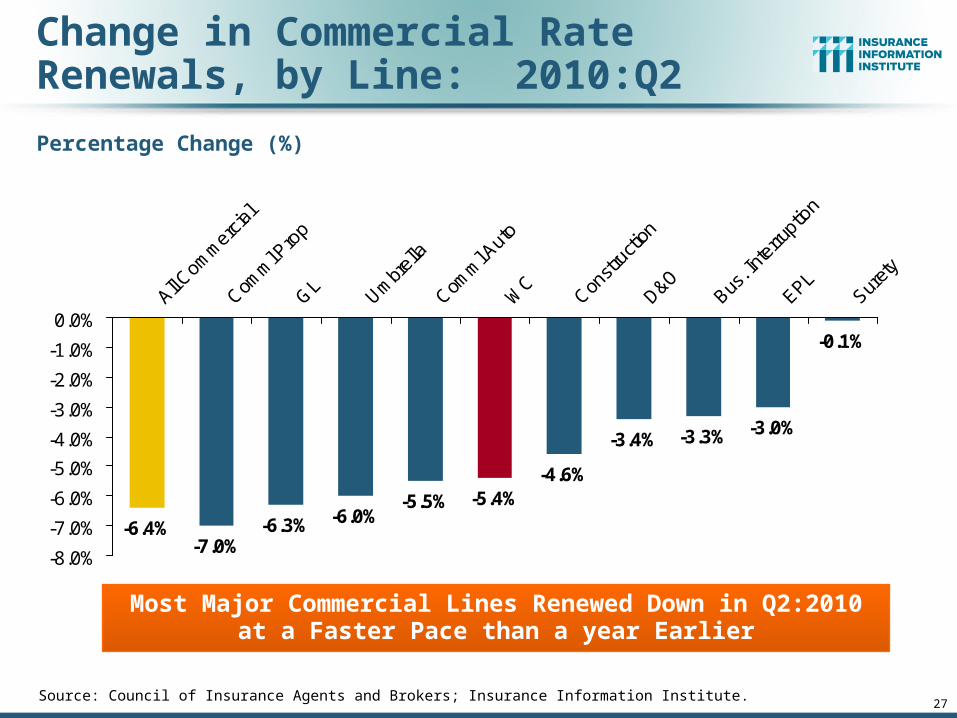
Change in Commercial Rate Renewals, by Line: 2010:Q2
Source: Council of Insurance Agents and Brokers; Insurance Information Institute.
Most Major Commercial Lines Renewed Down in Q2:2010 at a Faster Pace than a year Earlier
Percentage Change (%)
-4.6%
-3.4% -3.3% -3.0%
-0.1%
-6.4%-7.0%
-6.3% -6.0%-5.5% -5.4%
-8.0%
-7.0%
-6.0%
-5.0%
-4.0%
-3.0%
-2.0%
-1.0%
0.0%All C
omm
ercia
l
Comm
l Pro
p
GL
Umbr
ella
Comm
l Aut
o
WC
Const
ructi
on
D&OBus
. Int
erru
ptio
n
EPLSur
ety
28
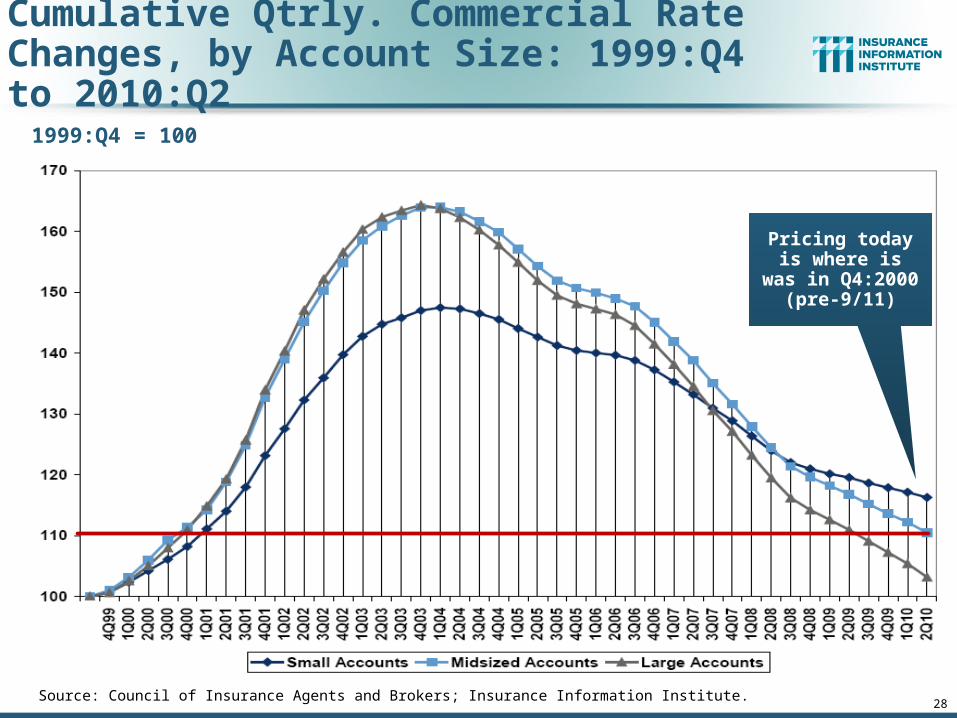
Cumulative Qtrly. Commercial Rate Changes, by Account Size: 1999:Q4 to 2010:Q2
Source: Council of Insurance Agents and Brokers; Insurance Information Institute.
1999:Q4 = 100
Pricing today is where is was in
Q4:2000 (pre-9/11)

Net Written Premium Growth Forcasts by Line: 2010 - 2012
Source: Conning, Second Quarter 2010 forecast.
Line 2010F 2011F 2012FAll Lines 1.8% 5.0% 5.4%
Personal Auto 3.1 5.2 5.0
Homeowners 4.7 5.2 5.0
Workers Comp -4.0 5.5 10.0
Commercial Auto 1.5 8.1 6.9
Commercial Multiperil 1.5 6.3 7.3
General Liability 1.3 5.8 5.8
Inland Marine 2.0 4.5 5.0

Capital/PolicyholderSurplus (US)
30
Shrinkage, but Not Enoughto Trigger Hard Market

31
Policyholder Surplus, 2006:Q4–2010:Q2
Sources: ISO, A.M .Best.
($ Billions)
$487.1$496.6
$512.8$521.8
$478.5
$455.6
$437.1
$463.0
$490.8
$511.5
$540.7$530.5
$505.0$515.6$517.9
$420
$440
$460
$480
$500
$520
$540
$560
06:Q4 07:Q1 07:Q2 07:Q3 07:Q4 08:Q1 08:Q2 08:Q3 08:Q4 09:Q1 09:Q2 09:Q3 09:Q4 10:Q1 10:Q2
2007:Q3Previous Surplus Peak
Quarterly Surplus Changes Since 2009:Q1 Trough
09:Q1: -$84.7B (-16.2%) 09:Q2: -$58.8B (-11.2%)09:Q3: -$31.8B (-5.9%)09:Q4: -$10.3B (-2.0%)
10:Q1: +$18.9B (+3.6%)10:Q2: -$10.2B (-1.9%)
Surplus set a new record in 2010:Q1*
*Includes $22.5B of paid-in capital from a holding company parent for one insurer’s investment in a non-insurance business

Investment Performance
32
Investments Are a PrincipleSource of Declining Profitability

Property/Casualty Insurance Industry Investment Gain: 1994–2010:H11
$35.4
$42.8$47.2
$52.3
$44.4
$36.0
$45.3$48.9
$59.4$55.7
$64.0
$31.7
$39.0
$25.8
$58.0
$51.9$56.9
$0
$10
$20
$30
$40
$50
$60
$70
94 95 96 97 98 99 00 01 02 03 04 05* 06 07 08 09 10:H1In 2008, Investment Gains Fell by 50% Due to Lower Yields and
Nearly $20B of Realized Capital Losses 2009 Saw Smaller Realized Capital Losses But Declining Investment Income
Investment Gains Are Recovering So Far in 20101 Investment gains consist primarily of interest, stock dividends and realized capital gains and losses.* 2005 figure includes special one-time dividend of $3.2B.Sources: ISO; Insurance Information Institute.
($ Billions) 2009:H1 gain was $12.5B
Investment gains in 2010 are on track to be their best since 2007

34
-1.8
%
-1.8
%
-2.0
%
-3.6
%
-3.3
%
-3.3
%
-3.7
%
-4.3
%
-5.2
%
-5.7
%
-7.3%
-1.9
%
-2.1
%
-3.1
%
-8%-7%-6%-5%-4%-3%-2%-1%0%
Perso
nal L
ines
Pvt Pass
Aut
o
Pers P
rop
Comm
ercia
l
Comm
l Auto
Credit
Comm
Pro
p
Comm
Cas
Fidelity
/Sure
ty
War
rant
y
Surplu
s Line
s
Med
Mal
WC
Reinsu
ranc
e**
Lower Investment Earnings Place a Greater Burden on Underwriting and Pricing Discipline
*Based on 2008 Invested Assets and Earned Premiums**US domestic reinsurance onlySource: A.M. Best; Insurance Information Institute.
Reduction in Combined Ratio Necessary to Offset 1% Decline in Investment Yield to Maintain Constant ROE, by Line*

35
Underwriting Trends – Financial Crisis Does Not
Directly Impact Underwriting Performance: Cycle, Catastrophes
Were 2008’s Drivers

36
P/C Insurance Industry Combined Ratio, 2001–2010:H1*
* Excludes Mortgage & Financial Guaranty insurers in 2008, 2009 and 2010. Including M&FG, 2008=105.1, 2009=100.7, 2010:H1=101.7 Sources: A.M. Best, ISO.
95.7
99.3 100.1101.0
92.6
100.898.4
100.1
107.5
115.8
90
100
110
120
2001 2002 2003 2004 2005 2006 2007 2008 2009* 2010:H1
Best Combined
Ratio Since 1949 (87.6)
As Recently as 2001, Insurers Paid Out
Nearly $1.16 for Every $1 in Earned
Premiums
Relatively Low CAT Losses, Reserve Releases
Cyclical Deterioration
Heavy Use of Reinsurance Lowered Net
Losses
Relatively Low CAT Losses, Reserve Releases
Lower CAT
Losses, More
Reserve Releases

37
2.3
-2.1
-8.3
-2.6-6.6
-9.9 -9.8
-4.1
1
11.7
23.2
13.79.9
7.3
-6.7-9.5
-14.6-16 -15
-5
-$20
-$15
-$10
-$5
$0
$5
$10
$15
$20
$25
$309
2
93
94
95
96
97
98
99
00
01
02
03
04
05
06
07
08
09
10
E
11
E
Pri
or
Yr.
Re
se
rve
Re
lea
se
($
B)
-6
-4
-2
0
2
4
6
8 Imp
ac
t on
Co
mb
ine
d R
atio
(Po
ints
)
Prior Yr. ReserveDevelopment ($B)
Impact onCombined Ratio(Points)
P/C Reserve Development, 1992–2011E
Reserve Releases Are Continuing Strong in 2010 But Should Begin to Taper Off in 2011
Note: 2005 reserve development excludes a $6 billion loss portfolio transfer between American Re and Munich Re. Including this transaction, total prior year adverse development in 2005 was $7 billion. The data from 2000 and subsequent years excludes development from financial guaranty and mortgage insurance. Sources: Barclay’s Capital; A.M. Best.
Prior year reserve releases totaled $8.8 billion in the
first half of 2010, up from $7.1 billion in
the first half of 2009

Workers Compensation Operating Environment
38
The Weak Economy and Soft Market Have Made the Workers Comp Operating
Increasingly Challenging

Workers Compensation Combined Ratio: 1973–2012P
96
.8 99
.91
01
.1 10
4.2
10
3.6
99
.49
6.4
10
1.4
10
2.8
10
3.9
11
2.5
12
1.9
11
8.8
12
1.1
11
7.6
11
8.4
11
8.2
11
7.4 12
2.6
12
1.5
10
9.1
10
2.0
97
.0 10
0.0
10
1.0
10
7.0
11
5.3 11
8.2
12
1.7
11
0.9
11
0.0
10
7.0
10
2.7
98
.41
03
.51
04
.31
09
.81
16
.01
17
.01
17
.0
80
85
90
95
100
105
110
115
120
125
73 75 77 79 81 83 85 87 89 91 93 95 97 99 01 03 05 07 09 11P
Workers Comp Underwriting Results Are Deteriorating Markedly
Sources: A.M. Best; Insurance Information Institute.

$ Billions
Calendar Year
2
5
10
15
1820
21
18
15
12
6
99
42
0
5
10
15
20
25
30
1995 1996 1997 1998 1999 2000 2001 2002 2003 2004 2005 2006 2007 2008 2009
2009 Tabular Discount Is $5.3 Billion
Considers all reserve discounts as deficienciesLoss and LAE figures are based on NAIC Annual Statement data for each valuation date and NCCI latest selectionsSource: NCCI analysis
WC Loss and LAE Reserve Deficiency: Private Carriers
Calendar Year Reserve Deficiency Increased in 2009

Workers Compensation Medical & Indemnity Claim Cost Trends
41
Rising Medical Costs Exert Pressure While Indemnity Costs Rise Well Ahead of
Wage Inflation

$8.5 $8.6 $8.4$9.2 $9.6$10.3
$11.4$12.3
$13.6$14.6
$16.6$18.0
$19.2$20.3
$21.9$23.0
$24.3$25.9
$27.2
$5
$10
$15
$20
$25
$30
91 92 93 94 95 96 97 98 99 00 01 02 03 04 05 06 07 08 09p
Annual Change 1991–1993: +1.9%Annual Change 1994–2001: +8.9%Annual Change 2002-2009: +6.6%
Accident Year
MedicalClaim Cost ($000s)
2009p: Preliminary based on data valued as of 12/31/20091991-2008: Based on data through 12/31/2008, developed to ultimateBased on the states where NCCI provides ratemaking services; Excludes the effects of deductible policies
Cumulative Change = 224%(1993-2009p)
Workers Comp Medical Claim Costs Continue to Rise

4.5%
3.5%2.8%
3.2% 3.5%4.1%
4.6% 4.7%4.0%
4.4% 4.2% 4.0%4.4%
3.7% 3.4%
5.1%
7.4%
10.1%
8.3%
10.6%
7.3%
13.5%
8.8%
7.3%
5.6%
7.4%
5.4% 5.4%
6.7%
5.0%
0%
2%
4%
6%
8%
10%
12%
14%
16%
1995 1996 1997 1998 1999 2000 2001 2002 2003 2004 2005 2006 2007 2008 2009
Change in Medical CPI
Change Med Cost per Lost Time Claim
WC Medical Severity Risingat Twice the Medical CPI Rate
Sources: Med CPI from US Bureau of Labor Statistics, WC med severity from NCCI based on NCCI states.
Average annual increase in WC medical severity form 1995 through 2009 was nearly twice the medical CPI (7.6% vs.
3.9%). New healthcare reform legislation is unlikely to have any
impact on the gap.

WC Insurers Experience Inflation More Intensely than 2009 CPI Suggests
Source: Bureau of Labor Statistics; Insurance Information Institute.
2.7%
1.8%
6.9%
3.0% 3.0%3.4%
3.1%3.4%
0%
2%
4%
6%
8%
Overall CPI "Core" CPI HospitalServices
Physicians'Services
DentalServices
PrescriptionDrugs
Medical CareCommodities
Medical CPI
(Percent increase Dec 08 to Dec 09)
Healthcare Costs Are a Major WC Insurance Cost Driver. They AreLikely to Increase Faster than the CPI for the Next Few Years, at Least
44
Excludes Food and Energy
Inpatient Services Rose 6.7%;
Outpatient Services Rose 7.4%

45
Workers Compensation Lost-Time Claim Frequency Continues to Decline*
-4.4
%
0.3
%
-6.5
%
-4.5
%
0.5
%
-3.9
%
-2.3
%
-4.5
%
-6.9
%
-4.5
%
-4.1
%
-3.7
%
-6.6
%
-6.2
%
-3.0
%
-3.4
%
-4.0
%
-9.2
%
-4.2
%
-10%
-8%
-6%
-4%
-2%
0%
2%
91 92 93 94 95 96 97 98 99 00 01 02 03 04 05 06 07 08 09P
(Percent) Lost-Time Claims
Claim frequency fell in 4.0% in 2009, in part due to the recession
Cumulative Change of -54.7%
(1991 – 2008)
2009p: Preliminary based on data valued as of 12/31/2009; *Frequency is defined as the number of lost-time claims per 100,000 workers.1991-2008: Based on data through 12/31/2008, developed to ultimateBased on the states where NCCI provides ratemaking services including state funds; Excludes the effects of deductible policies

Med Costs Share of Total Costs is Increasing Steadily
Indemnity53%
Medical47%
Source: NCCI (based on states where NCCI provides ratemaking services).
Indemnity48%
Medical52%
Indemnity42%
Medical58%1989
1999
2009p

WC Med Cost Will Equal 2/3 of Total by 2019 if Trends Hold
Source: Insurance Information Institute.
Indemnity33%
Medical67%
2019 Estimate
This trend will likely be
supported by the increased labor
force participation of workers age 55
and older.

Indemnity Claim Cost Trends
48
Indemnity Costs Continue to Rise at a Pace Above Wage Inflation

$1
0.0
$9
.7
$9
.4
$9
.9
$1
0.1
$1
0.7
$1
1.5
$1
2.5
$1
3.8
$1
5.3
$1
6.7
$1
7.3
$1
8.0
$2
2.0
$2
3.0
$2
0.8
$1
9.8
$1
8.3
$1
8.8
+5.0%
+1.0%-3.1% -2.8%+4.9%+1.7%+5.9%
+7.7%+9.0%
+10.1%
+10.1%
+9.2%+3.1%+4.1%+1.7%
+3.1%+5.0%
5
7
9
11
13
15
17
19
21
23
25
1991 1993 1995 1997 1999 2001 2003 2005 2007 2009p
IndemnityClaim Cost ($ 000s)
Annual Change 1991–1993: -1.7%Annual Change 1994–2001: +7.3%Annual Change 2002–2008: +4.0%
2009p: Preliminary based on data valued as of 12/31/20091991–2008: Based on data through 12/31/2008, developed to ultimateBased on the states where NCCI provides ratemaking servicesExcludes the effects of deductible policies
Accident Year
+4.5
Workers Comp Indemnity Claim Costs Continue to Grow
+5.8
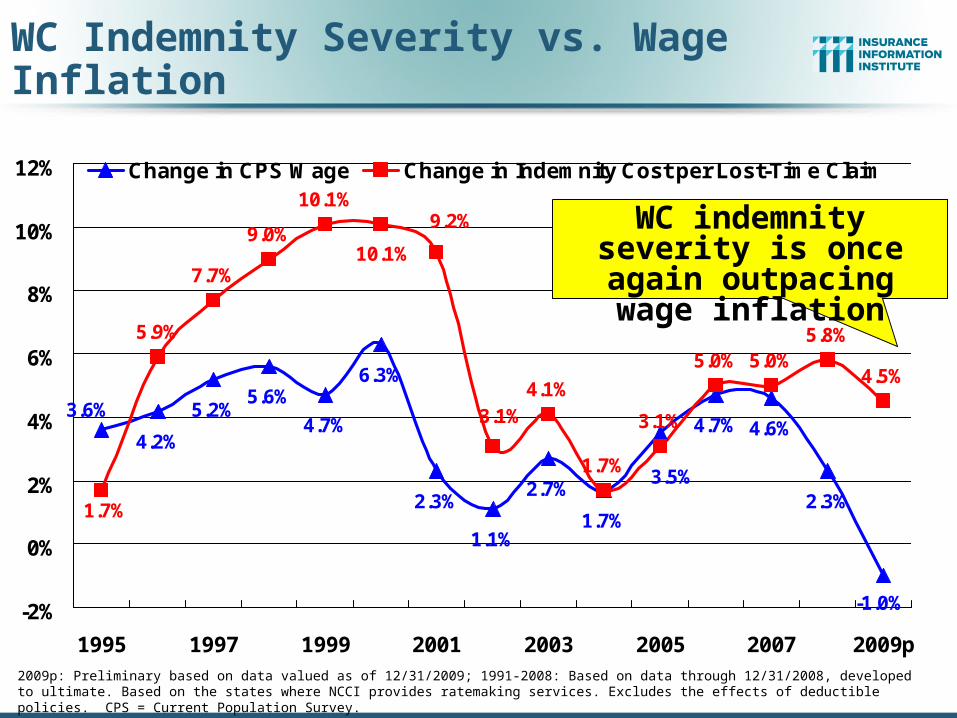
4.2%
5.2%5.6%
4.7%
6.3%
2.3%
1.1%
2.7%
1.7%
4.7% 4.6%
2.3%
5.9%
7.7%
9.0%
10.1%
4.1%
1.7%
3.1%
5.0% 5.0%5.8%
4.5%
-1.0%
3.5%
3.6%
1.7%
10.1%
9.2%
3.1%
-2%
0%
2%
4%
6%
8%
10%
12%
1995 1997 1999 2001 2003 2005 2007 2009p
Change in CPS Wage Change in Indemnity Cost per Lost-Time Claim
WC Indemnity Severity vs. Wage Inflation
2009p: Preliminary based on data valued as of 12/31/2009; 1991-2008: Based on data through 12/31/2008, developed to ultimate. Based on the states where NCCI provides ratemaking services. Excludes the effects of deductible policies. CPS = Current Population Survey.Source: NCCI
WC indemnity severity is once again outpacing
wage inflation
51
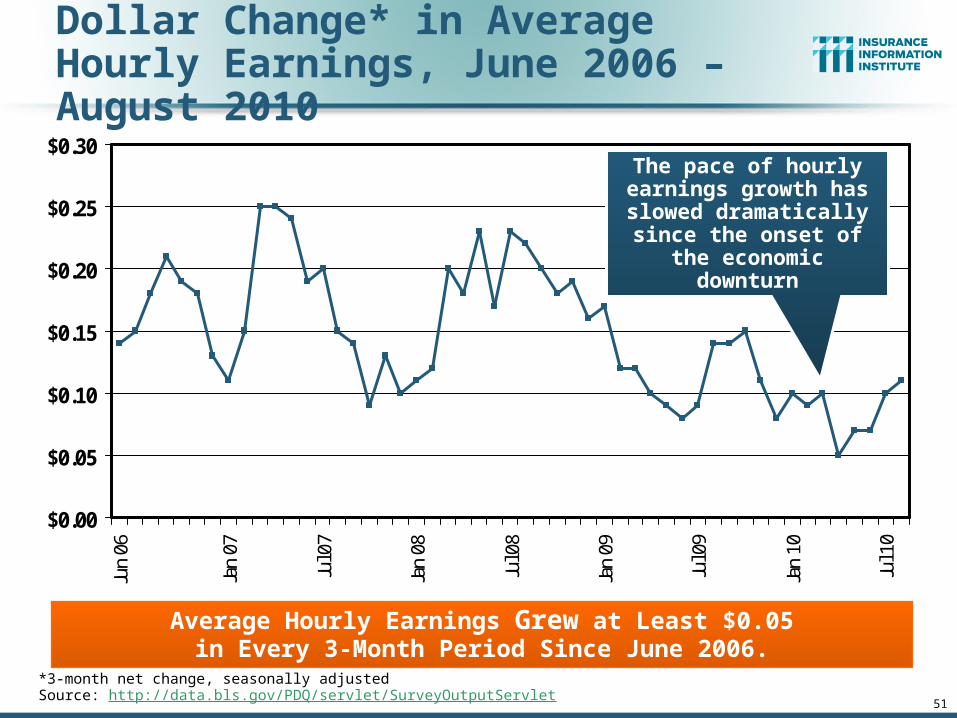
Dollar Change* in Average Hourly Earnings, June 2006 – August 2010
$0.00
$0.05
$0.10
$0.15
$0.20
$0.25
$0.30Ju
n 06
Jan
07
Jul 0
7
Jan
08
Jul 0
8
Jan
09
Jul 0
9
Jan
10
Jul 1
0
*3-month net change, seasonally adjustedSource: http://data.bls.gov/PDQ/servlet/SurveyOutputServlet
Average Hourly Earnings Grew at Least $0.05in Every 3-Month Period Since June 2006.
The pace of hourly earnings growth has
slowed dramatically since the onset of the
economic downturn

52
Total Wages, California2001-2009
$619.15 $614.54$630.69
$667.52
$703.99
$749.50
$790.44 $797.79
$753.97
$518
.60
$508
.16
$521
.08
$555
.40
$588
.32
$627
.54
$659
.99
$661
.15
$618
.17
$400
$450
$500
$550
$600
$650
$700
$750
$800
$850
2001 2002 2003 2004 2005 2006 2007 2008 2009p
All Employers Private Employers
Source: http://data.bls.gov
Recessions Cause Payrolls to Shrink. The 2001 Recession Saw a 2.0% Decline in Private Wages; the 2008-09 Dropoff was 6.3%.
Billions
Wages fallen sharply in hard hit
states like California

Where Will the Growth in WC Exposure Come From?
53
Industry and Occupation Growth Analysis

54
Fastest Growing Occupations, 2008–2018:Health/Science/Tech Dominate
Sources: US Bureau of Labor Statistics: Occupational Outlook Handbook, 2010-2011 Edition; Insurance Information Institute
OccupationsPercent change
Number of
new jobs(in thousands)
Wages (May 2008 median) Education/training category
Biomedical engineers 72 11.6 $ 77,400 Bachelor's degree
Network systems and data communications analysts
53 155.8 71,100 Bachelor's degree
Home health aides 50 460.9 20,460 Short-term on-the-job training
Personal and home care aides 46 375.8 19,180 Short-term on-the-job training
Financial examiners 41 11.1 70,930 Bachelor's degree
Medical scientists, except epidemiologists
40 44.2 72,590 Doctoral degree
Physician assistants 39 29.2 81,230 Master's degree
Skin care specialists 38 14.7 28,730 Postsecondary vocational award
Biochemists and biophysicists 37 8.7 82,840 Doctoral degree
Athletic trainers 37 6.0 39,640 Bachelor's degree
Physical therapist aides 36 16.7 23,760 Short-term on-the-job training
Dental hygienists 36 62.9 66,570 Associate degree
Veterinary technologists and technicians
36 28.5 28,900 Associate degree
Dental assistants 36 105.6 32,380 Moderate-term on-the-job training
Computer software engineers, applications
34 175.1 85,430 Bachelor's degree
Medical assistants 34 163.9 28,300 Moderate-term on-the-job training
Physical therapist assistants 33 21.2 46,140 Associate degree
Veterinarians 33 19.7 79,050 First professional degree
Self-enrichment education teachers
32 81.3 35,720 Work experience in a related occupation
Compliance officers, except agriculture, construction, health and safety, and transportation
31 80.8 48,890 Long-term on-the-job training
SOURCE: BLS Occupational Employment Statistics and Division of Occupational Outlook
WC exposure growth the fastest in the health, science and tech areas

55
Occupations with Largest Numerical Growth, 2008–2018: Health, Services Dominate
Sources: US Bureau of Labor Statistics: Occupational Outlook Handbook, 2010-2011 Edition; Insurance Information Institute
Dollar growth in WC exposures should grow the most (at current rate levels) in the health and services industries
Occupations
Number of
new jobs(in thousands) Percent change
Wages (May 2008 median) Education/training category
Registered nurses 581.5 22 $ 62,450 Associate degree
Home health aides 460.9 50 20,460 Short-term on-the-job training
Customer service representatives 399.5 18 29,860 Moderate-term on-the-job training
Combined food preparation and serving workers, including fast food
394.3 15 16,430 Short-term on-the-job training
Personal and home care aides 375.8 46 19,180 Short-term on-the-job training
Retail salespersons 374.7 8 20,510 Short-term on-the-job training
Office clerks, general 358.7 12 25,320 Short-term on-the-job training
Accountants and auditors 279.4 22 59,430 Bachelor's degree
Nursing aides, orderlies, and attendants
276.0 19 23,850 Postsecondary vocational award
Postsecondary teachers 256.9 15 58,830 Doctoral degree
Construction laborers 255.9 20 28,520 Moderate-term on-the-job training
Elementary school teachers, except special education
244.2 16 49,330 Bachelor's degree
Truck drivers, heavy and tractor-trailer
232.9 13 37,270 Short-term on-the-job training
Landscaping and groundskeeping workers
217.1 18 23,150 Short-term on-the-job training
Bookkeeping, accounting, and auditing clerks
212.4 10 32,510 Moderate-term on-the-job training
Executive secretaries and administrative assistants
204.4 13 40,030 Work experience in a related occupation
Management analysts 178.3 24 73,570 Bachelor's or higher degree, plus work experience
Computer software engineers, applications
175.1 34 85,430 Bachelor's degree
Receptionists and information clerks
172.9 15 24,550 Short-term on-the-job training
Carpenters 165.4 13 38,940 Long-term on-the-job trainingSOURCE: BLS Occupational Employment Statistics and Division of Occupational Outlook

56
Occupations With Largest Numerical Growth Across the States, 2006–2016
Sources: State Occupational Projections (Long-term), http://www.projectionscentral.com/
State Occupations
Number of
new jobs Percent Change
California Retail salespersons 109,300 22
TexasCombined food preparation and serving workers, incl. fast food
88,520 33
Texas Retail salespersons 78,600 24
California Personal and home care aides 76,900 27
Texas Personal and home care aides 74,800 56
TexasCustomer service representatives
65,630 31
California Office clerks, general 63,100 15
TexasElementary school teachers, except special education
62,280 43
California Registered nurses 59,600 25
Texas Registered nurses 59,590 38
Florida Retail salespersons 55,930 20
CaliforniaCustomer service representatives
55,600 28
Texas Waiters and waitresses 53,650 31
CaliforniaCombined food preparation and serving workers, incl. fast food
53,200 25
California Waiters and waitresses 52,800 23
New York Home health aides 52,320 38
FloridaCustomer service representatives
51,830 32
California Postsecondary teachers 51,300 30
CaliforniaElementary school teachers, except special education
51,300 27
Texas Child care workers 44,230 30
Texas and California will see the most job growth through 2016, much of it
in health and retail occupations

57
The Economic Storm
What the Financial Crisis and Recession Mean for the Industry’s
Exposure Base, Growth and Profitability
58
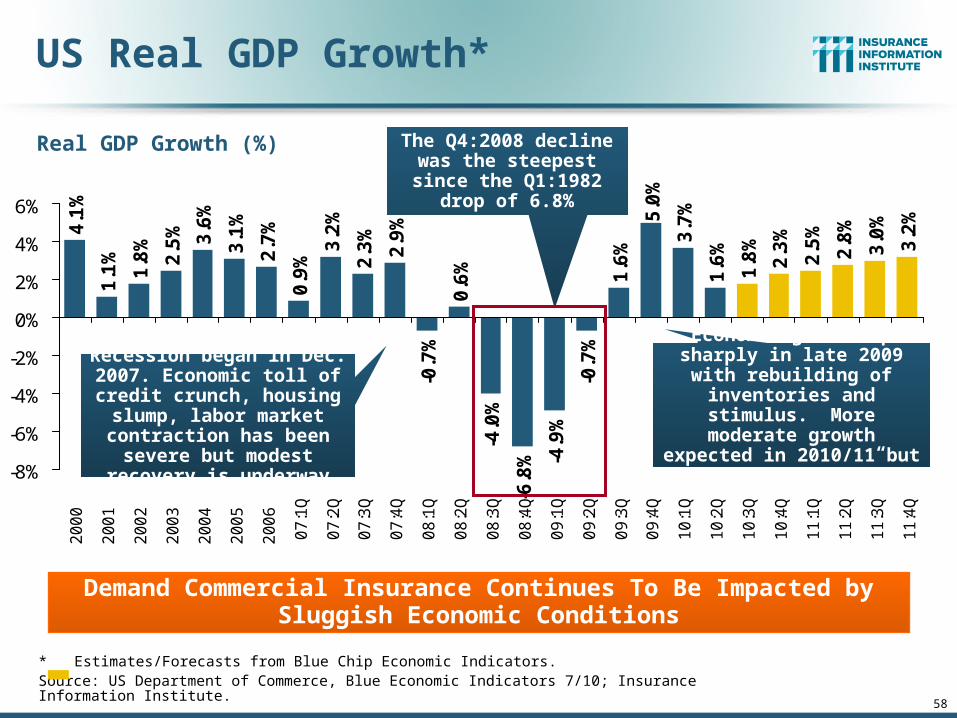
US Real GDP Growth*
* Estimates/Forecasts from Blue Chip Economic Indicators.Source: US Department of Commerce, Blue Economic Indicators 7/10; Insurance Information Institute.
2.7
%
0.9
%
3.2
%
2.3
%
2.9
%
-0.7
%
0.6
%
-4.0
%
-6.8
% -4.9
%
-0.7
%
1.6
%
5.0
%
3.7
%
1.6
%
1.8
%
2.3
%
2.5
%
2.8
%
3.0
%
3.2
%
4.1
%
1.1
%
1.8
%
2.5
% 3.6
%
3.1
%
-8%
-6%
-4%
-2%
0%
2%
4%
6%
2
00
0
2
00
1
2
00
2
2
00
3
2
00
4
2
00
5
2
00
6
07
:1Q
07
:2Q
07
:3Q
07
:4Q
08
:1Q
08
:2Q
08
:3Q
08
:4Q
09
:1Q
09
:2Q
09
:3Q
09
:4Q
10
:1Q
10
:2Q
10
:3Q
10
:4Q
11
:1Q
11
:2Q
11
:3Q
11
:4Q
Demand Commercial Insurance Continues To Be Impacted by Sluggish Economic Conditions
Real GDP Growth (%)
Recession began in Dec. 2007. Economic toll of credit
crunch, housing slump, labor market contraction has
been severe but modest recovery is underway
The Q4:2008 decline was the steepest since the Q1:1982 drop of 6.8%
Economic growth up sharply in late 2009 with rebuilding
of inventories and stimulus. More moderate growth
expected in 2010/11 but no “double dip”

59
Length of US Business Cycles,1929–Present*
10 1116
6
168 8
19
50
80
3745
39
24
106
36
58
12
92
120
73
13
43
138 11 10 8
0
10
20
30
40
50
60
70
80
90
100
110
120
Aug1929
May1937
Feb1945
Nov1948
Jul1953
Aug1957
Apr1960
Dec1969
Nov1973
Jan1980
Jul1981
Jul1990
Mar2001
Dec2007
Month Recession Started
Contraction Expansion Following
* Through July 2010. Assumes “official” end of recession was June 2009. ** Post-WW II period through end of most recent expansion. Sources: National Bureau of Economic Research; Insurance Information Institute.
Average Duration**Recession = 10.4 MosExpansion = 60.5 Mos
Length of Expansions Greatly Exceeds
Contractions
Duration (Months)

60
State Economic Growth Varied Tremendously in 2008
US Bureau of Economic Analysis
Highest Quintile
Fourth Quintile
Third Quintile
Second Quintile
Lowest Quintile
Far West0.6
Rocky Mountain2.2
Southwest1.7
Plains2.0 Great Lakes
-0.4
New England1.0
Mideast1.3
Southeast0.0
US = 0.7
WA2.0
OR1.6
CA0.4
NV-0.6
ID0.0
MT1.8
WY4.4
UT1.4 CO
2.9
AZ-0.6 NM
2.0
TX2.0
OK2.7
KS2.2
NE1.3
SD3.5
ND7.3 MN
2.0
IA2.1
MO1.3
WI0.7
IL0.3
MI-1.5
IN-0.6
OH-0.7
NY1.6
PA1.1
NJ0.6
MD1.3
DE-1.6
DC3.0VA
1.3
WV2.5
KY-0.1
NC0.1
SC0.6
TN0.5
AR0.7
LA0.3
MS1.7
AL0.7
GA-0.6
FL-1.6
AK-2.0
HI0.7
ME1.4
NH1.8
VT1.7 MA
1.9
RI-0.9CT
-0.4
Mountain, Plains States Growing the Fastest
Percent Change in Real GDP by State, 2007–2008

61
Labor Market Trends
Massive Job Losses Sapped the Economy and Commercial/Workers
Comp Exposure, But Trend is Improving

62
Unemployment and Underemployment Rates: Rocketed Up in 2008-09; Stabilizing in 2010?
2
4
6
8
10
12
14
16
18
Jan 00 Jan 01 Jan 02 Jan 03 Jan 04 Jan 05 Jan 06 Jan 07 Jan 08 Jan 09 Jan 10
Traditional Unemployment Rate U-3
Unemployment + Underemployment Rate U-6
Aug10
Unemployment rate was 9.6% in
July
Unemployment peaked at 10.1%
in Oct. 2009, highest monthly rate since 1983.
Peak rate in the last 30 years: 10.8% in Nov -
Dec 1982
Source: US Bureau of Labor Statistics; Insurance Information Institute.
U-6 went from 8.0% in March
2007 to 17.5% in Oct 2009; Stood at 16.7% in July
2010
January 2000 through August 2010, Seasonally Adjusted (%)
Recession ended in
November 2001
Unemployment kept rising for
19 more months
Recession began in
December 2007

63
US Unemployment Rate
4.5
%
4.5
%
4.6
%
4.8
%
4.9
% 5.4
% 6.1
%
6.9
%
8.1
%
9.3
%
9.6
% 10
.0%
9.7
%
9.7
%
9.6
%
9.5
%
9.4
%
9.2
%
9.0
%9.6
%
4.0%
5.0%
6.0%
7.0%
8.0%
9.0%
10.0%
11.0%
07
:Q1
07
:Q2
07
:Q3
07
:Q4
08
:Q1
08
:Q2
08
:Q3
08
:Q4
09
:Q1
09
:Q2
09
:Q3
09
:Q4
10
:Q1
10
:Q2
10
:Q3
10
:Q4
11
:Q1
11
:Q2
11
:Q3
11
:Q4
Rising unemployment eroded payrolls
and workers comp’s exposure base.
Unemployment likely peaked at 10% in late 2009.
* = actual; = forecastsSources: US Bureau of Labor Statistics; Blue Chip Economic Indicators (9/10); Insurance Information Institute
2007:Q1 to 2011:Q4F*
Unemployment forecasts remain stubbornly high
through 2011

64
Unemployment Rates Vary Widelyby State and Region: July 2010*
14.3
%
13.1
%
6.5%
4.7%
4.4%
3.6%
8.9%
10.6
%12.3
%
10.2
%7.
8%
6.8%
10.3
%
6.8%
9.2%
10.3
%
8.0%
6.7%7.
3%7.
2%
8.8%
8.2%
8.2%
6.9%
9.6%
0%
3%
6%
9%
12%
15%
AZ
NM TX OK ID CO UT
MT
WY
NV
CA
OR
WA MI IL O
H IN WI
MO
MN IA KS NE
SD
ND
Une
mpl
oym
ent R
ate
(%)
*Provisional figures for July 2010, seasonally adjusted.
Sources: US Bureau of Labor Statistics; Insurance Information Institute.
Southwest Mountain
Far West
Great Plains
Great Lakes

65
Unemployment Rates Vary Widelyby State and Region: July 2010* (cont’d)
11.5
%10
.8%
10.8
%9.
9%9.
9%9.
8%9.
8%9.
7%8.
6%7.
4%7.
2%7.
0%
9.7%
9.3%
8.4%
8.2%
7.1%
11.9
%9.
0%8.
9%8.
1%6.
0%5.
8%
7.7%
6.3%
0%
3%
6%
9%
12%
15%
FL MS
SC
GA KY
TN NC AL
WV AR LA VA NJ
PA DE
NY
MD RI
MA CT
ME
VT
NH
AK HI
Une
mpl
oym
ent R
ate
(%)
*Provisional figures for July 2010, seasonally adjusted.
Sources: US Bureau of Labor Statistics; Insurance Information Institute.
Southeast Mid-Atlantic New England

66
Monthly Change Employment*-7
2-1
44
-12
2-1
60
-13
7-1
61
-12
8-1
75
-32
1-3
80
-59
7-6
81
-77
9-7
26
-75
3-5
28 -3
87
-51
5 -34
6 -21
2-2
25
-22
46
4-1
09
14 39
20
8 31
3 43
2-1
75 -5
4-5
4
-1,000
-800
-600
-400
-200
0
200
400
600
Jan
08
Fe
b 0
8M
ar
08
Ap
r 0
8M
ay
08
Jun
08
Jul 0
8A
ug
08
Se
p 0
8O
ct 0
8N
ov
08
De
c 0
8Ja
n 0
9F
eb
09
Ma
r 0
9A
pr
09
Ma
y 0
9Ju
n 0
9Ju
l 09
Au
g 0
9S
ep
09
Oct
09
No
v 0
9D
ec
09
Jan
10
Fe
b 1
0M
ar
10
Ap
r 1
0M
ay
10
Jun
10
Jul 1
0A
ug
10
Monthly Losses in Dec. 08–Mar. 09 Were
the Largest in the Post-WW II Period
*Estimate based on Reuters poll of economists.Source: US Bureau of Labor Statistics: http://www.bls.gov/ces/home.htm; Insurance Information Institute
Job Losses Since the Recession Began in Dec. 2007 Peaked at 8.4 Mill in Dec. 09; Stands at 7.7 Million Through August 2010;
14.9 Million People are Now Defined as Unemployed
January 2008 through August 2010* (Thousands)
The job gain and loss figures in 2010 are severely distorted by the hiring and
termination of temporary Census workers. So far in 2010, 763,000 private sector jobs
have been created.

Estimated Effect of Recessions* on Payroll (Workers Comp Exposure)
*Data represent maximum recorded decline over 12-month period using annualized quarterly wage and salary accrual dataSource: Insurance Information Institute research; Federal Reserve Bank of St. Louis (wage and salary data); National Bureau of Economic Research (recession dates).
-4.4%
-2.0%-1.1%
1.1%
3.7%4.6%
8.5%
3.5%
2.1%
-0.5%
-3.6%
-6%
-4%
-2%
0%
2%
4%
6%
8%
10%
1948-1949
1953-1954
1957-1958
1960-1961
1969-1970
1973-1975
1980 1981-1982
1990-1991
2001 2007-2009
Recessions in the 1970s and 1980s saw smaller exposure impacts
because of continued wage inflation, a factor not present
during the 2007-2009 recession
The Dec. 2007 to mid-2009 recession
caused the largest impact on WC
exposure in 60 years
(Percent Change)
(All Post WWII Recessions)
Recession Dates (Beginning/Ending Years)

68
Frequency: 1926–2009A Long-Term Drift Downward
Note: Recessions indicated by gray bars.Sources: NCCI from US Bureau of Labor Statistics; National Bureau of Economic Research.
Manufacturing – Total Recordable CasesRate of Injury and Illness Cases per 100 Full-Time Workers

Crisis-Driven Exposure Drivers
69
Economic Obstaclesto Growth in P/C Insurance,
Including Workers Compensation

70
43,6
9448
,125
69,3
0062
,436
64,0
04 71,2
77 81,2
3582
,446
63,8
5363
,235
64,8
5371
,549
70,6
4362
,304
52,3
7451
,959
53,5
4954
,027
44,3
6737
,884
35,4
7240
,099
38,5
4035
,037
34,3
1739
,201
19,6
95 28,3
2243
,546
60,8
3729
,059
0
10,000
20,000
30,000
40,000
50,000
60,000
70,000
80,000
90,000
80 81 82 83 84 85 86 87 88 89 90 91 92 93 94 95 96 97 98 99 00 01 02 03 04 05 06 07 08 0910
:H1
Business Bankruptcy Filings,1980-2010:H1
Source: American Bankruptcy Institute; Insurance Information Institute
Significant Exposure Implications for All Commercial Lines. There Are Some Preliminary Indications that Business
Bankruptcies Are Beginning to Decline.
There were 60,837 business bankruptcies in 2009, up 40% from 2008 and the most since 1993. 2010:H1
bankruptcies totaled 29,059, down 4% from H1:2009, but still very high by historical standards.
% Change Surrounding Recessions
1980-82 58.6%1980-87 88.7%1990-91 10.3%2000-01 13.0%2006-09 208.9%*

71
Private Sector Business Starts,1993:Q2 – 2009:Q4*
175
186
174
180
186
192
188
187 18
918
6 190 19
419
119
9 204
202
195
196
196
206
206
201
192
198
206
206
203
211
205
212
200 20
520
420
419
720
320
920
1
192
192
193
201 20
420
221
0 212
209
216 22
0 223
220
220
210
221
212
204
218
209
207
199
191 19
317
117
716
918
0
203
150
160
170
180
190
200
210
220
230
93 94 95 96 97 98 99 00 01 02 03 04 05 06 07 08 09
Business Starts Are Down Nearly 20% in the Current Downturn, Holding Back Most Types of Commercial Insurance Exposure
*Latest available as of September 12, 2010, seasonally adjustedSource: Bureau of Labor Statistics, http://www.bls.gov/news.release/cewbd.t07.htm.
(Thousands)
180,000 businesses started in 2009:Q4, the best quarter in 2009. 2009 was the slowest year for new
business starts since 1993.

66%
68%
70%
72%
74%
76%
78%
80%
82%
Ma
r 0
1
Ju
n 0
1
Se
p 0
1
De
c 0
1
Ma
r 0
2
Ju
n 0
2
Se
p 0
2
De
c 0
2
Ma
r 0
3
Ju
n 0
3
Se
p 0
3
De
c 0
3
Ma
r 0
4
Ju
n 0
4
Se
p 0
4
De
c 0
4
Ma
r 0
5
Ju
n 0
5
Se
p 0
5
De
c 0
5
Ma
r 0
6
Ju
n 0
6
Se
p 0
6
De
c 0
6
Ma
r 0
7
Ju
n 0
7
Se
p 0
7
De
c 0
7
Ma
r 0
8
Ju
n 0
8
Se
p 0
8
De
c 0
8
Ma
r 0
9
Ju
n 0
9
Se
p 0
9
De
c 0
9
Ma
r 1
0
Ju
n 1
0
Recovery in Capacity Utilization is a Positive Sign for Insurance Exposure
Source: Federal Reserve Board statistical releases at http://www.federalreserve.gov/releases/g17/Current/default.htm. 72
Percent of Capacity Utilized (Manufacturing, Mining, Utilities)
Hurricane Katrina
March 2001-November 2001
recession
“Full Capacity”
The closer the economy is to operating at “full
capacity,” the greater the demand for insurance
Manufacturing capacity stood at
74.8% in July 2010, above the June 2009 low of 68.2% but well below the pre-crisis
peak of 80%+
Recession began December 2007

www.iii.org
Thank you for your timeand your attention!
Twitter: twitter.com/bob_hartwig
Insurance Information Institute Online:
Related Documents