Worked solutions: Chapter 5 Measurement and data processing Page 1 © Pearson Education Australia (a division of Pearson Australia Group Pty Ltd) 2008. This page from the Chemistry: For use with the IB Diploma Programme SL Teacher’s Resource may be reproduced for classroom use. Section 5.1 Exercises 1 These results are not very accurate. The actual value of 14.70% is not close to these results. These results, however, are precise because they are all very close in value to each other. The average is 14.37% and the range is only ± 0.03%. 2 Percentage difference = 1 100 value accepted value accepted value al experiment × − = 1 100 70 . 14 37 . 14 70 . 14 × − = 2.24 % These results are quite accurate, after all, as the percentage difference is only 2.24%. 3 Only random uncertainties can be reduced by repeating an experiment many times. Systematic errors, such as an incorrectly zeroed set of scales, will occur in all the repetitions. Systematic errors can only be reduced by more careful use and maintenance of equipment. 4 Some solid may be spilt on the pan and would create a systematic error if not cleaned off; the balance may not be completely level, which would affect its accurate operation; the balance may not return to zero after a measurement. 5 a Answers in bold. Experiment number 1 2 3 4 5 6 7 Final volume (±0.08 cm 3 ) 21.43 42.80 27.27 20.52 42.90 22.42 42.80 Initial volume (±0.08 cm 3 ) 0.00 21.43 0.20 0.50 20.52 1.00 21.42 Volume of titre (±0.2 cm 3 ) 21.43 21.37 27.07 20.02 22.38 21.42 21.38 b Not all of the results should be averaged. The results of experiment 3, 4 and 5 are obviously wrong (especially experiment 3) and should not be used. c The average is 4 38 . 21 42 . 21 37 . 21 43 . 21 + + + = 21.40 cm 3 The range is ±0.03, which is less than the random uncertainty of the volume of the titre (±0.2 cm 3 ) so the uncertainty in the average titre remains at ±0.2 cm 3 . 6 a 4 b 4 c 5 d 2 e 5 f 1

Welcome message from author
This document is posted to help you gain knowledge. Please leave a comment to let me know what you think about it! Share it to your friends and learn new things together.
Transcript
Worked solutions: Chapter 5 Measurement and data processing
Page 1 © Pearson Education Australia (a division of Pearson Australia Group Pty Ltd) 2008.
This page from the Chemistry: For use with the IB Diploma Programme SL Teacher’s Resource may be reproduced for classroom use.
Section 5.1 Exercises
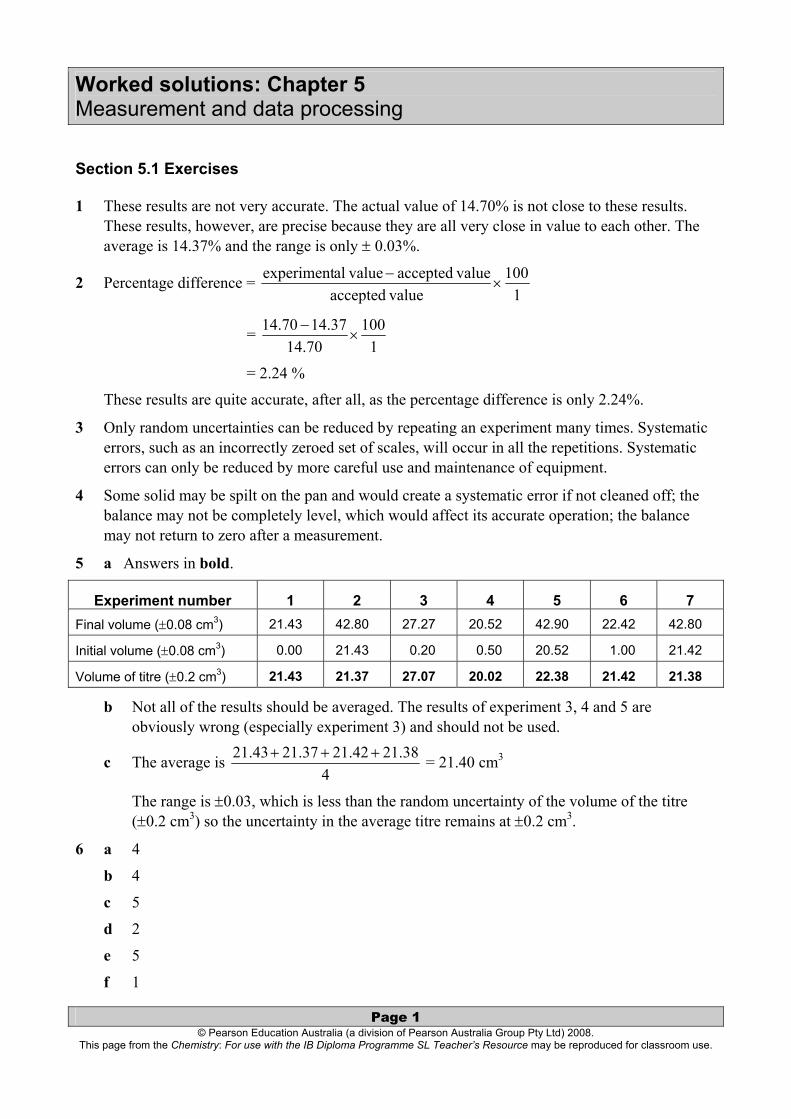
1 These results are not very accurate. The actual value of 14.70% is not close to these results. These results, however, are precise because they are all very close in value to each other. The average is 14.37% and the range is only ± 0.03%.
2 Percentage difference = 1
100 valueaccepted
valueaccepted valuealexperiment×
−
= 1
10070.14
37.1470.14×
−
= 2.24 %
These results are quite accurate, after all, as the percentage difference is only 2.24%.
3 Only random uncertainties can be reduced by repeating an experiment many times. Systematic errors, such as an incorrectly zeroed set of scales, will occur in all the repetitions. Systematic errors can only be reduced by more careful use and maintenance of equipment.
4 Some solid may be spilt on the pan and would create a systematic error if not cleaned off; the balance may not be completely level, which would affect its accurate operation; the balance may not return to zero after a measurement.
5 a Answers in bold.
Experiment number 1 2 3 4 5 6 7 Final volume (±0.08 cm3) 21.43 42.80 27.27 20.52 42.90 22.42 42.80
Initial volume (±0.08 cm3) 0.00 21.43 0.20 0.50 20.52 1.00 21.42
Volume of titre (±0.2 cm3) 21.43 21.37 27.07 20.02 22.38 21.42 21.38 b Not all of the results should be averaged. The results of experiment 3, 4 and 5 are
obviously wrong (especially experiment 3) and should not be used.
c The average is 4
38.2142.2137.2143.21 +++ = 21.40 cm3
The range is ±0.03, which is less than the random uncertainty of the volume of the titre (±0.2 cm3) so the uncertainty in the average titre remains at ±0.2 cm3.
6 a 4
b 4
c 5
d 2
e 5
f 1
Worked solutions: Chapter 5 Measurement and data processing
Page 2 © Pearson Education Australia (a division of Pearson Australia Group Pty Ltd) 2008.
This page from the Chemistry: For use with the IB Diploma Programme SL Teacher’s Resource may be reproduced for classroom use.
g 4
h 3
7 a 0.96
b 34.7
c 22.22
d 0.00306
e 0.0031
f 1.00
g 15.28
h 0.000585
i 2.44
j 0.83
8 a 5 × 10⁸
b 4.8 × 10⁸
c 4.78 × 10⁸
d 4.780 × 10⁸
9 a 485.7
b 33.79
c 1.7 × 10²
d 0.18
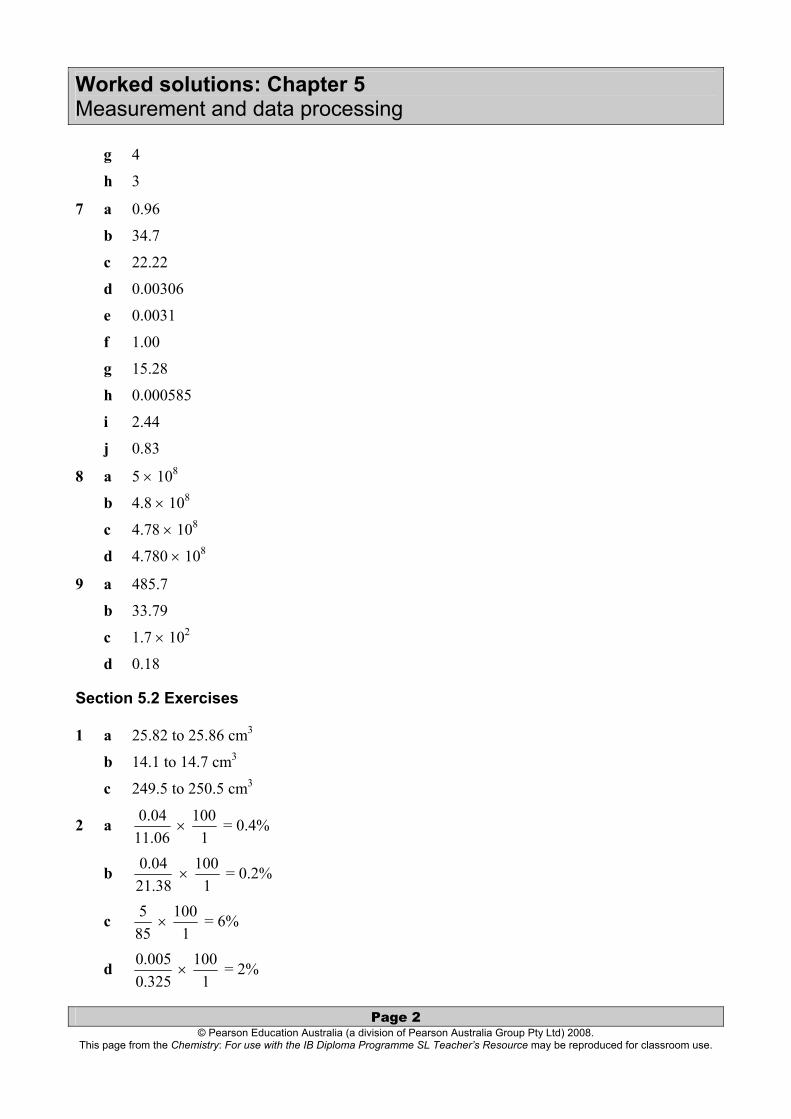
Section 5.2 Exercises
1 a 25.82 to 25.86 cm3
b 14.1 to 14.7 cm3
c 249.5 to 250.5 cm3
2 a 06.1104.0 ×
1100 = 0.4%
b 38.21
04.0 × 1
100 = 0.2%
c 855 ×
1100 = 6%
d 325.0005.0 ×
1100 = 2%
Worked solutions: Chapter 5 Measurement and data processing
Page 3 © Pearson Education Australia (a division of Pearson Australia Group Pty Ltd) 2008.
This page from the Chemistry: For use with the IB Diploma Programme SL Teacher’s Resource may be reproduced for classroom use.
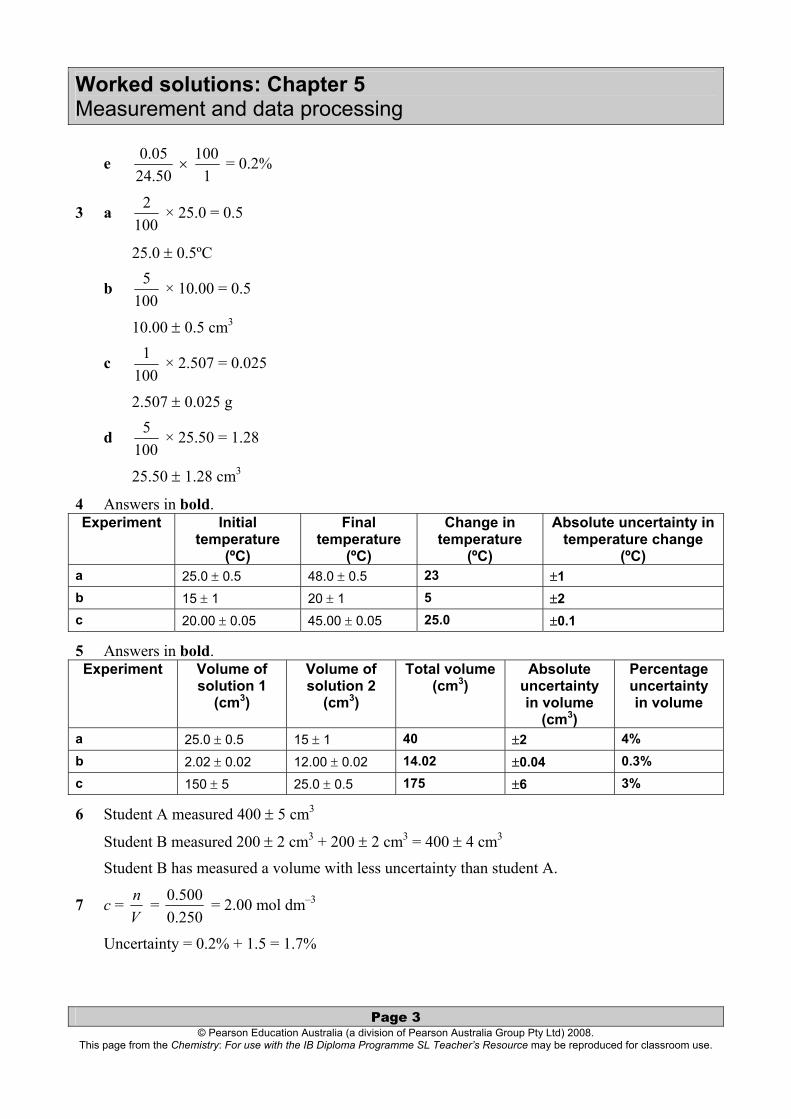
e 50.2405.0 ×
1100 = 0.2%
3 a 100
2 × 25.0 = 0.5
25.0 ± 0.5ºC
b 100
5 × 10.00 = 0.5
10.00 ± 0.5 cm3
c 100
1 × 2.507 = 0.025
2.507 ± 0.025 g
d 100
5 × 25.50 = 1.28
25.50 ± 1.28 cm3
4 Answers in bold. Experiment Initial
temperature (ºC)
Final temperature
(ºC)
Change in temperature
(ºC)
Absolute uncertainty in temperature change
(ºC) a 25.0 ± 0.5 48.0 ± 0.5 23 ±1 b 15 ± 1 20 ± 1 5 ±2 c 20.00 ± 0.05 45.00 ± 0.05 25.0 ±0.1
5 Answers in bold. Experiment Volume of
solution 1 (cm3)
Volume of solution 2
(cm3)
Total volume (cm3)
Absolute uncertainty in volume
(cm3)
Percentage uncertainty in volume
a 25.0 ± 0.5 15 ± 1 40 ±2 4% b 2.02 ± 0.02 12.00 ± 0.02 14.02 ±0.04 0.3% c 150 ± 5 25.0 ± 0.5 175 ±6 3%
6 Student A measured 400 ± 5 cm3
Student B measured 200 ± 2 cm3 + 200 ± 2 cm3 = 400 ± 4 cm3
Student B has measured a volume with less uncertainty than student A.
7 c = Vn =
250.0500.0 = 2.00 mol dm–3
Uncertainty = 0.2% + 1.5 = 1.7%
Worked solutions: Chapter 5 Measurement and data processing
Page 4 © Pearson Education Australia (a division of Pearson Australia Group Pty Ltd) 2008.
This page from the Chemistry: For use with the IB Diploma Programme SL Teacher’s Resource may be reproduced for classroom use.
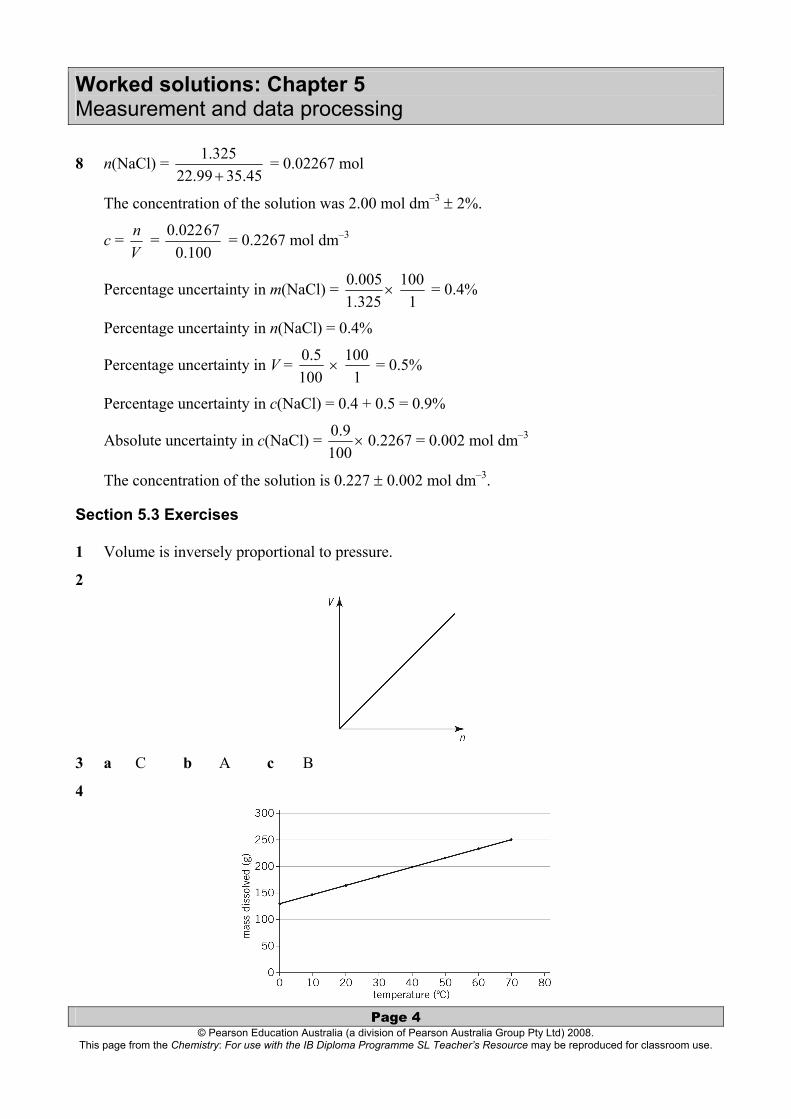
8 n(NaCl) = 45.3599.22
325.1+
= 0.02267 mol
The concentration of the solution was 2.00 mol dm–3 ± 2%.
c = Vn =
100.067022.0 = 0.2267 mol dm–3
Percentage uncertainty in m(NaCl) = 325.1005.0
× 1
100 = 0.4%
Percentage uncertainty in n(NaCl) = 0.4%
Percentage uncertainty in V = 100
5.0 × 1
100 = 0.5%
Percentage uncertainty in c(NaCl) = 0.4 + 0.5 = 0.9%
Absolute uncertainty in c(NaCl) = 100
9.0× 0.2267 = 0.002 mol dm–3
The concentration of the solution is 0.227 ± 0.002 mol dm–3.
Section 5.3 Exercises
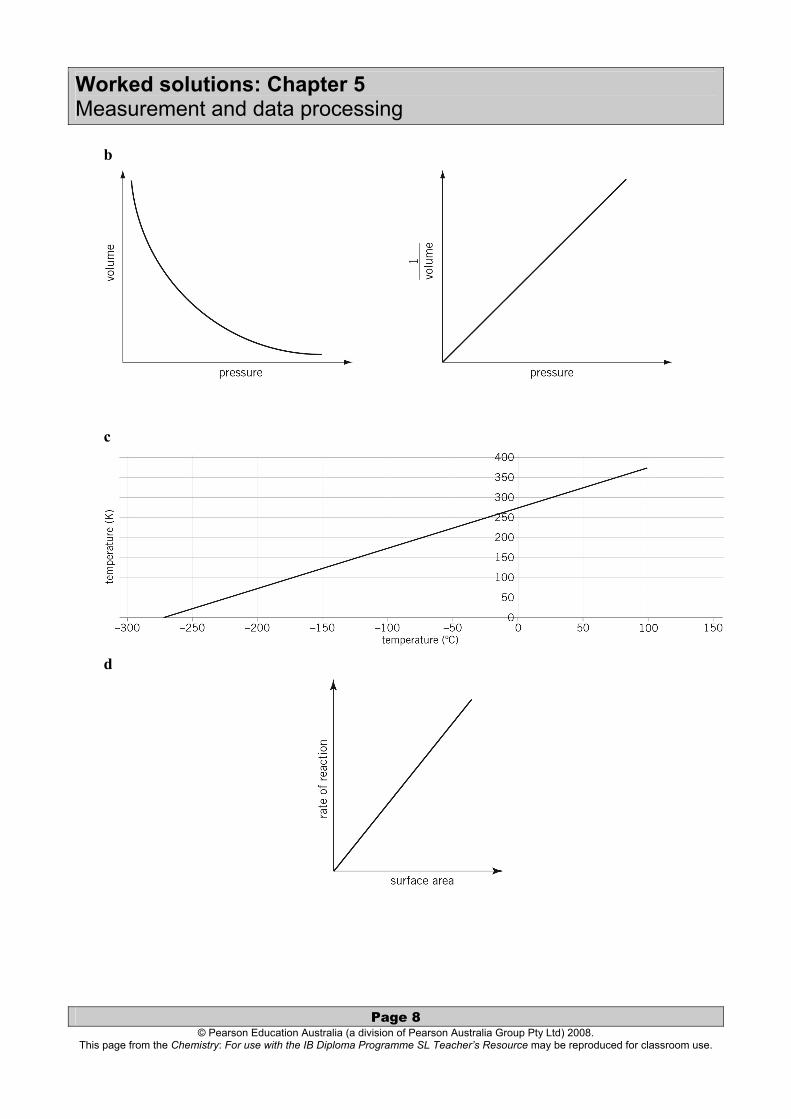
1 Volume is inversely proportional to pressure.
2
3 a C b A c B
4

Worked solutions: Chapter 5 Measurement and data processing
Page 5 © Pearson Education Australia (a division of Pearson Australia Group Pty Ltd) 2008.
This page from the Chemistry: For use with the IB Diploma Programme SL Teacher’s Resource may be reproduced for classroom use.
5
Chapter 5 Review questions
1 Yes, it is possible to obtain a set of experimental results which are precise, but not accurate. The results may all be very close to one another, with a very small range (therefore precise) but, perhaps due to a systematic error, they are far from the theoretical result, and so are not accurate.
2 The average of the five results is 10.51 cm3, with a range of ±0.04 cm3. The percentage difference between the expected volume (10 cm3) and the actual volume (10.51 cm3) is
1100
101051.10
×− = 5%.
The graduated cylinder is not very accurate.
3 Random uncertainties are minor uncertainties inherent in any measurement. In a measuring cylinder, the random uncertainty will vary depending on the size of the measuring cylinder. The value is usually recorded on the glassware. For example, a 100 cm3 measuring cylinder will typically have a random uncertainty of ±0.1 cm3. A systematic error will occur when a piece of equipment is not used correctly, consistently. In the case of the measuring cylinder, a systematic error will occur if the top, rather than the bottom, of the meniscus is read to find a volume. The value will consistently be too high.
Worked solutions: Chapter 5 Measurement and data processing
Page 6 © Pearson Education Australia (a division of Pearson Australia Group Pty Ltd) 2008.
This page from the Chemistry: For use with the IB Diploma Programme SL Teacher’s Resource may be reproduced for classroom use.
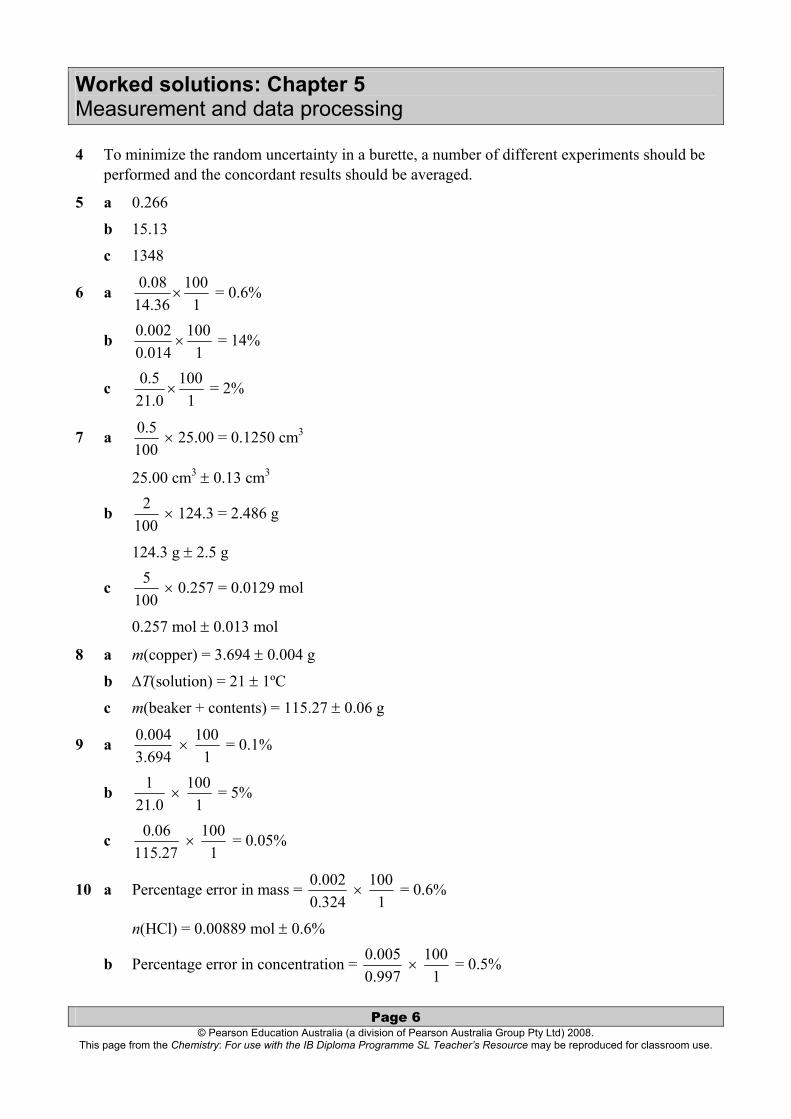
4 To minimize the random uncertainty in a burette, a number of different experiments should be performed and the concordant results should be averaged.
5 a 0.266
b 15.13
c 1348
6 a 36.1408.0
×1
100 = 0.6%
b 014.0002.0
×1
100 = 14%
c 0.215.0×
1100 = 2%
7 a 100
5.0 × 25.00 = 0.1250 cm3
25.00 cm3 ± 0.13 cm3
b 100
2 × 124.3 = 2.486 g
124.3 g ± 2.5 g
c 100
5 × 0.257 = 0.0129 mol
0.257 mol ± 0.013 mol
8 a m(copper) = 3.694 ± 0.004 g
b ∆T(solution) = 21 ± 1ºC
c m(beaker + contents) = 115.27 ± 0.06 g
9 a 694.3004.0 ×
1100 = 0.1%
b 0.21
1 × 1
100 = 5%
c 27.115
06.0 × 1
100 = 0.05%
10 a Percentage error in mass = 324.0002.0 ×
1100 = 0.6%
n(HCl) = 0.00889 mol ± 0.6%
b Percentage error in concentration = 997.0005.0 ×
1100 = 0.5%
Worked solutions: Chapter 5 Measurement and data processing
Page 7 © Pearson Education Australia (a division of Pearson Australia Group Pty Ltd) 2008.
This page from the Chemistry: For use with the IB Diploma Programme SL Teacher’s Resource may be reproduced for classroom use.
Percentage error in volume = 0.50
75.3 × 1
100 = 7.5%
Total percentage error = 0.5 + 7.5 = 8%
n(NaOH) = (0.997 ± 0.005) × 1000
75.30.50 ± = 0.0499 ± 8%
c Percentage error in mol = 99009.003000.0
× 1
100 = 0.3%
Percentage error in volume = 250.00015.0 ×
1100 = 0.6%
Total percentage error = 0.3 + 0.6 = 0.9%
c(NaCl) = 250.0
99009.0 = 0.0400 mol dm–3 ± 0.9%
11 a 100
6.0 × 0.008 89 = ±5 × 10⁻⁵ mol
b 100
8 × 0.0499 = ±4 × 10⁻³ mol
c 100
9.0 × 0.0400 = ±4 × 10⁻⁴ mol dm–3
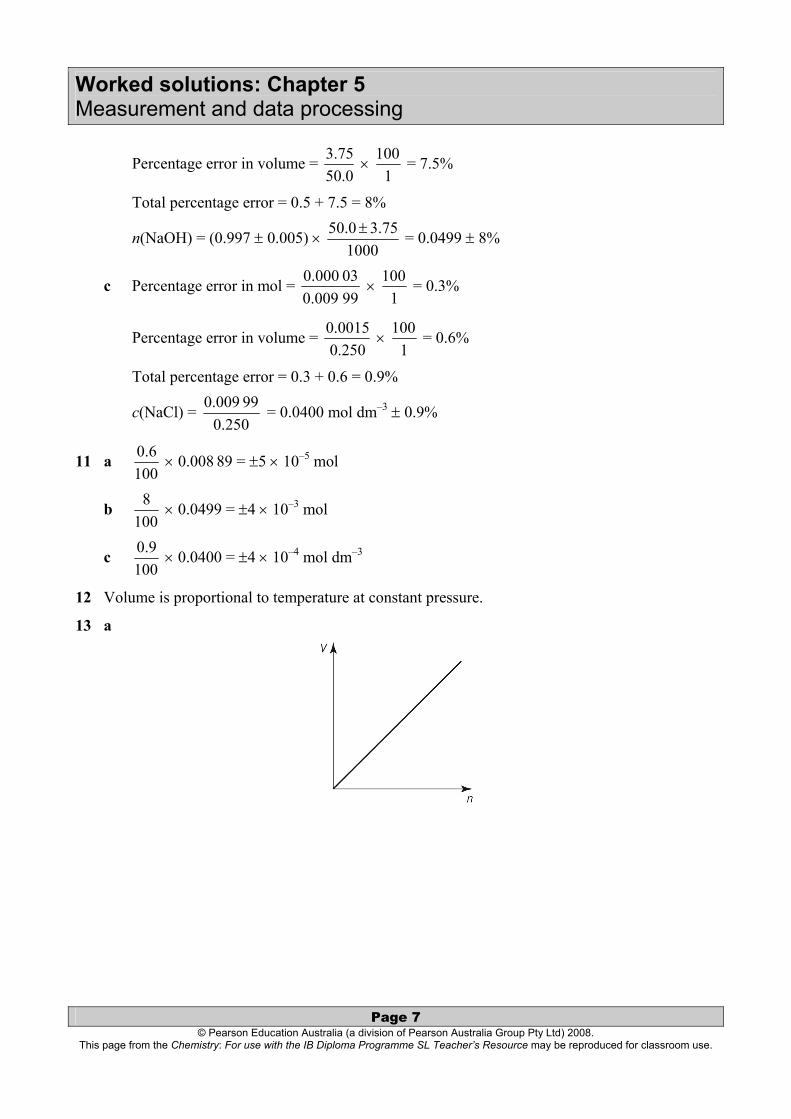
12 Volume is proportional to temperature at constant pressure.
13 a
Worked solutions: Chapter 5 Measurement and data processing
Page 8 © Pearson Education Australia (a division of Pearson Australia Group Pty Ltd) 2008.
This page from the Chemistry: For use with the IB Diploma Programme SL Teacher’s Resource may be reproduced for classroom use.
b
c
d

Worked solutions: Chapter 5 Measurement and data processing
Page 9 © Pearson Education Australia (a division of Pearson Australia Group Pty Ltd) 2008.
This page from the Chemistry: For use with the IB Diploma Programme SL Teacher’s Resource may be reproduced for classroom use.
e
14 a Ba(OH)2(aq) + H2SO4(aq) → BaSO4(s) + 2H2O(l)
b The electrical conductivity decreased until 15 cm3 of sulfuric acid had been added, then it increased.
c As sulfuric acid is added, it reacts with the barium ions and hydroxide ions in solution, forming solid barium sulfate and water, neither of which conduct electricity. When all of the barium hydroxide has reacted, the conductivity starts to increase again due to the excess of H+ ions and SO4
2– ions in solution.
15
16 a At t = 0 min, gradient = 5.08.1 = 3.6 g min–1
At t = 1.5 min, gradient = 0.1
8.29.3 − = 1.1 g min–1
b The gradient has the greater value at t = 0.
Worked solutions: Chapter 5 Measurement and data processing
Page 10 © Pearson Education Australia (a division of Pearson Australia Group Pty Ltd) 2008.
This page from the Chemistry: For use with the IB Diploma Programme SL Teacher’s Resource may be reproduced for classroom use.
Chapter 5 Test
Part A: Multiple-choice questions
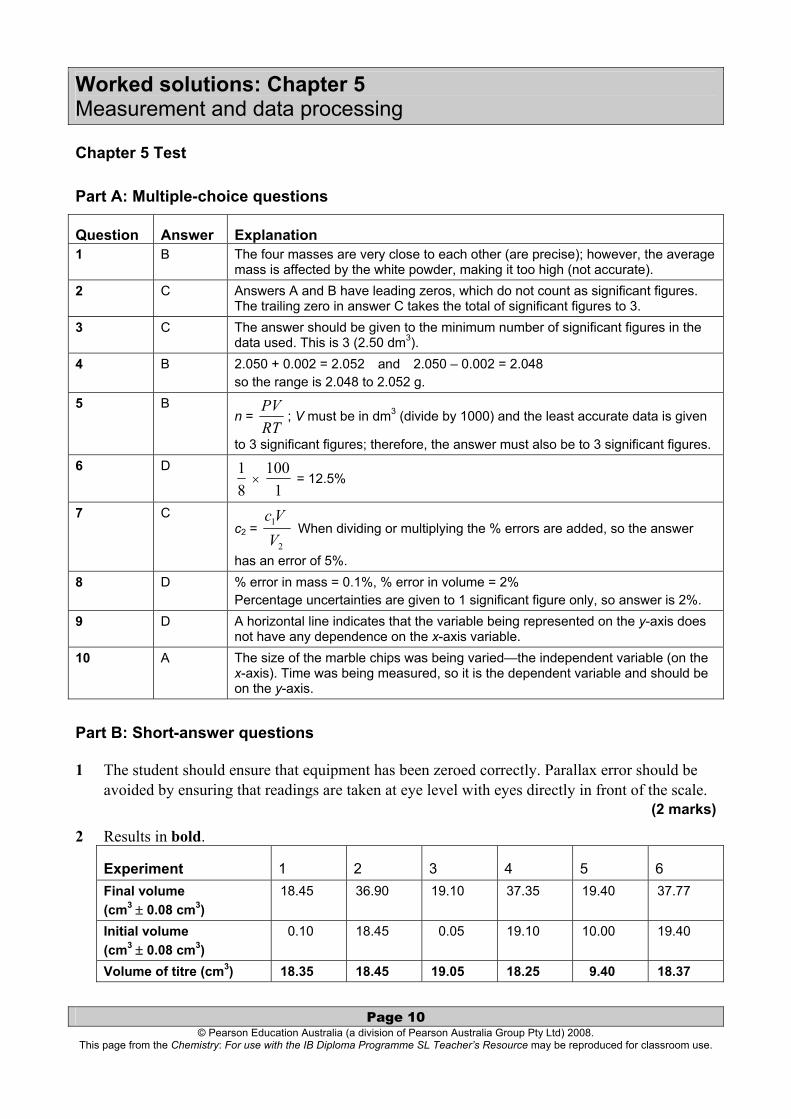
Question Answer Explanation 1 B The four masses are very close to each other (are precise); however, the average
mass is affected by the white powder, making it too high (not accurate). 2 C Answers A and B have leading zeros, which do not count as significant figures.
The trailing zero in answer C takes the total of significant figures to 3. 3 C The answer should be given to the minimum number of significant figures in the
data used. This is 3 (2.50 dm3). 4 B 2.050 + 0.002 = 2.052 and 2.050 – 0.002 = 2.048
so the range is 2.048 to 2.052 g. 5 B
n = RTPV
; V must be in dm3 (divide by 1000) and the least accurate data is given
to 3 significant figures; therefore, the answer must also be to 3 significant figures. 6 D
81
× 1
100 = 12.5%
7 C c2 =
2
1
VVc
When dividing or multiplying the % errors are added, so the answer
has an error of 5%. 8 D % error in mass = 0.1%, % error in volume = 2%
Percentage uncertainties are given to 1 significant figure only, so answer is 2%. 9 D A horizontal line indicates that the variable being represented on the y-axis does
not have any dependence on the x-axis variable. 10 A The size of the marble chips was being varied—the independent variable (on the
x-axis). Time was being measured, so it is the dependent variable and should be on the y-axis.
Part B: Short-answer questions
1 The student should ensure that equipment has been zeroed correctly. Parallax error should be avoided by ensuring that readings are taken at eye level with eyes directly in front of the scale.
(2 marks)
2 Results in bold.
Experiment 1 2 3 4 5 6 Final volume (cm3 ± 0.08 cm3)
18.45 36.90 19.10 37.35 19.40 37.77
Initial volume (cm3 ± 0.08 cm3)
0.10 18.45 0.05 19.10 10.00 19.40
Volume of titre (cm3) 18.35 18.45 19.05 18.25 9.40 18.37
Worked solutions: Chapter 5 Measurement and data processing
Page 11 © Pearson Education Australia (a division of Pearson Australia Group Pty Ltd) 2008.
This page from the Chemistry: For use with the IB Diploma Programme SL Teacher’s Resource may be reproduced for classroom use.
a Random uncertainty is ±0.16 or ±0.2 cm3. (1 mark)
b The result of experiments 3 and 5 should be omitted. (3 marks)
c 4
37.1825.1845.1835.18 +++ = 18.36 cm3 ± 0.2 cm3 (range ± 0.1 is less than random
uncertainty) (2 marks)
3 a The rate of formation of nitrogen decreases with time. (2 marks)
b The volume of N2 eventually remains constant because one (or both) of the reactants has been used up and no more nitrogen gas is being produced.
(1 mark)
4 a As NaOH is added to the HCl, the pH increases very gradually at first, but then increases rapidly when the equivalence point is approaching (equal numbers of mole of NaOH and HCl). The pH then continues to increase gradually as NaOH is in excess.
(3 marks) b The change in pH is 7.2 when the volume of NaOH added is equal to 25 cm3.
(1 mark)
Part C: Data-based questions
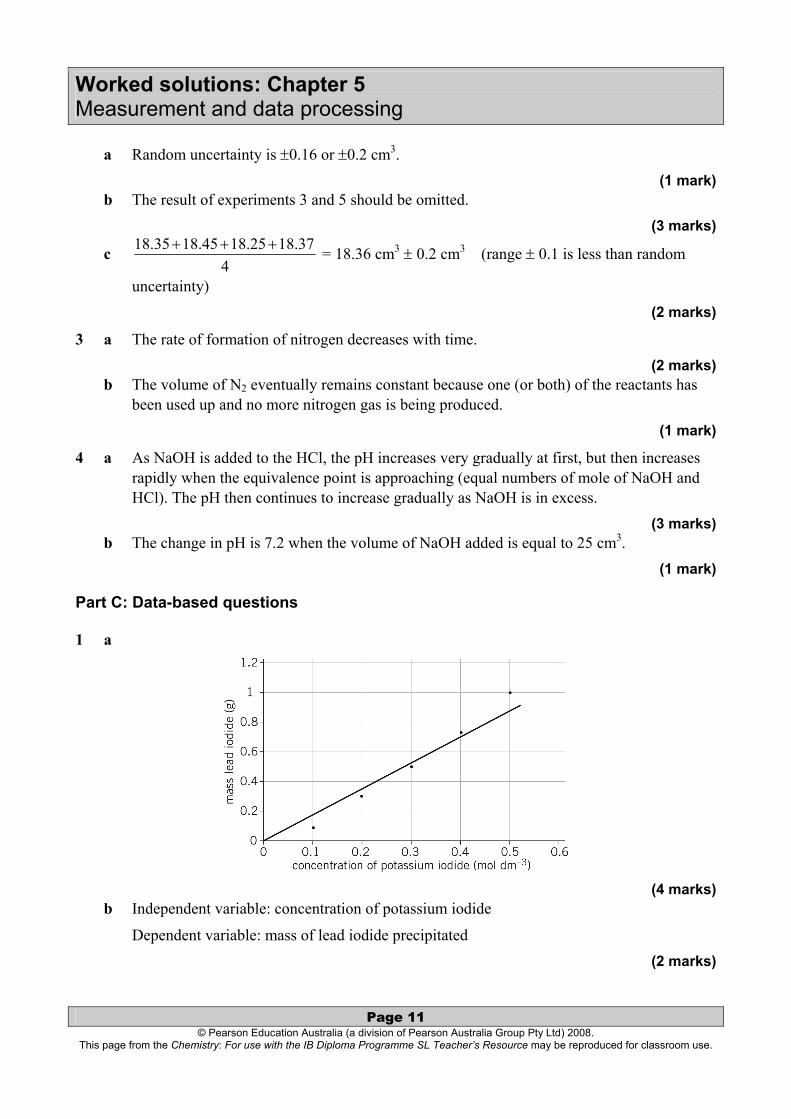
1 a
(4 marks)
b Independent variable: concentration of potassium iodide
Dependent variable: mass of lead iodide precipitated (2 marks)

Worked solutions: Chapter 5 Measurement and data processing
Page 12 © Pearson Education Australia (a division of Pearson Australia Group Pty Ltd) 2008.
This page from the Chemistry: For use with the IB Diploma Programme SL Teacher’s Resource may be reproduced for classroom use.
c The mass of lead iodide precipitated is proportional to the concentration of potassium iodide used.
(1 mark)
2 a
(6 marks)
b Slope (gradient) = runrise = 3100.1
)2.3(15.3−×−
−− = –6320
∴–6320 = –Ea ÷ 8.314
∴ Ea = 52.5 kJ mol–1 (3 marks)
c Percentage difference = 53
5.5253− × 1
100 = 0.9%
(2 marks)
Related Documents