Calhoun: The NPS Institutional Archive Theses and Dissertations Thesis Collection 1991 Work-related injury frequency rates in the Navy Seabees. Van de Voorde, James R. Springfield, Virginia: Available from National Technical Information Service http://hdl.handle.net/10945/28653

Welcome message from author
This document is posted to help you gain knowledge. Please leave a comment to let me know what you think about it! Share it to your friends and learn new things together.
Transcript
Calhoun: The NPS Institutional Archive
Theses and Dissertations Thesis Collection
1991
Work-related injury frequency rates in the Navy Seabees.
Van de Voorde, James R.
Springfield, Virginia: Available from National Technical Information Service
http://hdl.handle.net/10945/28653

BISEBralEBHffigjmHHHsS
HRSmSpENJ
'*"-'-'.'
Eft
HmBHpJME


Work-Related Injury Frequency Rates
in the
Navy Seabees
by
James R. Van de Voordet *
Submitted in partial fulfillment of the
requirements for the degree of
Master of Science in Civil Engineering
University of Washington
1991

Work-Related Injury Frequency Rates
in the
Navy Seabees
by
James R. Van de Voorde
Submitted in partial fulfillment of the
requirements for the degree of
Master of Science in Civil Engineering
University of Washington
1991
T253526

6.1

TABLE OF CONTENTS
Page
List of Tables ii
Section 1. INTRODUCTION 1
Section 2. BACKGROUND ON SEABEES 3
Section 3. RESEARCH METHODOLOGY 6
Section 4. RESULTS 10
Part A: Overall Characterization of the Data 10
Part B: Jobsite Workers 18
Part C: Independent Factors 20
Section 5. SUMMARY AND RECOMMENDATIONS 32
BIBLIOGRAPHY 35
APPENDIX A: Questionnaire 36
APPENDIX B: Histograms of Jobsite Seabees Frequency of Injuries.40
APPENDIX C: Supervisor Correlation Tables 43
APPENDIX D: Definition File 45


Table 1.
Table 2.
Table 3.
Table 4.
Table 5.
Table 6.
Table 7.
Table 8.
Table 9.
Table 10.
Table 11.
Table 12.
Table 13.
Table 14.
Table 15.
Table 16.
II
LIST OF TABLES
Page
Responses by Trade 1
1
Responses by Paygrade 1
1
Responses by Job Description 11
Injury Frequency 17
Responses by Trade for Jobsite Seabees 19
Responses by Paygrade for Jobsite Seabees 19
Injury Frequency Rates for Jobsite Seabees 19
Injury Frequency Rate by Trade for Jobsite Seabees 21
Injury Frequency Rate by Time at Present Command for
Jobsite Seabees 22
Injury Frequency Rate by Time in the Navy for Jobsite
Seabees 23
Correlation Between Supervisor Variable and Injury
Frequency Rates 26
Correlation Between Worker Comfort Variable and Injury
Frequency Rates 27
Correlation Between Assistance Variable and Injury
Frequency Rates 28
Correlation Between Morale Variable and Injury
Frequency Rates 28
Correlation Between Safety Lecture Variable and Injury
Frequency Rates 29
Correlation Between First Aid Case Injury Rates and
Internal Personal Factors 31

SECTION 1: Introduction:
Worker safety is a solemn responsibility of all leaders and
managers. Understanding what safety statistics indicate is only the
beginning of this responsibility. Leaders must be intimately familiar
with the safety records of their organization and be able to identify the
key areas that pose the most risk to their workers. A successful safety
program certainly includes the enforcement of specific safety
standards. However, management often delegates the safety function
to a special staff or division. The role that top management plays in
creating a safe work "environment" is often overlooked. This
"environment" includes not only the physical hazards but also the
organization's overall policies and leadership styles. A "safe"
organization therefore must have more than a safety committee
meeting every month, or a broad organizational policy statement on
safety or even consistent enforcement of safety regulations, i.e., it must
create as integral to its overall management plan, a positive
atmosphere within which good safety programs (consisting of the
above elements) can operate.
Workers in the construction industry face significant hazards to
their safety and well being. While making up only 6% of the U.S.
domestic work force, construction workers account for 21% of worker
fatalities and 11% of all serious injuries (National Safety Council, 1990).
Construction worker safety is not limited to the civilian world. The
armed forces of the United States employ on active duty tens of
thousands of construction workers. This paper will focus on a

particular group of construction workers in the armed forces, the Navy
Seabees. These men and women of the famed Seabees perform many
of the same trades that are found in the civilian construction industry.
A recent study by Navy Lieutenant Timothy Burns (University of
Washington, 1990) addressed construction productivity among Navy
Seabees. His survey of over 600 Seabees also gathered data on safety
factors and injury frequencies. This paper will describe additional
analysis of that data that was performed with the following four
objectives in mind:
•Determine average injury frequency rate for Seabees
•Identify groups within the Seabees that have the highest
injury rates
•Identify other factors that most affect injury rates
•Make recommendations based on these findings for
inclusion in leadership and safety training

SECTION 2: Background Information on Seabees
The following background on Seabees is provided to help the
reader understand the results. The Navy Seabees questioned in this
study are enlisted personnel skilled and trained in construction.
Seabees enter the Navy following high school and often have little or
no construction experience. Upon completion of Navy basic recruit
training or "boot camp", all Seabees attend an entry level training
course ("A" School) applicable to their speciality. These schools are
generally 12 to 16 weeks in length. Construction Electricians complete
4 weeks of basic electrical theory course work prior to their "A" school.
The seven Seabee trades, called "ratings", encompass all
construction trades. Therefore, Seabees do not become specialists
instead they are often cross-trained in other construction skills since
their jobs may carry them to remote locations where more than one
skill is required to carry out their mission. The seven ratings and
areas of expertise are:
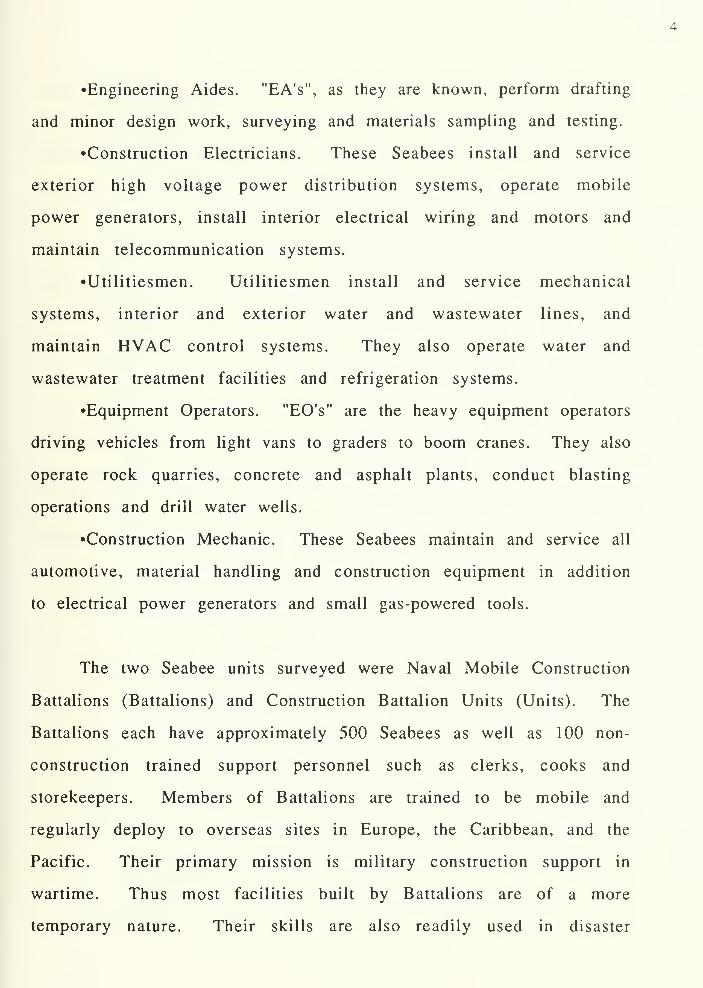
•Builders. These Seabees perform as carpenters, working with
wood and concrete; as masons and as painters.
•Steelworkers. Steelworkers fabricate and erect steel structures,
bend and install reinforcing steel, weld most metals and bend sheet
metal, including ventilation duct work fabrication and installation.
They also are skilled in rigging methods and techniques.

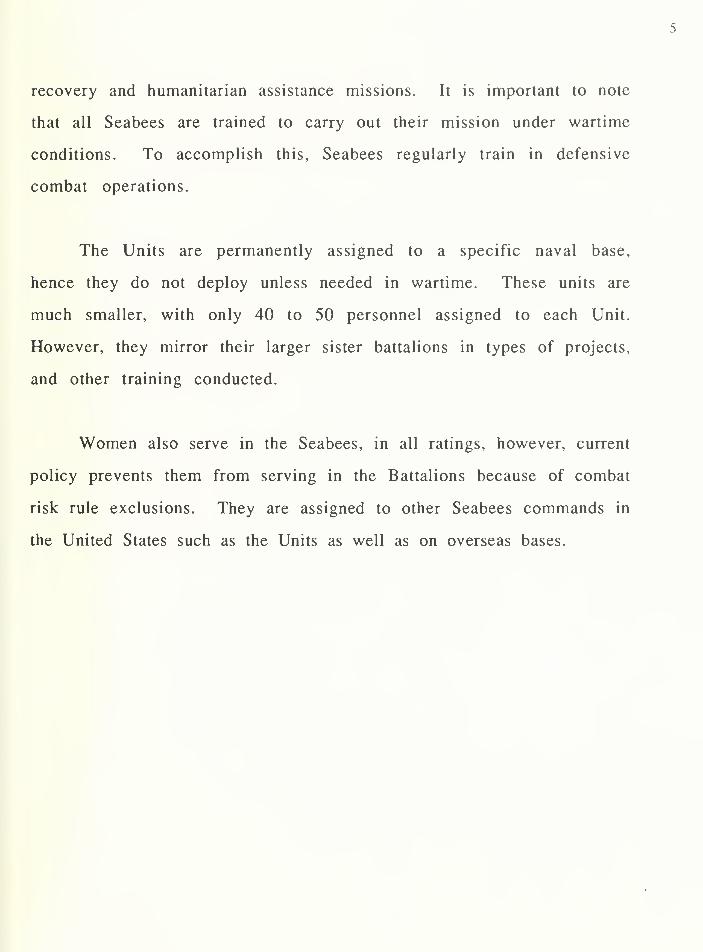
•Engineering Aides. "EA's", as they are known, perform drafting
and minor design work, surveying and materials sampling and testing.
•Construction Electricians. These Seabees install and service
exterior high voltage power distribution systems, operate mobile
power generators, install interior electrical wiring and motors and
maintain telecommunication systems.
•Utilitiesmen. Utilitiesmen install and service mechanical
systems, interior and exterior water and wastewater lines, and
maintain HVAC control systems. They also operate water and
wastewater treatment facilities and refrigeration systems.
•Equipment Operators. "EO's" are the heavy equipment operators
driving vehicles from light vans to graders to boom cranes. They also
operate rock quarries, concrete and asphalt plants, conduct blasting
operations and drill water wells.
•Construction Mechanic. These Seabees maintain and service all
automotive, material handling and construction equipment in addition
to electrical power generators and small gas-powered tools.
The two Seabee units surveyed were Naval Mobile Construction
Battalions (Battalions) and Construction Battalion Units (Units). The
Battalions each have approximately 500 Seabees as well as 100 non-
construction trained support personnel such as clerks, cooks and
storekeepers. Members of Battalions are trained to be mobile and
regularly deploy to overseas sites in Europe, the Caribbean, and the
Pacific. Their primary mission is military construction support in
wartime. Thus most facilities built by Battalions are of a more
temporary nature. Their skills are also readily used in disaster

recovery and humanitarian assistance missions. It is important to note
that all Seabees are trained to carry out their mission under wartime
conditions. To accomplish this, Seabees regularly train in defensive
combat operations.
The Units are permanently assigned to a specific naval base,
hence they do not deploy unless needed in wartime. These units are
much smaller, with only 40 to 50 personnel assigned to each Unit.
However, they mirror their larger sister battalions in types of projects,
and other training conducted.
Women also serve in the Seabees, in all ratings, however, current
policy prevents them from serving in the Battalions because of combat
risk rule exclusions. They are assigned to other Seabees commands in
the United States such as the Units as well as on overseas bases.

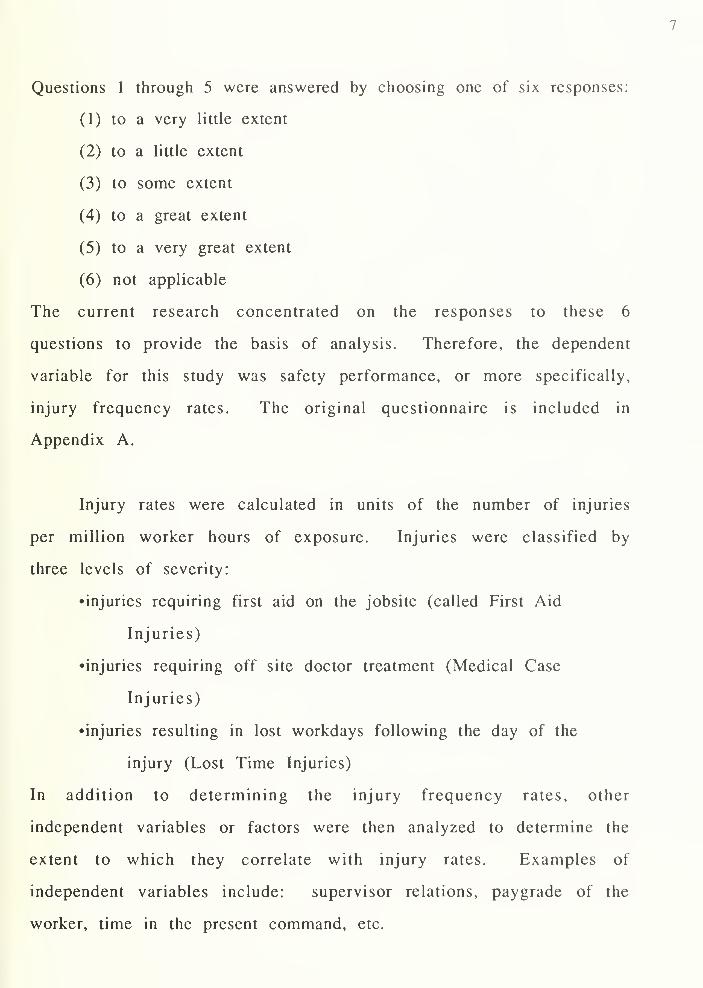
SECTION 3: Research Methodology:
The data used in this current study was gathered by Lieutenant
Burns (University of Washington, 1990). The method used to collect
the data was a mail survey. Questionnaires were sent to the eight
active duty Battalions and to eight smaller commands, called Units.
1000 questionnaires were distributed: 100 each to the Battalions and
25 each to the Units. A total of 618 responses were received. The
principle focus of Lieutenant Burns' research was to identify primary
motivational and productivity factors among Seabees. There were
however also 6 questions regarding worker safety:
1. Do safety regulations restrict your ability to work
effectively?
2. Do you understand the need for safety awareness on
the projects?
3. Do you feel that you work in a safety conscious work
environment?
4. Are daily safety lectures effective?
5. Have you observed any major safety violations that
were unreported?
6. Since you have been in your present unit/command,
how many injuries have you received that:
a. Required first aid treatment only?
b. Required a doctor's attention?
c. Were lost time accidents?

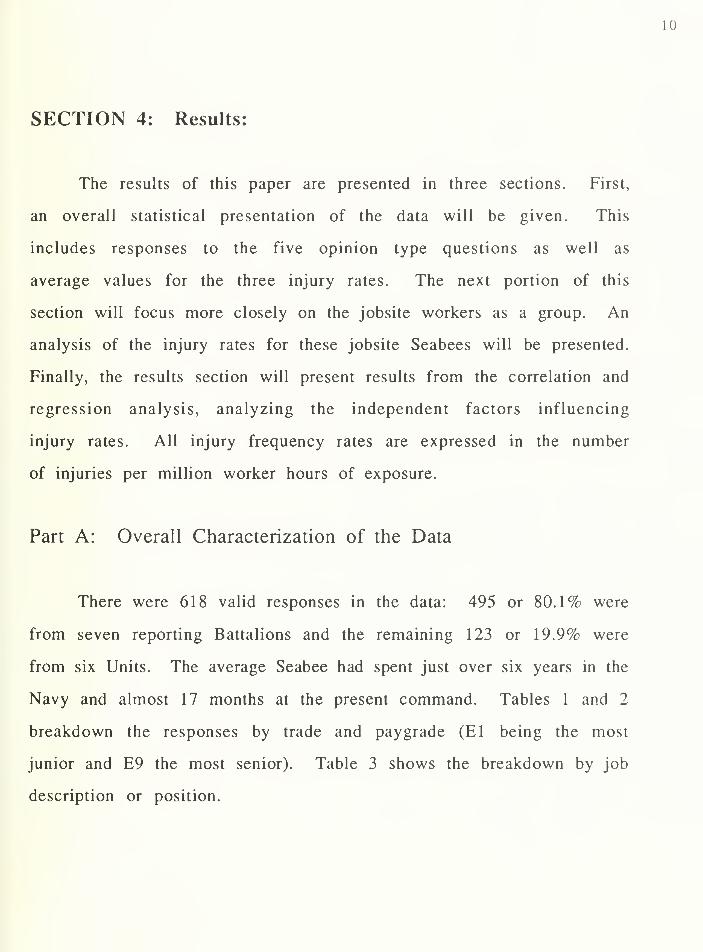
Questions 1 through 5 were answered by choosing one of six responses:
(1) to a very little extent
(2) to a little extent
(3) to some extent
(4) to a great extent
(5) to a very great extent
(6) not applicable
The current research concentrated on the responses to these 6
questions to provide the basis of analysis. Therefore, the dependent
variable for this study was safety performance, or more specifically,
injury frequency rates. The original questionnaire is included in
Appendix A.
Injury rates were calculated in units of the number of injuries
per million worker hours of exposure. Injuries were classified by
three levels of severity:
•injuries requiring first aid on the jobsite (called First Aid
Injuries)
•injuries requiring off site doctor treatment (Medical Case
Injuries)
•injuries resulting in lost workdays following the day of the
injury (Lost Time Injuries)
In addition to determining the injury frequency rates, other
independent variables or factors were then analyzed to determine the
extent to which they correlate with injury rates. Examples of
independent variables include: supervisor relations, paygrade of the
worker, time in the present command, etc.


The survey responses provided information on the number of
each type of injury suffered while at the present command, how long
the worker has been at the present command, and the number of
hours in an average workweek (determined to be 49.2 for the
Battalions and 41.9 for the Units). It was assumed that each Seabee
worked 48 weeks each year as service members are entitled to 30
days of "leave" or vacation each year. The injury frequency rate was
determined by the following formula:
Rate in injuries per million worker hours of exposure =
(number of injuries while at present command) times 1,000,000 hours
per million worker hours divided by (number of years at present
command times 48 weeks per year times the hours worked each
week). For example, a Seabee assigned to a Unit had two injuries in 12
months at the Unit. This translates to an injury rate of 994 injuries per
million worker hours of exposure (2 x 1,000,000)/(1 x 48 x 41.9).
Statistical analysis was conducted assuming normally distributed
data. The specific computer software utilized was "Statistical Package
for the Social Sciences" or SPSS. This is the same program used in
Lieutenant Burns' study. In addition to basic frequency and mean
calculations, both rank correlation and multiple linear regression
analyses were used to determine the relationships, if any, between
injury rates (the dependent variable) and other independent variables
provided by the survey responses.


Independent Factors
The independent variables or factors can be grouped into three
broad categories. The first is personal data, consisting of the following
specific factors:
•worker trade, called rating in the Seabees
•pay scale level, referred to as paygrade
•tenure of the Seabee in the Navy
•tenure of the Seabee in the present command
•position of Seabee; either a project manager, crew
member or leader or staff/support
•organization type; either a Battalion or a Unit
The second category of independent factors were those relating
to productivity:
•crew and fellow worker relations -stress
•tools and equipment used "training provide
•substance abuse 'personal problem
•communication -physical fitness
•relations with supervisor -type of work
•location of work
The third factor category were motivational factors including:
•rewards "camaraderie -money
•benefits -job security -personal goals
•recognition 'advancement -job satisfaction

10
SECTION 4: Results:
The results of this paper are presented in three sections. First,
an overall statistical presentation of the data will be given. This
includes responses to the five opinion type questions as well as
average values for the three injury rates. The next portion of this
section will focus more closely on the jobsite workers as a group. An
analysis of the injury rates for these jobsite Seabees will be presented.
Finally, the results section will present results from the correlation and
regression analysis, analyzing the independent factors influencing
injury rates. All injury frequency rates are expressed in the number
of injuries per million worker hours of exposure.
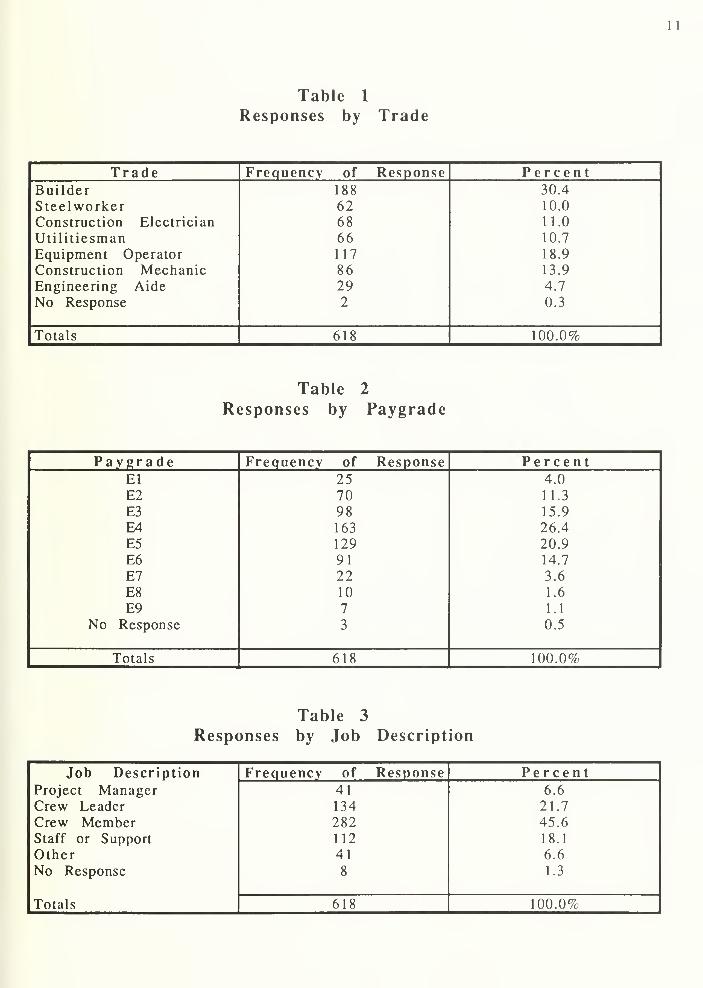
Part A: Overall Characterization of the Data
There were 618 valid responses in the data: 495 or 80.1% were
from seven reporting Battalions and the remaining 123 or 19.9% were
from six Units. The average Seabee had spent just over six years in the
Navy and almost 17 months at the present command. Tables 1 and 2
breakdown the responses by trade and paygrade (El being the most
junior and E9 the most senior). Table 3 shows the breakdown by job
description or position.

1
1
Table 1
Responses by Trade
Trade Frequency of Response PercentBuilder 188 30.4
Steelworker 62 10.0
Construction Electrician 68 11.0
Utilitiesman 66 10.7
Equipment Operator 117 18.9
Construction Mechanic 86 13.9
Engineering Aide 29 4.7
No Response 2 0.3
Totals 618 100.0%
Table 2
Responses by Paygrade
Pay grade Frequency of Response PercentEl 25 4.0
E2 70 11.3
E3 98 15.9
E4 163 26.4
E5 129 20.9
E6 91 14.7
E7 22 3.6
E8 10 1.6
E9 7 1.1
No Response 3 0.5
Totals 618 100.0%
Table 3
Responses by Job Description
Job Description
Project ManagerFrequency of Response Percent
41 6.6
Crew Leader 134 21.7
Crew Member 282 45.6
Staff or Support 112 18.1
Other 41 6.6
No Response
Totals
8 1.3
618 100.09;

12
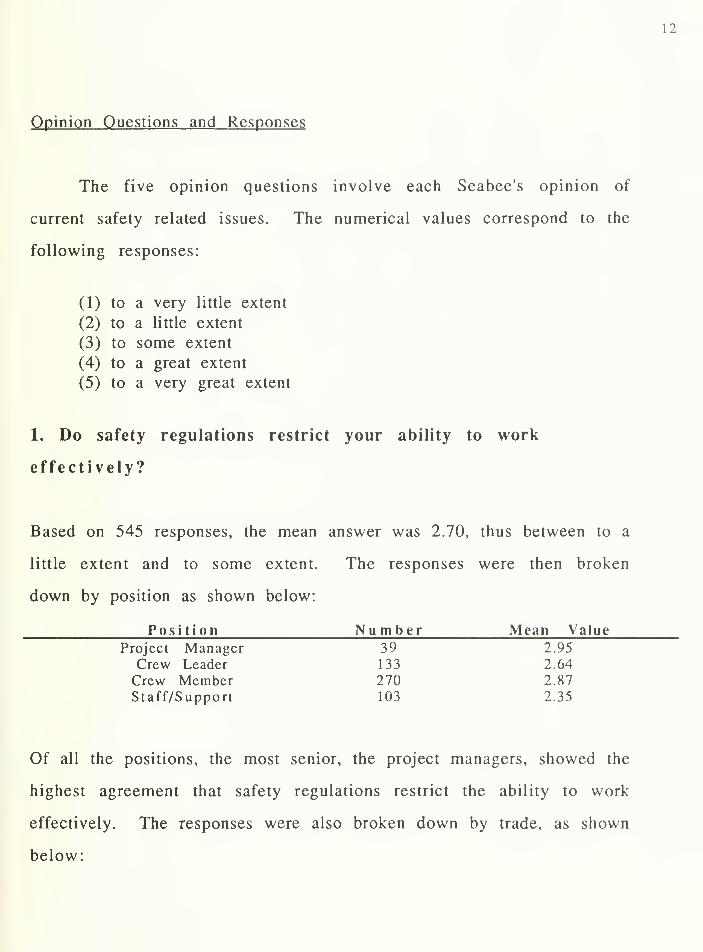
Opinion Questions and Responses
The five opinion questions involve each Seabee's opinion of
current safety related issues. The numerical values correspond to the
following responses:
(1) to a very little extent
(2) to a little extent
(3) to some extent
(4) to a great extent
(5) to a very great extent
1. Do safety regulations restrict your ability to work
effectively?
Based on 545 responses, the mean answer was 2.70, thus between to a
little extent and to some extent. The responses were then broken
down by position as shown below:
Position Number Mean Value
Project Manager 39 2.95
Crew Leader 133 2.64
Crew Member 270 2.87
Staff/Support 103 2.35
Of all the positions, the most senior, the project managers, showed the
highest agreement that safety regulations restrict the ability to work
effectively. The responses were also broken down by trade, as shown
below:

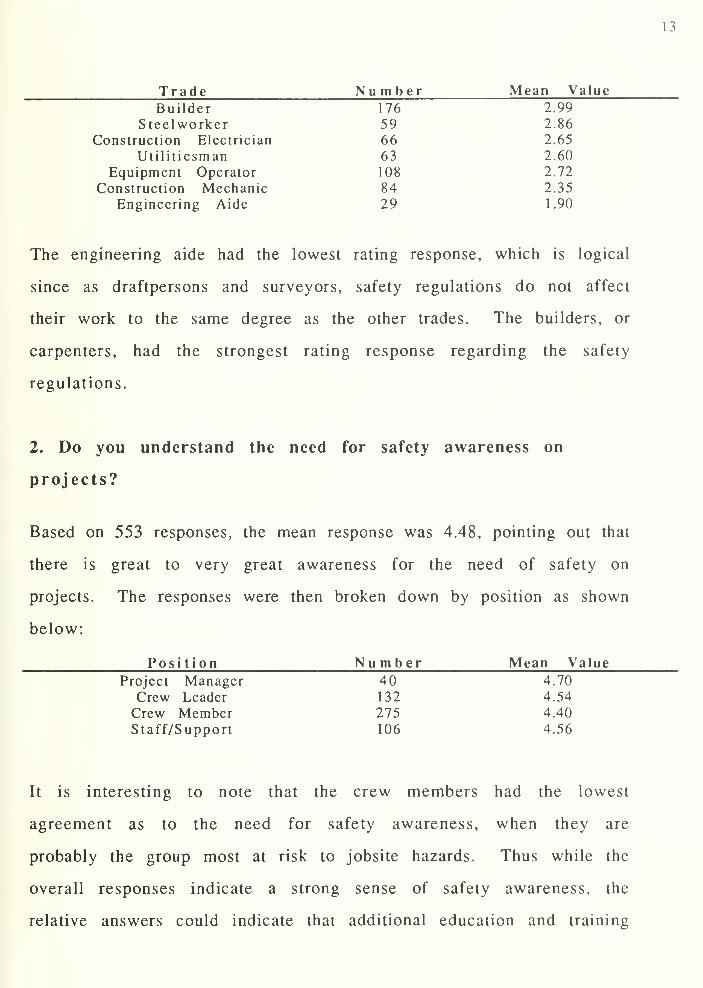
1 3
Trade NumberBuilder 176
Steelworker 59Construction Electrician 66
Utilitiesman 63Equipment Operator 108
Construction Mechanic 84Engineering Aide 29
Mean Value2.99
2.86
2.65
2.60
2.72
2.35
1.90
The engineering aide had the lowest rating response, which is logical
since as draftpersons and surveyors, safety regulations do not affect
their work to the same degree as the other trades. The builders, or
carpenters, had the strongest rating response regarding the safety
regulations.
2. Do you understand the need for safety awareness on
projects?
Based on 553 responses, the mean response was 4.48, pointing out that
there is great to very great awareness for the need of safety on
projects. The responses were then broken down by position as shown
below:
Position Number Mean Value
Project Manager 40 4.70
Crew Leader 132 4.54
Crew Member 275 4.40
Staff/Support 106 4.56
It is interesting to note that the crew members had the lowest
agreement as to the need for safety awareness, when they are
probably the group most at risk to jobsite hazards. Thus while the
overall responses indicate a strong sense of safety awareness, the
relative answers could indicate that additional education and training

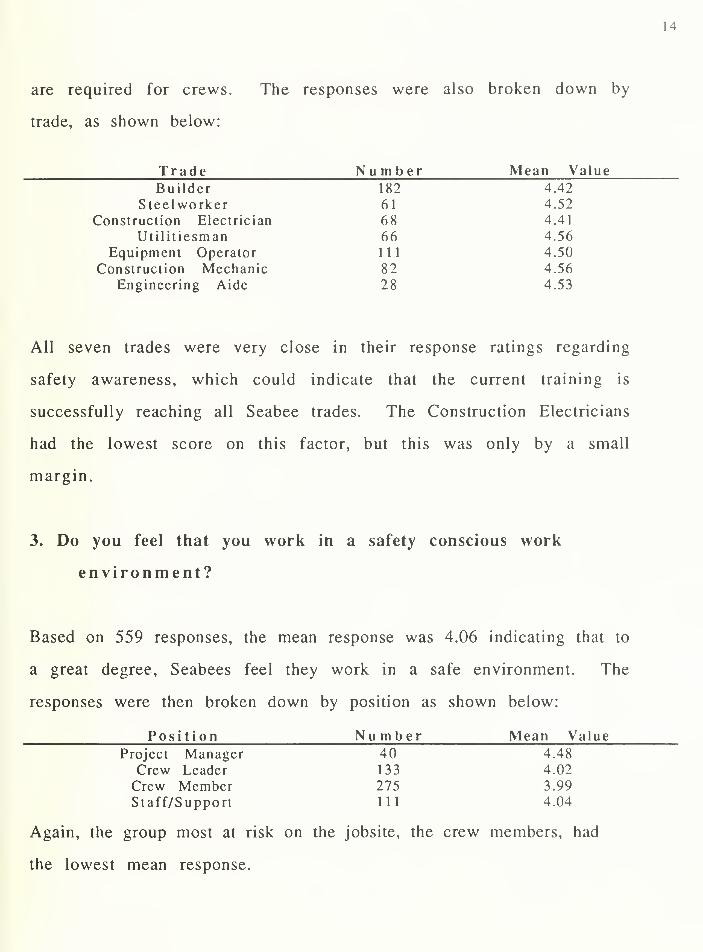
14
are required for crews. The responses were also broken down by
trade, as shown below:
Trade NumberBuilder 182
Steelworker 61
Construction Electrician 68Utilitiesman 66
Equipment Operator 111
Construction Mechanic 82Engineering Aide 28
Mean Value4.42
4.52
4.41
4.56
4.50
4.56
4.53
All seven trades were very close in their response ratings regarding
safety awareness, which could indicate that the current training is
successfully reaching all Seabee trades. The Construction Electricians
had the lowest score on this factor, but this was only by a small
margin.
3. Do you feel that you work in a safety conscious work
environment?
Based on 559 responses, the mean response was 4.06 indicating that to
a great degree, Seabees feel they work in a safe environment. The
responses were then broken down by position as shown below:
Posi tion Number Mean Value
Project Manager 40 4.48
Crew Leader 133 4.02
Crew Member 275 3.99
Staff/Support 111 4.04
Again, the group most at risk on the jobsite, the crew members, had
the lowest mean response.


15
The responses were also broken down by trade, as shown below:
Trade N umberBuilder 184
Steelworker 61
Construction Electrician 68Utilitiesman 66
Equipment Operator 111
Construction Mechanic 85Engineering Aide 29
Mean Value4.14
4.13
3.81
4.06
4.02
4.06
4.14
Of all the trades, the construction electrician had the only mean value
below 4.00 indicating the least secure feeling of safety on the jobsite.
Electricians know that accidents or mistakes in their line of work can
be fatal. Thus, their response could be indicative of their particular
trade. It is interesting to note however, that this trade had the lowest
opinion of the need for safety awareness on question 2. The builders
on the other hand, while answering earlier that regulations restrict
their work do show that they believe they work in a safe environment.
4. Are daily safety lectures effective?
Based on 546 responses, the mean was 3.39 indicating that between to
some and to a great extent that the daily safety lectures conducted by
the commands are effective. The responses were then broken down by
position as shown below:
Posi t i on Number Mean Value
Project Manager 39 3.95
Crew Leader 132 3.31
Crew Member 269 3.30
Staff/Support 106 3.48

If)
Trade N umberBuilder 177
Steelworker 60Construction Electrician 67
Utilitiesman 65Equipment Operator 108
Construction Mechanic 83Engineering Aide 26
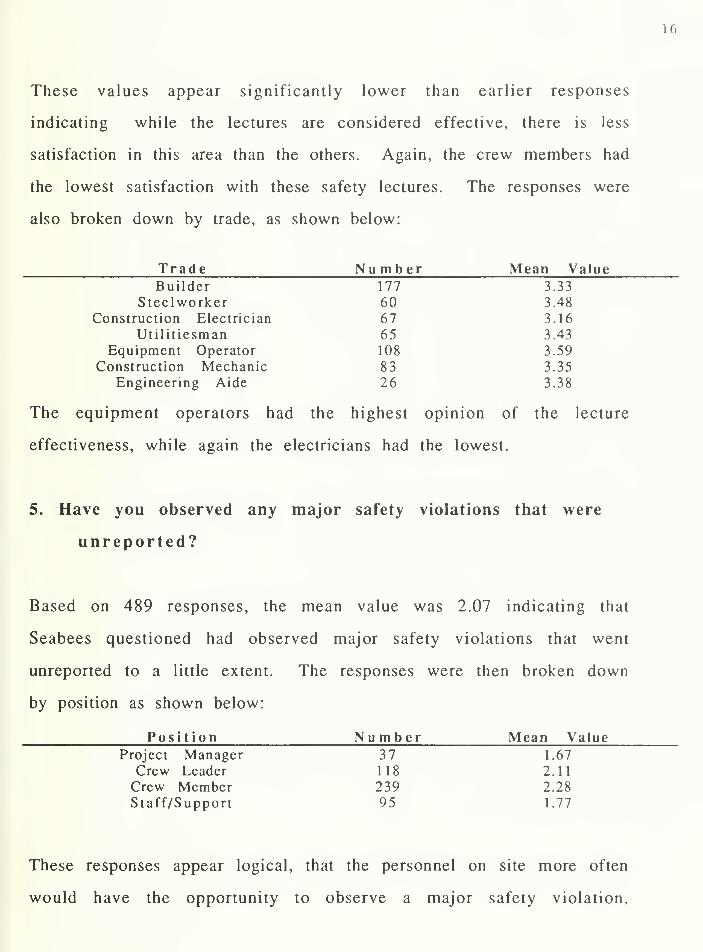
These values appear significantly lower than earlier responses
indicating while the lectures are considered effective, there is less
satisfaction in this area than the others. Again, the crew members had
the lowest satisfaction with these safety lectures. The responses were
also broken down by trade, as shown below:
Mean Value3.33
3.48
3.16
3.43
3.59
3.35
3.38
The equipment operators had the highest opinion of the lecture
effectiveness, while again the electricians had the lowest.
5. Have you observed any major safety violations that were
unreported?
Based on 489 responses, the mean value was 2.07 indicating that
Seabees questioned had observed major safety violations that went
unreported to a little extent. The responses were then broken down
by position as shown below:
Posi tion
Project ManagerCrew LeaderCrew MemberStaff/Support
These responses appear logical, that the personnel on site more often
would have the opportunity to observe a major safety violation,
Number Mean Value37 1.67
118 2.11
239 2.28
95 1.77


17
although it is encouraging that the values are as low as they are. The
responses were also broken down by trade, as shown below:
Trade NumberBuilder 158
Steelworker 52Construction Electrician 62
Utilitiesman 58Equipment Operator 102
Construction Mechanic 77Engineering Aide 20
Mean Value1.97
1.98
2.17
2.13
2.37
1.80
2.00
The equipment operators had the highest value for observing safety
violations, and yet they also had the highest opinion of the
effectiveness of daily safety lectures. It is possible that they believe
the heavy equipment lectures are effective and they think other trades
around them allow major violations to go unreported. The construction
electricians again gave a higher rating response. Combined with earlier
questions, this appears to indicate a weakness in the safety knowledge
and training among the electricians.
Injury Frequency Rates
The overall injury frequency rates for the 618 cases are depicted in
Table 4.
Table 4
Injury Frequency Rates
Injury Type Number Injury Rate
First Aid CaseMedical Case
Lost Time Case
614603585
608.7
368.8
132.8

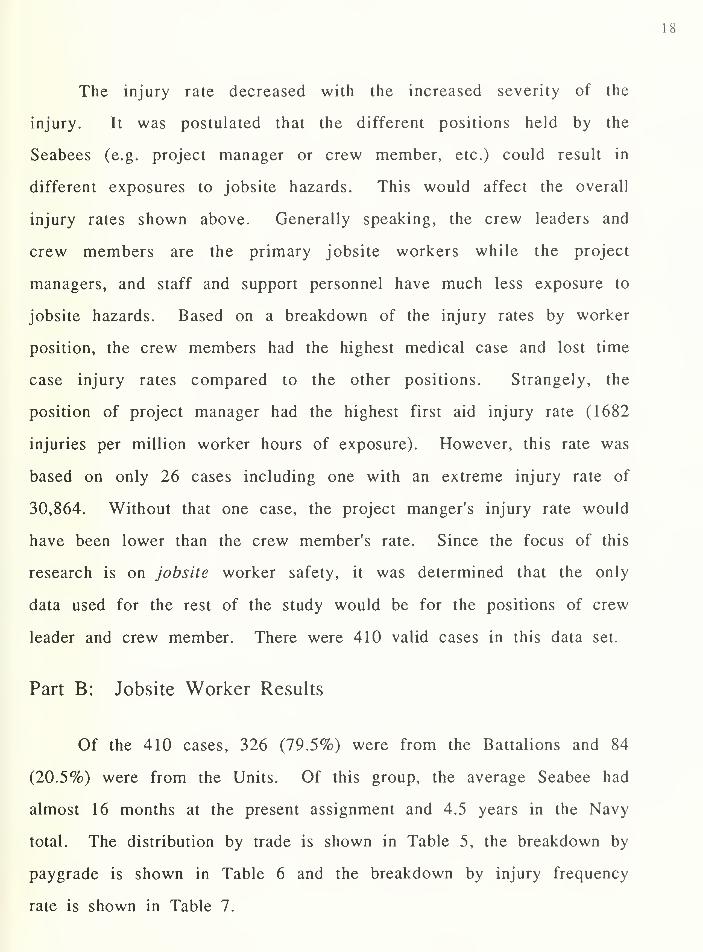
The injury rate decreased with the increased severity of the
injury. It was postulated that the different positions held by the
Seabees (e.g. project manager or crew member, etc.) could result in
different exposures to jobsite hazards. This would affect the overall
injury rates shown above. Generally speaking, the crew leaders and
crew members are the primary jobsite workers while the project
managers, and staff and support personnel have much less exposure to
jobsite hazards. Based on a breakdown of the injury rates by worker
position, the crew members had the highest medical case and lost time
case injury rates compared to the other positions. Strangely, the
position of project manager had the highest first aid injury rate (1682
injuries per million worker hours of exposure). However, this rate was
based on only 26 cases including one with an extreme injury rate of
30,864. Without that one case, the project manger's injury rate would
have been lower than the crew member's rate. Since the focus of this
research is on jobsite worker safety, it was determined that the only
data used for the rest of the study would be for the positions of crew
leader and crew member. There were 410 valid cases in this data set.
Part B: Jobsite Worker Results
Of the 410 cases, 326 (79.5%) were from the Battalions and 84
(20.5%) were from the Units. Of this group, the average Seabee had
almost 16 months at the present assignment and 4.5 years in the Navy
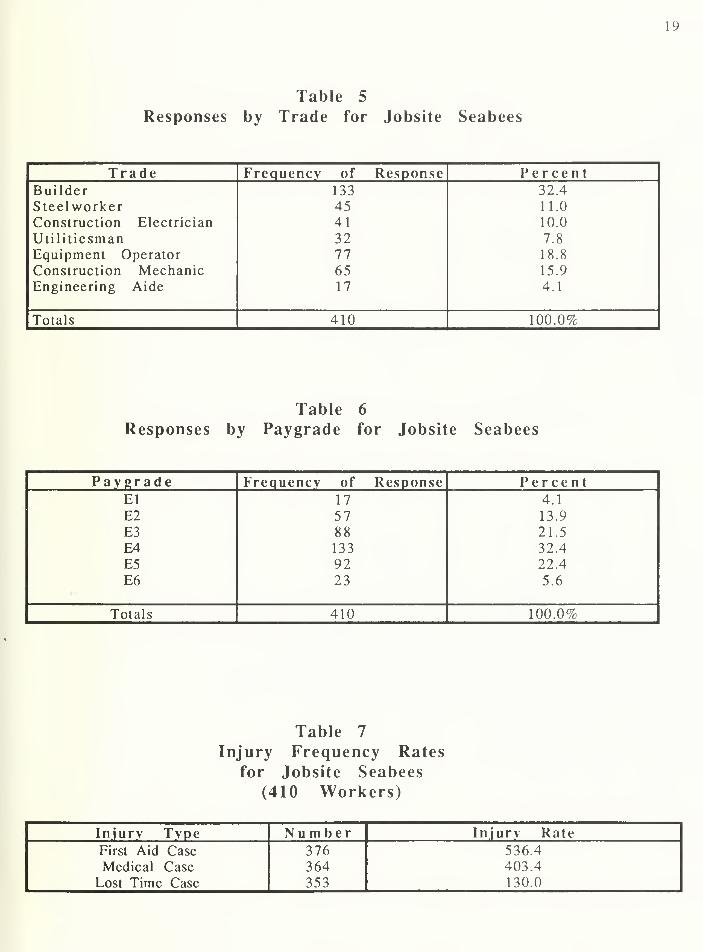
total. The distribution by trade is shown in Table 5, the breakdown by
paygrade is shown in Table 6 and the breakdown by injury frequency
rate is shown in Table 7.

19
Table 5
Responses by Trade for Jobsite Seabees
Trade Frequency of Response PercentBuilderSteelworkerConstruction Electrician
UtilitiesmanEquipment Operator
Construction MechanicEngineering Aide
133
4541
32776517
32.4
11.0
10.0
7.8
18.8
15.9
4.1
Totals 410 100.0%
Table 6
Responses by Paygrade for Jobsite Seabees
Pay grade Frequency of Response PercentEl 17 4.1
E2 57 13.9
E3 88 21.5
E4 133 32.4
E5 92 22.4
E6 23 5.6
Totals 410 ioo.o r;
Table 7
Injury Frequency Rates
for Jobsite Seabees
(410 Workers)
Injury Type Number Injury Rate
First Aid Case
Medical CaseLost Time Case
376364353
536.4
403.4130.0


20
These injury frequency rates compare reasonably with those of
all the Seabees surveyed, as shown in Table 4. It had been expected
that these rates would be higher. When crew leaders are excluded
leaving just the crew members, the injury frequency rates are : 625 for
First Aid cases, 532 for Medical cases and 156 for Lost Time cases
which are all higher than the overall rates, supporting the decision to
focus on crew data. The crew leader data was retained since they are
similar to working foremen on the jobsite.
Part C: Independent Factors Influencing Injury Rates
The three categories of independent variables or factors will now
be analyzed in terms of their association with the injury frequency
rates for jobsite workers. First, some general observations will be
made regarding the personal type factors. Then the productivity and
motivational factors proposed by Lieutenant Burns will be discussed.
Correlation analysis and regression analysis were used to determine
independent factor relationships with injury rates.
The two different command types were first compared for injury
rates to detect any differences. The First Aid injury rate was virtually
identical (534 for Battalions and 546 for the Units). However, for both
Medical and Lost Time cases, the Units had higher injury rates than the
Battalions (although neither were significant at the p < .05 level).
These rates were 498 (Medical) and 169 (Lost Time) for the Units, and
381 (Medical) and 120 (Lost Time) for the Battalions. As the smaller
Units have but one junior ranking commissioned officer in charge and

21
usually only three senior enlisted Seabees, there might be less
command expertise and safety training compared to the Battalions
with 20 officers, many chief petty officers and a full time senior
enlisted Seabee devoted to safety. The safety programs are usually
more formal and sophisticated in the Battalions.
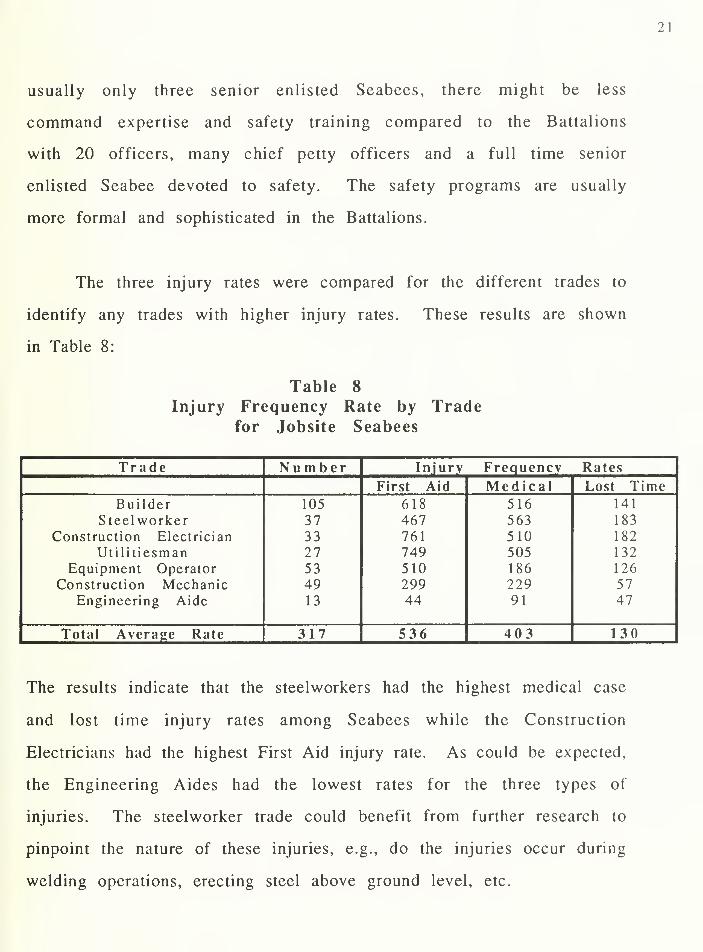
The three injury rates were compared for the different trades to
identify any trades with higher injury rates. These results are shown
in Table 8:
Table 8
Injury Frequency Rate by Tradefor Jobsite Seabees
Trade Number Injury Frequency Rates
First Aid Medical Lost TimeBuilder 105 618 516 141
Steelworker 37 467 563 183
Construction Electrician 33 761 510 182
Utilitiesman 27 749 505 132
Equipment Operator 53 510 186 126
Construction Mechanic 49 299 229 57
Engineering Aide 13 44 91 47
Total Average Rate 317 536 403 130
The results indicate that the steelworkers had the highest medical case
and lost time injury rates among Seabees while the Construction
Electricians had the highest First Aid injury rate. As could be expected,
the Engineering Aides had the lowest rates for the three types of
injuries. The steelworker trade could benefit from further research to
pinpoint the nature of these injuries, e.g., do the injuries occur during
welding operations, erecting steel above ground level, etc.

22
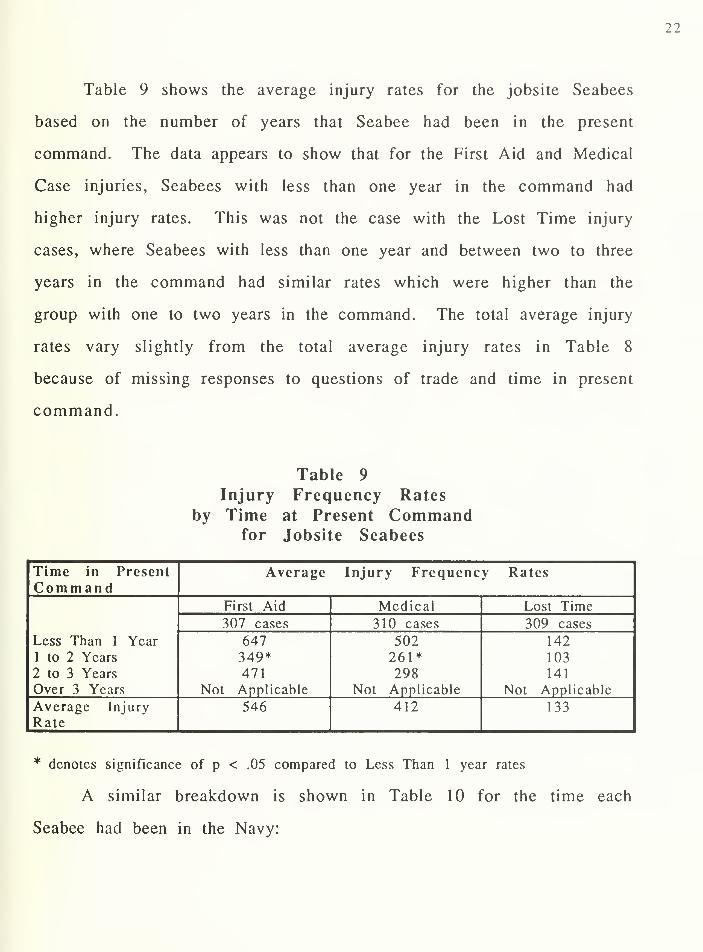
Table 9 shows the average injury rates for the jobsite Seabees
based on the number of years that Seabee had been in the present
command. The data appears to show that for the First Aid and Medical
Case injuries, Seabees with less than one year in the command had
higher injury rates. This was not the case with the Lost Time injury
cases, where Seabees with less than one year and between two to three
years in the command had similar rates which were higher than the
group with one to two years in the command. The total average injury
rates vary slightly from the total average injury rates in Table 8
because of missing responses to questions of trade and time in present
command.
Table 9
Injury Frequency Rates
by Time at Present Commandfor Jobsite Seabees
Time in PresentCommand
Average Injury Frequency Rates
Less Than 1 Year1 to 2 Years
2 to 3 Years
Over 3 Years
First Aid Medical Lost Time307 cases 310 cases 309 cases
647349*471
Not Applicable
502261*298
Not Applicable
142
103
141
Not Applicable
Average Injury
Rate546 412 133
* denotes significance of p < .05 compared to Less Than 1 year rates
A similar breakdown is shown in Table 10 for the time each
Seabee had been in the Navy:

23
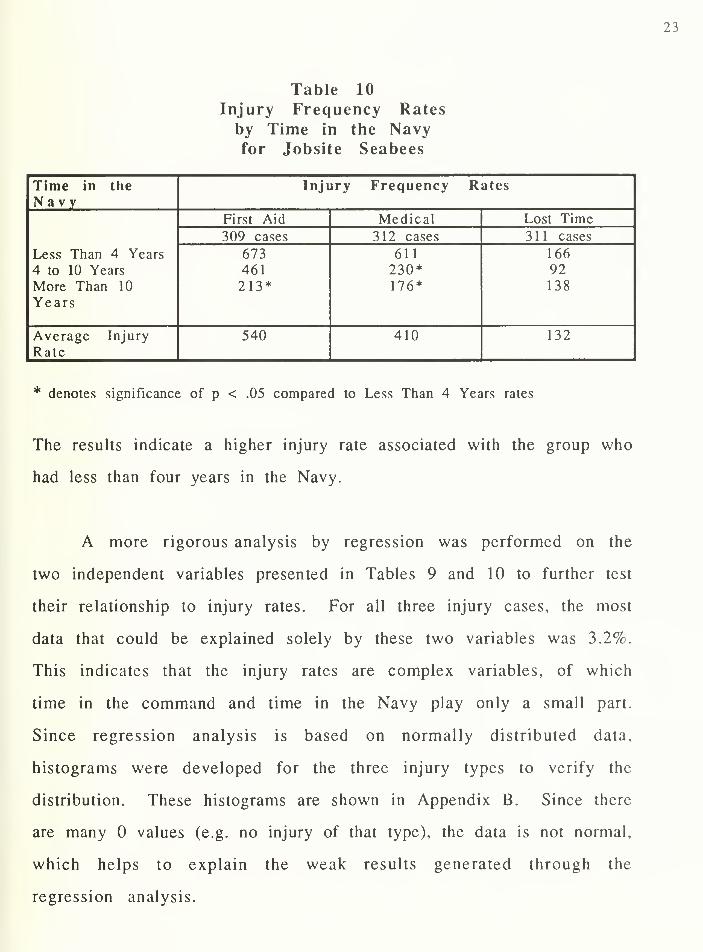
Table 10
Injury Frequency Rates
by Time in the Navyfor Jobsite Seabees
Time in the
NavyInjury Frequency Rates
Less Than 4 Years
4 to 10 Years
More Than 10
Years
First Aid Medical Lost Time
309 cases 312 cases 311 cases
673461213*
611230*176*
166
92138
Average Injury
Rate540 410 132
* denotes significance of p < .05 compared to Less Than 4 Years rates
The results indicate a higher injury rate associated with the group who
had less than four years in the Navy.
A more rigorous analysis by regression was performed on the
two independent variables presented in Tables 9 and 10 to further test
their relationship to injury rates. For all three injury cases, the most
data that could be explained solely by these two variables was 3.2%.
This indicates that the injury rates are complex variables, of which
time in the command and time in the Navy play only a small part.
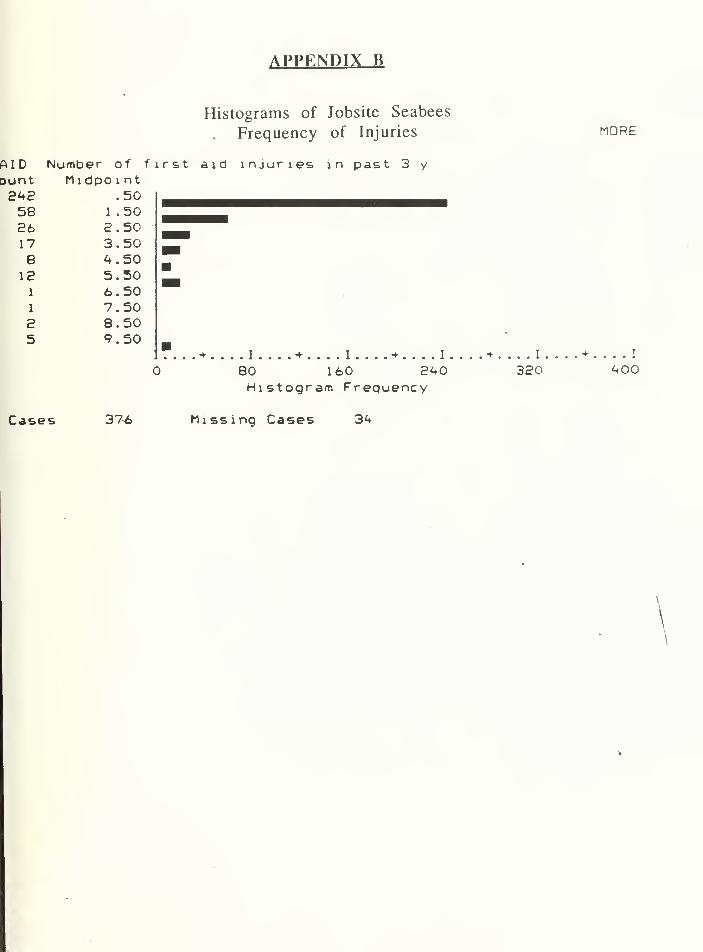
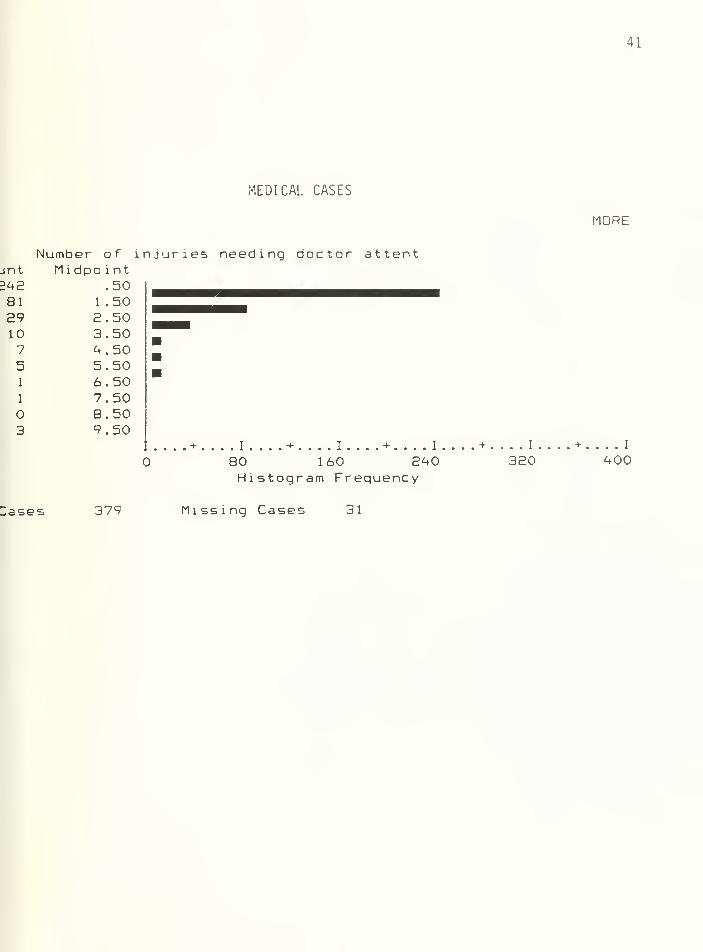
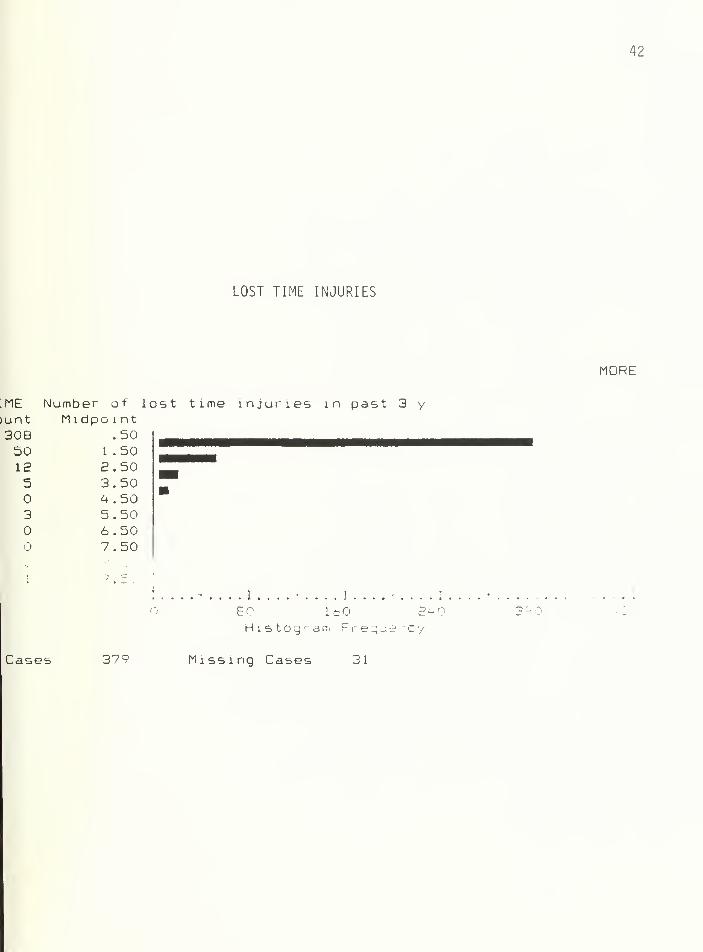
Since regression analysis is based on normally distributed data,
histograms were developed for the three injury types to verify the
distribution. These histograms are shown in Appendix B. Since there
are many values (e.g. no injury of that type), the data is not normal,
which helps to explain the weak results generated through the
regression analysis.


24
Productivity and Motivational Factors
The 140 plus independent variables used in Lieutenant Burns' study
were then tested against the dependent variables, the three types of
injury rates. This testing was based on the non-parametric correlation
method. This was done for First Aid, Medical Case and Lost Time
injuries. Of the 140 plus variables, 11 relationships were statistically
significant at the p < .001 level. The following variables were found to
be related to better or lower injury frequency rates:
•Supervisor helps with personal problems
•Supervisor sets a good example on and off the job
•Supervisor praises workers
•Supervisor is respected by workers
•Worker would like to work for the Supervisor again
•Supervisor considers suggestions from crew
•Supervisor is a good motivator
•Worker is comfortable in work environment
•Daily safety lectures are effective
•Adequate assistance is provided by unit for personal problems
•Morale is generally good in work environment
Of the above variables seven relate to the supervisor. The
correlation coefficients of these variables range from -0.18 to -0.22
with a p < .001. Based on this, and to simplify the display of the
results, the responses for these seven supervisory variables were
combined into a single variable: "Supervisor has good people skills".

25
This variable was created by summing the weighted mean injury rates
for the seven variables and dividing by seven to find the mean injury
rates of the new variable. This reduced the number of independent
variables of interest to five in number. The following tables
summarize the correlations found between the independent variables
and the three injury rates. Appendix B contains the individual tables
for the seven supervisory factors. The five possible responses (see
page 12) were condensed into two groups. The first group combined
the numerical responses 1, 2 and 3. This combined response covers
answers from To a Very Little Extent, To a Little Extent and To Some
Extent. Similarly, the numerical responses 4 and 5 were combined so
the new response includes answers: To a Great Extent and To a Very
Great Extent. The level of significance for the correlation of the
independent variable with each injury rate is also presented. The
entry of "n.s." (not significant) indicates that the level of significance is
greater than .01.
Variable Tested: Supervisor has good people skills.
This variable combined the seven supervisor-related variables
identified by the correlation analysis. Included are whether or not the
supervisor: sets a good example to the workers, praises the workers,
helps with personal problems, is respected by the workers, considers
suggestions from the crew and is a good motivator and whether the
workers would like to work for the supervisor again. Table 1 1 shows
the correlation results.

26
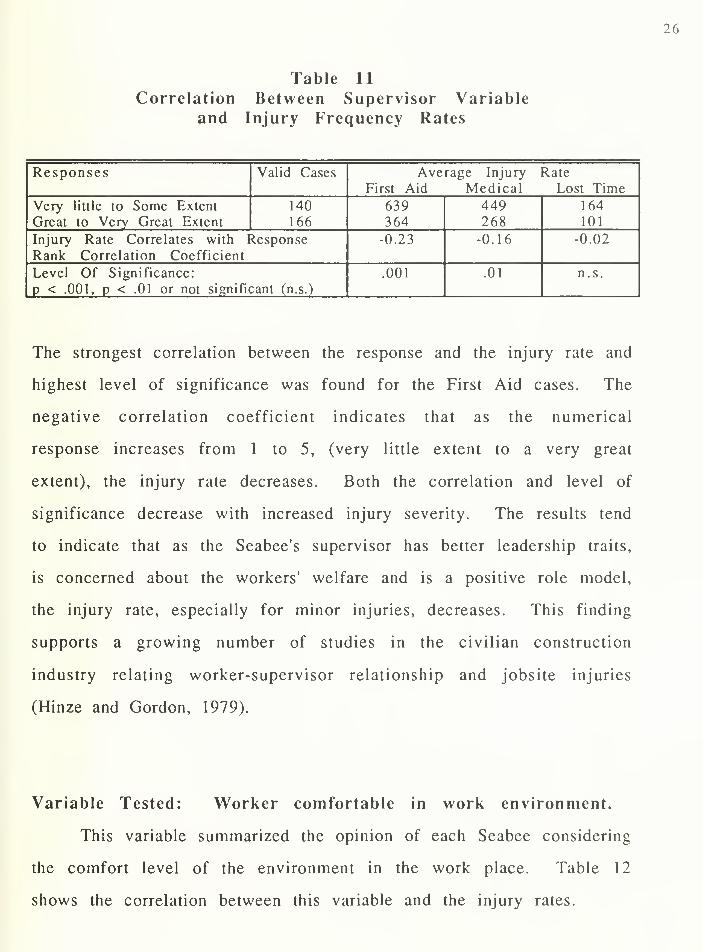
Table 11
Correlation Between Supervisor Variableand Injury Frequency Rates
Responses Valid Cases Average Injury Rate
First Aid Medical Lost Time
Very little to Some Extent
Great to Very Great Extent
140
166639364
449268
164
101
Injury Rate Correlates with ResponseRank Correlation Coefficient
-0.23 -0.16 -0.02
Level Of Significance:
p < .001, p < .01 or not significant (n.s.)
.001 .01 n.s.
The strongest correlation between the response and the injury rate and
highest level of significance was found for the First Aid cases. The
negative correlation coefficient indicates that as the numerical
response increases from 1 to 5, (very little extent to a very great
extent), the injury rate decreases. Both the correlation and level of
significance decrease with increased injury severity. The results tend
to indicate that as the Seabee's supervisor has better leadership traits,
is concerned about the workers' welfare and is a positive role model,
the injury rate, especially for minor injuries, decreases. This finding
supports a growing number of studies in the civilian construction
industry relating worker-supervisor relationship and jobsite injuries
(Hinze and Gordon, 1979).
Variable Tested: Worker comfortable in work environment.
This variable summarized the opinion of each Seabee considering
the comfort level of the environment in the work place. Table 12
shows the correlation between this variable and the injury rates.

27
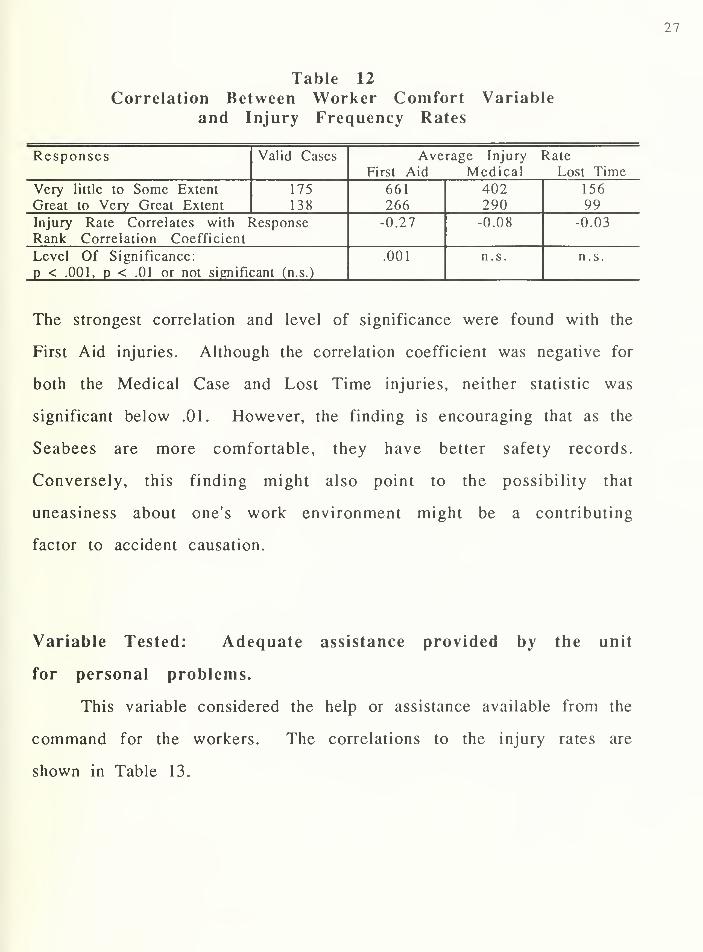
Table 12
Correlation Between Worker Comfort Variable
and Injury Frequency Rates
Responses Valid Cases Average Injury Rate
First Aid Medical Lost Time
Very little to Some Extent
Great to Very Great Extent
175
138
661
266402290
156
99
Injury Rate Correlates with ResponseRank Correlation Coefficient
-0.27 -0.08 -0.03
Level Of Significance:
p < .001, p < .01 or not significant (n.s.)
.001 n.s. n.s.
The strongest correlation and level of significance were found with the
First Aid injuries. Although the correlation coefficient was negative for
both the Medical Case and Lost Time injuries, neither statistic was
significant below .01. However, the finding is encouraging that as the
Seabees are more comfortable, they have better safety records.
Conversely, this finding might also point to the possibility that
uneasiness about one's work environment might be a contributing
factor to accident causation.
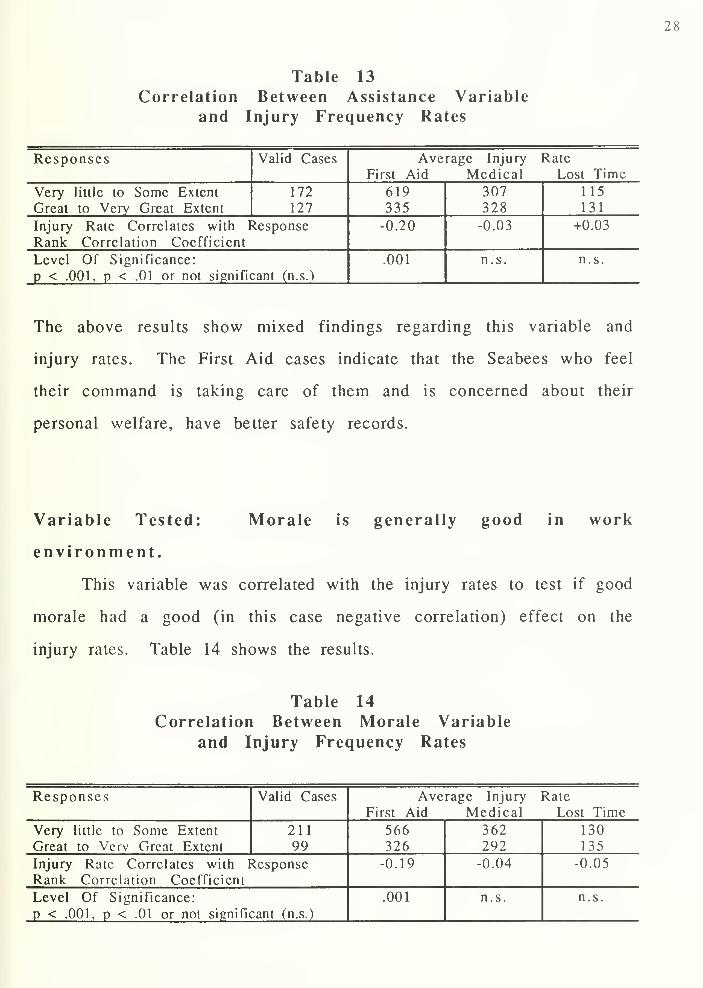
Variable Tested: Adequate assistance provided by the unit
for personal problems.
This variable considered the help or assistance available from the
command for the workers. The correlations to the injury rates are
shown in Table 13.

28
Table 13
Correlation Between Assistance Variable
and Injury Frequency Rates
Responses Valid Cases Average Injury Rate
First Aid Medical Lost Time
Very little to Some Extent
Great to Very Great Extent
172
127
619335
307328
115131
Injury Rate Correlates with Response
Rank Correlation Coefficient
-0.20 -0.03 +0.03
Level Of Significance:
p < .001, p < .01 or not significant (n.s.)
.001 n.s. n.s.
The above results show mixed findings regarding this variable and
injury rates. The First Aid cases indicate that the Seabees who feel
their command is taking care of them and is concerned about their
personal welfare, have better safety records.
Variable Tested: Morale is generally good in work
environment.
This variable was correlated with the injury rates to test if good
morale had a good (in this case negative correlation) effect on the
injury rates. Table 14 shows the results.
Table 14
Correlation Between Morale Variable
and Injury Frequency Rates
Responses Valid Cases Average Injury Rate
First Aid Medical Lost Time
Very little to Some Extent
Great to Vcrv Great Extent
211
99566326
362292
130135
Injury Rate Correlates with
Rank Correlation Coefficient
Response -0.19 -0.04 -0.05
Level Of Significance:
p < .001, p < .01 or not significant (n.s.)
.001 n.s. n.s.

29
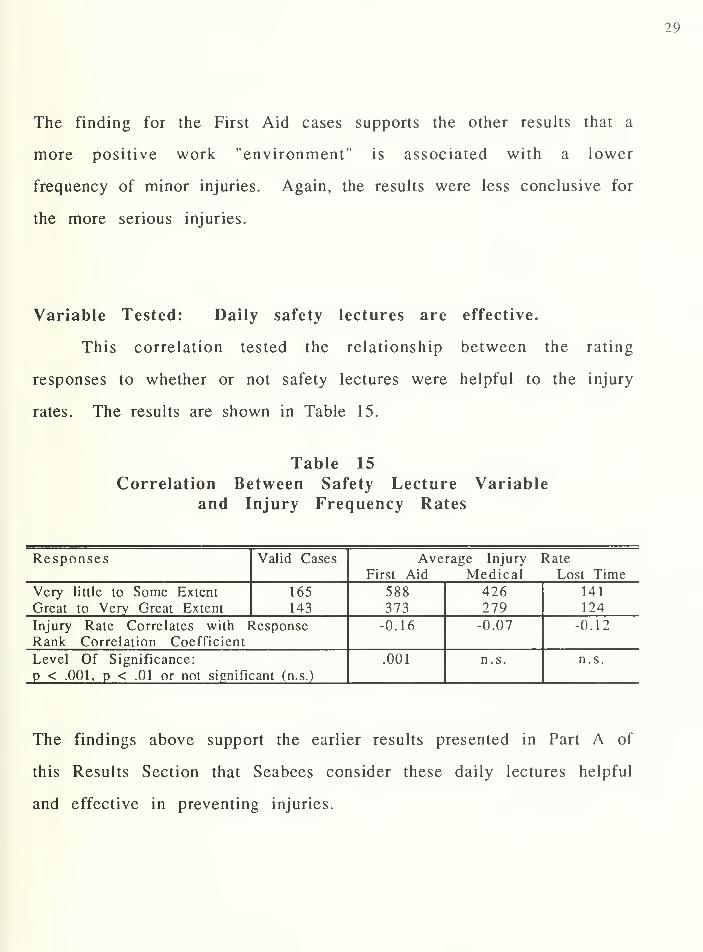
The finding for the First Aid cases supports the other results that a
more positive work "environment" is associated with a lower
frequency of minor injuries. Again, the results were less conclusive for
the more serious injuries.
Variable Tested: Daily safety lectures are effective.
This correlation tested the relationship between the rating
responses to whether or not safety lectures were helpful to the injury
rates. The results are shown in Table 15.
Table 15
Correlation Between Safety Lecture Variable
and Injury Frequency Rates
Responses Valid Cases Average Injury RateFirst Aid Medical Lost Time
Very little to Some Extent
Great to Very Great Extent
165
143
588373
426279
141
124
Injury Rate Correlates with
Rank Correlation Coefficient
Response -0.16 -0.07 -0.12
Level Of Significance:
p < .001, p < .01 or not significant (n.s.)
.001 n.s. n.s.
The findings above support the earlier results presented in Part A of
this Results Section that Seabees consider these daily lectures helpful
and effective in preventing injuries.

30
These five variables that showed the strong correlation with the
injury rate were analyzed by multiple linear regression to identify if
any variable strongly influenced the injury rates. These results
indicated only a weak influence of these individual variables on injury
rates. The highest R Squared coefficient found was 0.07, or only 7% of
the injury rate data could be explained by this analysis. This was for
the variable "Supervisor considers suggestions from the crew". These
weak results of the regression analysis indicate that many variables
influence the injury rates of Seabees. The analysis was also limited by
the information obtained from the original study designed to test
productivity and motivational factors and only briefly surveyed safety
issues. Thus, the focus of the variables was not on safety.
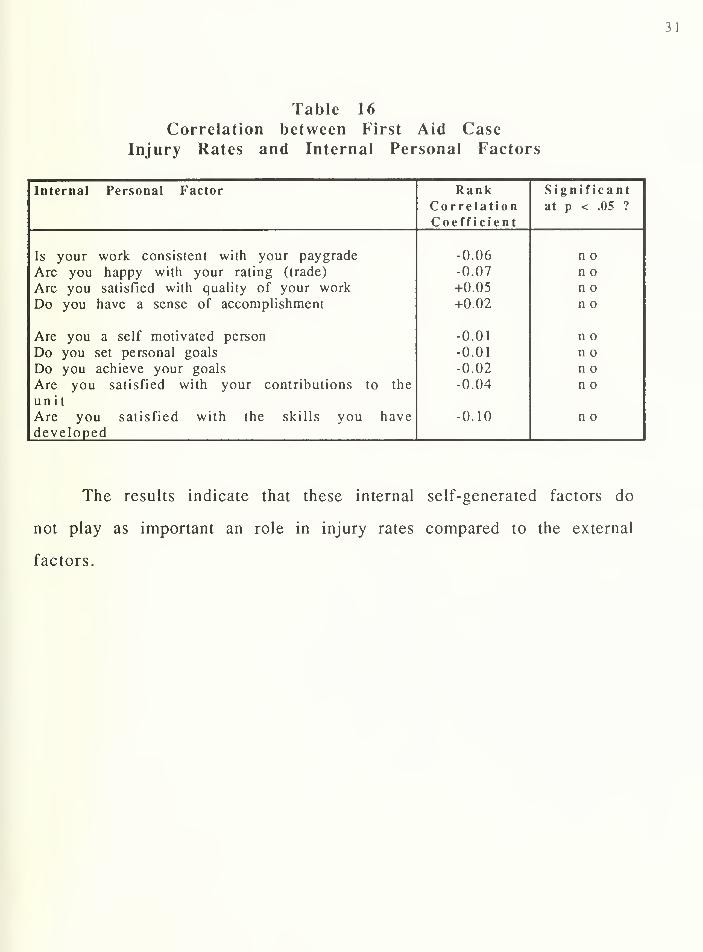
It is interesting to note that with the exception of the Daily
Safety Lecture variable, the other variables all relate to the work-
place environment or climate. These factors are external to the Seabee
and can be controlled by the command's leadership. This finding is
reinforced by reviewing the correlation coefficients of the factors
internal to the workers. Since the correlations were strongest for the
First Aid cases, the following variables and their correlations are
presented in Table 16 for First Aid cases only:

H
Table 16
Correlation between First Aid CaseInjury Rates and Internal Personal Factors
Internal Personal Factor Rank Sign if icant
Correlation at p < .05 ?
Coefficient
Is your work consistent with your paygrade -0.06 n o
Are you happy with your rating (trade) -0.07 n o
Are you satisfied with quality of your work +0.05 n o
Do you have a sense of accomplishment +0.02 n o
Are you a self motivated person -0.01 n o
Do you set personal goals -0.01 n o
Do you achieve your goals -0.02 n o
Are you satisfied with your contributions to the -0.04 n o
unitAre you satisfied with the skills you have -0.10 n o
developed
The results indicate that these internal self-generated factors do
not play as important an role in injury rates compared to the external
factors.

32
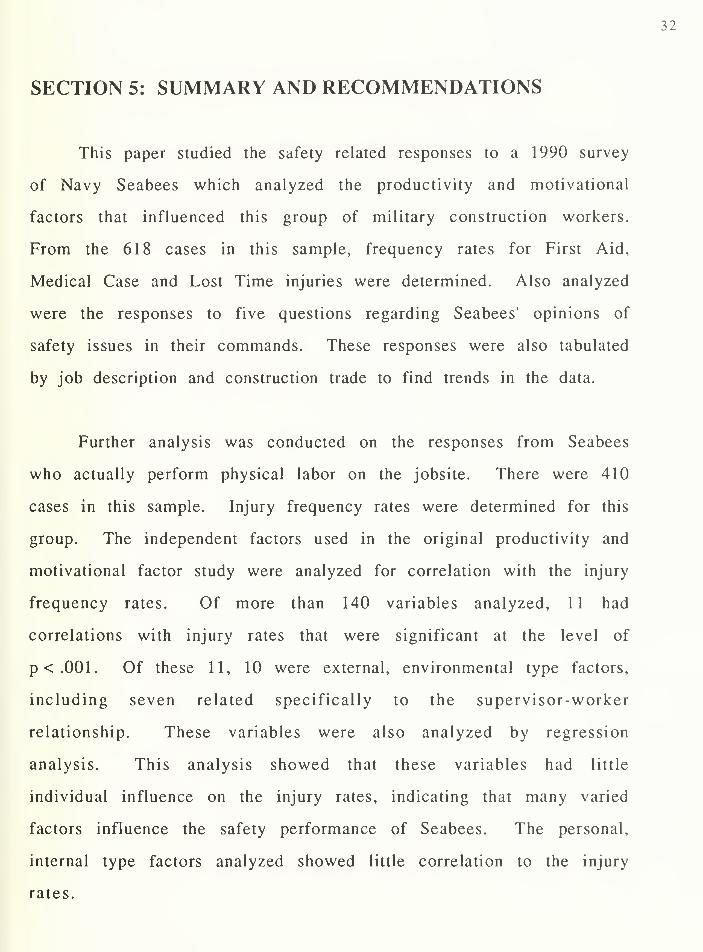
SECTION 5: SUMMARY AND RECOMMENDATIONS
This paper studied the safety related responses to a 1990 survey
of Navy Seabees which analyzed the productivity and motivational
factors that influenced this group of military construction workers.
From the 618 cases in this sample, frequency rates for First Aid,
Medical Case and Lost Time injuries were determined. Also analyzed
were the responses to five questions regarding Seabees' opinions of
safety issues in their commands. These responses were also tabulated
by job description and construction trade to find trends in the data.
Further analysis was conducted on the responses from Seabees
who actually perform physical labor on the jobsite. There were 410
cases in this sample. Injury frequency rates were determined for this
group. The independent factors used in the original productivity and
motivational factor study were analyzed for correlation with the injury
frequency rates. Of more than 140 variables analyzed, 11 had
correlations with injury rates that were significant at the level of
p<.001. Of these 11, 10 were external, environmental type factors,
including seven related specifically to the supervisor-worker
relationship. These variables were also analyzed by regression
analysis. This analysis showed that these variables had little
individual influence on the injury rates, indicating that many varied
factors influence the safety performance of Seabees. The personal,
internal type factors analyzed showed little correlation to the injury
rates.

33
Several other conclusions can be drawn from these findings.
Overall, Seabees have a good safety environment. There is a high level
of awareness for safety on the jobsite; there is also a high feeling of
safety consciousness at the work place. Of the seven Seabee ratings, or
trades, it appears that the Construction Electrician had the least sense
of confidence in their safety environment.
From the analysis of the independent factors, the external,
environmental factors showed a much stronger correlation to the
injury rates than the internal, personal factors. This is important
because the command has more control over the worker's environment
than over a Seabee's personal feelings. The external factors identified
all emphasize the importance or value of positive leadership and
communication skills.
Specific recommendations resulting from this study are:
•Leadership training programs for crew leaders, Chief Petty
Officers, and junior Officers, should stress the relationship identified in
this study connecting the positive leadership skills already taught in
the Navy and better jobsite safety.
•Include in the senior-level courses taught for new commanding
officer, executive officers and operations officers in Battalions the
influence of work-place environment and climate on jobsite safety.


34
•Conduct further review of individual Seabee ratings (trades),
particularly the Construction Electrician and Steelworker ratings, to
pinpoint areas requiring additional attention to decrease the injury
rates and increase the level of safety knowledge and confidence of
junior enlisted personnel.

3 5
BIBLIOGRAPHY
Burns, Timothy, W., LT, CEC, USN, "Motivational and Productivity Factors
that Influence the Naval Construction Force", thesis , University of
Washington, Department of Civil Engineering, 1990.
Hinze, Jimmie and Gordon, Francine, "Supervisor-Worker Relationship
Affects Injury Rate", Journal of the Construction Division . AASCE, Vol.
105, No. C03, September, 1979.
Hinze, Jimmie and Burns, Timothy, "Job Factors That Influence
Construction Worker Productivity", Construction Project Modelling and
Productivity Proceedings of International Conference . Dubrovnik, 1991.
National Safety Council, Accident Facts . 1990 Edition.
U.S. Navy, Naval Facilities Engineering Command, Publication-315, Naval
Construction Force Manual . 1983.

36
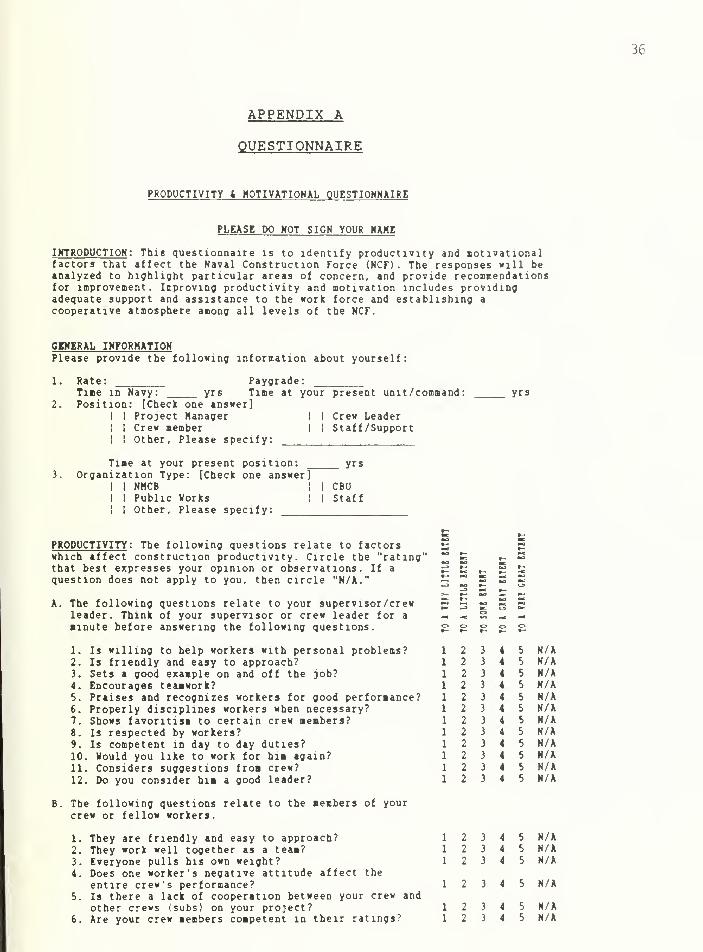
APPENDIX A
QUESTIONNAIRE
PRODUCTIVITY t MOTIVATIONAL QUESTIONNAIRE
PLEASE DO WOT SIGN YOUR NAME
INTRODUCTION : This questionnaire is to identify productivity and motivationalfactors that affect the Naval Construction Force (NCF) . The responses will beanalyzed to highlight particular areas of concern, and provide recommendationsfor improvement. Improving productivity and motivation includes providingadequate support and assistance to the work force and establishing a
cooperative atmosphere among all levels of the NCF.
CBtERAL INFORMATIONPlease provide the following information about yourself:
3.
Rate:Time in Navy:
Paygrade:yrs Time at your present unit/command:
2. Position: [Check one answer]! I Project Manager I I Crew Leader! I Crew member I ! Staff /SupportI ! Other, Please specify:
Time at your present position: yrsOrganization Type: [Check one answer]
I I NMCB ! I CBUI I Public Works ! I Staff! I Other, Please specify:
yrs
PRODUCTIVITY : The following questions relate to factorswhich affect construction productivity. Circle the "rating'that best expresses your opinion or observations. If a
question does not apply to you, then circle "N/A."
A. The following questions relate to your supervisor/crewleader. Think of your supervisor or crew leader for a
inute before answering the following questions.
1. Is willing to help workers with personal problems?2. Is friendly and easy to approach?3. Sets a good example on and off the job?4. Encourages teamwork?5. Praises and recognizes workers for good performance?6. Properly disciplines workers when necessary?7. Shows favoritism to certain crew members?
Is respected by workers?Is competent in day to day duties?Would you like to work for him again?Considers suggestions from crew?Do you consider him a good leader?
8.
9.
1011
12
B. The following questions relate to the members of yourcrew or fellow workers.
1. They are friendly and easy to approach?2. They work well together as a team?3. Everyone pulls his own weight?4. Does one worker's negative attitude affect the
entire crew's performance?5. Is there a lack of cooperation between your crew and
other crews (subs) on your project?6. Are your crew members competent in their ratings?
5 N/A5 N/A5 N/A5 N/A5 N/A5 N/A5 N/A5 N/A5 N/A5 N/A5 N/A5 N/A
1 2 3 4 5 N/A1 2 3 4 5 N/A1 9
4. 3 4 5 N/A
3 4 5 N/A
N/AN/A

M
C. The following questions relate to the type of work youperform on a daily basis.
1. Do you generally work within your rating?2. Are you happy with your rating?3. Have you ever done work that you knew could be done
better by another method?4. Are you comfortable in your present work environment?5. Are you satisfied with the quality of your work?6. Does your work give you a sense of accomplishment?7. What percent of your work time do you perform at your
fullest potential? percent of the time.8. How many hours do you work each week? hrs
D. To the best of your ability, please provide your personalopinions and observations to the following questions.If a question does not apply to you, then circle "N/A."
1. Does the location of your assignment (deploymentsite, duty station...) effect your productivity?
2. Are the proper tools for the job always available?3. Are the available tools in adequate condition?4. Are the available tools old fashioned or obsolete?5. Are the construction materials of good quality?6. Has your or your crew's performance been affected by
poor quality materials?7. Does the formal training tie. schools) adequately
prepare you for your assigned duties?8. Do your current duties provide adequate on-the-job
training?9. Does the inspection program ensure quality work?10. Has the performance of your crew ever been affected
by a crew members substance abuse (drugs or alcohol)?11. Has your performance ever been affected by substance
abuse?12. Is the proper equipment for the job available?13. Is the available equipment in adequate condition?14. Is the available equipment old fashioned or obsolete?15. Has the use of poor quality equipment affected your
crew's performance?16. Has the use of computers had any affect on your
performance?17. Are computers effectively used within your
unit/command?18. Is adequate time set aside for planning and
estimating of projects?19. Are schedules usually followed?20. Is it worth the time and effort to plan and estimate?21. Are computers effectively used in the planning and
estimating effort?22. Are computers effectively used for project management
during construction?23. Should computers be used more in project planning
and managing of projects?24. Do safety regulations restrict your ability to work
effectively?25. Do you understand the need for safety awareness on
the projects?26. Do you feel that you work in a safety conscious
work environment?27. Are daily safety lectures affective?28. Have you observed any major safety violations that
were unreported?
1 2 3 4 5 N/A1 2 3 4 5 N/A
1 2 3 4 b N/A1 2 3 4 b N/A1 2 3 4 5 N/A1 2 3 4 5 N/A
N/AN/AN/AN/AN/A
N/A
N/A
N/AN/A
5 N/A
5
5
5
5
N/AN/AN/AN/A
5 N/A
5 N/A
5 N/A
5
6
5
N/AN/AN/A
5 N/A
5 N/A
5 N/A
b N/A
5 N/A
5
5
N/AN/A
5 N/A

38
29. Since you have been in your present unit/command,how many injuries have you received that:
a. Required first aid treatment only?b. Required a doctor's attention?c. Were lost tine accidents?
30. Has personal problems ever affected your crew's work?31. If you had a personal problem, would you know where
to go to seek help to resolve the problem?32. Is adequate assistance provided by your command to
resolve a member's personal problem?33. Do you feel that your superiors are concerned about
your personal problems?34. Do you feel that the communication within your chain
of command is effective?35. Have you or your crew ever performed rework due to
poor communications between crew and supervisor?36. Is morale generally good in your work environment?37. Has low morale ever affected your crew's work
performance negatively?38. Does family separation of your job affect your
productivity?39. Are you under a lot of stress in your work
environment?40. Is the productivity of your crew reduced due to
stress?41. Do you feel that the some constructions methods that
are being used are outdated?42. Are the quality of your project plans of good
quality and are easy to understand?43. Do the project plans have few errors (interferences,
missing information...) that require major revisions?44. Does a crew member's substandard physical fitness
affect your crew's productivity?45. Do any discriminatory remarks or actions by crew
members affect your crew's productivity?46. Would you like to increase your participation in the
decision making process concerning your project?
E. The following is a list of factors that affect constructiorPlease select the top five factors that most influence youiin a positive way, and rank in order of importance, (1-highest;
12 3-1 5 N/A
12 3-1 5 N/A
1 L j 'I 5 N/A
12 3-1 5 N/A
1 2 3 - 1 5 N/A
12 3-12 3-
I 5
I 5
N/AN/A
12 3-i 5 N/A
12 3-I 5 N/A
12 3-I 5 N/A
1 2 3 -1 5 N/A
12 3- 1 5 N/A
12 3-I 5 N/A
12 3- 1 5 N/A
12 3- I 5 N/A
12 3- I 5 N/A
1 2 3 < I 5 N/A
n product]r work pei
vity.f ormance
SupervisorType of workWeatherLocationToolsMaterialsTrainingSubstance abuseEquipmentComputersPhysical Fitness
Planning and schedulingSafetyPersonal problemsChain of command communMoraleFamily SeparationStressConstruction MethodsPlansDiscriminationOther, please specify :
lowest
!
cation
MOTIVATION : The following questions relate to factors whichaffect a construction worker's motivation. Motivation is
the desire to satisfy your physical and emotional needs, bystimulating an active interest in your assigned task .
A. To the best of your ability, please provide your personal opinions andobservations to the following questions. If a question does not apply toyou, then circle "N/A."
1. Does the opportunity for rewards (Letters of appre-ciation/commendation, medals, special liberty, etc..)improve your performance? 1 2 3 4 5 N/A

39
2.
3.
4.
5.
6.
7.
7.
8.
9.
10
11,
12.
13.
14.
15.
16.
17.
18.
19.
20.
21.
22.
23.
24.
25.
26.
Do you feel that you are adequately recognized forcontributions
:
a. By your superiorsb. By your peers?c. By your subordinates?
Do your evaluations accurately reflect yourperformance?If you received a less thap average evaluation,would you try to improve your performance?If you received an above average evaluation, wouldyou work harder to maintain your performance level?Is your supervisor a good motivator of personnel?Do you tend to be a self-motivator?Do you set personal goals for yourself?Do you achieve your personal goals?Do you know what your superiors expect of you?Are you satisfied with your contribution to thecommand?Are you learning a useful career skill at yourpresent position?Since you have been in the Naval Construction Force,have the duty assignments, training and experiencethat you received, been what you expected?Do you consider the pay and benefits that youreceive to be adequate compensation for your duties?Do you enjoy your work?Do you try to do a better job on some types of
construction work than other types?Is the type of work you perform meaningful?Do you have pride in yourself as a member of theNavy?Are you proud to be a member of your present command?Are you proud to be a Seabee?Are you satisfied with the advancement procedures?Do you prefer to stay at your present paygrade?Does the potential for advancement influence yourperformance?Does the 30b security of being in the Navy influenceyour performance?Do you feel that you have earned the respect from your
a. Superiorsb. Peersc. Subordinates
Is the respect from others an influence on yourperformance?How much longer do you expect to stay in the Navy?
I 3
yrs
The following is a list of factors that affect the motivation of
construction workers. Please select the top five factors that mostyour work performance in a positive way, and rank in order of imporhighest; 5-lowest)
.
5 N/A5 N/A5 N/A
5 N/A
5 N/A
5 N/A5 N/A5 N/A5 N/A5 N/A5 N/A
5 N/A
5 N/A
5 N/A
5 N/A5 N/A
N/AN/A
N/AN/AN/AN/AN/A
5 N/A
5 N/A
5 N/A5 N/A5 N/A
5 N/A
nf luenceance, (1-
HoneyRewardsBenefitsRecognition
I I Personal goalsI I Training and education
programs available! ! On-the-Job Training
I Travel! Job satisfactionI Patriotism/camaraderieI AdvancementI Job securityI RespectI Meaningful workI Other, please specify:
Thank you for the time and effort in answering these questions!

APPENDIX B
AID Number ofDunt M i dpo l nt242 .5058 1 .5026 2.5017 3.50e 4.50
12 5.501 6.501 7.502 8.505 9.50
Histograms of Jobsite Seabees
Frequency of Injuries
first aid injuries in past 3 y
MORE
. I .... + .... I .... + .... I .
80 160 240Histogram Frequency
. . I ,
320 400
Cases 376 Missing Cases 34
\

4:
MEDICAL CASES
MORE
Numb er of injuries needing doc tor at tentjnt Mi dpo i nt2A8 .50
1 .508189 8.5010 3.507 A. 5051
5.506.50
1 7.508.50
3 9.50. I .... + .... I .... + .... I
.
80 160 8^0Histogram Frequency
. . I .
380. . I
<+oo
lases 379 Missing Cases 31

42
LOST TIME INJURIES
MORE
ME N urnber of lost t ime injuri es in past>unt M l dpo i nt308 .50
1 .5050125
E.503.50^+.50
3 5.506.507.50
3 y
. i ......... i .........
:
BO 160 2~ r<
Histogram F r e q - e "Cy
n
Cases 379 Missing Cases 31

4j
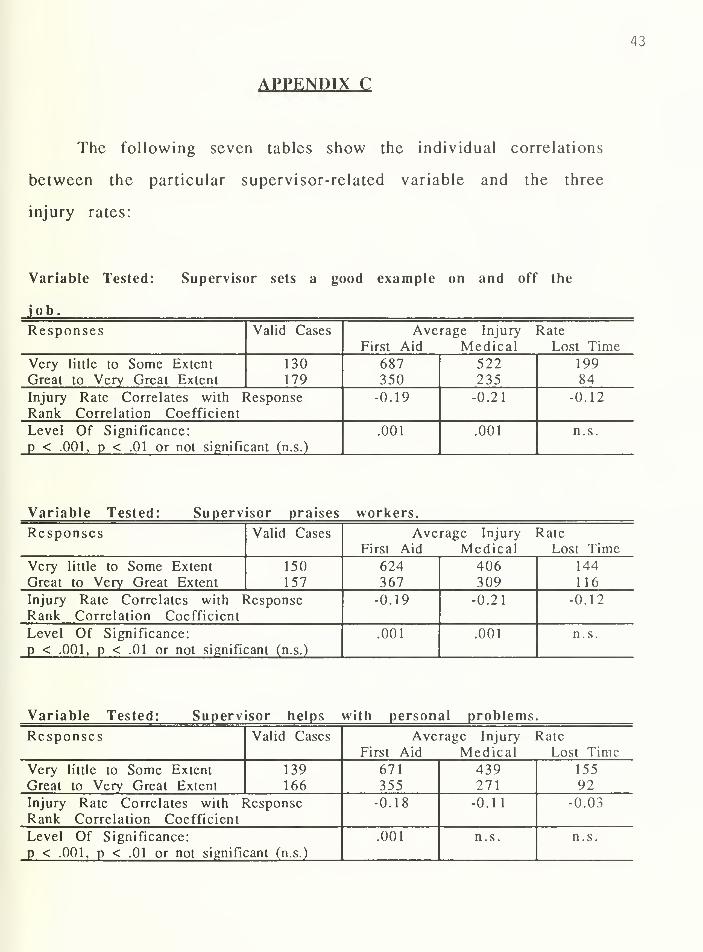
APPENDIX C
The following seven tables show the individual correlations
between the particular supervisor-related variable and the three
injury rates:
Variable Tested: Supervisor sets a good example on and off the
job.
Responses Valid Cases AveFirst Aid
rage Injury
MedicalRate
Lost Time
Very little to Some Extent
Great to Very Great Extent
130179
687350
5222 35
19984
Injury Rate Correlates with
Rank Correlation Coefficient
Response -0.19 -0.21 -0.12
Level Of Significance:
p < .001, p < .01 or not significant (n.s.)
.001 .001 n.s.
Variable Tested: Supervisor praises workers.
Responses Valid Cases Average Injury RateFirst Aid Medical Lost Time
Very little to Some Extent
Great to Very Great Extent
150
157
624367
406309
144
116
Injury Rate Correlates with
Rank Correlation Coefficient
Response -0.19 -0.21 -0.12
Level Of Significance:
p < .001, p < .01 or not significant (n.s.)
.001 .001 n.s.
Variable Tested: Supervisor helps with personal problems
Responses Valid Cases Average Injury RateFirst Aid Medical Lost Time
Very little to Some Extent
Great to Very Great Extent
139
166
671
355439271
155
92
Injury Rate Correlates with
Rank Correlation Coefficient
Response -0.18 -0.11 -0.03
Level Of Significance:
p < .001, p < .01 or not significant (n.s.)
.001 n.s. n.s.

44
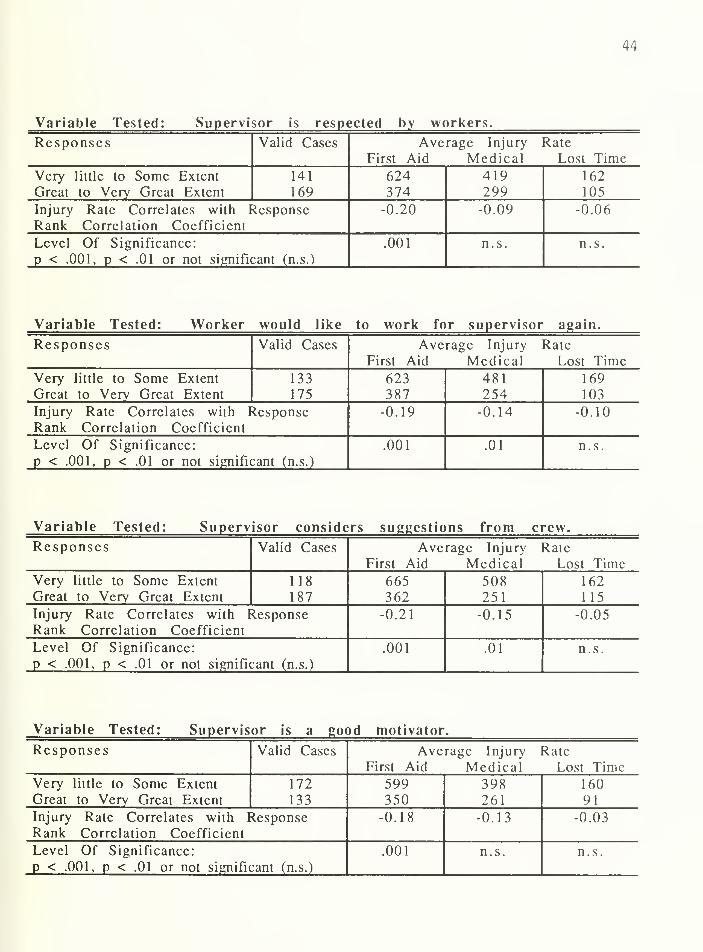
Variable Tested: Supervisor is respected by workers.
Responses Valid Cases Average Injury Rate
First Aid Medical Lost Time
Very little to Some Extent
Great to Very Great Extent
141
169
624374
4 19
299162
105
Injury Rate Correlates with ResponseRank Correlation Coefficient
-0.20 -0.09 -0.06
Level Of Significance:
p < .001, p < .01 or not significant (n.s.)
.001 n.s. n.s.
Variable Tested: Worker would like to work for supervisor again.
Responses Valid Cases Average Injury Rate
First Aid Medical Lost TimeVery little to Some Extent
Great to Very Great Extent
133
175
623387
481254
169
103
Injury Rate Correlates with
Rank Correlation Coefficient
Response -0.19 -0.14 -0.10
Level Of Significance:
p < .001, p < .01 or not significant (n.s.)
.001 .01 n.s.
Variable Tested: Superv isor considers suggestions from crew.
Responses Valid Cases Average Injury
First Aid MedicalRate
Lost TimeVery little to Some Extent
Great to Very Great Extent
118
187
665
362508251
162
115
Injury Rate Correlates with ResponseRank Correlation Coefficient
-0.21 -0.15 -0.05
Level Of Significance:
p < .001, p < .01 or not significant (n.s.)
.001 .01 n.s.
Variable Tested: Supervisor is a good motivator .
Responses Valid Cases Average Injury
First Aid MedicalRate
Lost TimeVery little to Some Extent
Great to Very Great Extent
172
133
599350
398261
160
91
Injury Rate Correlates with
Rank Correlation Coefficient
Response -0.18 -0.13 -0.03
Level Of Significance:
p < .001, p < .01 or not significant (n.s.)
.001 n.s. n.s.

45APPENDIX D
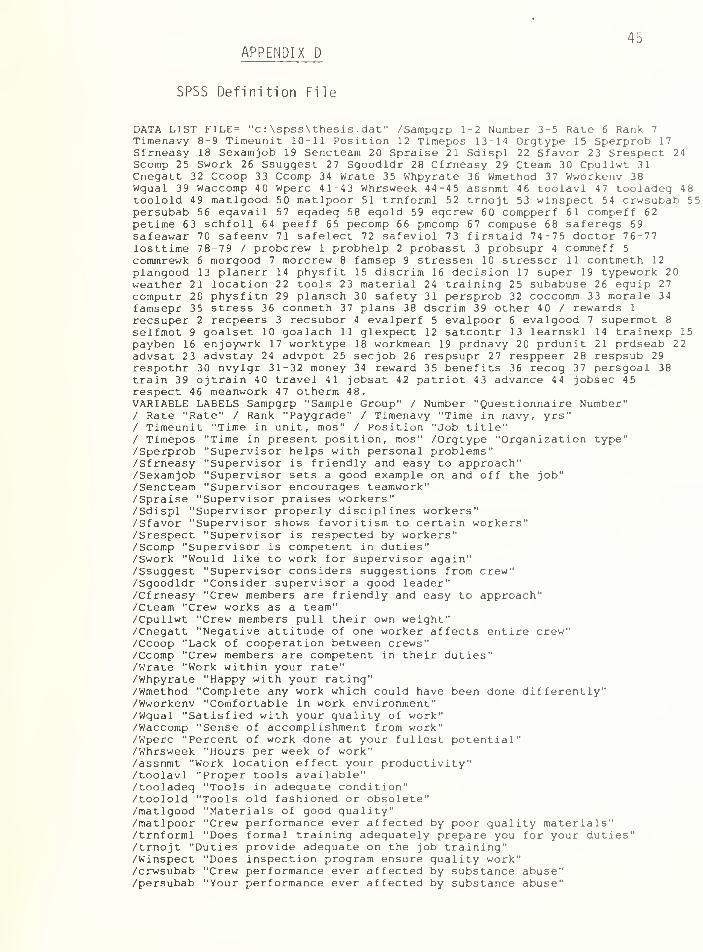
SPSS Definition File
DATA LIST FILE= "c:\spss\thesis.dat" /Sampgrp 1-2 Number 3-5 Rate 6 Rank 7
Timenavy 8-9 Timeunit 10-11 Position 12 Timepos 13-14 Orgtype 15 Sperprob 17Sfrneasy 18 Sexamjob 19 Sencteam 20 Spraise 21 Sdispl 22 Sfavor 23 Srespect 24Scomp 25 Swork 26 Ssuggest 27 Sgoodldr 28 Cfrneasy 29 Cteam 30 Cpullwt 31Cnegatt 32 Ccoop 33 Ccomp 34 Wrate 35 Whpyrate 36 Wmethod 37 Wworkenv 38Wqual 39 Waccomp 40 Wperc 41-43 Whrsweek 44-45 assnmt 46 toolavl 47 tooladeq 48toolold 49 matlgood 50 matlpoor 51 trnforml 52 trnojt 53 winspect 54 crwsubab 55persubab 56 eqavail 57 eqadeq 58 eqold 59 eqcrew 60 compperf 61 compeff 62petime 63 schfoll 64 peeff 65 pecomp 66 pmcomp 67 compuse 68 saferegs 69safeawar 70 safeenv 71 safelect 72 safeviol 73 firstaid 74-75 doctor 76-77losttime 78-79 / probcrew 1 probhelp 2 probasst 3 probsupr 4 commeff 5
commrewk 6 morgood 7 morcrew 8 famsep 9 stressen 10 stressor 11 contmeth 12
plangood 13 planerr 14 physfit 15 discrim 16 decision 17 super 19 typework 20weather 21 location 22 tools 23 material 24 training 25 subabuse 26 equip 27computr 28 physfitn 29 plansch 30 safety 31 persprob 32 coccoram 33 morale 34
famsepr 35 stress 36 conmeth 37 plans 38 dscrim 39 other 40 / rewards 1
recsuper 2 recpeers 3 recsubor 4 evalperf 5 evalpoor 6 evalgood 7 supermot 8
selfmot 9 goalset 10 goalach 11 glexpect 12 satcontr 13 learnskl 14 trainexp 15
payben 16 enjoywrk 17 worktype 18 workmean 19 prdnavy 20 prdunit 21 prdseab 22advsat 23 advstay 24 advpot 25 secjob 26 respsupr 27 resppeer 28 respsub 29respothr 30 nvylgr 31-32 money 34 reward 35 benefits 36 recog 37 persgoal 38train 39 ojtrain 40 travel 41 jobsat 42 patriot 43 advance 44 jobsec 45respect 46 meanwork 47 otherm 48.VARIABLE LABELS Sampgrp "Sample Group" / Number "Questionnaire Number"/ Rate "Rate" / Rank "Paygrade" / Timenavy "Time in navy, yrs"/ Timeunit "Time in unit, mos" / Position "Job title"/ Timepos "Time in present position, mos" /Orgtype "Organization type"/Sperprob "Supervisor helps with personal problems"/Sfrneasy "Supervisor is friendly and easy to approach"/Sexamjob "Supervisor sets a good example on and off the job"/Sencteam "Supervisor encourages teamwork"/Spraise "Supervisor praises workers"/Sdispl "Supervisor properly disciplines workers"/Sfavor "Supervisor shows favoritism to certain workers"/Srespect "Supervisor is respected by workers"/Scomp "Supervisor is competent in duties"/Swork "Would like to work for supervisor again"/Ssuggest "Supervisor considers suggestions from crew"/Sgoodldr "Consider supervisor a good leader"/Cfrneasy "Crew members are friendly and easy to approach"/Cteam "Crew works as a team"/Cpullwt "Crew members pull their own weight"/Cnegatt "Negative attitude of one worker affects entire crew"/Ccoop "Lack of cooperation between crews"/Ccomp "Crew members are competent in their duties"/Wrate "Work within your rate"/Whpyrate "Happy with your rating"/Wmethod "Complete any work which could have been done differently"/Wworkenv "Comfortable in work environment"/Wqual "Satisfied with your quality of work"/Waccomp "Sense of accomplishment from work"/Wperc "Percent of work done at your fullest potential"/Whrsweek "Hours per week of work"/assnmt "Work location effect your productivity"/toolavl "Proper tools available"/tooladeq "Tools in adequate condition"/toolold "Tools old fashioned or obsolete"/matlgood "Materials of good quality"/matlpoor "Crew performance ever affected by poor quality materials"/trnforml "Does formal training adequately prepare you for your duties"/trnojt "Duties provide adequate on the job training"/Winspect "Does inspection program ensure quality work"/crwsubab "Crew performance ever affected by substance abuse"/persubab "Your performance ever affected by substance abuse"

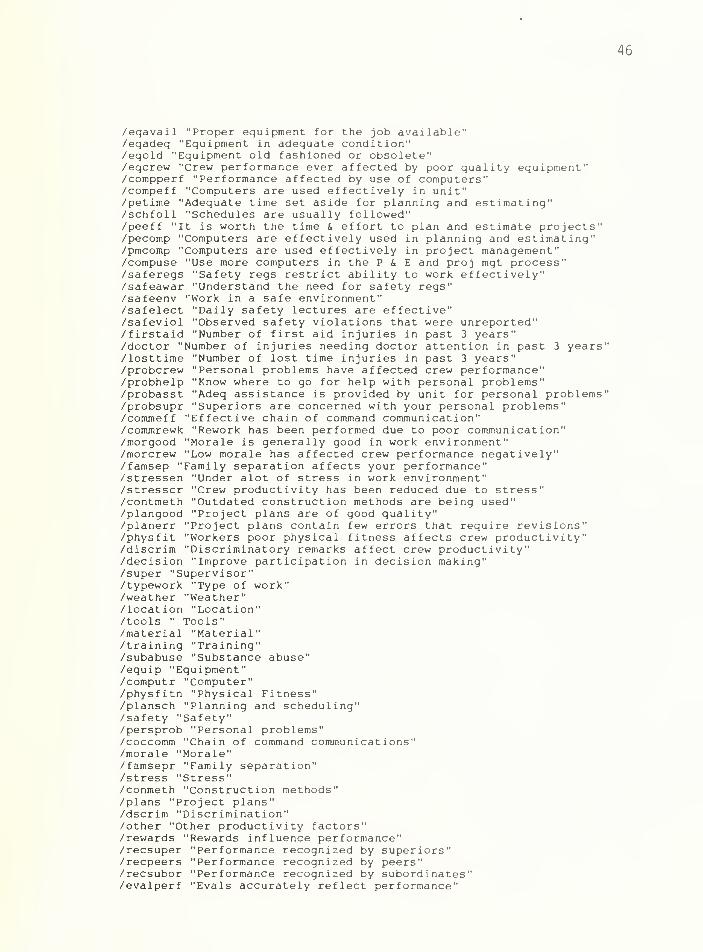
46
/eqavail "Proper equipment for the job available"/eqadeq "Equipment in adequate condition"/eqold "Equipment old fashioned or obsolete"/eqcrew "Crew performance ever affected by poor quality equipment"/compperf "Performance affected by use of computers"/compeff "Computers are used effectively in unit"/petime "Adequate time set aside for planning and estimating"/schfoll "Schedules are usually followed"/peeff "It is worth the time & effort to plan and estimate projects"/pecomp "Computers are effectively used in planning and estimating"/pmcomp "Computers are used effectively in project management"/compuse "Use more computers in the P & E and proj mgt process"/saferegs "Safety regs restrict ability to work effectively"/safeawar "Understand the need for safety regs"/safeenv "Work in a safe environment"/safelect "Daily safety lectures are effective"/safeviol "Observed safety violations that were unreported"/firstaid "Number of first aid injuries in past 3 years"/doctor "Number of injuries needing doctor attention in past 3 years"/losttime "Number of lost time injuries in past 3 years"/probcrew "Personal problems have affected crew performance"/probhelp "Know where to go for help with personal problems"/probasst "Adeq assistance is provided by unit for personal problems"/probsupr "Superiors are concerned with your personal problems"/commeff "Effective chain of command communication"/commrewk "Rework has been performed due to poor communication"/morgood "Morale is generally good in work environment"/morcrew "Low morale has affected crew performance negatively"/famsep "Family separation affects your performance"/stressen "Under alot of stress in work environment"/stressor "Crew productivity has been reduced due to stress"/contmeth "Outdated construction methods are being used"/plangood "Project plans are of good quality"/planerr "Project plans contain few errors that require revisions"/physfit "Workers poor physical fitness affects crew productivity"/discrim "Discriminatory remarks affect crew productivity"/decision "Improve participation in decision making"/super "Supervisor"/typework "Type of work"/weather "Weather"/location "Location"/tools " Tools"/material "Material"/training "Training"/subabuse "Substance abuse"/equip "Equipment"/computr "Computer"/physfitn "Physical Fitness"/plansch "Planning and scheduling"/safety "Safety"/persprob "Personal problems"/coccomm "Chain of command communications"/morale "Morale"/famsepr "Family separation"/stress "Stress"/conmeth "Construction methods"/plans "Project plans"/dscrim "Discrimination"/other "Other productivity factors"/rewards "Rewards influence performance"/recsuper "Performance recognized by superiors"/recpeers "Performance recognized by peers"/recsubor "Performance recognized by subordinates"/evalperf "Evals accurately reflect performance"


47
/evalpoor "Strive for improved performance due to a poor eval"/evalgood "Strive to maintain or improve performance due to good eval"/supermot "Supervisor is a good motivator"/selfmot "Self motivating individual"/goalset "Set personal goals"/goalach "Achieve personal goals"/glexpect "Know what is expected of your performance from superiors"/satcontr "Satisfied with contributions to unit"/learnskl "Learning a useful skill at present position"/trainexp "Satisfied with skills developed"/payben "Pay and benefits are adeguate for work performed"/enjoywrk "Enjoy your work"/worktype "Work harder on some types of work than others"/workmean "Perform meaningful work"/prdnavy "Proud to be in the navy"/prdunit "Proud to be in present unit"/prdseab "Proud to be a Seabee"/advsat "Satisfied with advancement procedures"/advstay "Prefer to stay at present paygrade"/advpot "Potential for advancement improves work performance"/secjob "Job security influences performance"/respsupr "Earned the respect of superiors"/resppeer "Earned the respect of peers"/respsub "Earned the respect of subordinates"/respothr "Respect from other persons influence performance"/nvylgr "How much longer do you expect to remain in the navy, yrs"/money "Money"/reward "Rewards"/benefits "Benefits"/recog "Recognition"/persgoal "Personal goals"/train "Training"/ojtrain "On the job training"/travel "Travel"/jobsat "Job satisfaction"/patriot "Patriotism and camaraderie"/advance "Advancement"/jobsec "Job security"/respect "Respect"/meanwork "Meaningful work"/otherm "Other motivational factors".VALUE LABELS Rate 1 "BU" 2 "SW" 3 "CE" 4 "UT" 5 "EO" 6 "CM" 7 "EA" 8 "Other"/ Rank 1 "El" 2 "E2" 3 "E3" 4 "E4" 5 "E5" 6 "E6" 7 "E7" 8 "E8" 9 "E9"/ Position 1 "Project Manager" 2 "Crew Leader" 3 "Crew Member"4 "Staff or Support" 5 "Other"/ Orgtype 1 "NMCB" 2 "CBU" 3 "Public Works" 4 "Staff" 5 "Other"/ Sperprob to Waccomp 1 "Very Little extent" 2 "Little Extent" 3 "Some extent"4 "Great extent" 5 "Very great extent" 6 "N/A"/ assnmt to safeviol 1 "Very little extent" 2 "Little extent" 3 "Some extent"4 "Great extent" 5 "Very great extent" 6 "N/A"/ probcrew to decision 1 "Very little extent" 2 "Little extent" 3 "Some extent'4 "Great extent" 5 "Very great extent" 6 "N/A"/ rewards to respothr 1 "Very little extent" 2 "Little extent" 3 "Some extent"4 "Great extent" 5 "Very great extent" 6 "N/A".MISSING VALUES Rank (0) / Rate Position Orgtype to Waccomp assnmt to safeviolprobcrew to respothr money to otherm (9) / Sampgrp Timenavy Timeunit TimeposWhrsweek firstaid doctor losttime nvylgr (99) / Number Wperc (999).
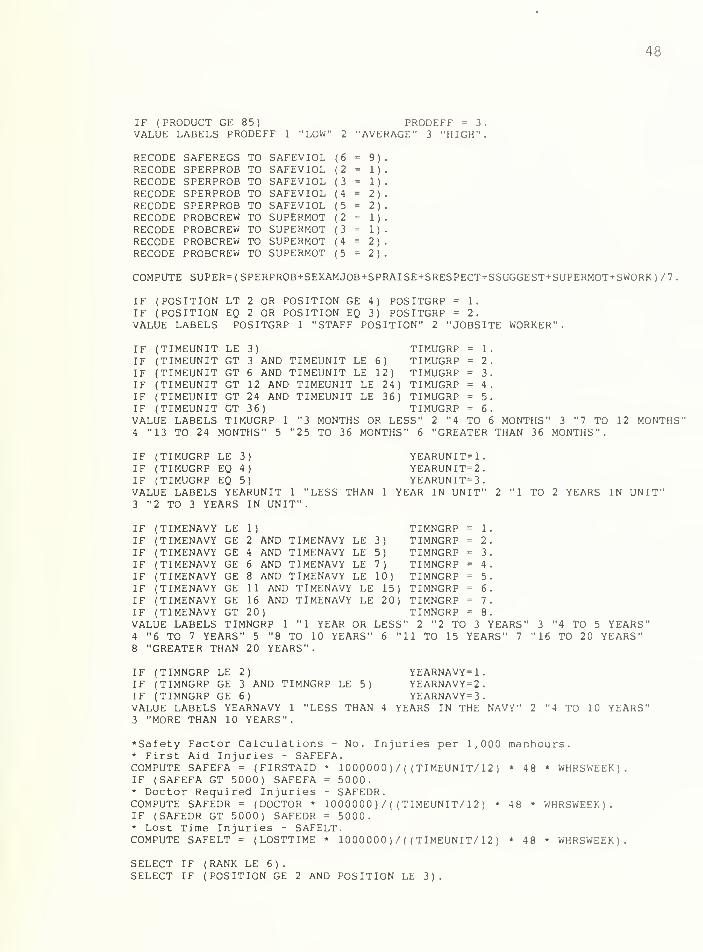
* Productivity Efficiency Calculations.IF (ORGTYPE EQ 1) AVGWK = 4 9.2.IF (ORGTYPE EQ 2) AVGWK = 41.9.COMPUTE PRODUCT = (WPERC * WHRSWEEK ) /AVGWK
.
IF (PRODUCT LT 55) PRODEFF = 1.
IF (PRODUCT GE 55 AND PRODUCT LT 85) PRODEFF = 2.

48
IF (PRODUCT GE 85) PRODEFF = 3
VALUE LABELS PRODEFF 1 "LOW" 2 "AVERAGE" 3 "HIGH"
RECODE SAFEREGS TO SAFEVIOL (6 = 9).RECODE SPERPROB TO SAFEVIOL (2 == 1).RECODE SPERPROB TO SAFEVIOL (3 == 1).RECODE SPERPROB TO SAFEVIOL (4 == 2).RECODE SPERPROB TO SAFEVIOL (5 == 2).RECODE PROBCREW TO SUPERMOT (2 == 1) •
RECODE PROBCREW TO SUPERMOT (3 == 1).
RECODE PROBCREW TO SUPERMOT (4 = = 2) .
RECODE PROBCREW TO SUPERMOT (5 = = 2).
COMPUTE SUPER=(SPERPROB+SEXAMJOB+SPRAISE+SRESPECT+SSUGGEST+SUPERMOT+SWORK)/7
IF (POSITION LT 2 OR POSITION GE 4) POSITGRP = 1.
IF (POSITION EQ 2 OR POSITION EQ 3) POSITGRP = 2.
VALUE LABELS POSITGRP 1 "STAFF POSITION" 2 "JOBSITE WORKER".
IF (TIMEUNIT LE 3) TIMUGRPIF (TIMEUNIT GT 3 AND TIMEUNIT LE 6) TIMUGRPIF (TIMEUNIT GT 6 AND TIMEUNIT LE 12) TIMUGRPIF (TIMEUNIT GT 12 AND TIMEUNIT LE 24) TIMUGRPIF (TIMEUNIT GT 24 AND TIMEUNIT LE 36) TIMUGRPIF (TIMEUNIT GT 36) TIMUGRPVALUE LABELS TIMUGRP 1 "3 MONTHS OR LESS"4 "13 TO 24 MONTHS" 5 "25 TO 36 MONTHS" 6
1 .
2 .
3.
4 .
5.
6.
2 "4 TO 6 MONTHS" 3 "7 TO"GREATER THAN 36 MONTHS".
12 MONTHS'
IF (TIMUGRP LE 3) YEARUNIT=1.IF (TIMUGRP EQ 4) YEARUNIT=2
.
IF (TIMUGRP EQ 5) YEARUNIT=3.VALUE LABELS YEARUNIT 1 "LESS THAN 1 YEAR IN UNIT" 2
3 "2 TO 3 YEARS IN UNIT"."1 TO 2 YEARS IN UNIT'
IF (TIMENAVY LE 1) TIMNGRP = 1.
IF (TIMENAVY GE 2 AND TIMENAVY LE 3) TIMNGRP = 2.
IF (TIMENAVY GE 4 AND TIMENAVY LE 5) TIMNGRP = 3.
IF (TIMENAVY GE 6 AND TIMENAVY LE 7) TIMNGRP = 4.
IF (TIMENAVY GE 8 AND TIMENAVY LE 10) TIMNGRP = 5.
IF (TIMENAVY GE 11 AND TIMENAVY LE 15) TIMNGRP = 6.
IF (TIMENAVY GE 16 AND TIMENAVY LE 20) TIMNGRP = 7.
IF (TIMENAVY GT 20) TIMNGRP = 8.
VALUE LABELS TIMNGRP 1 "1 YEAR OR LESS" 2 "2 TO 3 YEARS"4 "6 TO 7 YEARS" 5 "8 TO 10 YEARS" 6 "11 TO 15 YEARS" 7
'
8 "GREATER THAN 20 YEARS".
3'
16
4 TO 5 YEARS'TO 20 YEARS"
IF (TIMNGRP LE 2)IF (TIMNGRP GE 3 AND TIMNGRP LE 5)IF (TIMNGRP GE 6)VALUE LABELS YEARNAVY 1 "LESS THAN 4
3 "MORE THAN 10 YEARS".
YEARNAVY=1.YEARNAVY=2.YEARNAVY=3.
YEARS IN THE NAVY" 2 "4 TO 10 YEARS'
Safety Factor Calculations - No. Injuries per 1,000 manhours* First Aid Injuries - SAFEFA.
* 1000000)/( (TIMEUNIT/12)= 5000.- SAFEDR.1000000)/( (TIMEUNIT/12) *
COMPUTE SAFEFA = (FIRSTAIDIF (SAFEFA GT 5000) SAFEFA* Doctor Required InjuriesCOMPUTE SAFEDR = (DOCTOR *
IF (SAFEDR GT 5000) SAFEDR = 5000.* Lost Time Injuries - SAFELT.COMPUTE SAFELT = (LOSTTIME * 1 000000 )/(( TIMEUNIT/ 12
)
SELECT IF (RANK LE 6 )
.
SELECT IF (POSITION GE 2 AND POSITION LE 3 )
.
48 * WHRSWEEK)
48 * WHRSWEEK)
.
48 WHRSWEEK)


49
IF (FIRSTAID GT AND FIRSTAID LT 99)IF (FIRSTAID EQ 0)IF (DOCTOR GT AND DOCTOR LT 99)IF (DOCTOR EQ 0)IF (LOSTTIME GT AND LOSTTIME LT 9 9
)
IF (LOSTTIME EQ 0)
FAINJURY = 1 .
FAINJURY = 0.
DRINJURY = 1.
DRINJURY = 0.
LTINJURY = 1.
LTINJURY = 0.


ThesisV162526c.l
Van de VoordeWork-related injury
frequency rates in theNavy Seabees.
Thesis
V162526 Van de Voorde
c.l Work-related injury
frequency rates in the
Navy Seabees.

Related Documents


