www.pwc.pl Work in the European Union – taxes and social security contributions April 2016

Welcome message from author
This document is posted to help you gain knowledge. Please leave a comment to let me know what you think about it! Share it to your friends and learn new things together.
Transcript

www.pwc.pl
Work in the European Union – taxes and social security contributions
April 2016

PwC
Top destinations for economic migration
in Europe: 1,901,000 people (mainly European Union countries)
Source: GUS (Polish Office of National Statistics) information on destinations and levels of temporary migration from Poland in the years 2004 to 2014
In 2004, a million people were temporary migrants: up by 132%
2,320,000 Polish people are temporary economic migrants, including:
86%
Top migration destinations:
• United Kingdom (685,000)
• Germany (614,000)
• Ireland (113,000)
• Netherlands (109,000)
• Italy (96,000)
2

PwC
Taxation of income from work – changes
• Estonia: from 21% to 20% (2015)
• Latvia: from 24% to 23% (2015)
• Hungary: from 16% to 15% (2016)
• Austria (2016): a reduction in the lowest tax rate from 36.5% to 25%; a new (temporary – until 2020) 55% tax rate for the
richest (income > EUR 1m)
• Spain (2015 and 2016): a reduction in the rates from 20-47% (in 2014) to 19-45% (in 2016)
• Netherlands (2015 and 2016): a reduction in the rates (both income tax and social security contributions) from
37%/42%/52% (in 2014) to 36.55%/40.40%/52% (in 2016)
• Ireland (2015): a reduction in the lowest rate from 41% to 40%
• Portugal (2015): the introduction of a family quotient modelled on the French tax system (with each child corresponding to
0.3)
• Greece (2015): an increase in the highest solidarity tax rate from 2.8% to 8% (for incomes > EUR 500,000)
• Estonia – an increase from EUR 1,848 EUR to EUR 2,040 (further gradual increase expected by 2018 - the tax-free
threshold is to be EUR 2,460)
• Finland – an increase from EUR 16,500 to EUR 16,700
• Germany – an increase from EUR 8,354 to EUR 8,652
• United Kingdom – an increase from about EUR 13,500 to EUR 14,100
Tax rate changes
Changes in tax-free
thresholds (2016)
Most of the changes in Europe are beneficial to taxpayers – mainly tax rate cuts (in the first instance, flat rates
or tax rates for the poorest taxpayers) and tax-free threshold increases
3

PwC
Taxation of income from work – changes (cont.)
Tax thresholds – examples of changes
Interesting facts
United Kingdom – the first tax threshold was lowered in the tax years 2014/2015 and 2015/2016 (from GBP 32,010 to GBP 31,865 and from GBP 31,865 to
GBP 31,785), only to be increased to GBP 32,000 in the tax year 2016/2017 (whereas the second tax threshold remains unchanged).
There are 18 income tax rates in place in Luxembourg!
Country The highest threshold 2015 The lowest threshold 2016 Tax rate* (%)
Sweden EUR 68,527 EUR 67,170 57
Austria EUR 60,000 EUR 90,000 50
Belgium EUR 37,300 EUR 38,080 50
Finland* EUR 90,000 EUR 72,300 31.75 (+ local district tax)
Netherlands EUR 57,585 EUR 66,421 52
Germany EUR 250,731 EUR 254,447 45
* However, the other thresholds were raised
4

PwC
Reporting of income from work – interesting facts
Ireland: it’s permitted to pay tax in 12 instalments (the total tax liability due is 105% of the original tax
liability)
Sweden: a tax return may by accepted by phone or a text message
The Provisional Tax Return is becoming more and more popular – more than a half of the member
states; Croatia (since 2015), Poland
Popularization of electronic tax returns: available in most European countries; in Greece, taxpayers
who submit their tax returns electronically are entitled to a tax allowance of 1.5% (up to EUR 118);
in Portugal, a person who submits their tax return online may do that by the end of April (rather than by
the end of March); similar arrangements are in place in the United Kingdom and Italy
Austria: late filing of a tax return may carry a penalty of 10% of the tax due
5
PwC
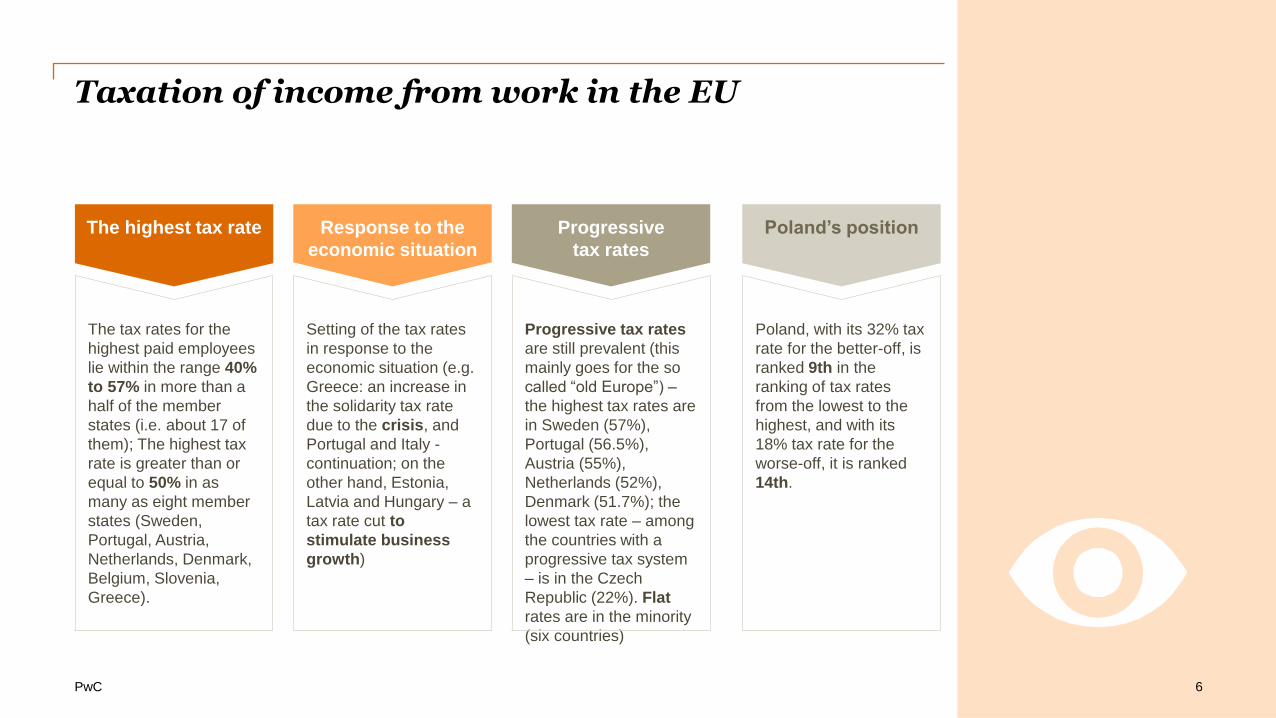
Taxation of income from work in the EU
The highest tax rate
The tax rates for the
highest paid employees
lie within the range 40%
to 57% in more than a
half of the member
states (i.e. about 17 of
them); The highest tax
rate is greater than or
equal to 50% in as
many as eight member
states (Sweden,
Portugal, Austria,
Netherlands, Denmark,
Belgium, Slovenia,
Greece).
Response to the
economic situation
Setting of the tax rates
in response to the
economic situation (e.g.
Greece: an increase in
the solidarity tax rate
due to the crisis, and
Portugal and Italy -
continuation; on the
other hand, Estonia,
Latvia and Hungary – a
tax rate cut to
stimulate business
growth)
Progressive
tax rates
Progressive tax rates
are still prevalent (this
mainly goes for the so
called “old Europe”) –
the highest tax rates are
in Sweden (57%),
Portugal (56.5%),
Austria (55%),
Netherlands (52%),
Denmark (51.7%); the
lowest tax rate – among
the countries with a
progressive tax system
– is in the Czech
Republic (22%). Flat
rates are in the minority
(six countries)
Poland’s position
Poland, with its 32% tax
rate for the better-off, is
ranked 9th in the
ranking of tax rates
from the lowest to the
highest, and with its
18% tax rate for the
worse-off, it is ranked
14th.
6

PwC
Taxation of income from work – allowances
No option for couples to file jointly: Austria, Netherlands, Cyprus, Czech Republic, Denmark, Lithuania
(with certain exceptions), Latvia, Romania, Slovenia, Hungary, Italy. Whereas in Greece, joint filing of tax
returns is (in principle) mandatory for couples
Family tax allowances (mainly child tax allowances or, to a lesser extent, joint filing for couples) are in
place in most of the countries; moreover, many countries use a wide range of other allowances (e.g.
educational, medical, commuter allowances, etc.)
Poland looks good in terms of family tax allowances (children’s allowance, joint filing for couples, joint
filing for single parents and their children), however, far worse in terms of other allowances
7

PwC
Taxation of income from work – preferences for mobile employees
8
An option to exclude a relocation package from tax (up to a certain limit: private
Austrian school tuition benefit, double-household benefit, travel to and from the
home country)
No taxation of amounts involved in travel to and from the home country and
visits paid by the spouse
We have noticed a practice of tax revenue authorities which is beneficial to
mobile employees, in respect of mobility-related income – for instance,
interpretations are issued to confirm that a refund of the employee’s travel from
the home country to the country of secondment by the employer is excluded
from the employee’s income. The same applies to a refund of housing costs,
school for children, etc.
Poland
France
Macron’s Law
(France) – seconded
employees have the
right to retain the
benefits granted to
them under the home
country’s laws even if
they change their
employer (within the
same group)
Austria

PwC
Social security contributions on remuneration
Ireland: 11 social security rates, depending on remuneration (8.50% to 10.75% for the employer and nil to 4% for the
employee)
United Kingdom: any income below GBP 7,775 a year is excluded from social security contributions; there are two social
security thresholds depending on income: in total, 25.8% and 15.8% (the lower social security contribution is applicable to
higher incomes)
Poland is positioned in the middle of the cost of labour (i.e. the employer’s contribution) ranking (it is ranked 14th from the
lowest cost to the highest cost), with the employer’s contribution of up to 22.67%.
Luxembourg: some of the lowest social security contributions (16% in total) - offset by high taxes
Social security contribution raises / cuts (2016) Belgium – a raise in the employer’s contribution from
27% to 30% (in 2015, there was a cut from 33% to 27%), Slovakia – a cut in the employer’s contribution
from 35.2% to 34.4%; Spain – a slight cut in the employer’s contribution (from 30.15% to 29.9%)
In most of the countries: total social security contributions between 30% and 40% (in a couple of them above 40%, e.g.
Slovakia, Czech Republic, Belgium; France even 60%), of which the employer’s contribution lies usually in the range 20%
to 35%
France: the employer’s contribution is as much as 45%
Usually, the employer’s contribution is higher than the employee’s contribution, the contribution basis is capped in
absolute terms, and contributions are deductible from income – this is also the case in Poland
9

PwC
Retirement age in the EU
The lowest retirement age is in Slovenia at the moment (58.4 years for women and 58.8 years for men)
The highest retirement age in the Czech Republic – even 68.4 years (in the future). The retirement age
in the United Kingdom is to be raised to 68 years.
A pension reform is also under way in Poland – the retirement age of 67 years will be reached in 2020
for men, and in 2040 for women
Retirement age: continued gradual increase in most of the countries – to 65 or 67 years
10

PwC
Conclusions Characteristics shared by most EU countries
Income tax
rates
Popular tax
allowances
Income tax
tendencies
Social security
contributions
Progressive tax rates are prevalent in European countries (with the highest tax rate usually in
the range of 40% to 50%)
There are child allowances in most of the countries, also joint filing of tax returns for couples in
about a half of the countries, many countries employ other tax allowances
Tax cuts, tax-free threshold raises and tax threshold indexation in a couple of countries
On average, about 30% to 40% of the employees remuneration; the retirement age gradually
being increased to 65 to 67 years in many countries
11

PwC
Personal income taxes are not all there is… CIT and VAT – changes (1/2)
The reduced VAT rate was raised for certain goods from 10% to 13% (effective from
1 January 2016) Austria
The CIT rate is reduced
2013 – 25%
2014 – 24.5%
2015 – 23.5%
Denmark
In January 2014, the main VAT rate was raised from 18% to 19%, and one of the reduced
rates was raised from 8% to 9% Cyprus
In 2015, a second reduced VAT rate of 10% was introduced Czech
Republic
In 2015, the CIT rate was reduced from 21% to 20% Estonia
12

PwC
Personal income taxes are not all there is… CIT and VAT – changes (2/2)
CIT rate cut: before 31 March 2015, the CIT rate was 21%. Now: 20% United
Kingdom
In 2014, the CIT rate was reduced from 24.5% to 20% Finland
Effective from 1 January 2014, the main VAT rate was raised from 19.6% to 20%, and the
reduced rate was raised from 7% to 10% France
Raise of three VAT rates: before 1 January 2015, the VAT rates was: 15%, 12%, 6%, 3%,
0%. Now: 17%, 14%, 8%, 3%, 0%. Luxembourg
The CIT rate was reduced from 30% to 25% (for the periods starting 1 January 2016 or
later) Spain
13
Romania 2016 change of VAT rates: from 24 to 20%; another
decrease planned in 2017

PwC
Tax revenue as a percentage of GDP
0%
5%
10%
15%
20%
25%
30%
35%
40%
45%
50%
Source: Taxation trends in the European Union, 2015 Edition
14

PwC
Selected taxes as a percentage of total taxation (in alphabetical order) (1/2)
Country
Indirect taxes
(VAT, excise duty, customs
duty, etc.) CIT PIT Social security contributions
Austria 34.4 5.5 23.5 34.6
Belgium 29.4 6.8 28.0 32.2
Bulgaria 55.3 6.8 10.6 25.8
Croatia 50.8 5.6 10.3 32.1
Cyprus 42.7 17.8 11.3 25.9
Czech Republic 35 9.5 10.8 44.5
Denmark 35 6.3 50.9 1.9
Estonia 43.7 4.5 16.5 35.3
Finland 33.3 5 29.4 29.8
France 34.9 5 18.8 37.9
Greece 37.6 3.3 20.6 32.1
Spain 32.9 6.6 23.8 36.8
Netherlands 30.4 5.4 19.6 41
Ireland 39.1 8.5 33.8 15.3
Source: Taxation trends in the European Union, 2015 Edition
15

PwC
Selected taxes as a percentage of total taxation (in alphabetical order) (2/2)
Country
Indirect taxes
(VAT, excise duty, customs
duty, etc.) CIT PIT Social security contributions
Lithuania 41.9 4.8 12.9 40.3
Luxembourg 33 13.4 22 29.3
Latvia 42.2 5.7 20.4 30.2
Malta 40.7 18.7 20.1 18
Germany 29.2 6.9 22.5 39.8
Poland 40.4 6.6 14.1 37.7
Portugal 42.9 8.7 18.3 28
Romania 47.2 7.6 12.3 31.2
Slovakia 36.1 8.5 9.2 44.2
Slovenia 38.8 3.4 15.6 40.5
Sweden 42.3 6.5 34.4 16.2
Hungary 47.1 3.3 13.8 33.8
United Kingdom 38.5 8.1 27.1 18.8
Italy 34.5 5.1 27.8 30.8
Source: Taxation trends in the European Union, 2015 Edition
16

Thank you!
Tomasz Barańczyk
Managing Partner
PwC, Tax and Legal Services
Phone: + 48 22 746 4852
Joanna Narkiewicz-Tarłowska
Director
PwC, Tax and Legal Services
Phone: 502 184 764
© 2016 PwC Poland Sp. z o.o.
This presentation has been prepared for general guidance only and it does not
constitute advice within the meaning of the relevant Polish laws and regulations.
You should not rely on the information contained in this presentation in your
actions/decisions without first obtaining professional advice. No warranty
(express or implied) is given as to the correctness or accuracy of the information
contained in our presentation. Moreover, to the extent permitted by the laws of
Poland, PwC Polska Sp. z o.o., its partners, employees and agents do not
assume any liability to you or accept any responsibility, contractual or otherwise,
for any losses, damage or expenditure which may be a direct or indirect
consequence of any action taken on the basis of the information contained in our
presentation or decisions taken on the basis of this presentation.
Mikołaj Woźniak
Vice Director
PwC, Tax and Legal Services
Phone: 519 507 449

PwC
Annex 1 – Personal income tax rates in the EU
18

PwC
Ranking of countries by tax rates (the highest tax bracket)*
Rank Country Tax rate (%)
1. Bulgaria 10 (flat rate)
2. Lithuania 15 (flat rate)
3. Hungary 16 (flat rate)/ from 2016 – 15
4. Romania 16 (flat rate)
5. Estonia 20
6. Czech
Republic
22
7. Latvia 23 (flat rate)
8. Slovakia 25
9. Poland 32
10. Cyprus 35
11. Malta 35
12. Croatia 40
13. Luxembourg 40
14. Ireland 40
Rank Country Tax rate (%)
15. Italy 43 (+ regional, local district and solidarity taxes depending
on income)
16. United
Kingdom
45
17. Germany 45 (plus solidarity tax at 5.5% of the tax)
18. Spain 47 / from 2016: 45
19. Finland 48 (including state and local district tax)
20. France 49
21. Greece 50 (including solidarity tax of 8%)
22. Slovenia 50
23. Belgium 50
24. Denmark 51.7 (including state and local district tax)
25. Netherlands 52
26. Austria 50 / from 2016: 55
27. Portugal 56.5 (including solidarity tax of 8.5%)
28. Sweden 57 (including state and local district tax)
* It should be borne in mind that, in addition to the tax rates themselves, what should be taken into account in fully identifying personal income tax charge on remunerations in each country are also tax thresholds,
the tax-free threshold, tax exemptions and allowances available, etc.
19

PwC
Ranking of countries by tax rates (the lowest tax bracket)
Rank Country Tax rate (%)
1. France 5,5
2. Luxembourg 8
3. Netherlands 8,4
4. Bulgaria 10 (flat rate)
5. Croatia 12
6. Germany 14 (plus solidarity tax at 5.5% of the tax)
7. Malta 15
8. Lithuania 15 (flat rate)
9. Czech
Republic
15
10. Romania 16 (flat rate)
11. Slowenia 16
12. Hungary 16 (flat rate)/ from 2016 – 15
13. Portugal 18 (including 3,5% solidarity tax)
14. Poland 18
Rank Country Tax rate (%)
15. Slovakia 19
16. Cyprus 20
17. Spain 20 / from 2016: 19
18. Ireland 20
19. United
Kingdom
20
20. Estonia 20 (flat rate)
21. Greece 22.7 (including solidarity tax of 0.7%)
22. Finland 22.75 (including state and local district tax)
23. Italy 23 (+ regional, local and solidarity taxes depending on
income)
24. Latvia 23 (flat rate)
25. Belgium 25
26. Sweden Ca. 32 (in the first tax bracket – municipial tax only)
27. Denmark Ok. 32 (including state and municipial tax)
28. Austria 36,5/ from 2016: 25
20

PwC
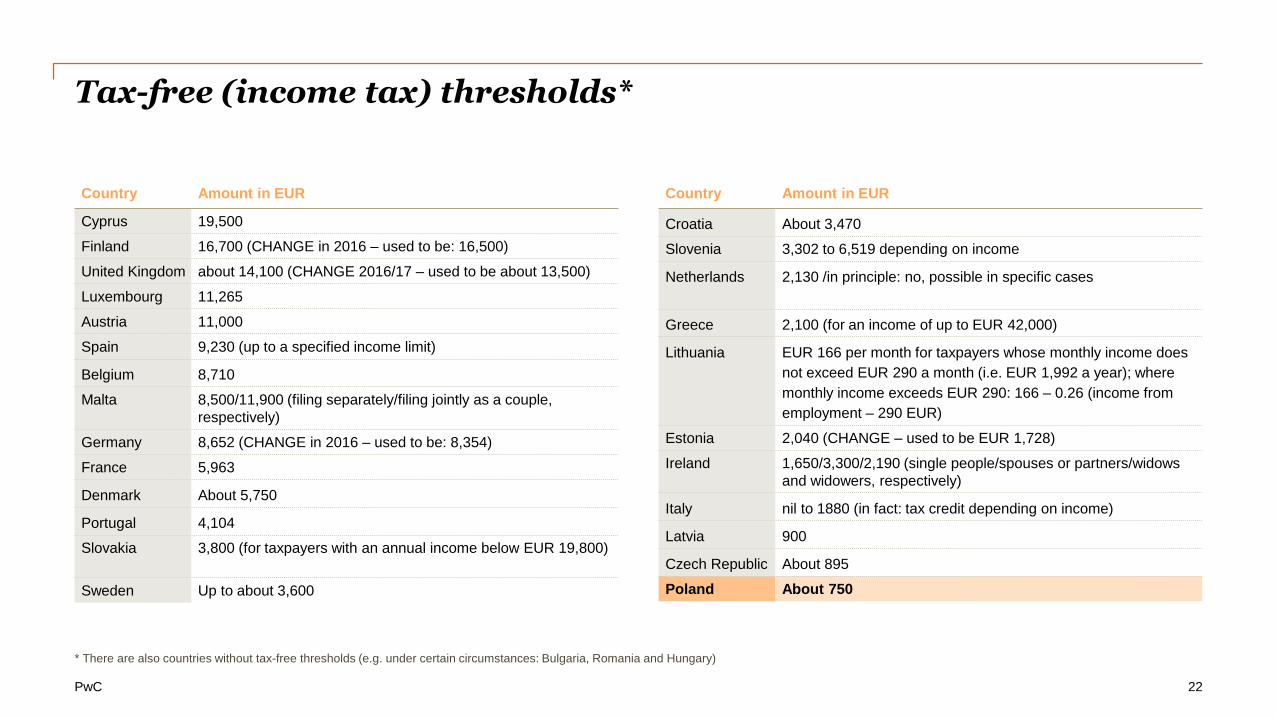
Annex 2: Tax-free (income tax) thresholds in EU member states
21
PwC
Tax-free (income tax) thresholds*
Country Amount in EUR
Cyprus 19,500
Finland 16,700 (CHANGE in 2016 – used to be: 16,500)
United Kingdom about 14,100 (CHANGE 2016/17 – used to be about 13,500)
Luxembourg 11,265
Austria 11,000
Spain 9,230 (up to a specified income limit)
Belgium 8,710
Malta 8,500/11,900 (filing separately/filing jointly as a couple,
respectively)
Germany 8,652 (CHANGE in 2016 – used to be: 8,354)
France 5,963
Denmark About 5,750
Portugal 4,104
Slovakia 3,800 (for taxpayers with an annual income below EUR 19,800)
Sweden Up to about 3,600
Country Amount in EUR
Croatia About 3,470
Slovenia 3,302 to 6,519 depending on income
Netherlands 2,130 /in principle: no, possible in specific cases
Greece 2,100 (for an income of up to EUR 42,000)
Lithuania EUR 166 per month for taxpayers whose monthly income does
not exceed EUR 290 a month (i.e. EUR 1,992 a year); where
monthly income exceeds EUR 290: 166 – 0.26 (income from
employment – 290 EUR)
Estonia 2,040 (CHANGE – used to be EUR 1,728)
Ireland 1,650/3,300/2,190 (single people/spouses or partners/widows
and widowers, respectively)
Italy nil to 1880 (in fact: tax credit depending on income)
Latvia 900
Czech Republic About 895
Poland About 750
* There are also countries without tax-free thresholds (e.g. under certain circumstances: Bulgaria, Romania and Hungary)
22

PwC
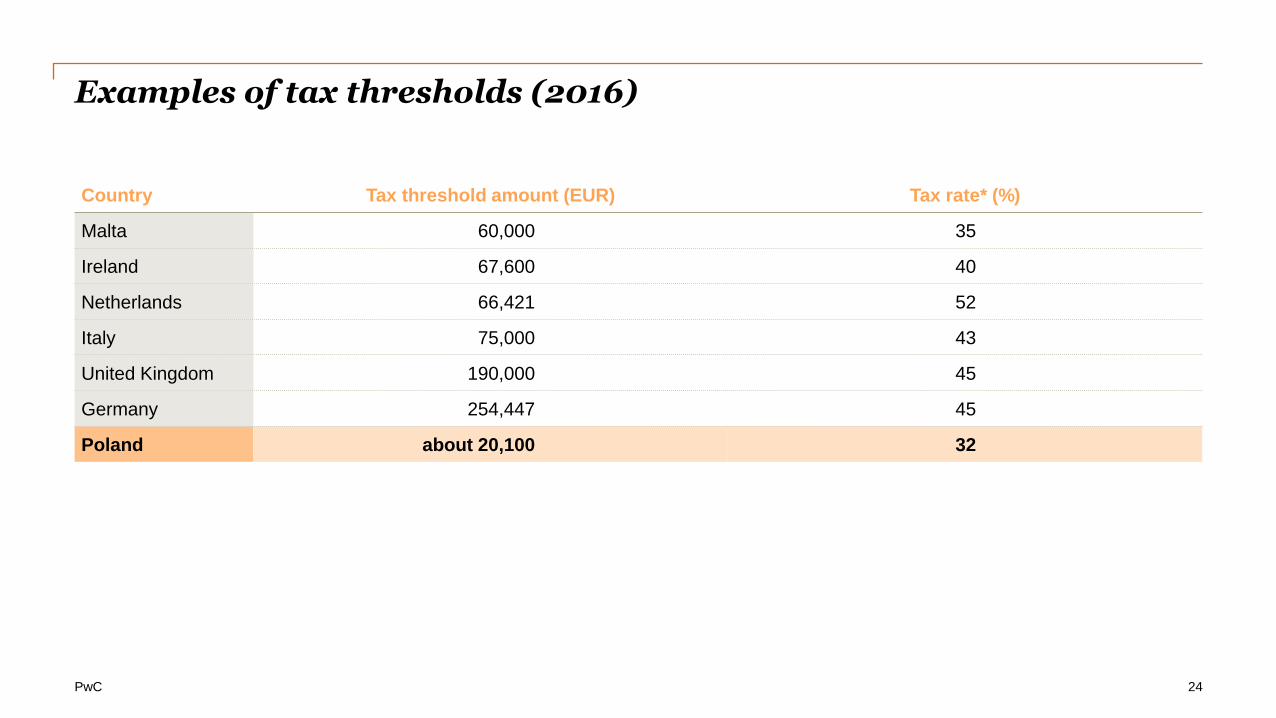
Annex 3: Examples of tax thresholds in the EU
23
PwC
Examples of tax thresholds (2016)
Country Tax threshold amount (EUR) Tax rate* (%)
Malta 60,000 35
Ireland 67,600 40
Netherlands 66,421 52
Italy 75,000 43
United Kingdom 190,000 45
Germany 254,447 45
Poland about 20,100 32
24
PwC
Annex 4 – Social security contributions in the EU
25

PwC
Social security contributions on remuneration – ranking by the cost to the employer (1/2)*
Rank Country Cost to employer (%) Cost to employee (%) Total social security contribution (%)
1. Luxembourg 8 8 16
2. Slowenia 8,85 15,5 24,35
3. Denmark 10 5 15
4. Malta 10 (+ additional state
funds
of 50% of the
contribution)
10 20 (+ additional state funds
of 50% of the contribution)
5. Ireland 10,75 0 (4) 14,75
6. Cyprus 11,5 7,8 15,6
7. United Kingdom 13,8 2 (12) 15,8 (25,8)
8. Croatia 17,2 20 37,2
9. Finland 17,35 5,7 (7,2) 23,05 (24,55)
10. Bulgaria 17,8-18,5 12,9 30,7-31,4
11. Netherlands 18,81 28,15 46,96
12. Germany 19,32 18,32 42,6
13. Austria 21,63 18,07 39,7
14. Polska 22,67 14.96 (including the non-
deductible portion of the
health insurance
conribution)
37,63
26
*At the highest rate in each category
PwC
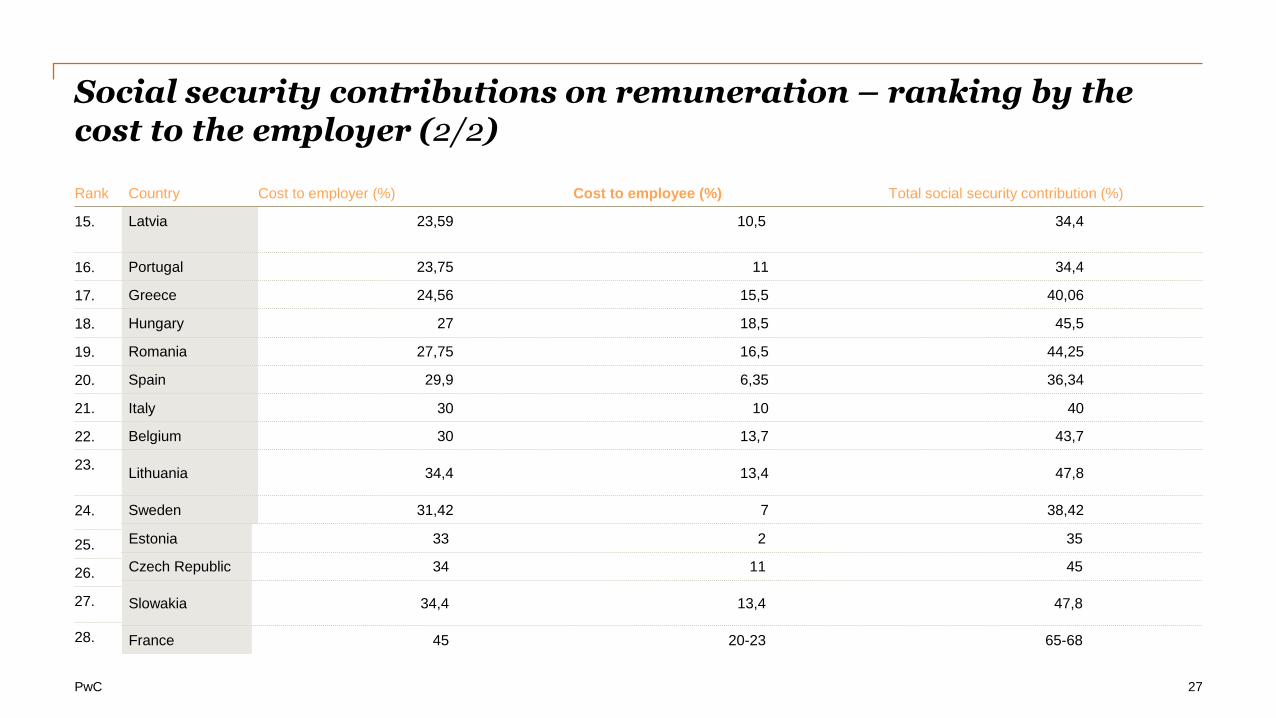
Social security contributions on remuneration – ranking by the cost to the employer (2/2) Rank Country Cost to employer (%) Cost to employee (%) Total social security contribution (%)
15. Latvia 23,59 10,5 34,4
16. Portugal 23,75 11 34,4
17. Greece 24,56 15,5 40,06
18. Hungary 27 18,5 45,5
19. Romania 27,75 16,5 44,25
20. Spain 29,9 6,35 36,34
21. Italy 30 10 40
22. Belgium 30 13,7 43,7
23. Lithuania 34,4 13,4 47,8
24. Sweden 31,42 7 38,42
27
25.
26.
27.
28.
Estonia 33 2 35
Czech Republic 34 11 45
Slowakia 34,4 13,4 47,8
France 45 20-23 65-68

PwC
Annex 5 – retirement age in the EU
28
PwC
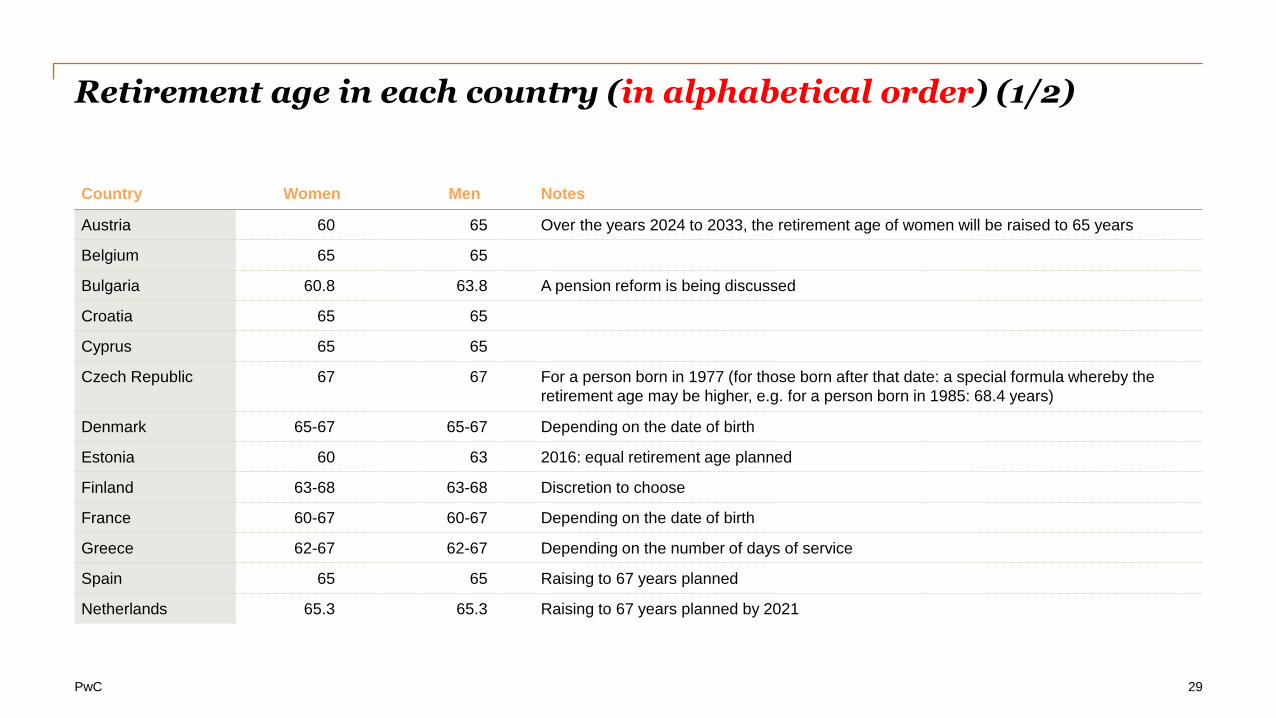
Retirement age in each country (in alphabetical order) (1/2)
Country Women Men Notes
Austria 60 65 Over the years 2024 to 2033, the retirement age of women will be raised to 65 years
Belgium 65 65
Bulgaria 60.8 63.8 A pension reform is being discussed
Croatia 65 65
Cyprus 65 65
Czech Republic 67 67 For a person born in 1977 (for those born after that date: a special formula whereby the
retirement age may be higher, e.g. for a person born in 1985: 68.4 years)
Denmark 65-67 65-67 Depending on the date of birth
Estonia 60 63 2016: equal retirement age planned
Finland 63-68 63-68 Discretion to choose
France 60-67 60-67 Depending on the date of birth
Greece 62-67 62-67 Depending on the number of days of service
Spain 65 65 Raising to 67 years planned
Netherlands 65.3 65.3 Raising to 67 years planned by 2021
29

PwC
Retirement age in each country (in alphabetical order) (2/2)
Country Women Men Notes
Ireland 65 65
Lithuania 61.4 63.2 Raising to 65 years planned by 2026
Luxembourg 65 65
Latvia 62 62
Malta 65 65
Germany 65 65 Raising to 67 years planned by 2029
Portugal 66 66
Romania 63 65
Slovakia 62 62
Slovenia 58.4-65 58.8-65 Depending on the insurance period
Sweden 65 65
Hungary 62 62 Raising to 65 years planned by 2022
United Kingdom 60 65 Raising to 68 years planned for both sexes
Italy 63.9 66.3
30

PwC
Annex 6: CIT and VAT rates in each country
31

PwC
VAT and CIT rates in each country (in alphabetical order) (1/2)
Country VAT rate CIT rate
Austria 20%, 13% 25%
Belgium 21%, 12%, 6%, 0% 33.99%
Bulgaria 20%, 9%, 0% 10%
Croatia 25%, 13%, 5% 20%
Cyprus 19%, 9%, 5%, 0% 12.5%
Czech Republic 21%, 15%, 10%, 0% 19%
Denmark 25%, 0% 22%
Estonia 20%, 9%, 0% 20%
Finland 24%, 14%, 10%, 0% 20%
France 20%, 10%, 5%, 2.1%, 0% 33.33%
Greece 23%, 13%, 6.5%, 0% 26%
Spain 21%, 10%, 4% 25%
Netherlands 21%, 6%, 0% 25%, 20%
Ireland 23%, 13.5%, 9%, 0% 12.5%
32

PwC
VAT and CIT rates in each country (in alphabetical order) (2/2)
Country VAT rate CIT rate
Lithuania 21%, 9%, 6%, 5%, 0% 15%, 5% (small enterprises and farmers)
Luxembourg 17%, 14%, 8%, 3%, 0% 20%, 21%
Latvia 21%, 12%, 0% 15%
Malta 18%, 7%, 5%, 0% 35%
Germany 19%, 7% 15%
Poland 23%, 8%, 5%, 0% 19%
Portugal 23%, 13%, 6%, 0% 21%, 17%
Romania 24%, 9%, 0% 16%
Slovakia 20%, 10%, 0% 22%
Slovenia 22%, 9.5% 17%
Sweden 25%, 12%, 6%, 0% 22%
Hungary 27%, 18%, 5% 10%, 19%
United Kingdom 20%, 5%, 0% 20%
Italy 22%, 10%, 4% 27.5%
33
Related Documents