University of South Florida Scholar Commons Graduate eses and Dissertations Graduate School January 2012 Women's Political Representation in Europe: An Analysis of Structural and Aitudinal Factors Jenna Elaine Mcculloch University of South Florida, [email protected] Follow this and additional works at: hp://scholarcommons.usf.edu/etd Part of the American Studies Commons , European Languages and Societies Commons , Political Science Commons , and the Women's Studies Commons is esis is brought to you for free and open access by the Graduate School at Scholar Commons. It has been accepted for inclusion in Graduate eses and Dissertations by an authorized administrator of Scholar Commons. For more information, please contact [email protected]. Scholar Commons Citation Mcculloch, Jenna Elaine, "Women's Political Representation in Europe: An Analysis of Structural and Aitudinal Factors" (2012). Graduate eses and Dissertations. hp://scholarcommons.usf.edu/etd/4153

Welcome message from author
This document is posted to help you gain knowledge. Please leave a comment to let me know what you think about it! Share it to your friends and learn new things together.
Transcript

University of South FloridaScholar Commons
Graduate Theses and Dissertations Graduate School
January 2012
Women's Political Representation in Europe: AnAnalysis of Structural and Attitudinal FactorsJenna Elaine MccullochUniversity of South Florida, [email protected]
Follow this and additional works at: http://scholarcommons.usf.edu/etd
Part of the American Studies Commons, European Languages and Societies Commons, PoliticalScience Commons, and the Women's Studies Commons
This Thesis is brought to you for free and open access by the Graduate School at Scholar Commons. It has been accepted for inclusion in GraduateTheses and Dissertations by an authorized administrator of Scholar Commons. For more information, please contact [email protected].
Scholar Commons CitationMcculloch, Jenna Elaine, "Women's Political Representation in Europe: An Analysis of Structural and Attitudinal Factors" (2012).Graduate Theses and Dissertations.http://scholarcommons.usf.edu/etd/4153

Women’s Political Representation in Europe:
An Analysis of Structural and Attitudinal Factors
by
Jenna Elaine McCulloch
A thesis submitted in partial fulfillment of the requirements for the degree of
Master of Arts
Department of Government and International Affairs
College of Arts and Sciences
University of South Florida
Major Professor: Kiki Caruson, Ph.D.
M. Scott Solomon, Ph.D.
Peter N. Funke, Ph.D.
Date of Approval:
June 26, 2012
Keywords: Politics, Female Representation, Religiosity, Gender Quotas, European
Elections
Copyright © 2012, Jenna Elaine McCulloch

Acknowledgments
I wish to thank the chair of my thesis committee, Dr. Kiki Caruson, for all of her
help and encouragement throughout this process, especially for her assistance with the
quantitative analyses. I greatly appreciate her patience with my constant desire for
perfection. I also want to thank Dr. M. Scott Solomon and Dr. Peter N. Funke for their
suggestions and feedback on my work. Finally, I wish to express my gratitude to my
family for their incredible patience, understanding, and support over the years.

i
Table of Contents
List of Tables .................................................................................................................... iv
List of Figures ......................................................................................................................v
Abstract .............................................................................................................................. vi
Chapter 1: Introduction ........................................................................................................1
Why Europe? ...........................................................................................................3
Chapter 2: Literature Review ...............................................................................................7
Substantive Representation ......................................................................................7
Structural and Attitudinal Factors ..........................................................................11
Women’s Suffrage .................................................................................................12
Electoral System ....................................................................................................13
Proportional representation ........................................................................13
Majoritarian systems ..................................................................................16
Mixed systems ...........................................................................................17
Gender Quotas .......................................................................................................18
Gender Equality .....................................................................................................22
Female Professionals .............................................................................................25
Religiosity ..............................................................................................................27
Theoretical Framework ..........................................................................................32
Hypotheses .................................................................................................33
Chapter 3: Research Methodology.....................................................................................35
Operationalization of Variables .............................................................................35
Dependent variable ....................................................................................35
Independent variables ................................................................................36
Women’s suffrage ..........................................................................36
Electoral system .............................................................................36
Gender quotas ................................................................................37
Gender equality ..............................................................................38
Female professionals ......................................................................38
Religiosity ......................................................................................39
Chapter 4: Quantitative Results .........................................................................................41
Europe-wide Model ...............................................................................................41

ii
Western Europe Model ..........................................................................................45
Eastern Europe Model............................................................................................49
Chapter 5: Introduction to Western Europe Case Studies .................................................54
Chapter 6: Sweden .............................................................................................................56
Women’s Representation since Suffrage ...............................................................56
Electoral System ....................................................................................................58
Gender Quota .........................................................................................................59
Gender Equality .....................................................................................................61
Female Professionals .............................................................................................63
Religiosity ..............................................................................................................64
Impact on Substantive Representation ...................................................................65
Conclusion .............................................................................................................65
Chapter 7: Ireland ..............................................................................................................66
Women’s Representation since Suffrage ...............................................................67
Electoral System ....................................................................................................68
Gender Quota .........................................................................................................70
Gender Equality .....................................................................................................73
Female Professionals .............................................................................................75
Religiosity ..............................................................................................................77
Impact on Substantive Representation ...................................................................78
Conclusion .............................................................................................................79
Chapter 8: Introduction to Eastern Europe Case Studies ...................................................81
Chapter 9: Macedonia ........................................................................................................83
Women’s Representation since Suffrage ...............................................................84
Electoral System ....................................................................................................85
Gender Quota .........................................................................................................87
Gender Equality .....................................................................................................89
Female Professionals .............................................................................................91
Religiosity ..............................................................................................................92
Impact on Substantive Representation ...................................................................94
Conclusion .............................................................................................................94
Chapter 10: Hungary ..........................................................................................................96
Women’s Representation since Suffrage ...............................................................97
Electoral System ....................................................................................................98
Gender Quota .......................................................................................................100
Gender Equality ...................................................................................................104
Female Professionals ...........................................................................................106
Religiosity ............................................................................................................107
Impact on Substantive Representation .................................................................109
Conclusion ...........................................................................................................109

iii
Chapter 11: Conclusion....................................................................................................111
List of References ............................................................................................................117
Appendices…….. .............................................................................................................130
Appendix A: Calculation of Religiosity ..............................................................131
Variable name (v109): how often attend religious services .....................131
Variable name (v6): how important in your life: religion ........................131
Appendix B: Complete Data ................................................................................133
Appendix C: Correlations ....................................................................................136
Appendix D: Regressions without Female Professionals Variable .....................139

iv
List of Tables
Table 1: Europe-wide Model: OLS Regression Results ....................................................42
Table 2: Western Europe Model: OLS Regression Results ...............................................46
Table 3: Eastern Europe Model: OLS Regression Results ................................................50
Table 4: History of Women’s Political Representation in Sweden’s Riksdag ..................57
Table 5: History of Women’s Political Representation in Ireland’s Dáil ..........................68
Table 6: History of Women’s Political Representation in Macedonia’s Sobranie ............84
Table 7: History of Women’s Political Representation in Hungary’s Országgyülés ........97
Table B1: Europe-wide Data ...........................................................................................133
Table B2: Western Europe Data ......................................................................................134
Table B3: Eastern Europe Data ........................................................................................135
Table C1: Europe-wide Correlations ...............................................................................136
Table C2: Western Europe Correlations ..........................................................................137
Table C3: Eastern Europe Correlations ...........................................................................138
Table D1: Europe-wide Model without Female Professionals Variable .........................139
Table D2: Western Europe Model without Female Professionals Variable ....................139

v
List of Figures
Figure 1: Percent of Women in National Legislatures .........................................................4
vi
Abstract
In this mixed methods study, I explore the reasons for the low level of women in
elected office in Europe. I analyze the impact of three structural factors (number of years
since women’s suffrage was enacted, type of electoral system, and presence of legal
gender quotas) and three attitudinal factors (level of gender equality, percentage of
female professionals, and level of religiosity) on the percentage of women in national
legislatures in each of the European countries. Specifically, I pose the following research
question: Which structural and/or attitudinal factors are more influential for women’s
political representation in European countries?
In order to answer this question, I begin by performing ordinary least squares
(OLS) regression analyses of the variables. My Europe-wide and Western Europe
regression results indicate that there is a statistically significant positive relationship
between the favorability of a country’s electoral system to the election of women and the
level of women’s political representation in that country. Proportional representation
electoral systems are particularly beneficial to female candidates. In addition, unlike
previous scholars who focus on the dominant religion, I apply the concept of religiosity
(the importance of religion to a country’s citizens) to women’s political representation. I
find a statistically significant negative relationship between the level of religiosity in a
country and the level of women’s political representation in that country. Countries in

vii
which citizens are particularly religious tend to be conservative and less likely to
encourage the election of women. However, none of the variables are statistically
significant in the regression analysis of Eastern Europe, which indicates the need to take
regional factors into consideration.
In the second part of the study, I examine four case studies (Sweden, Ireland,
Hungary, and Macedonia). The case studies permit in-depth analyses of the individual
countries, and show the manner in which structural and attitudinal factors interact in a
particular country context. In the case of Macedonia, structural factors have mitigated the
effects of negative attitudinal factors. In most of the case studies, however, a combination
of structural (electoral system and gender quotas) and attitudinal factors (gender equality
and religiosity) affect the level of women’s political representation in the country.
Ultimately, the case studies demonstrate how the country-specific context impacts the
election of women to parliament.

1
Chapter 1: Introduction
In 1968, Jane Dillon Byrne was campaigning for a seat on the local council in
Ireland: “I was married 10 months, 9 months pregnant. I met a lady at a door in
Booterstown who said: ‘You are a bloody disgrace, you should be at home doing your
knitting’” (qtd. in Daly, 2012). Four decades later, women continue to face various
barriers to elected office. In 2007, Irish Prime Minister Bertie Ahern used his influence to
persuade voters to give preference to his friend Cyprian Brady over the female candidate,
Mary Fitzpatrick (Ruane, 2011). Electoral challenges are not limited to Western Europe;
women in Eastern European countries also face barriers to elected office. For example, a
male Polish politician told the media in 2011 that “unattractive” female candidates would
“repel voters” (qtd. in Day, 2011).
According to the Inter-Parliamentary Union (IPU, Nov. 2011), the worldwide
average for women in legislatures1 is a mere twenty percent. The European average is
only slightly higher at approximately twenty-four percent (IPU, Nov. 2011). Scholars
have offered a number of explanations for the low level of women in elected office,
including structural and attitudinal factors. Structural explanations include the type of
electoral system or the absence of gender quotas (see e.g. Kenworthy & Malami, 1999;
Kittilson, 2006; Paxton, 1997; Reynolds, 1999; Ruedin, 2012). Scholars have also
1 Lower or single national legislative house.

2
proposed explanations that focus on citizens’ traditional attitudes towards gender roles
(measured via the country’s dominant religion) and the overall climate towards gender
equality in a given country (see e.g. Paxton & Kunovich, 2003; Ruedin, 2012).
The lack of women in office is problematic for the notion of democracy (Galligan,
2009, p. 283; Leyenaar, 2004). Specifically, the concept of representative democracy
specifies that a “representative body should reflect the diversity of the electorate and MPs
are elected by ‘their own’ constituents and accountable to them” (Leyenaar, 2004, p.
230). Thus, a male-dominated legislature obviously does not reflect the gender make-up
of society in general. Indeed, proponents of parliamentary gender quotas in France argued
that “there could be no true democracy without the full representation of each sex”
(Leyenaar, 2004, p. 228). In addition, gender parity in government institutions
“strengthens the equality principle and the democratic character of the political bodies
and it means an efficient use of potential talent and ability” (Leyenaar, 2004, p. 8). In
other words, a representative democracy leads to better governance.
Female legislators are important not only for democratic purposes, but also
because of their power to take action: “Representatives do have autonomy, which is why
it matters who those representatives are” (Phillips, 1995, p. 78). Indeed, the lack of
women in legislatures around the world is of great concern due to the concept of
substantive representation. Hanna Fenichel Pitkin (1967) notes that substantive
representation is defined as “acting in the interest of the represented, in a manner
responsive to them” (p. 209). Thus, the focus is on actively “acting for,” rather than
passively “standing for” a particular constituency (Pitkin, 1967, p. 60-1; p. 112-3;
Galligan, Clavero, & Calloni, 2007, p. 40). Substantive representation focuses on the idea

3
that an elected official “seeks to advance a group’s policy preferences and interests”
(Lovenduski, 2005, p. 3). In the case of female politicians, it means that they “represent
women’s concerns…[and] feel they have a specific responsibility to speak for women’s
interests” (Galligan, 2009, p. 280). Women often “bring a different set of attitudes,
interests, and priorities to policy making” (Bratton & Ray, 2002, p. 428). Specifically,
various studies have found that female representatives speak on behalf of their female
constituents and address women’s policy issues more so than their male counterparts
(Bratton & Ray, 2002; Catalano, 2009; Childs, 2001; Childs & Withey, 2006; Meyer,
2003; Osborn & Mendez, 2010; Swers, 1998; Wangnerud, 2000). Thus, based on the
premise of substantive representation, the absence of gender parity in the legislature
damages “the legitimacy of the outcome of political decision-making” (Leyenaar, 2004,
p. 3).
Why Europe?
Most contemporary quantitative studies of women’s political representation tend
to have a global focus (see e.g. Kenworthy & Malami, 1999; Paxton, 1997; Paxton &
Kunovich, 2003; Reynolds, 1999; Ruedin, 2012). In addition, a continent-wide
quantitative investigation of women’s political representation has largely been ignored in
favor of case study analyses. The few cross-national quantitative studies of European
women’s representation primarily investigate the situation in Western Europe (e.g.
Kittilson, 2006; Norris, 1985), rather than conducting an analysis of the whole continent.
This is why there is a clear need for a quantitative study of Europe in its entirety.
Concentration on female politicians in Europe allows for the evaluation of region-specific
factors. Furthermore, as the continent becomes more integrated via European Union (EU)

4
membership, there arguably needs to be a more comprehensive analysis of women’s
representation at the home country-level.
Figure 1: Percent of Women in National Legislatures2
Data source: IPU (Nov. 2011).
The diverse landscape is arguably the most important reason for a study of
women’s representation in the European continent. Across Europe, the political
representation of women varies significantly, from a mere eight percent of female
representatives in Ukraine’s parliament to forty-five percent in Sweden’s Riksdag (IPU,
Nov. 2011) (see Figure 1). Indeed, the clear difference between the percent of women
elected to national legislatures in Western Europe versus Eastern Europe warrants
2 Percent of women in the lower or single national legislative house.

5
investigation. Under communism, women were present in high numbers in legislatures
(Moser, 2001, p. 355). However, their presence was more “symbolic” than substantive
(Rueschemeyer and Wolchik, 2009a, p. 9), and their actual power was limited (Moser,
2001, p. 355; Wolchik, 1998, p. 288). As the statistics demonstrate, since the fall of
communism, Eastern European countries have struggled to elect women to political
office.
In this study, I explore the impact of three structural factors (number of years
since women’s suffrage was enacted, type of electoral system, and presence of legal
gender quotas) and three attitudinal factors (level of gender equality, percentage of
female professionals, and level of religiosity) on the percentage of women in national
legislatures in Europe. Specifically, I pose the following research question: Which
structural and/or attitudinal factors are more influential for women’s political
representation in European countries?
I begin by providing an overview of relevant literature on this subject. I then
discuss the operationalization of the variables that are used to predict female
representation across Europe and implement three ordinary least squares (OLS)
regression models. I create three separate models (Europe-wide, Western Europe, and
Eastern Europe) in order to account for regional differences. My regression results
indicate that the type of electoral system and the level of religiosity tend to influence
women’s representation in the Europe-wide model, as well as in the Western Europe
model. However, none of the variables are statistically significant in the Eastern Europe
regression analysis, thereby indicating the importance of regional differences. In the
second part of the study, I examine four case studies (Sweden, Ireland, Hungary, and

6
Macedonia). The case studies permit in-depth analyses of the individual countries, and
show the manner in which structural and attitudinal factors interact in a particular country
context. In addition, the case study analyses also allow for a brief investigation of the
impact of female members of parliament (MPs) on the substantive representation of
women. In the case of Macedonia, structural factors (the list-PR electoral system and the
presence of a legal gender quota) have mitigated the effects of negative attitudinal factors
(low gender equality and high religiosity). In most of the case studies, however, a
combination of structural (electoral system and gender quotas) and attitudinal factors
(gender equality and religiosity) affect the level of women’s political representation in the
country. Ultimately, the case studies demonstrate how the country-specific context
impacts the election of women to parliament

7
Chapter 2: Literature Review
In this chapter, I begin by detailing the literature on substantive representation
since it pertains to the importance of women’s political representation. I then provide an
overview of the debate as to whether or not structural or attitudinal factors are more
influential for women’s political representation. Specifically, I discuss the literature on
structural barriers, including: women’s suffrage, electoral systems, and gender quotas. I
then discuss the previous literature on the following attitudinal factors: gender equality,
female professionals, and religiosity. Finally, I explain my theoretical framework and
hypotheses.
Substantive Representation
Substantive representation suggests that an elected official “seeks to advance a
group’s policy preferences and interests” (Lovenduski, 2005, p. 3). When applied to
female parliamentarians, substantive representation means that they “represent women’s
concerns…[and] feel they have a specific responsibility to speak for women’s interests”
(Galligan, 2009, p. 280). Thus, as previously mentioned, the focus is on the concept of
“acting for,” rather than just “standing for” particular constituents (Pitkin, 1967, p. 60-1;
112-3).
There is considerable evidence to support the presence of substantive
representation in Western Europe. For example, Kathleen A. Bratton and Leonard P. Ray
(2002) find that female legislators in Norwegian local governments have a positive

8
influence on the agenda-setting process (p. 429). Specifically, they find that “the women
elected to local councils brought a new set of concerns to the political agenda” (Bratton
& Ray, 2002, p. 435). For instance, female legislators champion child care policy, which
is an issue that is very important to women (Bratton & Ray, 2002, p. 435). In Britain,
research shows that female MPs are more likely to speak on behalf of issues that women
tend to prioritize such as health care (Catalano, 2009, p. 61). Similarly, Sarah Childs and
Julie Withey (2006) discuss the substantive impact of female British Labour MPs in
successfully getting the VAT on feminine products reduced by 12.5 percent (p. 10). In
nearby Northern Ireland, interviews with female legislators demonstrate that they are
“more concerned than men with issues of healthcare, childcare, education, and eldercare”
(Cowell-Meyers, 2001, p. 72). Finally, female legislators in Germany championed
divorce reform in the 1970s that benefitted women (Meyer, 2003, p. 415).
In Eastern Europe, substantive representation varies by country. In Slovenia,
Milica G. Antić (2009) finds that male MPs “never mentioned matters related to gender
equality, which is why we conclude that male and female deputies thus have different
policy priorities; women MPs clearly pay more attention to gender-sensitive issues” (p.
103). However, the substantive representation of women in Eastern Europe seems to be a
relatively new phenomenon, as it did not occur during the communist era (Wolchik,
1998, p. 288-9). In addition, the country-specific context matters. For example, in Russia,
the “postcommunist gender discourse limits the ability and willingness of female
politicians to protect nontraditional women’s interests, because by accentuating these
issues, women politicians may alienate themselves from the mainstream political
process” (Shevchenko, 2007, p. 130). Thus, it is not surprising that in Russia party

9
membership primarily dictates voting choices rather than gender (Shevchenko, 2007, p.
142). However, female Russian politicians do vote in favor of some “neotraditionalist
issues dealing with children and family matters,” regardless of party membership
(Shevchenko, 2007, p. 143).
While the Russian example alludes to the importance of party membership, it
should also be noted that in some countries, there are differences between the positions
taken by male and female parliamentarians of the same party. For example, female
parliamentarians tend to devote more attention to welfare policy (Wangnerud, 2000, p.
68). In the U.K., survey evidence indicates that male Conservative Party members are
more supportive of public spending cuts than female party members (Campbell & Childs,
2012). Similarly, in the debate on the Equal Rights Act of 1957 in West Germany, the
“confrontation took place across party lines, with male [MPs] opposing female MPs. The
women argued progressively and unequivocally for recognition of all rights while the
men often dismissed equality as unnatural ‘equalizing’” (Meyer, 2003, p. 412).
Furthermore, in the U.S., Michele L. Swers (1998) finds that “moderately conservative
Republican women are far more likely to vote in favor of…women’s issue bills than are
moderately conservative Republican men” (p. 444-5). Thus, she subsequently concludes:
“The Republican primary voter who subscribes to a more liberal position on women’s
issues may be better served by choosing the female candidate” (Swers, 1998, p. 445).
This is powerful evidence in favor of the need for women in government.
Female legislators have alluded to the significance of substantive representation
during interviews. In the Czech Republic, one female MP noted: “I see myself as
representing the interests of women, of those who elected me and of my party as well”

10
(Čurdová, 2009, p. 232). Similarly, a female British Labour MP said: “I don’t see men
lining up to talk about childcare, never have; [I] don’t see men lining [up] to talk about
women’s rights to abortion, never have” (qtd. Childs, 2001, p. 181). Another female
Labour MP described an instance in which a mother discussed her daughter’s rape: “I felt
she found it easier to talk to me than she may have a male MP” (Childs, 2001, p. 179).
Sarah Childs (2001) concludes that “an initial politics of transformation is occurring
within the MP-constituency relationship as a result of women’s political presence” (p.
179). In this manner, one may speculate that female constituents may come to have a
better view of government if female MPs are representing their needs.
Women’s substantive representation is perhaps not surprising when one considers
that women generally have different reasons from men for running for office.
Specifically, in Northern Ireland, Kimberly Cowell-Meyers (2001) notes:
The majority of the women interviewed view political activity as a form of
community activism or social work, an extension of their service in other
contexts. Men, in contrast, are much more likely to view politics as a kind of
individual or career activity. (p. 84)
Women also have a different leadership style than men: “Men and women differ in
attitudes to decision-making: women are more focused on consensus and balance in
communication and more democratically oriented, while men are more focused on
competition and have a more autocratic orientation” (Leyenaar, 2004, p. 82). MPs in
Eastern Europe have expressed similar sentiments (Rueschemeyer & Wolchik, 2009b, p.
262). Collectively, this evidence indicates that the representative’s gender is extremely
relevant and deserving of discussion.

11
Structural and Attitudinal Factors
Scholars have proposed a variety of reasons that impede the election of women
globally. It should be noted that factors that are significant in worldwide analyses are
sometimes not relevant when statistical analyses are performed at the regional (i.e.
Western or Eastern Europe) or country levels. Thus, in the case of Europe, levels of
democracy and industrialization are not as significant. Overall, the explanations can
largely be grouped into structural/institutional or attitudinal categories. However, debate
exists as to whether or not structural or attitudinal factors are more influential.
In their global analyses, Andrew Reynolds (1999), and Lane Kenworthy and
Melissa Malami (1999) find that both structural and attitudinal factors are statistically
significant. However, in his conclusion, Reynolds (1999) argues that religious
“foundations can…be built upon (or perhaps bypassed) by women-friendly political
institutions” (p. 572). This would indicate that the structural environment can possibly be
used to manipulate attitudinal factors. Similarly, when she conducts a worldwide
analysis, Pippa Norris (2004) finds that “structural factors appear more influential factors
affecting women’s role in public life than the proxy indicators of cultural attitudes” (p.
207). In other words, these findings point to the need to provide favorable structural
environments for women.
Yet, other scholars offer cautionary notes on structural factors: “An electoral
system only structures the context in which candidates and voters operate; it can not
determine how the incentives and disincentives embedded in that context are handled by
individual actors” (Moser, 2001, p. 358). Didier Ruedin (2012) concurs: “Studies entirely
focusing on institutional factors probably overestimate the effects of the electoral system,

12
in particular the effectiveness of voluntary party quotas” (p. 105). This indicates that the
environment towards gender is also important. Indeed, Kenworthy and Malami (1999)
observe:
To the degree politics is seen as an appropriate vocation for women and women
are viewed as capable of serving effectively in that capacity, they should be more
willing to stand for office, more likely to be nominated by party leaders, and more
likely to be chosen by voters. (p. 241)
Furthermore, if society views women as “inferior or incompetent,” logically they have a
much smaller chance of being elected to national government (Paxton, 1997, p. 446). In
the long run, Ruedin (2012) surmises that it may be more fruitful to attempt to “change
attitudes towards women in politics,” in order to increase women’s representation (p.
106). This is because a shift in attitudes “influences both the supply and demand side”
(Ruedin, 2012, p. 106). Essentially, these results indicate that attitudinal changes may
have a more significant impact on women’s political representation than structural
factors. However, there is clearly a lack of consensus among scholars over the
importance of some types of factors over others.
Women’s Suffrage
The issue of women’s suffrage is an example of the lack of consensus amongst
scholars. Some scholars find that countries that passed women’s suffrage earlier are more
likely to have a higher percentage of women in parliament (Kenworthy & Malami, 1999;
Reynolds, 1999). Specifically, Kenworthy and Malami (1999) explain: “The longer
women have had the right to vote, the larger we can expect the percentage of women who
vote to be (at least relative to their male counterparts), and the more headway we should

13
therefore expect women to have made in national politics” (p. 239). Similarly, Norris
(2004) observes a statistically significant positive relationship between the number of
years since women’s suffrage was granted and the level of female representation, even
when electoral and cultural variables are controlled for (p. 185-6). However, in a recent
worldwide quantitative analysis, Ruedin (2012) does not find the number of years since
women’s suffrage to be statistically significant when he controls for citizens’ “attitudes
towards women as political leaders” (p. 102-3). Therefore, one wonders about the
continued relevance of this factor.
Electoral System
Of the percentage of women elected to the lower house of parliament worldwide
in 2000, women accounted for 15.4 percent of legislators in proportional systems (15.6
percent from party lists systems, 10.6 percent from single transferable vote systems),
while they comprised 11.3 percent of legislators in mixed systems, and 8.5 percent in
majoritarian systems (Norris, 2004, p. 187). Indeed, the type of electoral system has
generally been found to impact the percentage of women elected to legislatures
(Kenworthy & Malami, 1999; Leyenaar, 2004; Paxton, 1997; Paxton & Kunovich, 2003;
Reynolds, 1999).
Proportional representation. Under proportional representation, multiple
candidates are selected based on the percentage of votes the candidate or party receives
(Leyenaar, 2004, p. 68). Research has found that “as a simple rule, women proved almost
twice as likely to be elected under proportional than under majoritarian electoral
systems” (Norris, 2004, p. 187). There are two types of PR systems: list-proportional
representation (list-PR), which can be either closed or open, and single transferable vote

14
(STV) (Htun & Jones, 2002, p. 37; Norris, 2004, p. 187; Schmidt, 2008b, p. 191).
Monique Leyenaar (2004) explains that under list-PR: “Seats are allocated to each party
in proportion to the share of votes that the party list received in the election” (p. 68). This
means that under the closed list system people “vote for a party’s list rather than
individual candidates, so women need not stand alone to achieve political office”
(Paxton, 1997, p. 445). In closed list ballots, the party selects the order in which the
candidates appear on the list (Htun & Jones, 2002, p. 37; Schmidt, 2008b, p. 191). In the
open list system, there is some degree of personalization as voters can select candidates
within the party lists (Htun & Jones, 2002, p. 37; Schmidt, 2008b, p. 191). Scholars have
generally found closed list-PR to be more beneficial to women than open list-PR (Htun &
Jones, 2002, p. 37-9; Meier, 2008, p. 144; Norris, 2004, p. 197). However, Reynolds
(1999) notes that in “progressive cultures,” such as Scandinavia, the opposite is true since
“women-friendly voters” are able to select female candidates (p. 555).
Overall, list-PR has a positive effect on women’s political representation for a
number of reasons (Kenworthy & Malami, 1999; Leyenaar, 2004; Paxton, 1997; Paxton
& Kunovich, 2003; Reynolds, 1999). One reason is that “parties are more likely to
nominate women for office, and voters are more likely to vote for them, if women
represent only part of a larger group of candidates” (Kenworthy & Malami, 1999, p. 237).
Indeed, Pamela Paxton and Sheri Kunovich (2003) observe that in list-PR systems,
“parties are also able to package female candidates with males, who are often perceived
as stronger candidates” (p. 90). Notably, these explanations underscore the persistence of
traditional attitudes about gender roles. The structure of the electoral system merely
mitigates the effects of these negative attitudes toward women.

15
National political parties have more control under list-PR systems because they
have “considerable influence over the nomination of candidates” (Norris, 1987, p. 129).
In addition, parties in list-PR systems “have an electoral incentive to maximize their
collective appeal in party lists” since “the exclusion of any major social sector, including
women, could signal discrimination,” which would harm the party’s electoral hopes
(Norris & Krook, 2011, p. 23). This is not the case under majoritarian systems (Norris &
Krook, 2011, p. 23).
The single transferable vote (STV) electoral system is a second form of
proportional representation. While STV also elects candidates to multimember districts, it
differs from list-PR by permitting voters to rank candidates in terms of the voters’
personal preferences (Blais & Massicotte, 1996, p. 64). Norris (2004) provides an
overview of the somewhat complex process:
To be elected, candidates must reach the minimum quota. When the first
preferences are counted, if no candidates reach the quota, then the candidate with
the least votes is eliminated, and his or her votes are redistributed according to
second preferences. (p. 55)
The idea behind STV is that “voter preferences are utilized to the full, and there is
minimal vote wastage” (Galligan, 2009, p. 151).
Under STV, the focus is on the candidate rather than the party (Sinnott, 2005, p.
112). This has a negative impact for women as “personal campaigns by the candidates are
necessary” (Leyenaar, 2004, p. 37). In Ireland, one of the few countries where STV is
practiced at the national level, “fewer women than men can afford these costly
undertakings, not least because the majority of women have traditionally not been in paid

16
employment” (Leyenaar, 2004, p. 37). Thus, it is perhaps not surprising that some
scholars indicate that list-PR offers more assistance to female candidates than
proportional representation systems in general (Kenworthy & Malami, 1999, p. 252).3
Majoritarian systems. Single-member plurality (SMP) electoral systems, which
include first-past-the-post (FPTP) and two-round systems (TRS), are the least favorable
for women seeking office (Kenworthy & Malami, 1999; Reynolds, 1999). Unlike in PR
systems, under SMP only the candidate with the most votes is elected (Leyenaar, 2004, p.
68). SMP systems are more susceptible to the incumbency advantage, which discourages
political novices (Leyenaar, 2004, p. 69; Kenworthy & Malami, 1999, p. 262; Norris &
Krook, 2011, p. 24). Indeed, Leyenaar (2004) points out that “it is much easier with a list-
PR system to make room on the list for newcomers, often women” (p. 70). There is also a
financial disadvantage for women running for SMP seats, as more campaign money is
needed (Leyenaar, 2004, p. 65). However, women tend to have lower incomes than men
(Eurostat, 2008). In addition, unlike in list-PR systems, in SMP systems “a woman or
minority candidate can stand out, making them riskier candidates for political party
investment” (Paxton, 1997, p. 445). Furthermore, Pippa Norris and Mona Lena Krook
(2011) point out that in SMP systems, “local party members often want a representative
who will maximize their chances of winning in that constituency, irrespective of the
broader consequences of the party or parliament” (p. 23). Thus, in contrast to list-PR
systems, party officials at the district level do not have to focus on ensuring diversity
(Norris, 2004, p. 208).
3 Kenworthy and Malami (1999) observe: “The standardized coefficient for the party list measure was
twice as large as that for the proportional representation measure, and the former was statistically
significant (marginally so at the .10 level) while the latter was not” (p. 252).

17
Mixed systems. Finally, there are mixed electoral systems, including mixed-
member proportional (MMP) and parallel systems. These systems, which are also known
as Additional Member Systems (AMS), tend to combine PR and SMP voting:
Voters have two ballots: one is used to vote for a party list and determines the
total number of seats for a party through PR; the other ballot is used in the
constituency to vote for a candidate by use of the SMP system. Half of the seats
are allocated on the basis of first-past-the-post elections to single-member
constituencies. The remaining seats are allocated on the basis of a national list-PR
election. (Leyenaar, 2004, p. 45)
The difference between MMP and parallel systems is that under MMP “the List PR
system compensates for the disproportionality in the results from the plurality/majority
system,” while this is not the case in parallel systems (IDEA, 2009). Norris and Krook
(2011) note that “the proportion of women elected under mixed or combined systems
usually falls somewhere between pure majoritarian and PR systems” (p. 22). Women tend
to do better on the party list ballot, than on the SMP ballot (Norris & Krook, 2011, p. 25).
For example, under Germany’s mixed system, women are elected in higher numbers via
PR lists than through SMP (Leyenaar, 2004, p. 46).
While studies have generally found that women do better on party lists than SMP
ballots, this is not always the case in Eastern Europe. Robert G. Moser (2001) found that
in Russia, “women tend to be elected in greater numbers in SMD [single-member district]
elections rather than in PR elections” (p. 365). Yet, it should be noted that Moser bases
his conclusions on data from the 1990s, while Russia adopted list-PR in 2007 (IPU
PARLINE, 2012). Similarly, Sara Clavero and Yvonne Galligan (2005) report that in

18
semi-structured interviews, female Eastern European respondents “were keen to
emphasise that there are significantly fewer women than men on the parties’ electoral
lists, and, more importantly, that these women tend to occupy non-eligible positions at
the bottom of those lists” (p. 989). This indicates what Moser (2001) labels the
“interrelationship between parties and electoral systems” (p. 362). In other words, one
must be careful when analyzing electoral systems without taking into consideration the
influence of political parties. Interestingly, when Macedonia utilized the mixed system
from 1998 to 2002, a higher percentage of women were elected from party lists than
SMDs (Ristova, 2003, p. 199). Therefore, it is clear that more analysis is needed of the
effects of electoral systems on women’s political representation in Eastern Europe.
Gender Quotas
Gender quotas are intended to guarantee a particular level of female
representation in parliament (Dahlerup & Freidenvall, 2005, p. 26-7). Scandinavian
countries pioneered the idea of gender quotas in legislatures in the 1970s (Leyenaar,
2004, p. 220). There are three types of gender quotas: reserved seats, legal quotas, and
voluntary/party quotas (Norris & Krook, 2011, p. 28). Reserved seats involve the
government mandating that a certain number of seats in parliament be held for women
(Norris & Krook, 2011, p. 28). However, reserved seats are not used in Europe and, thus,
do not warrant discussion in this study (Norris & Krook, 2011, p. 28).
Legal quotas are “mandatory provisions that apply to all parties” (Franceschet &
Krook, 2008, p. 21). Susan Francheschet and Mona Lena Krook (2008) explain that legal
quotas tend to “call for women to form between 25% and 50% of all candidates, and in
most instances, the language is gender-neutral, speaking of women and men together or

19
making reference to the ‘underrepresented sex’” (p. 21).4 Thus, they apply equally to all
political parties (Norris & Krook, 2011, p. 28-9). Legal gender quotas may also specify
penalties for “non-compliance and be subject to oversight from external bodies such as
Electoral Commissions” (Norris & Krook, 2011, p. 29). Without regulation and stern
consequences for “non-compliance,” however, the quotas can become “just a symbolic
gesture” (Dahlerup & Freidenvall, 2005, p. 37).
In some countries, legal quotas include “placement mandates,” which specify the
order in which the underrepresented sex appears on the list (Schmidt, 2008b, p. 193). For
instance, in Belgium, the quota law specifies that “candidates of the same sex may not
occupy both the top two positions on a list” (Meier, 2008, p. 140). Some placement
mandates are “zipper” systems which “regulate the alternative rank order of women and
men candidates on party lists” (Leyenaar, 2004, p. 220-1; Norris & Krook, 2011, p. 34).
Without placement mandates, female candidates can find themselves mired at the end of
the list with little chance of being elected (Ruedin, 2012, p. 106).
Finally, voluntary gender quotas are “introduced solely by the individual political
parties and not required by national legal rules” (Dahlerup & Freidenvall, 2005, p. 32).
Party quotas are the most popular type of gender quota (Norris & Krook, 2011, p. 35).
Some countries have had success with this form of quota, especially in Scandinavia
where party gender quotas are favored (Leyenaar, 2004, p. 23). For example, the Swedish
Liberal Party introduced a zipper system in 1984 (Leyenaar, 2004, p. 220). In addition, in
Germany, there has been evidence of the “contagion” effect, in which once one party
4 Leyenaar (2004) points out that it is also much more difficult to pursue a quota system in countries with
SMP electoral systems (p. 54), although France has attempted this (IDEA, 2012). Furthermore, Miki Caul
Kittilson (2006) notes: “In single-member districts, mandating a ‘female’ seat to the exclusion of all males
is often seen as discriminatory and a threat to local party autonomy” (p. 38).

20
adopts a gender quota, the other parties follow suit (Leyenaar, 2004, p. 221; Meyer, 2003,
p. 406). Yet, the disadvantage of party quotas is that they lack incentives for compliance
(Dahlerup and Freidenvall, 2005, p. 40). In addition, even if parties have a strong
commitment to gender quotas, they may still “perform badly and win few seats”
(Reynolds, 1999, p. 561). This is especially the case for smaller parties.
Gender quotas are a controversial subject with arguments being made for and
against their introduction. Miki Caul Kittilson (2006) provides one of the primary
arguments for gender quotas: “Once women are in positions of power, no matter how
they got there, it will become more difficult in the future to exclude them” (p. 66). Others
label quotas “a means to open up systems of closed and male-dominated recruitment
patterns” (Dahlerup & Freidenvall, 2005, p. 41). Similarly, another argument is that
“more gradualist forms of affirmative action will only produce results in the very long
term” (Htun & Jones, 2002, p. 34). Thus, gender quotas can be viewed as a faster way to
incorporate women into democratic institutions. In addition, they can lead to informative
discussions about gender equality (Htun & Jones, 2002, p. 34). Indeed, Petra Meier
(2008) notes that gender quotas “may feed less traditional conceptions of gender roles”
(p. 147).
In contrast, critics have focused on the flaws associated with the idea of quotas.
Scholars caution that “quota systems do not remove all barriers to women in politics”
(Dahlerup & Freidenvall, 2005, p. 42). Gender quotas are especially controversial in
Eastern Europe since “it reminds people of what is seen as the ‘forced emancipation’ of
Soviet rule” (Dahlerup & Freidenvall, 2005, p. 42). Critics argue that quotas can
“contribute to the stigmatization of women politicians” (Dahlerup & Freidenvall, 2005, p.

21
42). Some argue that quotas give the impression that “women are lent a hand because of
their symbolic value, not because of their talents, qualifications and experience”
(Leyenaar, 2004, p. 218). Some critics even go as far as to suggest that quotas will lead to
the election of “underqualified women” (Htun & Jones, 2002, p. 35). Yet, former Latvian
President Vaira Vike-Freiberga disagrees: “They are saying that we do not have qualified
women around and I resent that. It is a lie and we should all protest against that because it
implies that somehow talent was distributed only to those with one kind of chromosome”
(qtd. in Charter, 2009). Education statistics appear to support Vike-Freiberga’s
comments, as there are high numbers of qualified females in many European countries
(UNDP, 2009).
Despite the controversy, some scholars find that gender quotas have a positive
effect on women’s representation over time. Leyenaar (2004) and Kittilson (2006) both
conclude that countries in which political parties introduced voluntary quotas in earlier
decades have higher percentages of women in parliament in later decades. Notably,
Kittilson (2006) observes that “the impact of…quotas is limited to the statistical model
that measures change in women’s parliamentary presence from one election to the next”
(p. 127). In other words, longitudinal analysis. Leyenaar (2004) bases her conclusions on
her qualitative observations: “So far in countries where parties adopted quotas in the
1970s, 1980s and 1990s, more women have shown up in the political arena” (p. 54).
Similarly, Reynolds (1999) observes that countries with some type of quota have
“marginally higher” female representation (p. 561). However, he does not appear to
include the variable in his statistical analysis. Interesting, Mala N. Htun and Mark P.
Jones (2002) explain that quotas have the most success when they operate under “a

22
closed-list system, a placement requirement, large district magnitude and good-faith
compliance by political parties” (p. 36). Yet, scholars’ operational definitions of gender
quotas vary.
In multivariate analysis, Ruedin (2012) finds that once he controls for region,
“voluntary party quotas no longer seem to make a significant difference (P>0.1), whilst
the stricter statutory variant still seems to work (P<0.05)” (p. 101). However, when a
control variable which measures “attitudes towards women in political roles” is included,
none of the gender quota variables are statistically significant (Ruedin, 2012, p. 102). In
light of this, Ruedin (2012) declares: “The introduction of quotas is not associated with
an increase in the proportion of women in parliament greater than in countries where no
quotas were introduced” (p. 105). He speculates that this is due to the absence of
placement mandates, which leaves female candidates “in unwinnable districts or at the
bottom of party lists” (Ruedin, 2012, p. 11). While Ruedin’s conclusions are based on
worldwide quantitative analysis, rather than European-level analysis, his findings point to
the importance of further exploring the impact of placement mandates.
Gender Equality
Structural factors are not the only factors that warrant greater analysis, as
attitudinal variables also require attention. For instance, some scholars observe a
statistically significant positive relationship between the level of gender equality in a
country and the percentage of women in parliament (Inglehart & Norris, 2003, p. 138;
Reynolds, 1999, p. 567-8). Yet, others, including Paxton (1997) do not find gender
equality to have a statistically significant impact on women’s representation (p. 455).
Essentially, measures of gender equality indicate the favorability of the overall climate

23
for women in the specified country. For example, in Scandinavian countries, there is a
strong and well established commitment to gender equality (Leyenaar, 2004, p. 21;
Paxton, 1997, p. 451). Official measures of gender equality generally take into
consideration life expectancy, adult literacy rate, education rates, and earned income
(UNDP, 2009).
First, attitudes affect the availability of education to females (UNESCO, 2011).
Specifically, education is an important factor since “the higher the number of women
with university degrees, the higher the number of female potential candidates to the
legislative” (Valiente, 2008, p. 128). Thus, education impacts the supply of qualified
women. In addition, Norris (1985) notes: “Educated citizens are more likely to follow
current events in the media, to acquire information about government, to feel competent
to discuss political issues and to be politically efficacious” (p. 95). In other words,
educated citizens will feel more capable of serving in their country’s legislature.
Second, based on the statistics, income inequality is an issue in many European
countries (UNDP, 2009). In the European Union, “Women have on average lower
earnings than men in all age groups, at all education levels, in all—or virtually all—
occupations and irrespective of the length of service” (Eurostat, 2008, p. 93-4). Indeed,
within the EU, “average gross hourly earnings of women (those between 16 and 64 years
old and working 15 hours or more a week) were, on average, 15% below those of men in
2005” (Eurostat, 2008, p. 93). Especially notable is the fact that women employed in
professional or technical sectors receive 73 percent of men’s average hourly earnings
(Eurostat, 2008, p. 96). This is problematic since political candidates tend to come from
professional backgrounds (Norris, 1996, p. 188-90; Reynolds, 1999, p. 550). While these

24
results refer to the EU, rather than the entire European continent, it should be noted that
they reflect the situation in twenty-five countries. This arguably indicates that societies
do not value women’s work as much as men’s work. Furthermore, as previously
discussed, the costs of pursuing a political campaign can impede women (Meier, 2008, p.
145). Thus, if they earn less than men, it will be harder for them to run for office if they
do not receive assistance from their political parties.
Gender equality under communism requires a separate discussion. During the
communist era, Eastern European countries had “an official, explicit commitment to
women’s equality…and included measures forbidding discrimination against women in
their laws” (Rueschemeyer & Wolchik, 2009a, p. 8-9). In addition, under communism,
women were granted “equal access to schooling and equal access to paid jobs; they were
supposed to be equally paid for equal jobs” (Antić, 2009, p. 94). Yet, the reality was far
different. The government’s focus on gender equality was “mostly rhetorical and self-
interested” (Fábián, 2009, p. 73). In other words, communist leaders did not have a
genuine commitment to fostering true gender equality.
The leaders’ public stance “led many men and women to identify gender equality
with the communist regime and to reject it as a goal once that regime was no longer in
power” (Wolchik, 1998, p. 293). Thus, after the fall of communism, traditional attitudes
towards gender became increasingly prominent (Rueschemeyer & Wolchik, 2009b, p.
253). There was also an increase in income inequality post-communism (Fábián, 2009, p.
60). Therefore, one may expect countries in Eastern Europe to fail to see the importance
of women’s representation. The European Union is beginning to have an effect on official
gender policy in some of these Eastern European member-states (Fábián, 2009, p. 71-3;

25
Rueschemeyer & Wolchik, 2009a, p. 3; 12). However, the case studies demonstrate that
there is a difference between passively enacting EU law and actively encouraging the use
of the law’s provisions.
Female Professionals
The presence of female professionals may positively impact the level of women’s
representation in a given country. Reynolds (1999) observes: “Most politicians, male and
female, come from a pool of citizens who are highly educated, have professional jobs,
and have access to the resources of public life” (p. 550). In addition, professional
experience can have a positive psychological impact: “A work career may result in
enhanced confidence and independence, and therefore in a greater sense of political
efficacy” (Kenworthy & Malami, 1999, p. 240). Indeed, this enhanced confidence is
important since research in the U.S. has shown that women are less likely than men to
consider themselves “qualified” to stand for election (Lawless & Fox, 2005). Professional
careers also “yield political contacts,” as well as much needed campaign money
(Kenworthy & Malami, 1999, p. 240; Paxton & Kunovich, 2003, p. 89).
In countries with Western style democracies, members of parliament tend to come
from professional careers, rather than blue collar jobs (Norris, 1996, p. 188-90). In
Slovenia, Milica G. Antić (2009) finds that “the formal qualifications of women MPs are
generally higher than those of male MPs” (p. 101, emphasis added). Furthermore, she
finds that in general, members of parliament tend to have backgrounds in economics,
humanities, and social sciences (Antić, 2009, p. 101). Indeed, even a cursory
examination, based on available data, of the occupations of parliamentarians in Europe

26
demonstrates that the legal, business, and engineering professions are well represented
(IPU PARLINE, 2012).
Kenworthy and Malami (1999) find a statistically significant positive relationship
between the level of female professionals and the percentage of women in legislatures
when surveying 116 countries (p. 254). They argue that it is important to note the
difference between working in a professional field versus ordinary labor force
participation: “It is not paid work per se that affects women’s opportunities for legislative
representation, but rather the particular types of paid work in which women participate”
(Kenworthy & Malami, 1999, p. 251). Leyenaar (2004) concurs that “very often women
lack the advantages of ‘professional convergence’, the fact that holding certain
professions qualify for a political position” (p. 65). However, Pamela Paxton (1997) did
not find this variable to be statistically significant in her analysis (p. 454). Given these
dissimilar findings, further exploration of this variable is clearly warranted.
There should be a cautionary note, however, on Eastern European cases.
Specifically, Zillah Eisenstein (1993) observes: “Soviet society had the largest number of
women professionals and specialists on the globe, although few filled the top ranks” (p.
311, emphasis added). In other words, a glass ceiling was in place, which meant that
women failed to reach the pinnacle for professional careers. Indeed, women tended to
“predominate in low paid ‘feminized’ occupations” (Eisenstein, 1993, p. 311). Similarly,
Éva Fodor (2005) explains that the communists “emphasized women’s education but
inhibited their advancement in the power structures. Thus a large number of women
stayed in professional jobs, never advancing to positions of authority” (p. 12). This
indicates that the percentage of female professionals in Eastern Europe may not have the

27
hypothesized positive effect on women’s representation if these attitudes towards female
professionals continue to pervade society today.
Religiosity
In some studies, religion has been found to negatively impact the election of
female candidates (see e.g. Kenworthy & Malami, 1999; Leyenaar, 2004; Paxton, 1997;
Reynolds, 1999). Specifically, religion has been used as a measure of traditional attitudes.
Previous research “suggests that the type of religion is a suitable proxy indicator of
culture because religious values are closely related to attitudes towards women in
politics” (Norris, 2004, p. 205). Paxton (1997) concurs that “the dominant religion of a
country provides a measure of ideology because religions of the world are differentially
conservative or patriarchal in their views about the place of women” (p. 449).
Scholars have previously operationalized their religion variables by focusing on
types of religion. For example, Paxton (1997) and Kenworthy and Malami (1999)
operationalize their measure of religion by comparing Catholicism, Islam, and a
miscellaneous religion category against the percentage of women in parliament. They
choose Protestantism as the “baseline” category because it is “the least likely to
emphasize traditional roles for women” (Kenworthy & Malami, 1999, p. 247). These
studies find that certain types of religion, such as Catholicism, have a statistically
significant negative influence on women’s political representation across the world
(Kenworthy & Malami, 1999, p. 254-5; Paxton, 1997, p. 457-8). This is consistent with
Leyenaar’s (2004) findings that European countries with a Protestant or secular history
tend to have higher percentages of women in parliament (p. 21), than countries in which

28
religion “has played an important role in the development of strict notions of male and
female roles in society” (p. 26). For example, Leyenaar (2004) observes:
Years of socialisation, for example by the church, proclaiming that women and
men should fulfil different roles in society and that operating in public life is a
valued role only for men, have caused a severe backlog in women’s
representation in countries such as Greece, Italy and Ireland. (p. 53)
Catholicism is obviously the historically dominant religion in Italy and Ireland, while
Greek Orthodoxy is the main religion in Greece (Galligan, 1998, p. 29; Leyenaar, 2004,
p. 26).
Even scholars who operationalize their religion variable in a slightly different
manner find support for the influence of religion on women’s political representation.
Reynolds (1999) operationalizes his religion variable by comparing six religious
dummies (Buddhist, Eastern Orthodox, Muslim, Other, Protestant, and Traditional)
against a Catholic baseline (p. 571). He curiously adopts a Catholic baseline after
observing that countries in which Catholicism was the dominant religion had a slightly
higher percentage of women in the legislature (15.8 percent) than the countries in which
Protestantism dominated (15.5 percent) (Reynolds, 1999, p. 560). Yet, Reynolds (1999)
cautions that this observation may be an “anomaly” (p. 564). Nevertheless, he finds a
statistically significant negative relationship between three religious dominations
(Buddhism, Eastern Orthodox, and Islam) and the level of women’s political
representation (Reynolds, 1999, p. 568).
Despite these findings, there continues to be debate about the direct connection
between religion and female representation. Some scholars find that when control

29
variables are incorporated, religion ceases to be statistically significant. For instance, in
his worldwide analysis, Ruedin (2012) concludes that religion does not have a
statistically significant influence on women’s political representation when he adds
geographic region as a control variable (p. 99). Yet, it is not clear how Ruedin
operationalizes his religion variable. Interestingly, in another study, Paxton and Kunovich
(2003) find that the negative effect of religion is no longer statistically significant when
they place a survey measure of gender equality into their regression model (p. 99). In
addition, Norris (2004) does not find religion to be statistically significant once she
controls for “the type of electoral system, the use of reserved seats, and the length of
women’s suffrage” (p. 208). Clearly, these findings warrant further examination of the
effect of religion on women’s political representation.
In particular, an examination of religion in Europe is especially interesting
because the climate towards religion in the continent has been evolving in response to
immigration from Islamic countries (Davie, 2006, p. 30-4). Currently, in Germany, there
is not one dominant religion, with the CIA World Factbook (2012) estimating that
Catholics and Protestants each account for 34 percent of the population, while 3.7 percent
are Muslim. Interestingly, in Macedonia, 64.7 percent are Orthodox, while a third of the
population is Muslim (CIA, 2012). Thus, previous measures would classify Macedonia as
an Orthodox country, completely discounting the impact of Muslim voters. Furthermore,
measures of the dominant religion fail to account for whether or not respondents are
active adherents who regularly attend worship services. Thus, religiosity may be a better
measure of traditional attitudes than a country’s dominant religion. Religiosity is able to
account for the overall level of importance of religion to a country’s citizens (Inglehart &

30
Norris, 2003, p. 52-5). The degree of religiosity in countries in Europe rests on “historical
traditions and the power of the church” (Inglehart & Norris, 2003, p. 52). Thus, some
European countries (i.e. Ireland and Italy) are more religious than others (i.e. the
Scandinavian countries, which have a Lutheran heritage) (Inglehart & Norris, 2003, p.
56).
Notably, no scholars have applied the concept of religiosity specifically to
women’s political representation. This is somewhat surprising since Ronald Inglehart and
Pippa Norris (2003) find that there is a negative correlation between levels of religiosity
in postindustrial countries and support for gender equality (p. 67). Furthermore, Jen’nan
Ghazal Read (2003) finds that regardless of whether they are Christian or Muslim, Arab-
American women with higher levels of religiosity tend to hold “inegalitarian gender role
attitudes” (Read, 2003, p. 217). Read (2003) concludes that “religiosity and ethnicity are
more important in shaping women’s gender role attitudes than their affiliations as
Muslims and Christians” (p. 207). Thus, this indicates that religiosity is a better measure
of the effect of religion on society than resorting to basic categories of religion.
Two case studies have established the connection between religion and gender
attitudes in Europe. Yvonne Galligan (1998) finds that conservative attitudes towards
women have negatively influenced their public participation in Ireland (p. 26-9). For
instance, a 1998 survey found that the Irish were more conservative than their
counterparts in other European Union countries (Galligan, 1998, p. 28-9). This
conservatism and traditionalism can be traced back to both the state and the Catholic
Church’s influence on the populace (Galligan, 1998, p. 29). Thus, religion may help to
explain the low percentage of women in the Irish parliament (IPU, Nov. 2011). Similarly,

31
in another case study, Lee Ann Banaszak (2006) conducts a time-series analysis of the
differences between citizens’ gender attitudes in East Germany and West Germany (p.
29). Utilizing survey data, she finds evidence supporting the fact that East Germans
continue to be more progressive today in their attitudes toward women that their West
German counterparts (Banaszak, 2006, p. 37-43). Furthermore, she finds that religiosity
(measured by church attendance) widens the gender attitude gap between the two
formerly separate states (Banaszak, 2006, p. 48-9). Specifically, West Germans, who
have more conservative views of women, are more religious than their East German
counterparts (Banaszak, 2006, p. 49).
The issue of religion in Eastern Europe, however, is contentious due to the many
years of communism, during which religion was removed from its standing in public life
and replaced by a policy of atheism (Franklin Lytle, 1998, p. 304; p. 307). Indeed, the
authorities believed that “religion had to be either controlled and manipulated or
destroyed outright” (Franklin Lytle, 1998, p. 305). With the fall of communism, the
“increased religious attendance and a more public role for religion” in some countries
accompanied the “heightened sense of national identity” (Franklin Lytle, 1998, p. 323).
Interestingly, the prominence of religion seems to vary by country (Marinović Jerolimov
& Zrinščak, 2006, p. 280). For instance, Paul Froese (2005) claims: “In Slovakia, Roman
Catholicism and nationalism are conjoined in much the same way as they are in Poland.
Consequently, Roman Catholicism is quite popular among Slovaks” (p. 280). In contrast,
historical events have destroyed any link between nationalism and religion in the Czech
Republic (Froese, 2005, p. 281). In addition, survey evidence collected in 1999 from ten
former communist countries showed that there had been a “15 per cent decline in

32
religious practices since 1991” (Luxmoore, 2001, p. 324). In light of this, more research
is clearly needed on the topic of religion in Eastern Europe.
Theoretical Framework
Collectively, the literature on substantive representation has demonstrated the
relevance of gender in European politics. Based on this premise, I seek to account for the
vast differences among women’s political representation in Europe, a continent where
women account for forty-five percent of the parliament in Sweden, and only eight percent
of the Ukrainian legislature (IPU, Nov. 2011). Specifically, I create a theoretical
framework of structural and attitudinal factors, and explore which factors are more
influential on women’s political representation.
Scholars have categorized similar variables in different ways. First, Paxton (1997)
defines her model as follows: measures of social structure (e.g. labor force, education,
female professionals), measures of political system (e.g. electoral system, level of
democracy, absolutism), and measures of ideology (e.g. religion, social equality).
Kenworthy and Malami (1999) use political factors (e.g. electoral system, women’s
suffrage, level of democracy), socioeconomic indicators (e.g. education, labor force,
female professionals, economic development) and cultural variables (e.g. religion,
region). Reynolds (1999) utilizes four types of explanatory factors: social culture and
socioeconomic development, political culture, nature of the state, and political
institutions.
Given that my study focuses on a continent, rather than the entire world, I have
opted to condense the categorization of my variables into structural (number of years
since women’s suffrage was enacted, type of electoral system, and presence of legal

33
gender quotas) and attitudinal (level of gender equality, percentage of female
professionals, and level of religiosity). Structural factors are institutional factors that are
not affected by attitudes or ideologies. On the other hand, attitudinal factors concentrate
on the social environment. Thus, the female professionals variable is treated as an
attitudinal factor, rather than a structural factor, because societal attitudes affect the
prevalence of women in these occupations.
Specifically, I ask: Which structural and/or attitudinal factors are more influential
for women’s political representation in European countries?
Hypotheses. I propose six separate hypotheses. The first three focus on structural
factors, while the latter three focus on attitudinal factors:
1. There is a positive relationship between the number of years since a country
granted suffrage to women and the level of women’s political representation in
that country.
2. There is a positive relationship between the favorability of a country’s electoral
system to the election of women and the level of women’s political representation
in that country.
3. There is a positive relationship between the presence of a legal gender quota in a
country and the level of women’s political representation in that country.
4. There is a positive relationship between the level of gender equality in a country
and the level of women’s political representation in that country.
5. There is a positive relationship between the percentage of female professionals in
a country and the level of women’s political representation in that country.

34
6. There is a negative relationship between the level of religiosity in a country and
the level of women’s political representation in that country.

35
Chapter 3: Research Methodology
In this chapter, I discuss my research methodology and the operationalization of
my variables. In chapter 4, I perform ordinary least squares (OLS) regression using three
separate models: Europe-wide, Western Europe, and Eastern Europe. I utilize separate
models in order to account for regional differences between Eastern and Western Europe.
In chapters 5-10, I conduct case study analyses. I select two Western European countries
(Sweden and Ireland) and two Eastern European countries (Macedonia and Hungary) in
order to further explore the impact of structural and attitudinal factors in these countries.
Operationalization of Variables
Dependent variable. My dependent variable is the political representation of
women in Europe. Conceptually, this refers to women in elected office who are
accountable to and legally authorized to act on behalf of their constituents. This
conceptual definition is based on Hanna Pitkin’s definition of authorized representation,
which refers to a politician being “legally empowered to act for another” person
(Lovenduski, 2005, p. 3). The operational definition is the percentage of women in each
lower or single national legislature in Europe. This measurement is consistent with the
operational definition chosen by previous scholars (see e.g. Kenworthy & Malami, 1999;
Paxton, 1997; Paxton & Kunovich, 2003; Reynolds, 1999; Ruedin, 2012). The data for
the dependent variable comes from the Inter-Parliamentary Union (IPU)’s “Women in

36
National Parliaments” database (November, 2011). Specifically, the IPU provides the
percent of women in each country’s single or lower house of parliament. This has also
been the favored source of previous scholars (e.g. Kenworthy and Malami, 1999;
Leyenaar, 2004; Paxton and Kunovich, 2003; Reynolds, 1999; Ruedin, 2012).
Independent variables.
Women’s suffrage. Women’s suffrage is conceptually defined as when women
were granted electoral rights, including the right to vote and stand for election.
Operationally, this is defined as the number of years between the date women in a
country were granted full electoral rights, which means the right to vote and stand for
election without restrictions, through 2011.5 Thus, if women were permitted to stand for
election before they were allowed to vote or vice versa, then the later date is used. Both
the conceptual and operational definitions are based on the definitions by the Inter-
Parliamentary Union (n.d.) and Reynolds (1999). Furthermore, I primarily rely on data
from the Inter-Parliamentary Union (n.d.)’s “Women’s Suffrage” page, which is also
utilized by Kenworthy and Malami (1999).
Electoral system. The type of electoral system is conceptually defined as the
manner in which countries elect their political representatives. I operationally define an
electoral system based on its favorability to the election of women. Thus, SMP systems,
including two-round systems (TRS) and first past the post (FPTP) systems, are coded as
5 Suffrage dates are frequently disputed due to the presence of “conflicting information,” as Caroline Daley
and Melanie Nolan (1994) note: “It was often impossible to tell whether the dates given were for the year
women’s suffrage was granted, or the year it was first exercised” (p. 349). In Europe, the most difficult
cases include Hungary (1918 vs. 1945), Ireland (1922 vs. 1928), Moldova (1978 vs. 1993), and Spain
(1931 vs. 1976). The conflicting dates for Spain can be explained by the fact that women were, indeed,
granted suffrage in 1931, but they lost this right in 1936 and did not regain it until 1976 (Daley & Nolan, p.
350). Thus, I use the 1976 date. Given the lack of available information on Moldova, I have chosen 1993
(IPU, n.d.). Hungarian women’s electoral rights were “shortlived” in 1918, which is why I have opted for
1945 (Fábián, 2007, p. 112). Finally, after consultation with a scholar on Irish women’s representation, I
have chosen 1922 for Ireland (Y. Galligan, personal communication, April 1, 2012).

37
the least favorable (0). Mixed systems, including MMP and parallel systems, are coded as
the second-least favorable to women (1). Finally, the most favorable electoral system to
women is PR (including STV6) (2). My primary data source is the International-
Parliamentary Union (2012)’s PARLINE database.7 Kenworthy and Malami (1999)
include mixed systems as the middle category when coding their electoral system
variable (p. 245). In contrast, in his worldwide analysis, Reynolds (1999) compares nine
electoral systems against the list-PR baseline (p. 568). However, it was not possible to
code in this manner given the smaller number of countries in my study.
Gender quotas. A gender quota system is conceptually defined as a method for
establishing greater representation of women in legislatures. This is based on the
definition provided by Drude Dahlerup (2009). I operationally define gender quotas as
national legal mandates which specify penalties for non-compliance and contain
placement mandates. This obviously eliminates France’s gender quota since it is unable
to prescribe placement mandates given its use of TRS (IDEA, 2011; Leyenaar, 2004, p.
221). While Ruedin (2012) utilizes data from the International Institute for Democracy
and Electoral Assistance (IDEA)’s “Quota Project: Global Database of Quotas for
Women” (2011), I found that this source did not have the data needed for all of the
countries in my study. Thus, I have opted to supplement IDEA’s data with information
from Norris and Krook (2011). I code countries with legal gender quotas as “1,” while
6 While it would have been preferable to code STV separately from list-PR, this was not possible since only
one European country in this study (Ireland) utilizes STV for parliamentary elections (IPU PARLINE,
2012).
7 The coding of Macedonia (list-PR), Spain (list-PR), and Switzerland (mixed) requires discussion. While
some (IDEA, 2005) classify Switzerland as list-PR, it is properly classified as ‘mixed’ given that
representatives are elected from a mixture of single and multi-member districts (IPU PARLINE, 2012).
IPU PARLINE (2012) classifies both Macedonia and Spain’s electoral systems as mixed. However, the
small number of single-member districts are for the overseas constituencies (IPU PARLINE, 2012). In
other words, the individuals living in the respective countries elect via list-PR (IPU PARLINE, 2012).

38
those without legal gender quotas are coded as “0.” I opt to focus on legal gender quotas
over party quotas due to the importance of compliance and enforcement regulations
(Dahlerup and Freidenvall, 2005, p. 40).
Gender equality. Gender equality is conceptually defined as both men and women
having the “same opportunities and the same constraints on full participation in both the
economic and the domestic realm” (Bailyn, 2006, p. 57). Operationally, the level of
gender equality is defined as a country’s equality score on the United Nations’ 2007
Gender-related Development Index (GDI), which is “a composite index measuring
average achievement in the three basic dimensions captured in the human development
index—a long and healthy life, knowledge and a decent standard of living—adjusted to
account for inequalities between men and women” (UNDP, 2009, p. 210). The GDI is
based on life expectancy, adult literacy rate, combined gross enrollment in education
(elementary, secondary, and tertiary), and estimated income (UNDP, 2009). The higher
the score on this index, the higher the level of equality in the country (UNDP, 2009).
Reynolds (1999) utilizes an older version of the GDI. The disadvantage of using the GDI
is that data is unavailable for Serbia, Montenegro, and Bosnia and Herzegovina.
However, the problem with alternative measures, such as the UN’s Gender Inequality
Index, is that they include women’s political representation within their measures
(UNDP, 2010).
Female professionals. Female professionals are conceptually defined as women
in white collar positions. Operationally, the United Nations Development Programme
(UNDP, 2009) explains that the level of female professionals in a country refers to:

39
Women’s share of positions defined according to the International Standard
Classification of Occupations (ISCO-88) to include physical, mathematical and
engineering, science professionals (and associate professionals), life science and
health professionals (and associate professionals), teaching professionals (and
associate professionals) and other professionals and associate professionals. (p.
212)
The UNDP labels this measure as “female professional and technical workers.” I utilize
the data from the International Labour Organization (ILO), which is included in the 2009
UN Human Development Report. According to the UNDP (2009), the “data refer to the
most recent year available between 1999 and 2007” (p. 189). Given the broad and vague
nature of the variable description, this is not an ideal measure. However, as Kenworthy
and Malami (1999) point out “disaggregated figures for professional occupations only are
not available for most countries” (p. 246). Thus, I have been unable to find alternative
measures.
Religiosity. Based on Inglehart and Norris (2003)’s work, I conceptually define
religiosity as the importance of religion to individuals in a given country. Religiosity is
operationalized based on the valid percentage of respondents to the European Values
Study (2008)8 who attend church at least once a week or more and respond that religion is
“quite important” or “very important” in their lives (EVS, 2008). The percentages for
church attendance and level of importance of religion are aggregated and divided by two
8 The European Values Study (2008) separates the survey results for the United Kingdom into two separate
files: Great Britain and Northern Ireland. Northern Ireland’s religiosity score is 53.2, whereas Britain’s
score is 28.6. However, representatives to the U.K. Parliament from Northern Ireland only account for 18
of the 650 MPs (~2.77%) (U.K. Parliament, 2012). Therefore, I have opted to utilize the results for Great
Britain without modification.
40
to achieve a score out of 100 percent (see Appendix A).9 Inglehart and Norris (2003)
pursue a similar strategy by aggregating their World Values Survey and European Values
Study data to create a six-point religiosity scale that is standardized to 100 points (p. 179-
80). I opted to pursue a more concise measure of religiosity.
9 France, Ukraine, Croatia, and Russia have not had elections since 2007, while the data for religiosity
comes from 2008. Despite this, the EVS (2008) data offers the best measure of religiosity available, which
is why it is utilized rather than a more dated measure.

41
Chapter 4: Quantitative Results
Europe-wide Model10
Overall, the results for the Europe-wide model11
provide support for the
importance of both structural and attitudinal factors in determining female representation
in parliament (see Table 1). Specifically, two variables are statistically significant in the
model: type of electoral system and level of religiosity. The relationships between each of
the remaining independent variables and the dependent variable (women’s political
representation) are also discussed below.
Among the structural variables, one variable is statistically significant.
Specifically, as demonstrated in earlier scholarly publications (e.g. Kenworthy &
Malami, 1999; Paxton, 1997; Reynolds, 1999), there is a statistically significant (.05)
positive relationship between the favorability of a country’s electoral system to the
election of women and the level of women’s political representation in that country.
Proportional representation (PR) systems are the most favorable of the electoral systems
to women. PR systems are also the most popular type of electoral system in Europe. As
10
The Europe-wide model contains the following countries: Austria, Belgium, Bulgaria, Croatia, Czech
Republic, Denmark, Estonia, Finland, France, Germany, Greece, Hungary, Iceland, Ireland, Italy, Latvia,
Lithuania, Macedonia, Moldova, the Netherlands, Norway, Poland, Portugal, Romania, Russia, Slovakia,
Slovenia, Spain, Sweden, Switzerland, Ukraine, and the United Kingdom. Due to missing data, the
following European countries are excluded from all three models: Albania, Belarus, Bosnia and
Herzegovina, Luxembourg, Montenegro, and Serbia.
11
See Table B1 in Appendix B for Europe-wide data.

42
Table B1 in Appendix B demonstrates, 29 of the 38 countries (before six countries are
dropped by the statistical analysis program due to missing data) utilize proportional
representation. Even after these six countries are dropped, the remaining PR countries
still account for three-quarters (24 out of 32) of the electoral systems.
Table 1: Europe-wide Model:
OLS Regression Results12
Among the attitudinal variables, there is a statistically significant (.05) negative
relationship between the level of religiosity in a country and the level of women’s
political representation in that country. Countries with more religious citizens are less
likely to elect female representatives to their national legislature. This is consistent with
Kenworthy and Malami (1999) and Paxton (1997)’s findings. Interestingly, however,
Norris (2004) does not find her religion variable to be significant once she controls for
“the type of electoral system, the use of reserved seats, and the length of women’s
12
The R2 for the Europe-wide model is .585, while the adjusted R
2 is .485. This indicates that 48.5 percent
of the variation in the dependent variable (women’s political representation) can be explained by the six
independent variables: number of years since women’s suffrage was enacted, type of electoral system,
presence of a legal gender quota, level of gender equality, percentage of female professionals, and level of
religiosity.
Independent Variables b-score
standard
error t score
Years since Women’s Suffrage .051 .085 .597
Type of Electoral System 5.590* 2.544 2.197
Legal Gender Quota 7.590 5.033 1.508
Level of Gender Equality 36.937 41.750 .885
Percent of Female Professionals -.451 .342 -1.319
Level of Religiosity -.285* .110 -2.584
Constant 11.924 53.289 .224
R2
=58.5%
Adjusted R2 =48.5%
Statistical significance: * p<.05
Data sources: EVS (2008), IDEA (2011), IPU (n.d.), IPU (Nov. 2011), IPU
PARLINE (2012), Norris & Krook (2011), UNDP (2009).

43
suffrage” (p. 208). Yet, in my model, religiosity continues to be significant even when
type of electoral system, legal gender quota, and years since women’s suffrage are
included. Therefore, my result underscores the importance of a more sophisticated
method of capturing the impact of religion on a country’s citizens and provides evidence
of how religious attitudes affect female representation at the national level.
There is a positive relationship between the amount of years since a country
granted suffrage to women and the level of women’s political representation in that
country. However, the relationship is not statistically significant, which is consistent with
Ruedin (2012)’s findings. In contrast, Norris (2004) finds the suffrage date to be
statistically significant even after she controls for electoral and cultural factors (p. 185-6).
Of course, my finding may be due to the uncertainty over suffrage dates. However, it
should be noted that Switzerland is ranked 12th
in Europe in terms of women’s political
representation, even though it only granted electoral rights to women in 1971 (IPU, n.d.).
On the other hand, Ukrainian women have had voting rights for ninety-two years and
have the worst level of women’s political representation in Europe (IPU, n.d.). Thus,
these anecdotal examples indicate that the timing of suffrage may not be critical for
determining women’s representation in Europe.
There is a positive relationship between the final structural variable, presence of a
legal gender quota in a country, and the level of women’s political representation in that
country. In this case, the absence of statistical significance may be the result of a variety
of different factors. First, only five countries in Europe have legal gender quotas with
placement policies and non-compliance penalties: Belgium, Macedonia, Portugal, Serbia,
and Spain. Unfortunately, due to missing data for other variables, Serbia drops out of the

44
analysis. This means that only four countries with legal gender quotas remain in the
regression. This may contribute to the insignificance of this variable. Second, it may be
that the analysis of gender quotas does not lend itself to OLS regression. As previously
mentioned, Kittilson (2006) only observes a relationship between gender quotas and
women’s political representation when she conducts longitudinal analysis. Third, the
countries in this study only enacted legal gender quotas with placement mandates in the
past decade (IDEA, 2011; Meier, 2008, p. 140).
In terms of attitudinal variables, there is a positive relationship between the level
of gender equality in a country and the level of women’s political representation in that
country. However, it is not statistically significant. Paxton (1997) also does not find
gender equality to be statistically significant. Yet, interestingly, Reynolds (1999), who
uses an older measure of GDI, does observe a statistically significant positive relationship
in his worldwide regression analysis. Regardless, there is a rather substantial difference in
the level of gender equality between the country with the highest women’s representation
(Sweden= .956 equality), and the country with the lowest women’s representation
(Ukraine= .793 equality). Indeed, countries in Western Europe tend to have higher
equality scores than countries in Eastern Europe. Thus, this finding suggests regional
differences.
The final attitudinal variable, female professionals, requires discussion. I
hypothesized a positive relationship between the percentage of female professionals in a
country and the level of women’s political representation in that country. However, while
not statistically significant, the regression results indicate a negative relationship between
female professionals and women’s political representation. Notably, according to the

45
data, the percentage of female professionals is higher in Eastern Europe than Western
Europe. This is most likely due to measurement error, which also plagued Kenworthy and
Malami (1999). Specifically, my chosen measure of female professionals is extremely
broad. Thus, it is possible that some occupations that one would not necessarily
categorize as “professional” are included in the measure. Yet, without female
professionals, my R2 drops by approximately 12.5 percent (see Table D1 in Appendix D).
Thus, despite the imperfect measurement of white collar female professionals, the
variable is clearly having an impact on my model.
Western Europe Model13
As with the first model, the results for the Western Europe model14
offer support
for the importance of both structural and attitudinal factors in determining female
representation in parliament (see Table 2). In addition, the same two variables are
statistically significant: type of electoral system and level of religiosity. Yet, as with the
earlier model, the remaining variables fail to achieve statistical significance.
As with the Europe-wide model, among the structural variables, there is a
statistically significant (.01) positive relationship between the favorability of a country’s
electoral system to the election of women and the level of women’s political
representation in that country. Countries with electoral systems that are more beneficial
to the election of women (i.e. PR systems) are more likely to elect female representatives
to their national legislatures. Indeed, the eight countries with the greatest female
representation in Western Europe all use proportional representation systems.
13
The Western Europe model contains the following countries: Austria, Belgium, Denmark, Finland,
France, Germany, Greece, Iceland, Ireland, Italy, the Netherlands, Norway, Portugal, Spain, Sweden,
Switzerland, and United Kingdom. Luxembourg is excluded due it missing data.
14
See Table B2 in Appendix B for Western Europe data.

46
Table 2: Western Europe Model:
OLS Regression Results15
Among the attitudinal variables, there is a statistically significant (.01 level)
negative relationship between the level of religiosity in a country and the level of
women’s political representation in that country. The countries with higher levels of
religiosity tend to have lower levels of women’s representation. This relationship will be
further explored in the case studies that follow.
The manner in which the type of electoral system and the level of religiosity
interact is also interesting. Specifically, the cases of Greece, the U.K., and France
demonstrate the importance of the individual country context. On the one hand, the two
countries with SMP, the U.K. and France, have low levels of women’s representation,
regardless of their low levels of religiosity. In these cases, it appears that less religious
environments are unable to mitigate the effects of unfavorable electoral systems. On the
other hand, despite having a PR system, Greece has the second lowest women’s
15
The R2 for the Western Europe model is .899, while the adjusted R
2 is .838. This indicates that 83.8
percent of the variation in the dependent variable (women’s political representation) can be explained by
the six independent variables.
Independent Variables b-score
standard
error t score
Years since Women’s Suffrage -.033 .084 -.395
Type of Electoral System 7.461** 1.867 3.997
Legal Gender Quota 2.444 4.314 .567
Level of Gender Equality 59.273 99.409 .596
Percent of Female Professionals .492 .505 .974
Level of Religiosity -.588** .099 -5.959
Constant -41.581 94.840 -.438
R2
=89.9%
Adjusted R2 =83.8%
Statistical significance: ** p<.01
Data sources: EVS (2008), IDEA (2011), IPU (n.d.), IPU (Nov. 2011), IPU
PARLINE (2012), Norris & Krook (2011), UNDP (2009).

47
representation rate in Western Europe. Yet, it also has high religiosity. Thus, in the case
of Greece, attitudinal factors seem to nullify the effects of a favorable electoral system.
Finally, Ireland also has high religiosity and a PR system. However, it does not utilize
list-PR, but rather has an STV system, which does not easily lend itself to the election of
women (Gardiner & Leijenaar, 1997, p. 78; Sinnott, 2009). This is an issue that will be
further explored in the case study section.
While not statistically significant, there is an unexpected negative relationship
between the number of years since women’s suffrage was enacted in a country and the
level of women’s political representation in that country. This is not particularly
surprising if one looks at Table B2 in Appendix B since suffrage years are scattered
throughout the Western Europe data table. For example, Irish women have had the right
to vote and stand for election for eighty-nine years, but rank at the bottom of the table.
However, Belgian women have had electoral rights for sixty-three years and rank fifth on
the table. As with the Europe-wide model, the number of years since women’s suffrage
does not appear to matter in the case of Western Europe.
There is a positive relationship between the presence of a legal gender quota in a
country and the level of women’s political representation in that country. However, again
this relationship is not statistically significant. Of course, one must remember that only
three Western European countries have legal gender quotas that meet my definition:
Belgium,16
Portugal,17
and Spain.18
Both Portugal and Spain have closed list-PR systems
16
Belgium has a 50 percent quota level and specifies that “the two top candidates on candidate lists and on
the lists of alternates cannot be of the same gender” (Norris & Krook, 2011, p. 57). Parties that do not meet
these requirements are not permitted to submit their lists to the electoral board (Norris & Krook, 2010, p.
57).
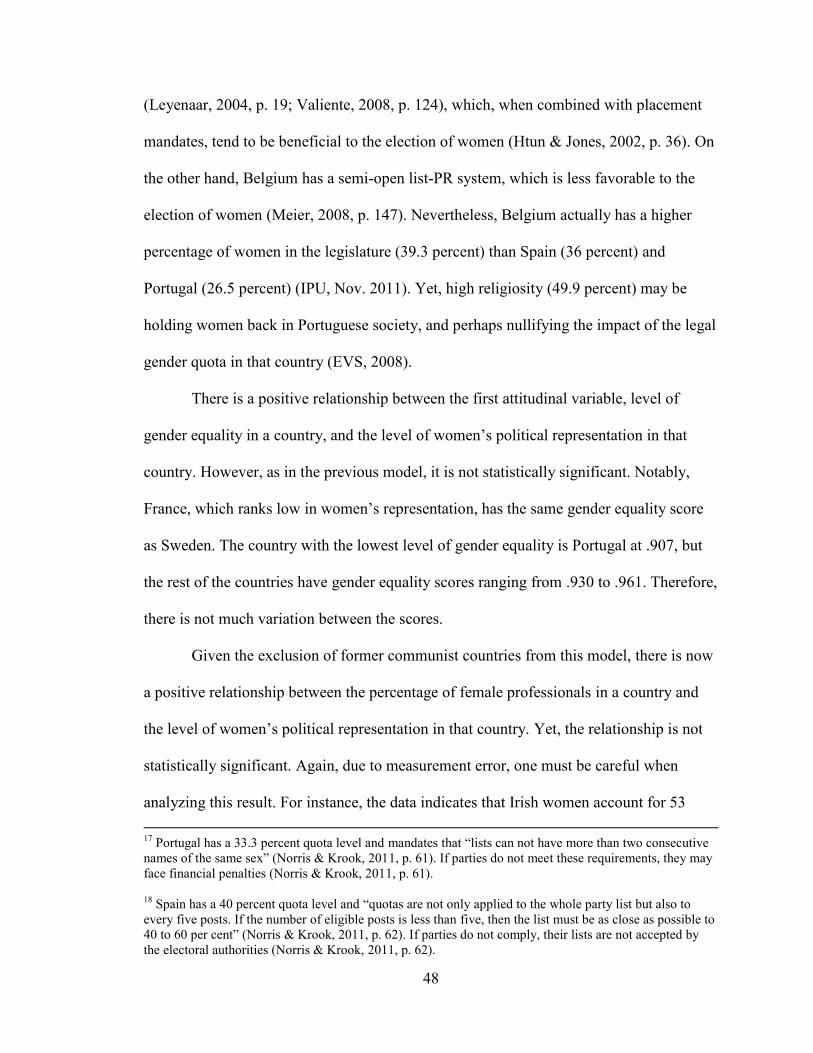
48
(Leyenaar, 2004, p. 19; Valiente, 2008, p. 124), which, when combined with placement
mandates, tend to be beneficial to the election of women (Htun & Jones, 2002, p. 36). On
the other hand, Belgium has a semi-open list-PR system, which is less favorable to the
election of women (Meier, 2008, p. 147). Nevertheless, Belgium actually has a higher
percentage of women in the legislature (39.3 percent) than Spain (36 percent) and
Portugal (26.5 percent) (IPU, Nov. 2011). Yet, high religiosity (49.9 percent) may be
holding women back in Portuguese society, and perhaps nullifying the impact of the legal
gender quota in that country (EVS, 2008).
There is a positive relationship between the first attitudinal variable, level of
gender equality in a country, and the level of women’s political representation in that
country. However, as in the previous model, it is not statistically significant. Notably,
France, which ranks low in women’s representation, has the same gender equality score
as Sweden. The country with the lowest level of gender equality is Portugal at .907, but
the rest of the countries have gender equality scores ranging from .930 to .961. Therefore,
there is not much variation between the scores.
Given the exclusion of former communist countries from this model, there is now
a positive relationship between the percentage of female professionals in a country and
the level of women’s political representation in that country. Yet, the relationship is not
statistically significant. Again, due to measurement error, one must be careful when
analyzing this result. For instance, the data indicates that Irish women account for 53
17
Portugal has a 33.3 percent quota level and mandates that “lists can not have more than two consecutive
names of the same sex” (Norris & Krook, 2011, p. 61). If parties do not meet these requirements, they may
face financial penalties (Norris & Krook, 2011, p. 61).
18
Spain has a 40 percent quota level and “quotas are not only applied to the whole party list but also to
every five posts. If the number of eligible posts is less than five, then the list must be as close as possible to
40 to 60 per cent” (Norris & Krook, 2011, p. 62). If parties do not comply, their lists are not accepted by
the electoral authorities (Norris & Krook, 2011, p. 62).

49
percent of professionals in that country. Curiously, Swedish women are reported to
account for 51 percent of professionals. This is interesting because there is a thirty
percent difference in women’s representation between the two countries, with Sweden
and Ireland having the best and worst levels of female representation respectively. This
indicates the need for better measurement of female professionalism in a given country.
However, as with the Europe-wide model, the variable is clearly having an impact on my
model. When the female professionals variable is eliminated from the model, the R2
drops by almost 20 percent (see Table D2 in Appendix D).
Eastern Europe Model19
None of the variables are statistically significant in the Eastern Europe model (see
Table 3).20
However, one has to be cautious in interpreting the results due to the number
of excluded cases. Indeed, as a result of missing data, I analyze fifteen countries as
opposed to the original twenty. Despite this, the results for the limited data set
demonstrate the importance of taking region into consideration.
First, there is an unexpected negative relationship between the number of years
since women’s suffrage was enacted in a country and the level of women’s political
representation in that country. However, one must remember that for years under
communism, voters could only vote for one party. Thus, voters had little to no real choice
in elections. In this regard, the date of suffrage may be less relevant for Eastern Europe.
19
As a result of missing data, the Eastern Europe model contains the following countries: Bulgaria, Croatia,
Czech Republic, Estonia, Hungary, Latvia, Lithuania, Macedonia, Moldova, Poland, Romania, Russia,
Slovakia, Slovenia, and Ukraine.
20
See Table B3 in Appendix B for Eastern Europe data.

50
Table 3: Eastern Europe Model:
OLS Regression Results21
Unlike my earlier models, the positive relationship between the favorability of a
country’s electoral system to the election of women and the level of women’s political
representation in that country is not statistically significant. While excluded from the
regression model due to missing data, it is interesting that Belarus has the highest
women’s representation despite the fact that it has a SMP system. The vast majority of
countries in this region have PR systems. For instance, both Macedonia and Ukraine
utilize PR, but there is a twenty-two percent difference between the two countries in
terms of women’s political representation. This indicates that regardless of electoral
system, another factor is influencing the election of women in these countries. This is in
line with Moser (2001)’s findings that electoral systems in some Eastern European
countries do not conform to conventional expectations in terms of their impact on
women’s political representation.
21
The R2 for the Eastern Europe model is .434, while the adjusted R
2 is .009. It indicates that a mere 0.9%
of the variation in the dependent variable (women’s political representation) can be explained by the six
independent variables.
Independent Variables b-score
standard
error t score
Years since Women’s Suffrage -.051 .105 -.486
Type of Electoral System 3.699 3.755 .985
Legal Gender Quota 14.869 7.357 2.021
Level of Gender Equality 45.529 53.477 .851
Percent of Female Professionals .182 .395 .460
Level of Religiosity .038 .126 .302
Constant -36.421 63.936 -.570
R2
=43.4%
Adjusted R2 =0.9%
Statistical significance: * p<.05
Data sources: EVS (2008), IDEA (2011), IPU (n.d.), IPU (Nov. 2011), IPU
PARLINE (2012), Norris & Krook (2011), UNDP (2009).

51
While not statistically significant, there is a positive relationship between the
presence of a legal gender quota in a country and the level of women’s representation in
that country. First of all, very few countries in this region have gender quota laws that
meet my operational definition. For instance, Bosnia & Herzegovina does not have legal
sanctions for non-compliance, while Slovenia does not have a placement mandate (IDEA,
2011). Thus, only two countries meet my requirements: Macedonia and Serbia.
Macedonia has a relatively high percentage of women’s representation. The influence of
its gender quota will be discussed further in chapter 9. Serbia also has a relatively high
rate of women’s representation if one considers that the bar for success is clearly set
much lower in Eastern Europe than in Western Europe. However, it is excluded from my
statistical model due to missing data. The Serbia case is interesting because the country
only separated from Montenegro in 2006 (IPU PARLINE, 2012). The legal quota was
introduced in 2004, when the two countries were still united (IDEA, 2011). Thus, as an
independent country, Serbia has always had a legal gender quota. In 2007, women
accounted for 20.4 percent of the legislature, and this percentage increased to 21.6
percent in the last election in 2008 (IPU PARLINE, 2012). As a comparison, in 2003,
before the introduction of the quota, the former Serbia and Montenegro elected a mere
7.9 percent of women to their parliament (IPU PARLINE, 2012). While one has to take
into account the influence of the Montenegrin culture, there has obviously been a rather
significant increase in women’s representation. Therefore, it is possible that this variable
only lends itself to longitudinal analysis.
In terms of the attitudinal variables, there is a positive relationship between the
level of gender equality in a country and the level of women’s political representation in

52
that country. However, the relationship is not statistically significant. Interestingly, on the
one hand, Slovenia has the highest gender equality score in Eastern Europe (.927), but
has low women’s representation. On the other hand, Macedonia has the third lowest
gender equality score in Eastern Europe (.812), but has the highest women’s
representation within the regression model. Yet, one must also remember the region’s
complex history with the notion of gender equality, which is an issue that will be
discussed in greater detail in the case study analyses. It is possible that the GDI is simply
unable to shed light on the impact of gender inequality on women’s political
representation for each of the Eastern European countries.
As previously discussed, the data source for female professionals is problematic,
which may explain the absence of statistical significance for this variable. Again, while
not statistically significant, there is a positive relationship between the percentage of
female professionals in a country and the level of women’s political representation in that
country. However, the segregation of female professionals under communism into less
powerful positions is a factor that must be taken into consideration when evaluating this
result (Eisenstein, 1993, p. 311; Fodor, 2005, p. 12). Indeed, the case studies demonstrate
that men continue to be more prevalent in high level professional positions than women.
Unexpectedly, there is a positive relationship between the level of religiosity in a
country and the level of women’s political representation in that country. While not
statistically significant, this is a curious finding. Nevertheless, Macedonia has a high
level of religiosity and the second highest level of women’s representation in Eastern
Europe, which is obviously the opposite of my hypothesized relationship. Thus, while
there was a return to traditional views of women in the aftermath of communism, it

53
appears that the region’s relationship with religion is more complex and difficult to
capture via regression analysis.

54
Chapter 5: Introduction to Western Europe Case Studies
In chapter 4, the quantitative analysis for the Western Europe model demonstrated
that both structural and attitudinal factors are important in predicting women’s political
representation. Specifically, the favorability of a country’s electoral system to the
election of women and the level of religiosity were both found to be statistically
significant. These factors are also explored in the two Western European case studies that
follow. Sweden and Ireland offer ideal comparative cases, as they fall at either ends of
the women’s political representation table in Western Europe (see Appendix B). The case
studies also permit analyses of the impact of female MPs on women’s substantive
representation in a country. Ultimately, the case studies indicate the collective importance
of a variety of structural and attitudinal factors.
Sweden, which has a population of just over 9 million, has the highest percentage
of women in parliament (45 percent) amongst all European countries (CIA, 2012; IPU,
Nov. 2011). Notably, it also has the third highest rate of women’s political representation
in the world (IPU, Nov. 2011). The Swedish case demonstrates how structural and
attitudinal factors can be harmonized for maximum women’s political representation.
Specifically, the prevalence of gender equality and the low level of religiosity has
safeguarded against the spread of traditional attitudes. Furthermore, this favorable
attitudinal climate, along with the lobbying power of women’s organizations, has led

55
political parties to adopt gender quotas to ensure women’s representation. The country’s
use of list-PR electoral system has also aided women. Collectively, this has led to the
substantive representation of women.
In contrast, Ireland, with a population of approximately 4.7 million, has the lowest
women’s political representation rate in Western Europe with 15.1 percent (CIA, 2012;
IPU, Nov. 2011). Notably, Ireland ranks 32nd
out of 38 European countries in terms of
women’s political representation. Thus, its female representation rate is not only low for
Western Europe, but also for the entire continent. Ultimately, the Irish case shows that
unfavorable structural and attitudinal factors can come together to limit the percentage of
women in a country’s parliament. Unlike Sweden, Ireland has an unfavorable attitudinal
environment with strong conservative and religious values. Indeed, gender inequality is
clearly present in Irish society. This environment helps to explain why many political
parties fail to take action to aid female candidates. In addition, the personalized electoral
system is a primary structural barrier holding women back. As a result of the structural
and attitudinal impediments, women’s substantive representation in Ireland is being
severely hampered.

56
Chapter 6: Sweden
Along with its Nordic neighbors, Sweden is known for its support of gender
equality (Bergqvist, 2011, p. 157). Sweden has “a political culture of egalitarianism,” as
well as a commitment to “the principles of proportional representation, consultation and
inclusiveness” (Sainsbury, 2005, p. 196). Indeed, with its low religiosity and high level of
gender equality, Sweden has a favorable attitudinal environment for the election of
female candidates. The attitudinal environment is partly responsible for the adoption of
party gender quotas, which, when combined with the country’s use of list-PR, have
ensured women’s substantive representation in the parliament (the Riksdag).
Women’s Representation since Suffrage
Swedish women were granted the right to vote and stand for election in 1921
(IPU, n.d.). Sweden was actually the final country in Scandinavia to provide women with
electoral rights (IPU, n.d.). This was partly due to the fact that the women’s suffrage
movement in Swedish was “slow to get under way” and “lack[ing] the radicalism” seen
in the rest of Scandinavia (Forsås-Scott, 1997, p. 28). Despite this, the women were able
to successfully lobby the parliament for voting rights earlier than their peers in some
Western European countries (Forsås-Scott, 1997, p. 28; IPU, n.d.). Thus, the country
would appear to conform to my original hypothesis that there is a positive relationship
between the number of years since women were granted suffrage and the level of

57
women’s political representation. In other words, the case of Sweden disputes the
findings of my regression analysis for the Western Europe, which indicated a negative
relationship between the two variables. Yet, as detailed below, it appears that other
factors have had a greater influence on women’s representation in Sweden than the
number of years since women’s suffrage was granted.
Table 4: History of Women’s Political Representation in Sweden’s Riksdag
Table 4 demonstrates the incremental changes in women’s representation over the
past four decades. In 1921, the first year that women were eligible to vote, 2 percent of
parliamentarians elected to the Riksdag were women (Bergqvist, 2011, p. 158). In 1968,
15.5 percent of MPs were women, which is higher than Ireland’s current level of
women’s representation (IPU PARLINE, 2012). Over the course of two decades, the
percentage of women increased to 38.1 in 1988 (IPU PARLINE, 2012). Yet, the country
suffered a setback in 1991, when the level fell to 33.5 percent (IPU PARLINE, 2012).
Election
Year
Percent of Women
Elected to the Riksdag
1968 15.5
1970 14.0
1973 21.4
1976 22.6
1979 26.4
1982 27.5
1985 29.8
1988 38.1
1991 33.5
1994 40.4
1998 42.7
2002 45.3
2006 47.3
2010 45.0
Data source: IPU PARLINE (2012)

58
However, as a result of a strong women’s movement and reactive political parties
initiating new gender quotas, the percentage increased to 40.4 percent in 1994, and
women’s representation currently sits at 45 percent (IPU PARLINE, 2012).
Electoral System
Sweden utilizes a semi-open, or flexible, list-proportional (list-PR) electoral
system (Schmidt, 2008b, p. 192). While the regression results have demonstrated that
proportional systems are generally more favorable to the election of women, some studies
argue that open lists are not as favorable to women as closed lists (Norris, 2004, p. 197).
However, Reynolds (1999) suggests that “women-friendly voters” in more “progressive
cultures” select female candidates under this system (p. 555). First of all, Sweden only
adopted a semi-open list-PR system in 1998, as the country previously used a closed list-
PR system (Sainsbury, 2005, p. 197). Thus, the tremendous growth in women’s
representation occurred under closed list-PR. Second, semi-open means that voters have
the “option” of selecting a candidate(s) from the party lists (Sainsbury, 2005, p. 197).
However, they can also choose to simply vote for the party, thereby voting for the
candidates in the order in which they are printed on the ballot (Schmidt, 2008a, p. 166).
Ultimately, it appears that the semi-open list-PR option has had limited effects on the
overall results: “Only between one-quarter and one-third of the electorate utilised its
option to vote for a candidate in addition to the party; as a result, ten or twelve candidates
in each election entered parliament, and they comprised a mere 3-4 per cent of the
members of parliament” (Sainsbury, 2005, p. 197-8). Thus, it does not appear to have
harmed women’s chances. In fact, women have undoubtedly benefitted far more from the

59
PR system than an SMP system. This may also be due to the egalitarian values in
Sweden, which are discussed below.
Gender Quota
I hypothesized a positive relationship between the presence of a legal gender
quota in a country and the level of women’s political representation in that country.
Interestingly, however, Sweden uses only voluntary party quotas and has a high rate of
women’s representation. Almost all of the parties utilize some type of gender quota or
target system (Freidenvall, 2011, p. 136). Yet, their journeys to adopting these measures
require discussion. Quotas were first mentioned in 1928 by the National Federation of
Social Democratic Women (Freidenvall, 2011, p. 134). However, they were dismissed at
the time because critics believed they were “in conflict with the fundamental principles of
equal opportunity for all” (Freidenvall, 2011, p. 134). Over time, attitudes towards gender
quotas have changed. For example, quotas were introduced at the local level in some
areas by the Social Democratic Party in the late 1960s and early 1970s (Freidenvall,
2011, p. 134).
Political parties started to embrace gender quotas as the result of: 1) electoral
competition between parties, 2) the threat of a legal gender quota, and 3) pressure from
women’s groups (Freidenvall, 2011, p. 135; Sainsbury, 2005, p. 203-9). First of all, in
1972, there was “competition” between political parties for women’s votes (Freidenvall,
2011, p. 135). Second, in the late 1980s, a government commission investigating
women’s representation threatened to initiate legal gender quotas for state boards and
committees (Freidenvall, 2011, p. 135; Sainsbury, 2005, p. 203-5). While the threat of
legal quotas did not apply to parliamentary nominees, it led to a discussion of quotas in

60
the public domain (Freidenvall, 2011, p. 135; Sainsbury, 2005, p. 205). The commission
ultimately agreed not to pass legal quotas if women comprised 30 percent of the state
board and inquiry committee nominees by 1992 (Sainsbury, 2005, p. 205). Finally, after
the percentage of women in parliament fell following the 1991 elections, the Support
Stockings women’s organization threatened to establish a women’s party that would steal
votes from other left-leaning parties if the parties did not increase their women’s
representation (Sainsbury, 2005, p. 207-9). In addition, women’s caucuses within
established political parties, such as the Social Democratic Women’s Federation (SSKF),
used the threat to pressure political gatekeepers in their own parties to take action
(Sainsbury, 2005, p. 209). In response, in 1993, the Social Democratic Party instituted a
zipper system (Freidenvall, 2011, p. 135; IDEA, 2011; Sainsbury, 2005, p. 208).
Similarly, the Left Party increased their quota to 50 percent (Freidenvall, 2011, p. 135;
IDEA, 2011).
Lenita Freidenvall (2011) notes that “with the exception of the Sweden-
Democratic Party,” parties with quotas have higher women’s representation than parties
without such measures (p. 138). Yet, she argues that overall “the introduction of quotas
contributed to safe guard levels already gained.” (Freidenvall, 2011, p. 142). Unlike in
some countries, the evidence indicates that the parties are willing to self-police the
implementation of their quotas. For instance, during the 2006 elections, the Green Party
and the Social Democratic Party each applied their quota rules to 76 percent of their
districts, while the Left Party applied their quotas to 69 percent of their districts
(Freidenvall, 2011, p. 140). In addition, in the most recent election in 2010, 48.2 percent
of those elected from the Social Democratic Party were women, while 57.9 percent of

61
those elected from the Left Party were female (IPU PARLINE, 2012). Thus, in Sweden,
it does not appear to be necessary to have a legal gender quota in place.
Overall, the adoption of quotas has demonstrated that political parties are friendly
to women. Furthermore, they arguably show that parties are susceptible to lobbying from
women’s groups and women’s caucuses within the parties. This also speaks to the
prevalence of the egalitarian environment, in which parties are aware that they will pay a
price at the polls if they do not institute measures to ensure women’s representation.
Gender Equality
Sweden is known for its egalitarian environment. Indeed, it has one of the highest
gender equality scores, ranking 5th
in the world and joint 3rd
in Europe behind Norway
and Iceland on the 2007 Gender-related Development Index (GDI) (UNDP, 2009). In this
regard, while this factor was not statistically significant in any of the models, there is
support for the hypothesis that there is a positive relationship between the level of gender
equality in a country and the level of women’s political representation in that country.
The estimated income for women in 2007 was $29,476 in comparison to $44,071 for
men, which means that women earn 66.9 percent of men’s wages (UNDP, 2009). Sweden
is 4th
in income equality in Western Europe (UNDP, 2009). These pay inequalities “can
largely be explained by differences in their profession, sector, position, work experience
and age” (Swedish Institute, 2011, p. 3). In addition, research shows that “on average,
women’s monthly salaries are 94 percent of men’s when differences in choice of
profession and sector are taken into account” (Swedish Institute, 2011, p. 3). This
indicates that the vast majority of pay inequalities in Sweden are not the result of gender
discrimination, which is most likely due to the prevalence of the egalitarian culture.

62
In addition to low pay inequalities, “women comprise roughly 60 percent of all
students in under-graduate university studies and almost two-thirds of all degrees are
awarded to women” (Swedish Institute, 2011, p. 1). In 2007, women also had a higher
combined gross enrollment ratio in education than men (UNDP, 2009). These education
statistics support Sweden’s proclaimed commitment to gender equality.
Surveys of Swedish citizens also support the prevalence of egalitarian attitudes. In
one survey, 76 percent of Swedish couples had “egalitarian ideals,” while 59 percent of
couples reported that they shared housework (Bernhardt, Noack, & Lyngstad, 2008, p.
281). In another study, a mere 11 percent of parents said that the husband is the “sole
provider” for the family (Ellingsæter, 1998, p. 66). In contrast, 55 percent reported that
they shared the task of providing for the family (Ellingsæter, 1998, p. 66). Furthermore,
in comparison with Norway, Swedish survey respondents “score significantly higher on
the scale on positive attitudes toward mothers’ employment than Norwegians” (Knudsen
& Wærness, 2001, p. 75). Thus, while the GDI is able to demonstrate some elements of
gender equality, it is unable to capture some attitudinal differences, which explains why
Norway scores higher on the GDI than Sweden.
Finally, it should be noted that Sweden offers parents a generous 480 days of
leave following the birth of their child, which permits both men and women to share
parenting duties (Swedish Institute, 2011, p. 2). Indeed, approximately 85 percent of
Swedish men utilize at least some of their paternity leave (Bennhold, 2010). Former
Swedish politician Bengt Westerberg states: “The only way to achieve equality in society
is to achieve equality in the home. Getting fathers to share the parental leave is an
essential part of that” (qtd. in Bennhold, 2010). In addition, according to Anne Lise

63
Ellingsæter (1998), the country began offering childcare services in the late 1960s and
early 1970s in order to ensure “the integration of mothers into the labour force” (p. 62).
Essentially, the welfare state was used to both enable and encourage women to pursue
employment opportunities.
Female Professionals
ILO data indicates that Swedish women account for 51 percent of professionals in
the country (UNDP, 2009). I have previously discussed the imperfect nature of this
measure. According to the data, Swedish women have the same level of professional
participation as Norway and Portugal, but slightly less than Iceland, Finland, Ireland, and
Denmark (UNDP, 2009). Statistics Sweden (2010) reports that women account for 56
percent of “business professionals” (p. 65). However, the Swedish Institute (2011) offers
a more detailed picture of the situation:
The percentage of women heading Swedish private limited companies (with more
than one employee, excluding the managing director) was 25 percent in 2009.
This represents an increase of 16 percentage points since 1990. The proportion of
women on the boards of listed companies is also increasing, having risen from 6
percent in 2002 to 22 percent in 2009. The figures are higher in the public sector.
The majority of managers in municipal, county council and central government
are women (52 percent). (p. 3)
Based on this information, it appears that Sweden has made considerable progress in
providing women with professional career opportunities. Female business professionals
also reportedly earn 79 percent of men’s wages (Statistics Sweden, 2010, p. 65). Thus,
there seems to be some support for my hypothesis of a positive relationship between the

64
percentage of female professionals in a country and the level of women’s political
representation in that country.
Religiosity
Sweden is a “very secular country” and was “one of the first countries in Western
Europe to embrace the ideas of the Reformation” (Jänterä-Jareborg, 2010, p. 669; p. 671).
Indeed, Sweden has the lowest religiosity level in Europe with 14.2 percent (EVS, 2008).
In addition, only 23.4 percent of respondents stated that religion was important to them
(EVS, 2008). Interestingly, most Swedes are members of the Church of Sweden, since
“until 1996 all citizens of Sweden were automatically born into the Church of Sweden,
on condition that at least one of the parents belonged to the Church” (Jänterä-Jareborg,
2010, p. 669). The Church of Sweden has also permitted female ministers since 1958
(Jänterä-Jareborg, 2010, p. 671), thereby demonstrating that the church itself is
supportive of egalitarian measures. Yet, just 4.9 percent reported attending religious
services at least once a week or more (EVS, 2008). Thus, there is clearly support for the
finding that there is a statistically significant negative relationship between the level of
religiosity in a country and the level of women’s political representation in that country.
Part of the secularization of society resulted from the creation of a welfare system
in the aftermath of World War II: “New legislation, based on the idea of gender equality
paved the way for women’s entry into the labour market and abolished the remains of
religious values in fields such as family law” (Jänterä-Jareborg, 2010, p. 672). This also
meant that “religion became increasingly regarded as belonging to the private sphere of
life, only” (Jänterä-Jareborg, 2010, p. 672). Indeed, although there is a Christian
Democratic party, Maarit Jänterä-Jareborg (2010) argues that “even for leaders of this

65
Party, it would be most odd and unusual to refer to God in their public speeches or in the
public arena in general” (p. 670). Thus, it is clear that, unlike in other European countries,
religion is not a major influence on Swedish society or public policy.
Impact on Substantive Representation
The large percentage of women in the Riksdag has had a positive effect on
women’s substantive representation. Specifically, studies have shown that “female
politicians have consistently been the group that have pursued social welfare policy
issues to the greatest extent in their parliamentary work” (Wangnerud, 2000, p. 82).
Social welfare policy obviously has a tremendous impact on women. In addition, as
mentioned above, the debate over gender quotas is another example of substantive
representation. Specifically, SSKF worked with elected officials, such as MP Mona
Sahlin, to lobby for quotas (Sainsbury, 2005, p. 209).
Conclusion
Overall, as a result of the harmony between structural and attitudinal factors,
Sweden has the most impressive level of women’s representation in Europe. Indeed, both
survey and statistical evidence demonstrate the prevalence of gender equality in Swedish
society. The low level of religiosity has also hampered the spread of traditional attitudes.
Thus, there is support for my gender equality, female professionals, and religiosity
hypotheses. Due to the egalitarian environment, lobbying by women’s organizations, and
the desire to court female voters, political parties began to adopt and self-police gender
quotas. Of course, the list-PR electoral system has also enabled these gender quotas to
take effect. Collectively, this has led to the substantive representation of Swedish women.

66
Chapter 7: Ireland
Ireland ranks at the bottom of women’s political representation in Western Europe
(IPU, Nov. 2011). In an editorial, Garret Fitzgerald (2010) explains that this has grave
implications: “Our party system, lacking significant female input, is bound to be
incomplete and defective.” This case study explores the ways in which a combination of
structural and attitudinal factors have limited women’s presence in the lower house of the
Irish Parliament (the Dáil Éireann). Specifically, the high level of religiosity and
unfavorable climate towards gender equality combined with a personalized electoral
system are primarily responsible for women’s predicament. The refusal of political
parties to take greater measures to increase women’s representation is also an issue.
Indeed, the twenty-five female parliamentarians that account for 15.1 percent of the Dáil
are severely limited in their ability to partake in the substantive representation of women.
Before analyzing structural and attitudinal factors, it is important to note that
Ireland had two successive female presidents, Mary Robinson and Mary McAleese, from
1990 to 2011 (Galligan, 2009, p. 263; IPU PARLINE, 2012). Thus, on the surface, the
country would seem open to the election of women. However, this appearance is a
smokescreen (Galligan, 2009, p. 265). Presidents essentially serve as the face of Ireland
and have a largely “symbolic role” (Hardy, 2008, p. 47). Indeed, Molly O’Hagan Hardy
(2008) says that once in office, Robinson became a “mother figure for Ireland” (p. 57).

67
Notably, a woman has never been elected as Prime Minister (Taoiseach), a position with
more power over legislative matters (Galligan, 2009, p. 265).
Women’s Representation since Suffrage
In Ireland, women were granted the right to vote in 1922 (Y. Galligan, personal
communication, April 1, 2012). However, at the time, Ireland was “not fully independent
(it was a Free State, could make its own laws, but was still under UK jurisdiction)” (Y.
Galligan, personal communication, April 1, 2012). It is important to note that women’s
suffrage was linked to nationalism and “was interpreted as a step on the way to self-
government” (Galligan, 2009, p. 263). In other words, the focus was not on granting
women the right to vote in and of itself. Rather, the focus was on the national cause.
Interestingly, Frances Gardiner and Monique Leijenaar (1997) claim: “Nationalism splits
women’s identity, retarding gender consciousness in favour of tribal loyalty” (p. 78).
Thus, while I expected a positive relationship between the years since women’s suffrage
and women’s political representation, I did not account for the environment in which
suffrage was introduced.
Since they were granted voting rights, women have made limited progress in the
Dáil. In the first election in 1922, women accounted for 1.6 percent of the parliament,
which is similar to the percentage of women in Sweden’s Riksdag in the same time
period (Galligan, 1993, p. 152; IPU PARLINE, 2012). However, the growth has been
anemic. It took 70 years for women’s representation to break into double-figures, with 12
percent of women in parliament in 1992 (Galligan, 1993, p. 152). Women accounted for
18.5 percent of all candidates that year, which was a 4.4 percent increase in female
candidates from the previous election (Galligan, 1993, p. 152). Thus, this indicates that

68
there has been a small increase in women coming forward to run for office. However, in
2011, women made up just 15.1 percent of all Irish parliamentarians (Teachtaí Dála,
TDs) (IPU PARLINE, 2012).
Table 5: History of Women’s Political Representation in Ireland’s Dáil
Electoral System
While the regression results found a statistically significant positive relationship
between electoral systems that are favorable to women (i.e. PR systems) and the level of
women’s political representation in that country, it is important to note that Ireland was
the only non list-PR country included in the proportional representation category. Instead,
Ireland utilizes the single transferable vote (STV) electoral system (Sinnott, 2009). As
Gardiner and Leijenaar (1997) note: “The highly personalised type of electoral system,
Election Year
Percent of
Women Elected
to the Dáil
1922 1.6
1932 1.3
1943 2.2
1954 2.8
1969 2.1
1973 2.8
1977 4.1
1981 6.6
1982 (February) 4.8
1982 (November) 8.4
1987 8.4
1989 7.8
1992 12.0
1997 12.0
2002 12.7
2007 13.3
2011 15.1
Data sources: Galligan (1993, p. 152) (1922-1992 data);
IPU PARLINE, 2012 (1997-2011 data)

69
where every personal vote counts toward an electoral quota, means that campaigns attract
confident personalities and are costly undertakings” (p. 78). Yet, studies find that women
lack the confidence to run for office in Ireland (Department of Justice and Equality,
2012), which is perhaps connected to the electoral system. Similarly, a survey of eligible
female candidates in the U.S. indicates that women are “63 percent more likely than men
to view the likelihood of winning any political contest as ‘very unlikely’” (Lawless &
Fox, 2005, p. 98). It is notable that the U.S. uses SMP (IPU PARLINE, 2012), which is
also a personalized voting system. Second, as discussed below, Irish women do not earn
as much money as men (UNDP, 2009). Thus, the costs can prevent women from running
(Department of Justice and Equality, 2012; Leyenaar, 2004, p. 37).
Given the personalized nature of voting, it is perhaps not surprising that some
women who have been elected have had familiar relations with previous officeholders:
“The relationship between electoral success and family ties with previous political
incumbents remains on average twice as significant a factor for women as for men”
(Galligan, 1993, p. 149). While family ties are less prominent today for elected female
TDs, it is notable that “from 1927 to 1973 the majority of women elected to Dáil were
related through family or marriage to former TDs” (Galligan, 2009, p. 278). Based on
this, one may infer that women were not respected either by voters or by the political
parties without the family name. However, in their study of American politics, Jennifer L.
Lawless and Richard L. Fox (2005) observe a statistically significant positive relationship
between a political upbringing (i.e. having a parent that previously ran for office) and an
individual considering a run for office (p. 57). Thus, political socialization may be a
factor in Ireland.

70
Another factor is that the personalized system leads to the prominence of
incumbency, which hurts new candidates (Galligan, Laver, & Carney, 1999). As Yvonne
Galligan, Michael Laver, and Gemma Carney (1999) conclude: “Women candidates get
fewer votes than men, not because they are women per se, but because women are less
likely to be incumbents, and thus to benefit from the clear incumbency bonus” (p. 120).
Therefore, because women do not have a history of participating in Irish politics, they are
at a disadvantage when they go head-to-head against an incumbent.
A final aspect of Ireland’s electoral system that is detrimental to women relates to
the use of by-elections when MPs leave office in the middle of their terms (Gardiner &
Leijenaar, 1997, p. 80). In contrast, under list-PR, vacancies are generally filled by names
further down the ballot from the original election (Gardiner & Leijenaar, 1997, p. 80; IPU
PARLINE, 2012). Of course, in general, women tend to occupy the positions lower on
the list (Moser, 2001, p. 366). Thus, it is easier for women to be elected under list-PR,
rather than having to undertake a brand new campaign for office (Gardiner & Leyenaar,
1997, p. 80).
Gender Quota
I would expect the absence of a legal gender quota to harm the level of women’s
political representation in Ireland, which appears to be the case. Indeed, only one major
party in the country has a voluntary gender quota. As the result of lobbying from
women’s groups and the Gender Quota Committee, the Labour Party has had a 20
percent gender quota since the early 1990s (Galligan, 1993, p. 164). From 2012, the party
will have a 33 percent gender quota, which will increase to 40 percent seven years later
(Galligan, 2009, p. 272). Indeed, Labour has the highest percentage of women in the Dáil,

71
with 22.2 percent (8 out of 36) of those elected from the party being female (Houses of
the Oireachtas, 2012).
The rest of the main parties do not have quotas, which may help to explain the
limited percentage of women in the Dáil. In 2011, 20 percent of Sinn Féin’s candidates
were women, while 14.3 percent (2 out of 14) were elected to the Dáil (Houses of the
Oireachtas, 2012; Sinn Féin, 2011). In addition, despite women comprising 16 percent of
Fianna Fáil’s candidates in 2011, none were elected (Houses of the Oireachtas, 2012;
Kavanagh, 2010). It should be noted, however, that the party suffered a significant defeat
at the polls (IPU PARLINE, 2012). In addition, despite Fine Gael winning 45 percent of
the votes in the Dáil (IPU PARLINE, 2012), just 14.7 percent of those elected from the
party were women (Houses of the Oireachtas, 2012). Collectively, this indicates that
either women are placed in unwinnable districts, or else the parties are not devoting as
many resources to their female candidates as to their male candidates.
Some parties have focused on “target setting” rather than enacting quotas
(Galligan, 2009, p. 272). For example, Fine Gael “set a target of securing the election of
between eight and ten women to the Dáil in 2008, up from the two returned in 2002”
(Galligan, 2009, p. 272). Similarly, Fianna Fáil announced in 2005 that it was seeking to
have women account for a third of its candidates by 2014 (Galligan, 2009, p. 272). Based
on the most recent election, however, it appears that parties are not doing enough to
increase the percentage of female candidates. Indeed, Galligan (2009) points out: “The
likelihood of a substantially increased presence of women in political life is slim without
the adoption of strong affirmative action measures by parties” (p. 287). This is in sharp
contrast to the pro-women stance of most Swedish political parties. The overall lack of

72
party commitment to gender quotas has prevented the establishment of a contagion effect,
which occurs when parties adopt quotas to battle for women’s votes (Freidenvall, 2011,
p. 135). The absence of the contagion effect is perhaps due to the fact that gender equality
does not pervade public discussion as it does in Sweden (Bergqvist, 2011, p. 166; Cullen,
2008, p. 86).
Recently, there has been increased attention on the prospect of a legal gender
quota. In February 2012, the Minister for Environment, Community and Local
Government, Phil Hogan introduced a gender quota bill in the Irish Senate (Seanad
Eireann) (IDEA, 2012). The bill “proposes to remove one-half of state funding for the
lifetime of a Dail from parties that do not select a minimum 30% female candidates at the
next general election” (IDEA, 2012). Seven years after the first election, the quota would
increase to 40 percent for each subsequent election (Department of Justice and Equality,
2012).
While there are penalties for non-compliance in the proposed bill, there is
obviously no way to introduce a placement mandate due to the STV system. Thus, even if
the bill passes, it will be left in the hands of the political parties to campaign equally for
their male and female candidates, which, if past evidence is any indication, could hurt
women’s chances of being elected. Indeed, in a 2007 survey, 73 percent of female
candidates agreed that “women are not given the opportunity [to run] by parties”
(McElroy & Marsh, 2011, p. 531). This led Gail McElroy and Michael Marsh (2011) to
conclude that “there may well be nomination bias at play in Irish political parties” (p.
532).

73
Senator Averil Power believes the proposed quota law could inadvertently have a
negative impact on women: “I think we could all be worse off if it is not taken seriously
and women are put forward who don’t have a chance of winning (because of the
constituencies in which they are run)” (qtd. in Daly, 2012). Interestingly, however, as will
be discussed in the Hungary case, the quota proposal has been criticized by some female
TDs for “subvert[ing] democracy by making the ends more important than the means”
(Tuffy, 2011). Yet, the bill has the support of the current Taoiseach Enda Kenny, who has
pointed out the lack of electoral progress women have made since being granted suffrage
(The Journal, Jan. 2012). In addition, the National Women’s Council of Ireland and the
5050 Group are both championing quota legislation (5050 Group, 2012; Brennan, 2011).
Yet, without widespread support for quotas, it remains unclear whether the bill will
become law.
Gender Equality
Ireland is ranked 10th
in the world and 8th
in Western Europe on the GDI (UNDP,
2009). In comparison, Germany, which has more than double the level of women’s
representation, is ranked 20th
in the world (UNDP, 2009). In fact, nine of the eighteen
Western European countries in this study have lower GDI rankings but higher rates of
women’s representation than Ireland. Based on my hypothesized positive relationship
between the level of gender equality in a country and women’s political representation in
that country, I would expect women’s representation to be higher in Ireland. On the one
hand, education does not appear to be an issue that is holding women back, as 59 percent
of college freshmen were women between 2006 and 2007 (Galligan, 2009, p. 274).
Indeed, the 2007 survey of female candidates found that a mere 6 percent agreed with the

74
statement that “women do not have [the] right experience and education” (McElroy &
Marsh, 2011, p. 531). On the other hand, the GDI indicates that women earn 55.8 percent
of men’s wages, which is the 5th
highest pay inequality in Western Europe (UNDP, 2009,
p. 181). Nevertheless, it appears that the GDI does not fully capture the gender inequality
that is inherent in Ireland.
In order to identify gender inequality, one must begin by looking at the Irish
Constitution (1937), which states:
In particular, the State recognises that by her life within the home, woman gives
to the State a support without which the common good cannot be achieved. The
State shall, therefore, endeavour to ensure that mothers shall not be obliged by
economic necessity to engage in labour to the neglect of their duties in the home.
(Article 41.2)
As Pauline P. Cullen (2008) points out, this means that “ideologically the role of mothers
as carers continues to be underwritten by the Irish constitution” (p. 88). Indeed, Ireland
“lacks policies like those in Holland where childcare and employment incentives attract
women to paid work” (Gardiner & Leijenaar, 1997, p. 76). Furthermore, Irish political
parties “have resisted the establishment of a strong childcare infrastructure, sensitive to
the traditional view that children should be cared for by their mothers in the home”
(Cullen, 2008, p. 87). This is problematic since Irish Senator Ivana Bacik cites the
“shortage of childcare assistance” as one reason for the absence of women in politics
(The Journal, Jan. 2012). The GDI also does not capture the fact that working mothers
earn less than other women (Cullen, 2008, p. 85). Collectively, this indicates that the
climate does not lend itself to gender equality.

75
Survey evidence also demonstrates the absence of gender equality in Ireland. In a
2007 survey, only 49 percent of men concurred that “working mothers can have as strong
a bond with their children as home-based mothers” (Galligan, 2009, p. 276). In contrast,
75 percent of young women agreed with the statement (Galligan, 2009, p. 276). Based on
this, Galligan (2009) subsequently concludes: “It appears that, in general, Irish men
continue to expect women to pursue a traditional family role, while Irish women are more
open to balancing the obligations flowing from this role with job and career demands”
(Galligan, 2009, p. 276). The problem, of course, is that men obviously tend to be the
political gatekeepers in Ireland (Ferriter, 2011). Therefore, their opinions can hurt
women’s electoral chances. Furthermore, given men’s standing in Irish politics, it is
perhaps not surprising that scholars indicate that the country lacks the “political will” to
make gender equality more than a “marginal element in Irish policymaking” (Cullen,
2008, p. 87).
Female Professionals
As mentioned in the regression results, women account for 53 percent of
professionals in Ireland (UNDP, 2009). If this is the case, I would expect there to be more
women in the Dáil. Yet, since the operational definition of “professional” used by the
UNDP (2009) seems broad, more research is needed. Additional statistics indicate that in
2009, women accounted for 40 percent of attorneys and barristers (Galligan, 2009, p.
273). However, only 20 percent of “small and medium-sized companies are owned or
managed by women” (Galligan, 2009, p. 274). In contrast, Swedish women run 25
percent of private companies (Swedish Institute, 2011). Yet, it is difficult to compare
these statistics since the operational definitions may be different.

76
It is important to note that there were barriers to women participating in the work
force in earlier decades. From 1932 to 1974, the marriage bar prevented women from
working in the civil service/government sector after they married (Galligan, 1998, p. 31-
2; Galligan, 2009, p. 273). This resulted in “an entire generation of women” being
prevented from working as public servants (Galligan, 2009, p. 273). This is particularly
problematic since they were unable to gain valuable experience that could have led to a
political career. In other words, the absence of women from the government sector could
arguably help to explain the limited percentage of women in elected office in earlier
decades. Of course, women have been able to work in civil service for almost four
decades. Thus, the explanation of the marriage bar has limited explanatory power for the
current level of women’s political representation.
It is curious that in Ireland, there seems to be greater emphasis on professional
experience for female candidates, but not for male candidates since men “come from
more varied employment backgrounds” (Galligan, 2009, p. 277). Indeed, in the current
Dáil, some male TDs are carpenters and farmers, while none of the female TDs have
similar backgrounds (Houses of the Oireachtas, 2012). In the previous Dáil (2007-2011),
“almost one-half of the women TDs were involved in education prior to entry to the Dáil,
one-third had professional and business careers, while 14 per cent came from the legal
profession” (Galligan, 2009, p. 278). Notably, Galligan (2009) concludes that male TDs
“do not appear to be penalised for lower educational performance, as this is compensated
for through their local network-building experience” (p. 277). First of all, this is further
evidence that female candidates do not campaign on an even playing field. Second, it
demonstrates that women continue to compete with an unfavorable personalized electoral

77
system. In this case, the high percentage of female professionals does not indicate a
favorable attitudinal environment since Irish political culture does not appear to place an
emphasis on professional experience for members of the Dáil.
Religiosity
At 55.8 percent, Ireland has the highest level of religiosity in Western Europe
(EVS, 2008). It also has the fourth highest religiosity rate in the entire continent (EVS,
2008). The EVS (2008) survey found that religion was important to 67.3 percent of
respondents, while 44.3 percent reported attending religious services at least once per
week or more. The church attendance rate is the highest in Western Europe (EVS, 2008).
Thus, it is clear that despite its reported decline in importance and influence on society in
recent years (Galligan, 2009, p. 275; Ryan, 2012), religion remains prominent in Ireland.
In this manner, Ireland conforms to my finding of a statistically significant negative
relationship between the level of religiosity in a country and the level of women’s
political representation in that country.
Catholicism has been influencing government policy for generations. Shortly after
women were granted suffrage and the Irish Free State was established in 1922, the
government “set about shaping a role for women based on patriarchy and Catholic social
thought” (Gardiner & Leijenaar, 1997, p. 71). Cullen (2008) argues that the article in the
Constitution that references women’s “duties in the home” is an example of the
“persuasive influence of the Catholic Church on Irish Society and politics” (p. 85).
Similarly, Galligan (1998) proclaims that Ireland has “an institutionalized church with
close connections to political elites” (p. 29). Furthermore, the church has not moved away
from its traditional view of women as wives and mothers (Galligan, 1998, p. 39).

78
The Catholic Church has heavily influenced Ireland having the “strictest” abortion
law in Europe (Ryan, 2012), thereby demonstrating the power of the church on both
public policy and society. The Irish Constitution (1937) states:
The State acknowledges the right to life of the unborn and, with due regard to the
equal right to life of the mother, guarantees in its laws to respect, and, as far as
practicable, by its laws to defend and vindicate that right. (Article 40.3)
Indeed, all abortions were illegal until 1992, when the Supreme Court ruled that abortions
could be permitted if there is a danger to the mother’s life (O’Brien, 2010; Ryan, 2012).
This means that women seeking abortions that do not meet these requirements are forced
to travel to the UK or other nearby countries (O’Toole, 2012). Given the controversy over
abortion in Ireland, policymakers prefer to avoid legislating on this issue, even to the
detriment of women’s health (O’Brien, 2010). Notably, a recent EU ruling will force
policymakers to legislate on abortion (O’Brien, 2010; Ryan, 2012). Regardless, the
abortion issue is further evidence of the impact of heightened religiosity on women’s
rights in society. In contrast, less religious Sweden permits abortions for any reason until
the 18th
week of a pregnancy (Pew Forum on Religion & Public Life, 2008). Notably,
unlike Ireland, “abortion has not been a politically controversial issue in Sweden” (Pew
Forum on Religion & Public Life, 2008).
Impact on Substantive Representation
The lack of women in the Dáil has undermined the substantive representation of
women. Research indicates that female representatives are “reluctant to be over-identified
(or, in some cases, even associated) with feminist issues, and unwilling to be typecast as
speaking for women” (Galligan, 2009, p. 282). Instead, they focus on “socio-cultural

79
issues” (Galligan, 2009, p. 282). Under these circumstances, female representatives “have
little option but to moderate their views to fit in with the masculinist culture and norms
pervading Dáil business” (Galligan, 2009, p. 282). One female TD spoke of the
environment towards women in the Dáil:
The problem is that there are so few of us. The time I really was conscious of this
to the point where I really felt afraid was when the abortion referendum
legislation was coming into the house. I spoke in the Dáil and I looked around and
I realised that there were eight men for every one woman in the chamber. None of
those men would have ever envisaged what a crisis pregnancy was like. So it’s a
very dominant culture in here and what you really need is a critical mass of about
30% for that culture to change. (qtd. in McGing, 2011, p. 18)
A second issue is that “parliamentary party cohesion is believed to be even higher
in Ireland than the European average and it is very unusual for a deputy not to vote with
the party line” (McGing, 2011, p. 20). This obviously makes it more difficult for female
TDs to work together (McGing, 2011, p. 20). Despite this, there is evidence of a
transformation in the relationship with constituents. Specifically, female TDs reported
that female constituents are more comfortable talking to them because “they just felt
automatically that a woman would understand [their situation]” (qtd. in McGing, 2011, p.
11). Yet, it is clear that more women are needed in the Dáil in order to alter this
“masculine” culture and allow for women to be adequately represented.
Conclusion
A combination of structural and attitudinal factors have led to the poor
predicament of women’s representation in Ireland, which, in turn, has hurt the substantive

80
representation of women. The overall conservative and religious environment is one
factor. Therefore, there is support for the hypotheses related to gender equality and
religiosity. Indeed, traditional gender attitudes also explain the unwillingness amongst
political parties to take action to aid female candidates via gender quotas. In addition, the
personalized electoral system is a primary structural barrier holding women back. Thus,
there arguably needs to be a greater degree of women’s activism to ensure that female
candidates are actively supported by political parties. A stronger level of women’s
activism would benefit female candidates by bolstering support for the proposed legal
gender quota and altering the conservative attitudinal environment. If political parties feel
threatened, as they did in Sweden, it is possible that they will do more to aid female
candidates. Without this continued pressure, even if the legal gender quota passes, parties
may only grudgingly include female candidates to satisfy the law. Thus, women may be
left in unwinnable districts with few resources at their disposal.

81
Chapter 8: Introduction to Eastern Europe Case Studies
The case studies of Sweden and Ireland have demonstrated that structural and
attitudinal factors are both relevant. For instance, the type of electoral system, the
presence of a legal gender quota, the level of gender equality, and the level of religiosity
are all important explanatory factors in the two Western European countries. Yet, given
the absence of statistical significance for all of the variables in the Eastern Europe
regression model, one wonders about the relevance of these factors further east. Indeed,
the impact of life under communism must be taken into consideration. Furthermore,
literature also indicates that substantive representation is a new phenomenon of the post-
communist period (Wolchik, 1998, p. 288-9). In light of this, I have chosen two Eastern
European countries which, like Sweden and Ireland, are polar opposites in terms of
women’s political representation. Despite the regression results, the case studies of
Macedonia and Hungary indicate the continued relevance of structural and attitudinal
factors in Eastern Europe.
Macedonia, a country of approximately two million people, has the second
highest women’s political representation rate in Eastern Europe with women accounting
for 30.9 percent of its parliament (CIA, 2012; IPU, Nov. 2011). The Macedonian case
indicates that structural factors (a favorable electoral system and a legal gender quota)
can mitigate the effects of negative attitudinal factors related to gender inequality and
religiosity. Furthermore, it also demonstrates the importance of taking context into

82
consideration, as Macedonia is a country in transition that seemingly wishes to prove
itself to the rest of the world by supporting the election of women.
In contrast, Hungary, with a population of just under ten million, has the second
worst rate in the entire European continent with a mere 9.1 percent female representation
in its parliament (CIA, 2012; IPU, Nov. 2011). The Hungarian case indicates that both
structural and attitudinal factors can hamper women’s political representation.
Furthermore, unlike Macedonia, Hungary is already a member of the EU (Eurostat, 2008)
and does not need to prove itself to the world. Thus, policymakers are apparently lacking
the will, and the pressure, to promote women’s political representation by initiating a
legal gender quota. Indeed, the conservative climate towards gender equality in the
country is not favorable. Furthermore, the polarizing environment in the Hungarian
government is not conducive to the discussion of gender parity. In addition, the
Hungarian mixed electoral system is a prominent structural barrier to the election of
women.

83
Chapter 9: Macedonia
Under communism, Macedonia was one of the six republics (Bosnia &
Herzegovina, Croatia, Montenegro, Serbia, and Slovenia) that comprised Yugoslavia
(Ramet, 1998, p. 164). Unlike Slovenia and Croatia, Macedonia has always been one of
the “less developed areas” (Ramet, 1998, p. 168). As Yugoslavia fell apart in the early
1990s, Macedonia “reluctantly declared its independence in October 1991” (Ramet,
1998, p. 180). Since its declaration of independence, Macedonia has sought to integrate
itself into the rest of Europe via EU membership (Risteska, 2007). Indeed, as discussed
below, it has even introduced gender equality laws that comply with EU laws
(Kazandziska, Risteska, & Schmidt, 2012, p. 27). Yet, in 2008, Macedonia was tied with
Bosnia & Herzegovina and Albania for the lowest living standards in Central and Eastern
Europe (Kazandziska, Risteska, & Schmidt, 2012, p. 9). This context is important when
evaluating women’s representation in the country. It is clearly a country in transition that
is seeking to prove itself to the world, which affects its choices regarding incorporating
women into its parliament (the Sobranie). The favorable electoral system and the
presence of a legal gender quota have reduced the impact of negative attitudinal factors
related to gender inequality and religiosity. Furthermore, there is evidence that female
MPs are partaking in the substantive representation of women.

84
Women’s Representation since Suffrage
Unlike some European countries, Macedonia “never [had] a forceful suffrage
movement” (Ristova, 2003, p. 196). However, women’s contribution to the war effort led
them to be enfranchised in 1946 (Albanese, 2006, p. 112; IPU, n.d.). Thus, they have had
voting rights for sixty-five years. My regression analysis for the Eastern Europe model
found an unexpected negative relationship between the number of years since women’s
suffrage was enacted in a country and the level of women’s political representation in that
country. Yet, as mentioned in the discussion of the regression results, suffrage dates are
arguably less relevant due to the number of years women lived under communism during
which their voting options were limited.
Table 6: History of Women’s Political Representation in Macedonia’s Sobranie
Under communism, “women were never well represented in the Macedonian
parliament…but they were present” (Ristova, 2003, p. 196). As Table 6 notes, for the
Election
Year
Percent of
Women
Elected to
Sobranie
Electoral
System
1974 15.6
1978 12.4
1982 11.2
1986 17.4
1990 4.2 TRS
1994 3.3 TRS
1998 7.5 Mixed
2002 17.5 List-PR
2006 28.3 List-PR
2008 31.7 List-PR
2011 30.9 List-PR
Data sources: Ristova (2003, p. 197) (1974-1998 data);
IPU PARLINE (2012) (2002-2011 data).

85
communist elections held between 1974 and 1986, women accounted for an average of
14.2 percent of the Macedonian parliament (Ristova, 2003, p. 197). During this time, the
parliament had an “informal quota system” (Ristova, 2003, p. 193). While Macedonia did
not officially declare its independence until 1991, the 1990 elections are generally viewed
as the first “free” multi-party elections in the country (International Republican Institute,
1994, p. 4; Strmiska, 1999). In the aftermath of communist rule, women’s representation
dropped 13.2 percent (IPU PARLINE, 2012). Yet, as described below, structural changes
in the past decade have led to a sharp rise in the number of women in office.
Electoral System
Macedonia has experienced three different electoral systems in the post-
communist era: majoritarian two-round system (TRS), mixed majoritarian, and list-PR22
(Lundberg, 2009, p. 22; Ristova, 2003, p. 198). For the 1990 and 1994 elections, the
country utilized TRS (Ristova, 2003, p. 198). However, it adopted a mixed system in
1998, and later moved to closed list-PR in 2002 as part of the Ohrid Framework
Agreement (Lundberg, 2009, p. 21; Ristova, 2003, p. 198). The Ohrid Agreement was a
peace agreement between Macedonians and ethnic Albanians, which sought, in part, to
implement a mechanism to increase the representation of ethnic Albanians in the
parliament (Lundberg, 2009, p. 21). The agreement was “motivated by Macedonia’s
desire to join international organisations like the European Union and the North Atlantic
Treaty Organisation (NATO)” (Lundberg, 2009, p. 21). Thus, while women’s groups
campaigned for list-PR (Ristova, 2003, p. 212), it appears to have been primarily
22
In 2011, the electoral code was amended to allow for the election of three MPs representing overseas
constituencies, thereby bringing the number of MPs to 123 (IPU PARLINE, 2012). These MPs are elected
in single-member districts via FPTP (IPU PARLINE, 2012). Yet, Macedonians who reside in their home
country elect via list-PR.

86
introduced to pacify the international community. There was also an increase in district
magnitude with the introduction of the list-PR system, which benefited women since
more seats were available in each district (Ristova, 2003, p. 213). Furthermore, there is
“no formal threshold for parties to cross in order to gain parliamentary seats” (Lundberg,
2009, p. 21). This obviously expands the possibilities of being elected in Macedonia.
Table 6 demonstrates the effect of electoral systems on women’s representation.
Yet, one should also note that a legal gender quota was introduced in 2002 alongside the
list-PR system (Norris & Krook, 2011, p. 60). Therefore, it is difficult to evaluate the
impact of list-PR given the simultaneous introduction of the legal gender quota.
However, as discussed below, reports indicate that many women were placed in
unwinnable list positions in 2002 (Cozzarelli, 2010, p. 19; Dimitrievska, 2004, p. 4).
Regardless of this, the change to list-PR still resulted in a 10 percent increase in women’s
political representation (IPU PARLINE, 2012). Overall, the Macedonia case appears to
support my hypothesized positive relationship between the favorability of a country’s
electoral system to the election of women and the level of women’s political
representation in that country. This is interesting since the Eastern Europe regression
model failed to indicate a statistically significant relationship between these two
variables.
Finally, it should be noted that women have also gained entry to the parliament
after the elections, as Karolina Ristova (2003) explains: “If a party participates in the
formation of a new government, which in Macedonia is quite sizable, most of these
leaders move to the government and have to be replaced by candidates lower on the
closed party lists” (p. 200). Thus, women’s representation has subsequently increased in

87
the immediate aftermath of elections in 2006 (27.5 percent to 28.3 percent), 2008 (28.3
percent to 31.7 percent), and 2011 (27.6 percent to 30.9 percent) as the result of male
candidates not utilizing their parliamentary list positions (IPU PARLINE, 2012). Table 6
reflects these final percentages.
Gender Quota
Female candidates have not only been impacted by the electoral system, but also
by the introduction of gender quotas. Voluntary gender quotas were introduced by the
Social Democratic Union of Macedonia in 1995, with the Liberal Democratic Party and
the Liberal Party following suit, after pressure from women’s groups and the women’s
arm of political parties (Dimitrievska, 2004, p. 3; Norris & Krook, 2011, p. 60; Ristova,
2003, p. 216). In 2002, a legal gender quota was introduced after much lobbying by
women’s groups (Dimitrievska, 2004, p. 4). The influence of the EU Stability Pact’s
Gender Task Force has also been credited for the installation of the legal gender quota
(Spehar, 2012, p. 370). On posters and other printed materials, the women’s groups
stated: “It is hard to imagine a world with 97% of Romeos and 3% of Juliets”
(Dimitrievska, 2004, p. 2). The original legal gender quota called for a “minimum 30%
obligatory presence of the under-represented sex on the candidate lists” (qtd. in
Dimitrievska, 2004, p. 3). The quota also contained a compliance mechanism by stating
that the party’s list would be rejected if it did not meet the requirement (Dimitrievska,
2004, p. 3). As previously mentioned, there was a ten percent increase in women’s
representation as a result of the quota and the new closed list-PR electoral system (IPU
PARLINE, 2012). However, of the 32.2 percent of women on lists, the vast majority

88
(19.8 percent) were placed in the lower half of the lists, where they had less chance of
being elected (Dimitrievska, 2004, p. 4).
Women’s groups were dissatisfied with female candidates being placed in
unwinnable positions (Cozzarelli, 2010, p. 19). Thus, in 2006, a placement mandate was
introduced (Norris & Krook, 2011, p. 60). The requirement states: “In every three places
[on candidate lists] at least one will be reserved for the less represented sex” (qtd. in
IDEA, 2011). After the introduction of the placement mandate, there was a noticeable 10
percent increase in women’s representation from 17.5 percent to 27.5 percent (the
percentage rose to 28.3 percent after the formation of the new government) (IPU
PARLINE, 2012). Thus, it is clear that the placement mandate has had a positive effect.
Macedonia’s acceptance of gender quotas is arguably linked to their desire to be
accepted by the international community. For example, a 2000 report by Marcia
Greenberg and Kara McDonald for the U.S. Agency for International Development
(USAID) argued that increasing women’s political representation would “broaden and
strengthen Macedonia’s democratic culture and processes” (p. viii). Notably, the
European Commission (2000) has stated: “Democracy is a fundamental value of the
European Union, Member States, EEA States, and applicant countries…Its full
realization requires the participation of all citizens women and men alike” (qtd. in
Weiner, 2009, p. 211). Thus, since Macedonia wishes to join the EU, it needs to
demonstrate its willingness to comply with the organization’s values.
Overall, the Macedonian quota system has ideal requirements: closed list-PR
system, legal placement mandate, and sanctions for non-compliance. It should be noted
that Macedonia is one of the few countries in Eastern Europe with a placement mandate

89
(IDEA, 2011). There are also similarities in terms of the pressures exerted by women’s
groups in Macedonia and Sweden. Finally, the placement mandates are also arguably
very important given the prominence of traditional gendered attitudes in the country.
Indeed, in a report on Macedonia, Catherine Cozzarelli (2010) notes: “Interviewees
mentioned that men occupy the top positions in political parties and are not sensitive to
nominating women unless they are forced by law to do so” (p. 19). The prevalence of
such attitudes are discussed in more detail below. Most importantly, this case supports
the notion of a positive relationship between the presence of a legal gender quota in a
country and the level of women’s political representation in that country.
Gender Equality
Macedonia is a disappointing 62nd
worldwide on the GDI (UNDP, 2009). Indeed,
it has the third lowest GDI in Europe (UNDP, 2009). Thus, it does not meet the
hypothesized positive relationship between the level of gender equality and the level of
women’s political representation. First of all, there is a gender gap in the actual
employment rate, with women having a 29.4 percent employment rate in contrast to
men’s 47.5 percent employment rate (Kazandziska, Risteska, & Schmidt, 2012, p. 16). In
addition, in 2007, the estimated earned income for women in Macedonia was $5,956,
whereas the men earned $12,247 (UNDP, 2009). This means that women earn just 48.6
percent of men’s wage (UNDP, 2009). Macedonia has the highest pay gap between male
and female wages amongst sixteen Eastern European countries (Kazandziska, Risteska, &
Schmidt, 2012, p. 12). One reason for this is “the traditional role of women in society and
in the family whereby women take on most of the tasks related to the care of children, the
elderly in the family and the household” (Kazandziska, Risteska, & Schmidt, 2012, p. 7).

90
The problem was arguably aggravated in the aftermath of communism due to the
“weakening of the welfare state” (Ristova, 2003, p. 210). Unlike in Sweden, the wage
gap in Macedonia is primarily the result of “discrimination” (Kazandziska, Risteska, &
Schmidt, 2012, p. 22). This pay gap harmed women running for office in SMDs under the
mixed system since parties were “very interested in candidates with a strong economic
base and the attached economic and social leverage, influence and connections” (Ristova,
2003, p. 209). Yet, with the introduction of list-PR, this issue is less relevant since
candidates are more likely to receive financial assistance from their parties (Ristova,
2003, p. 215).
It is notable that a higher percent of Macedonian women than men have university
degrees (Kazandziska, Risteska, & Schmidt, 2012, p. 7). Of the 412 masters degrees
issued in 2009, 57 percent went to women (Kazandziska, Risteska, & Schmidt, 2012, p.
7). Similarly, of the 114 doctorates issued, 55 percent were given to female students
(Kazandziska, Risteska, & Schmidt, 2012, p. 7). Overall, women accounted for 60
percent of all university graduates in 2008 (Kazandziska, Risteska, & Schmidt, 2012, p.
7). This is important due to the fact that “in the Macedonian political culture, politics is
generally viewed as an activity reserved for those who have a university education”
(Ristova, 2003, p. 207). In the future, as these women gain professional experience, they
could have a substantial positive impact on the level of women’s political representation.
Even though Macedonia has sought to design its domestic laws to comply with
EU regulations in an effort to increase its chances of being accepted into the union
(Spehar, 2012, p. 365), there continues to be gender discrimination in the country
(Kazandziska, Risteska, & Schmidt, 2012, p. 27-8). For instance, employers are still able

91
to ask “the marital or family status of applicants” (Kazandziska, Risteska, & Schmidt,
2012, p. 28). Notably, Macedonian employers are required “to pay for maternity leave for
female employees,” which, along with cultural stereotypes, makes women less desirable
employees (Ristova, 2003, p. 210). While paternity leave for men is offered, Milka
Kazandziska, Marija Risteska, and Verena Schmidt (2012) indicate that men are not
currently being “encouraged” to utilize it (p. 33). Thus, the burden of childcare continues
to fall on women. Overall, this speaks to the hostile environment towards gender equality.
In addition, some evidence indicates that women are not taking advantage of the new
gender equality laws (Spehar, 2012, p. 373). Thus, based on attitudes toward gender
equality alone, Macedonia defies expectations with its high level of women’s political
representation. This indicates that favorable structures are mitigating unfavorable gender
attitudes.
Female Professionals
According to ILO data, women account for 53 percent of professionals in
Macedonia (UNDP, 2009). However, as discussed earlier, this is an imperfect
measurement of the percentage of female professionals. Kazandziska, Risteska, and
Schmidt (2012) apparently use a different version of the ILO data and state that female
Macedonians account for 51.5 percent of professionals, while they account for 51.8
percent of technicians and associate professionals (p. 20). These percentages are clearly
very similar.
Of “legislators, senior officials and managers,” women accounted for 27 percent
of the total in 2009 (Kazandziska, Risteska, & Schmidt, 2012, p. 20). Unfortunately, the
percentage of female managers, which may offer a better measure of women in

92
professional positions, is unavailable. Yet, Kazandziska, Risteska, and Schmidt (2012)
conclude: “Managerial and senior positions in work places are in most cases occupied by
men, while women are asked to perform lower-paid jobs” (p. 7). Interestingly, in another
study, “One female executive that was interviewed (the Executive Director of MASIT, a
Chamber of Commerce for ICT enterprises) estimated that only 2-3% of managerial
positions are held by women in Macedonia” (Cozzarelli, 2010, p. 25). While one
executive’s estimation of female professionals is open to dispute, it is certainly
interesting how much this figure differs from the official percentages. Of course, this
could be due to different operational definitions. Overall, as a result of these varying
percentages, it is difficult to assess the relationship between the percentage of female
professionals and the level of women’s political representation.
Religiosity
When the communists came to power, they took possession of “lands owned by
the Catholic and Orthodox Churches” (Ramet, 1998, p. 162). Indeed, churches were also
not allowed to engage in “political and nationalist activities” (Ramet, 1998, p. 175). Post-
communism, Macedonia currently has the 7th
highest level of religiosity in Eastern
Europe at 46.7 percent (EVS, 2008). Thus, based on my hypothesis, this high level of
religiosity should have a negative impact on women’s political representation. However,
the Eastern Europe regression model found an unexpected positive relationship between
the level of religiosity in a country and the level of women’s political representation in
that country. In terms of the importance of religion to respondents, Macedonia ranks the
3rd
highest in Eastern Europe with 80.3 percent of respondents reporting that religion was
important to them (EVS, 2008). Yet, the country is 8th
in church attendance with only

93
13.1 percent of respondents saying they attended religious services at least once a week
(EVS, 2008). Thus, there seems to be a tremendous difference between professing the
faith and actually practicing the faith.
The 2002 census indicated that 64.7 percent of the population are Macedonian
Orthodox, while 33.3 percent are Muslim (CIA, 2012). Yet, in the EVS (2008), adherents
belonging to Orthodox Christian Church accounted for 80 percent of the valid responses,
while 19.1 percent were Muslim. Thus, it is clear that those practicing Orthodoxy are
overrepresented in the sample. However, if Read (2003) is correct in her assessment of
Christians and Muslims in the U.S., then the different categories of religion should not be
as important as the levels of religiosity in a country.
It appears that the religious authorities have relationships with the government,
and continue to influence attitudes in Macedonia, as Andrea Spehar (2012) notes:
The patriarchal system of values is becoming even more powerful due to the
conservative Government being very strongly connected both with the Orthodox
Church and with the Islamic community, which has an increasing impact on
everyday life…Women in Macedonia face issues that are deeply rooted in the
traditional, patriarchal values and gender roles in the family and in the society. (p.
372)
In addition, scholars indicate that “the Macedonian Orthodox Church and Muslim
religious officials are seen as promoters of traditional gender roles” (Cozzarelli, 2010, p.
13). Interestingly, Cozzarelli (2010) reports that “many people believe that beliefs about
gender roles have become more conservative in recent years and some see the rise of a

94
‘new fundamentalism’ in the country” (p. 13). On the surface, this is obviously not the
preferable climate for women seeking elected office.
Impact on Substantive Representation
The female representatives’ influence on substantive representation has evolved
over time. For instance, a 2000 report stated that “some women leaders who have reached
positions of authority in government or the political parties have distanced themselves
from women’s issues” (Greenberg & McDonald, 2000, p. 8). However, the achievements
of the Women Parliamentarians’ Club, which was founded in 2003, demonstrates that the
substantive representation of women in Macedonia has improved significantly (Spehar,
2012, p. 370). Specifically, all female representatives are also members of the Women
Parliamentarians’ Club, which has worked on issues such as family violence, free
preventive gynecological exams, and the introduction of the placement mandate to the
legal gender quota (Assembly of the Republic of Macedonia, 2009). This indicates that
women are, indeed, working to represent their female constituents. However, it is clear
that female MPs need to take further legislative action to reduce the negative stereotypes
of women and to foster a more equal society.
Conclusion
It appears that the favorable electoral system and the legal gender quota (with
placement mandate) have mitigated the effects of negative attitudinal factors related to
gender inequality and religiosity. Without the two beneficial structural factors, women
clearly would not have made the same amount of progress in the parliament. Even
women in the country admit that in the absence of legal placement mandates, men would
continue to exclude women from winnable seats (Cozzarelli, 2010, p. 19). Yet, with its

95
application for EU membership, Macedonia seemingly wishes to prove itself to the rest of
the world. Thus, it is willing to pacify its critics, including women’s organizations, by
taking action to increase women’s representation. There is also some evidence of the
substantive representation of women taking place in the parliament. Yet, one wonders
whether the benefits of the legal gender quota will continue to keep conservative attitudes
towards women in government at bay, or whether there will be a decline in women
running for office in the future if religious fundamentalism rises. This may be the true test
for the substantive representation of women in Macedonia.

96
Chapter 10: Hungary
A previously communist country, Hungary held its first free elections in 1990
(Kürti, 1998, p. 86). The current Hungarian political environment can best be described
as adversarial (Palonen, 2009). Today, “Hungarian politics is dominated by inter-parties
and personal conflicts” (Ilonszki, 2006, p. 56). Following the 1994 elections, “the ‘liberal
pole’ disappeared: the ‘right-wing’ liberal Fidesz joined the conservative national camp
and the left-liberal SZDSZ became a coalition partner of the victorious Socialist party”
(Palonen, 2009, p. 323). Thus, this “party consolidation” has resulted in a polarizing
environment (Ilonszki, 2008, p. 206; Palonen, 2009). This type of environment is
obviously not conducive to the growth of women in parliament, or even to the discussion
of the need to expand women’s representation (Ilonszki, 2008, p. 211). Thus, it is not
surprising that Hungary has one of the worst female representation rates in Europe. The
overall negative climate towards gender equality and heightened conservatism, combined
with an adverse electoral system and absence of a legal gender quota, are the primary
factors that are holding women back. The situation has certainly damaged the ability of
female MPs to partake in substantive representation in the Hungarian Parliament (the
Országgyülés).

97
Women’s Representation since Suffrage
Women’s journey to suffrage in Hungary is rather complicated, as Katalin Fábián
(2007) explains:
First, they were granted suffrage in the social-democratic revolution of 1918, then
saw it re-affirmed during the communist take-over of 1919, but their universal
voting rights were short-lived. The successive authoritarian political regime under
the leadership of Admiral Horthy persistently moved to eradicate signs of the
immediate past and, consequently, passed laws that severely restricted women’s
right to stand as political candidates, vote, and have access to university
education. (p. 112)
Thus, women were not actually given full voting rights until 1945 (Fábián, 2007, p. 112).
Yet, as discussed earlier, suffrage dates do not appear to have had a tremendous impact
on the level of women’s political representation in Eastern Europe.
Table 7: History of Women’s Political Representation in Hungary’s Országgyülés
Election
Year
Percent of
Women Elected
to Országgyülés
1971 23.9
1975 28.7
1980 30.1
1985 21.0
1990 7.3
1994 11.1
1998 8.3
2002 9.8
2006 10.4
2010 9.1
Data source: IPU PARLINE (2012)

98
As Table 7 notes, female political representation was higher under communism.
Available data indicates that women accounted for an average of 25.9 percent of the
members of parliament in the period between 1971 and 1985; the average for the post-
communist period is 9.3 percent (IPU PARLINE, 2012). Yet, it should be noted that in
the communist era, “no woman was ever a member of a body with real political power”
(Bollobás, 1993, p. 202). Eva Fodor (1998) explains: “An unspecified (though certainly
low) quota from women was in place. Though a few women were in fact installed in the
central leadership, they never became part of the old boys’ network” (p. 147). Thus, it is
obvious that women’s talents were not utilized to their full extent.
Electoral System
Hungary utilizes a mixed electoral system. I expected a mixed system to be less
favorable to the election of women than PR, but not as unfavorable as SMP. In short, I
did not anticipate a country with a mixed system to have the second worst women’s
representation rate in Europe. Yet, as explained below, part of the problem is the manner
in which the mixed system is set up in Hungary.
The 386 positions in the Hungarian parliament are elected via a mixture of
majoritarian and proportional representation systems (IPU PARLINE, 2012). First, 176
seats are elected via “a two-round majority vote system in single member districts
[SMD]” (Montgomery & Ilonszki, 2003, p. 109). Of the remaining positions, 146 are
elected via twenty county lists, while 64 are elected from a national list of candidates
(IPU PARLINE, 2012). Both of the lists at the county and national levels are closed list-
PR with a five percent electoral threshold (Montgomery & Ilonszki, 2003, p. 109;
Palonen, 2009, p. 321). The national list seats are “awarded to parties on the basis of a

99
proportional allocation of remainder votes” (Montgomery & Ilonszki, 2003, p. 109).
Thus, under this system, if a party is very successful at the regional level, it gains less
seats from the national list (Montgomery & Ilonszki, 2003, p. 112).
Interestingly, Hungary is one of the few countries in Eastern Europe in which
female survey respondents have specifically blamed the electoral system for “hindering
the political representation of women” (Clavero & Galligan, 2005, p. 989). Certain
aspects of the mixed system in Hungary make it unfavorable to women. First of all, in
contrast to the mixed system used in Macedonia from 1998 to 2002 (Ristova, 2003, p.
200), the Hungarian system permits candidates to run on multiple ballots (i.e. SMD,
county list, and national list) (Ilonszki, 2008, p. 212; Montgomery & Ilonszki, 2003, p.
111). This allowance “makes it very difficult for party gatekeepers to predict which slots
on the lists represent winnable positions” (Montgomery & Ilonszki, 2003, p. 111). This is
because if a candidate wins in the SMD, then he/she will obviously not utilize their
position on the list ballots (Montgomery & Ilonszki, 2003, p. 111). Yet, gatekeepers are
unable to foresee “how many of the names at the top will be stricken, so they cannot
meaningfully engage in (or be held accountable for) ticket balancing” (Montgomery &
Ilonszki, 2003, p. 111). Notably, this also demonstrates the attitudes of male gatekeepers
towards women: “Under conditions of uncertainty, parties prefer to perpetuate the (male)
national leadership” (Chiva, 2005, p. 979). Thus, they clearly do not view women as
strong candidates. In addition, “many of the smaller magnitude county constituencies
have become de facto SMDs,” which hurts the ability of women to get elected
(Montgomery & Ilonszki, 2003, p. 112).

100
Of the women elected in the most recent 2010 elections, 9 were elected via the
SMDs (26.5 percent), 14 from the county lists (41.2 percent), and 11 from the national
list (32.4 percent) (House of the Nation, 2012).23
Thus, despite its lack of statistical
significance in the Eastern Europe regression model, it appears that proportional
representation is more favorable to the election of women. Notably, the women who won
in the single member districts were all from Fidesz-Hungarian Civic Union, which has a
supermajority in the parliament (House of the Nation, 2012). This Fidesz result could
indicate that a candidate’s gender is less important that his/her party affiliation. However,
despite having a supermajority, only 19 of Fidesz’s 226 MPs are women (House of the
Nation, 2012). Thus, Fidesz clearly are not putting forth many female candidates.
Gender Quota
There is no legal gender quota in Hungary (IDEA, 2011). Therefore, due to its
low women’s political representation, this case supports my hypothesis regarding the
positive influence of legal gender quotas. Gender quotas are very controversial in
Hungary, even amongst female representatives (Fábián, 2009, p. 151). The vice president
of the conservative Independent Smallholders’ Party (FKgP)’s women’s organization
mentions a common view of quotas in Eastern Europe: “Quotas raise bad memories from
past ties [with communism]. Only individual qualities can challenge prevailing practice.
Only highly qualified and able women, who might even be more professional [than] their
male colleagues, can establish the credibility of women politicians” (qtd. in Montgomery
& Ilonszki, 2003, p. 120).
23
This is based on the 34 women that are currently in parliament; 35 were elected, but one evidently has
stepped down since the election. The 9.1 percent is based on the percentage elected and in parliament as of
the November 2011 IPU data update.

101
Despite the negative views of quotas, the subject has been discussed in
parliament. In 2007, two representatives of the Alliance of Free Democrats (SzDSz)
introduced two bills related to gender quotas, which would have called for a legal gender
quota of 30 percent (Fábián, 2009, p. 151). Yet, many parliamentarians were not
enthusiastic about the bill: “Even the Alliance of Free Democrats was not united behind
its two politicians’ motion. In addition, some leading women representatives in the
Hungarian Parliament and the European Parliament…rather angrily rejected the
proposal” (Fábián, 2009, p. 151). Thus, the bill failed to pass with just 38 percent of
representatives in favor (Fábián, 2009, p. 187). Despite having its own internal party
quota, the Hungarian Socialist Party (MSzP) did not endorse the quota bill (Fábián, 2009,
p. 187). Fábián (2009) offers one possible reason for the rejection of the quota bill:
“Although they never came out and admitted it, most (male) politicians were
understandably concerned that they would lose their seats in Parliament if they were to
support such a measure” (p. 188). Yet, some politicians explained their lack of support by
stating that there were more pressing concerns for the government to address (Fábián,
2009, p. 188).
A December 2011 proposal, which called for a third of list candidates to be
women, was similarly dismissed (Ertsey, 2011). Parliamentarian Katalin Ertsey (2011) of
Politics Can be Different (LMP) explains: “LMP’s proposed quota for female
representation in parliament began as a proposal sponsored by multiple parties, but at the
last moment, Fidesz and MSZP backed out.” It is unclear why the two parties abandoned
their support in such an abrupt manner.
102
Only two major Hungarian parties have quotas. First, MSzP has a 20 percent
quota (Fábián, 2009, p. 187). The quota was introduced in 1998 after lobbying from the
party’s women’s caucus (Fábián, 2009, p. 187). It should be noted that there was “strong
objection to affirmative action among the membership and the local party organs”
(Montgomery & Ilonszki, 2003, p. 122). The quota is also not only intended to benefit
women, but also applies to those under the age of 35 (Montgomery & Ilonszki, 2003, p.
122). However, in 2010, only 4.2 percent of the socialists elected were women (House of
the Nation, 2012). This indicates that either women did not run for office under the
socialist label, or else MSzP placed them in unwinnable positions. In 2010, MSzP gained
the majority of its seats in parliament via the county and national lists (IPU, 2012). While
29 MSzP representatives were elected from the national list, only one female was elected
from this list (House of the Nation, 2012; IPU PARLINE, 2012). Similarly, 27 men and
only one female were elected from the county lists (House of the Nation, 2012; IPU
PARLINE, 2012). Thus, it appears that female candidates had less desirable places on
the lists. Yvonne Galligan, Sara Clavero, and Marina Calloni (2007) reached the same
conclusion using data from the 2002 elections (p. 105).
Unlike MSzP, LMP has a placement mandate, which specifies that no more than
two repeated candidates of the same sex can be placed in succession on the list (IDEA,
2011). Five women were elected to the 2010 parliament from LMP, with four coming
from the national list and one from the county regional list (House of the Nation, 2012).
Six men from LMP were elected from the national list, while four were elected from
county list (House of the Nation, 2012). The gender make-up of LMP’s elected officials
indicates that the small party self-complied with its own quota mandate. It is notable that,

103
in 2000, Steven Saxonberg wrote: “Partially as a result of the behavior of [the] reformed
former communists, no parties have emerged to their left in the Hungarian or Polish
parliament that could pressure the official social-democratic parties into increasing
female representation” (Saxonberg, 2000, p. 152). In the current conservative climate,
left-leaning LMP is obviously not seen as competition because the dominant party
(Fidesz) does not feel threatened by its pro-equality stance. Thus, unlike in Sweden,
competition is not present between parties in a manner that would force them to adopt
measures, such as quotas, to increase women’s representation.
The lack of support for gender quotas arguably demonstrates the absence of a
political will to change the status quo. Indeed, there continues to be a nomination bias
amongst parties in many Eastern European countries, with female candidates being
concentrated at the bottom of lists (Clavero & Galligan, 2005, p. 989). Yet, unlike in
Sweden and Macedonia, there is a lack of pressure on political gatekeepers from
women’s organizations. For instance, throughout most of the 1990s, many women’s
groups were opposed to quotas (Fábián, 2009, p. 150). In recent years, the tide has begun
to turn, as more groups have offered their support for legal gender quotas (Fábián, 2009,
p. 189-90). However, given the fact that two political parties backed out of supporting the
quota bill in 2011, it appears that the women’s groups do not exert as much pressure as
those in Macedonia. As Montgomery and Ilonszki (2003) declare: “Without a popularly
supported, pro-equality women’s movement and organized women’s caucuses within the
parties, gatekeepers face little pressure to become more pro-active about female
recruitment” (p. 126). Hence, the status quo continues.

104
Gender Equality
Hungary ranks 37th
worldwide, and 4th
in Eastern Europe on the GDI (UNDP,
2009). Yet, as in Macedonia, there is a pay gap between the sexes (Fodor, 2005).
However, it is a much lower gap than in other European countries. For instance, in 2007,
the estimated earned income for women in Hungary was $16,143, whereas the men
earned $21,625 (UNDP, 2009). In other words, women received 74.6 percent of men’s
income. In fact, based on the data, Hungary has the lowest pay differential in Eastern
Europe and one of the lowest in the EU (i.e. women earn the highest percentage of men’s
wages) (Eurostat, 2008, p. 94; UNDP, 2009). Based on this information, one would
expect there to be higher women’s representation in Hungary, but that is not the case.
There are more women (52.5 percent) than men (47.5 percent) enrolled in higher
education (Hungarian Central Statistical Office, 2011, p. 16). Interestingly, Beáta Nagy
(2007) offers new insights by looking at the education levels of the employed population.
She finds that in 2005, 24.5 percent of employed women had attended college or
university, in comparison to 18.3 percent of employed men (Nagy, 2007). However, it is
important to note that a higher percentage of employed men than women (8.7 percent
versus 8.4 percent) graduated from university, which is more prestigious than college
(Nagy, 2007). Thus, this indicates a slight disadvantage to women that is not taken into
consideration in the education component of the GDI.
It is notable that in the aftermath of communism, there was a return to traditional
attitudes, which is not captured in the GDI. The new conservative political parties
encouraged women to return to their domestic roles (Fodor, 2005, p. 4). Indeed, the 2004
World Values Survey found that 73 percent of Hungarian women agreed with the

105
statement that “being a housewife is as fulfilling as working for wages” (qtd. in Fodor,
2005, p. 4). It is not surprising that Fodor (2005) concludes: “In this context, political
mobilization to encourage women to work, or even just to fight against gender inequality
in the labour market, proved rather unpopular and lacking in serious legitimacy” (p. 4).
This perhaps explains the absence of a strong unified women’s movement in Hungary
(Sloat, 2004, p. 9). Furthermore, Hungarians are not supportive of the notion of
feminism: “Claiming distinct rights for women is generally seen as an expression of
hostility toward the family in Hungary…Feminists are frequently blamed in the mass
media for undermining the role of the family” (Szalai, 1998, p. 197).
Women continue to receive “generous” maternity leave benefits (Fodor, 2005, p.
9). Yet, as in Macedonia, men are “not encouraged” to utilize paternity leave, as a result
of the lack of “cultural acceptance” for the provision (Fodor, 2005, p. 18-20). This means
that the “involvement of men in caring for children in practice remains symbolic”
(Kakucs & Pető, 2008, p. 185). Thus, unlike in egalitarian Sweden, Hungarian women
“spend roughly two or three times more hours on household work than men” (Fodor,
2005, p. 16). In light of their responsibilities at home, it is perhaps not surprising that in a
survey of women in Eastern Europe, participants mentioned “a lack of time due to family
obligations” as one barrier to women running for office (Clavero & Galligan, 2005, p.
984).
Some have argued that right-leaning parties are less supportive of women’s
progression in society (Montgomery and Ilonszki, 2003, p. 113). Indeed, Olga Avdeyeva
(2009) notes: “In Hungary the framing of gender equality issues changed with shifts of
parties in power” (p. 169). For instance, left-leaning parties were willing to give more

106
power to official governmental offices associated with women and equality than right-
wing parties (Avdeyeva, 2009, p. 168-9). Yet, it should be noted that even left-leaning
parties have discriminated against women. For instance, in the 1998 election, the Green
Party placed a man at the top of their list, which was the only position “that could
remotely be considered competitive if the party had an unusually good showing”
(Montgomery & Ilonszki, 2003, p. 116). Twenty three of the rest of the twenty four Green
candidates were women (Montgomery & Ilonszki, 2003, p. 116). With the exception of
LMP, which has proven to be committed to gender equality, it seems that none of the
remaining parties offer the kind of support for gender equality that is found in Sweden.
This further supports the hypothesized positive relationship between the level of gender
equality in a country and the level of women’s political representation in that country.
Female Professionals
Hungarian women account for 60 percent of professionals in the country (UNDP,
2009). Thus, based on the hypothesized positive relationship between the percentage of
female professionals and the level of women’s political representation, one would
logically expect Hungary to have a higher percentage of women in parliament. Yet, of
course, this is not the case. First of all, there is reason to question these figures:
Based on the category of ‘legislators, senior officials and managers’, and
compared with the total number of non-manual workers, we see that 31.9% of
men and 10.9% of women work in some kind of managerial position. Thus, men’s
chances of getting into management jobs are three times higher than those of
women. (Nagy, 2007)

107
Based on these statistics, one can clearly see that men are actually overrepresented in
managerial positions. Using slightly more dated statistics, Beáta Nagy (2007) is able to
further support this notion. For example, in 2002, 9.2 percent of employed women were
classified as a “high-level manager, senior professional, [or] official” (Nagy, 2007). In
comparison, 11.6 percent of all employed men were placed in this category (Nagy, 2007).
However, a higher percentage of employed women (26.8 percent) than men (11.5
percent) are found in the “lower-level manager, lower-level professional, [or] official”
category (Nagy, 2007). This indicates that the society offers more professional mobility
to men than women. The ILO statistics used by the UNDP (2009) are unable to capture
these important differences.
Religiosity
As in many communist countries, in Hungary, a “witch-hunt was organized to
arrest and delegitimize religious leaders of the various churches” (Kürti, 1998, p. 74).
However, in the 1970s, there was “a dramatic easing in Church-state relations” (Kürti,
1998, p. 83). At the end of the following decade, churches aided in the revolution that
brought an end to communism (Kürti, 1998, p. 85). Yet, today, Hungary has a religiosity
level of 24.5 percent, which is the 4th lowest in Eastern Europe (EVS, 2008). In the EVS
(2008) survey, 40.5 percent of respondents stated that religion was important to them,
while only 8.4 percent reported attending religious services at least once a week. Based
on the religiosity figures, one could conclude that it is not a very religious country, which
my hypothesis indicates should benefit women. However, this would be a premature
conclusion.

108
In 2011, the Fidesz-led government passed a new, very conservative Hungarian
Constitution (O’Donoghue, 2011). The Hungarian Civil Liberties Union argued that it
“reflects a Christian conservative set of values” (qtd. in O’Donoghue, 2011). Indeed, the
constitution appears to fall in line with many Catholic positions, such as prohibiting
same-sex marriage (O’Donoghue, 2011). Similarly, Article II of the new Fundamental
Law of Hungary (Magyarország Alaptörvénye) (2011) states: “Human dignity is
inviolable. Everyone has the right to life and human dignity; the life of a fetus will be
protected from conception.” Despite this, the government claims that “present liberal
regulations on abortion won’t change” (O’Donoghue, 2011). Yet, recent actions
contradict these claims. For example, in June 2011, Hungary was accused of misusing
EU funds for its anti-abortion campaign (Prague Post, 2011). As in Ireland, this would
indicate that the environment is not favorable to women’s rights.
The new constitution has also directly affected religion, with a recent editorial
claiming that the government has sought to:
Reimpose state regulation of religion by reducing the number of acknowledged
faiths and sects from 300 to 14 while denying any official place in society for
Muslim, Buddhist or Hindu congregations unless they have operated in Hungary
for at least 20 years. (The Times, 2012)
Press reports indicate the official government reasoning behind the legislation: “Party
Chairman and Deputy Prime Minister Zsolt Semjen said he wanted to ‘make order’ since
it was ‘abnormal’ to have so many churches” (Bandow, 2011). Yet, critics have argued
that it attacks the notion of freedom of religion (Bandow, 2011), which is also mentioned
in Article VII of the constitution. Thus, Hungary’s relationship with religion is complex.

109
However, it is clear that the recent constitutional changes do not benefit women. In fact,
they appear to signal the government’s increasingly conservative views, which will likely
further hamper women’s progression in society.
Impact on Substantive Representation
Unsurprisingly, evidence indicates that the small percentage of female
parliamentarians are failing to have a positive impact on the substantive representation of
women:
The few women who successfully obtain public office almost never represent
women’s interests for fear of being marginalized by their party or due to a lack of
female solidarity. This persistent condition has to do with deeply engrained
conservative cultural norms that surfaced during the transition and were soon
translated into political principles. (Sloat, 2004, p. 11)
Indeed, in many Eastern European countries, there is “fear among women MPs that if
they focus on women’s issues, they will be associated with feminism and the women’s
movement” (Clavero & Galligan, 2005, p. 997). As previously discussed, Hungarians are
hostile to the notion of feminism. Thus, it would be understandable if women feared
retaliation from their constituents or parties for addressing such issues. In addition, as
discussed in the introduction, the polarizing climate in the parliament is not favorable to
the discussion of issues that are not critically important to the parties, as the recent
response to legal gender quotas demonstrated.
Conclusion
Based on statistics, women have certainly lost representation in the Hungarian
Parliament following the end of communism. However, it could be argued that they never

110
truly had real power over legislation in the first place. As in Ireland, a combination of
structural and attitudinal factors are hurting women’s political representation in Hungary
today. There is support for the hypotheses relating to the type of electoral system and the
presence of a legal gender quota. Indeed, the structure of the mixed system and the
absence of a legal gender quota certainly contribute to the unfavorable conditions women
face. A legal gender quota could be applied to the PR lists. Furthermore, the lists are also
closed rather than open, which tends to benefit women as long as party gatekeepers place
them in winnable positions. However, policymakers are apparently lacking the will, and
the pressure, to make this happen. Indeed, there is support for the gender equality, female
professionals, and religiosity hypotheses since traditional attitudes continue to dictate
women’s place in Hungarian society. Overall, this is not conducive to the substantive
representation of women in Hungary.24
24
My analysis in this chapter was based on the impact of the most recent electoral system on women’s
political representation. The Hungarian electoral system was amended in December 2011 (Renwick, 2011).
While it is still a mixed system, there will be 199 seats in the parliament as opposed to 386 in future
elections (Renwick, 2011). In addition, the county lists are being eliminated in favor of a single round of
elections involving 106 SMD seats and 93 national closed list-PR seats (Renwick, 2011). Voters will now
vote for the national list, which will also be partially compensatory (Renwick, 2011). Given this recent
change and the fact that the new electoral system has not yet been practiced, there is no way to test the
impact of the electoral changes on female candidates. However, one can logically speculate that the
elimination of almost half of the SMD seats will lead to an influx of male candidates on the national list,
leaving little room for the election of female candidates.

111
Chapter 11: Conclusion
While most scholars have conducted quantitative research on women’s political
representation at the global level, my research has provided insights at the continental and
regional levels. My study indicates that a combination of structural and attitudinal factors
influence women’s political representation in Europe. Structurally, the regression results
for the Europe-wide and Western Europe models indicate that the type of electoral
system affects the level of women’s representation. There is a statistically significant
positive relationship between the favorability of a country’s electoral system to the
election of women and the level of women’s political representation in that country.
Proportional representation electoral systems are found to be particularly beneficial to
female candidates.
Among the attitudinal variables, the quantitative analyses for Europe-wide and
Western Europe find a statistically significant negative relationship between the level of
religiosity in a country and the level of women’s political representation in that country.
This indicates that religiosity can be utilized to measure conservative attitudes towards
women. Unlike some earlier studies that measured traditional attitudes using the
country’s dominant religion, religiosity continues to be significant when the type of
electoral system, the presence of a legal gender quota, and the number of years since
women’s suffrage are included in the models. Therefore, my results underscore the

112
importance of a more sophisticated method of capturing the impact of religion on a
country’s citizens. The measure is especially beneficial since it takes into consideration
the evolving climate towards religion in Europe as a result of an influx in immigration. In
this manner, measuring traditional attitudes towards women via the country’s dominant
religion may be an outdated measure that is no longer useful in our globalized society.
The Western Europe case studies support the regression results. The Swedish and
Irish cases demonstrate that the type of electoral system and the religious climate can
both impact women’s political representation. Sweden is an egalitarian and largely
secular country in which women are viewed as equal to men. This climate has led to the
establishment of powerful women’s groups which have had the ability to persuade
policymakers to take action to increase the percentage of female MPs via the adoption of
gender quotas. Sweden is the ideal scenario, as the composition of its parliament is
approaching true gender parity (45 percent). However, religious Ireland is arguably the
worst case scenario in Western Europe with female representatives accounting for just
15.1 percent of the Dáil. This anemic percentage can largely be explained by the
personalized voting system, lack of gender quotas, and widespread adherence to
traditional conservative gender values. Overall, these cases demonstrate that structural
and attitudinal factors can be harmonized for maximum women’s representation, as in
Sweden, or they can be combined in ways that harm women’s electoral chances, as in
Ireland. Most importantly, the absence of women in the legislature hurts the substantive
representation of women, as female MPs often feel uncomfortable speaking about
women’s concerns in the parliament when they are surrounded by men.

113
While the Western Europe model is able to explain 83.8 percent of the variation
in women’s political representation, the Eastern Europe fails to find any statistically
significant relationships. Furthermore, there is a sharp increase in the R2 after the Eastern
European countries are eliminated from the Europe-wide model (48.5 percent to 83.8
percent). This indicates that, despite the loss of cases due to missing data, there are
distinct regional differences between Western and Eastern Europe. Indeed, Eastern
Europe has a much lower average percentage of female representation than Western
Europe. The influence of communism has undoubtedly shaped the climate towards
female politicians in this region. Despite high percentages of women in parliament during
the communist era, in practice these women lacked the power to effectively influence
legislation. Furthermore, scholars have found that the communist governments’ focus on
gender equality was not genuine, but rather “mostly rhetorical and self-interested”
(Fábián, 2009, p. 73). Citizens in many Eastern European countries continue to associate
the concept of gender equality with communism, which makes it difficult for
policymakers to recognize the importance of women’s political representation (Wolchik,
1998, p. 293).
The case studies for Eastern Europe are able to capture aspects that the
quantitative analysis missed. For instance, regional regression analysis is unable to
capture the individual country context. The Macedonian case demonstrates that internal
pressures (i.e. women’s groups) and external factors (i.e. the desire to join the EU) can
come together to favor women’s representation, even when attitudes towards equality are
lacking. Indeed, in the absence of a closed list-PR electoral system and legal gender quota
with placement mandates, women’s political representation in Macedonia would almost

114
certainly be lower due to the prevalence of gender inequality and religiosity. Thus, in this
case, positive structural factors have mitigated the effects of negative attitudinal factors.
Female representatives in the Sobranie have also participated in the Women
Parliamentarians’ Club since its creation in 2003, thereby increasing the substantive
representation of their female constituents.
As in Ireland, the Hungarian case study demonstrates that both structural and
attitudinal factors can collectively harm women’s electoral chances. Specifically, the
structure of the mixed electoral system is particularly harmful to female candidates.
However, due to the prevalence of traditional attitudes toward women and the overall
hostility toward feminist ideals, previous attempts to introduce a legal gender quota have
failed. Thus, it is not surprising that in this conservative climate the few women in
parliament would fail to “represent women’s interests for fear of being marginalized by
their party” (Sloat, 2004, p. 11).
In light of this, there is a need for further research on the impact that political
parties have on women’s political representation. Political gatekeepers are affected by the
prevalence of traditional gender attitudes and levels of religiosity in a society. The case
studies show that parties frequently place their female candidates in unwinnable positions
on electoral lists. This nomination bias makes it harder for women to get elected.
Furthermore, in Hungary and Ireland, very few political parties are willing to support
measures to increase women’s representation. In addition, one notable finding from the
case studies is that female MPs in certain countries have refused to support gender
quotas. It would be interesting to investigate whether their refusal is a personal decision
or the result of pressures from their party. After all, mechanisms to increase women’s

115
political representation would clearly have more chance of being enacted if current
female policymakers offered their support.
Further research is also needed on the topic of gender quotas. Gender quotas are
easy to apply to proportional representation lists and are most effective when they have a
placement mandate and are subjected to some type of oversight mechanism. While I did
not find a statistically significant relationship between the presence of a legal gender
quota and the level of women’s political representation, the Macedonian case shows the
need to reevaluate this issue. More research is also needed on party gender quotas since
the Swedish case demonstrates that self-compliance is possible under certain
circumstances.
Future research would be aided by the availability of improved data. The case
studies demonstrate the flawed nature of the Gender-related Development Index (GDI),
which is intended to measure gender equality in a country. Education, estimated income,
and life expectancy rates do not necessarily indicate an egalitarian society. My results
clearly demonstrate the need to include religiosity in any attempt to measure gender
equality.
The availability of reliable data on female professionals is another area in which
improvement is needed. The measure collected by the ILO and used by the UNDP (2009)
is extremely broad, and there is uncertainty over whether or not some occupations that
one would not necessarily categorize as “professional” are included in the measure.
Without reliable data, it is difficult to accurately determine the relationship between the
percentage of female professionals in a country and the level of women’s representation
in that country. Data from individual countries, rather than the ILO, clearly have different

116
operational definitions of “professional.” Therefore, at the present time, it is not possible
to accurately compare the rate of female professionals across countries.
Overall, my study shows that women benefit when they live in countries with PR
systems and low levels of gender inequality. On the one hand, women residing in
countries that utilize an SMP system are structurally disadvantaged. On the other hand,
women who live in highly religious societies are disadvantaged from an attitudinal
standpoint. However, regardless of their particular predicament, they can still take action
to increase their political representation. Indeed, women can work together to form a
powerful constituency, so that political parties will be forced to court them in exchange
for their votes. The Swedish case study demonstrates that women need to demand that
policymakers promote women’s political representation, or face the consequences on
election day. The early suffragettes showed that women can achieve their demands if they
are willing to band together. Similarly, women have more resources at their disposal
today than their predecessors. For instance, Facebook and Twitter can be used to attract
widespread support for the campaign to increase women’s political representation.
Women also have more leverage today than they did one hundred years ago, since they
heavily contribute to the world economy via their high levels of paid employment.
Women need to convince policymakers that gender parity produces better governance,
which benefits all citizens. Women are not asking for special treatment; they are asking
for their government to abide by the principles of representative democracy.

117
List of References
5050 Group. (2012). About the 5050 Group. Retrieved February 14, 2012, from
http://5050-group.com/blog/?page_id=2
Albanese, P. (2006). Mothers of the Nation: Women, Families, and Nationalism in
Twentieth-Century Europe. Toronto: University of Toronto Press.
Antić, M.G. (2009). What Difference Do Female Deputies Make in the Slovene
Parliament? In M. Rueschemeyer & S.L. Wolchik (Eds.), Women in Power in
Post-Communist Parliaments (pp. 93-110). Washington, D.C.: Woodrow Wilson
Center Press.
Assembly of the Republic of Macedonia. (2009). Women Parliamentarians’ Club:
Noteworthy Achievements. Retrieved May 16, 2012, from
http://www.sobranie.mk/en/?ItemID=CF32301070BA9E44AB8DA3FB6408976
A
Avdeyeva, O. (2009). Enlarging the club: When do candidate states enforce gender
equality laws? Comparative European Politics, 7(1), 158-177.
Back to Autocracy: A disgraceful new constitution threatens Hungary’s democracy and
basic liberties [Editorial]. (2012, January 2). The Times. Retrieved April 2, 2012,
from LexisNexis database.
Bailyn, L. (2006). Breaking the Mold: Redesigning Work for Productive and Satisfying
Lives. Ithaca, NY: Cornell University Press.
Banaszak, L.A. (2006). The Gendering State and Citizens’ Attitudes toward Women’s
Roles: State Policy, Employment, and Religion in Germany. Politics & Gender,
2(1), 29-55.
Bandow, D. (2011, December 7). Hungary Threatens Religious Liberty [Editorial].
Huffington Post. Retrieved April 2, 2012, from
http://www.huffingtonpost.com/doug-bandow/hungary-threatens-
religio_b_1135263.html
Bennhold, K. (2010, June 9). In Sweden, Men Can Have It All. New York Times.
Retrieved May 9, 2012, from

118
http://www.nytimes.com/2010/06/10/world/europe/10iht-
sweden.html?pagewanted=all
Bergqvist, C. (2011). The Nordic Countries. In G. Bauer & M. Tremblay (Eds.), Women
in Executive Power: A Global Overview (pp. 157-170). Hoboken, NJ: Routledge.
Bernhardt, E., Noack, T., & Lyngstad, T.H. (2008). Shared housework in Norway and
Sweden: advancing the gender revolution. Journal of European Social Policy,
18(3), 275-288.
Blais, A., & Massicotte, L. (1996). Electoral Systems. In L. LeDuc, R.G. Niemi, & P.
Norris (Eds.), Comparing Democracies: Elections and Voting in Global
Perspective (pp. 49-81). Thousand Oaks, CA: Sage Publications.
Bollobás, E. (1993). “Totalitarian Lib”: The Legacy of Communism for Hungarian
Women. In N. Funk & M. Mueller (Eds.), Gender Politics and Post-Communism:
Reflections from Eastern Europe and the Former Soviet Union (pp. 201-206).
New York: Routledge.
Bratton, K.A., & Ray, L.P. (2002). Descriptive Representation, Policy Outcomes, and
Municipal Day-Care Coverage in Norway. American Journal of Political Science,
46(2), 428-437.
Brennan, M. (2011, January 31). Women to make up just 15pc of election candidates.
Irish Independent. Retrieved February 14, 2012, from
http://www.independent.ie/national-news/elections/women-to-make-up-just-15pc-
of-election-candidates-2517561.html
Bunreacht na hÉireann (Constitution of Ireland). (1937). Dublin: Government Publication
Office.
Campbell, R., & Childs, S. (2012, May 17). How David Cameron’s cuts strategy is losing
him the support of Tory women. The Guardian. Retrieved May 18, 2012, from
http://www.guardian.co.uk/commentisfree/2012/may/17/david-cameron-cuts-
strategy-tory-women?CMP=twt_gu
Catalano, A. (2009). Women Acting for Women? An Analysis of Gender and Debate
Participation in the British House of Commons 2005-2007. Politics & Gender,
5(1), 45-68.
Central Intelligence Agency (CIA). (2012). The World Factbook. Retrieved January 14,
2012, from https://www.cia.gov/library/publications/the-world-
factbook/index.html
Charter, D. (2009, November 18). Don’t call me the token female: EU leadership hopeful
warns grey men. The Times. Retrieved May 15, 2012, from LexisNexis database.

119
Childs, S. (2001). In their own words: New Labour women and the substantive
representation of women. British Journal of Politics and International Relations,
3(2), 173-190.
Childs, S., & Withey, J. (2006). The Substantive Representation of Women: The Case of
the Reduction of VAT on Sanitary Products. Parliamentary Affairs, 59(1), 10–23.
Chiva, C. (2005). Women in Post-Communist politics: Explaining underrepresentation in
the Hungarian and Romanian Parliaments. Europe-Asia Studies, 57(7), 969-994.
Clavero, S., & Galligan, Y. (2005). ‘A Job in Politics Is Not for Women’: Analysing
Barriers to Women’s Political Representation in CEE. Czech Sociological Review,
41(6), 979-1004.
Cowell-Meyers, K. (2001). Gender, Power, and Peace. Women & Politics, 23(3), 57-90.
Cozzarelli, C. (2010). 2010 Gender Assessment for USAID/Macedonia. United States
Agency for International Development (USAID). Retrieved January 22, 2012,
from http://www.usaid.gov/our_work/cross-
cutting_programs/wid/pubs/Macedonia_Gender_Assessment_2010.pdf
Cullen, P.P. (2008). Irish Women’s Organizations in an Enlarged Europe. In S. Roth
(Ed.), Gender Politics in the Expanding European Union: Mobilization,
Inclusion, Exclusion (pp. 83-100). New York: Berghahn Books.
Čurdová, A. (2009). Negotiating the Czech Parliament: An Interview with Anna
Čurdová, House of Deputies, Czech Parliament. In M. Rueschemeyer & S.L.
Wolchik (Eds.), Women in Power in Post-Communist Parliaments (pp. 231-234).
Washington, D.C.: Woodrow Wilson Center Press.
Dahlerup, D. (2009). About Quotas. Quota Project: Global Database of Quotas for
Women. Retrieved November 12, 2010, from
http://www.quotaproject.org/aboutquotas.cfm
Dahlerup, D., & Freidenvall, L. (2005). Quotas as a ‘Fast Track’ to Equal Representation
for Women. International Feminist Journal of Politics, 7(1), 26-48.
Daley, C., & Nolan, M. (1994). Appendix: Chronological List of Women’s Suffrage
Dates. In Suffrage and Beyond: International Feminist Perspectives (pp. 349-
352). Auckland: Auckland University Press.
Daly, S. (2012, January 21). Gender quotas welcome—but ‘token’ women candidates
won’t work. The Journal. Retrieved February 14, 2012, from
http://www.thejournal.ie/gender-quotas-welcome-but-token-women-candidates-
wont-work-333263-Jan2012/

120
Davie, G. (2006). Is Europe an Exceptional Case? The Hedgehog Review, 8(1-2), 23-34.
Day, M. (2011, September 21). Ugly female candidates 'repel voters', says former Polish
prime minister. The Telegraph. Retrieved September 22, 2011, from
http://www.telegraph.co.uk/news/worldnews/europe/poland/8778967/Ugly-
female-candidates-repel-voters-says-former-Polish-prime-minister.html
Department of Justice and Equality. (2012). Overwhelming response to Conference on
Women and Politics. Retrieved February 14, 2012, from
http://www.inis.gov.ie/en/JELR/Pages/PR12000010
Dimitrievska, D. (2004, October). Quotas: The Case of Macedonia. Paper presented at
the International Institute for Democracy and Electoral Assistance (IDEA)/CEE
Network for Gender Issues Conference, Budapest, Hungary.
Eisenstein, Z. (1993). Eastern European Male Democracies: A Problem of Unequal
Equality. In N. Funk & M. Mueller (Eds.), Gender Politics and Post-Communism:
Reflections from Eastern Europe and the Former Soviet Union (pp. 303-317).
New York: Routledge.
Ellingsæter, A.L. (1998). Dual Breadwinner Societies: Provider Models in the
Scandinavian Welfare States. Acta Sociologica, 41(1), 59-73.
Ertsey, K. (2011, December 6). Parties Backed Out Of Needed Quota. Lehet Más a
Politika (LMP). Retrieved May 30, 2012, from
http://english.lehetmas.hu/news/576/parties-backed-out-of-needed-quota/
European Values Study. (2008). European Values Study (ZA4800_v2-0-0). GESIS Data
Archive for the Social Sciences. Retrieved November 17, 2011, from
http://zacat.gesis.org/webview/
Eurostat. (2008). The life of women and men in Europe: A statistical portrait.
Luxembourg: Office for Official Publications of the European Communities.
Fábián, K. (2007). Making an Appearance: The Formation of Women’s Groups in
Hungary. Aspasia, 1, 103-127.
Fábián, K. (2009). Contemporary Women’s Movements in Hungary: Globalization,
Democracy, and Gender Equality. Washington, D.C.: Woodrow Wilson Center
Press.
Ferriter, D. (2011). The ultimate old boys’ network [Editorial]. Sunday Business Post.
Retrieved March 1, 2012, from LexisNexis database.

121
Fitzgerald, G. (2010, September 11). Women’s limited role in politics highlights
defective system. Irish Times. Retrieved March 1, 2012, from LexisNexis
database.
Fodor, E. (1998). The Political Woman? Women in Politics in Hungary. In M.
Rueschemeyer (Ed.), Women in the Politics of Postcommunist Eastern Europe
(pp. 142-167). Armonk, NY: M.E. Sharpe.
Fodor, É. (2005). Women at Work: The Status of Women in the Labour Markets of the
Czech Republic, Hungary and Poland. Occasional Paper 3. Geneva, Switzerland:
United Nations Research Institute for Social Development (UNRISD). Retrieved
January 22, 2012, from
http://www.unrisd.org/80256B3C005BCCF9/%28LookupAllDocumentsByUNID
%29/655D60DC55B78527C1257011003866BA?OpenDocument
Forsås-Scott, H. (1997). Swedish Women’s Writing, 1850-1995. London: Athlone Press.
Franceschet, S., & Krook, M.L. (2008, August). Measuring the Impact of Quotas on
Women’s Substantive Representation: Towards a Conceptual Framework. Paper
presented at the annual meeting of the American Political Science Association
(APSA), Boston, MA.
Franklin Lytle, P. (1998). Religion and Politics in Eastern Europe. In S. Ramet (Ed.),
Eastern Europe: Politics, Culture, and Society since 1939 (pp. 304-329).
Bloomington, IN: Indiana University Press.
Freidenvall, L. (2011). Case Study: Sweden: Step by Step Towards Gender Balanced
Political Representation. In Electoral Gender Quota Systems and their
implementation in Europe (pp. 133-146). Brussels: Policy Department C:
Citizens’ Rights and Constitutional Affairs.
Froese, P. (2005). Czechs and Devout Slovaks: Explaining Religious Differences. Review
of Religious Research, 46(3), 269-283.
Galligan, Y. (1993). Party Politics and Gender in the Republic of Ireland. In J.
Lovenduski & P. Norris (Eds.), Gender and Party Politics (pp. 147-167). London:
Sage Publications.
Galligan, Y. (1998). Women in Irish Society and Politics. In Women and Politics in
Contemporary Ireland: From the Margins to the Mainstream (pp. 26-47).
London: Pinter.
Galligan, Y. (2009). Women in politics. In J. Coakley & M. Gallagher (Eds.), Politics in
the Republic of Ireland (5th
ed.) (pp. 263-291). Hoboken, NJ: Routledge.
122
Galligan, Y., Clavero, S., & Calloni, M. (2007). Gender Politics and Democracy in post-
socialist Europe. Farmington Hills, MI: Barbara Budrich Publishers.
Galligan, Y., Laver, M., & Carney, G. (1999). The effect of candidate gender on voting in
Ireland, 1997. Irish Political Studies, 14(1), 118-122.
Gardiner, F., & Leijenaar, M. (1997). The timid and the bold: Analysis of the ‘woman-
friendly state’ in Ireland and the Netherlands. In F. Gardiner (Ed.), Sex Equality
Policy in Western Europe (pp. 60-87). New York: Routledge.
Greenberg, M., & McDonald, K. (2000). Women’s Political Participation in the Republic
of Macedonia: Opportunities to Support Women in Upcoming Elections—and
Beyond. Washington, D.C.: A Women in Development Technical Assistance
Project. Retrieved January 22, 2012, from
http://pdf.usaid.gov/pdf_docs/PNACM344.pdf
Hardy, M.O. (2008). Symbolic Power in Mary Robinson’s Presidency and Eavan
Boland’s Poetry. New Hibernia Review, 12(3), 47-65.
House of the Nation. (2012). Registers of MPs. Retrieved May 15, 2012, from
http://www.parlament.hu/angol/registers.htm
Houses of the Oireachtas. (2012). Dáil Éireann Members Database. Retrieved March 30,
2012, from http://www.oireachtas.ie/members-
hist/default.asp?housetype=0&HouseNum=31&disp=mem#tabs-4
Htun, M.N., & Jones, M.P. (2002). Engendering the Right to Participate in Decision-
making: Electoral Quotas and Women’s Leadership in Latin America. In N.
Craske & M. Molyneux (Eds.), Gender and the Politics of Rights and Democracy
in Latin America (pp. 32-56). New York: Palgrave.
Hungarian Central Statistical Office. (2011). Hungary in Figures 2010. Budapest,
Hungary. Retrieved May 10, 2012, from
http://www.ksh.hu/apps/shop.kiadvany?p_kiadvany_id=8945&p_temakor_kod=K
SH&p_session_id=843748128997301&p_lang=EN
Ilonszki, G. (2006). Women in politics: The European Union and Hungary. In I. Nagy,
M. Pongrácz, & I.G. Tóth (Eds.), Changing Roles: Report on the Situation of
Women and Men in Hungary 2005 (pp. 56-68). Budapest: TÁRKI Social
Research Institute.
Ilonszki, G. (2008). Hungary: The Impact of Early Party Consolidation on Female
Representation and the Mixed Electoral System. In M. Tremblay (Ed.), Women
and Legislative Representation: Electoral Systems, Political Parties, and Sex
Quotas (pp. 205-216). New York: Palgrave MacMillan.

123
Inglehart, R., and Norris, P. (2003). Rising Tide: Gender Equality and Cultural Change
Around the World. Cambridge, UK: Cambridge University Press.
Inter-Parliamentary Union (IPU). (n.d.). Women’s Suffrage. Retrieved September 15,
2011, from http://www.ipu.org/wmn-e/suffrage.htm
Inter-Parliamentary Union (IPU). (2011, November 30). Women in National Parliaments.
Retrieved December 14, 2011, from http://www.ipu.org/wmn-
e/arc/classif301111.htm
Inter-Parliamentary Union (IPU). (2012). PARLINE database. Retrieved January 20,
2012, from http://www.ipu.org/parline-e/parlinesearch.asp
International Institute for Democracy and Electoral Assistance (IDEA). (2005). Countries
using List PR. Retrieved September 14, 2011, from
http://www.idea.int/esd/glossary.cfm
International Institute for Democracy and Electoral Assistance (IDEA). (2009). Glossary
of Terms. Retrieved September 14, 2011, from
http://www.idea.int/esd/glossary.cfm
International Institute for Democracy and Electoral Assistance (IDEA). (2011). Quota
Project: Global Database of Quotas for Women. Retrieved September 25, 2011,
from http://www.quotaproject.org/uid/search.cfm
International Institute for Democracy and Electoral Assistance (IDEA). (2012). Ireland.
Quota Project: Global Database of Quotas for Women. Retrieved March 25, 2012,
from http://www.quotaproject.org/uid/countryview.cfm?ul=en&country=102
International Republican Institute. (1994, October 30). IRI Election Observation Mission
Macedonia. 1-24. Retrieved April 1, 2012, from
http://www.iri.org/sites/default/files/Macedonia%27s%201994%20Parliamentary
%20Elections.pdf
Irish system has failed to provide higher number of women TDs: Taoiseach. (2012,
January 20). The Journal. February 14, 2012 from http://www.thejournal.ie/irish-
system-has-failed-to-provide-higher-number-of-women-tds-taoiseach-332522-
Jan2012/
Jänterä-Jareborg, M. (2010). Religion and the Secular State in Sweden. In J. Martínez-
Torrón & W.C. Durham, Jr. (General Reporters), Religion and the Secular State
(pp. 669-686). Provo, UT: The International Center for Law and Religion Studies,
Brigham Young University.

124
Kakucs, N., & Pető, A. (2008). The Impact of EU Accession on Gender Equality in
Hungary. In S. Roth (Ed.), Gender Politics in the Expanding European Union:
Mobilization, Inclusion, Exclusion (pp. 174-191). New York: Berghahn Books.
Kavanagh, A. (2010, December 7). Fianna Fail candidate selections. Irish Elections:
Geography, Facts and Analyses. Retrieved May 17, 2012, from
http://geographyspecialinterestgroup.wordpress.com/2010/12/07/ffcandsge2011/
Kazandziska, M., Risteska, M., & Schmidt, V. (2012). The Gender Pay Gap in the
former Yugoslav Republic of Macedonia. Skopje: International Labour
Organization (ILO) Decent Work Technical Support Team and Country Office for
Central and Eastern Europe. Retrieved May 25, 2012, from
http://www.ilo.org/wcmsp5/groups/public/---europe/---ro-geneva/---sro-
budapest/documents/publication/wcms_180637.pdf
Kenworthy, L., and Malami, M. (1999). Gender Inequality in Political Representation: A
Worldwide Comparative Analysis. Social Forces, 78(1), 235-268.
Kittilson, M.C. (2006). Challenging Parties, Changing Parliaments: Women and Elected
Office in Contemporary Western Europe. Columbus, OH: Ohio State University
Press.
Knudsen, K. & Wærness, K. (2001). The National Context, Individual Characteristics
and Attitudes on Mothers’ Employment: a Comparative Analysis of Great Britain,
Sweden and Norway. Acta Sociologica, 44 (1), 67-79.
Kürti, L. (1998). Hungary. In S. Ramet (Ed.), Eastern Europe: Politics, Culture, and
Society since 1939 (pp. 71-93). Bloomington, IN: Indiana University Press.
Lawless, J.L., & Fox, R.L. (2005). It takes a Candidate: Why Women Don’t Run for
Office. New York: Cambridge University Press.
Leyenaar, M. (2004). Political Empowerment of Women: The Netherlands and Other
Countries. Boston: Martinus Nijhoff Publishers.
Lovenduski, J. (2005). Introduction: state feminism and the political representation of
women. In State Feminism and Political Representation (pp. 1-19). New York:
Cambridge University Press.
Lundberg, T.C. (2009). Post-Communism and the Abandonment of Mixed-Member
Electoral Systems. Representation, 45(1), 15-27.
Luxmoore, J. (2001). Eastern Europe 1997-2001: a Review of Church Life. Religion,
State & Society, 29(4), 305-330.

125
Magyarország Alaptörvénye (Basic Law of Hungary). (2011). Retrieved April 12, 2012,
from
http://www.euractiv.com/sites/all/euractiv/files/CONSTITUTION_in_English__D
RAFT.pdf
Marinović Jerolimov, D., & Zrinščak, S. (2006). Religion Within and Beyond Borders:
The Case of Croatia. Social Compass, 53(2), 279-290.
McElroy, G., & Marsh, M. (2011). Electing Women to the Dáil: Gender Cues and the
Irish Voter. Irish Political Studies, 26(4), 521-534.
McGing, C. (2011, January). Women ‘acting for’ women?: the politics of place, gender
and representation in the Irish parliament. Paper presented at the 2nd
European
Conference on Politics and Gender, Budapest, Hungary.
Meier, P. (2008). Belgium: The Collateral Damage of Electoral System Design. In M.
Tremblay (Ed.), Women and Legislative Representation: Electoral Systems,
Political Parties, and Sex Quotas (pp. 137-147). New York: Palgrave MacMillan.
Meyer, B. (2003). Much Ado about Nothing? Political Representation Policies and the
Influence of Women Parliamentarians in Germany. Review of Policy Research,
20(3), 401-422.
Montgomery, K.A., & Ilonszki, G. (2003). Weak Mobilization, Hidden Majoritarianism,
and Resurgence of the Right: A Recipe for Female Under-Representation in
Hungary. In R.E. Matland & K.A. Montgomery (Eds.), Women’s Access to
Political Power in Post-Communist Europe (pp. 105-129). New York: Oxford
University Press.
Moser, R.G. (2001). The effects of electoral systems on women’s representation in post-
communist states. Electoral Studies, 20(3), 353-369.
Nagy, B. (2007). Gender and career development—Hungary. European Foundation for
the Improvement of Living and Working Conditions (Eurofound). Retrieved April
15, 2012, from
http://www.eurofound.europa.eu/eiro/studies/tn0612019s/hu0612019q.htm
Norris, P. (1985). Women’s legislative participation in western Europe. West European
Politics, 8(4), 90-101.
Norris, P. (1987). Politics and Sexual Equality: The Comparative Position of Women in
Western Democracies. Boulder: Lynne Rienner.
Norris, P. (1996). Legislative Recruitment. In L. LeDuc, R.G. Niemi, & P. Norris (Eds.),
Comparing Democracies: Elections and Voting in Global Perspective (pp. 184-
215). Thousand Oaks, CA: Sage Publications.

126
Norris, P. (2004). Electoral Engineering: Voting Rules and Political Behavior. New
York: Cambridge University Press.
Norris, P., & Krook, M.L. (2011). Gender Equality in Elected Office: A Six-Step Action
Plan. Vienna, Austria: Organization of Security and Cooperation in Europe
(OSCE)/Office for Democratic Institutions and Human Rights (ODIHR).
O’Brien, C. (2010, December 18). No more dodging the abortion issue. Irish Times.
Retrieved April 3, 2012, from LexisNexis database.
O’Donoghue, C. (2011, April 27). Region: Hungary passes new constitution amid
concerns. Prague Post. Retrieved April 12, 2012, from LexisNexis database.
O’Toole, E. (2012, June 8). This Irish feminist zeitgeist is ready for the challenge
[Editorial]. The Guardian. Retrieved June 9, 2012, from
http://www.guardian.co.uk/commentisfree/2012/jun/08/irish-feminist-zeitgeist-
challenge?CMP=twt_gu
Osborn, T., and Mendez, J.M. (2010). Speaking as Women: Women and Floor Speeches
in the Senate. Journal of Women, Politics & Policy, 31(1), 1-21.
Palonen, E. (2009). Political Polarisation and Populism in Contemporary Hungary.
Parliamentary Affairs, 62(2), 318–334.
Paxton, P. (1997). Women in National Legislatures: A Cross-National Analysis. Social
Science Research, 26, 442-464.
Paxton, P., and Kunovich, S. (2003). Women’s Political Representation: The Importance
of Ideology. Social Forces, 82(1), 87-113.
Pew Forum on Religion and Public Life. (2008, September 30). Abortion Laws Around
the World. Retrieved April 3, 2012, from
http://www.pewforum.org/Abortion/Abortion-Laws-Around-the-
World.aspx#westerneurope
Phillips, A. (1995). Quotas for Women. In The Politics of Presence (pp. 57-84). New
York: Oxford University Press.
Pitkin, H.F. (1967). The Concept of Representation. Berkeley, CA: University of
California Press.
Ramet, S. (1998). Yugoslavia. In Eastern Europe: Politics, Culture, and Society since
1939 (pp. 159-189). Bloomington, IN: Indiana University Press.
Read, J.G. (2003). The Sources of Gender Role Attitudes among Christian and Muslim
Arab-American Women. Sociology of Religion, 64(2), 207-222.

127
Region: EU asks Hungary to stop pro-life campaign. (2011, June 15). Prague Post.
Retrieved April 3, 2012, from LexisNexis database.
Renwick, A. (2011, December 25). Hungary’s New Electoral Law, Part 1: The Basics.
Reading Politics. Retrieved June 20, 2012, from
http://blogs.reading.ac.uk/readingpolitics/2011/12/25/hungary%E2%80%99s-
new-electoral-law-part-1-the-basics/
Reynolds, A. (1999). Women in the Legislatures and Executives of the World: Knocking
at the Highest Glass Ceiling. World Politics, 51(4), 547-572.
Risteska, M. (2007). The Macedonian Accession to the European Union. Skopje,
Macedonia: Centre for Research and Policy Making, 1-22. Retrieved March 28,
2012, from http://www.europeum.org/doc/pdf/860.pdf
Ristova, K. (2003). Establishing a Machocracy: Women and Elections in Macedonia
(1990-8). In R.E. Matland & K.A. Montgomery (Eds.), Women’s Access to
Political Power in Post-Communist Europe (pp. 196-216). New York: Oxford
University Press.
Ruane, M. (2011, February 19). What about gender, Enda—and the rest of you Dail
dinosaurs? [Editorial]. Irish Independent. Retrieved February 16, 2012, from
http://www.independent.ie/opinion/columnists/medb-ruane/medb-ruane-what-
about-gender-enda-and-the-rest-of-you-dail-dinosaurs-2547199.html
Ruedin, D. (2012). The Representation of Women in National Parliaments: A Cross-
national Comparison. European Sociological Review, 28(1), 96-109.
Rueschemeyer, M., & Wolchik, S.L. (2009a). Women in Power: The Issues. In Women in
Power in Post-Communist Parliaments (pp. 1-21). Washington, D.C.: Woodrow
Wilson Center Press.
Rueschemeyer, M., & Wolchik, S.L. (2009b). Women in Power: Concluding Thoughts.
In Women in Power in Post-Communist Parliaments (pp. 251-266). Washington,
D.C.: Woodrow Wilson Center Press.
Ryan, C. (2012, February 22). Irish poised to revisit abortion law. International Herald
Tribune. Retrieved April 3, 2012, from LexisNexis database.
Sainsbury, D. (2005). Party feminism, state feminism and women’s representation in
Sweden. In J. Lovenduski (Ed.), State Feminism and Political Representation (pp.
195-215). New York: Cambridge University Press.
Saxonberg, S. (2000). Women in East European Parliaments. Journal of Democracy,
11(2), 145-158.

128
Schmidt, G.D. (2008a). Peru: Success under Open List PR: The Election of Women to
Congress. In M. Tremblay (Ed.), Women and Legislative Representation:
Electoral Systems, Political Parties, and Sex Quotas (pp. 161-172). New York:
Palgrave MacMillan.
Schmidt, G.D. (2008b). The election of women in list PR systems: Testing the
conventional wisdom. Electoral Studies, 28(2), 190-203.
Shevchenko, I. (2007). Does the Gender of MPs Matter in Postcommunist Politics? The
Case of the Russian Duma, 1995-2001. In J.E. Johnson & J.C. Robinson (Eds.)
Living Gender after Communism (pp. 128-148). Bloomington, IN: Indiana
University Press.
Sinn Féin. (2011). The Candidates. Retrieved March 30, 2012, from
http://www.sinnfein.ie/the-candidates
Sinnott, R. (2009). The electoral system. In J. Coakley & M. Gallagher (Eds.), Politics in
the Republic of Ireland (5th
ed.) (pp. 111-136). Hoboken, NJ: Routledge.
Sloat, A. (2004, May). Fixing an Old Divide: The Political Participation of Women in an
Enlarged Europe. Paper presented at the annual meeting of the Network of
Institutes and Schools of Public Administration in Central and Eastern Europe
(NISPAcee), Vilnius, Lithuania.
Spehar, A. (2012). This Far, but No Further? Benefits and Limitations of EU Gender
Equality Policy Making in the Western Balkans. East European Politics and
Societies, 26(2), 362-379.
Statistics Sweden. (2010). Women and men in Sweden 2010. Örebro, Sweden.
Strmiska, M. (1999). The Macedonian Multipartism: A Note on the Typology of the
Macedonian Party Arrangement. Central European Political Studies Review, 1(0).
Swedish Institute. (2011). Gender equality: The Swedish approach to fairness. 1-4.
Retrieved March 29, 2012, from
http://www.sweden.se/upload/Sweden_se/english/factsheets/SI/SI_FS8_Gender%
20equality/FS8-Gender-equality-in-Sweden-low-resolution.pdf
Swers, M.L. (1998). Are Women More Likely to Vote for Women’s Issue Bills Than
Their Male Colleagues? Legislative Studies Quarterly, 23(3), 435-448.
Szalai, J. (1998). Women and Democratization: Some Notes on Recent Changes in
Hungary. In J.S. Jaquette & S.L. Wolchik (Eds.) Women and Democracy: Latin
America and Central and Eastern Europe (pp. 185-202). Baltimore, MD: Johns
Hopkins University Press.

129
Tuffy, J. (2011, November 22). Gender quotas do women no favours—and undermine
democracy [Editorial]. The Journal. Retrieved May 25, 2012, from
http://www.thejournal.ie/readme/column-gender-quotas-do-women-no-favours-
%E2%80%93-and-undermine-democracy/
U.K. Parliament. (2012). List of MPs. Retrieved March 22, 2012, from
http://www.parliament.uk/mps-lords-and-offices/mps/
United Nations Development Programme (UNDP). (2009). Human Development Report
2009. New York: Palgrave MacMillan.
United Nations Development Programme (UNDP). (2010). Gender Inequality Index.
New York: Palgrave MacMillan.
United Nations Educational, Scientific and Cultural Organizations (UNESCO). (2011).
Education: Girls. Retrieved April 14, 2012, from
http://portal.unesco.org/education/en/ev.php-
URL_ID=30870&URL_DO=DO_TOPIC&URL_SECTION=201.html
Valiente, C. (2008). Spain: Women in Parliament: The Effectiveness of Quotas. In M.
Tremblay (Ed.), Women and Legislative Representation: Electoral Systems,
Political Parties, and Sex Quotas (pp. 123-133). New York: Palgrave MacMillan.
Wangnerud, L. (2000). Testing the Politics of Presence: Women's Representation in the
Swedish Riksdag. Scandinavian Political Studies, 23(1), 67-91.
Weiner, E. (2009). Enlargement Dirigism and Déjà Vu Logic: The Gender Politics and
Perils of EU. European Journal of Women’s Studies, 16(3), 211–228.
Wolchik, S.L. (1998). Women and the Politics of Gender in Communist and Post-
Communist Central and Eastern Europe. In S. Ramet (Ed.), Eastern Europe:
Politics, Culture, and Society since 1939 (pp. 285-303). Bloomington, IN: Indiana
University Press.

130
Appendices

131
Appendix A: Calculation of Religiosity
Religiosity was calculated using survey data from the European Values Study
(2008). Specifically, an index was created based on respondents’ answers to the two
questions below. Respondents who reported attending religious services “once a week” or
“more than once week” were recorded. The percentage of valid responses for church
attendance was combined with the total valid percentage of respondents who reported
that religion was “very important” or “quite important” in their lives. The combined
percentages were then divided by two to achieve a score out of 100 percent.
Variable name (v109): how often attend religious services.
Apart from weddings, funerals and christenings, about how often do you attend
religious services these days?
1. More than once week
2. Once a week
3. Once a month
4. Only on specific holy days
5. Once a year
6. Less often
7. Never, practically never
Combined valid percent of respondents that answer “1” or “2.”
Variable name (v6): how important in your life: religion.
Please say, for each of the following, how important it is in your life: religion.
1. Very important
2. Quite important

132
3. Not important
4. Not at all important
Combined valid percent of respondents that answer “1” or “2.”

133
Appendix B: Complete Data
Table B1: Europe-wide Data
Country
Percent of
Women in
Legislature
Years
since
Women’s
Suffrage
Type of
Electoral
System
Legal
Gender
Quota
Level of
Gender
Equality
Percent
of
Female
Profess-
ionals
Level of
Religiosity
Sweden 45.0 90 PR No 0.956 51 14.2
Iceland 42.9 91 PR No 0.959 56 28.1
Finland 42.5 105 PR No 0.954 55 16.5
Norway 39.6 98 PR No 0.961 51 20.4
Belgium 39.3 63 PR Yes 0.948 49 24.5
Netherlands 39.3 92 PR No 0.954 50 30.9
Denmark 39.1 96 PR No 0.947 52 16.3
Spain 36.0 35 PR Yes 0.949 49 28.7
Germany 32.8 93 Mixed No 0.939 50 16.7
Belarus* 31.8 92 SMP No 0.824 - 30.7
Macedonia 30.9 65 PR Yes 0.812 53 46.7
Switzerland 28.5 40 Mixed No 0.946 46 26.7
Austria 27.9 93 PR No 0.930 48 31
Portugal 26.5 35 PR Yes 0.907 51 49.9
Poland 23.9 93 PR No 0.877 60 63.9
Croatia 23.5 66 PR No 0.869 51 49.0
Czech Rep. 22.0 91 PR No 0.900 53 14.3
U.K. 22.0 83 SMP No 0.943 47 28.6
Serbia* 21.6 65 PR Yes - 55 40.6
Italy 21.3 66 PR No 0.945 47 53.2
Latvia 21.0 93 PR No 0.865 66 19.1
Bulgaria 20.8 67 Mixed No 0.839 61 30.5
Luxembourg* 20.0 92 PR No 0.943 - 24.1
Estonia 19.8 93 PR No 0.882 69 14.4
Lithuania 19.1 93 Mixed No 0.869 70 29.0
France 18.9 67 SMP No 0.956 48 22.4
Moldova 18.8 18 PR No 0.719 68 46.8
Greece 17.3 59 PR No 0.936 49 53.5
Bosnia &
Herzegovina* 16.7 62 PR No - - 56.1
Albania* 16.4 91 PR No 0.814 - 31.4
Slovakia 16 91 PR No 0.877 58 51.2
Ireland 15.1 89 PR No 0.948 53 55.8
Slovenia 14.4 66 PR No 0.927 56 29.2
Russia 14 93 PR No 0.816 64 28.8
Romania 11.4 65 Mixed No 0.836 56 59.1
Montenegro* 11.1 65 PR No - 60 42.0
Hungary 9.1 66 Mixed No 0.879 60 24.5
Ukraine 8 92 PR No 0.793 64 39.6
*Country excluded from quantitative analysis due to missing data. Data sources: EVS
(2008), IDEA (2011), IPU (n.d.), IPU (Nov. 2011), IPU PARLINE (2012), Norris &
Krook (2011), UNDP (2009).

134
Appendix B: Complete Data (Continued)
Table B2: Western Europe Data
Country
Percent of
Women in
Legislature
Years
since
Women’s
Suffrage
Type of
Electoral
System
Legal
Gender
Quota
Level of
Gender
Equality
Percent
of
Female
Profess-
ionals
Level of
Religiosity
Sweden 45.0 90 PR No 0.956 51 14.2
Iceland 42.9 91 PR No 0.959 56 28.1
Finland 42.5 105 PR No 0.954 55 16.5
Norway 39.6 98 PR No 0.961 51 20.4
Belgium 39.3 63 PR Yes 0.948 49 24.5
Netherlands 39.3 92 PR No 0.954 50 30.9
Denmark 39.1 96 PR No 0.947 52 16.3
Spain 36.0 35 PR Yes 0.949 49 28.7
Germany 32.8 93 Mixed No 0.939 50 16.7
Switzerland 28.5 40 Mixed No 0.946 46 26.7
Austria 27.9 93 PR No 0.930 48 31.4
Portugal 26.5 35 PR Yes 0.907 51 49.9
U.K. 22.0 83 SMP No 0.943 47 28.6
Italy 21.3 66 PR No 0.945 47 53.2
Luxembourg* 20.0 92 PR No 0.943 - 24.1
France 18.9 67 SMP No 0.956 48 22.4
Greece 17.3 59 PR No 0.936 49 53.5
Ireland 15.1 89 PR No 0.948 53 55.8
*Country excluded from quantitative analysis due to missing data. Data sources: EVS
(2008), IDEA (2011), IPU (n.d.), IPU (Nov. 2011), IPU PARLINE (2012), Norris &
Krook (2011), UNDP (2009).

135
Appendix B: Complete Data (Continued)
Table B3: Eastern Europe Data
Country
Percent of
Women in
Legislature
Years
since
Women’s
Suffrage
Type of
Electoral
System
Legal
Gender
Quota
Level of
Gender
Equality
Percent
of
Female
Profess-
ionals
Level of
Religiosity
Belarus* 31.8 92 SMP No 0.824 - 30.7
Macedonia 30.9 65 PR Yes 0.812 53 46.7
Poland 23.9 93 PR No 0.877 60 63.9
Croatia 23.5 66 PR No 0.869 51 49.0
Czech Rep. 22.0 91 PR No 0.900 53 14.3
Serbia* 21.6 65 PR Yes - 55 40.6
Latvia 21.0 93 PR No 0.865 66 19.1
Bulgaria 20.8 67 Mixed No 0.839 61 30.5
Estonia 19.8 93 PR No 0.882 69 14.4
Lithuania 19.1 93 Mixed No 0.869 70 29.0
Moldova 18.8 18 PR No 0.719 68 46.8
Bosnia &
Herzegovina* 16.7 62 PR No - - 56.1
Albania* 16.4 91 PR No 0.814 - 31.0
Slovakia 16.0 91 PR No 0.877 58 51.2
Slovenia 14.4 66 PR No 0.927 56 29.2
Russia 14.0 93 PR No 0.816 64 28.8
Romania 11.4 65 Mixed No 0.836 56 59.1
Montenegro* 11.1 65 PR No - 60 42.0
Hungary 9.1 66 Mixed No 0.879 60 24.5
Ukraine 8.0 92 PR No 0.793 64 39.6
*Country excluded from quantitative analysis due to missing data. Data sources: EVS
(2008), IDEA (2011), IPU (n.d.), IPU (Nov. 2011), IPU PARLINE (2012), Norris &
Krook (2011), UNDP (2009).

136
Appendix C: Correlations
Table C1: Europe-wide Correlations
Percent of
Women in
Legislature
Years since
Women's
Suffrage
Type of
Electoral
System
Legal Gender
Quota
Level of Gender
Equality
Percent of
Female
Professionals
Level of
Religiosity
Pearson Correlation 1 .177 .105 .251 .518**
-.455**
-.438**
Sig. (2-tailed) .287 .529 .128 .001 .007 .006
N 38 38 38 38 35 34 38
Pearson Correlation .177 1 .026 -.460** .190 .148 -.382
*
Sig. (2-tailed) .287 .878 .004 .274 .404 .018
N 38 38 38 38 35 34 38
Pearson Correlation .105 .026 1 .201 .014 .144 .173
Sig. (2-tailed) .529 .878 .226 .937 .418 .299
N 38 38 38 38 35 34 38
Pearson Correlation .251 -.460** .201 1 .038 -.233 .115
Sig. (2-tailed) .128 .004 .226 .829 .186 .493
N 38 38 38 38 35 34 38
Pearson Correlation .518** .190 .014 .038 1 -.711
** -.327
Sig. (2-tailed) .001 .274 .937 .829 .000 .056
N 35 35 35 35 35 32 35
Pearson Correlation -.455** .148 .144 -.233 -.711
** 1 .003
Sig. (2-tailed) .007 .404 .418 .186 .000 .986
N 34 34 34 34 32 34 34
Pearson Correlation -.438**
-.382* .173 .115 -.327 .003 1
Sig. (2-tailed) .006 .018 .299 .493 .056 .986
N 38 38 38 38 35 34 38
Level of Gender Equality
Percent of Female
Professionals
Level of Religiosity
**. Correlation is significant at the 0.01 level (2-tailed). *. Correlation is significant at the 0.05 level (2-tailed).
Percent of Women in
Legislature
Years since Women's
Suffrage
Type of Electoral System
Legal Gender Quota

137
Appendix C: Correlations (Continued)
Table C2: Western Europe Correlations
Percent of
Women in
Legislature
Years since
Women's
Suffrage
Type of
Electoral
System
Legal Gender
Quota
Level of Gender
Equality
Percent of
Female
Professionals
Level of
Religiosity
Pearson Correlation 1 .294 .357 .145 .416 .484*
-.661**
Sig. (2-tailed) .237 .146 .565 .086 .049 .003
N 18 18 18 18 18 17 18
Pearson Correlation .294 1 .111 -.664** .446 .508
* -.421
Sig. (2-tailed) .237 .661 .003 .064 .037 .082
N 18 18 18 18 18 17 18
Pearson Correlation .357 .111 1 .224 -.064 .475 .221
Sig. (2-tailed) .146 .661 .372 .802 .054 .379
N 18 18 18 18 18 17 18
Pearson Correlation .145 -.664** .224 1 -.401 -.078 .143
Sig. (2-tailed) .565 .003 .372 .099 .766 .571
N 18 18 18 18 18 17 18
Pearson Correlation .416 .446 -.064 -.401 1 .248 -.486*
Sig. (2-tailed) .086 .064 .802 .099 .337 .041
N 18 18 18 18 18 17 18
Pearson Correlation .484*
.508* .475 -.078 .248 1 -.148
Sig. (2-tailed) .049 .037 .054 .766 .337 .570
N 17 17 17 17 17 17 17
Pearson Correlation -.661** -.421 .221 .143 -.486
* -.148 1
Sig. (2-tailed) .003 .082 .379 .571 .041 .570
N 18 18 18 18 18 17 18
Legal Gender Quota
Level of Gender Equality
Percent of Female
Professionals
Level of Religiosity
**. Correlation is significant at the 0.01 level (2-tailed). *. Correlation is significant at the 0.05 level (2-tailed).
Percent of Women in
Legislature
Years since Women's
Suffrage
Type of Electoral System

138
Appendix C: Correlations (Continued)
Table C3: Eastern Europe Correlations
Percent of
Women in
Legislature
Years since
Women's
Suffrage
Type of
Electoral
System
Legal Gender
Quota
Level of Gender
Equality
Percent of
Female
Professionals
Level of
Religiosity
Pearson Correlation 1 .077 -.186 .414 -.016 -.250 -.006
Sig. (2-tailed) .748 .432 .069 .950 .333 .982
N 20 20 20 20 17 17 20
Pearson Correlation .077 1 -.081 -.201 .474 .137 -.364
Sig. (2-tailed) .748 .735 .394 .055 .600 .115
N 20 20 20 20 17 17 20
Pearson Correlation -.186 -.081 1 .180 .023 -.147 .124
Sig. (2-tailed) .432 .735 .449 .931 .573 .602
N 20 20 20 20 17 17 20
Pearson Correlation .414 -.201 .180 1 -.185 -.399 .150
Sig. (2-tailed) .069 .394 .449 .477 .112 .529
N 20 20 20 20 17 17 20
Pearson Correlation -.016 .474 .023 -.185 1 -.327 -.289
Sig. (2-tailed) .950 .055 .931 .477 .234 .260
N 17 17 17 17 17 15 17
Pearson Correlation -.250 .137 -.147 -.399 -.327 1 -.331
Sig. (2-tailed) .333 .600 .573 .112 .234 .195
N 17 17 17 17 15 17 17
Pearson Correlation -.006 -.364 .124 .150 -.289 -.331 1
Sig. (2-tailed) .982 .115 .602 .529 .260 .195
N 20 20 20 20 17 17 20
Level of Gender Equality
Percent of Female
Professionals
Level of Religiosity
**. Correlation is significant at the 0.01 level (2-tailed). *. Correlation is significant at the 0.05 level (2-tailed).
Percent of Women in
Legislature
Years since Women's
Suffrage
Type of Electoral System
Legal Gender Quota

139
Appendix D: Regressions without Female Professionals Variable
Table D1: Europe-wide Model without Female Professionals Variable
Independent Variables b-score standard
error
t score
Years since Women’s Suffrage .064 .085 .756
Type of Electoral System 1.732 2.346 .738
Legal Gender Quota 11.247* 5.283 2.129
Level of Gender Equality 64.956* 25.035 2.595
Level of Religiosity -.212 .112 -1.891
Constant -35.467 24.089 -1.472
R2
=45.4%
Adjusted R2 =36.0%
Statistical significance: * p<.05
Data sources: EVS (2008), IDEA (2011), IPU (n.d.), IPU (Nov. 2011), IPU
PARLINE (2012), Norris & Krook (2011), UNDP (2009).
Independent Variables b-score standard
error
t score
Years since Women’s Suffrage .004 .111 .034
Type of Electoral System 6.886* 2.582 2.667
Legal Gender Quota 5.783 6.188 .934
Level of Gender Equality 151.493 144.689 1.047
Level of Religiosity -.511** .145 -3.517
Constant -109.825 138.840 -.791
R2
=74.6%
Adjusted R2 =64.0%
Statistical significance: * p<.05, ** p<.01
Data sources: EVS (2008), IDEA (2011), IPU (n.d.), IPU (Nov. 2011), IPU
PARLINE (2012), Norris & Krook (2011), UNDP (2009).
Table D2: Western Europe Model without Female Professionals Variable
Related Documents