Generic Fieldwork Enquiry Tasks For award in 2015 The Controlled Assessment Fieldwork Enquiry tasks are for 2015 award only. Centres must choose from these 8 tasks and not those for 2014. These tasks have been developed jointly by WJEC and Field Studies Council (FSC) © WJEC CBAC Ltd SJ/JF-W.38(12)

Welcome message from author
This document is posted to help you gain knowledge. Please leave a comment to let me know what you think about it! Share it to your friends and learn new things together.
Transcript

Generic Fieldwork Enquiry TasksFor award in 2015
The Controlled Assessment Fieldwork Enquiry tasks are for 2015 award only. Centres must choose from these 8 tasks and not those for 2014.
These tasks have been developed jointly by WJEC and Field Studies Council (FSC)
Centres should complete the Submission of Controlled Assessment form once they have decided on their task and read the accompanying supporting notes.
© WJEC CBAC LtdSJ/JF-W.38(12)

The following generic Fieldwork Enquiry tasks are available for candidates who receive their award in 2015.
Theme Generic task for the fieldwork Enquiry
The tasks are linked to the following enquiry questions from the specification
Page in specification
1 An investigation into factors that affect the formation of river landform(s)
1.1 What processes are associated with rivers?1.2 What landforms result from these processes?
14
4 An investigation of push-pull factors that produce urban to rural migration.
1.2 What are the push / pull factors that produce rural – urban migration and urban-rural migration?
16
6 An investigation into patterns of quality of life in one urban area.
1.2 What are the regional patterns of economic and/or social development in one country?
17
7 An investigation into the effects of coastal retreat on people.
1.3 How do these landforms and processes affect the lives of people living along the coast?
18
8 An investigation into factors that create variations in weather/climate in a local area.
1.1 What factors create the variations in weather and climate experienced within and around the British Isles?
19
9 An investigation of a woodland ecosystem.
1.1 How does the physical environment interact with living things to produce different large scale ecosystems?OR2.1 In what ways do people use ecosystems?2.2 How can ecosystems be managed sustainably?
19
10 An investigation into the impacts of tourism.
2.1 What are the impacts of the development of tourism on:
people and the economy? the environment?
20
11 An investigation into the spatial patterns of retailing in a specified area.
2.1 Where does retailing occur in the city?
20
© WJEC CBAC LtdSJ/JF-W38 (12)

Fieldwork Enquiry Task 2015 Rivers (Theme 1)
Theme Generic task for the fieldwork Enquiry
The tasks are linked to the following enquiry questions from the specification
Page in specification
1 An investigation into factors that affect the formation of river landform(s)
1.1 What processes are associated with rivers?1.2 What landforms result from these processes?
14
How tasks may be contextualisedCentres may provide students with an overarching enquiry question such as:
How might the current processes of erosion and deposition alter the shape of river landforms on the River Ilston over the next 20 to 50 years?
Alternatively, centres may present the tasks to their students as a hypothesis such as:
The wavelength of a meander is greater where the river channel is wider.
Coverage of river processes could include processes of erosion (attrition, solution, hydraulic action and corrosion), deposition and/or transportation (bed load, suspended load, solution). Landforms may include those created by erosion and/or those created by deposition.The focus must be on river processes and the development of distinctive fluvial landforms.
An investigation of river management strategies or flood hazards is not appropriate in this cycle.
Primary and Secondary dataWhichever investigation is chosen, students must be involved in primary data collection. Some suggestions are given below. Clearly, you will want to select a range of data collection techniques that provide opportunities for your students to meet the criteria of the mark scheme.
Primary data Channel measurements eg velocity, depth, wetted perimeter, gradient etc. Bed load measurements eg shape and size. Field sketches and photos that can be labelled and annotated eg sketches of river
features and landforms. Bank full measurements, eg bankfull width and depth. Valley profiles, sketches and photo annotation. Mapping of river landforms. Measurements of the landforms e.g. height & length of river cliffs on the outside of
each meander, gradients of slip-off slopes, meander wavelengths
1© WJEC CBAC LtdSJ/JF-W38 (12)

Secondary data Annotation of large scale sections of relevant OS maps. Use of old photos/maps to compare past and present landforms or river locations. Use of geology maps. Past years’ data from the same site. Drawing long profiles/cross sections from map data.
How to encourage independent thought:Time should be allowed for students to become involved in the planning process before the fieldwork is conducted. Students should be encouraged to contribute to discussions about data collection and sampling techniques. Student guidance sheets should be designed with suggestions to prompt independence, for example, whilst all students are involved in some data collection, students could also be given the opportunity to select one additional data collection technique. As well as answering the main contextualised title students could choose from a suggested selection of guiding questions to investigate the data further eg how and why velocity/bed load shape/bed load size/depth varies downstream or affect the main variable. Students should not be told which presentation technique to use with which data. They must be given the opportunity to select the data processing and presentation techniques that they feel are most appropriate across a range of graphical, cartographic, statistical skills.
AO2 Application The mark scheme criteria for AO2 should be checked thoroughly when designing the fieldwork enquiry. Students should apply their understanding of river processes and resulting landforms to the processes and landforms seen at the actual sites they have visited. They could apply concepts relating to process (erosion, transport, and deposition) or to a theory such as the Bradshaw model. Students could apply their knowledge of a case study of another river to the river they have investigated in their field enquiry.
Useful websites http://www.geography-fieldwork.org/riverfieldwork/river_processes/stage1.htm Field Studies Council River Processes
http://mapapps.bgs.ac.uk/geologyofbritain/home.html British Geological Survey = Geology of Britain Viewer
Displaying and presenting data in rivers fieldwork: Geographical Association http://www.geography.org.uk/projects/ks4ict/idea17/#top
RGS section on rivers fieldwork – has links to an activities document showing how to complete some of the measurements and what to think about when choosing a rivers site for fieldwork:http://www.rgs.org/OurWork/Schools/Resources/Learning+locally+through+fieldwork/River+basins.htm
Past weather data from a range of stations using Google Maps http://www.wunderground.com/wundermap/
2© WJEC CBAC LtdSJ/JF-W38 (12)

Fieldwork Enquiry Task 2015Changing Populations (Theme 4)
Theme
Generic task for the fieldwork enquiry
The task is linked to the following enquiry question from the specification
Page in specification
4 An investigation of push-pull factors that produce urban to rural migration.
1.2 What are the push / pull factors that produce rural – urban migration and urban-rural migration?
16
How the task may be contextualised
The theme 4 fieldwork enquiry for award in 2015 must investigate urban to rural migration patterns. In particular, it is important that candidates consider the push / pull factors that are producing movement of people from larger towns or cities to rural towns and villages. This may be contextualised through a hypothesis such as:
Recreational opportunities are the most important pull factor for people moving into Cornwall.
Alternatively, candidates could structure their investigation around an overarching question such as:
Which pull factors have the greatest importance for people moving into Gwynedd?
Remember that the enquiry in this cycle must focus on urban to rural migration. Investigations of migration from rural areas / rural depopulation / urban growth are not appropriate in this cycle.
Collecting primary and secondary data
The types of primary data that students might collect could be: Observer Survey: A variation on a pedestrian count – at public-space locations
through-out both the rural area, perhaps taking a couple of village sites and locations in the urban area, students could log the numbers and ‘type’ of people in the areas, perhaps also logging what the people are doing. Combined with a land-use map this may provide evidence of the results of urban-rural migration.
Land-use mapping: This could be used to map the recreational opportunities e.g. investigating the recreational opportunities of the village which may be a pull factor into a rural county.
Questionnaires: These could be done in both rural and urban areas and could include some of the attitude survey techniques to elicit deeper information.
Attitude Survey: This collects people's attitudes e.g. if they have moved why, why they think someone would want to move to or from an area or what might be the services on offer in that area. This could be done by a Likert Scale, which assesses the strength and direction of someone’s opinion of a series of statements E.g.
3© WJEC CBAC LtdSJ/JF-W38 (12)

There are lots of varied recreational opportunities in Pembrokeshire.
1 2 3 4
Agree Slightly Agree Slightly Disagree Disagree
Bi-polar scales are another way to achieve this. It would also be possible to provide different stakeholders with a set of statements which are linked to the different push-pull factors and ask them to rank these.
Services Audit: This could be a combination of the range, diversity and types of services available, the catchment area of the services, how frequently they are available, if they offer specific services for particular user groups e.g. disability access, schooling for special needs, youth discounts at sports centres etc.
Communities Activities Mapping: Data could be collected from web-sites, village notice boards, questionnaires or newsletters on the number & type of recreational & community activities. These could be combined on a map of the regions / villages community infrastructure e.g. village halls, libraries, playing fields etc.
Types of secondary data that students might collect could be: House-prices: This data could be combined with a mapping exercise looking at the
number of derelict and / or empty houses. It might also be possible to obtain data on second homes in the area.
Census data: for information relating to the population structure, ages, migration, levels of unemployment etc.
Schools data: Information on quality of the results from schools as well as the location of the schools.
Location specific regeneration projects: Secondary information from development areas in terms of jobs, or improved infrastructure may provide some location specific information as to the relative importance of the pull factors.
Blogs / YouTube: Villages or rural areas may have a blog &/or web-site which may provide evidence of the quality of life in different areas of the region. Text in the blogs could be analysed using web-sites such as Wordle.
Encouraging independence during the planning and data collection phaseIt is important to allow candidates to have the opportunity to demonstrate their independence in one or more of the following areas:
Planning the enquiry / posing enquiry questions Selecting and implementing data collection techniques or technologies.
This could be achieved if students were to focus on one or two specific stakeholder groups, e.g. different age groups of people. This could be achieved through using a class-wide resource to collect data and then students could modify aspects of it for their own study e.g. closed or open question additions to a questionnaire. Students could also use a Perception type survey to assess the rural and urban environments through the eyes of one of the stakeholder groups e.g. young student. It may also be possible for students to compare factors such as socio-economic or employment data in detail for the area.
AO2 Application
4© WJEC CBAC LtdSJ/JF-W38 (12)

Candidates need to make a connection between the specific place they are investigating and the wider concepts, models, theories or processes of their geographical studies. For example, candidates could apply their knowledge of a case study and contrast it with the fieldwork region. At the highest levels this could involve the candidate comparing secondary data provided for a different region within Wales or England.
Students could apply their understanding of a number of wider geographical concepts to their findings in the study area. For example, they could apply their:
Understanding of the concept of quality of life; Understanding of urban push factors such as 'urban rat race/pace of life ' or the
perception of urban crime Knowledge of another rural region of the UK or Europe that illustrates the process of
counter-urbanisation.
Useful weblinks
http://www.police.uk/crime/?q=Cardiff,%20UK#crimetypes/2013-03 Crime incident mapping from Police.UK
http://www.neighbourhood.statistics.gov.uk/HTMLDocs/dvc25/Index.html#00PF,loc,from Neighbour Statistics site of migration statistics; this page is an example from Rhondda
http://www.zoopla.co.uk/ House prices information for the whole of the UK
www.statistics.gov.uk This is the official website of the UK National Census. You can search by postcode to find all sorts of data about each ward (an enumeration district) in your chosen city.
http://www.caci.co.uk/acorn-classification.aspxACORN is a geodemographic segmentation of the UK’s population which segments small neighbourhoods, postcodes, or consumer households into 5 categories, 17 groups and 56 types
http://www.visionofbritain.org.uk/index.jsp A vision of Britain – historical land-use maps of Britain
http://www.geography-fieldwork.org/ruralfieldwork/counterurbanisation/stage1.htmField Studies Council information on rural fieldwork techniques
http://www.schoolsnet.com/uk-schools/schoolHome.jspSchoolsnet provides data on location, quality and sizes of schools.
5© WJEC CBAC LtdSJ/JF-W38 (12)

Fieldwork Enquiry Task 2015Development (Theme 6)
Theme
Generic task for the fieldwork enquiry
The task is linked to the following enquiry question from the specification
Page in specification
6 An investigation into patterns of quality of life in one urban area.
1.2 What are the regional patterns of economic and/or social development in one country?
17
How the task may be contextualised
The theme 6 fieldwork enquiry for award in 2015 must investigate patterns of quality of life in an urban context. Quality of life is a measure of the general well-being of people or groups of people. Aspects of quality of life include built environment, access to service provision, crime and safety, physical and mental health, traffic noise and safety, recreation, social belonging and community cohesion as well as standards of income. These aspects will be different for different groups of people.
Centres may provide students with an overarching enquiry question such as:
How and why does quality of life change with distance from the centre of Shrewsbury?
Alternatively, centres may present the tasks to their students as a hypothesis such as:
In Cardiff the quality of life for young families is higher in inner urban areas than in suburban wards.
One area that students might explore is the notion that aspects of quality of life will be different for different groups of people. This nuance may be an aspect where individuality, across the student cohort, could be promoted. Individual students could be encouraged to devise a sub-hypothesis or an additional organising question.
Remember that the focus of the enquiry in this cycle is quality of life in an urban context. An investigation of quality of life in a rural area is not appropriate in this cycle.
Collecting primary and secondary data
Gathering primary data through fieldwork should be at the heart of the investigation. Using a range of primary techniques the students should explore differences in quality of life such as the general well-being of people who live in the different residential areas selected for study; how quality of life is influenced by the quality of built environment; how access to services and recreation facilities can play an important part in quality of life.
6© WJEC CBAC LtdSJ/JF-W38 (12)

The types of primary data that students might collect could be:
Crime perception: surveys, questionnaires or indices e.g. a questionnaire for residents or observations in different urban areas of the burglar alarms, anti-crime features. This could be combined with some secondary crime data into an index for each output area.
Environmental Quality: Indices or bi-polar scores to collect data about the general landscape and upkeep of the area. Students could combine this with photos that they take of the worst and the best images in each category
Questionnaires: could collect data about different aspects of quality of life or from different stakeholder groups e.g. views on community cohesion, do people eat 5-a day, safety perception crime / traffic / pollution etc.
Services surveys: e.g. libraries, post-offices, pub, doctors surgeries etc. Transport index: create an index which combines the frequency, length and cost of
public transport to main service provision. Car Age Survey: for each of the cars parked in a survey area record its age – by
taking a mean, the average age of the cars in an area can be worked out. Extended interviews: for example with groups who might have set-up renewal
projects, youth projects, sports facilities etc. Communities’ activities mapping: data could be collected from web-sites, village
notice boards or newsletters on the number of community or recreational activities. This could be combined on a map of the community infrastructure e.g. playing fields, libraries, drop-in centres etc.
Photographic evidence: Photos could be taken of the various areas within the region and annotated to take note of the building / environment / traffic / people / services / renewal schemes / upkeep etc. Or perhaps a photo that students think sums up the area – socially or economically.
Secondary data, such as National Census data, should be used to support the task. This will allow the students to explore important aspects of quality of life, not possible to observe through fieldwork. This might include education provision, crime and safety issues, access to work opportunities and levels of income. If National Census data is used, appropriate data will be accessed through a representative ‘post code’ for the ‘wards’ being investigated. Types of secondary data that students might collect could be:
Mapping: for example, crime statistics, creation of micro-enterprise and businesses, support for tourism schemes, conservation and upgrading of heritage, training schemes for groups, services e.g. schools, doctors, transport links etc.
Services Index: using GoogleEarth estimate distances to major supermarkets, schools, free cash points, computers etc.
Newspaper reports: reports detailing any of the quality of life indicators, schemes or groups views. These could be annotated and analysed to provide supporting evidence.
Census data: quality of life indicators and multiple deprivation indices e.g. socio-economic class, health data, education levels
Encouraging independence during the planning and data collection phaseIt is important to allow candidates to have the opportunity to demonstrate their independence in one or more of the following areas:
Planning the enquiry / posing enquiry questions
7© WJEC CBAC LtdSJ/JF-W38 (12)

Selecting and implementing data collection techniques or technologies.
One simple way that this could be achieved if the contextualized question is looking at the variability of quality of life across an area would be to allow students to add a closed and open question to a questionnaire to investigate different groups of people quality of life within a region. If the contextualised question is looking at the quality of life for different groups of people, students might be encouraged to filter some of the census data for different aspects of quality of life such as percentage long-term illness, educational ability, unemployment etc.
AO2 ApplicationCandidates need to make a connection between the specific place they are investigating and the wider concepts, models, theories or processes of their geographical studies. For example, some discussion as to whether the quality of life patterns observed are typical or atypical is one productive line of analysis for AO2. Candidates could apply their understanding of externalities to the patterns observed on their fieldtrip ie they might conclude that some urban land uses seen on their visit (whether they be dual carriageways, parks or take-away shops) have a bigger sphere of influence on determining quality of life than others. Care should be taken not to associate patterns of quality of life with outmoded urban models of land-use. More able students should be encouraged to ask pertinent questions relating to their enquiry such as ‘What factors / events might change current quality of life patterns in the future?’
Useful weblinks
http://local.live.com/ This website has excellent aerial photos and satellite images. You can use it to describe housing type and housing density. You can also use it to describe externalities: the features of the neighbourhood such as parks and busy roads that add positive or negative value to quality of life.
www.statistics.gov.uk This is the official website of the UK National Census. Like the sites above, you can search by postcode to find all sorts of data about each ward (an enumeration district) in your chosen city.
http://www.checkmyfile.com/postcode-check/SY5-9PR.htmPostcode code data including, house prices, social grades, crime rates etc.
http://www.caci.co.uk/acorn-classification.aspxACORN is a geodemographic segmentation of the UK’s population which segments small neighbourhoods, postcodes, or consumer households into 5 categories, 17 groups and 56 types
http://www.apho.org.uk/resource/view.aspx?RID=116449Health Profiles for Local Authorities
http://www.neighbourhood.statistics.gov.uk/dissemination/Neighbourhood Statistics
8© WJEC CBAC LtdSJ/JF-W38 (12)

http://www.police.uk/Crime Coverage
http://www.wordle.net/Wordle – a site for anaysing text
9© WJEC CBAC LtdSJ/JF-W38 (12)

Fieldwork Enquiry Task 2015Coasts (Theme 7)
Theme
Generic task for the fieldwork enquiry
The task is linked to the following enquiry question from the specification
Page in specification
7 An investigation into the effects of coastal retreat on people.
1.3 How do these landforms and processes affect the lives of people living along the coast?
18
How the task may be contextualised
The focus of this enquiry must be the effects of coastal erosion / retreat on communities, groups or individuals. This enquiry lends itself to a mapping exercise in which vulnerable areas of a coastal community are mapped (using first hand and OS map data) and ranked to create a vulnerability map. The enquiry could include a questionnaire to investigate perception of the threat. The enquiry should be set in the context of coastal landforms (whether they be beaches or cliffs) that are threatened by the processes of retreat (including erosion, weathering or mass movement processes). Students may consider a variety of ways in which the lives of people could be affected, such as:
Economic e.g. the value of house prices, cost to councils of defences Environmental e.g. loss of farmland, environment or biodiversity Social e.g. re-location due to erosion, improvement in social wellbeing / quality of life
due to flood defences
Centres may provide students with an overarching enquiry question such as:
To what extent are different groups of people in Mappleton affected by the threat of coastal erosion?
Alternatively, centres may present the tasks to their students as a hypothesis such as:
It is not sustainable to continue to protect the village of Borth from coastal retreat.
An investigation that focuses solely on coastal processes such as longshore drift is not appropriate in this cycle.
Primary and Secondary Data
A land use survey of a coastal community at risk because of coastal retreat. Students should classify and plot different land uses on to a base map. They can also annotate field sketches or photos showing land uses and locations they consider being vulnerable to erosion or sea water flooding. Land use data can be analysed further, after the fieldtrip, with the use of an OS map. Students can assign each location they have visited with an erosion or flood risk index. This index can be calculated by:
10© WJEC CBAC LtdSJ/JF-W38 (12)

(a) Out in the field: Scoring each land use. For example, score 1 for land uses that are relatively unaffected by coastal retreat (such as recreational land or poor quality farmland) through to a score of 5 for high value land uses (such as a High Street chain store or major transport link such as a railway or A road). Your students can be involved in deciding on an appropriate scoring system.
(b) Back in the classroom: Calculating the height of the location above sea level (using spot heights / contours on the OS map). Give this a category, such as 0m to 10m equals category 1, 11m to 20m equals category 2, etc. to category 5.
(c) Multiplying (a) by category (b) to calculate an index of risk. Max score 25 in this example. These index scores can then be mapped to identify locations at greatest risk of erosion or coastal flooding.
An alternative approach to this enquiry would be to conduct questionnaires surveys to investigate resident / stakeholder perceptions of coastal erosion and/or the management of erosion. Students might want to investigate whether different groups of people have different perceptions of the risk of erosion. At a simple level, students could compare the perception of residents and tourists. At a more demanding level, students could investigate whether the perception of the risk of erosion is dependent on either length of residence in the community or distance of the resident’s home from the sea. Students might also investigate community perceptions of any coastal management techniques – do they work, does more need to be done?
Other examples of first hand data collection Visual / environmental impact assessment of both the threat created by erosion and
the approaches to coastal management Beach profile e.g. a transect along the beach from sea level to the coastline
(backshore/ berm/ sea wall/ dunes) to show the changing gradient and/ or transects at intervals along the beach.
Measurement of thickness of beach sediment along the profile. Field sketches and photos that can be labelled and annotated e.g. coastal features
e.g. beaches, pictures of differing pebble sizes and shapes from different locations on the beach, the effect of groynes.
Mapping the existing coastal defences & assessing the effectiveness (possibly done by an index)
Secondary data Use of old maps/photographs to compare past and present landforms and profiles Use of geology maps O.S. maps and aerial photographs Websites Newspaper articles
11© WJEC CBAC LtdSJ/JF-W38 (12)

Encouraging independence during the planning and data collection phaseIt is important to allow candidates to have the opportunity to demonstrate their independence in one or more of the following area:
Planning the enquiry / posing enquiry questions. Selecting and implementing data collection techniques and technologies.
For health and safety or logistical reasons the data collection could be common to the group of students as long as there are opportunities to demonstrate individuality. The individuality could be incorporated by students suggesting improvements to data collection, evaluating the nature and accuracy of sampling, choosing individual methods of data presentation and suggesting extensions to the study.
AO2 ApplicationCandidates need to make a connection between the specific place they are investigating and the wider concepts, models, theories or processes of their geographical studies. For example, candidates could:
Apply their understanding of concepts such as retreat rate, hazard vulnerability and hazard mapping.
Compare their findings at the study site to other coastal locations with different or similar rates of erosion.
Show their understanding of coastal environments as being dynamic and susceptible to change
Useful weblinks
RGS section on coastal fieldwork techniques, limitations and data presentation techniqueshttp://www.rgs.org/OurWork/Schools/Fieldwork+and+local+learning/Fieldwork+techniques/Coasts.htm
Background information to coasts, fieldwork techniques and analysishttp://www.geography-fieldwork.org/coastfieldwork/lowenergy/stage2.htm
Maps and air photos using a postcode searchhttp://www.bing.com/maps/
Photos of every OS grid squarehttp://www.geograph.org.uk/
http://geology.com/sea-level-rise/ Projected sea level rise maps. Could be used with UK Climate Projections to model potential future scenarios. http://ukclimateprojections.defra.gov.uk/21729
Shoreline Management Plans (SMPs) http://www.environment-agency.gov.uk/research/planning/104939.aspx
Environment Agengy - YouTube Channel - Coastal Erosion. http://www.youtube.com/watch?v=zUh3WeilFN4
12© WJEC CBAC LtdSJ/JF-W38 (12)

Fieldwork Enquiry Task 2015Weather and climate (Theme 8)
Theme
Generic task for the fieldwork enquiry
The task is linked to the following fieldwork enquiry question from the specification
Page in specification
8 An investigation into factors that create variations in weather/climate in a local area.
1.1 What factors create the variations in weather and climate experienced within and around the British Isles?
19
How the task may be contextualised
Centres may provide candidates with an overarching enquiry question, such as:
Which would be the best sites, within the school grounds, to locate a small wind turbine and install photo-voltaic cells?
Alternatively, centres may present the task to their candidates as a hypothesis, such as:
The school buildings have no impact on the micro-climate of the school grounds.
In the first example, students could determine what "best" might mean in terms of locating a wind turbine / PV's. This would include criteria such as the site with the “best” aspect or average wind speeds. It might also include criteria like space for ancillary infrastructure, effects on wildlife, creating a disturbance during construction & operation, open space or nearness to large buildings, trees or power lines, south facing slopes etc. This would then suggest what types of data they might choose to collect.
In the second example, if there is an impact, students might need to consider the spatial & temporal aspects of that impact, as well as thinking about the extent of the impact. e.g. is there more of an impact in the summer or for different parts of the site or different variables.
Primary & Secondary Data
The types of Primary Data that students might collect could be:
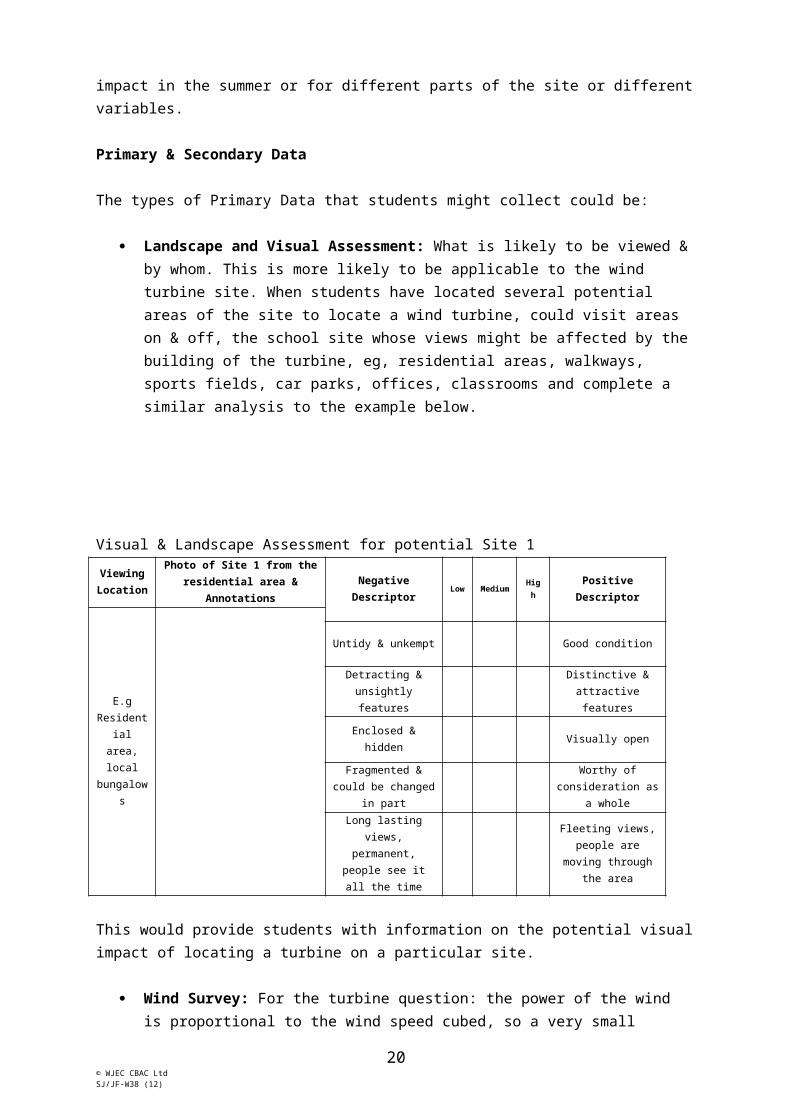
Landscape and Visual Assessment: What is likely to be viewed & by whom. This is more likely to be applicable to the wind turbine site. When students have located several potential areas of the site to locate a wind turbine, could visit areas on & off, the school site whose views might be affected by the building of the turbine, eg, residential areas, walkways, sports fields, car parks, offices, classrooms and complete a similar analysis to the example below.
13© WJEC CBAC LtdSJ/JF-W38 (12)

Visual & Landscape Assessment for potential Site 1Viewing Location
Photo of Site 1 from the residential area & Annotations Negative Descriptor Low Medium Hig
h Positive Descriptor
E.g Residentia
l area, local
bungalows
Untidy & unkempt Good condition
Detracting & unsightly features
Distinctive & attractive features
Enclosed & hidden Visually open
Fragmented & could be changed in part
Worthy of consideration as a
whole
Long lasting views, permanent, people see it all the time
Fleeting views, people are moving through the area
This would provide students with information on the potential visual impact of locating a turbine on a particular site.
Wind Survey: For the turbine question: the power of the wind is proportional to the wind speed cubed, so a very small increase in wind speed can be very important in terms of power. The distance from buildings & trees can also affect the wind speed. The height of the land would also be important to include within this survey. Direct measurements of the wind could be done, including speed & direction, which could be combined on a map with building heights, land heights etc. In terms of the school buildings having an impact on the micro-climate, you may have a wind tunnel affect, this could be measured by very small scale wind speed & direction measurements.
Noise survey: The noise of a turbine can affect the people in the surrounding area. There are several free Decibel meters for Smart Phones. It may be possible to set off an air horn blast at the potential sites & measure the noise level within nearby classrooms or playing fields.
Shading Audit: PVs will need to be in the sunshine for as long as possible during the day, through-out the year. To gauge this students could complete an over-shading audit, similar to below:
Over-shading % of sky blocked by trees & buildingsHeavy >80%Significant 60 to 79%Modest 20 to 59%None <20%
Roof Angle: A PV array should be mounted at an angle to the sun. This is between 30 & 45 degrees in the UK. Students could measure the angles of the various potential roofs using a Bubble App (hold the phone at arms length & in-line with the roof) or Clinometers / Inclinometer.
Temperature, Humidity, Wind, Light, Rainfall Measurements: Students could take measurements of these over a period of time. Or perhaps, on a micro-grid to look at the small scale impacts of the buildings.
14© WJEC CBAC LtdSJ/JF-W38 (12)
Heights, Colours & Textures of Buildings: Heights can be measured using a clinometer, or perhaps counting bricks of a known height, or taking a photo with a meter rule against the building & measuring on the resulting photo. The colours on the building & the textures on the facades may have an effect on the micro-climate. These could be recorded in a qualitative index or audit.
Rainfall & soil measurements. If you have the opportunity to conduct a temporal study, it might be possible to set-up a number of rain gauges & soil thermometers around the school buildings.
Questionnaires from local neighbours to the site: what would be their concerns and opinions in locating a turbine or PV array?
The types of Secondary Data that students might collect could be:
Orientation Map: Ideally PV should be sited so that they face between SE & SW. Students could work-out which parts of the site would provide the most appropriate orientation.
Proximity to public areas: It would be important for the site/s chosen to be in safe areas of the school site. A map highlighting public access areas could be combined with one highlighting available access points for construction & maintenance.
Visual Pollution: Wind turbine blades can produce 'shadow flicker' which happens when the sun is behind the blades relative to the viewer. This could be mapped.
Birds migration: A turbine may have an impact on the migration routes of birds, or create a barrier between feeding & nesting sites. Locating any designated areas surrounding the site could provide some data.
Aircraft: Does the site have any aviation restrictions? These can be mapped on to site map. http://aviationtool.planningportal.gov.uk/
Met Data for the area during the study. This could be combined with the students’ data, to see which areas of the site have been affected the most by the buildings.
How to encourage independent thought:Time should be allowed for students to become involved in the planning process before the fieldwork is conducted. Students should be encouraged to contribute to discussions about data collection and sampling techniques. Students can demonstrate independence in a number of ways, for example:
Student guidance sheets should be designed with suggestions to prompt independence, for example, whilst all students are involved in some data collection, students could also be given the opportunity to select one additional data collection technique.
All students could use a bi-polar technique to analyse potential sites (as shown at the top of page 14) and individually add their own bi-polar descriptors to the bottom of the form.
Students could pose an organising question of their own that supplements the enquiry question investigated by the whole class.
AO2 ApplicationCandidates need to make a connection between the specific place they are investigating and the wider concepts, models, theories or processes of their geographical studies. For example, candidates could:
15© WJEC CBAC LtdSJ/JF-W38 (12)

Apply their understanding of micro-climate concepts such as the urban heat island to their own area of primary data collection.
Compare the similarities and differences of the micro-climate of the school campus to a case study of an urban micro-climate they have studied in class.
Useful web links
This site provides a tool to assess if the proposed wind turbine is on safeguarded land, in terms of aviation.http://aviationtool.planningportal.gov.uk/
GoogleSketchUp is a free 3D modelling programme, that can also provide sun-shadows on models. A basic model of the site could be created to use in addition to a direct visual assessment & a way of looking at the shadow flicker.http://www.sketchup.com/intl/en/product/gsu.html
Wind Speed: Enter a post code and get the estimated wind speed of the location, at various heights. This maybe useful data to supplement students direct measurements. http://www.rensmart.com/Weather/BERR
RGS Microclimate Fieldworkhttp://www.rgs.org/OurWork/Schools/Fieldwork+and+local+learning/Fieldwork+techniques/Microclimate.htm
16© WJEC CBAC LtdSJ/JF-W38 (12)

Fieldwork Enquiry Task 2015Ecosystems (Theme 9)
Theme
Generic task for the fieldwork enquiry
The task is linked to the following fieldwork enquiry question from the specification
Page in specification
9 An investigation of a woodland ecosystem.
1.1 How does the physical environment interact with living things to produce different large scale ecosystems?OR2.1 In what ways do people use ecosystems?2.2 How can ecosystems be managed sustainably?
19
How the task may be contextualised
The theme 9 fieldwork enquiry for award in 2015 must investigate a woodland ecosystem. Centres can choose to focus on the biotic and abiotic factors of the woodland that interact to influence processes such as succession. For example, students can investigate factors such as aspect, soil depth and pH, moisture content and microclimate features such as temperature, light level and wind speed and consider their relationship to woodland plants. Alternatively, centres may choose to investigate the use and management of a woodland ecosystem such as the impacts of coppicing, clear felling or tourist use of woodlands.
Centres may provide candidates with an overarching enquiry question, such as:
How do woodland plants respond to the varying light conditions created by coppicing?
Alternatively, centres may present the task to their candidates as a hypothesis, such as:
Deciduous woodlands support a wider diversity of woodland plants than coniferous woodland.
For both ideas above, comparisons could be made of intensively managed and relatively un- managed woodland areas, provided permission and accessibility do not prove to be an issue.
An investigation of any other ecosystem is not appropriate in this cycle. Sand dunes were the focus of the 2014 task, so it is essential that a sand dune ecosystem is not the focus of enquiry in 2015.
17© WJEC CBAC LtdSJ/JF-W38 (12)

Primary and Secondary Data
First Hand Data Sampling of vegetation cover using quadrats to identify percentage cover (or the
inverse, % bare earth), and the presence of specific species, or total number of species. Sampling could be systematic at equal distances from the beginning of the transect, or stratified, to allow coverage of different environments and microclimates.
At each sampling point the following could also be measured: soil depth, soil colour, (an indication of organic matter), vegetation height, soil pH, wind speed, and temperature. Soil samples could be collected to be analysed later to calculate the moisture.
Plant identification charts can be used to determine which species are present at specific points along the transect.
Photographic evidence or field sketches that can be annotated to show changes along a transect in vegetation type, evidence of human activity and management techniques.
Photographic evidence of erosion adjacent to footpaths compared to areas which are out of bounds to the public, or width and depth of footpath erosion.
Stratified sampling of survey points along a transect or within the public access area, e.g. number of pieces of litter within a specified radius.
Questionnaires to ascertain the frequency and nature of human use such as tourism, attitudes towards tourists by local residents, e.g. who gains or loses?
Bi – polar analysis / environmental quality surveys to consider evidence of litter / damage from tourism.
Vehicle counts in adjacent car parks Visitor number counts
Secondary data Use of aerial photos or Google Earth which can also be annotated for the purpose of the
study. Use of old maps/photographs to compare past and present woodlands and the nature of
human activity, e.g. the recent provision of car parking and better access. O.S. maps – current and historical Websites such as Where’s the Path? http://wtp2.appspot.com/wheresthepath.htm
The site shows an OS extract alongside an aerial photo of your search area. There is a daily limit on map downloads on this website, and later in the day a 1940 version of the required area often appears. This could be a useful comparative tool if the nature of change is an element of the enquiry.
Newspaper articles / news websites
Encouraging independence during the planning and data collection phaseIt is important to allow candidates to have the opportunity to demonstrate their independence in one or more of the following areas:
Planning the enquiry / posing enquiry questions Selecting and implementing data collection techniques and technologies
For health and safety or logistical reasons the data collection could be common to the group of students as long as there are opportunities to demonstrate individuality. The individuality could be incorporated by students designing data logging sheets, suggesting criteria for environmental quality surveys, suggesting improvements to data collection, evaluating the nature and accuracy of sampling, choosing individual methods of data presentation and suggesting extensions to the study.
18© WJEC CBAC LtdSJ/JF-W38 (12)

Presentation of dataThere is a wide range of ways in which data can be presented such as:
Annotated transect profiles Tables to show slope and vegetation recordings along the transect(s) Located bar / pie charts showing vegetation cover or type Kite diagrams showing species distribution Tables and bar graphs to show the depth soil / soil pH / wind speed / temperature /
moisture / shell / salt content as it changes along the transect. Annotated or overlaid sketches and photographs Radial diagrams showing opinions / perceptions from questionnaire data
AO2 ApplicationCandidates need to make a connection between the specific place they are investigating and the wider concepts, models, theories or processes of their geographical studies. For example, candidates could:
Apply their understanding of theories such as vegetation succession to the situation found in the area of study.
Compare their findings to other woodlands with different levels of human activity or management, accessibility, or different microclimates.
Consider how their findings might differ at different times of the year or if the system was more or less intensively managed.
Useful web links
Science & Plant for Schools - Species distribution & ID informationhttp://www.saps.org.uk/secondary/teaching-resources/127-ecology-practical-distribution-of-species-and-fieldwork-sampling
Woodland Ecosystems and their management - RGShttp://www.rgs.org/NR/rdonlyres/36D53A02-A9B4-4DD8-8166-8B9FD4B55484/0/Woodlandecosystemsandtheirmanagement.pdf
Woodland plants & amounts of lighthttp://www.rgs.org/NR/rdonlyres/36D53A02-A9B4-4DD8-8166-8B9FD4B55484/0/Woodlandecosystemsandtheirmanagement.pdf
Countryside info: Woodlands & Biodiversityhttp://www.countrysideinfo.co.uk/woodland_manage/woodbio1.htm
Forestry Commission Report on Forests Role in Tourismhttp://www.forestry.gov.uk/pdf/tourismsum.pdf/$file/tourismsum.pdf
Maps and air photos using a postcode searchhttp://www.bing.com/maps/
Photos of every OS grid squarehttp://www.geograph.org.uk/
19© WJEC CBAC LtdSJ/JF-W38 (12)

Fieldwork Enquiry Task 2015Tourism (Theme 10)
Theme Generic task for the fieldwork enquiry
The task is linked to the following enquiry question from the specification
Page in specification
10 An investigation into the impacts of tourism.
2.1 What are the impacts of the development of tourism on:
people and the economy? the environment?
20
How the task may be contextualised
The theme 10 fieldwork enquiry for award in 2015 must be focussed on the impacts of tourism on the study area. Candidates might investigate both positive and negative impacts of tourism on a locality/community. They might focus on the impacts of tourism on the local economy (direct and indirect), the environment and on local residents. Candidates might even investigate the carrying capacity of the locality in terms of its social, psychological and environmental capacity to absorb visitors. Candidates could investigate impacts at a honeypot site and the spatial extent of the impacts around that site. Alternatively they could investigate the impacts of a tourism event such as festival.
Centres may provide candidates with an overarching enquiry question, such as:
Do the benefits of tourism in Tenby outweigh the disadvantages?Or What are the impacts of the Cheltenham festival on the local community?
Alternatively, centres may present the task to their candidates as a hypothesis, such as:
Environmental damage created by tourism decreases with distances from car parks in Dovedale.
A task that focuses on spatial patterns (such as the distribution of tourist accommodation or other tourist services) or the changing nature of tourism would not be appropriate in this cycle.
Collecting primary and secondary data
Types of primary data that students might be able to collect could be: Footpath Erosion: Width & depth - as well as possibly vegetation, bare ground
cover percentage & vegetation height. This could also be done using a range of categories to allow a subjective range. Students could also include any management of the paths such as surface or edges of the paths.
Activity Participant Survey: Who the visitors are, when they visit & what they do in the location. This could be based on observation of the visitors in the location, or in
20© WJEC CBAC LtdSJ/JF-W38 (12)
different parts of the location. This could be combined with a survey of the routes that visitors take through the location e.g. distance & routes from the car park. Students may record things such as how long people spend in particular places, what they are doing, estimated impact on the environment, do they stick to paths, use bins etc.
Visitor Impact Bi-Polar: See example below, a pilot survey would be appropriate to see if the categories are relevant to the area. Each location surveyed could be back-up by an annotated photograph.
ScoreThe area has a distinct
natural beauty+3 +2 +1 0 –1 –2 –3 Natural beauty has been
damagedFew human built
structures+3 +2 +1 0 –1 –2 –3 Intrusive car parking &
management structuresNot many people +3 +2 +1 0 –1 –2 –3 Crowded with people.
Some people have to walk off the paths
No damage to natural vegetation
+3 +2 +1 0 –1 –2 –3 Widespread damage to vegetation
No obvious hazards +3 +2 +1 0 –1 –2 –3 Volume of traffic high and annoying
No visible litter or dog mess
+3 +2 +1 0 –1 –2 –3 High levels of litter & dog mess
Quiet +3 +2 +1 0 –1 –2 –3 High levels of noise (e.g. music, traffic)
Facilities & Services Audit: Map the relative number of services & facilities targeted at locals & tourists or that are beneficial to the environment or not so beneficial e.g. car parks, visitor centres, town trails
Counts & Maps: Traffic, pedestrian, car-parking spaces, litter volumes, types of land-use, one-way traffic, coach parks, information boards, toilets, litter bins, signage & interpretation boards etc.
Product Survey: Students could select 10 random shops & look at what is being sold, where it is being sold, is the item being used to sell 'place' & how, who is going to buy it etc.
Roles Perception Survey: Select a role e.g. local parent with two children, teenage visitor from UK with parents, local business person. Then walk around the area & think about the facilities & services you would need during the day, what you would like to do, things that are too difficult / expensive to access etc. Mark on a map or record some of the answers, this collects data on the environment & if it is of benefit to a particular group or not.
Types of secondary data could be: Benefits Matrix: If students are looking at the benefits versus the disadvantages,
they might consider if user groups have different impressions of the tourism in the area as well as the economic, environmental, social impacts. They could use information from the Roles Perception Survey & combine it with other data, to provide a matrix to enable analysis of the their data.
Visitor Statistics: These could be from the local council or national park, e.g. income generated, visitor numbers, spending on footpath management.
House Price Survey: By mapping the average house prices within a area, it may be possible to determine if the location of physical tourist features have an effect on the house price. This would give information about the benefits or not to the local people.
21© WJEC CBAC LtdSJ/JF-W38 (12)

Encouraging independence during the planning and data collection phaseIt is important to allow candidates to have the opportunity to demonstrate their independence in one or more of the following areas:
Planning the enquiry / posing enquiry questions Selecting and implementing data collection techniques or technologies.
One simple way that this could be achieved would be designing a questionnaire of closed questions to be used by all candidates and asking each candidate to add one closed and one open question of their own to this common survey.
AO2 ApplicationCandidates need to make a connection between the specific place they are investigating and the wider concepts, models, theories or processes of their geographical studies. Students could apply their understanding of a number of wider geographical concepts to their findings in the study area. For example, they could apply their:
Understanding of the concept of positive multiplier effects or the concept of carrying capacity (social, psychological or environmental).
Understanding of models or theories such as the Butler Model.
Useful weblinks
Butler's Model of Tourismhttp://geographyfieldwork.com/ButlerModel.htm
National Park site on the Impacts of Tourismhttp://www.nationalparks.gov.uk/learningabout/ourchallenges/tourism/impactsoftourism.htm
Video clip from the BBC on managing impacts of tourism in the Peak Districthttp://www.bbc.co.uk/learningzone/clips/managing-the-impact-of-tourism-in-the-peak-district-national-park/7411.html
Fix the Fells - Footpath erosion in the Lake Districthttp://www.fixthefells.co.uk/
UK Government Site - Policy Helping the UK tourism industry to growhttps://www.gov.uk/government/policies/helping-the-uk-tourism-industry-to-grow
The following link is the publication hub of the UK National Statistics Office for tourist related publications. It includes a number of very useful hyperlinks (on the right of the screen) to other organisations such as Visit Britain and Visit England.http://www.statistics.gov.uk/hub/people-places/people/tourism
The following link is to a Tourism hub on the Welsh Government website.http://new.wales.gov.uk/topics/tourism/?lang=en
The Welsh Government site contains links to various research documents, many of which contain raw data on visitor numbers / attractions in Wales. These research documents are available from the following page:
22© WJEC CBAC LtdSJ/JF-W38 (12)

http://new.wales.gov.uk/topics/tourism/researchl1/tourisminwales/;jsessionid=NwndQsZXTYNrybZJT868npScD12ldKdGM9LY1jQzpPpmBZHr5Mwf!989377147?lang=en
Blackpool has indeed considered a rebranding exercise, and there are several references to this in the press:http://www.blackpoolgazette.co.uk/news/local/blackpool_needs_to_rebrand_says_tourism_boss_1_380619
23© WJEC CBAC LtdSJ/JF-W38 (12)

Fieldwork Enquiry Task 2015Urban & Retail change (Theme 11)
Theme
Generic task for the fieldwork enquiry
The task is linked to the following enquiry question from the specification
Page in specification
11 An investigation into the spatial patterns of retailing in a specified area.
2.1 Where does retailing occur in the city?
20
How the task may be contextualised
The theme 11 fieldwork enquiry for award in 2015 must be focussed on spatial retail distribution patterns. Centres may provide candidates with an overarching enquiry question, such as:
Which is the best site for a new IKEA store in Crawley?
Alternatively, centres may present the task to their candidates as a hypothesis, such as:
Swansea has a greater range of retail provision than Carmarthen.
The first title requires students to investigate a number of possible alternative sites. Obviously a range of factors will be considered before a final “best site” is identified, but the reasoning should also draw on experiences of locations for similar retail outlets. Perhaps students will reject all the sites offered and find a more suitable one of their own, which should be evaluated and justified.
The second approach, that of a hypothesis comparing two (or more) locations, enables students to clearly identify the variations in type, number, size etc of retail services. This approach provides a ready means to explore ideas about patterns, concepts of thresholds /catchment areas and factors which may determine usage levels
This task must investigate spatial retail patterns. An investigation of recent retail change and its impacts is not appropriate in this cycle.
Collecting primary and secondary data
It is probable that two main types of first-hand data collections will be undertaken by students: land-use / shop surveys and customer questionnaires. These are very effective, but should be carefully constructed to maximise the effectiveness of their interpretation especially when analysing and comparing more than one location. Sufficient data needs to be collected which goes beyond standard questions such as What shops are there? How often do you shop here? The following is a list of possible variations to encourage fuller analysis and evaluation of findings:
24© WJEC CBAC LtdSJ/JF-W38 (12)

Ground floor shop survey transects classifying convenience/comparison/service types.
Note condition of shops/vacant premises/chain stores/size of frontage.
Survey of first floor+ usage e.g. offices of solicitors/financial services/dentists etc.
Look for significant groupings of types e.g. near a station/specific side street/car park/libraries etc.
Note evidence of shopper-orientated planning e.g. pedestrianisation/street furniture/seating/notice boards and signposting/car parking facilities
Opening times can provide interesting comparisons between scales of retail service areas.
Bi-polar surveys comparing alternative existing sites or sites for future retail development.
Pedestrian questionnaires should be succinct and easy to complete. Graded response answers are much better than long open-ended questions. Tick box answer selections are also easier to quantify and collate, as well as being more manageable to present graphically.
Post codes are a good way of detecting a catchment area rather than asking for addresses.
Frequency of visit / purpose of visit / time taken to get here / how long do you expect to stay are all significant additional questions.
Pedestrian flow counts taken along key streets or areas of the retail location / pedestrian flow maps. Consider different times of day / weather conditions / weekdays compared to weekends.
Annotated digital photos are an excellent way to present findings
Secondary data sources which will be most helpful to this task would include:
Blank ground floor maps of retail centres using outlines from an industrial supplier e.g. GOAD maps.
Satellite imagery to show extent of retail location and surrounding areas/main routes.
Local newspapers/Local Government publications can indicate planning proposals for retail development. Urban District Plans are particularly useful, as retail centres have to be covered according to Local Planning Acts
Annual Reports of some High Street retail companies can disclose decision-thinking on location choices; this can make interesting web surfing but may be time-consuming.
25© WJEC CBAC LtdSJ/JF-W38 (12)

How to encourage independent thought
Students should be encouraged to be a part of the development of the survey/questionnaire structures and time should be allowed for students to become involved in the planning process before the fieldwork is conducted. An open discussion of the format of the survey/questionnaire to be used can take place at the pre-fieldwork stage, which will lead to additional factors/questions of their choice being added to a common, group structured response sheet, e.g. additional bi-polar categories.
Application AO2
Your students will only be able to access marks for AO2 if they link their observations of the place visited to their wider knowledge of retail areas or their wider understanding of urban and retail processes, concepts or theories. Some discussion as to whether the retail patterns observed are typical or atypical is a productive line of analysis for AO2.
Students could apply their understanding of a number of wider geographical concepts to their findings in the study area. For example, they could apply their:
Understanding of the concepts of retail hierarchy, threshold population or the range of a good.
Knowledge of another retail centre in Europe that illustrates the concepts of retail distribution.
Useful weblinks
http://www.rgs.org/OurWork/Schools/Fieldwork+and+local+learning/Fieldwork+techniques/Urban+and+settlement.htm The RGS has a useful guide to fieldwork examining retail distribution. Take care – this webpage also describes how retail change can be investigated, such a study is not appropriate in 2015.
Postcode code data including, house prices, social grades, crime rates etc.http://www.checkmyfile.com/postcode-check/SY5-9PR.htm
Maps and air photos using a postcode search.http://www.bing.com/maps/
Photos of every OS grid square:http://www.geograph.org.uk/
26© WJEC CBAC LtdSJ/JF-W38 (12)
Related Documents